
Abstract
In this paper, the mechanical behavior and compression deformation mode of three types of composite multilayer structures based on triply periodic minimal surfaces (TPMS) were conducted through experiments and finite element analysis. The results indicate that the load-displacement curves under varying stain rates manifest a double-platform characteristic for all three structure types. The P-G four-layer structure and P-G six-layer structure have no discernible extrusion of the structural layers during compression, and the entirety of the structure displays an almost regular cubic configuration after compression. Nevertheless, local separation was observed in the extruded portion of the P-H six-layer structure after the structural deformation at higher strain rates. For the other conditions, the structure exhibited a bulge but did not display any local detachment or separation phenomena. During the deformation of the P-H six-layer structure, a dome-shaped region emerges in the first and fifth layers. The “crown” layer displays an inverted bell-shaped failure mode for the first layer structure, exhibiting downward extrusion. In contrast, the fifth layer structure displays an upward extrusion and exhibits a bell-shaped failure mode. The P-H 6-layer structure has the best energy absorption performance under quasistatic compression conditions for the P-G 4-layer, P-G 6-layer and P-H 6-layer structure. However, the energy absorption performance of the identical structure remains largely consistent across varying strain rate conditions.
Introduction
In recent years, the advancing technology of additive manufacturing has significantly streamlined scientists’ research into TPMS structures. A tri-periodic minimal surface is characterized by zero mean curvature over its entire surface and exhibits periodic extension in three directions simultaneously. 1 Furthermore, three-periodic minimal surfaces are characterized by the absence of self-intersections, which divide space into two disjoint yet intertwined subregions. Both subregions are connected, and their distinctive geometries have the potential to markedly enhance the physical and chemical properties of porous structures. 2 The understanding TPMS encompasses multiple disciplines, including manufacturing science, acoustics, thermology, mechanics, biology, and so on. 3 Therefore, the discussions to address the mechanical properties encountered in design, manufacturing, and application research, such as the prosthesis implantation, sound insulated construction, and anti-blast protective structure, etc.3,4
Tri-periodic minimal surfaces are characterized by a specific periodicity in their structure, which can be precisely designed and adapted to the structure by varying the parameters. 5 These advantages make tri-periodic minimal surfaces promising and valuable in a wide range of applications in a number of fields such as materials science, optics and biomedicine.6–8 Abueidda et al. 9 prepared a novel polymeric porous material (CM) using three triple-periodic minimal surfaces (TPMS), and it was demonstrated that TPMS structures exhibit superior quasi-static compression and fatigue resistance properties compared to other porous structures. Yanez et al. 10 designed and prepared porous G-surface structures with different porosities and analyzed their mechanical properties under compressive and torsional loading. Wang et al. 11 examined the mechanical properties of various TPMS porous structures using TPMS to simulate skeletal implants. Revealed that a reduction in relative density resulted in a notable divergence in deformation patterns among different structural elements. Montazerian et al. 12 found that P-surface and I-WP-surface structures had the highest elastic properties and permeability higher than that of bending-dominated structures. Yu et al. 13 demonstrated that TPMS gradient structures exhibit enhanced resistance to compression when compared to conventional TPMS structures. Additionally, the gradient P-surface structure demonstrated superior energy absorption capabilities in compression tests. Al-Ketan et al. 14 found that the relative density cascade leads to shear band deformation, while the deformation mechanism of polymorphic fractions shows a layer-by-layer transition to the formation of shear bands at the interfaces between different fractions. The current research results show that significant progress has been made in the study of the geometric design and mechanical properties of TPMS. Nevertheless, TPMS constructed by parametric design still have great research potential in geometric modeling.
The introduction of TPMS into porous composite structures is based on the advantageous properties of their distinctive geometric morphology and functional characteristics. A substantial body of research has been conducted by scientists on the geometric design and mechanical behavior of TPMS composite porous structures, as well as their potential applications. Fu et al. 15 designed an isotropic hollow honeycomb structure with good load-bearing and energy-absorbing properties based on a TPMS, and the static functionality of the optimized hollow honeycomb structure was then evaluated through numerical homogenization and finite element analysis. Duan et al. 16 showed that honeycombs with variable thickness honeycomb edges exhibited enhanced compressive mechanical properties compared to conventional honeycombs. Oliveira et al. 17 created fully atomized models and converted them to macroscopic models, which were then 3D printed and the mechanical behavior of the gradient structure was investigated. Xia et al. 18 designed and fabricated a novel double-layered spiral honeycomb structure using 3D printing technology. The in-plane mechanical properties and energy absorption capacity of the structure were then investigated using a combination of experiments and simulations. Moroni et al. 19 studied the effect of different structures on the dynamic mechanical properties of 3D fiber deposition scaffolds and pointed out that the elastic properties decrease with increasing porosity, while the viscous parameters increase. Chen et al. 20 investigated the compression performance and energy absorption of lamellar structures composed of P-surface primitives and cubic cytosolic elements. Their findings revealed that the hybrid structure exhibited superior impact energy dissipation capabilities compared to the independent P-surface and cubic structures. Maskery et al. 21 investigated several damage modes of the Al-Si10-Mg double gyroscopic lattice and demonstrated the suitability of the double gyroscopic lattice for energy absorbing applications by applying heat treatments to eliminate brittle fracture and low strain damage. Novak et al. 22 analyzed the impact and blast resistance of sandwich panels with homogeneous and functionally gradient TPMS honeycomb cores. Their findings revealed that TPMS-filled sandwich panels have a higher specific energy absorption than strut sandwich panels with the same relative density. Zhou et al. 23 fabricated honeycomb samples by selective laser melting (SLM) using Ti6Al4V (TC4) material and investigated the mechanical response and energy absorption properties of the structure under different compression velocities. Feng et al. 24 employed the fused deposition modelling (FDM) method to design and prepare two TPMS with uniform and gradient properties, and the mechanical response and deformation behavior of the structures were investigated by quasi-static and drop hammer tests.
Specifically, P. Phung van et al. conducted a systematic study on a range of deformation characteristics, vibration and buckling, cell rotation, and other factors for different TMPS structural models. The authors demonstrated how the mechanisms responsible for both reducing and enhancing stiffness in the nanoplate could be understood by fine-tuning the nonlocal and strain gradient parameters. 3 The free vibration, buckling, and bending behaviors of the functionally graded-TPMS microplates were examined using an isogeometric approach based on the Hamilton principle, which incorporated both the high-order shear deformation theory and the modified strain gradient theory. 25 They 26 investigated the effects of pore modes, nonlocal parameters, and length scale parameters on the nonlinear behavior of FG-TPMS nanosheets. It was found that the PB3 pore mode significantly improved mechanical performance, nonlocal parameters enhanced deformation ability and predicted size dependence, while an increase in length scale parameters increased stiffness. Additionally, the mechanical properties of FG-TPMS plates were investigated using the HSDT meshless model, resulting in the calculation of the varied center displacement, intrinsic frequency, and critical buckling load rankings. 27 The results indicated that the normalization parameters increased with aspect ratio, and axial compression exhibited a higher buckling load than biaxial compression. In light of the influence of crystal orientation on the stiffness of TPMS lattice plates, the researchers concentrated on the impact of crystal rotation on cubic symmetric materials and simplified the 3D RotTPMS optimization method for the purpose of conducting an analysis and designing custom anisotropic materials. 28
It also has received considerable attention for the study of the mechanical behavior and deformation characteristics of multi-layer composite structures composed of TPMS units or combinations with other types of cells. The deformation characteristics of P-H four-layer structures under different strain rates were discussed in our previous research. 29 The structural layers are distinct, the cell elements and their combination forms are different, and there may be discrepancies in their structural stability, material stress distribution, and stiffness properties. In this paper, the mechanical behavior and compression deformation mode of three types of composite multilayer structures, P-G four-layer structure, P-G six-layer structure and P-H six-layer structure are studied through experiments and finite element analysis. The study of the mechanical behavior of different levels of the structure comprising TPMS and honeycomb offers valuable theoretical insight into the potential expansion of TPMS unit and composite structure engineering applications. Moreover, the combination of experimental and finite element methodology offers the valuable information for other scholars engaged in the study of mechanical behavior in porous structures and multi-layer structures.
Design and Preparation of Multilayer Structures
To investigate the deformation characteristics and mechanical properties of multi-layer structures comprising various cellular combinations, an optimization design of the G-surface structure was conducted utilizing the Grasshopper plugin within the Rhino software environment, as illustrated in Figure 1. The mathematical expression for the implicit function of the G-surface is
30
: Combination of parametric modeling operators for G surface.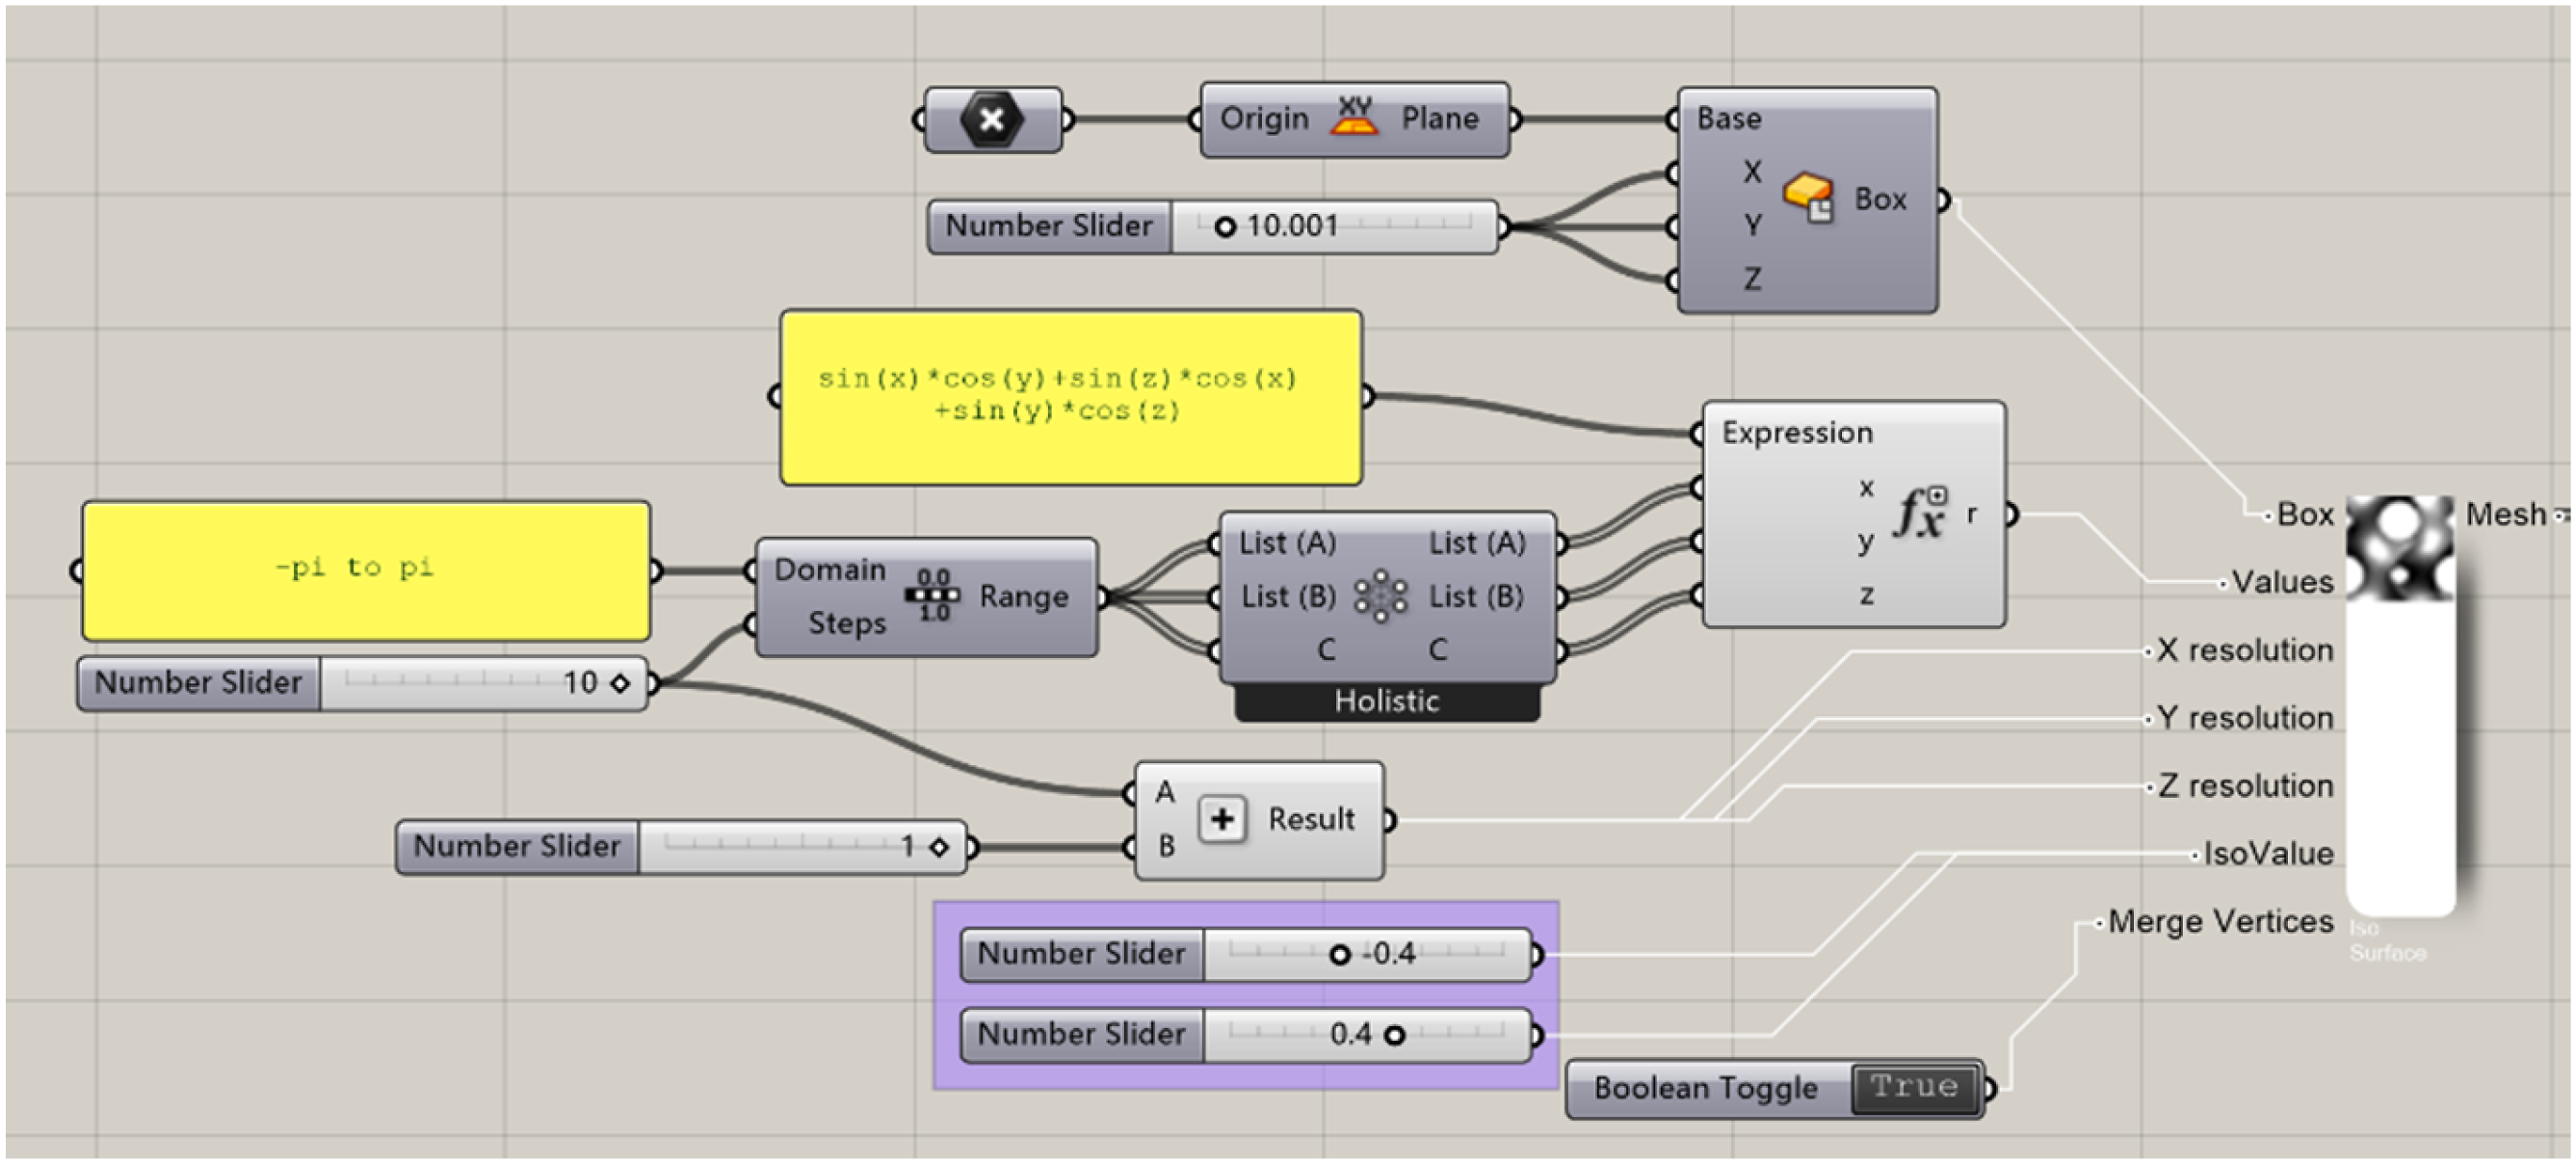

The configuration of the G-surface is changed by controlling the value of C. The G-surface shapes at C = −0.4 and C = 0.4 are selected, and Boolean operations are performed on the two surfaces to create the construction of G-surface solid structural units. The combination of G-surface meshes and resulting solid cells are illustrated in Figure 2. (a) G-surface mesh assembly; (b) Solid cell of g-surface structure.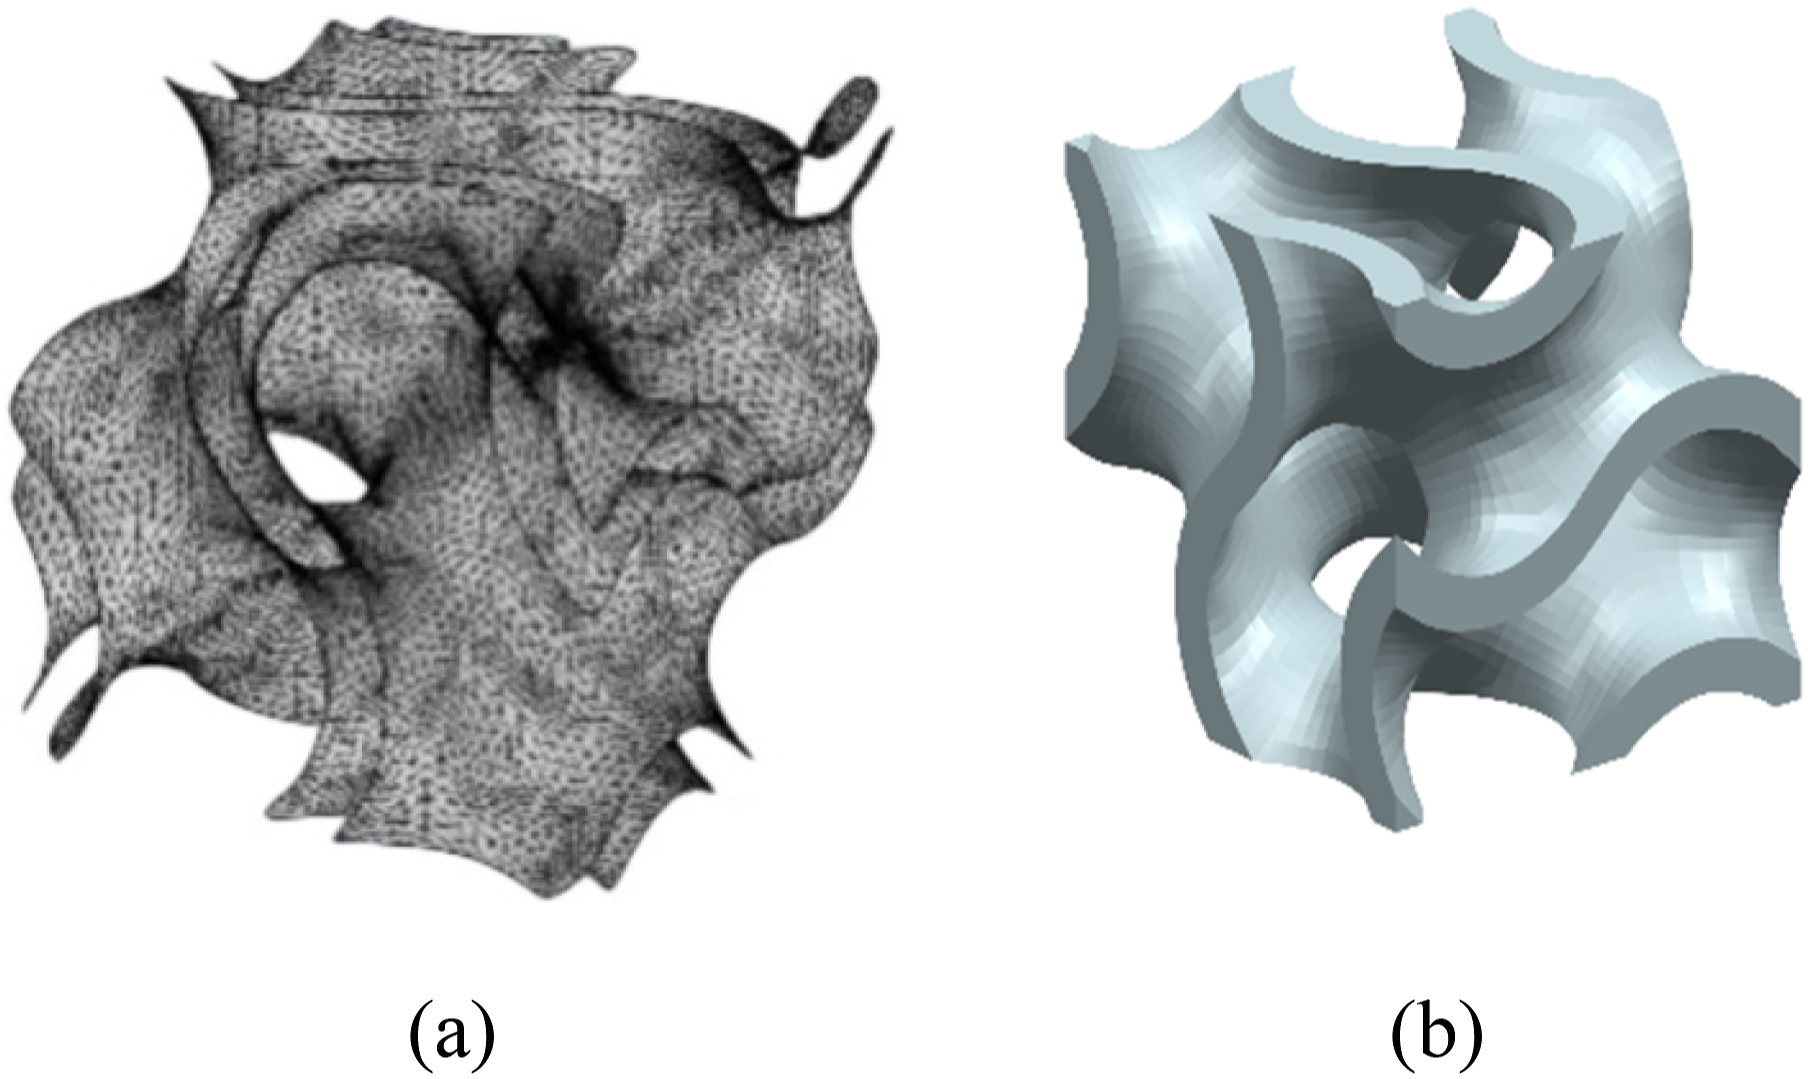
Based on the previous work,
29
the designed unit of the G-surface structure is imported into the UG software, where an array operation is executed to generate a 4*4 configuration of the G-surface layer structure. Subsequently, this arrayed G-surface layer is integrated with a P-surface structure to form the composite multilayer structure. Given the accuracy and feasibility of 3D printing, a 1 mm spacer is attached between the layers, and the size of the spacer is 40 mm*40 mm*1 mm. The design process of the new multilayer composite structure is illustrated in Figure 3(a). The G-surface structure, P-surface structure and honeycomb structure are combined into three different types of multi-layer composite structures as required, as shown in Figure 3(b)-(d). (a) Design process of the new multi-layer composite structure (b) a combination of G-surface structure and P-surface structure (G-P four layer structure), (c) G-P six layer structure, and (d) a combination of P-surface structure and honeycomb structure (P-H six layers structure).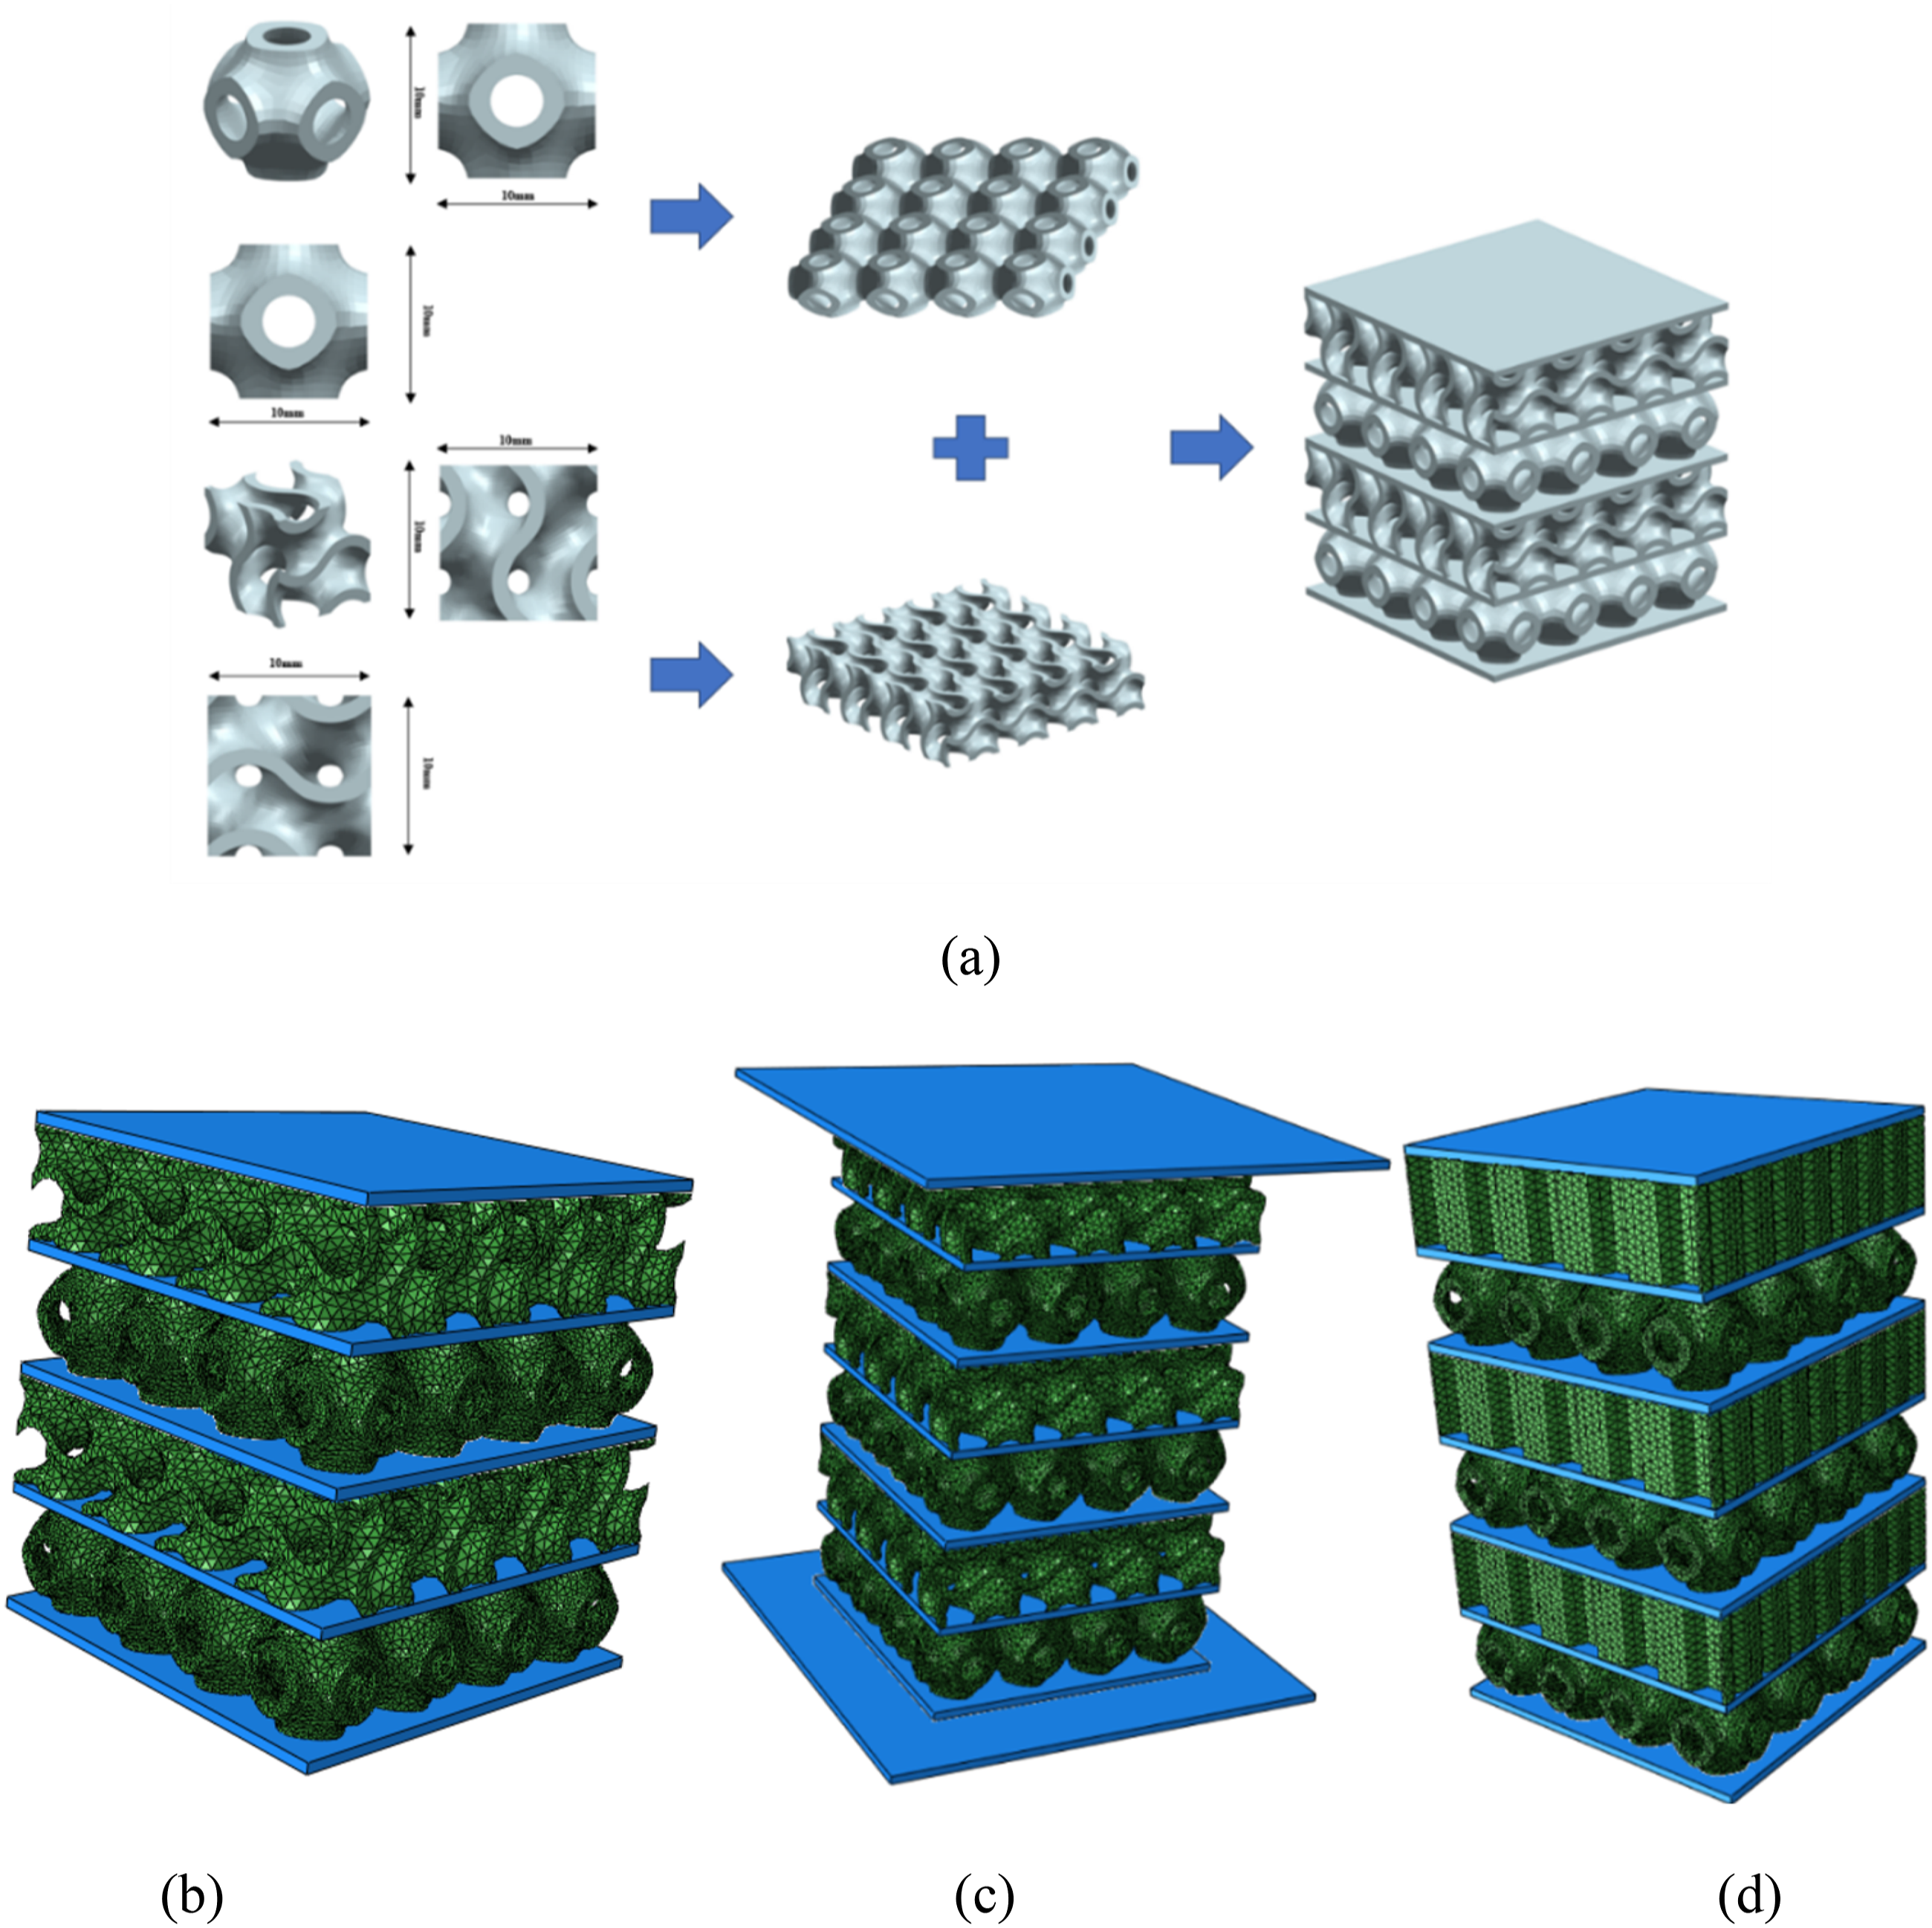
Consistent with the methodology employed in the previous work,
29
the G-surface and P-surface structures were selected for printing. Additionally, 1 mm thick plates were fabricated and subsequently assembled using adhesive to form the complete structure. The resultant 3D printed specimen is presented in Figure 4. (a) Top view of single layer of 3D printed composite structure; (b) 3D printed composite structure specimen.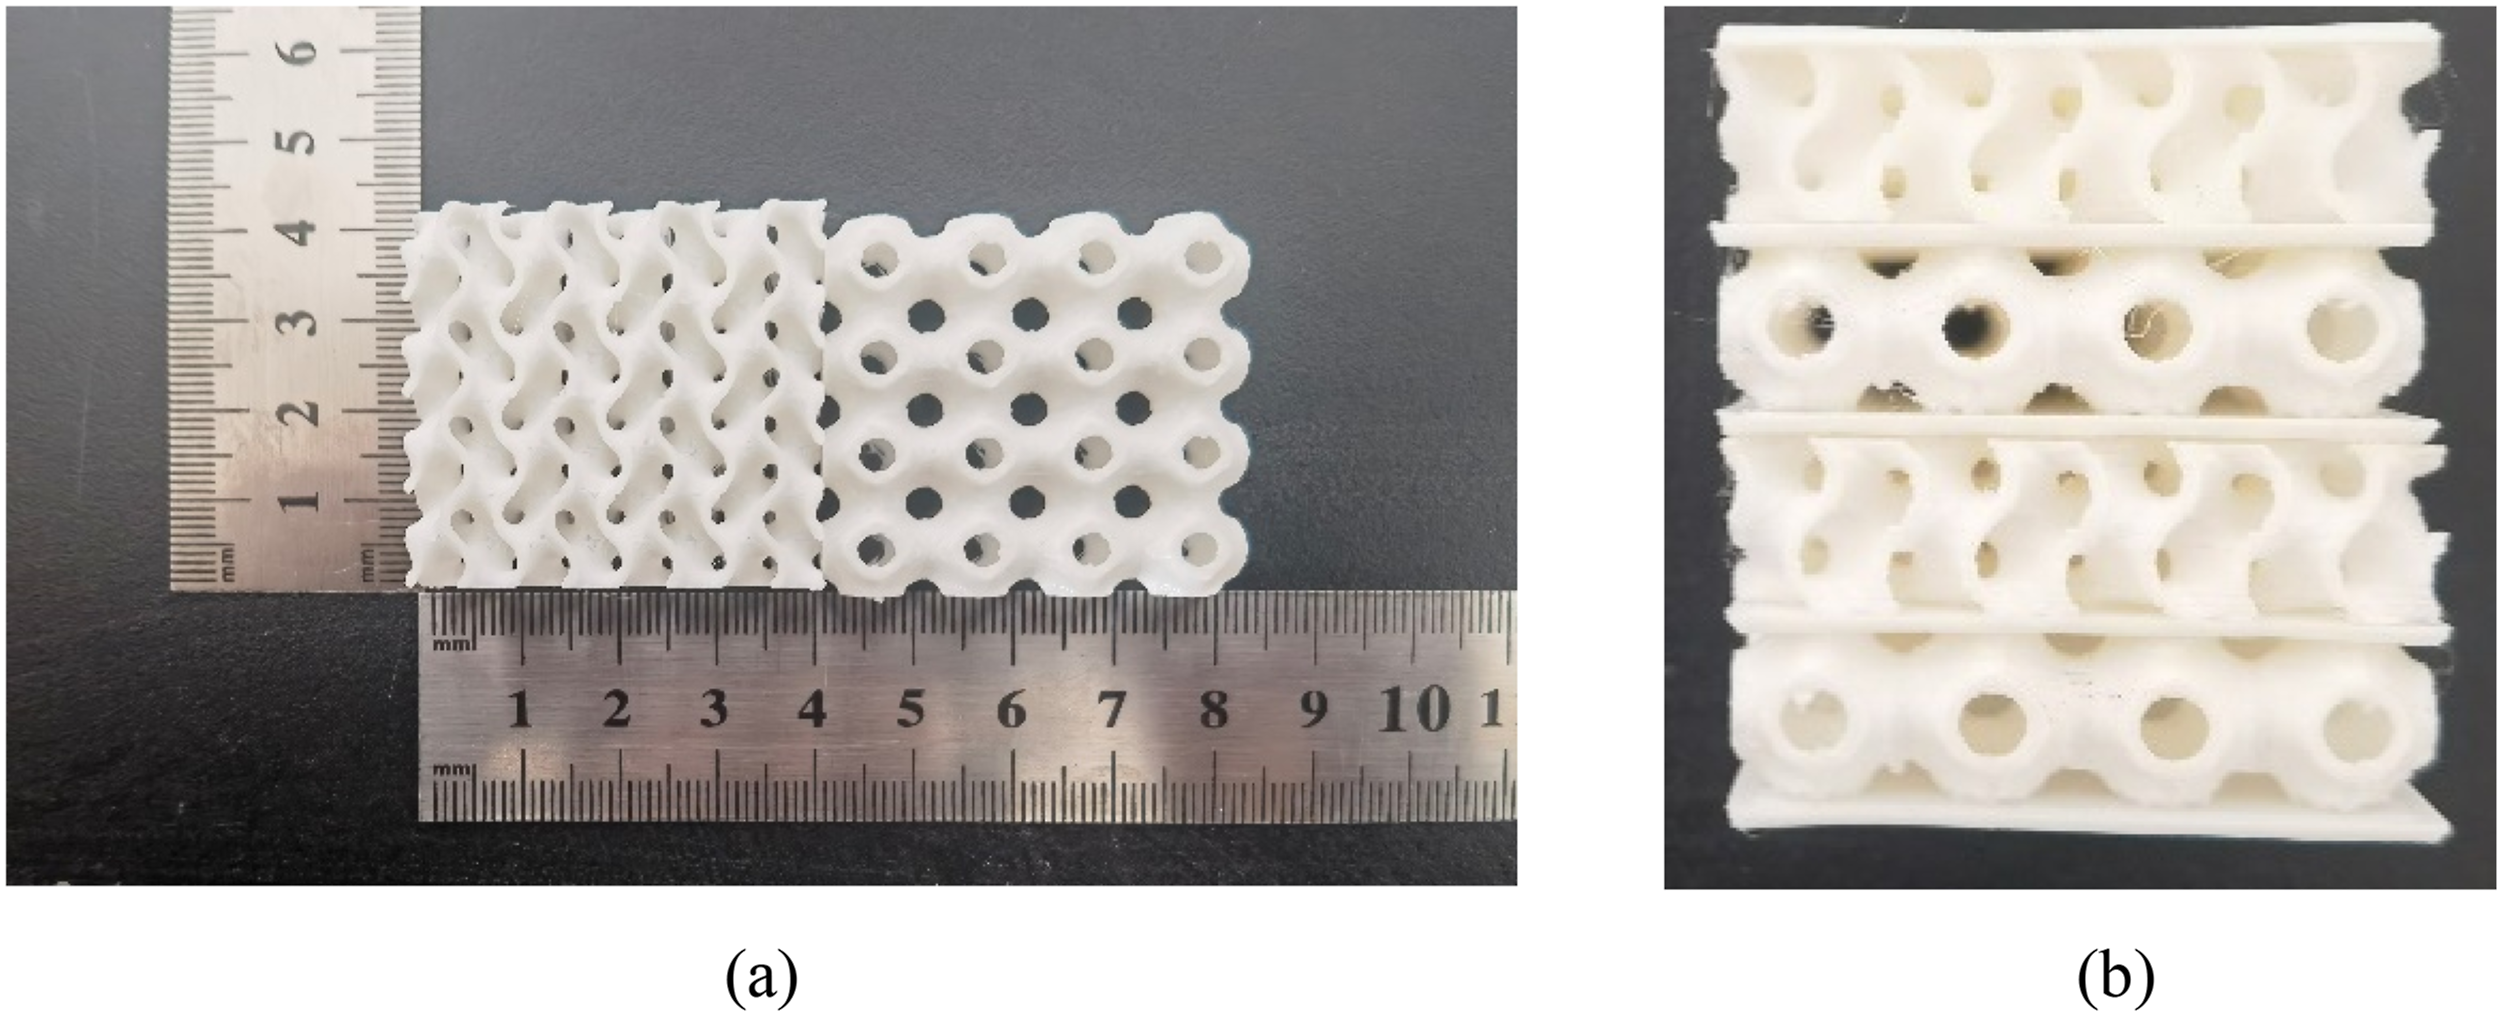
P-G Four-Layer Structure Mechanical Test
Mechanical Property
The previous work
29
on a multilayer structure (P-H four-layer structure) with a combination of P-structure and honeycomb structure at five different strain rates (0.2, 0.1, 0.01, 0.001 and 0.0001 s−1) revealed that the deformation and damage forms of the structure are essentially consistent across the five sets of compression rates. Accordingly, the P-G four-layer structure, the strain rate of 0.01 s−1 was selected for the test, with a strain rate of 0.01 s⁻1 and a loading rate of 27 mm/min, corresponding to 36 mm of downward compression. During the compression testing, the data pertaining to the compression load and displacement were recorded by utilizing digital image correlation of the universal testing machine. A comparison of the compression load-displacement curves for the P-G four-layer structure and the P-H four-layer structure at a strain rate of 0.01 s−1 is presented in Figure 5. Comparison of compression force-displacement curves for P-G four-layer and P-H four-layer structures at a strain rate of 0.01 s−1.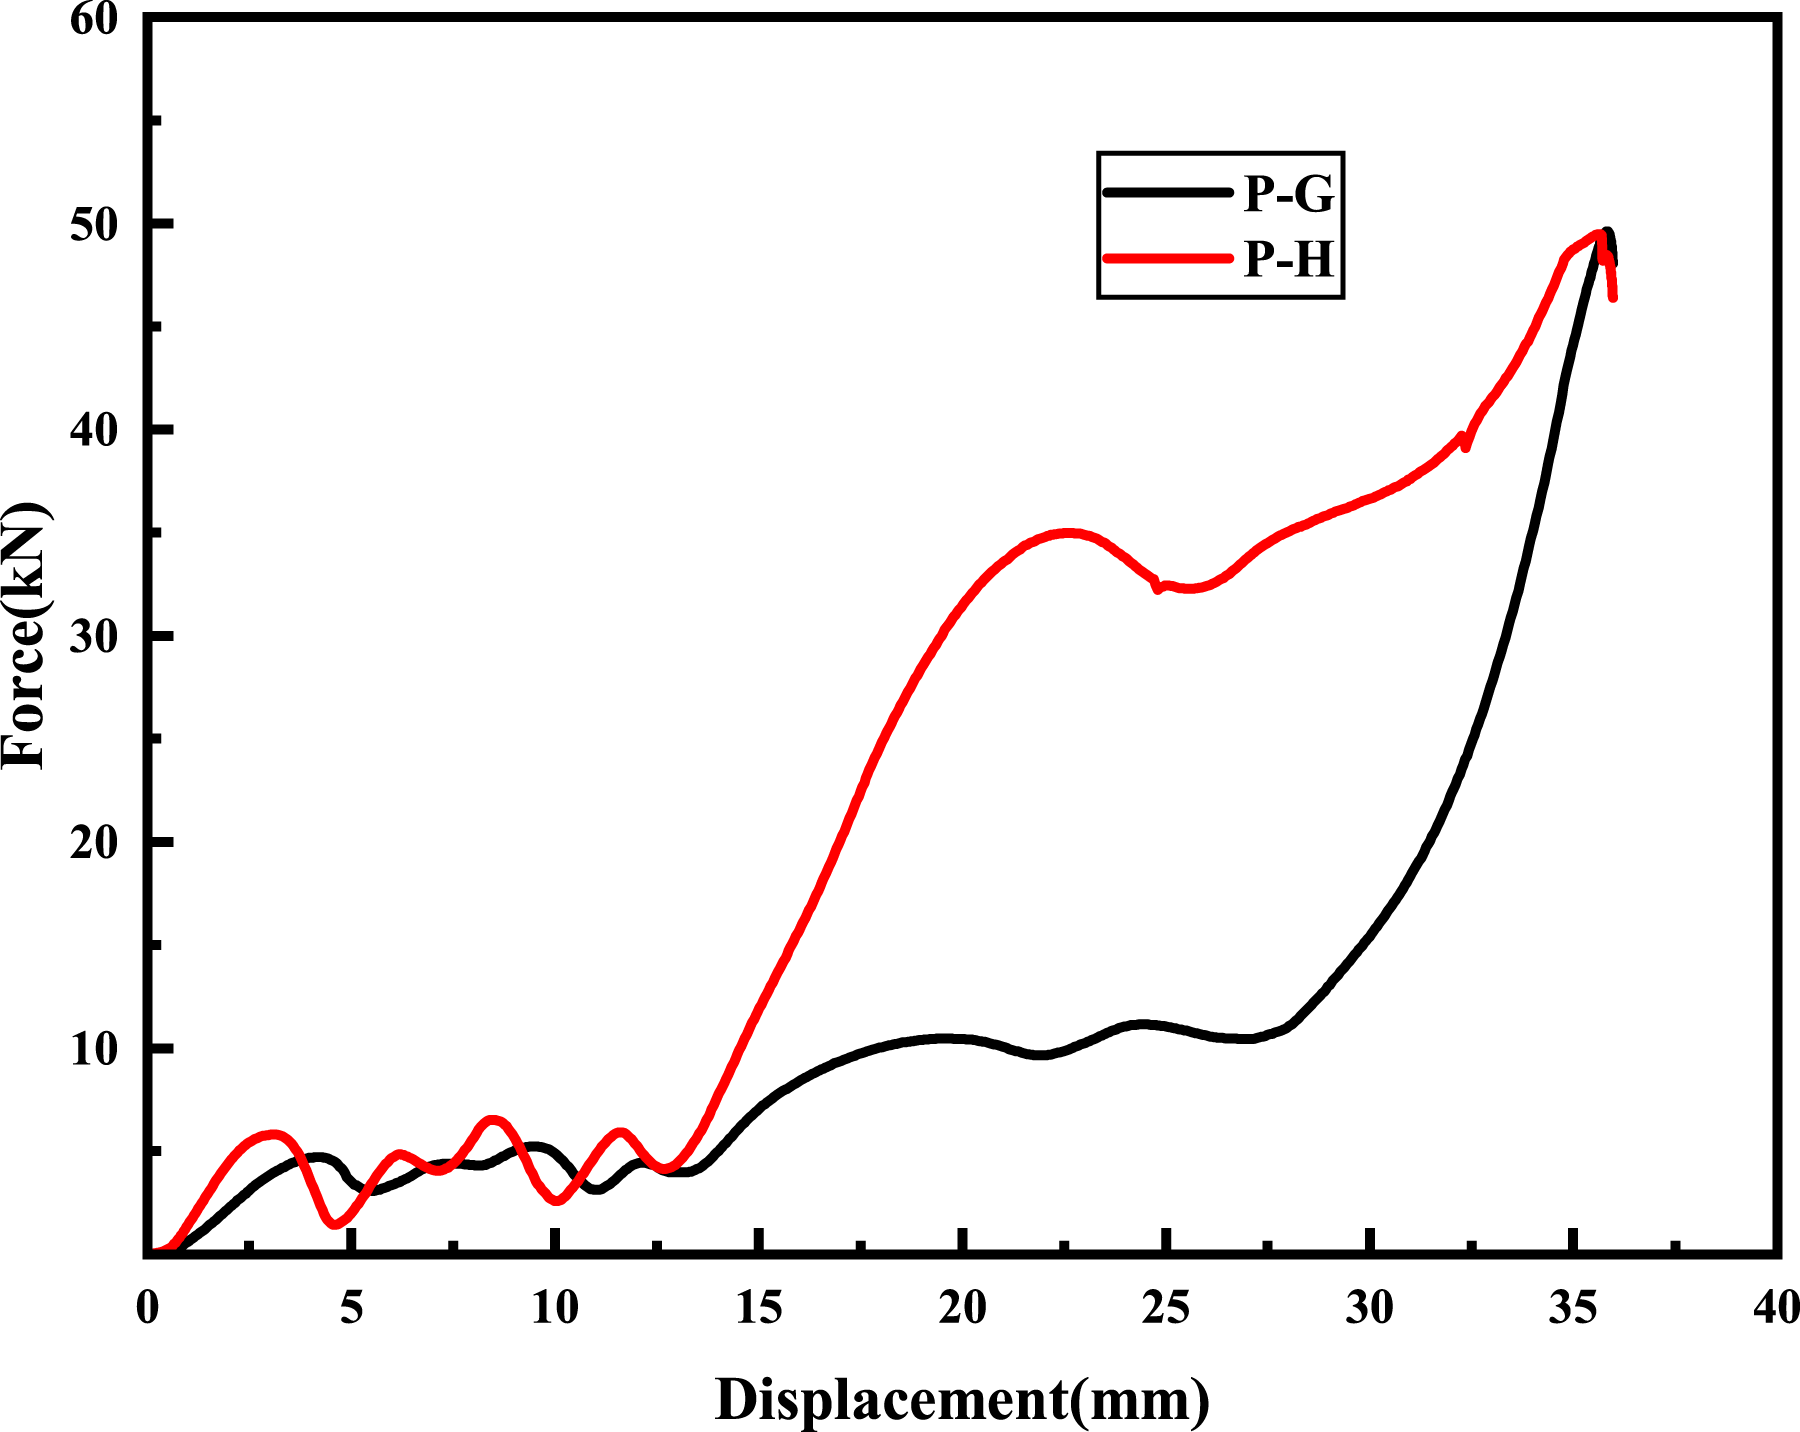
The Figure 5 illustrates that both the P-G four-layer structure and the P-H four-layer structure display double-platform characteristics at a strain rate of 0.01 s−1. It is, however, noteworthy that the double-platform characteristics of the P-G four-layer structure are less pronounced than those of the P-H four-layer structure. Upon the application of a displacement of 14 mm, the load borne by the two structures exhibits fluctuations in accordance with the increase in displacement, with the P-H four-layer structure situated within the initial platform stage. The first platform stage is terminated when the load reaches 14 mm, which is accompanied by a notable increase in the load on the P-H four-layer structure. The load transitions to the second platform stage when the displacement reaches approximately 22 mm. It should be noted that the P-G four-layer structure differs from the P-H four-layer structure. Upon completion of the initial platform phase, the load on the P-G four-layer structure increases gradually and transitions into the second platform phase at a displacement of approximately 20 mm. The loads corresponding to the two platform phases exhibit minimal discrepancy, and the double-platform feature is not readily discernible. As the displacement continues to increase, the load on the P-G four-layer structure grows at a faster rate than that on the P-H four-layer structure. Following the completion of compression, the structure is subjected to an almost identical load.
Deformation Characteristics of P-G Four-Layer Structures Loaded in Compression
A CCD camera was used in the compression test to capture the dynamic compression process of the specimen. When performing experiments with DIC, the scattering field on the test specimen was created using the spray painting method. First, the surface of the sample was uniformly sprayed with a layer of white paint as a base color to create a clear contrasting background; then the surface of the sample was sprayed with a matte black paint to create randomly distributed scattering spots. A high-precision CCD camera was applied to captured the scatter image of the specimen using a quasi-static two-dimensional DIC measurement system, thereby recording the specimen’s displacement during the loading process. The deformation morphology of the P-G four-layer structure at a compression rate of 27 mm/min (strain rate of 0.01 s−1) is illustrated in Figure 6, which depicts a scatter plot of the specimen as captured by the digital image correlation (DIC) equipment. Figure 7 illustrates the load-displacement curves at a strain rate of 0.01 s−1 accompanied by the strain field at the corresponding points. (a∼f) Deformation of P-G four-layer structure at a strain rate of 0.01s−1. (a) 0 mm, (b) 8 mm, (c) 12 mm, (d) 17 mm, (e) 27 mm, (f) 36 mm. Force-displacement curves at a strain rate of 0.01 s−1 with the strain field at the corresponding points.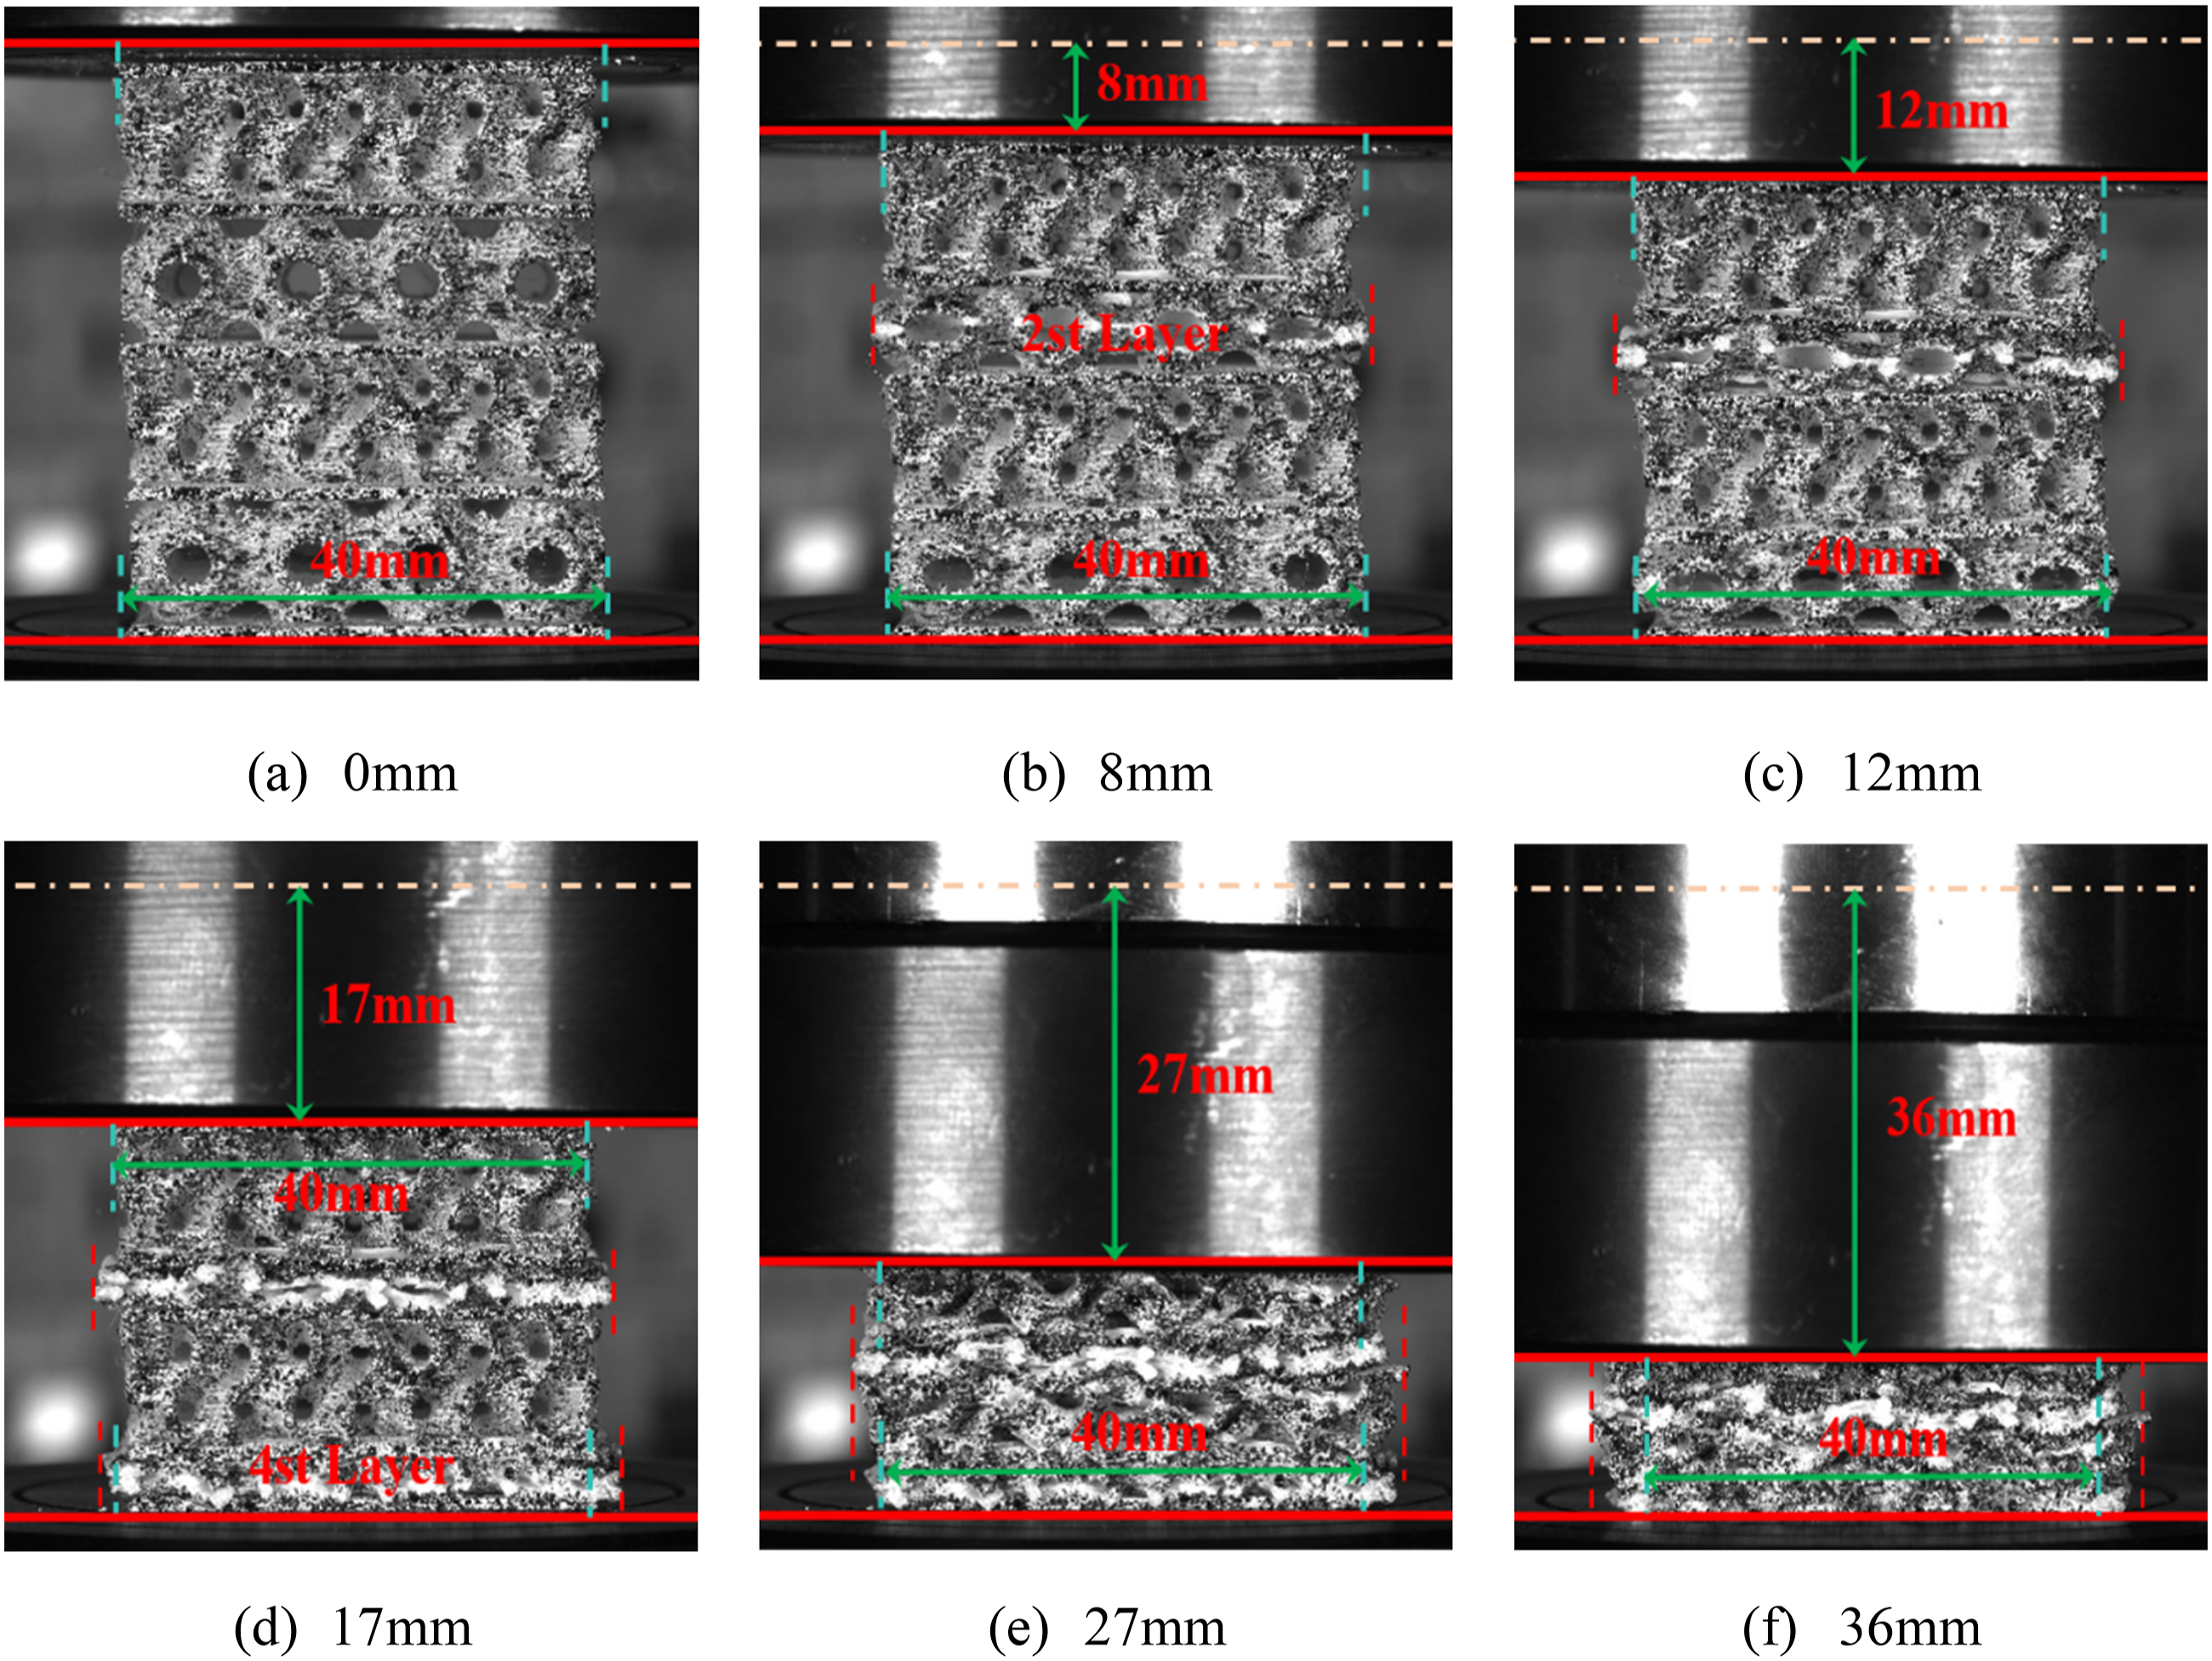
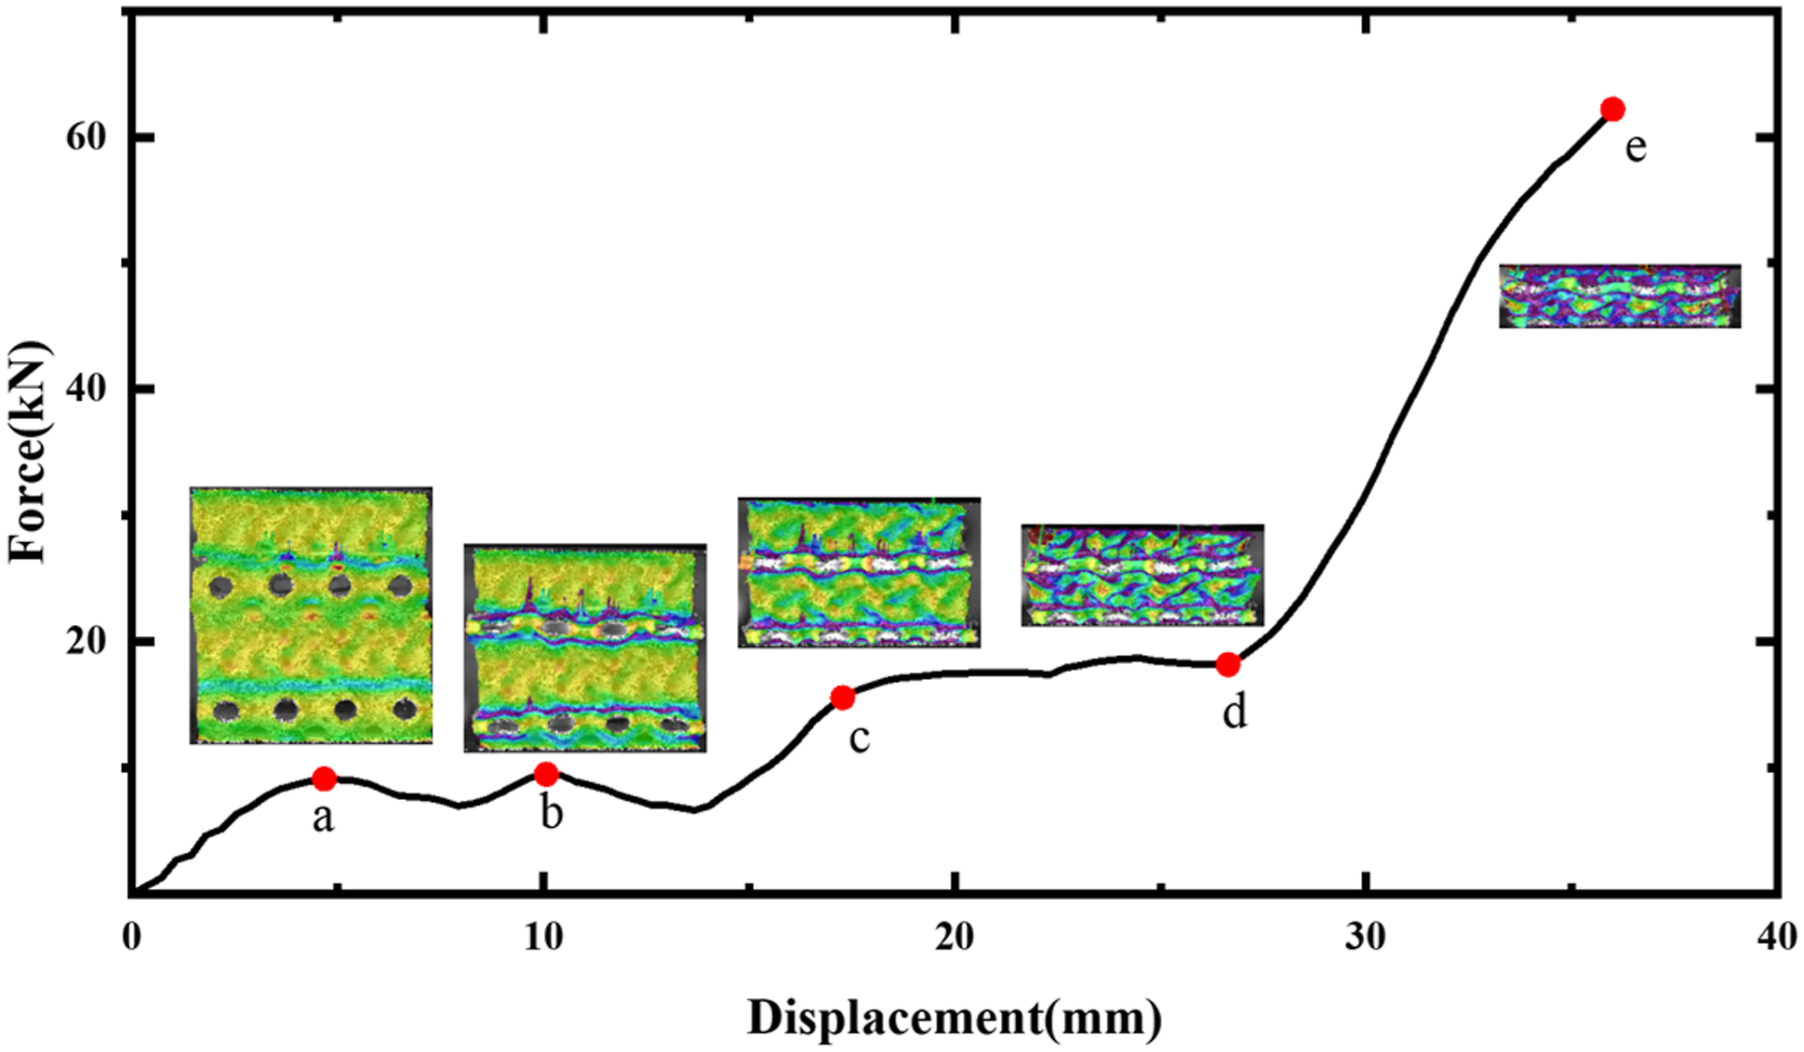
As illustrated in Figure 6, the deformation characteristics of the P-G structure during compression exhibit the hallmarks of layered damage, ultimately culminating in a state of densification. As present in Figure 7, P-structure of the structure begins to deform when the loading displacement up to 5 mm. The DIC deformation characteristics identified at points a, b, c, d, and e on the load-displacement curves correspond to the specific strain of the specimen at distinct deformation stages. The diagram is primarily employed for the purposes of schematic representation of the deformation process. The oa segment represents the elastic deformation stage of the structure, whereas the ab segment describes the deformation of the P-structure. To provide a more illustrative representation of this phenomenon, as illustrated in Figure 6, after the overall elastic deformation of the structure, the second layer of the P structure began to deform plastically, followed by the fourth layer of the P structure, and then the first and third layers of the G structure simultaneously. Subsequently, the structure underwent a densification deformation process. Moreover, the bearing area of the structure remains largely unaltered prior to the deformation of the G-structure.
In the cd section in Figure 7, the deformation of the G-structure is demonstrated, with the load reaching approximately 20 kN throughout the process. In the event of damage or deformation to the G-structure layer, the internal structure may undergo reconstruction in order to achieve equilibrium. The stress distribution within the G-structure layer remained stable throughout the continued loading, and the load did not increase significantly with the displacement. The de section in Figure 7 marks the overall damage to the structure, which is compressed to a state of complete densification when the displacement is loaded to 27 mm.
Results and Discussion
Finite Element Simulation of P-G Four-Layer Structures
The paper employs ABAQUS finite element software for the finite element simulation of the composite structure, as shown in Figure 3(b). Moreover, the material parameters are defined in accordance with the mechanical parameters of PLA material under five different strain rates. The flexible damage is set in accordance with the specifications set forth in references 29,31,32 and the contact property between layers is designated as hard contact. The lower extremity of the model is fixed, while the upper portion is subjected to a displacement load in a negative direction along the z-axis. The specimen is compressed in a downward direction by 36 mm, resulting in the acquisition of five sets of load-displacement curves under varying strain rates through the utilization of the display dynamics calculation.
Figure 8(a) depicts the simulation results of load-displacement curves for the P-G four-layer structure under different strain rates. It can be observed that the load-displacement curves of the P-G four-layer structure under different strain rates exhibit a similar variation, all of which demonstrate the double-platform characteristic. In particular, the curves for strain rates of 0.2 s−1 and 0.1 s−1 exhibit higher fluctuations compared to the curves under other strain rates in the curves after a load displacement of 20 mm. This may be attributed to the fact that the structure undergoes more rapid deformation and stress imposition at high strain rates, as well as the occurrence of several factors that contribute to fluctuations in the curve, including localized stress concentration within the material, more rapid microcrack generation and expansion, drastic changes in the internal microstructure. (a) Simulation results of force-displacement curves of P-G four-layer structure under different strain rates; (b) Comparison of experiment and simulation of force-displacement curves at a strain rate of 0.01s−1.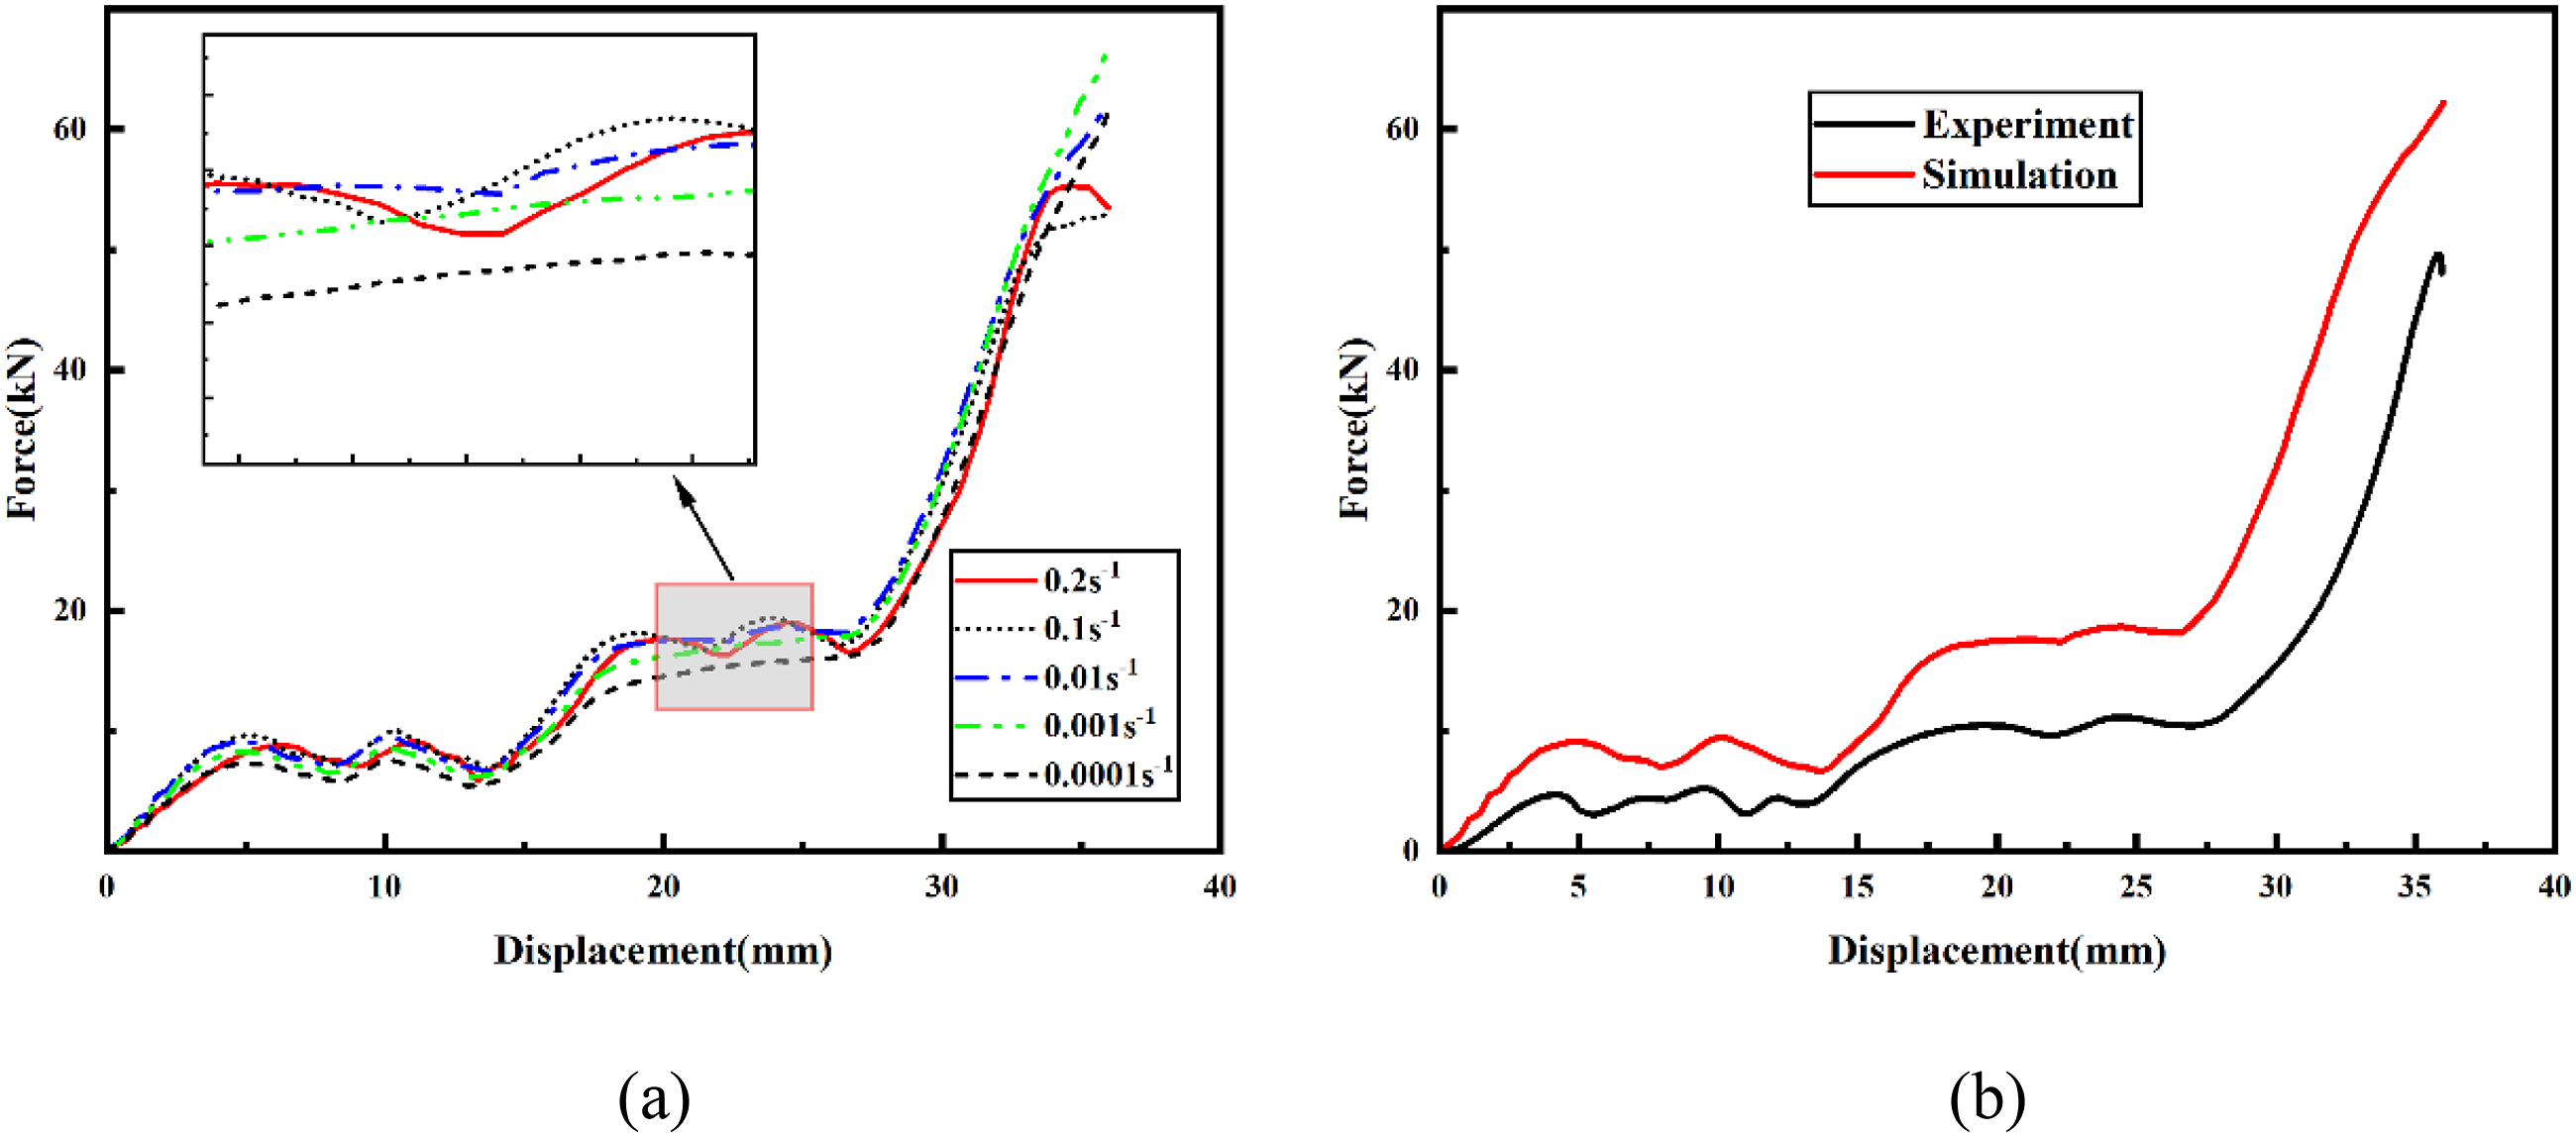
In the remaining three groups, the stress is applied relatively slowly, allowing the microstructure of the material to adjust and equilibrate over a sufficient period of time, which results in a smoother curve.
A comparison of the test data with the simulated data for the load-displacement curve at a strain rate of 0.01 s−1 is presented in Figure 8(b). As illustrated in the figure, the curves derived from the test and simulation exhibit a comparable trend in their change tendency. In the initial phase of curves, the load increases gradually with displacement, exhibiting fluctuations within a defined range. Subsequently, the load increases exponentially until the conclusion of the compression test. Furthermore, Figure 8(b) illustrates that the simulation exceed the experimental outcomes. This discrepancy may be attributed to the fact that the structure displays specific visco-elastoplastic characteristics during the experimental procedure at a low strain rate, which ultimately results in a reduction in the stiffness of the structure. It is therefore not unexpected that discrepancies may arise between the results of finite element simulations and those obtained from real experiments, given the inherent complexities associated with the materials and the discrepancies between actual structural configurations and their computational counterparts. These discrepancies may be attributed to a number of factors, including the presence of material inhomogeneity, alterations in material properties with deformation, the presence of defects in actual structures, and the inevitable discrepancies between the actual structures and their models. In summary, the load-displacement curves of the test and simulation exhibit a comparable trend of change, and the test and simulation results are basically coincide with each other.
The specimen morphology after compression collapse of the simulated resulting structures at five different strain rates is presented in Figure 9. It can be observed that the morphology of the specimens obtained from the simulation and the experimental specimens are in good agreement. Furthermore, the specimen morphology following compression collapse under varying strain rates displays comparable deformation characteristics. Specimen morphology of the structure after simulated compression collapse at five different strain rates and comparison between simulated and experimental specimen morphology at strain rate of 0.01 s−1 (a) 0.2 s−1; (b) 0.1 s−1; (c) 0.01 s−1; (d) 0.001 s−1; (e) 0.0001 s−1; (f) experimental specimen for the strain rate of 0.01 s−1.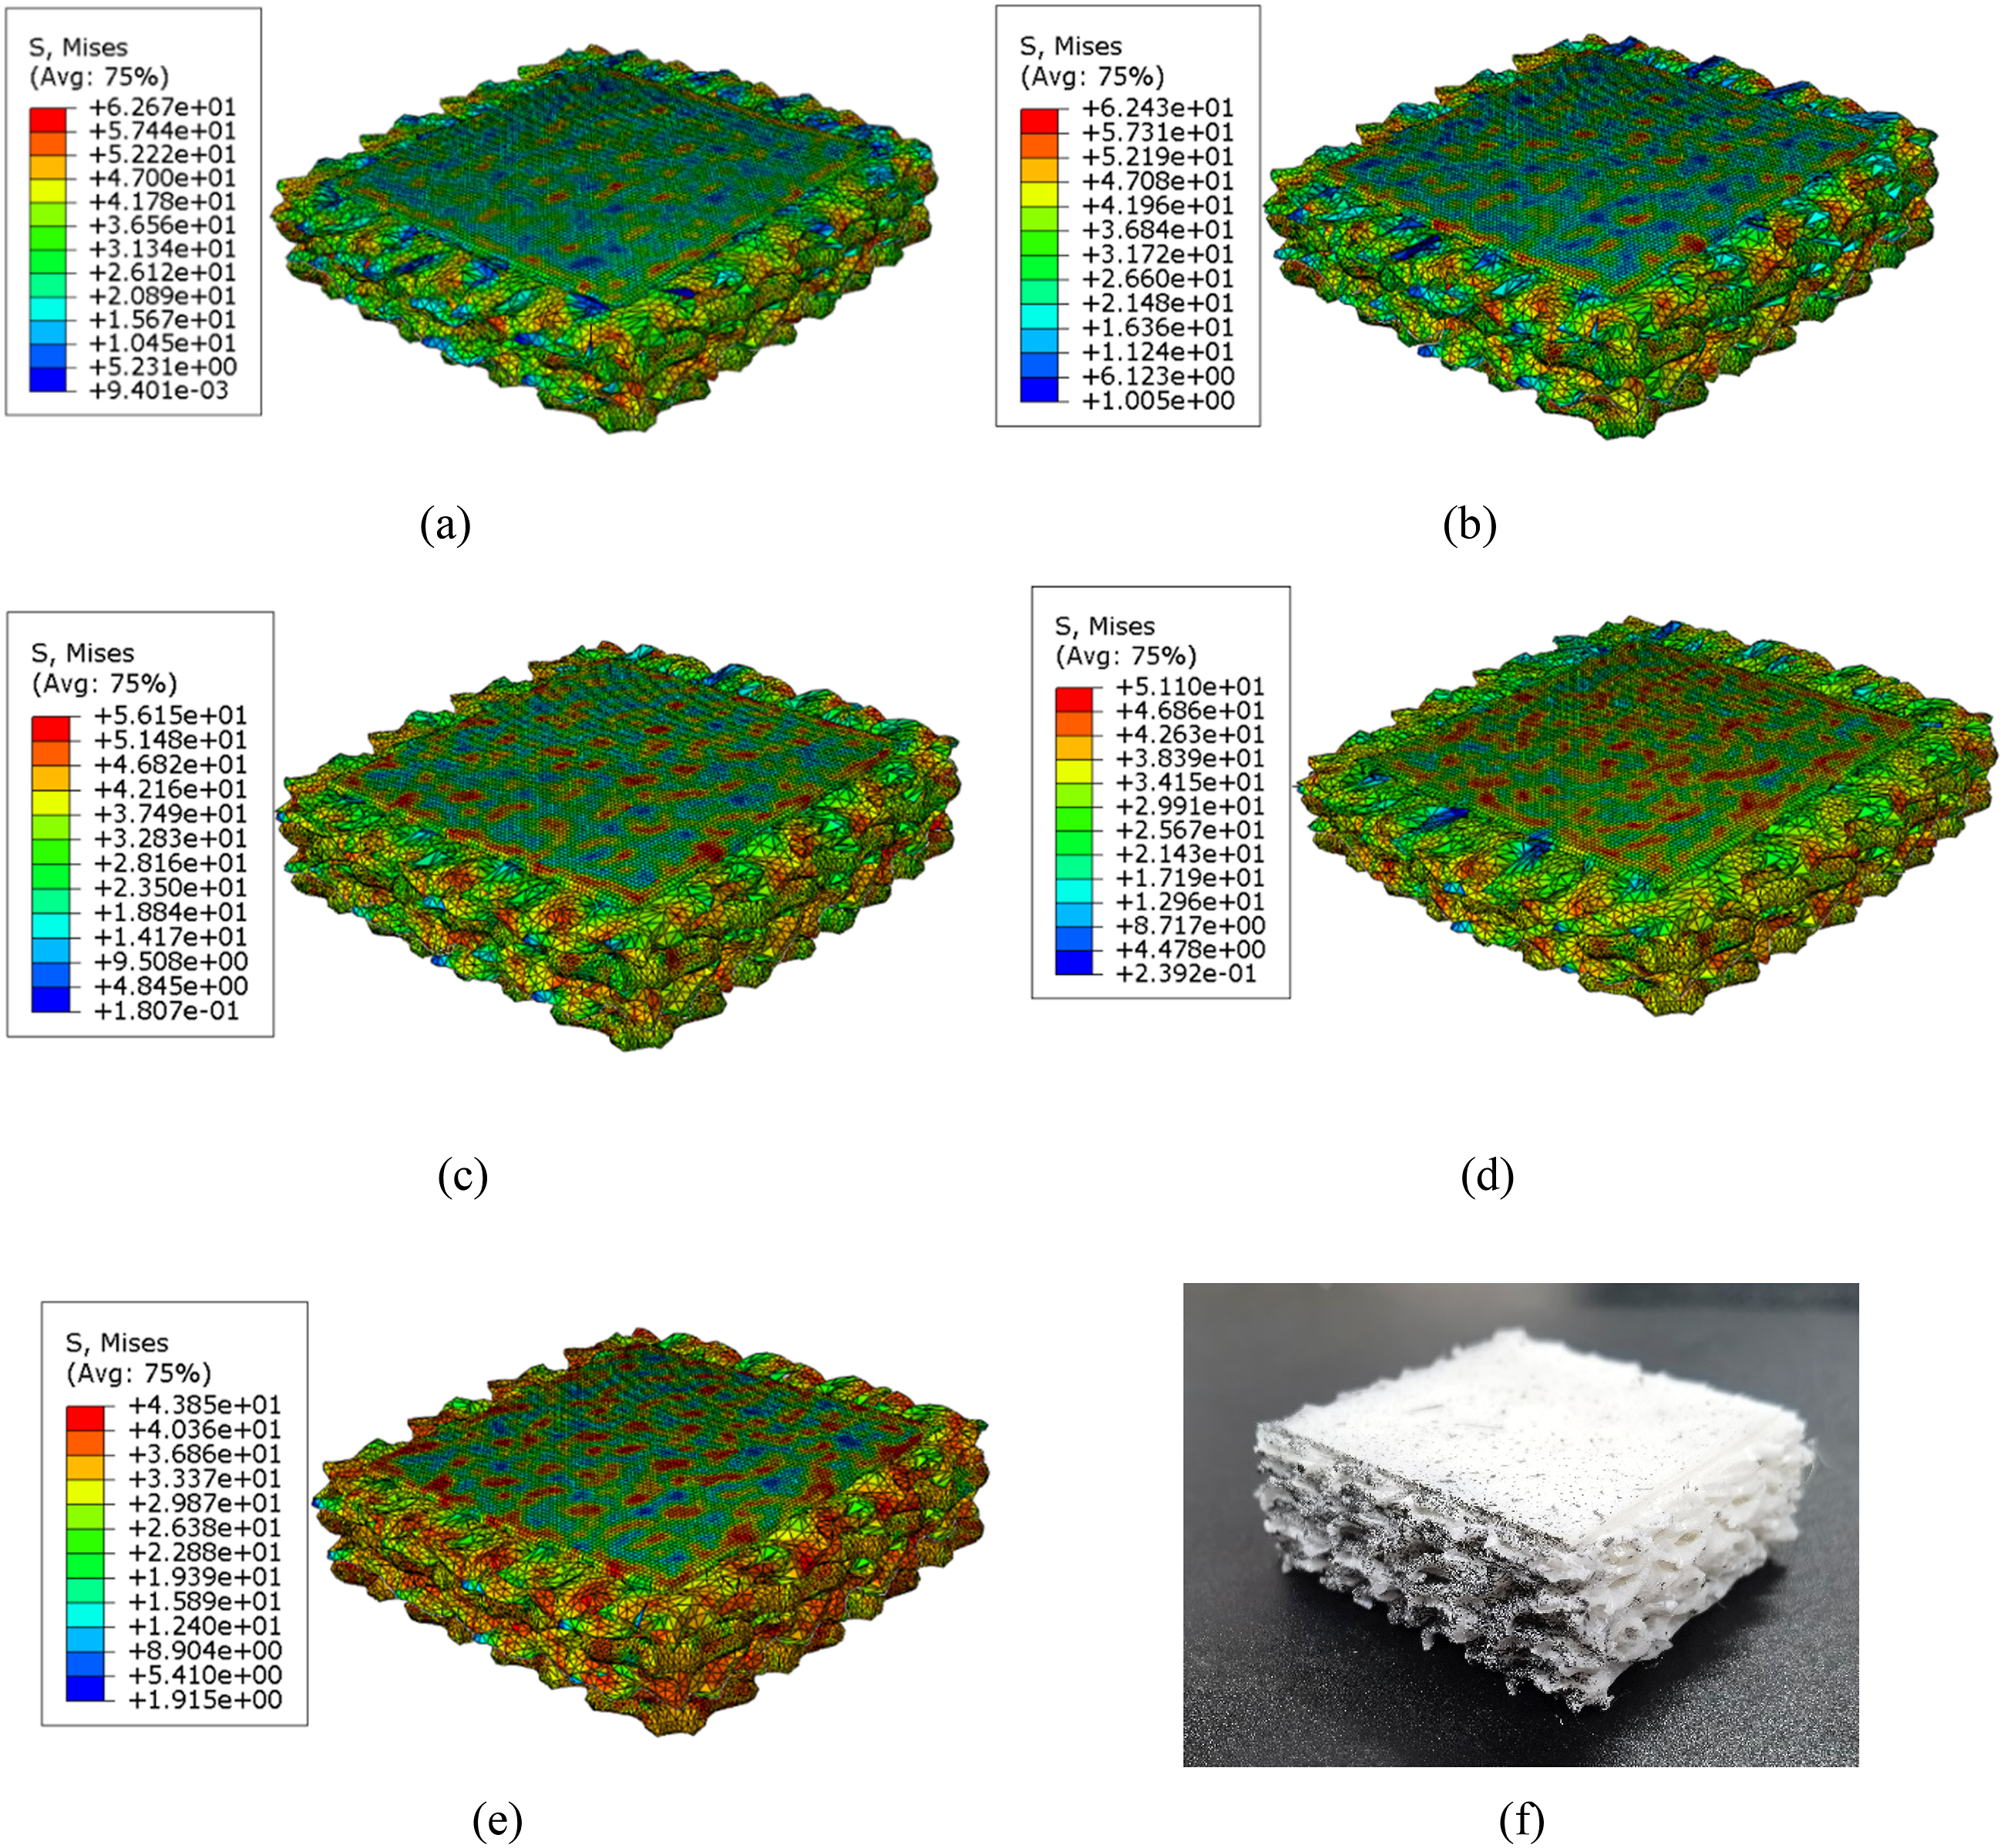
Stress-Strain Characteristics of P-G Four-Layer Structures
To investigate the stress distribution characteristics of the structure during compression deformation, a number of feature points are selected on the surface of the structure. The strain data pertaining to the strain within the 36 mm compression deformation range of the sample is then selected for display purposes, with a range of 0 to −1 selected. Figure 10(a) illustrates the vertical position of a number of points in the P-G four-layer structure, while Figure 10(b) depicts the strain along the vertical direction (Eyy) throughout the compression process for the aforementioned points. With the increase of compression displacement, the strains at the upper ( point 1 and 2 on the second P-layer ) of and lower points (point 4 and 5 on the fourth P-layer) are start increasing first. The strain of second P-layer reaches the maximum value before that of the fourth P-layer. As the compression process reached its halfway point, the strains of the two G-structure layers also began to increase. In general, the P-G four-layer structure exhibits the characteristics of layer-by-layer deformation and sequential compression collapse. Points bitmap at the same vertical position of the P-G Four Layer Structure and Eyy curves of the corresponding points.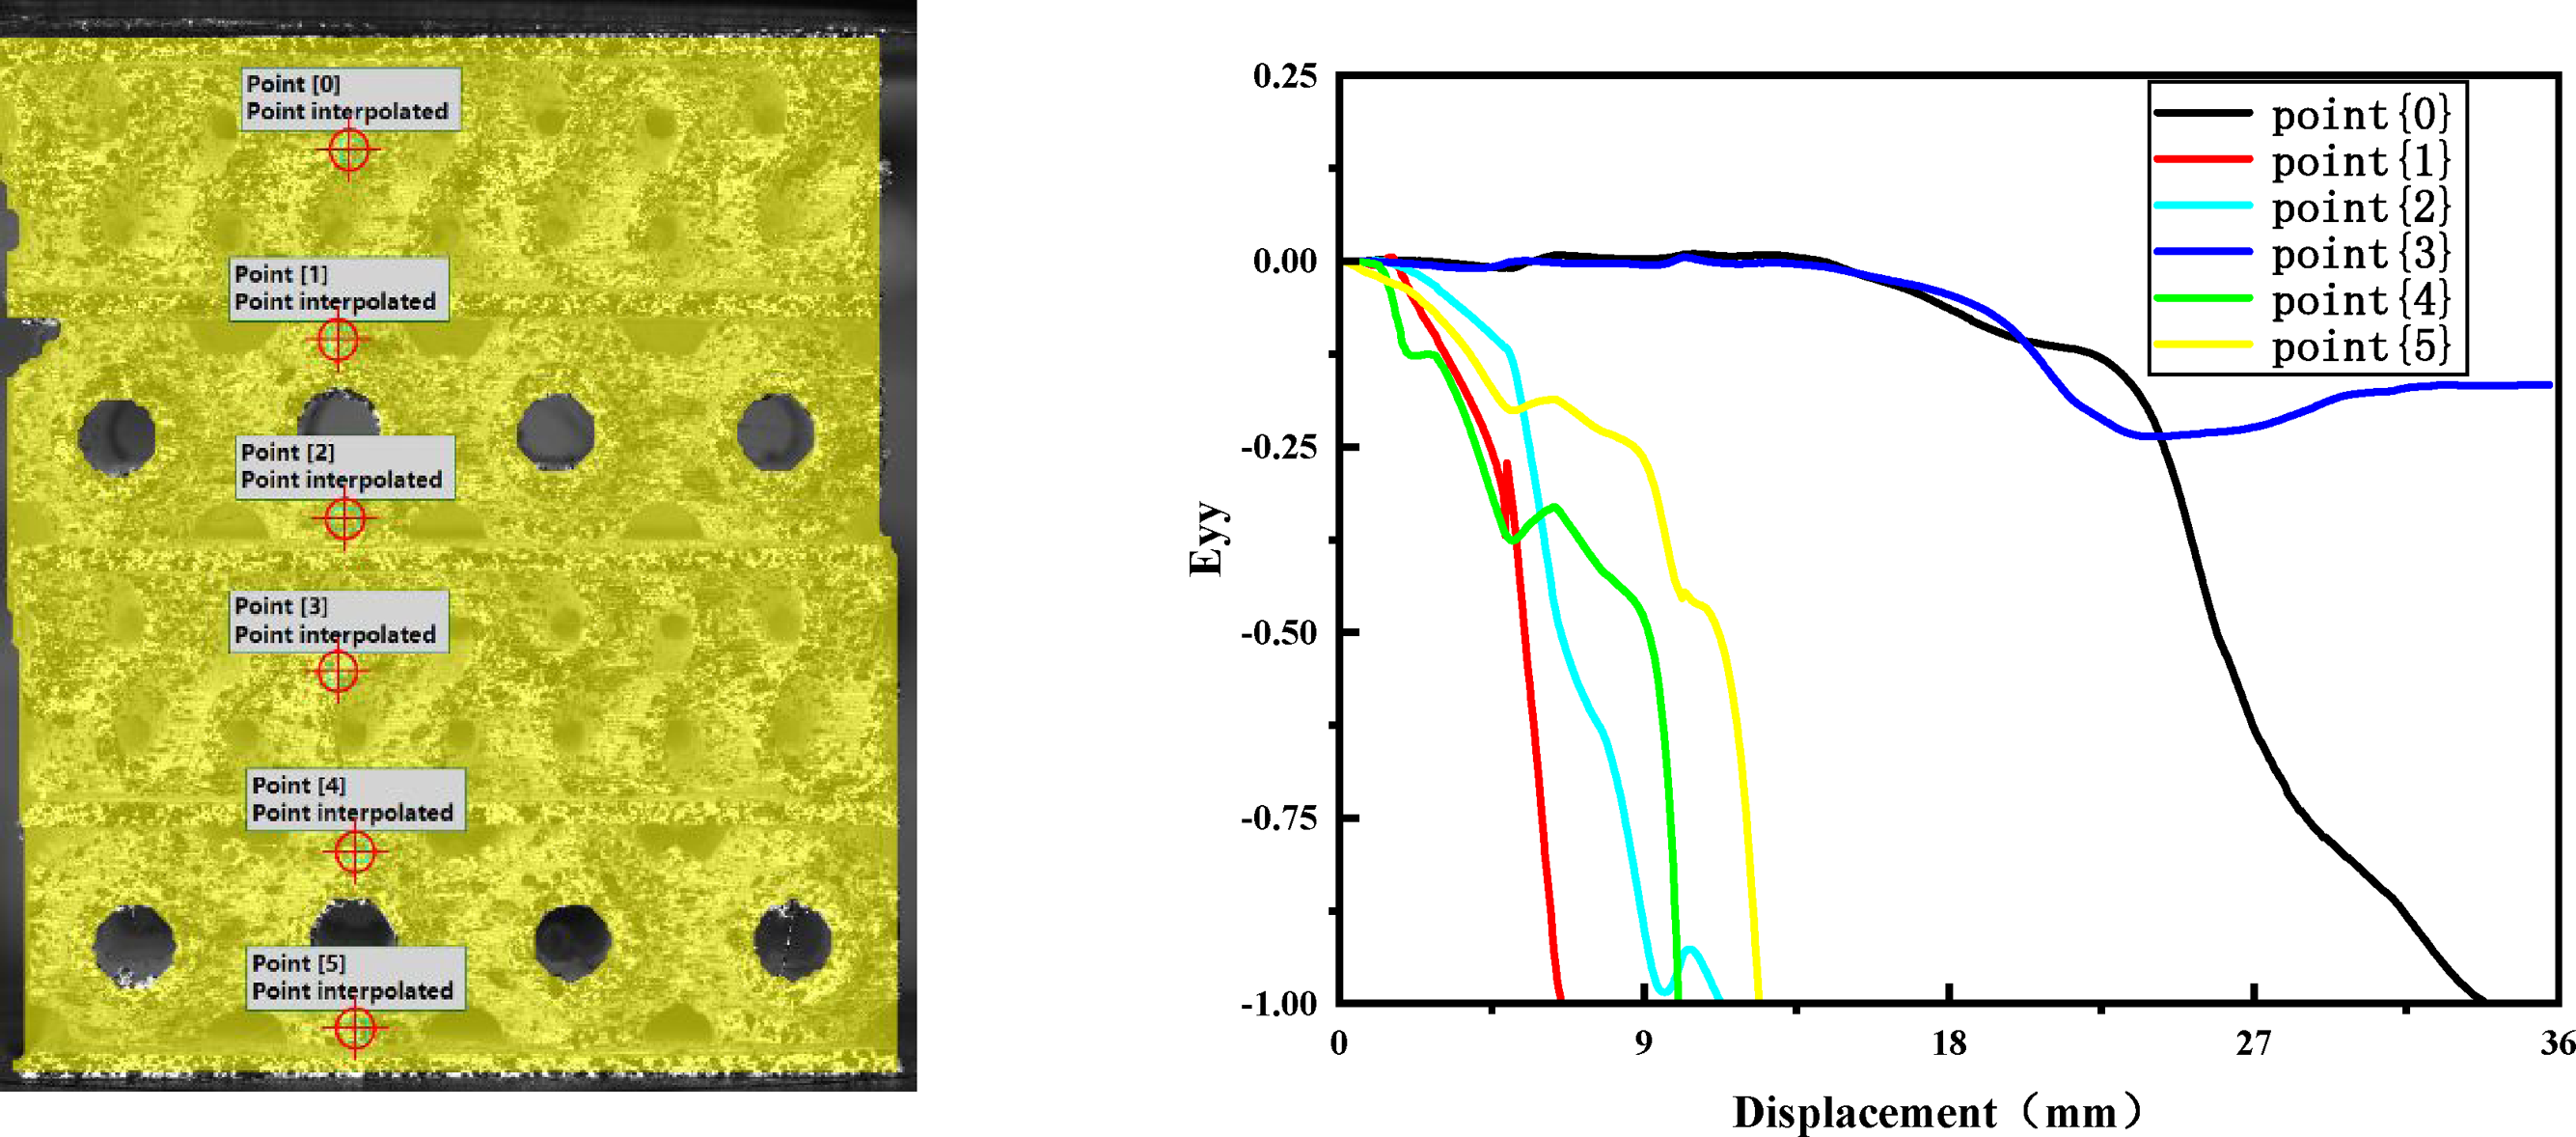
As shown in Figure 11, P-G structural simulations were performed at a strain rate of 0.01 s−1 and the representative stress clouds of several key compression displacement points (The values correspond to compression displacements of 8, 12, 17, 27, and 36 mm, respectively. These are illustrated in the experiment shown in Figure 6.) were selected. It can be observed that the two P-structure layers in the multilayer structure are the first to undergo deformation which have been confirmed by Figure 10(b), and that stress concentration occurs in the connection region of the P-structure layer units. (a)∼(f) Deformation diagrams corresponding to different compressive displacements of the P-G Four-Layer Structure at a strain rate of 0.01s−1. (a) 8 mm, (b) 12 mm, (c) 17 mm, (d) 27 mm, (e) 36 mm.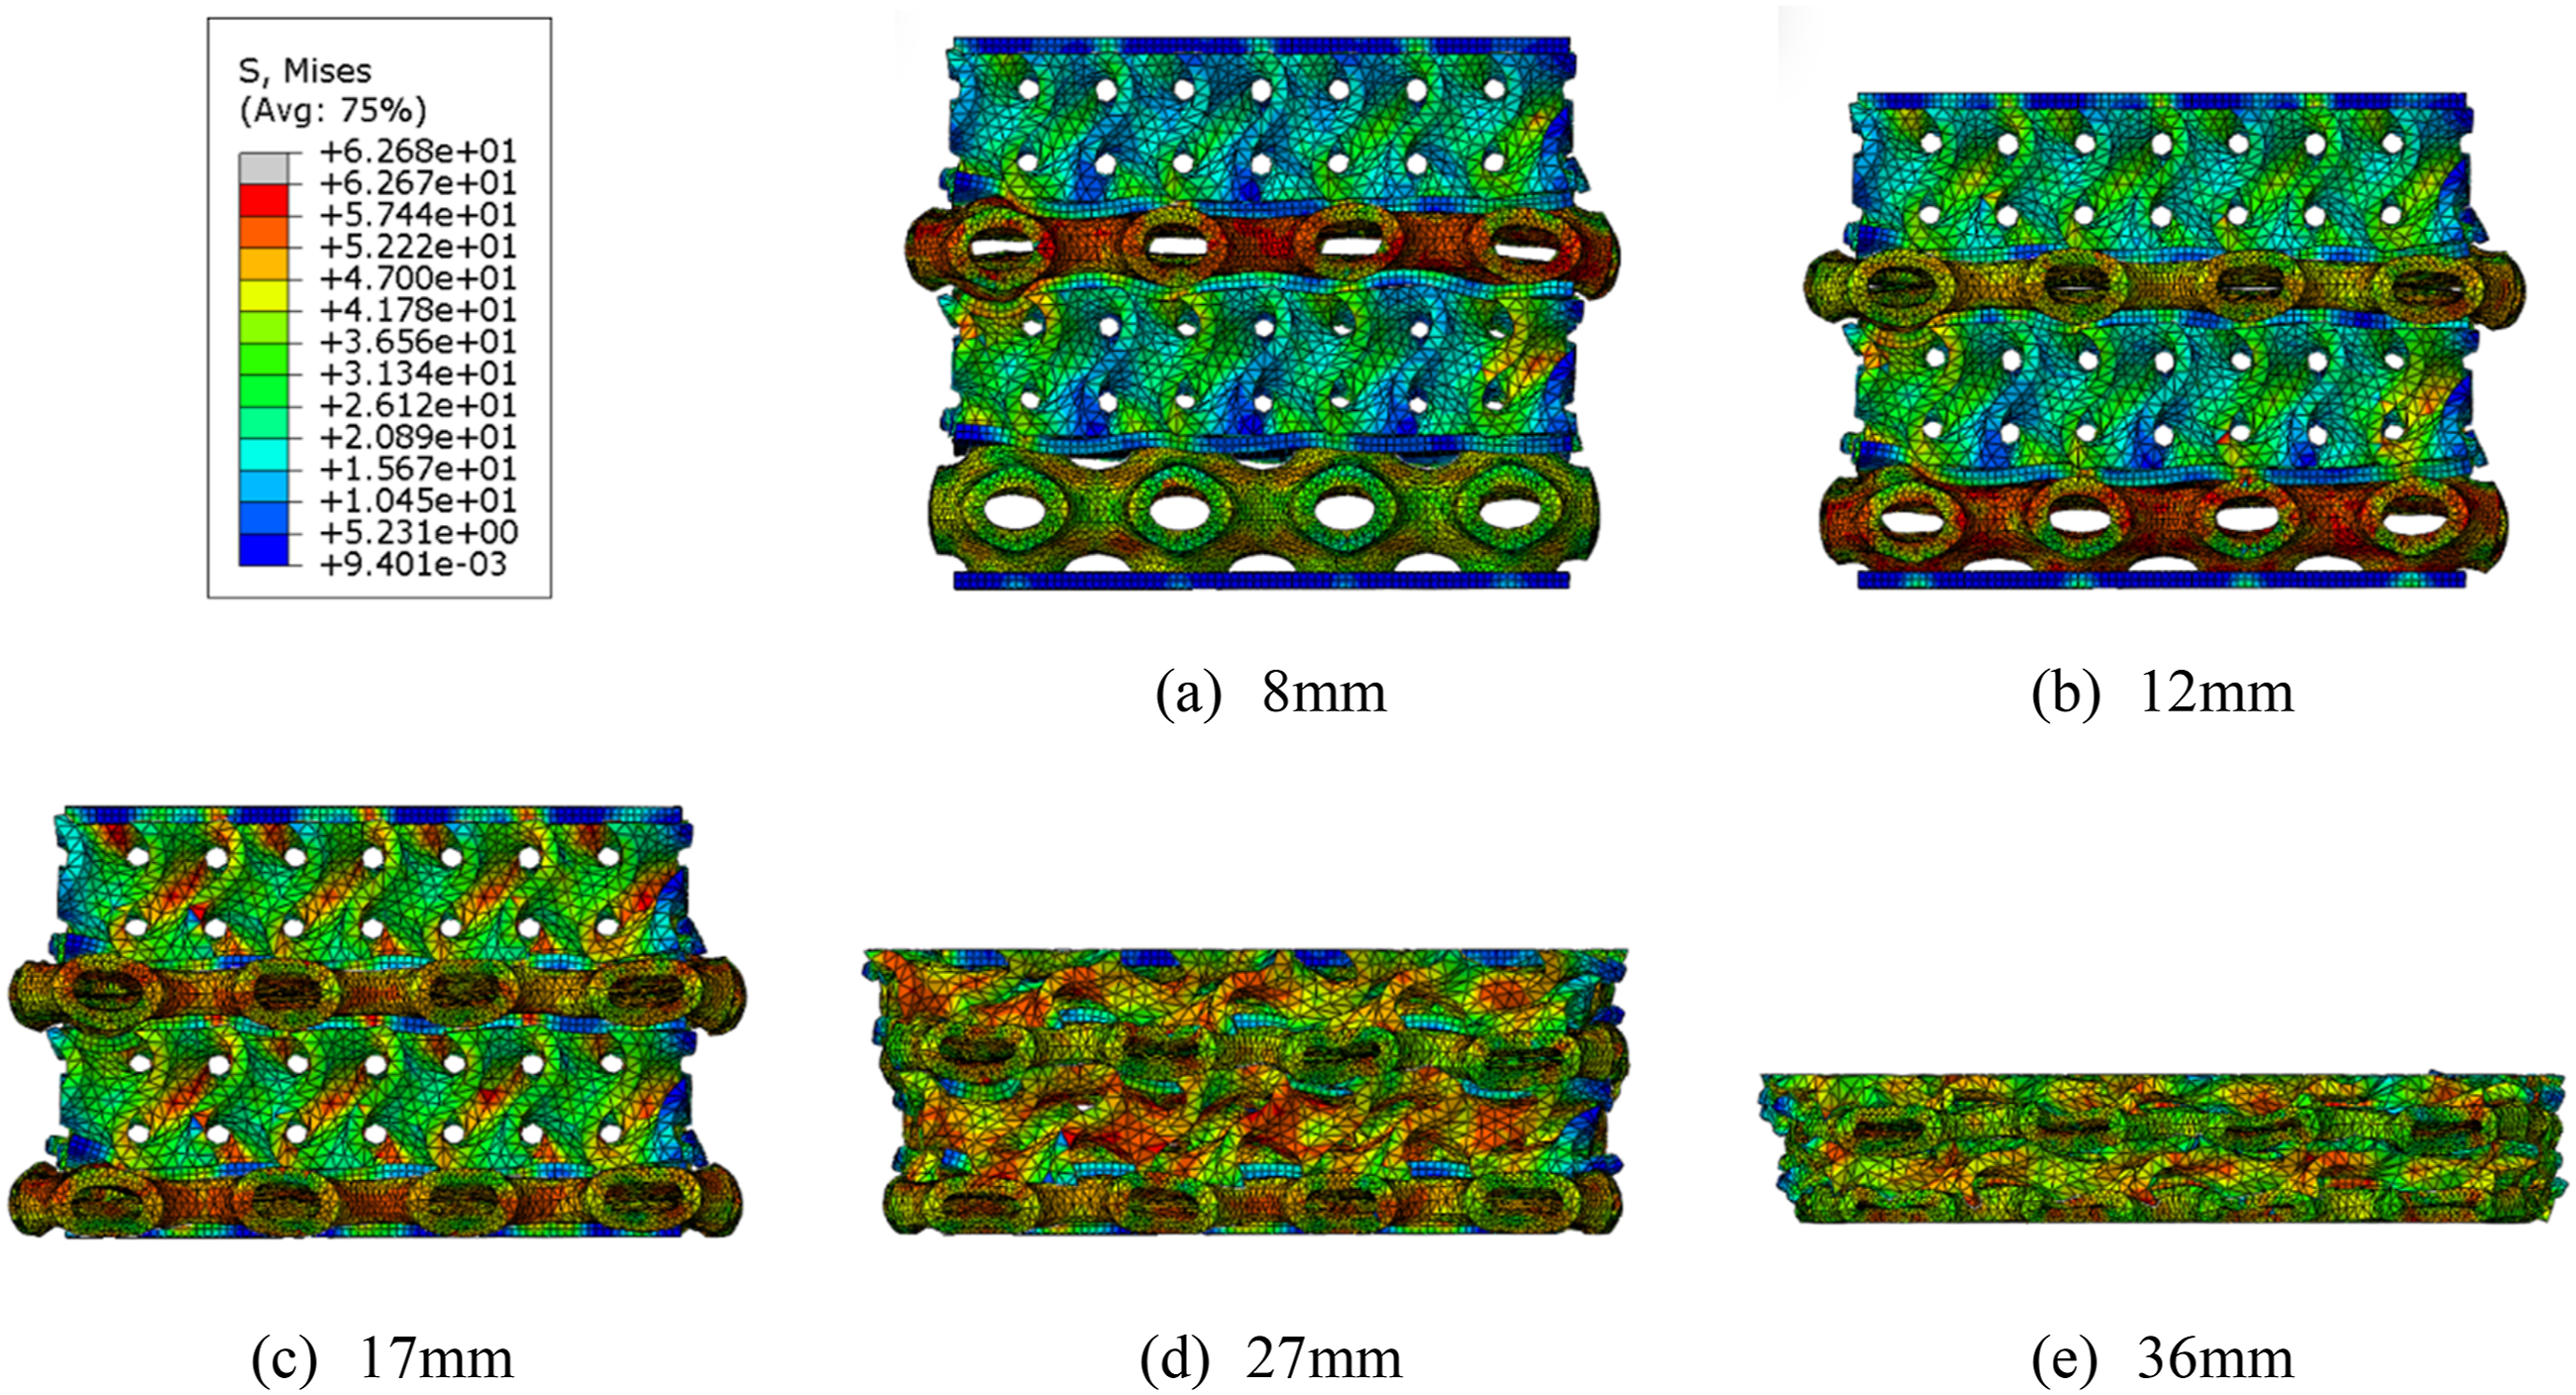
As the displacement increased, the second P-structural layer reached its ultimate strength, resulting in damage at 8 mm. This marked the onset of the initial phase of progressive collapse of the structure. Concurrently, the phenomenon of stress dissipation occurs in the region of the structure’s unit connections, demonstrating the adaptive adjustment of the structure in response to external forces. As the loading continues, the two-layer P structure is entirely destroyed when the displacement reaches 17 mm, at which point the two-layer G structure begins to contribute to the deformation. This conversion process is illustrative of the hierarchical and progressive nature of the structure in the collapse process. As the loading continues, the first layer of the G structure is destroyed before the third layer, and subsequently, the entire structure undergoes compression and densification. It is noteworthy that the collapse process of the P-G four-layer structure exhibits a markedly different pattern than that observed in the P-H four-layer structure, which has been described as exhibiting a “drum-shaped” destruction pattern. 29 In the P-G structure, there is no discernible extrusion of the structural layers, and the entirety of the structure exhibits an almost regular cubic configuration subsequent to compression. This distinctive collapse pattern serves to reinforce the progressive collapse of the P-G structure.
The compressive deformation process of the P-G structure obtained from simulation is basically consistent with the test, and the damage of the structure is evident in the form of layer-by-layer and progressive collapse, occurring in the following sequence: P structural layer (the second layer) → P structure (the fourth layer) → G structure (the first layer) → G structure (the fourth layer).
Mechanical Properties Analysis of P-G Six-Layer Structures
The preceding sections of this paper discussed the deformation characteristics of the four-layer structure under different strain rates. The findings indicate a strong correlation between the load-displacement data and the damage morphology of the structure obtained from the simulation and the test structure. The application of a flexible damage elasto-plasticity model in a finite element analysis can facilitate the identification of crucial reference points for the characterization of compressive deformation characteristics in multilayer structures. Accordingly, a six-layer structure founded upon the principles of the P-surface and G-surface models has been devised for simulation of compression tests conducted at disparate strain rates, as illustrated in Figure 3(c).
In this simulation, the lower end of the model was constrained, while the upper part was subjected to a displacement compression of 54 mm along the negative z-axis direction. Five sets of load-displacement curves under different strain rates were obtained by using display dynamics calculations as presented in Figure 12. Simulation results of force-displacement curves under five sets of different strain rates.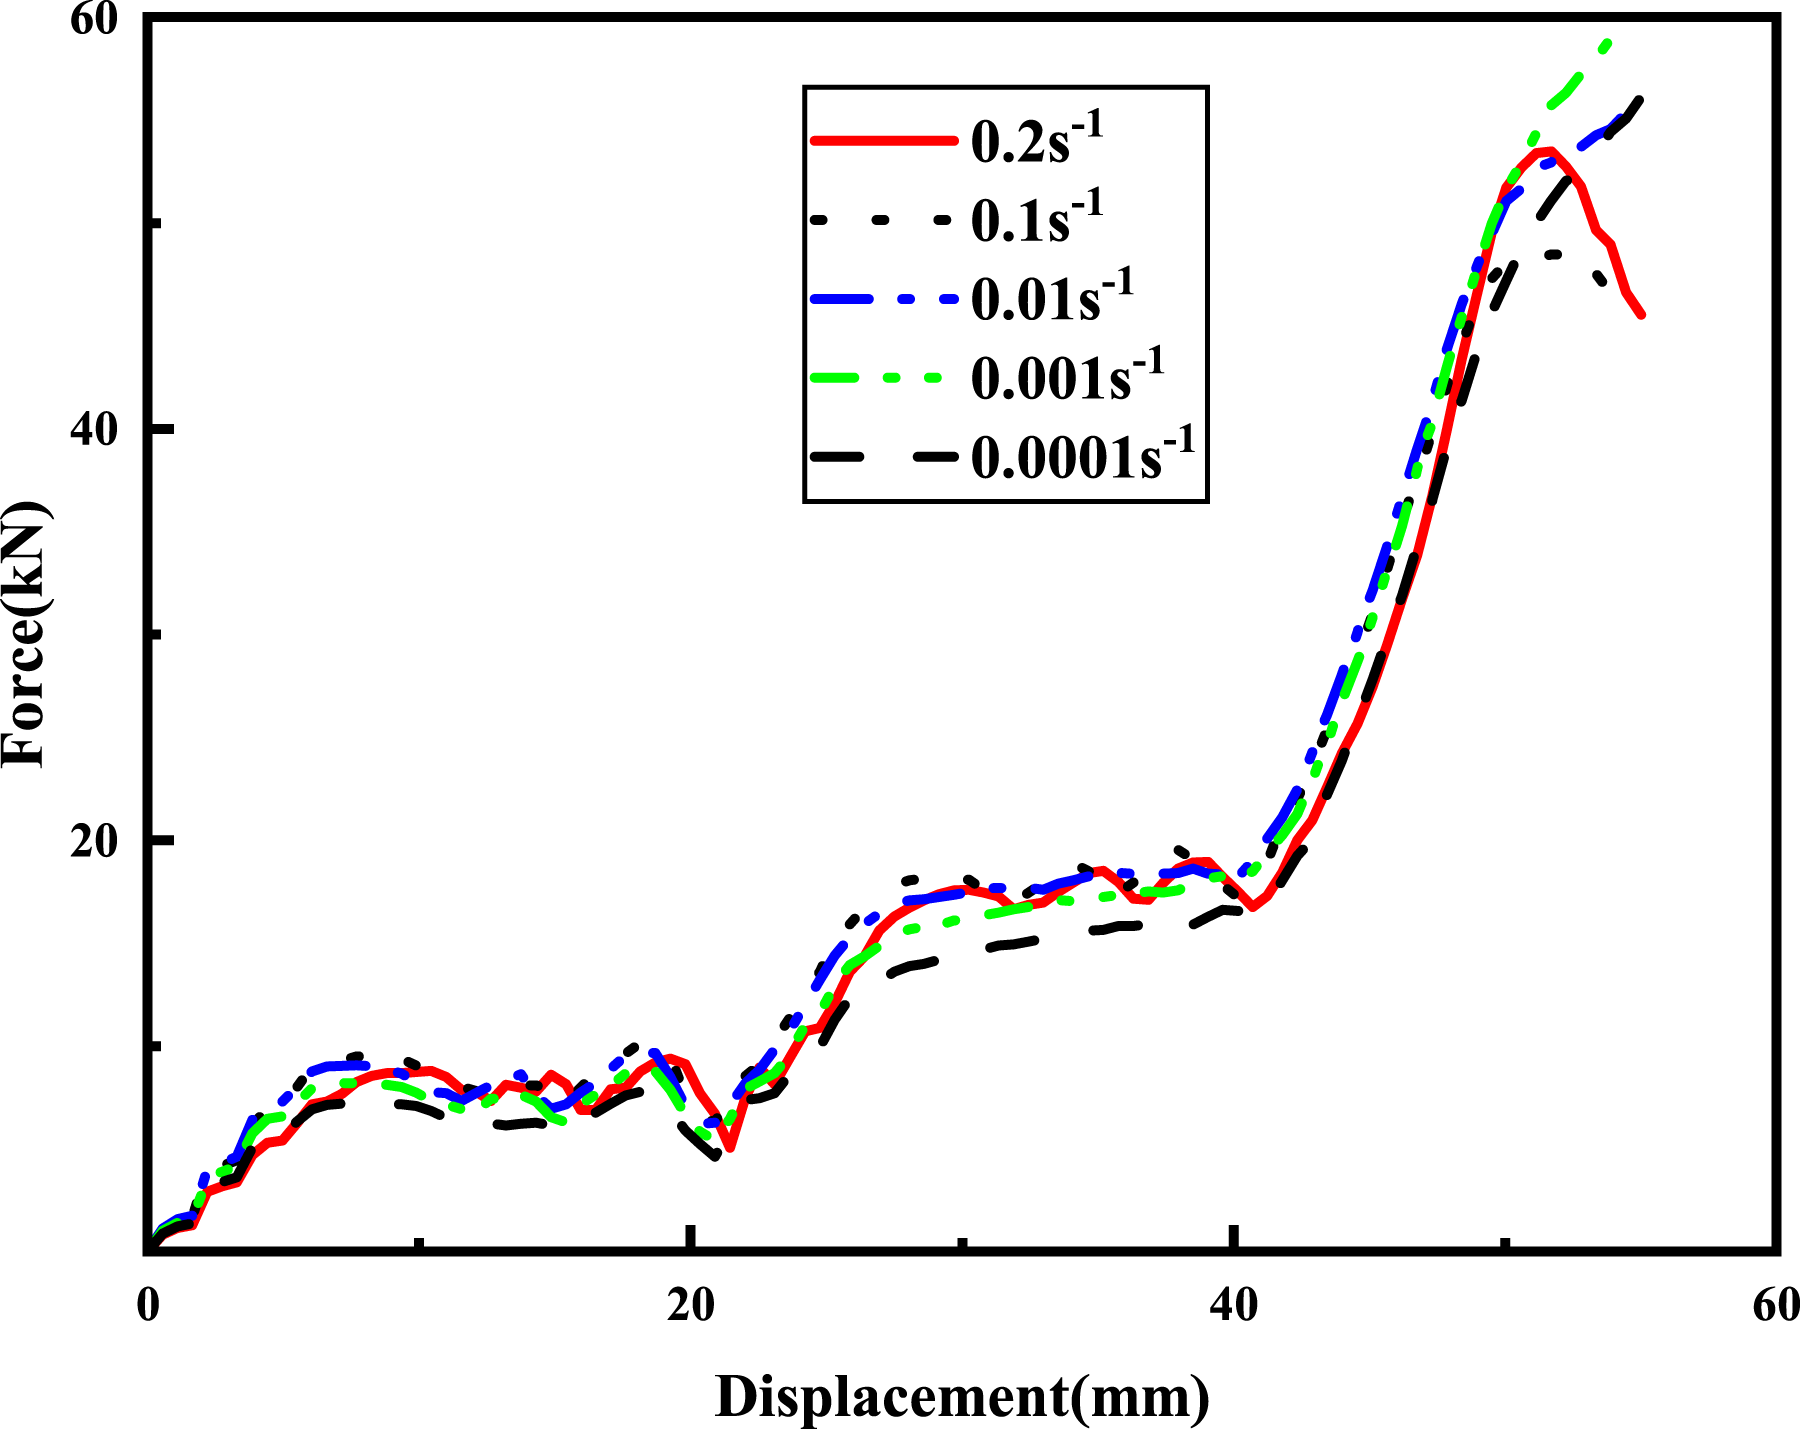
It can be observed that the load-displacement curves for varying strain rates demonstrate a double-platform characteristic and the pattern of the load-displacement curves during compression of the P-G six-layer structure is basically the same. Upon reaching a displacement of approximately 10 mm, the structure commences the first platform phase, which persists until the compression displacement reaches 20 mm. Upon exceeding a displacement of 20 mm, an increase in load is observed, accompanied by the commencement of the second platform stage of the structure. The second platform phase persists until the displacement upwards 40 mm. Subsequently, the structure is subjected to rapid increase in loads until the end of the simulation.
In particular, the load-displacement curves demonstrate elevated fluctuations in the second platform stage at strain rates of 0.2 s−1 and 0.1 s−1. This phenomenon is analogous to the cause of fluctuations observed in the second platform stage of a P-H four-layer structure at high strain rates.
The deformation of the P-G six-layer structure under five different strain rates are illustrated in Figure 13. It can be seen that the maximum stress experienced by the structure increases with the strain rate. The final damage morphology of the P-G structure exhibits a high degree of similarity at different compression rates, and there is no evidence of extrusion in any of the layers in any of the layers. In order to elucidate the compressive deformation process with greater clarity, Figure 14 presents 8 sets of stress cloud maps corresponding to different compression displacements under the strain rate of 0.2 s−1. Specimen morphology of the P-G Four-Layer Structure after simulated compression collapse at five different strain rates. (a) 0.2 s−1; (b) 0.1 s−1; (c) 0.01 s−1; (d) 0.001 s−1; (e) 0.0001s−1. (a)∼(h) Stress nephograms corresponding to eight different compressive displacements at a strain rate of 0.2 s−1. (a) 10 mm. (b) 12 mm. (c) 16 mm. (d) 22 mm, (e) 27 mm, (f) 34 mm, (g) 38 mm, (h) 40 mm.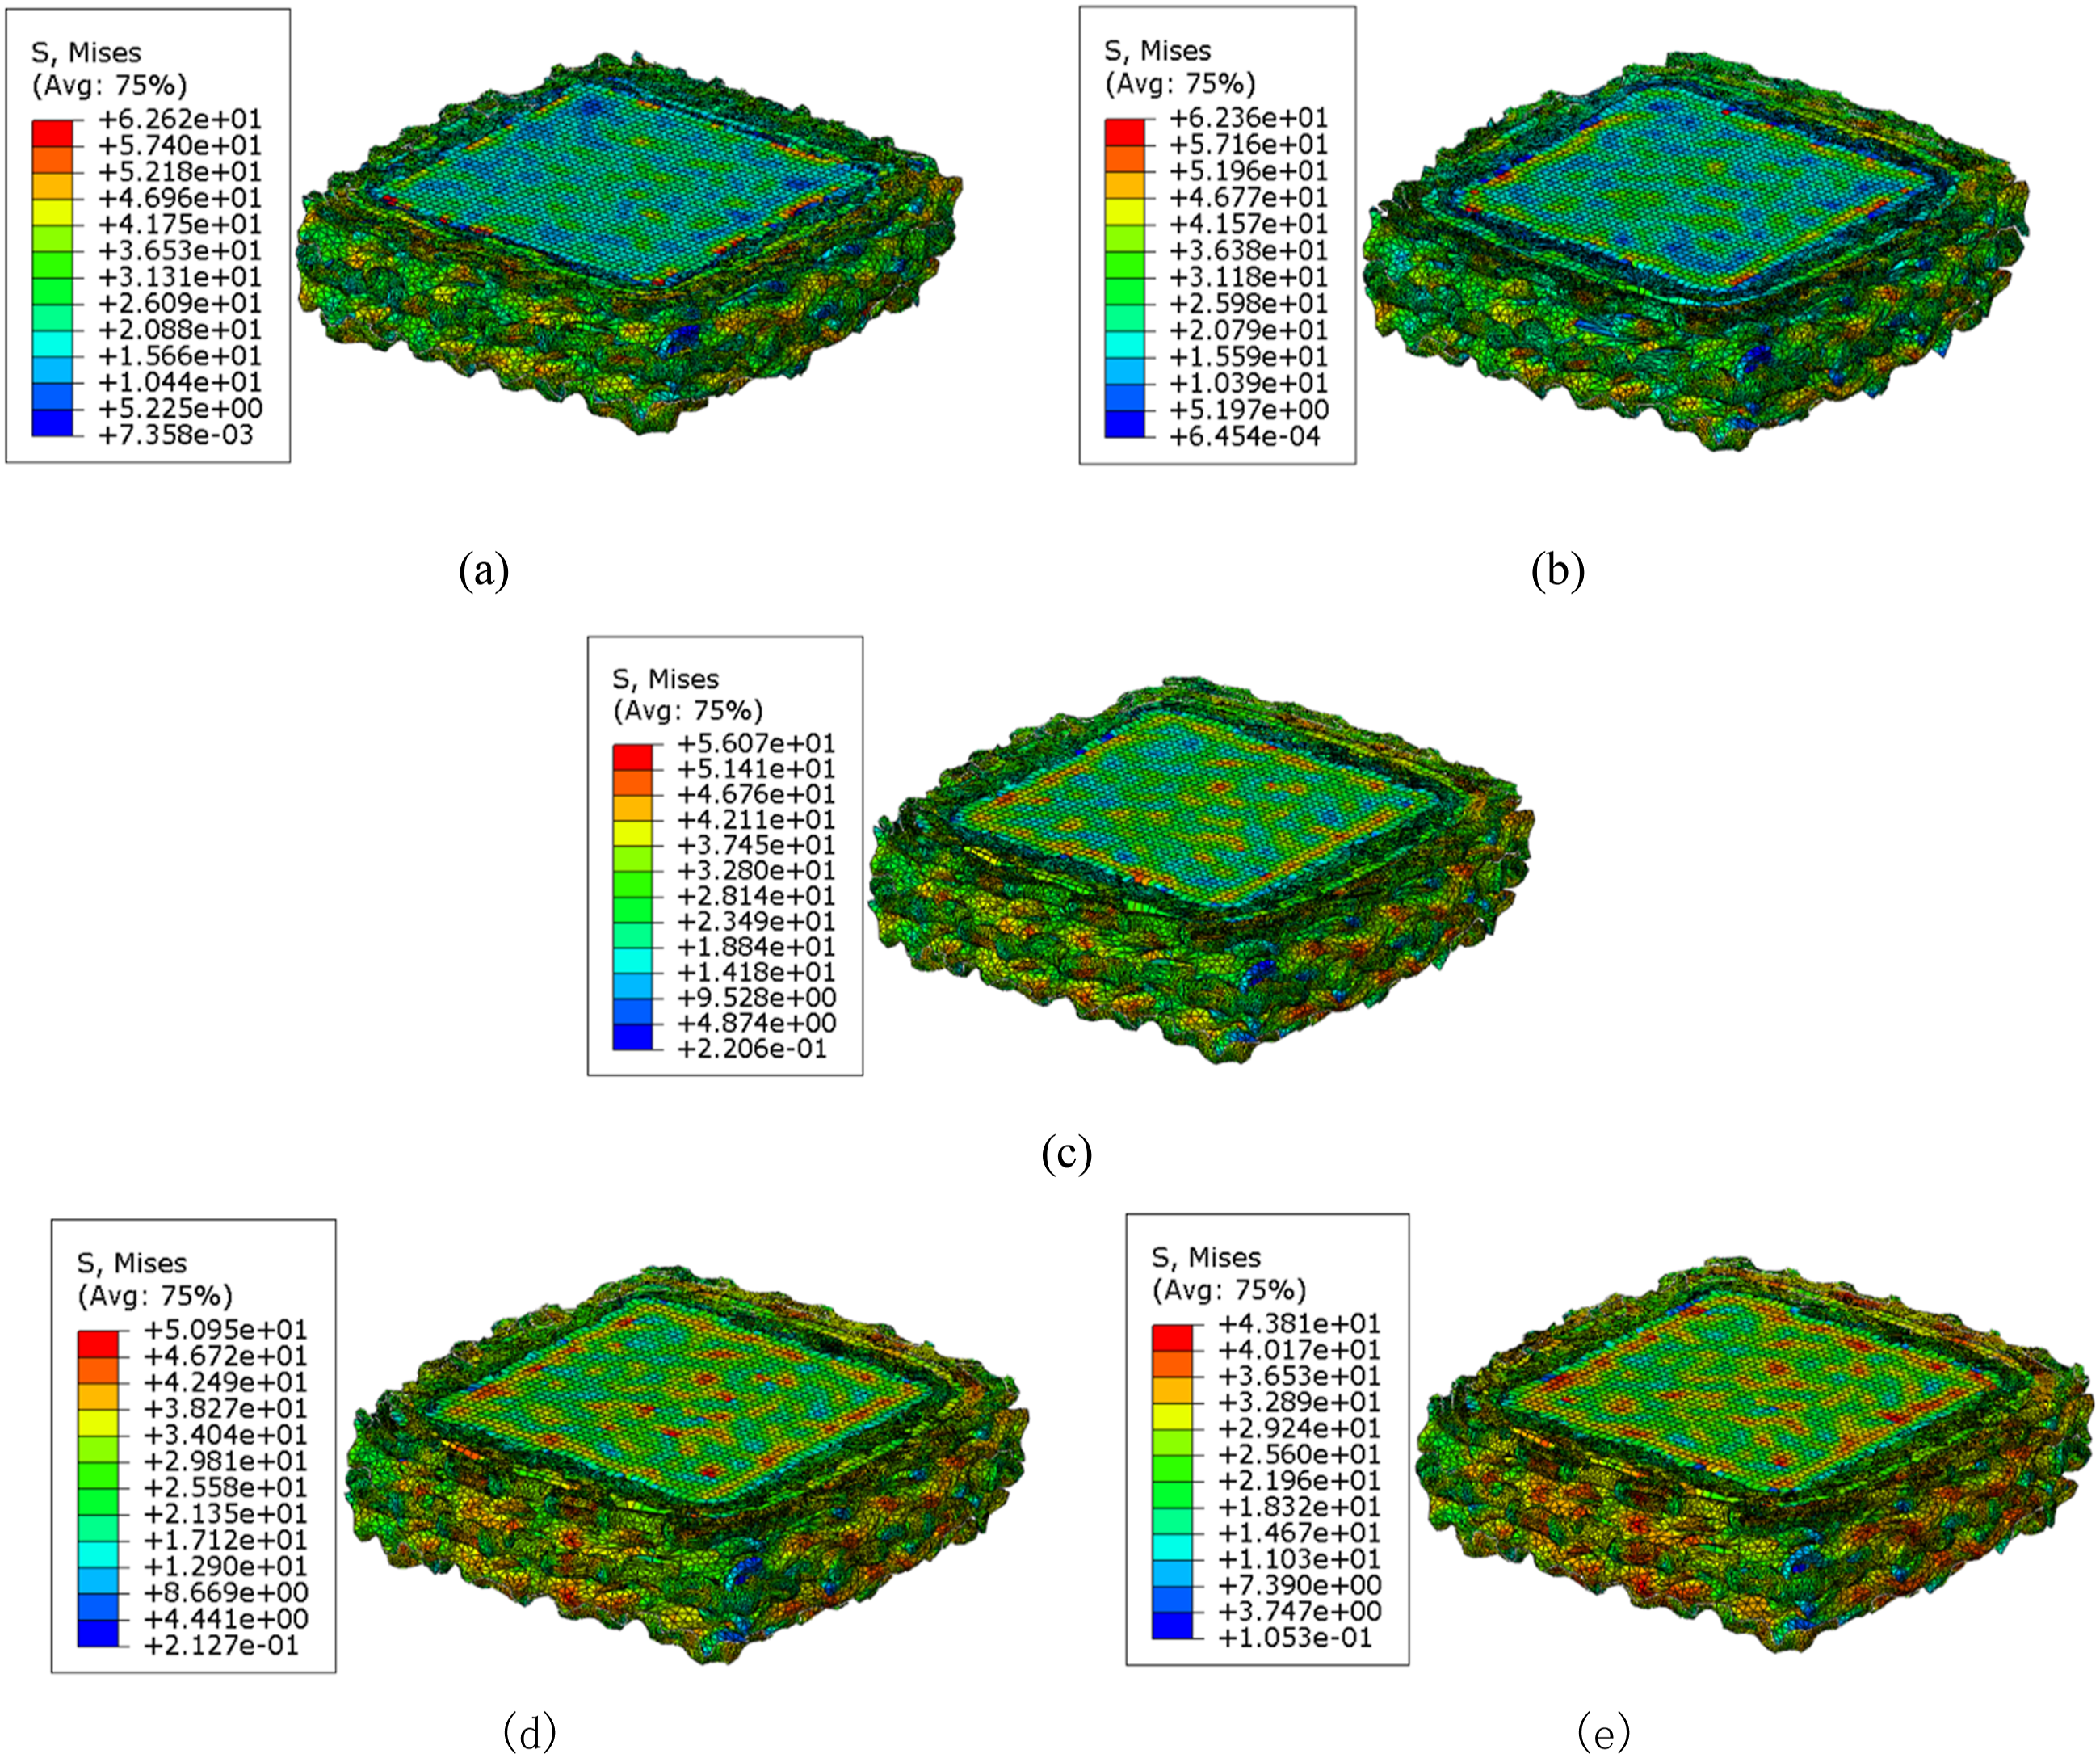
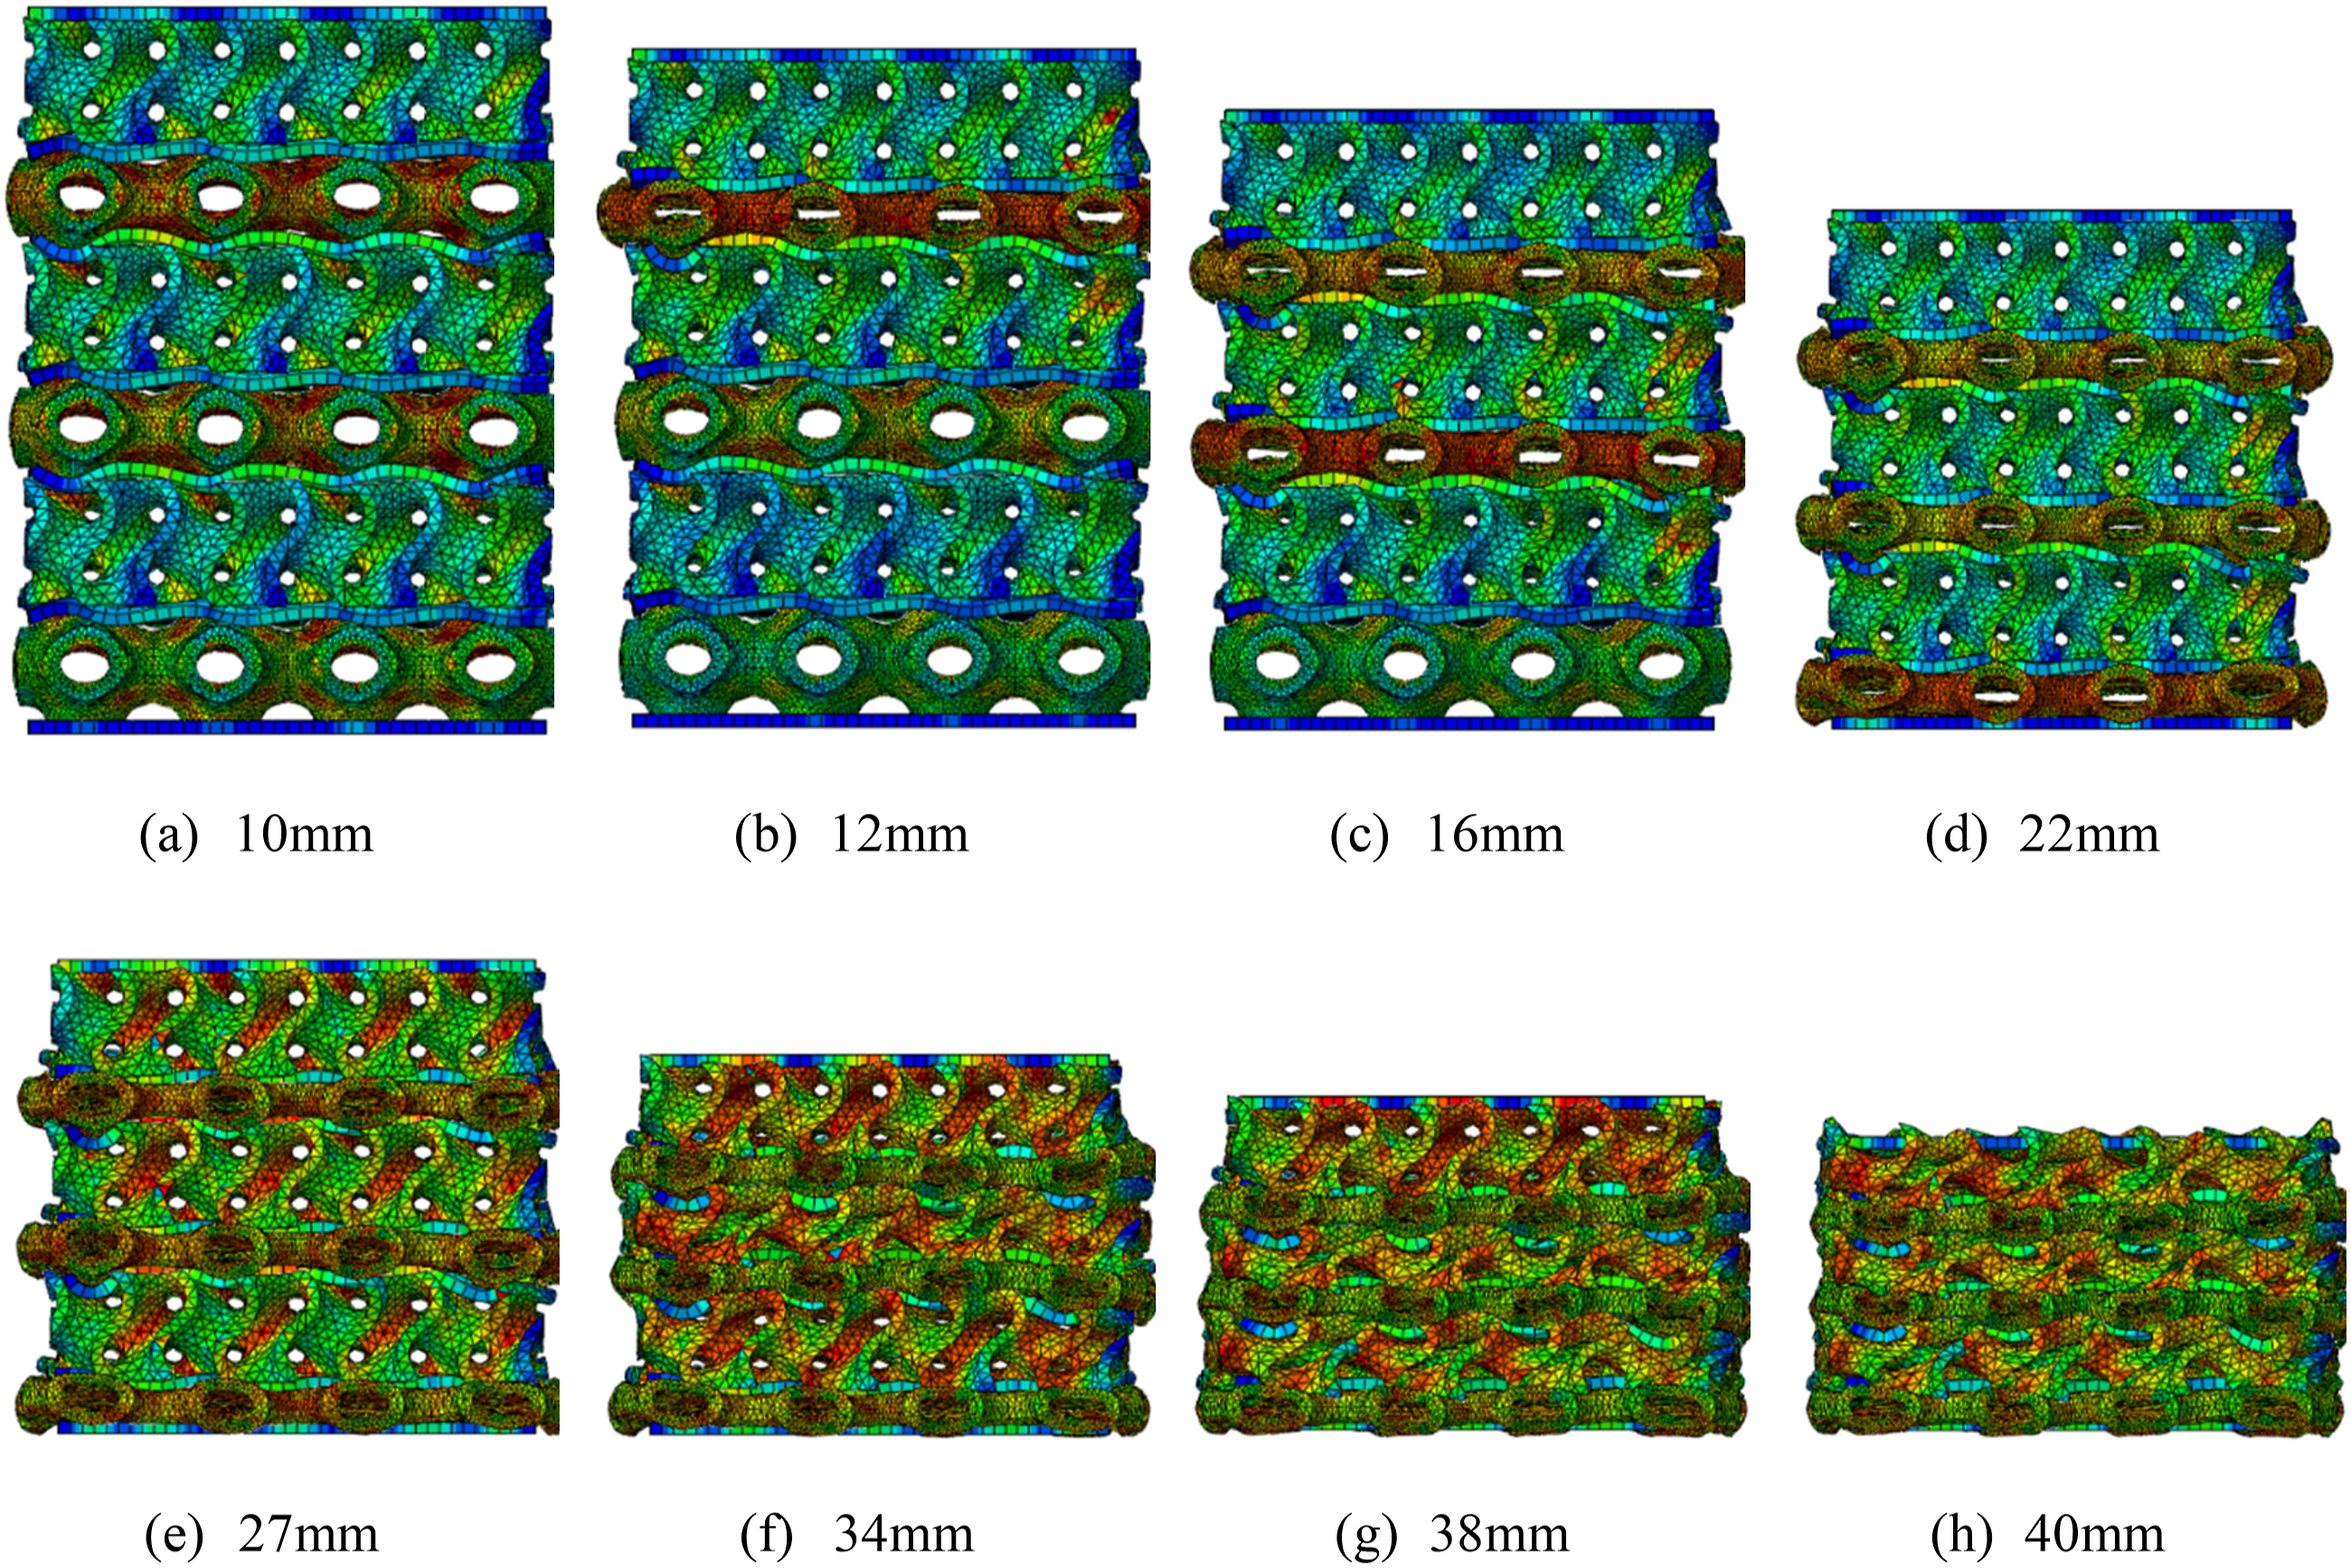
It can be observed that the three P-structural layers, which serve as the primary load-bearing components, undergo plastic deformation. Stress concentration occurs at the point of articulation within the P-structural layer, specifically at a compression displacement of 10 mm. Upon loading the displacement to 12 mm, the second layer of the structure (the P-structural layer, from top to bottom) undergoes plastic deformation and exhibits damage. It is observed that the phenomenon of stress concentration at the articulation of the fourth and sixth units (P structural layers) no longer occurs. This can be attributed to the same mechanism that governs stress dissipation in the four-layer P-structural layer following the onset of plastic damage. As the loading process continues, the fourth layer (P-structural layer) undergoes plastic deformation. Upon reaching a compression distance of 22 mm, the sixth layer (P-structural layer) begins to exhibit damage, with all P-structural layers subsequently undergoing crushing, compression, and compaction as a result of the loading displacement.
Subsequently, the three G structural layers commence loading as the principal bearing layers. From an analysis of the structural deformation patterns corresponding to 34 mm, 38 mm, and 40 mm in Figure 14, it can be observed that the third layer (G-structural layer) undergoes plastic deformation destruction first, followed by the fifth layer (G-structural layer). Ultimately, the first layer (G-structural layer) is subjected to crushing. Upon reaching a compression displacement up to 40 mm, the three G structural layers undergo a specific deformation, resulting in overall compression and compaction of the structure. Similarly, the destruction pattern of the P-G four-layer structure exhibits no discernible extrusion of each structural layer during compression. Upon completion of the compression, the entire structure exhibits a near-regular cubic configuration.
The layer by layer deformation characteristics of the damage manifestation of the P-G six-layer structure is: P structural layer (second layer, from top to bottom) → P structure (fourth layer) → P structure (sixth layer) → G structure (third layer) → G structure (fifth layer) → G structure (first layer).
Mechanical Properties Analysis of P-H Six-Layer Structures
The P-surface structure and honeycomb structure are combined into a new six-layer composite structure, as illustrated in Figure 3(d). The settings for the finite element simulation process are identical to those described in Section 4.3. The load-displacement curves at varying strain rates were generated following calculations utilizing display dynamics, as illustrated in Figure 15. Simulation results of force-displacement curves under five sets of different strain rates.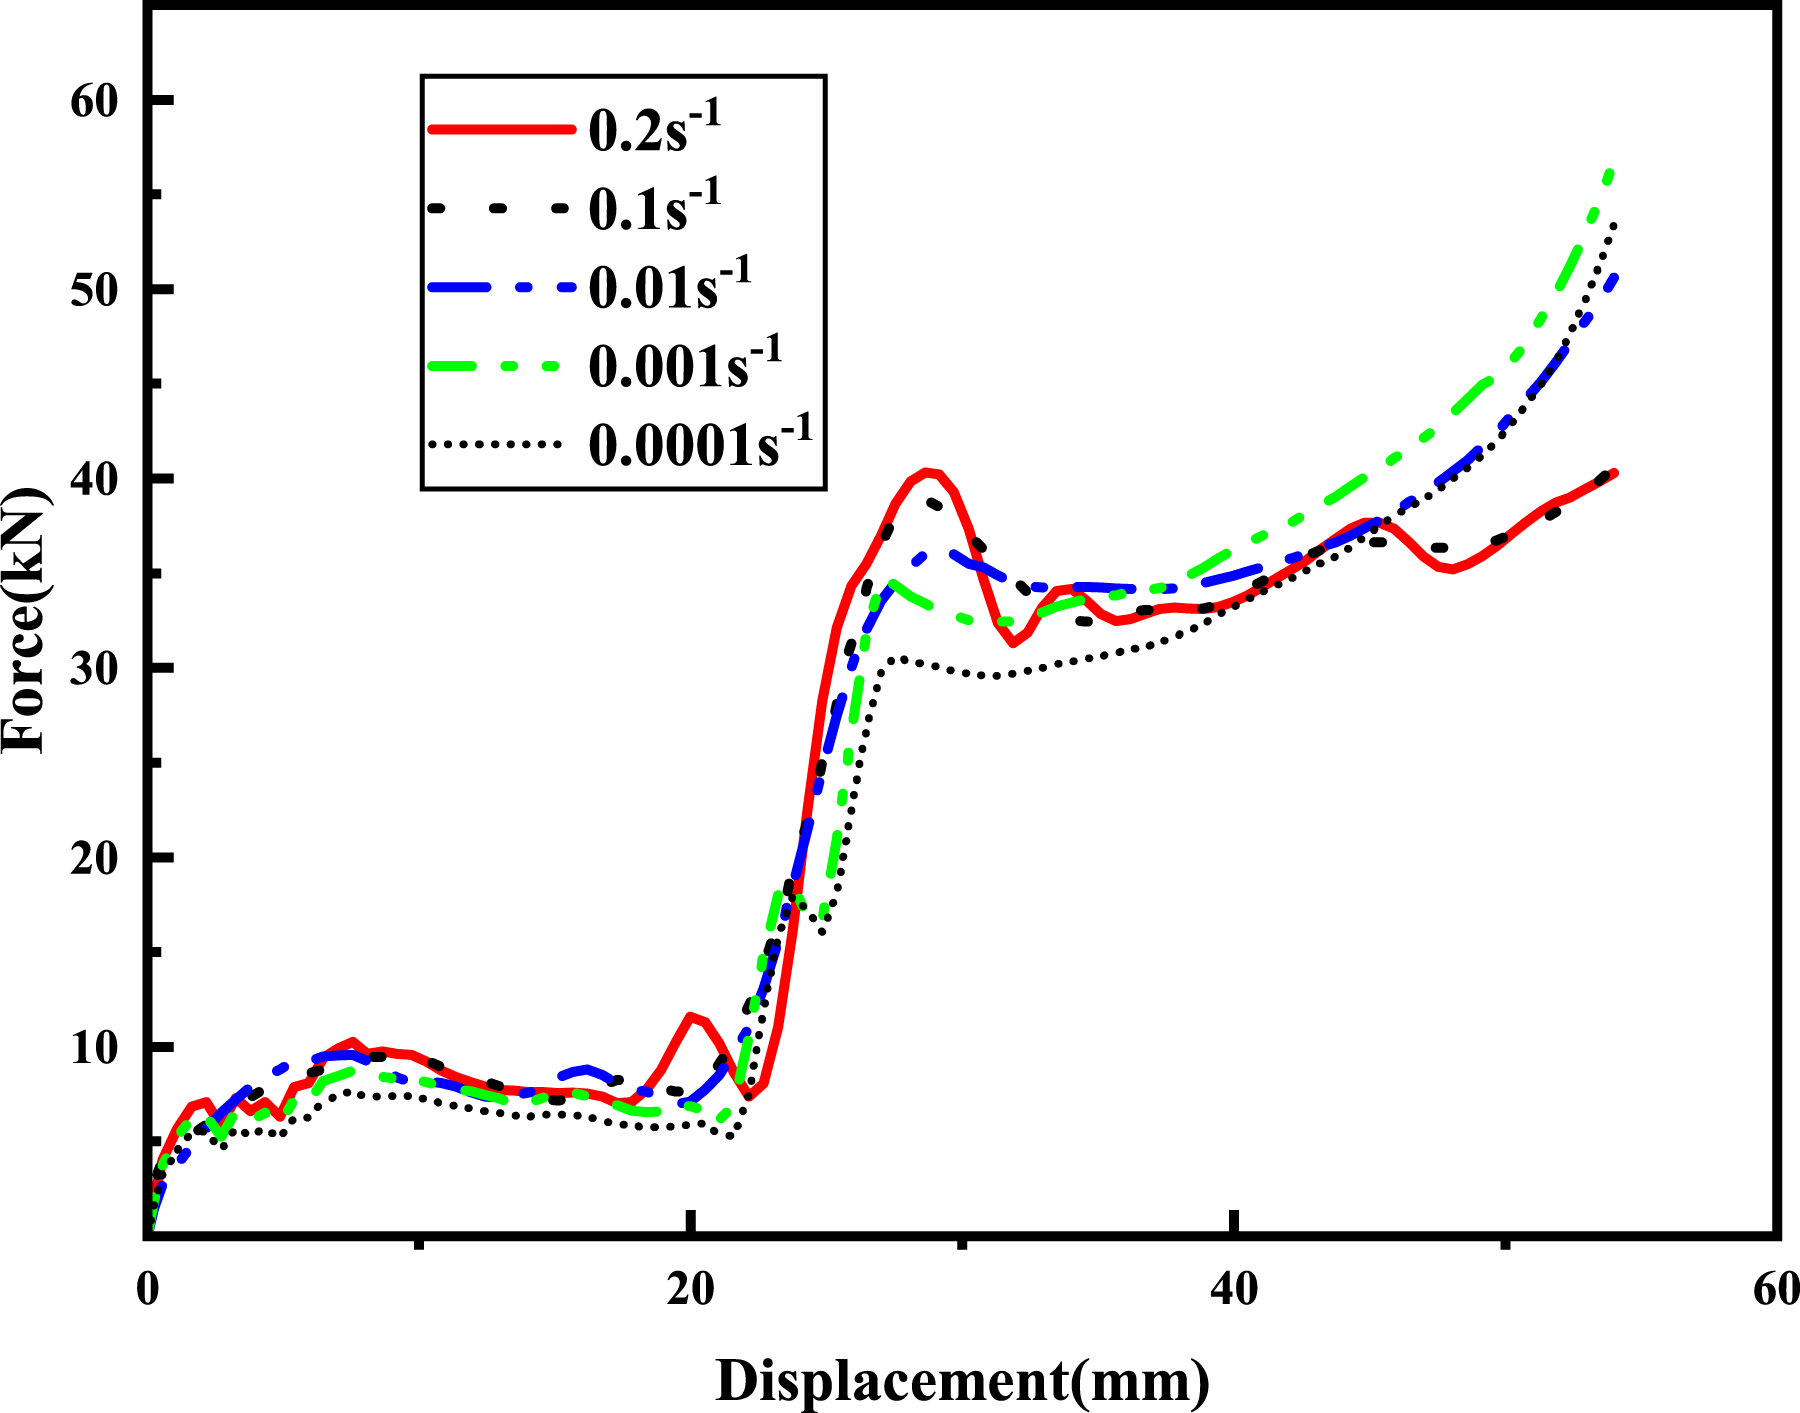
It can be observed that the force-displacement curves display a double-platform characteristic for all conditions and that the evolution trend of the five curves under different compression rates is basically the same. The P-H six-layer structure is situated within the initial platform stage between the compression displacements of 10mm-20 mm. Subsequently, the load increases linearly until the curve transitions into the second platform phase, which occurs when the compression displacement reaches approximately 30 mm. Ultimately, the structural integrity was compromised, resulting in the onset of the overall densification phase. A comparison with the load-displacement curves derived from the simulation of the P-G six-layer structure, as depicted in Figure 12, reveals that both six-layer structures share similar dual-platform characteristics. However, the load during the second platform stage of the P-H six-layer structure falls within the range of 40 kN, whereas for the P-G six-layer structure, it is within the range of 20 kN.
The finite element simulation results for the P-H six-layer structure, subjected to five distinct sets of strain rates, are depicted in Figure 16. It is evident from the analysis that the peak stress within the structure exhibits a positive correlation with the strain rate. Furthermore, the ultimate failure patterns of the P-H structure vary notably across the different compression rates. Under all conditions, the layered structure undergoes compressive displacement, resulting in the formation of a distinct “bulge” morphology. Specimen morphology of the P-H Six-Layer Structure after simulated compression collapse at five different strain rates. (a) 0.2 s−1 (b) 0.1 s−1 (c) 0.01 s−1 (d) 0.001 s−1 (e) 0.0001 s−1.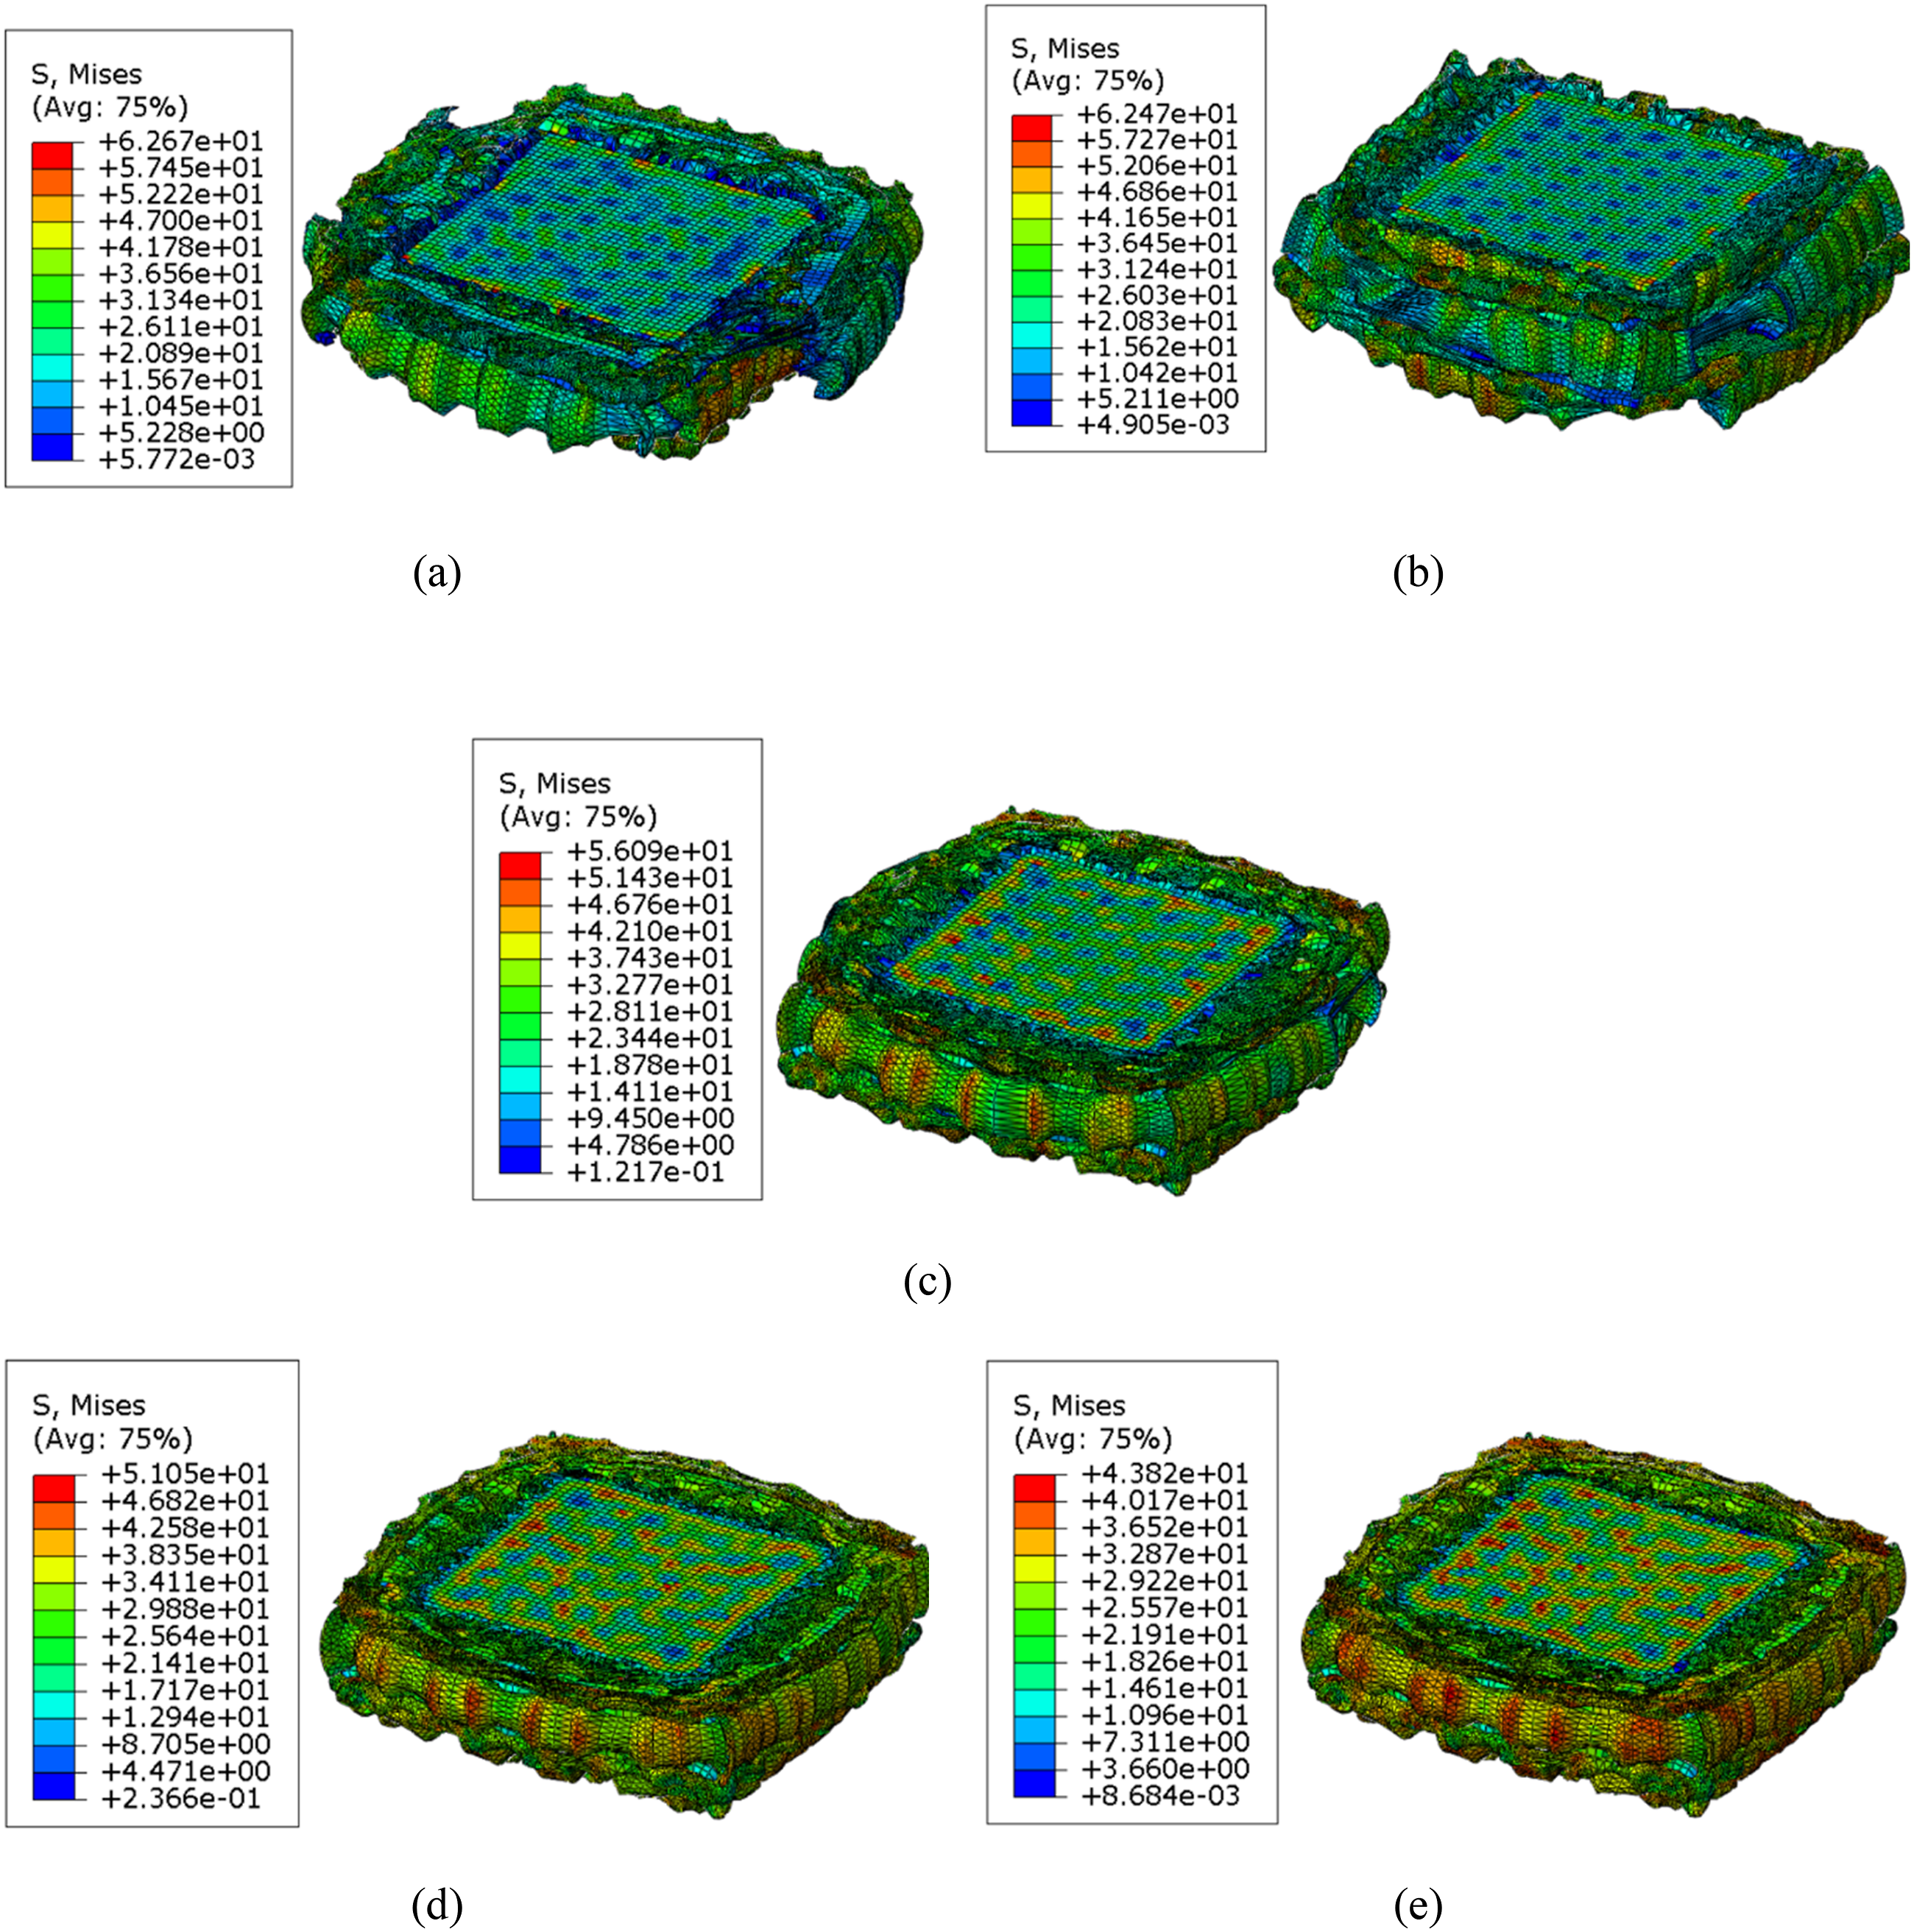
At the strain rates of 0.2 s−1 and 0.1 s−1, the local detachment and separation occur in the extruded part of structures following the structural deformation. In the other conditions, the structure formed a bulge but did not show any local detachment or separation phenomena. This may be attributed to the inability of the local strain to synchronize with the stress changes in the structure during the higher-speed deformation process. This indicates that the material is strain-rate sensitive, whereby the deformation behavior of the material under high-speed loading is significantly affected by the strain rate, which may result in the onset of localised failure or detachment phenomena.
The deformation of the P-H six-layer structure under five different strain rates is illustrated in Figure 17. The three P structural layers in the P-H six-layer structure assume the primary role of bearing the load and undergo significant deformation. The P structural layer exhibits a notable stress concentration phenomenon. (a∼h) Stress nephograms corresponding to eight different compressive displacements at a strain rate of 0.01 s−1. (a) 8 mm. (b) 12 mm. (c) 16 mm. (d) 22 mm. (e) 27 mm. (f) 32 mm. (g) 38 mm. (h) 43 mm.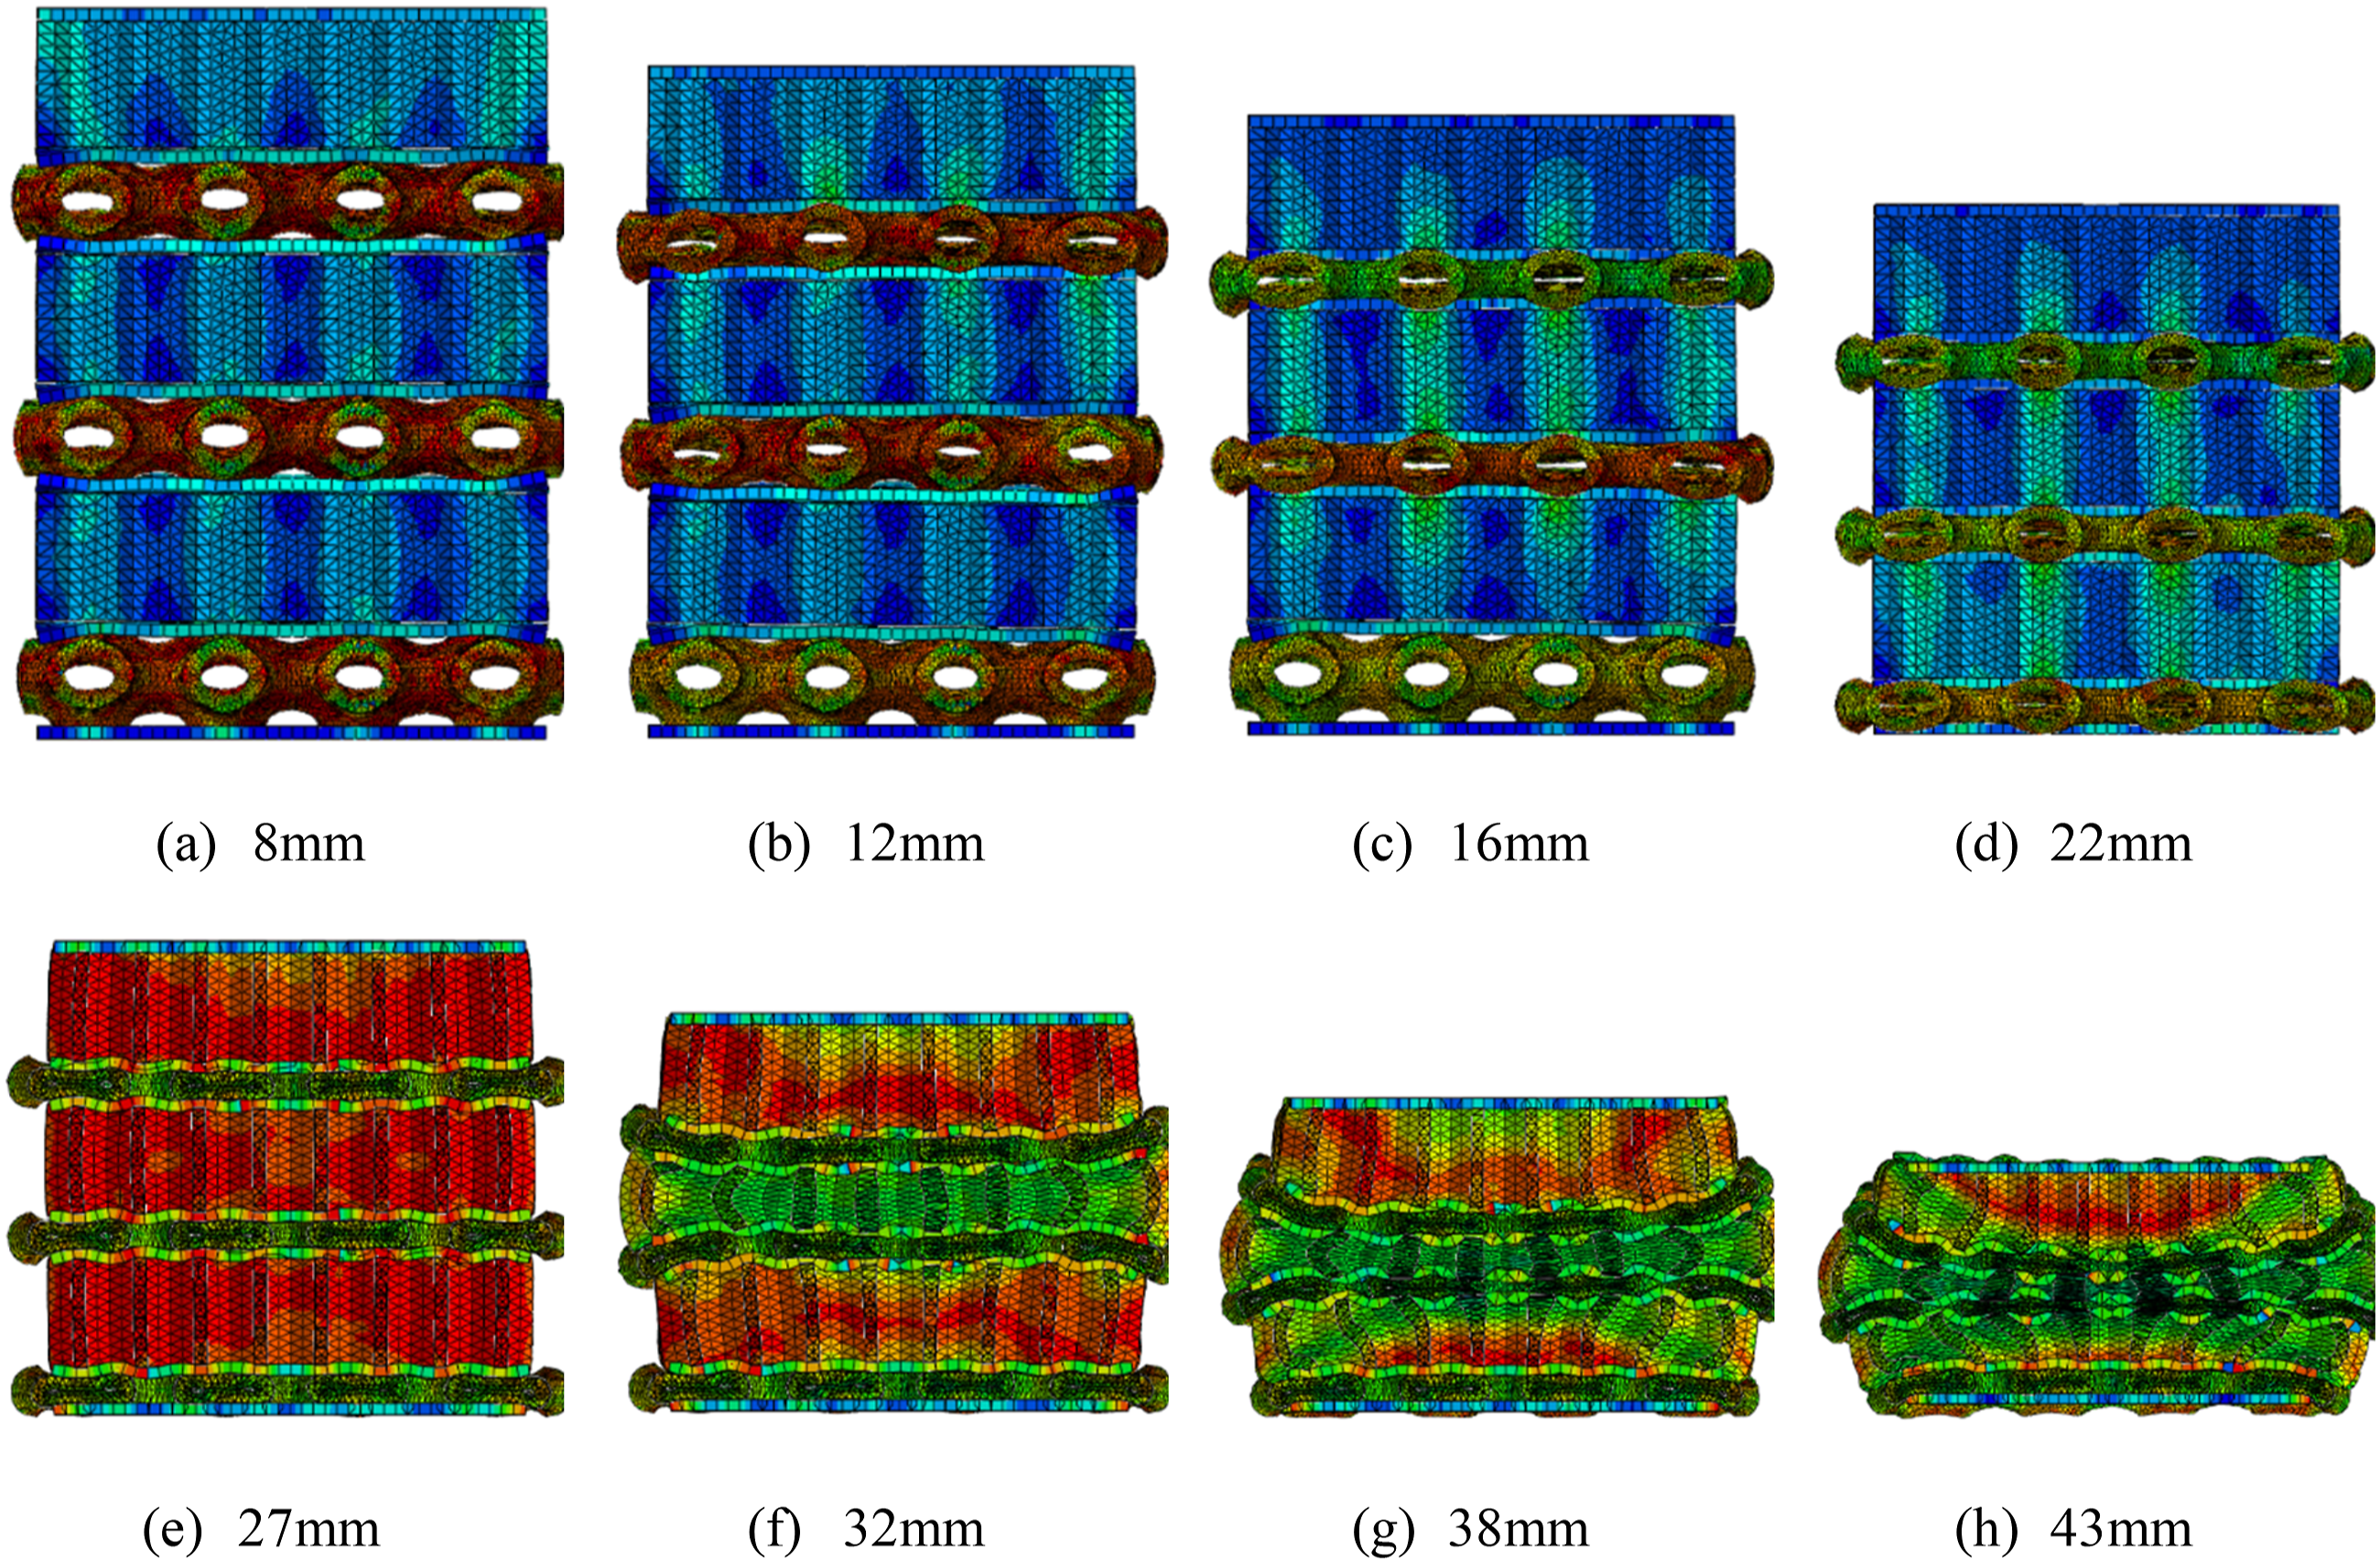
Upon reaching a displacement of 12 mm, the second layer of the structure (P structural layer, from top to bottom) undergoes deformation and damage, while the fourth (P structural layer) and the sixth layers (P structural layer) exhibit slight deformation. As the displacement continues, the fourth layer (P structural layer) undergoes deformation and damage, while the sixth layer (P structural layer) begins to deform plastically and exhibits a stress dissipation phenomenon. Upon reaching a compression distance of 22 mm, the three P-structural layers undergo complete crushing and compaction. By correlating these observations with Figure 15, it is evident that the initial plateau stage of the structural load-displacement curve corresponds to the sequential failure of these three P-structural layers.
As a consequence of the compression displacement, which has increased 22 mm to 27 mm, the H-structure layer is now the main load-bearing layer. As the load continues, the third layer (H-structure layer) deforms first, and the middle part of the layer structure extrudes outward, forming a “bulge” shape. Upon reaching a displacement of 38 mm, a stress reduction region emerges in the center of the fifth layer (H structural layer), showing a circular shape, and the structure layer undergoes deformation. At a compression displacement of 43 mm, the first layer (H-structured layer) also exhibits a stress-reduced region, with an inverse shape to that observed in the annular region in the fifth layer (H-structured layer).
The deformation manifested by the P-H six-layer structure can be observed to occur in a layer-by-layer manner. The characteristics of this deformation can be described as follows: P structural layer (second layer, from top to bottom) → P structural (fourth layer) → P structural (sixth layer) → honeycomb structural (third layer) → honeycomb structural (fifth layer) → honeycomb structural (first layer).
The stress cloud diagrams of the three honeycomb structural layers are chosen to describe deformation characteristics, as presented in Figure 18. It is noteworthy that the stress distribution of the honeycomb structural layer situated in the center (the third layer) is uniform and forms a drum-type structure, extruding outward due to the constraints. However, the stress in the first and fifth layers is uneven. During the deformation of the honeycomb structure, a domed region emerges in both the first and fifth layers. As illustrated in Figure 17, the “crown” layer exhibits an inverted bell-shaped failure mode for the first layer structure, characterized by downward extrusion. In contrast, the fifth layer structure displays an upward extrusion and manifests a bell-shaped failure mode. This phenomenon bears resemblance to the stress state of the honeycomb structure in the two layers of the P-H four-layer structure during deformation, as observed in reference.
29
The formation of such domed regions can be attributed to the occurrence of localized plastic deformation and damage during the deformation of the structure. This consequently results in a redistribution of stresses within the structure. Stress nephogram of three honeycomb structural layers under the displacement of 38 mm at a strain rate of 0.01 s−1 (a) the first layer; (b) the third layer; (c) the fifth layer.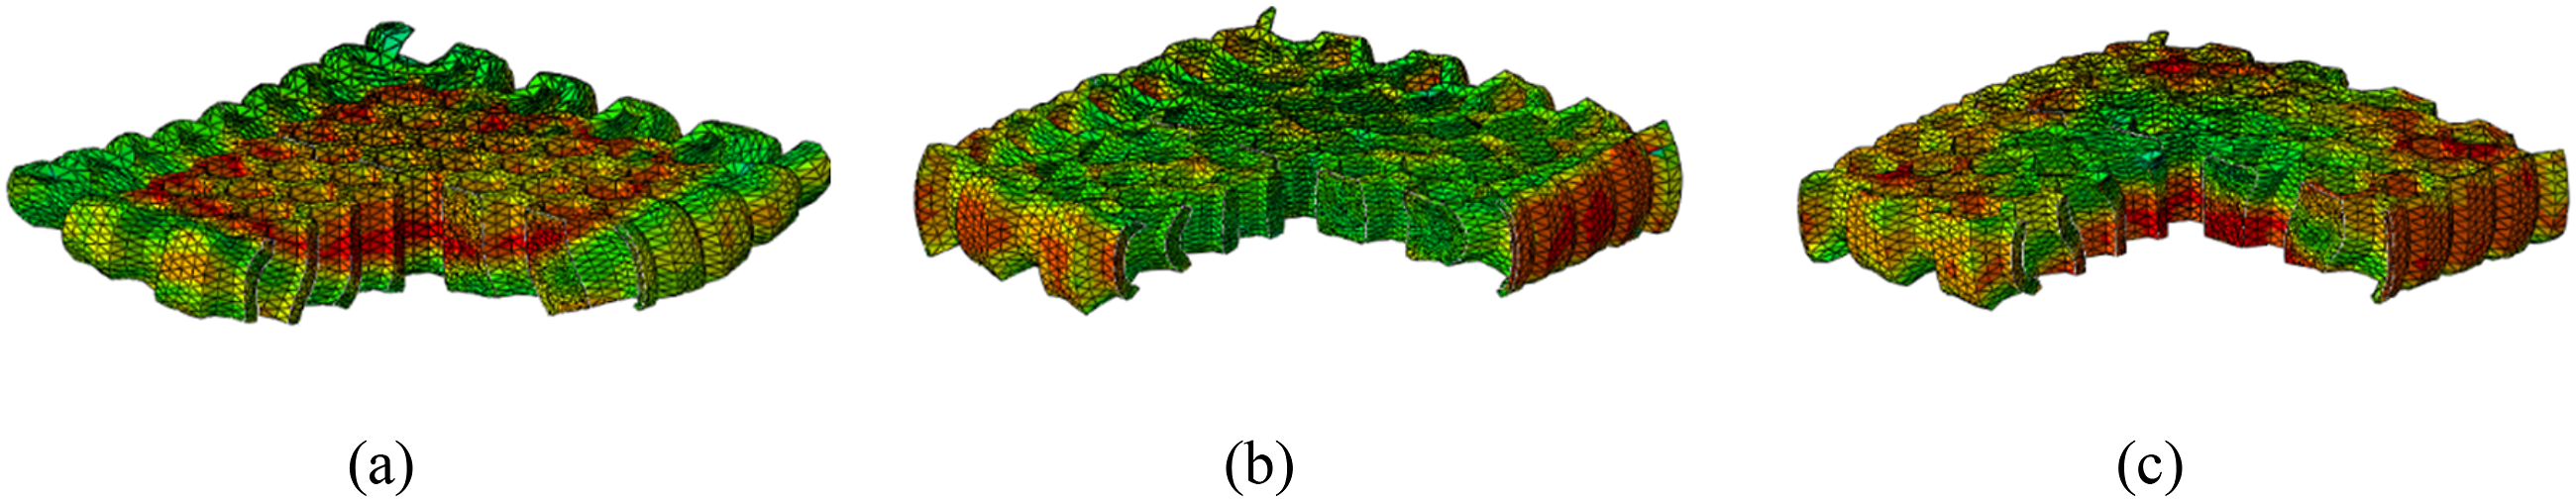
Mechanical Properties of Multi-Structures
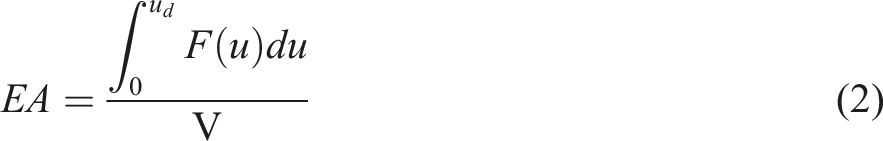
The energy absorption (EA) is an important index for evaluating the energy absorption performance of a structure, which is determined by the area under the load-displacement curve.
The load displacement curves under different strain rate conditions did not exhibit significant rate-dependent characteristics. Therefore, the energy absorption performance of the same structure is basically the same under different strain rate conditions. It is evident that this is markedly distinct from the rate-dependent characterize inherent to the materials. This indicates that the structural mechanical properties are not only influenced by the structural material, but are also closely associated with the structural configuration of the structure itself. The deformation process of a structure entails a complex interplay of forces at the local level. A given structure may experience tensile forces in one region, pressure in another, bending, shear, and extrusion deformation in a third, and so on. These diverse forms of loading are interconnected, influencing the overall deformation characteristics of the structure. Consequently, the deformation characteristics of the structure, including any significant rate dependence, are a function of the mechanical properties of the material, the structural configuration, and the load-bearing characteristics of all the local cytosolic elements in the overall structure.
The energy absorption calculation results for different structures are shown in the Figure 19. Obviously, for the P-G 4-layer, P-G 6-layer and P-H 6-layer structure, the P H 6-layer structure has the best energy absorption performance under quasistatic compression conditions. Energy absorption for the different structures.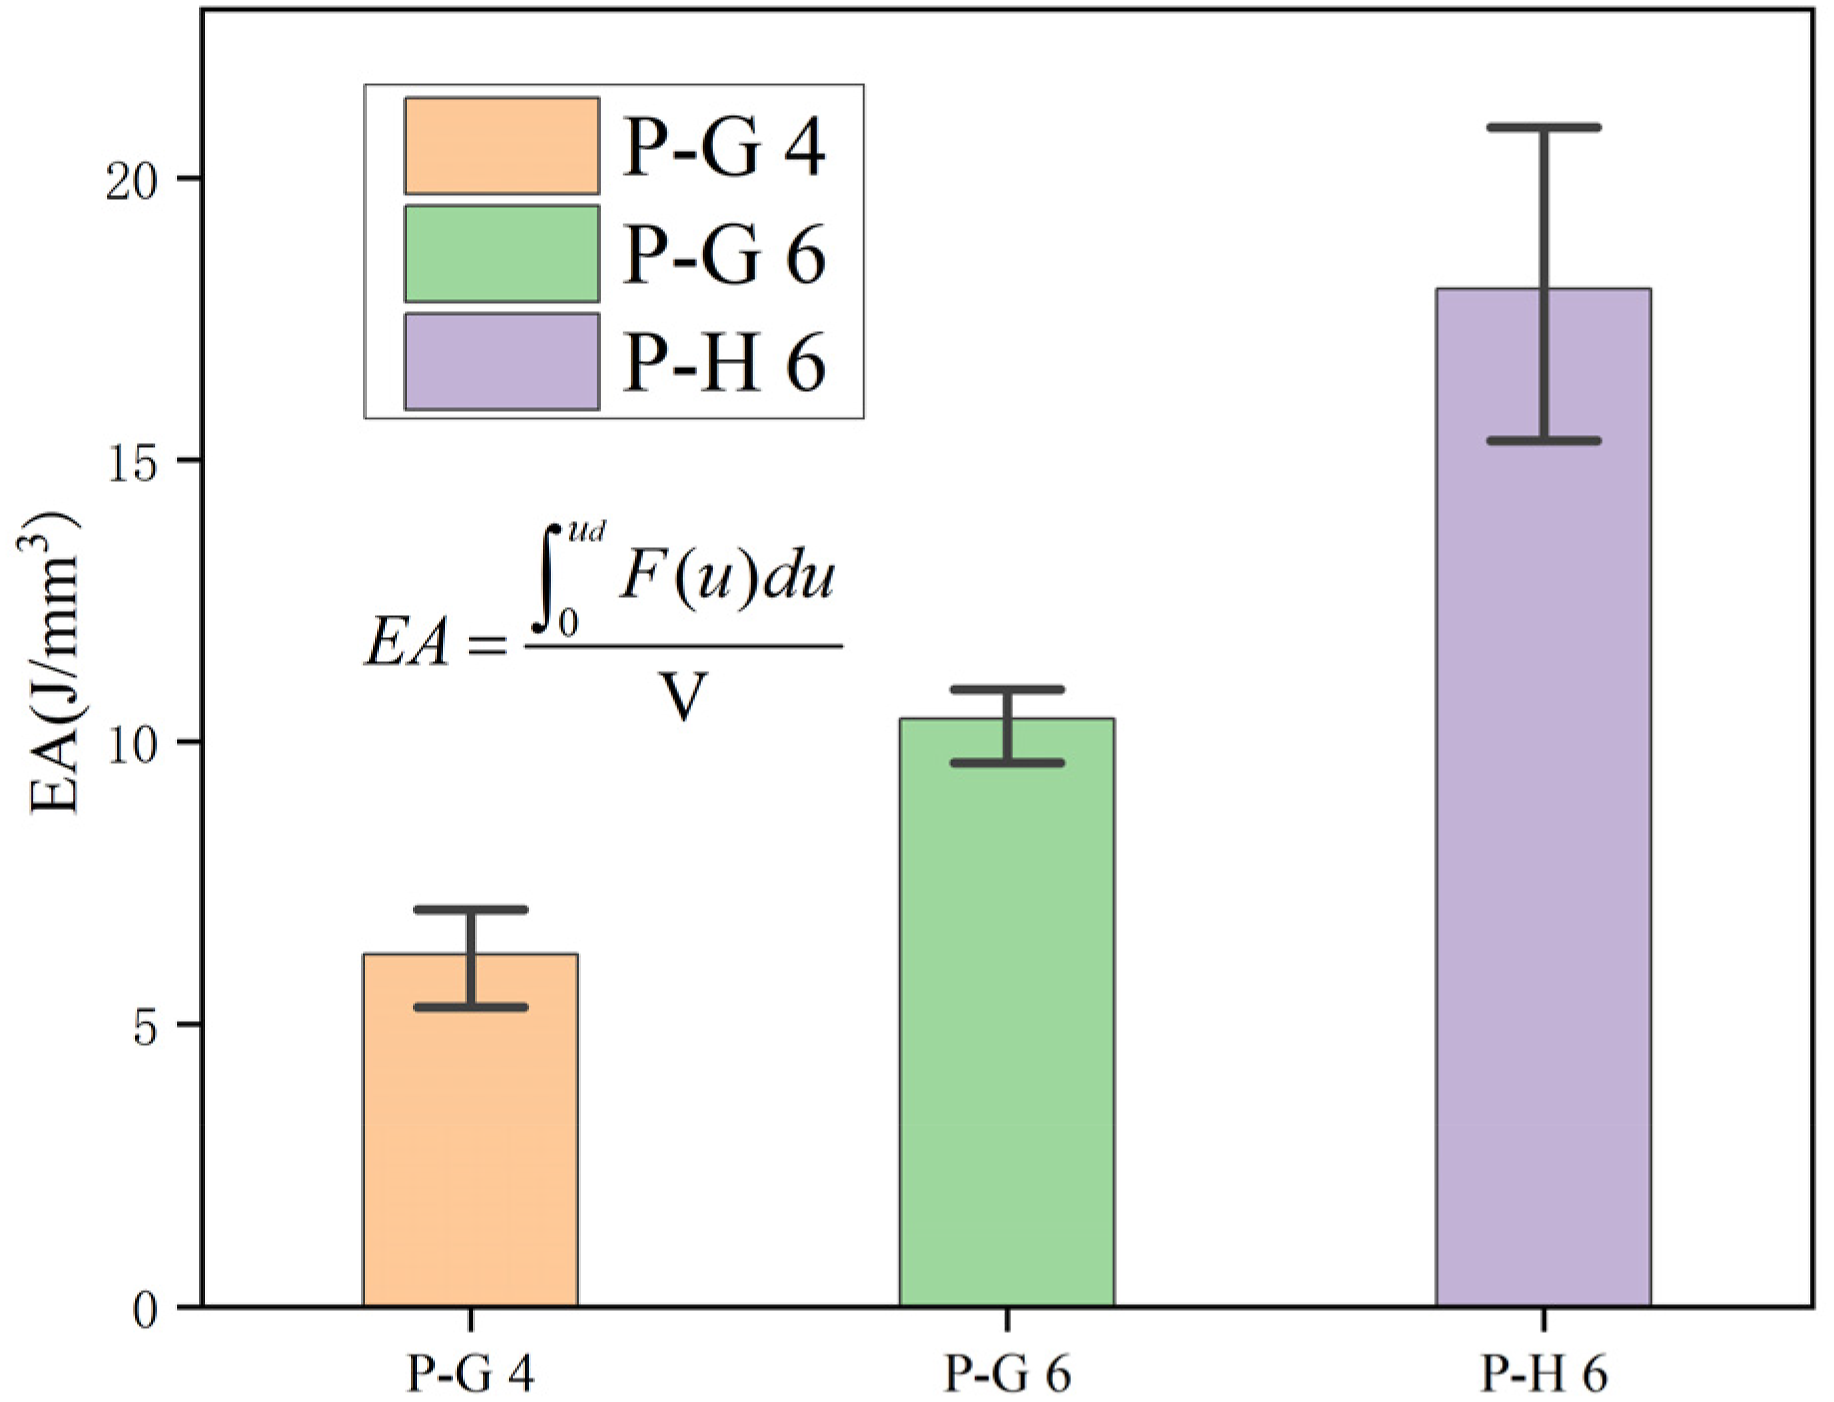
The experiments and simulations demonstrate that the primary mechanism of energy absorption in the structure under quasi-static loading conditions is the plastic deformation of the material and the structure. The bearing angle of the walls of the affected cell elements in the structure generates different force characteristics, which result in the deformation characteristics and energy absorption characteristics of the cell elements differing. The energy-absorbing mechanisms for different strain rates and similar cell element structures are essentially analogous. Furthermore, the separation or detachment of some of the components of the structure due to higher strain rates did not result in an increase or decrease in energy-absorbing properties. Consequently, it can be posited that the inelastic deformation of the crushed PLA is not the primary source of energy absorption.
Conclusion
In this paper, the mechanical behavior and compression deformation mode of three types of composite multilayer structures, P-G four-layer structure, P-G six-layer structure and P-H six-layer structure were studied through experiments and finite element analysis. The load-displacement curves under varying stain rates display a double-platform characteristic for all three types of structures, although this is not evident for the P-G four-layer structure. The load of the second platform stage of the P-H six-layer structure falls within the range of 40 kN and 20 kN for the P-G six-layer structure. For the P-G four-layer, P-G six-layer and P-H six-layer structure, the P-H six-layer structure has the best energy absorption performance under quasistatic compression conditions. However, the energy absorption performance of the same structure is basically the same under different strain rate conditions.
The P-G four-layer structure exhibits no discernible extrusion of the structural layers during compression, and the entirety of the structure shows an almost regular cubic structure after compression. The damage pattern observed in the P-G six-layer structure is analogous to that observed in the P-G four-layer structure. Nevertheless, the local detachment and separation are observed in the extruded part of P-H six-layer structure after the structural deformation at the strain rates of 0.2 s−1 and 0.1 s−1. In the other conditions, the structure exhibited a bulge but did not display any local detachment or separation phenomena. During the deformation of the P-H six-layer structure, a dome-shaped region emerges in the first and fifth layers. The “crown” layer displays an inverted bell-shaped failure mode for the first layer structure, characterized by downward extrusion. In contrast, the fifth layer structure displays an upward extrusion and exhibits a bell-shaped failure mode.
Footnotes
Declaration of conflicting interests
The author(s) declared no potential conflicts of interest with respect to the research, authorship, and/or publication of this article.
Funding
The author(s) disclosed receipt of the following financial support for the research, authorship, and/or publication of this article: This work is supported by the Science Foundation of Shanxi Province (No. 202203021221159) and National Natural Science Foundation of China (No. 12272249, 11702182).