
Abstract
In this study, a novel lattice structure with Y-shaped cores was designed. Specimens of the structure were fabricated using 3D printing technology for quasi-static compression tests. Numerical simulations were also performed to investigate the mechanical properties and failure behavior of the lattice structure. The numerical results are in good agreement with the experimental results. The numerical simulations are used to reveal the failure processes and failure mechanisms of structures with different relative densities. The results show that the relative density has significant effects on the mechanical properties of the lattice structure, and that different methods of changing the relative density lead to different results.
Introduction
The sandwich structure is an ordered porous structure that contains two panels and cores. Sandwich structures can be classified as honeycomb sandwich structures,1–3 corrugated sandwich structures,4–6 or lattice sandwich structures7–10 according to the type of cores. They have a series of advantages such as light weight, high strength, and good energy absorption. With the development of technology, many fabrication methods such as hot-press molding, interlocking, and additive manufacturing have been employed to manufacture sandwich structures using a variety of materials. Extensive research has been performed on reducing the weight and improving the properties of sandwich structures for automobile,11–13 aerospace,14–16 and marine17–19 applications.
The mechanical properties of many types of sandwich structures have been extensively investigated in recent years. Wang et al. 20 manufactured a X-type lattice truss structure using the interlocking method and studied its compressive and shear properties theoretically and experimentally. The experimental results indicate that the failure mode of the structure is debonding between the face sheets and core during the shear loading process. Improving the structure by incorporating a X-type lattice resulted in better compression resistance and shear strength than those achieved by using other pyramidal lattice structures with the same relative density. Himan et al.21,22 fabricated carbon-epoxy and glass fiber reinforced polymer sandwich panel with novel M-shaped core, experimentally and numerically investigated their compressive and bending behavior, their study showed that it has optimum mechanical strength with a considerable lightweight and the M-shaped core can well postpone the buckling and failure of the sandwich structures. Feng et al.23,24 designed an hourglass lattice structure and studied its mechanical properties. They found that the new structure has a large buckling resistance. The compression, bending, and shear properties of the hourglass lattice structure at low relative densities are superior to those of other sandwich structures. Ashok et al. 25 optimized topologies of some 2D and 3D structures, the results showed that the optimal patterns are very close to the nature inspired patterns, which provided the basis of their subsequent studies of nature inspired lattice structures with excellent mechanical properties.26–28 Furthermore, it has broad application prospect in a wide range of industries that use these nature inspired lattice structures with multifunctional auxetic mechanical metamaterials. 29
Many studies on sandwich structures with Y-shaped cores have been reported. Rubino et al.
30
experimentally and numerically investigated the three-point bending response of a Y-shaped sandwich core and corrugated sandwich beam made of stainless steel. He showed that the two structures have similar mechanical performance under different loadings. Zhou et al.
31
investigated the effect of different temperatures on the mechanical properties and failure mode of a carbon fiber composite Y-shaped core corrugated sandwich structure. They found that its compression strength and stiffness gradually decrease as the temperature increases continuously, and that the failure mode and stress–strain curves of the structure also change significantly when the temperature exceeds a certain value. Liu et al.
32
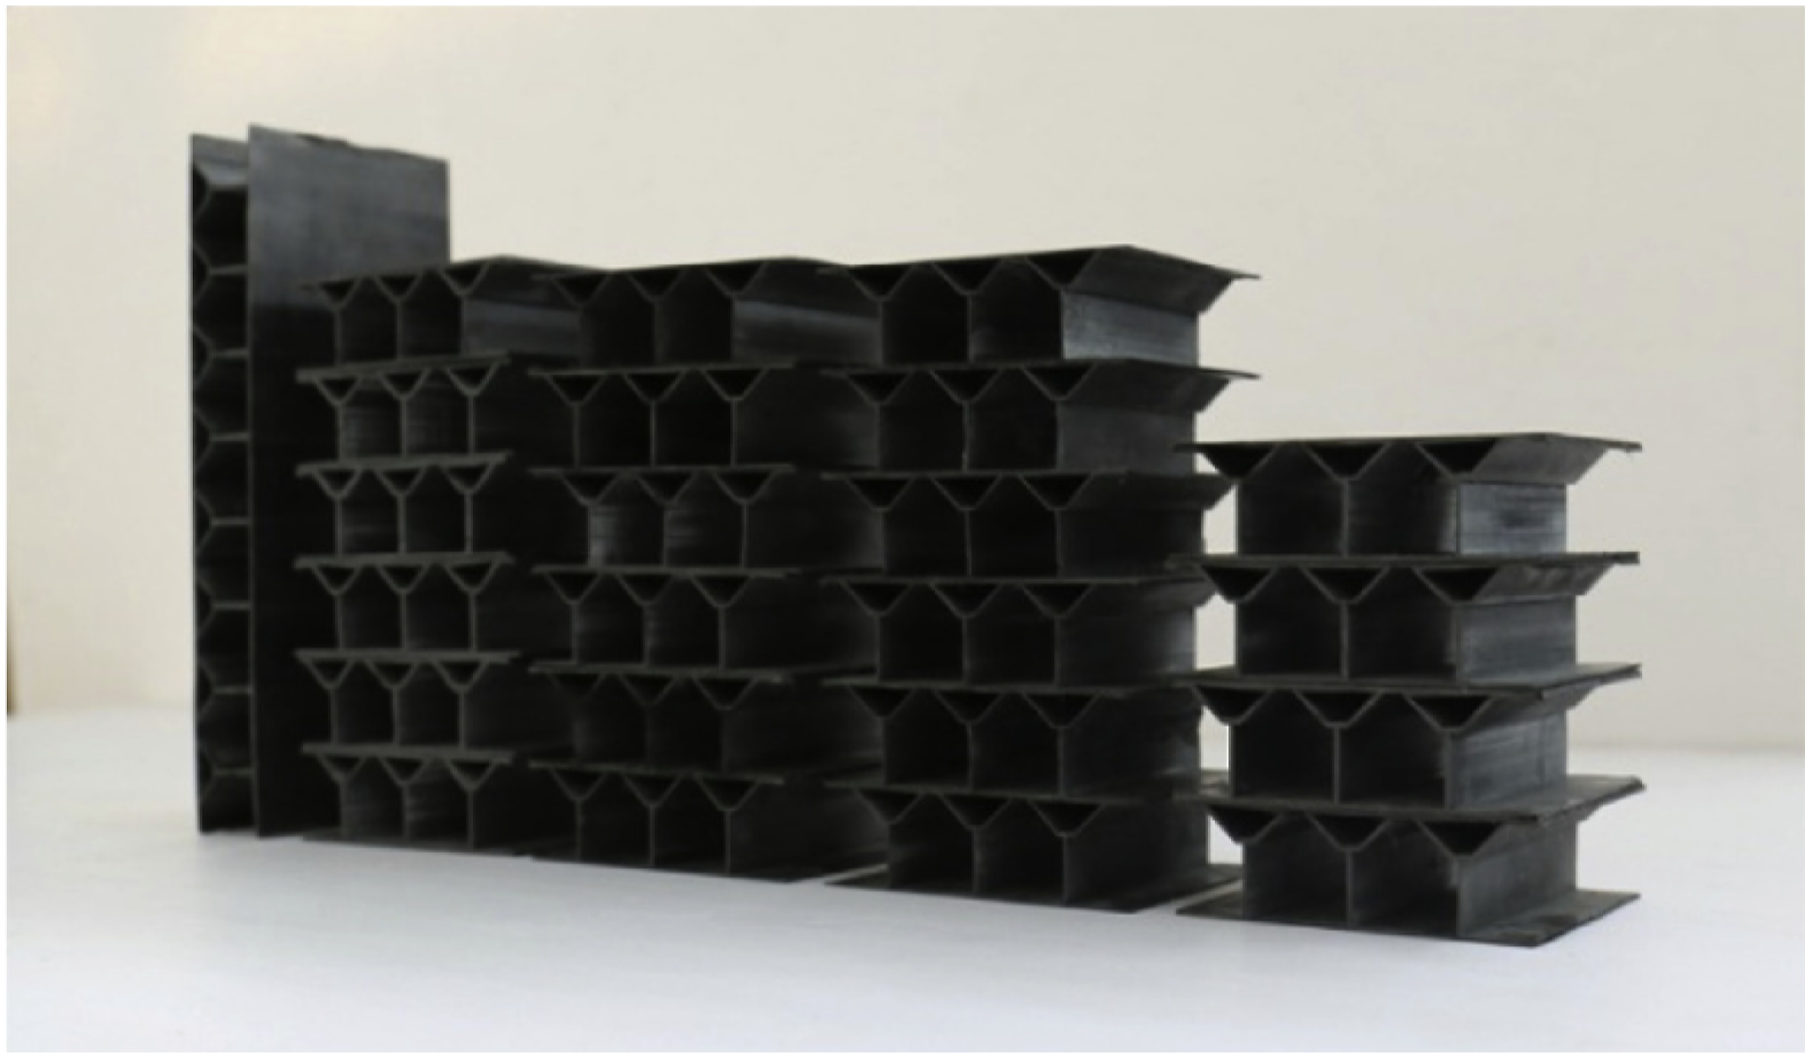
fabricated an all-composite sandwich with Y-shaped cores shown in Figure 1 using a novel hot-press molding method and analyzed its compressive behavior, failure modes, and energy absorption capacity. They found that the main failure mode of the structure is the delamination failure of the cores. In particular, the mountain-like profile of the stress–strain curves with two peaks allows the structure to absorb more energy during compression, which results in excellent carrying and energy absorption capacity. Compared to the corrugated structure, the lattice structure has better mechanical properties and a smaller mass. Although the fabrication and mechanical properties of corrugated sandwich structures with Y-shaped cores have been reported in several studies, there are as yet no reported studies on lattice sandwich structures with Y-shaped cores. Therefore, further research is required to fill this knowledge gap. All-composite corrugated sandwich structure with Y-shaped cores.
32
In this paper, a novel lattice sandwich structure with Y-shaped cores is presented. The structure is produced using 3D printing and made of polyamide 12 (PA12). The mechanical properties and failure behavior of the PA12 structure under out-of-plane compression are determined and analyzed, and a finite element model is developed to predict its mechanical properties. The numerical results are in good agreement with the experimental results. The effects of the relative density on the compression strength, stiffness, and energy absorption capacity are studied through numerical simulations.
Design and manufacture
The design concept is shown in Figure 2. Based on the classic pyramidal lattice structure, a new lattice structure is obtained by replacing the four inclined struts with four Y-shaped struts. This structure is referred to as the Y-type lattice structure in this paper. Configuration design of new lattice structure: (a) pyramidal lattice structrue; (b) replace the four inclined struts with four Y-shaped struts; (c) Y-type lattice structure.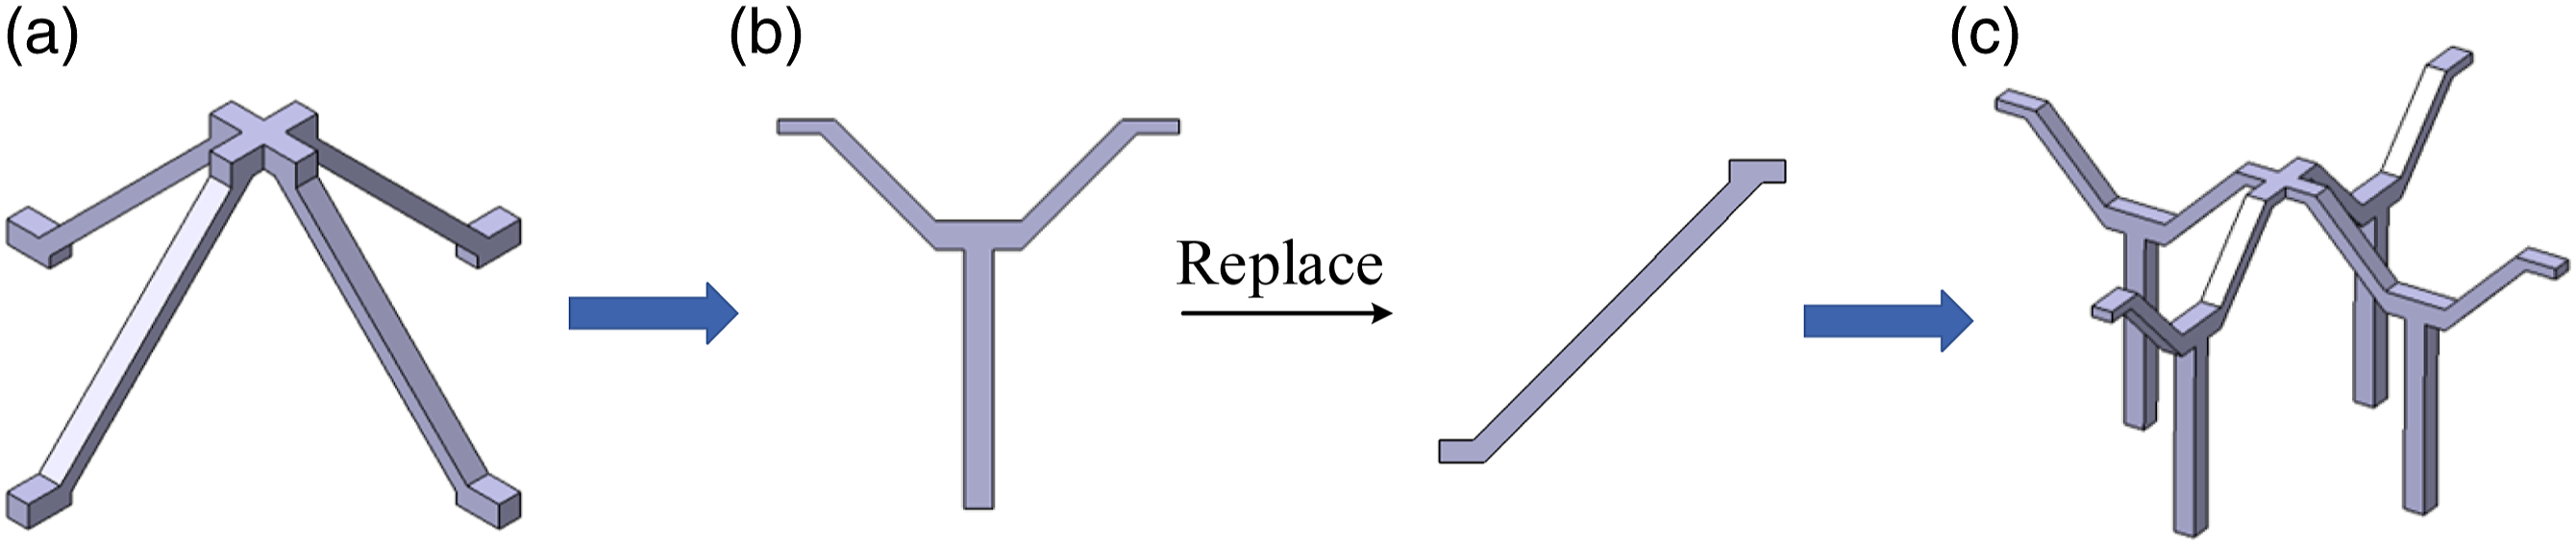
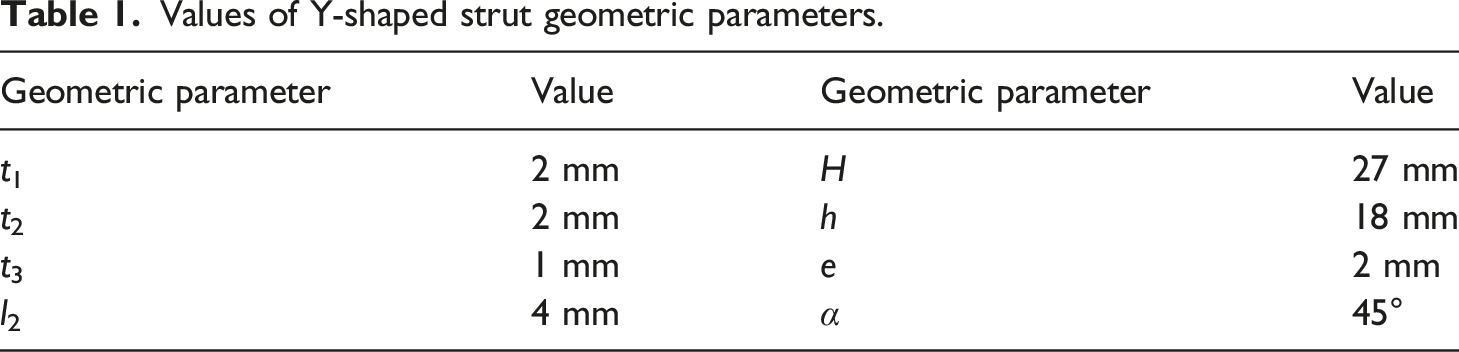
The geometry and geometric parameters of the Y-shaped strut are shown in Figure 3. The geometry of the Y-shaped strut is characterized by the leg width t1, web width t2, shoulder width t3, Y-flange length l1, shoulder length l2, leg height h, overall height H, web length e, and Y-flange inclination angle Geometry and geometric parameters of Y-shaped strut. Values of Y-shaped strut geometric parameters.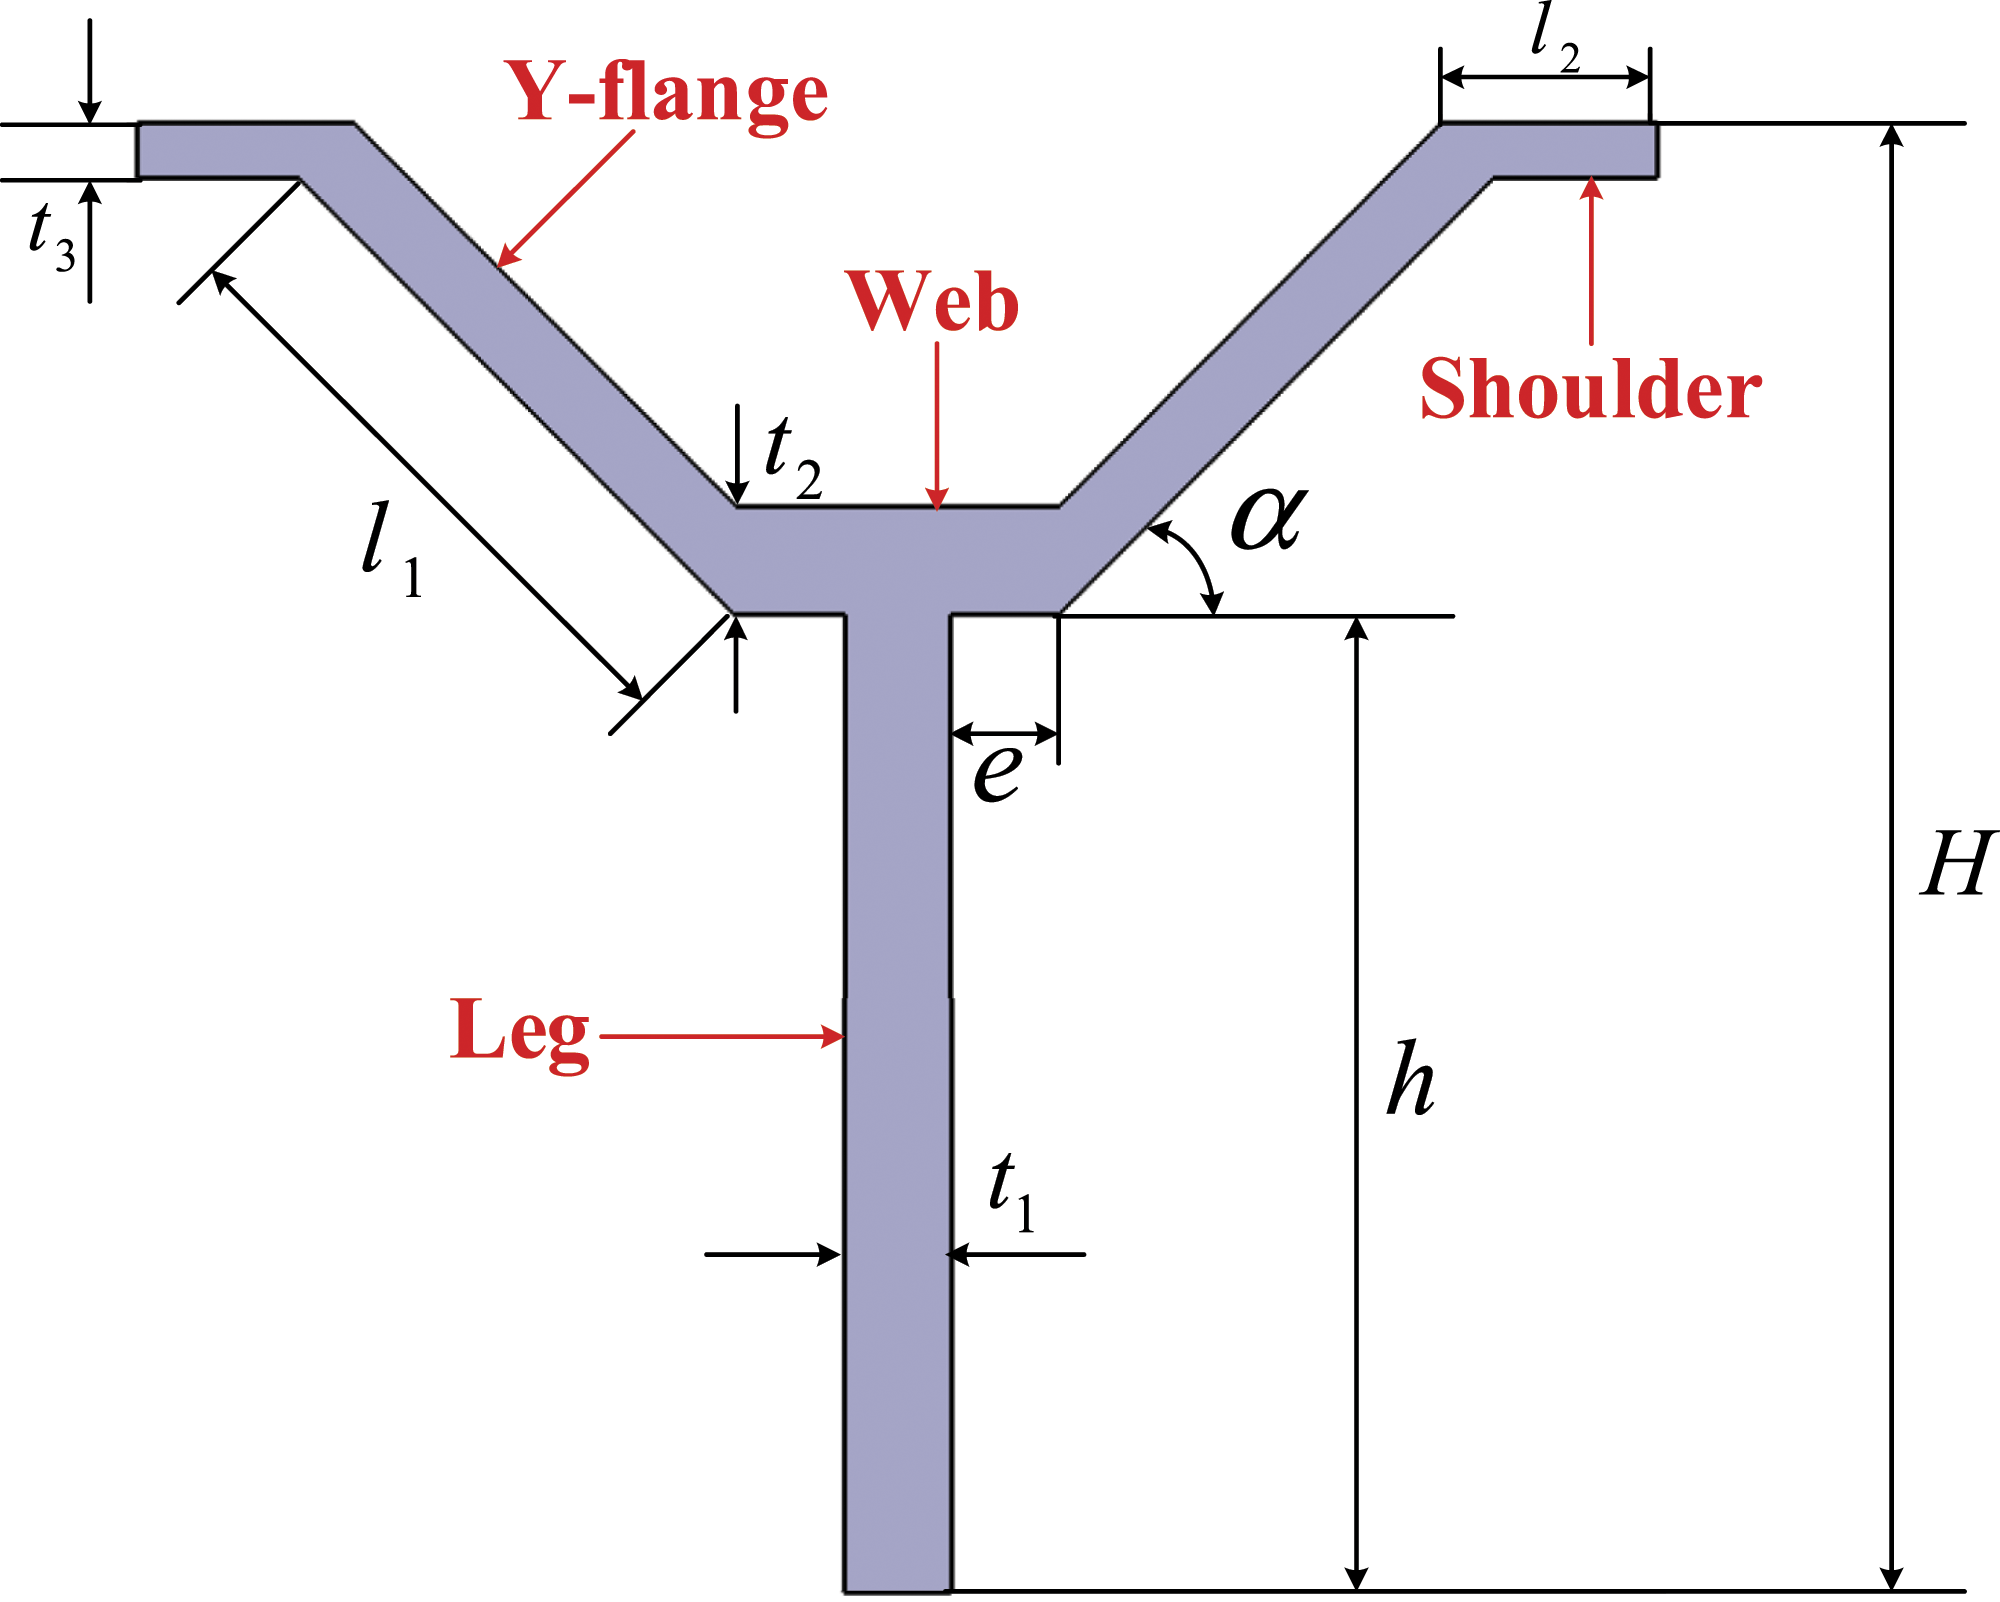
The unit cell of the Y-type lattice structure is shown in Figure 4. The parameters tc1, lc2, and T are the leg width, shoulder length, and strut thickness in a unit cell, respectively. Specifically, tc1 = 0.5t1, lc2 = 2L2, and the remaining parameters have the same values as those of the Y-shaped strut. Unit cell of Y-type lattice structure.
It has been reported in many studies that corrugated structures with Y-shaped cores have excellent mechanical properties. Compared to the corrugated structure, the lattice structure has a smaller core volume, which allows it to have comparable mechanical properties with a smaller mass.
In our preliminary study, finite element simulations were developed for corrugated structures with Y-shaped cores, lattice structure with Y-shaped cores and pyramidal lattice structure with the same core mass and material under out-of-plane compression. The simulated load–displacement curves of the three structures are shown in Figure 5. The more stable deformation of the core in the lattice structure during compression resulted in a larger force in the plateau stage compared to that in the other structures. This resulted in more energy absorbed by the new lattice structure during the entire process and demonstrates that the structure has the advantages of a small weight, high strength, and good energy absorption capacity. Simulation load–displacement curves of three structures.
The relative density is an important parameter that affects the mechanical properties of sandwich structures, which is expressed as the ratio of the material volume to the volume of the space occupied by the unit cell, according to the unit cell of Y-type lattice structure in Figure 4, the relative density is calculated as follows
From these equations, it’s obvious that the thickness T and inclination angle Variation of relative density with (a) T and (b) 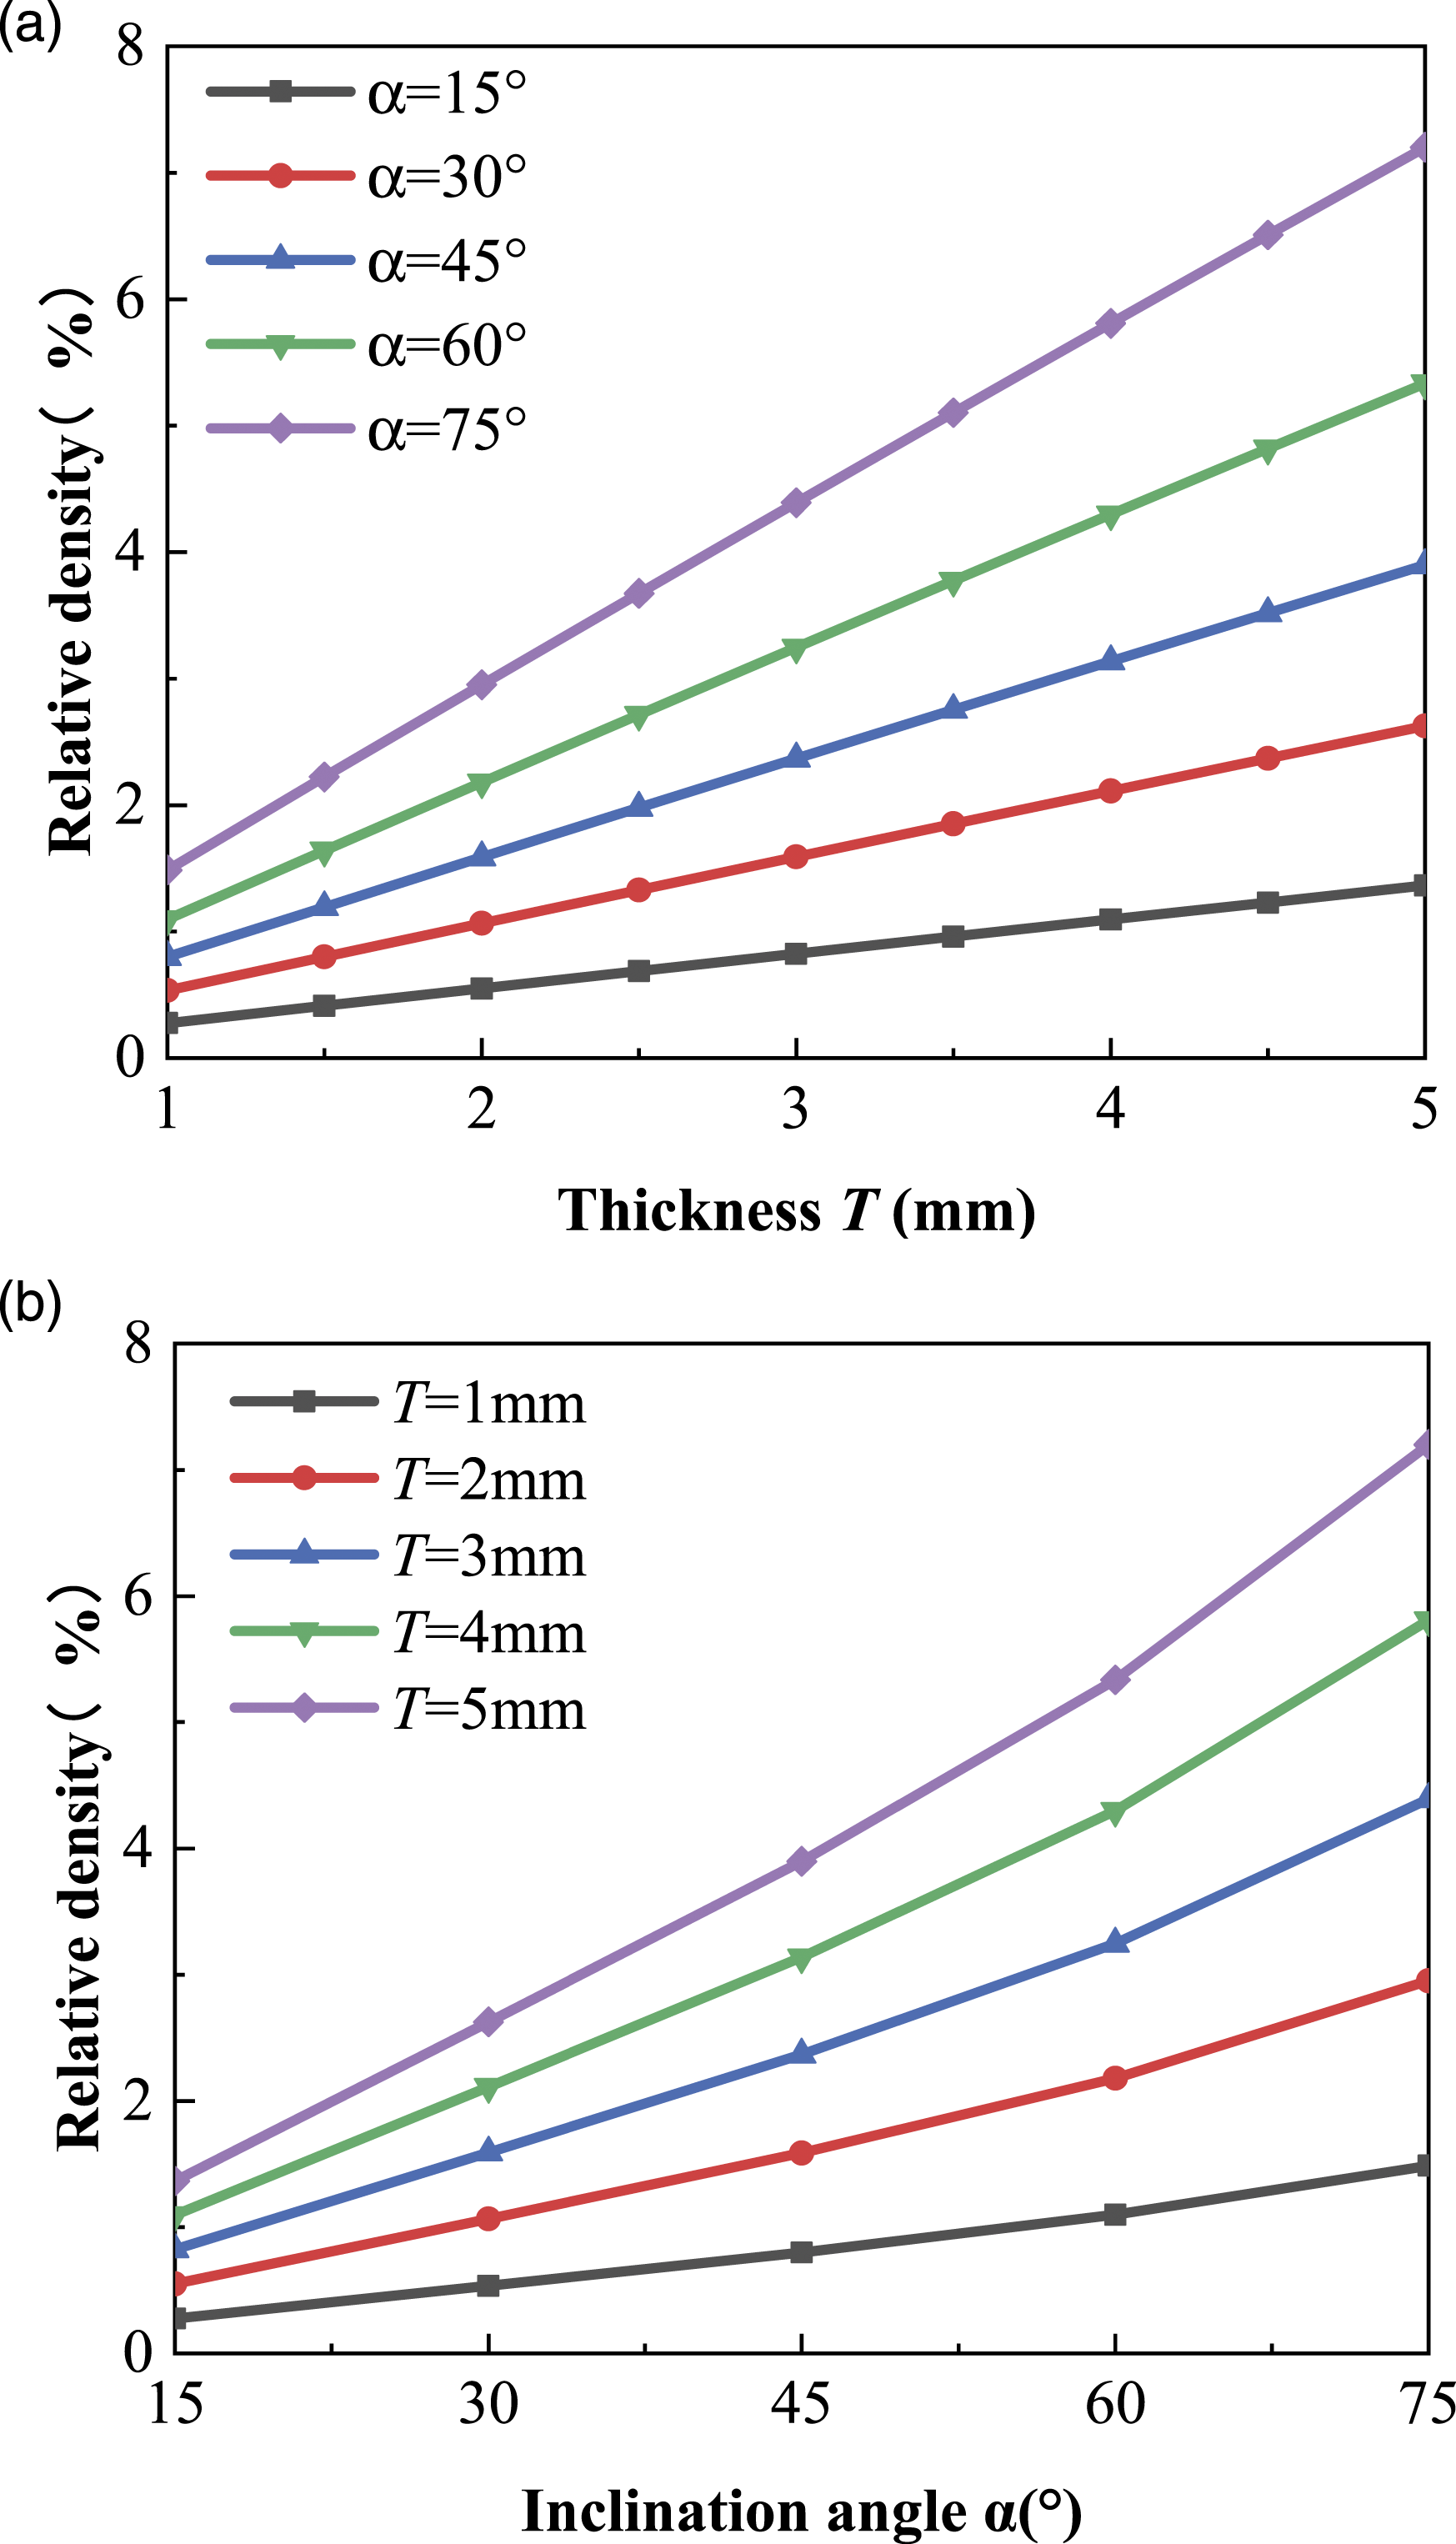
Polyamide 12 (PA12) is a new type of material, which has high strength and low density and is widely used in additive manufacturing. At present the main technologies that can use this material for 3D printing are Selective Laser Sintering (SLS), Fused Deposition Modeling (FDM) and Multi Jet Fusion (MJF), compared with SLS and FDM, PA12 samples printed by MJF have better mechanical properties and surface smoothness, therefore, in this study the MJF 3D printing technique was used to fabricate PA12 Y-type lattice structure specimens for the experiment. The overall lattice structure contains 2 × 2 unit cells, as shown in Figures 7(a) and (b). The geometric parameters have the constant values listed in Table 1. The thickness of the two face sheets is 2 mm, and the size of the specimen is 86 mm × 86 mm × 31 mm. PA12 Y-type lattice structure (a) core geometry and (b) test specimen.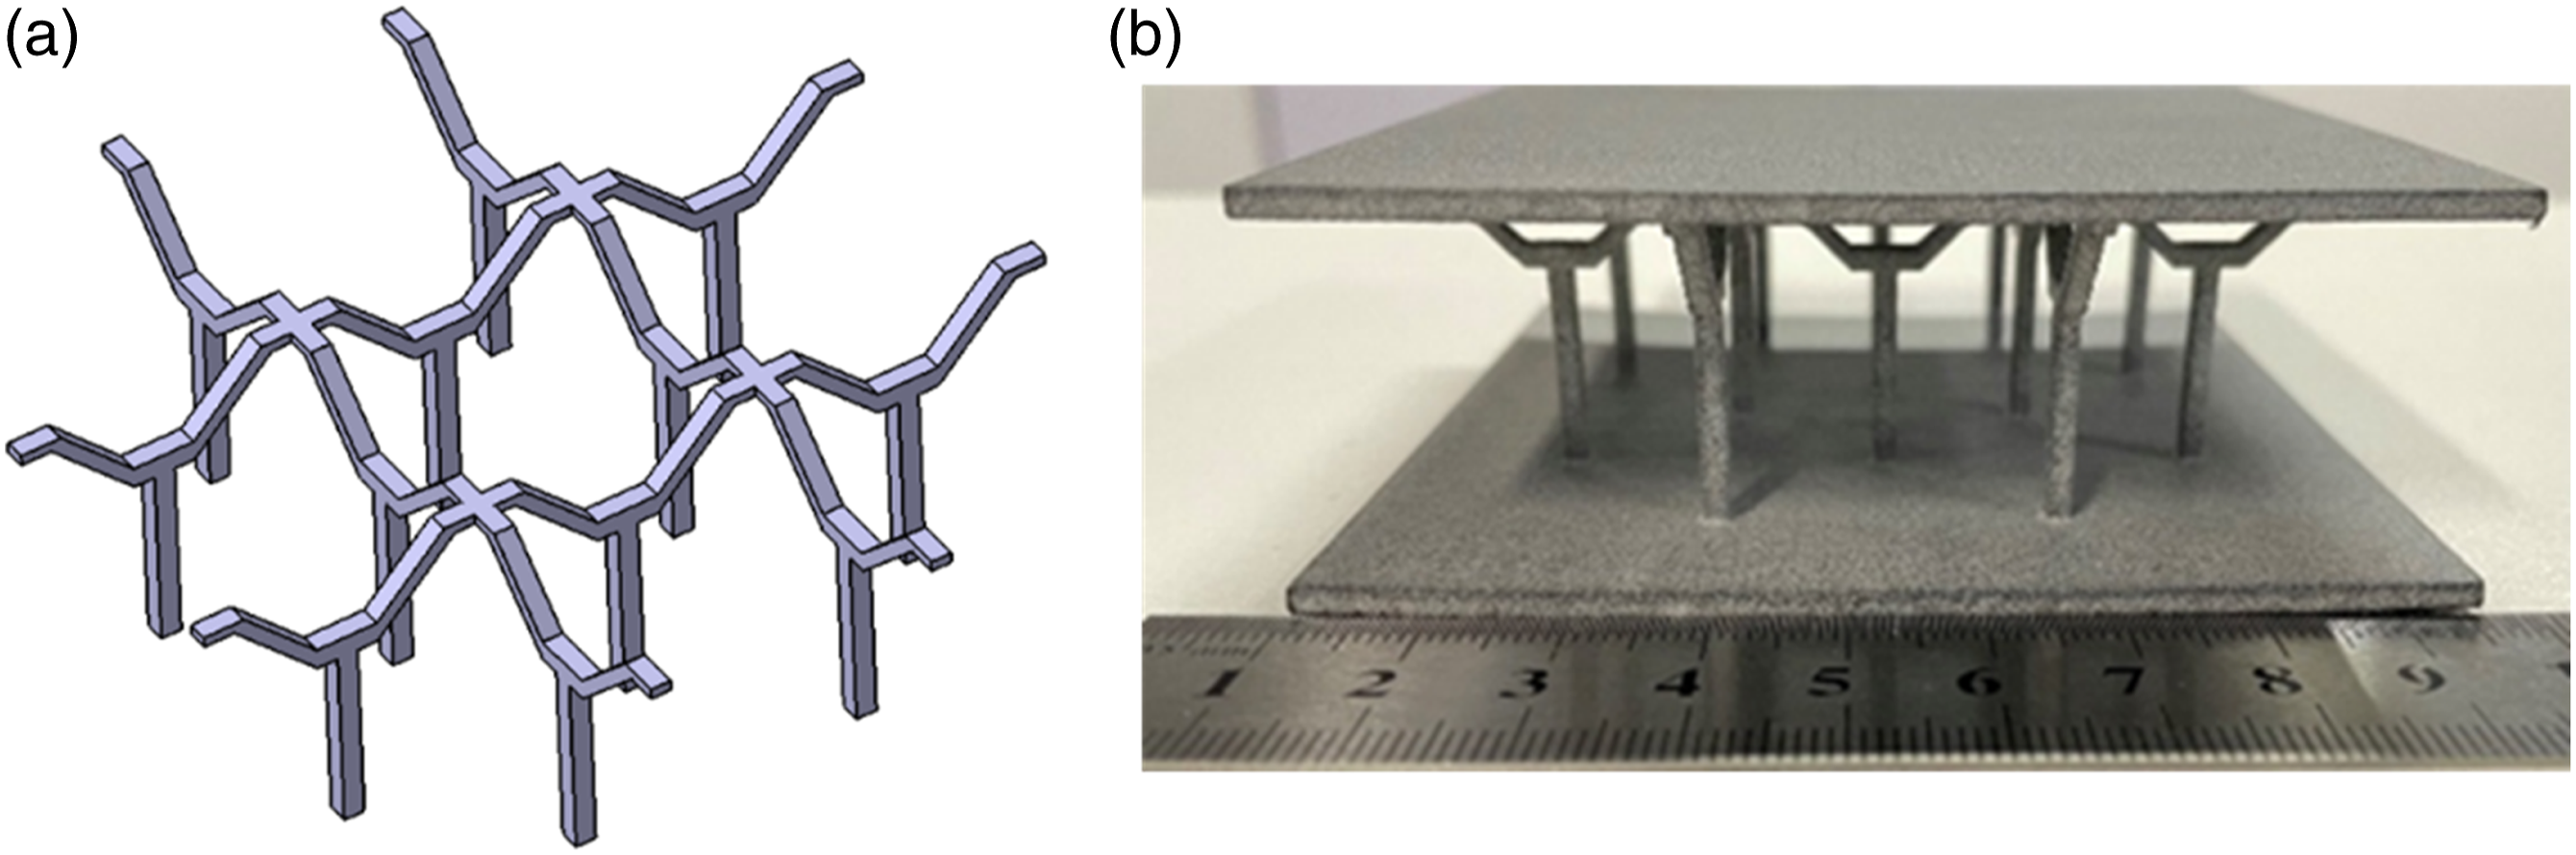
To obtain the material properties of PA12, according to GB/T 1041-2008, five identical standard specimens were prepared by MJF 3D printing technique for compressive tests. From the test data, the respective material parameter values of True stress–real plastic strain relationship of PA12.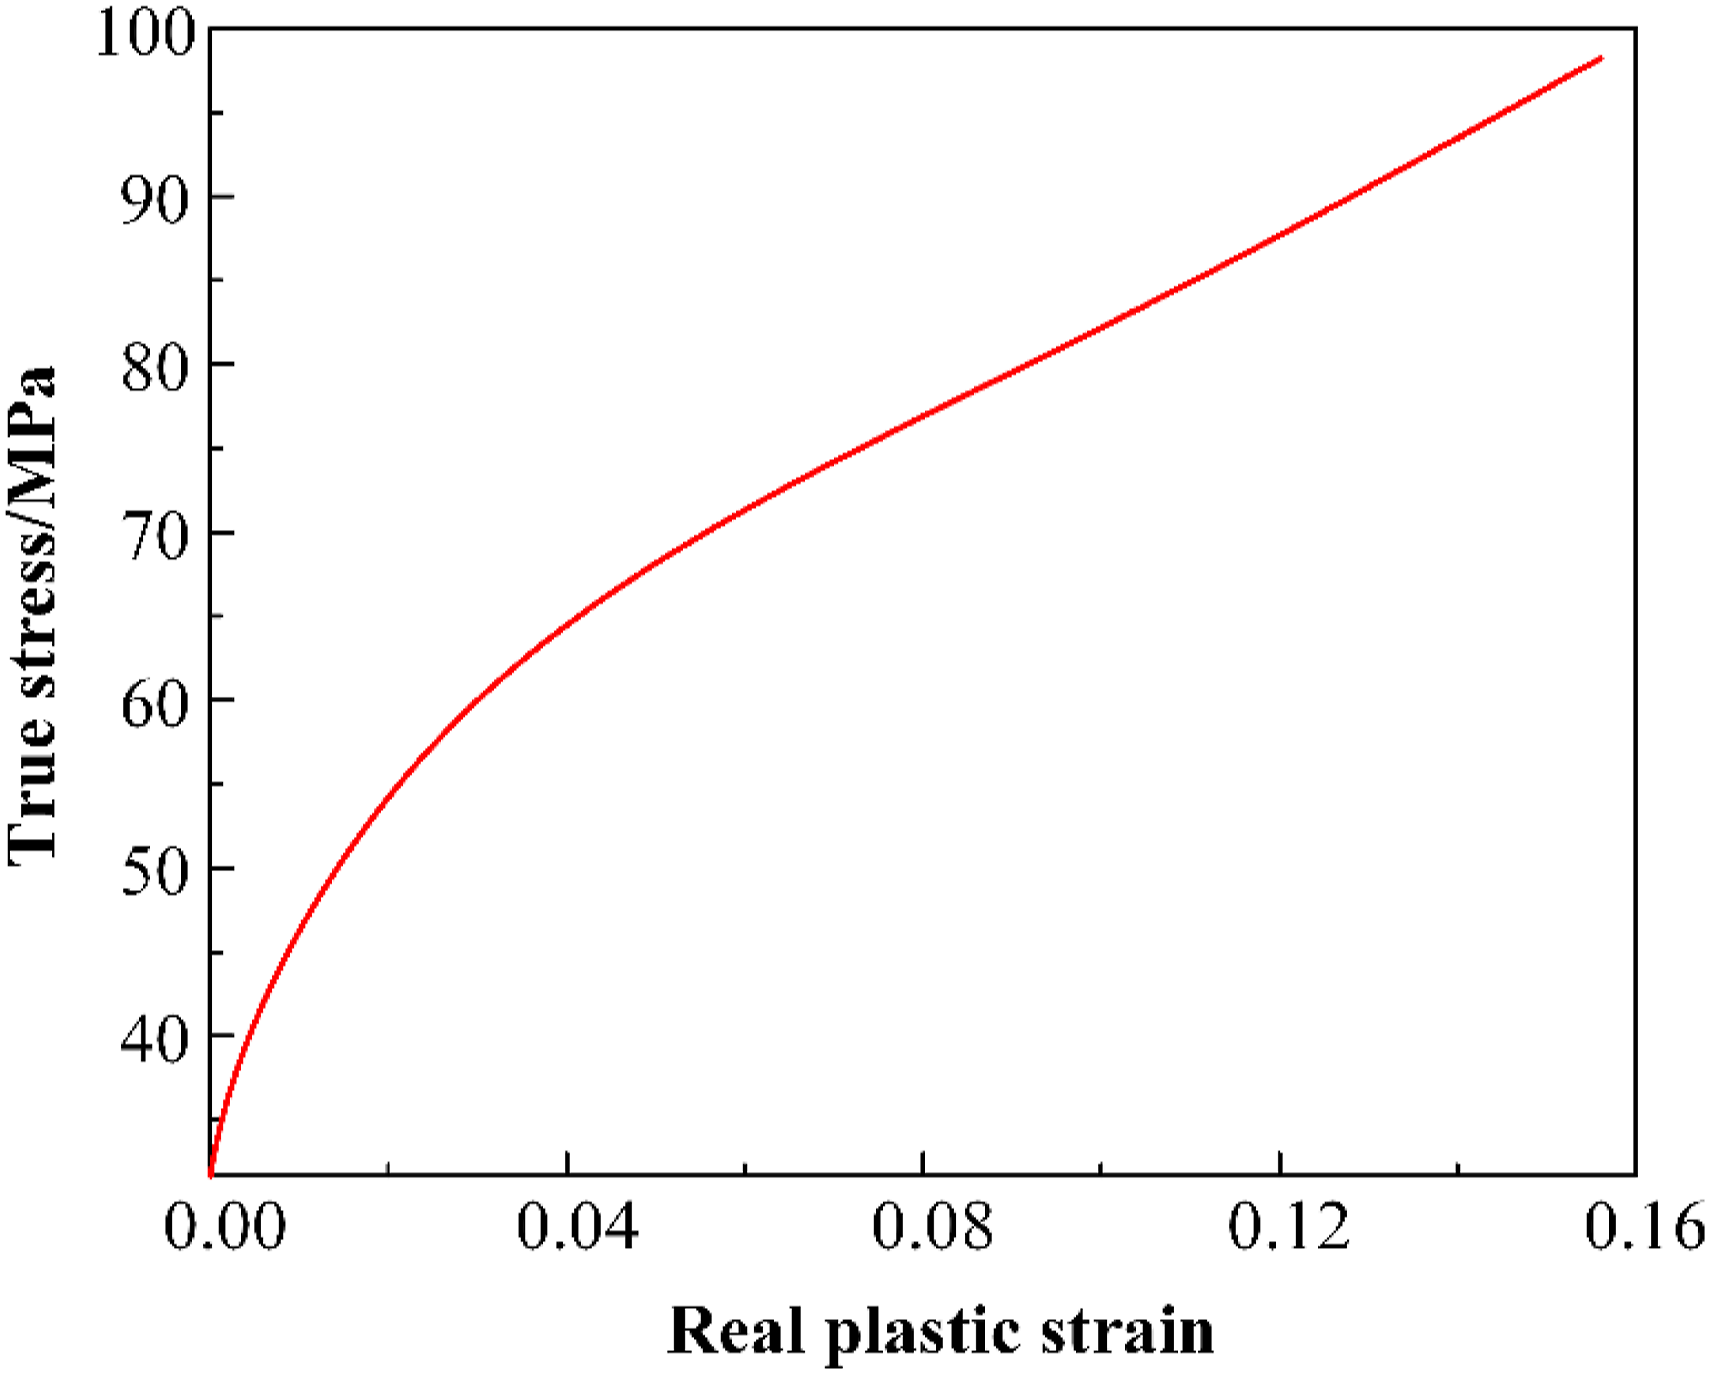
Experimental methods
A quasi-static compression test was carried out on the Y-type lattice structure in accordance to ASTM C365/C365M-05. An Instron5967 universal testing machine was used for the test. Figure 9 shows the test setup. The PA12 Y-type lattice structure specimen under compression was placed between the two cylindrical test fixtures. During the test, the top test fixture applied a compressive load at a constant displacement rate of V = 2 mm/min.
33
while the bottom test fixture was completely fixed. The load–displacement curves during the test were recorded using a computer and the failure mode and damage process recorded using a camera. Five specimens were tested to reduce the experimental errors. Test setup for PA12 Y-type lattice structure subjected to out-of-plane compressive load.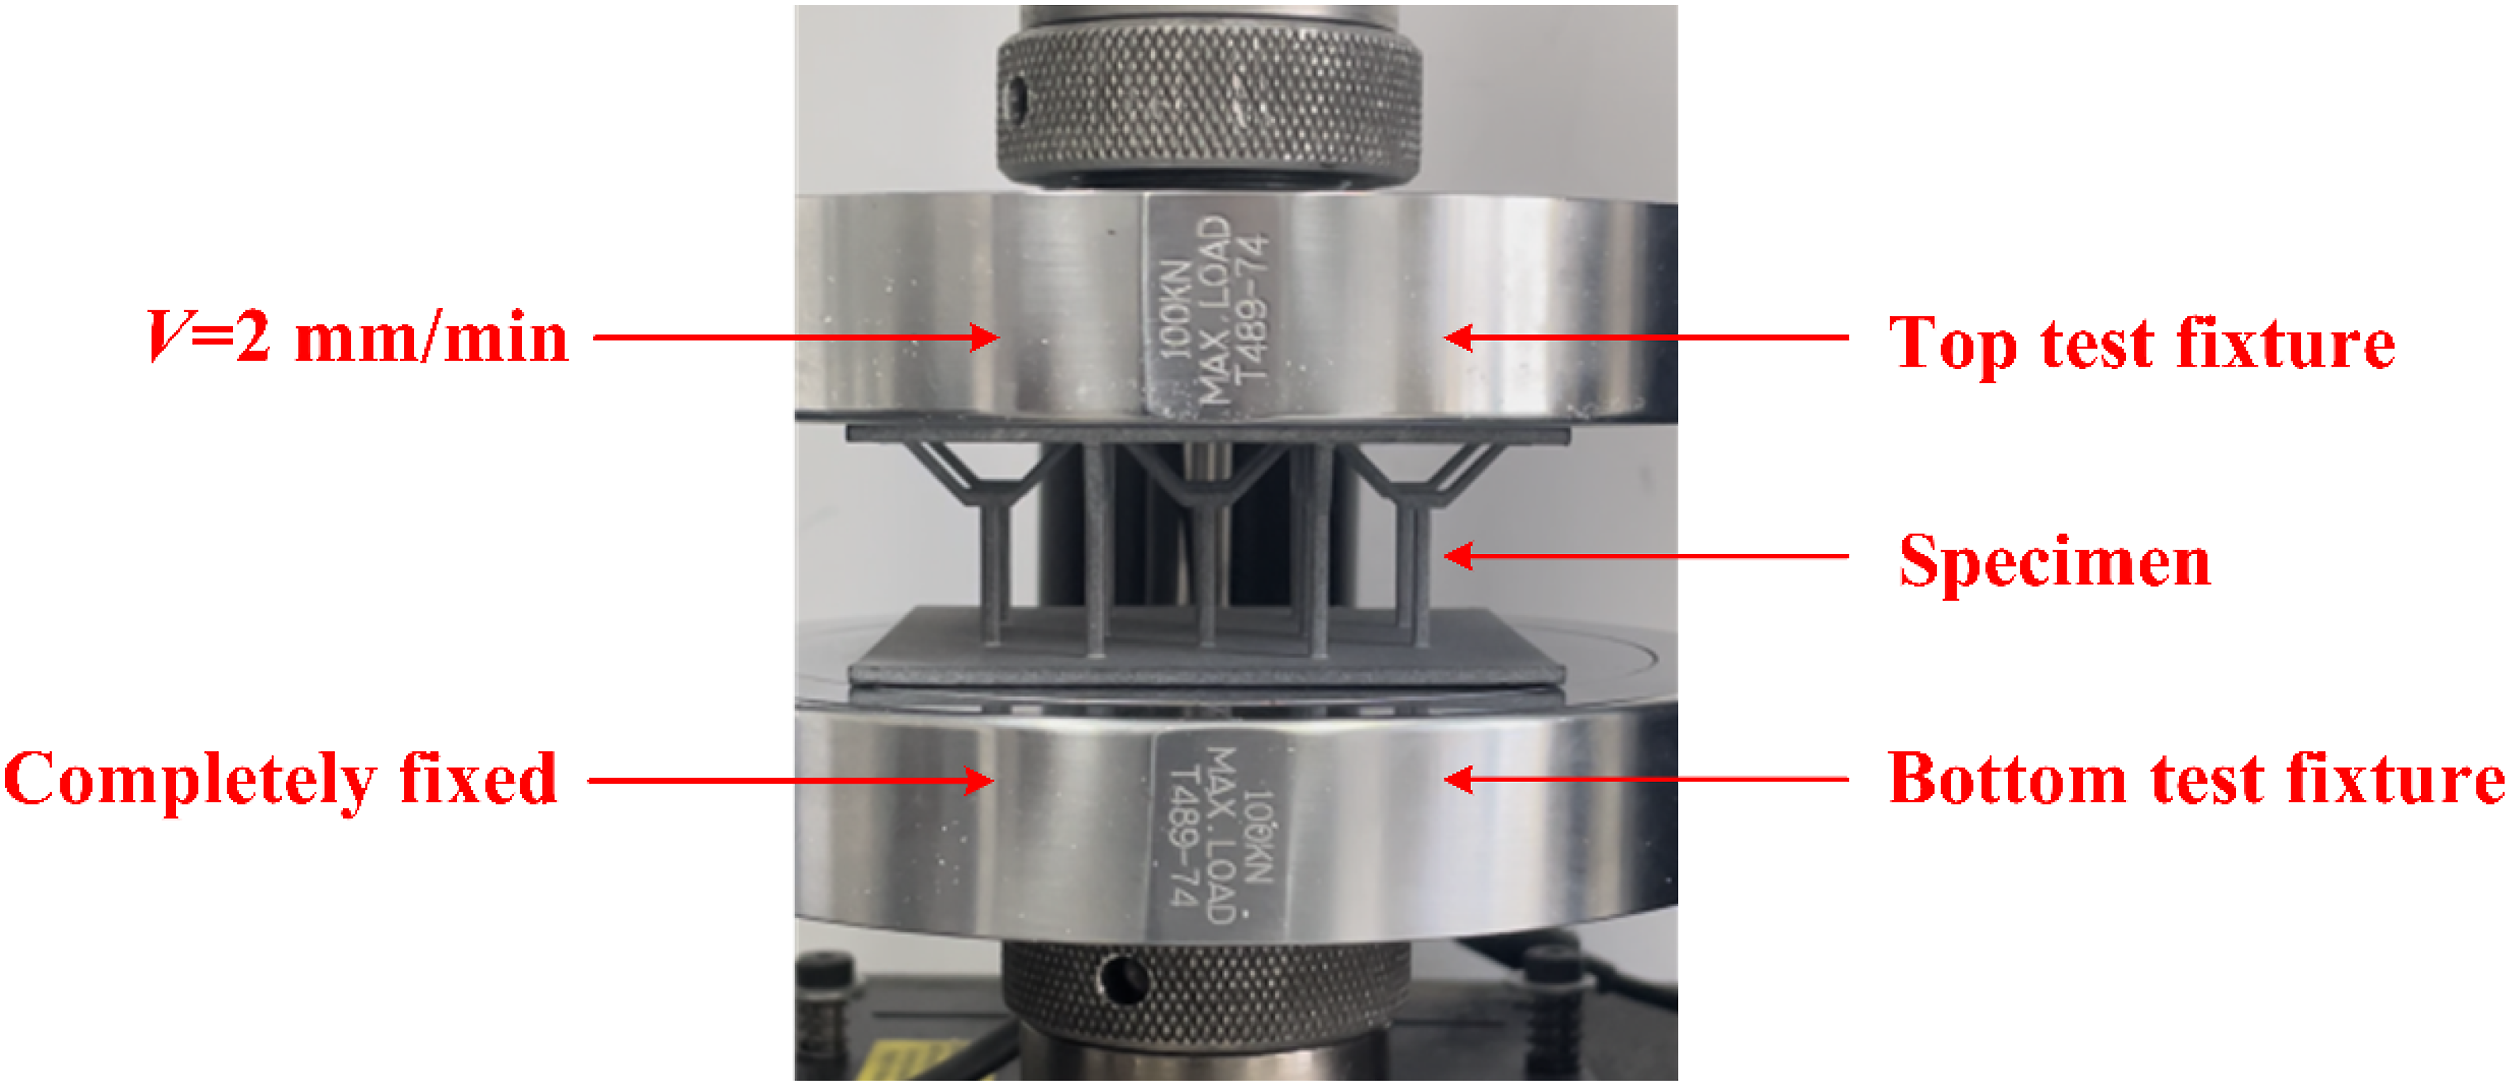
The measured compressive stiffness E of the structure at the linear-elastic stage is given by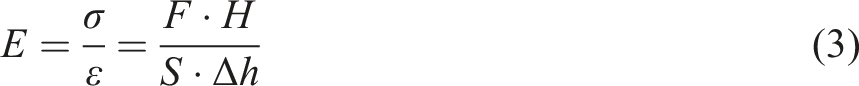
Results and discussion
Experimental results and discussion
The characteristics of the stress–strain curve and failure mechanism are analyzed in this section. Figure 10 shows the compressive stress–strain curve of the Y-type lattice structure. Based on the curve, the compressive strength and stiffness of the structure were determined to be 0.15 MPa and 3.92 MPa, respectively. There were three stages in the compressive process. In the first stage, the stress–strain curve increased linearly until it reached the peak stress at which the legs buckled and the resistance decreased sharply. In the second stage, the stress–strain curve reached a plateau when the strain increased to 0.1. This is the main stage for energy absorption by the structure during compression. When the strain increased to 0.35 in the third stage, the Y-flanges deformed and came into contact with the top face sheet. This resulted in densification in the upper half of the structure, which is reflected in the zigzag-shaped curve. Finally, the structure lost its load-supporting capability almost completely when the strain increased to 0.45 owing to the fracture failure of the struts. Compressive stress–strain curve of Y-type lattice structure.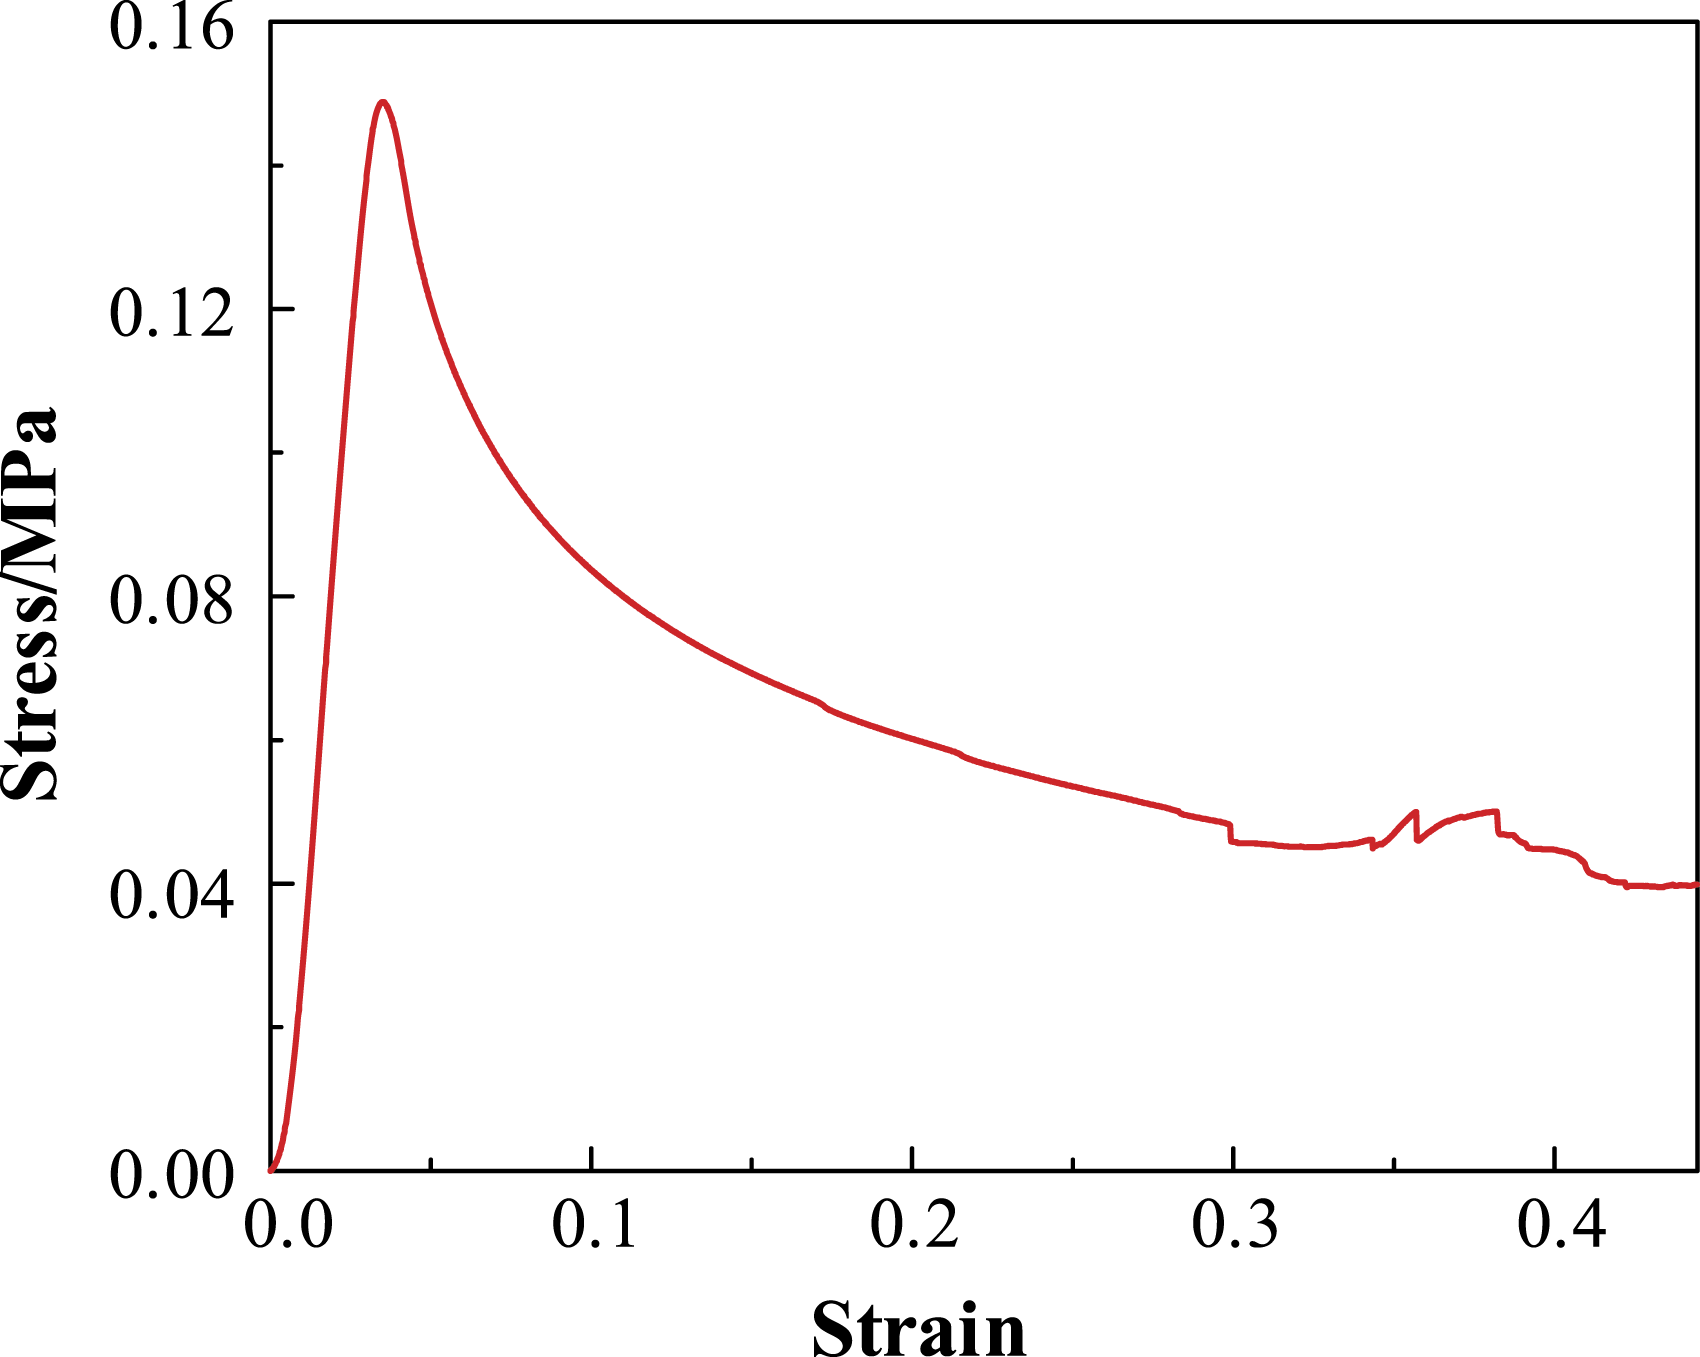
Figures 11(a)–(f) show the deformation and damage at different stages of the loading. The first stage corresponds to the elastic stage, in which a slight downward bending deformation first occurred at the web and the entire strut began to deform subsequently. Because the leg was a slender rod, buckling occurred after the supporting load reached the peak load. The legs in the first row in the front view (highlighted by circles in Figure 11) deformed in an opposite-direction deformation pattern while those in the next two rows deformed in a same-direction deformation pattern (the legs in the second row bent to the left while those in the third row bent to the right). These differences maybe caused by the initial defects in the specimens: a few legs and the bottom face sheet were not ideally perpendicular to each other, which led to the tendency for these legs to deform in the same direction at the beginning of tests. As the compressive load continued to increase, the legs and Y-flanges began to yield and exhibited conspicuous plastic deformation. The Y-flanges subsequently deformed and came into contact with the top face sheet, which resulted in densification in the upper half of the structure. Finally, when the maximum stress in the struts exceeded the limit of material, fracture failures occurred at different parts of the cores, and the lattice structure lost its load-supporting capability completely. Core deformation at different stages of loading: (a) initial stage, (b) elastic stage, (c) buckling stage, (d) yield stage, (e) densification stage, and (f) complete failure stage.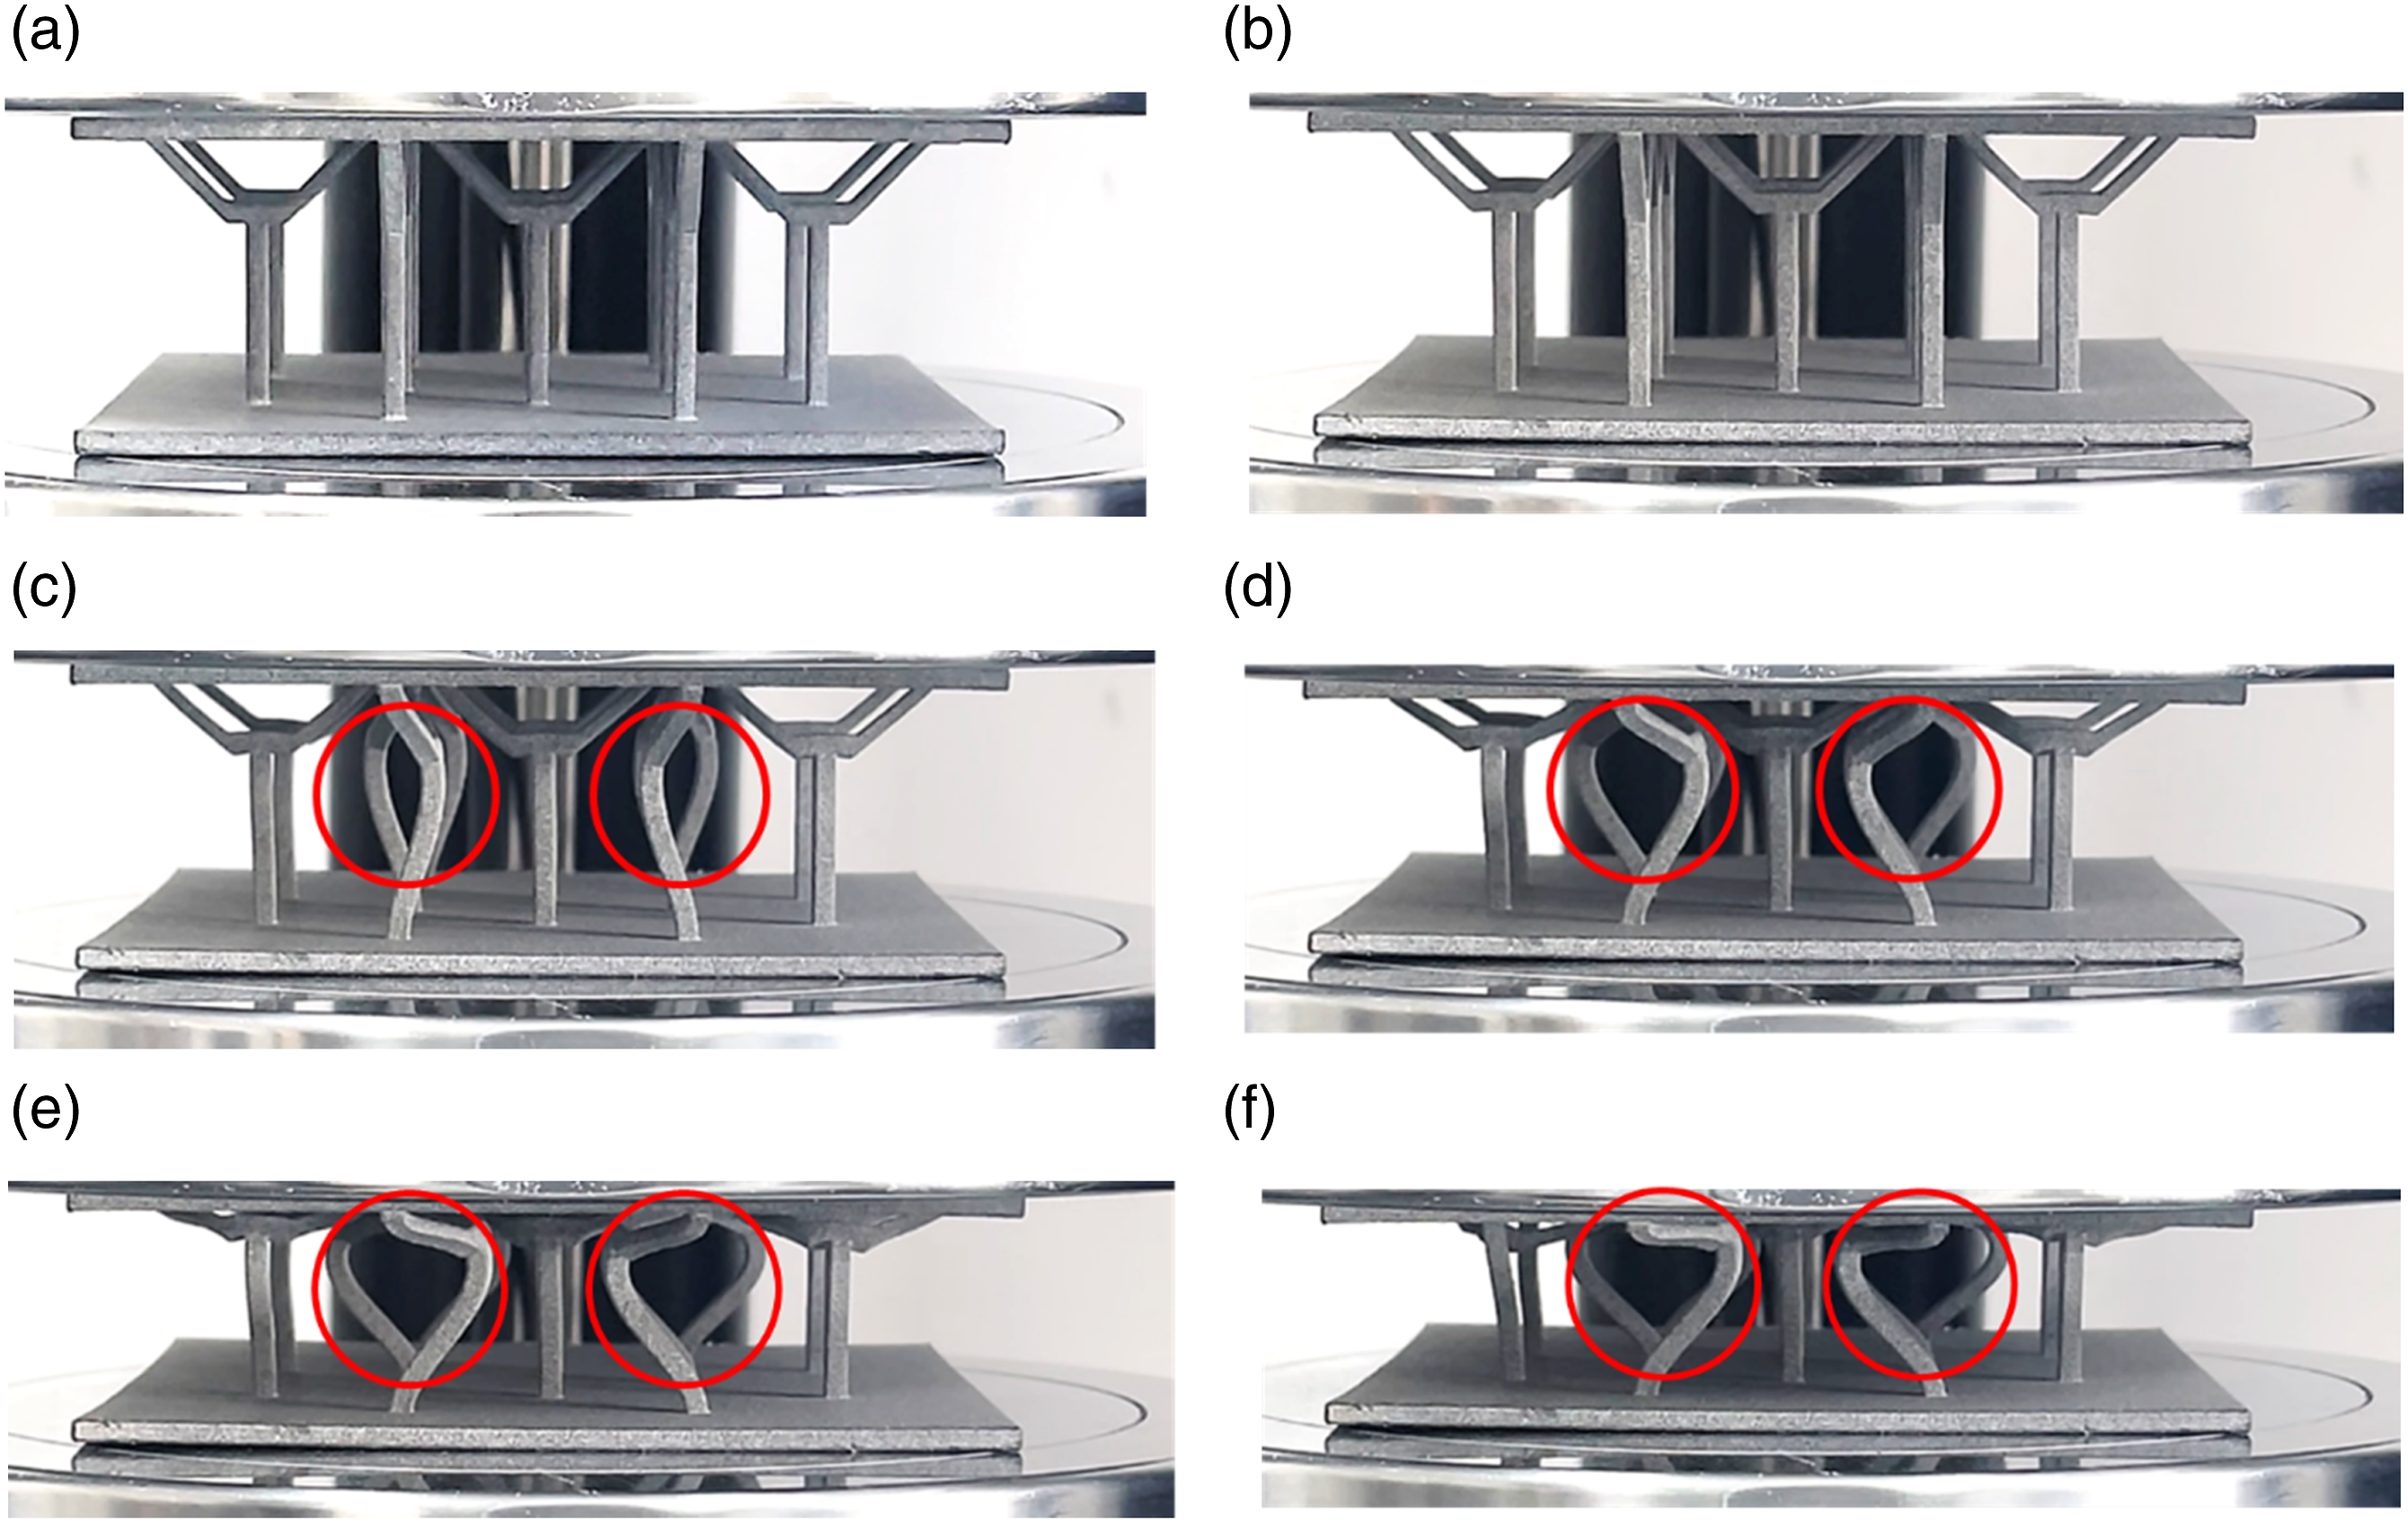
The experimental results indicate that the main failure modes of the PA12 Y-type lattice structure were plastic deformation and strut fracture. Figure 12(a) shows a detailed view of the legs after the experiment, from which it can be seen that fracture occurred at the upper middle of the legs and at the joints between the legs and the bottom face sheet. Figure 12(b) shows that fracture occurred at the joints of the Y-flanges, shoulders, and bottom face sheet. These fractures occurred because of stress concentration and manufacturing imperfections. Failure modes: (a) fracture at upper middle of legs and at joints between legs and bottom face sheet, (b) fracture at joint between Y-flange and shoulder.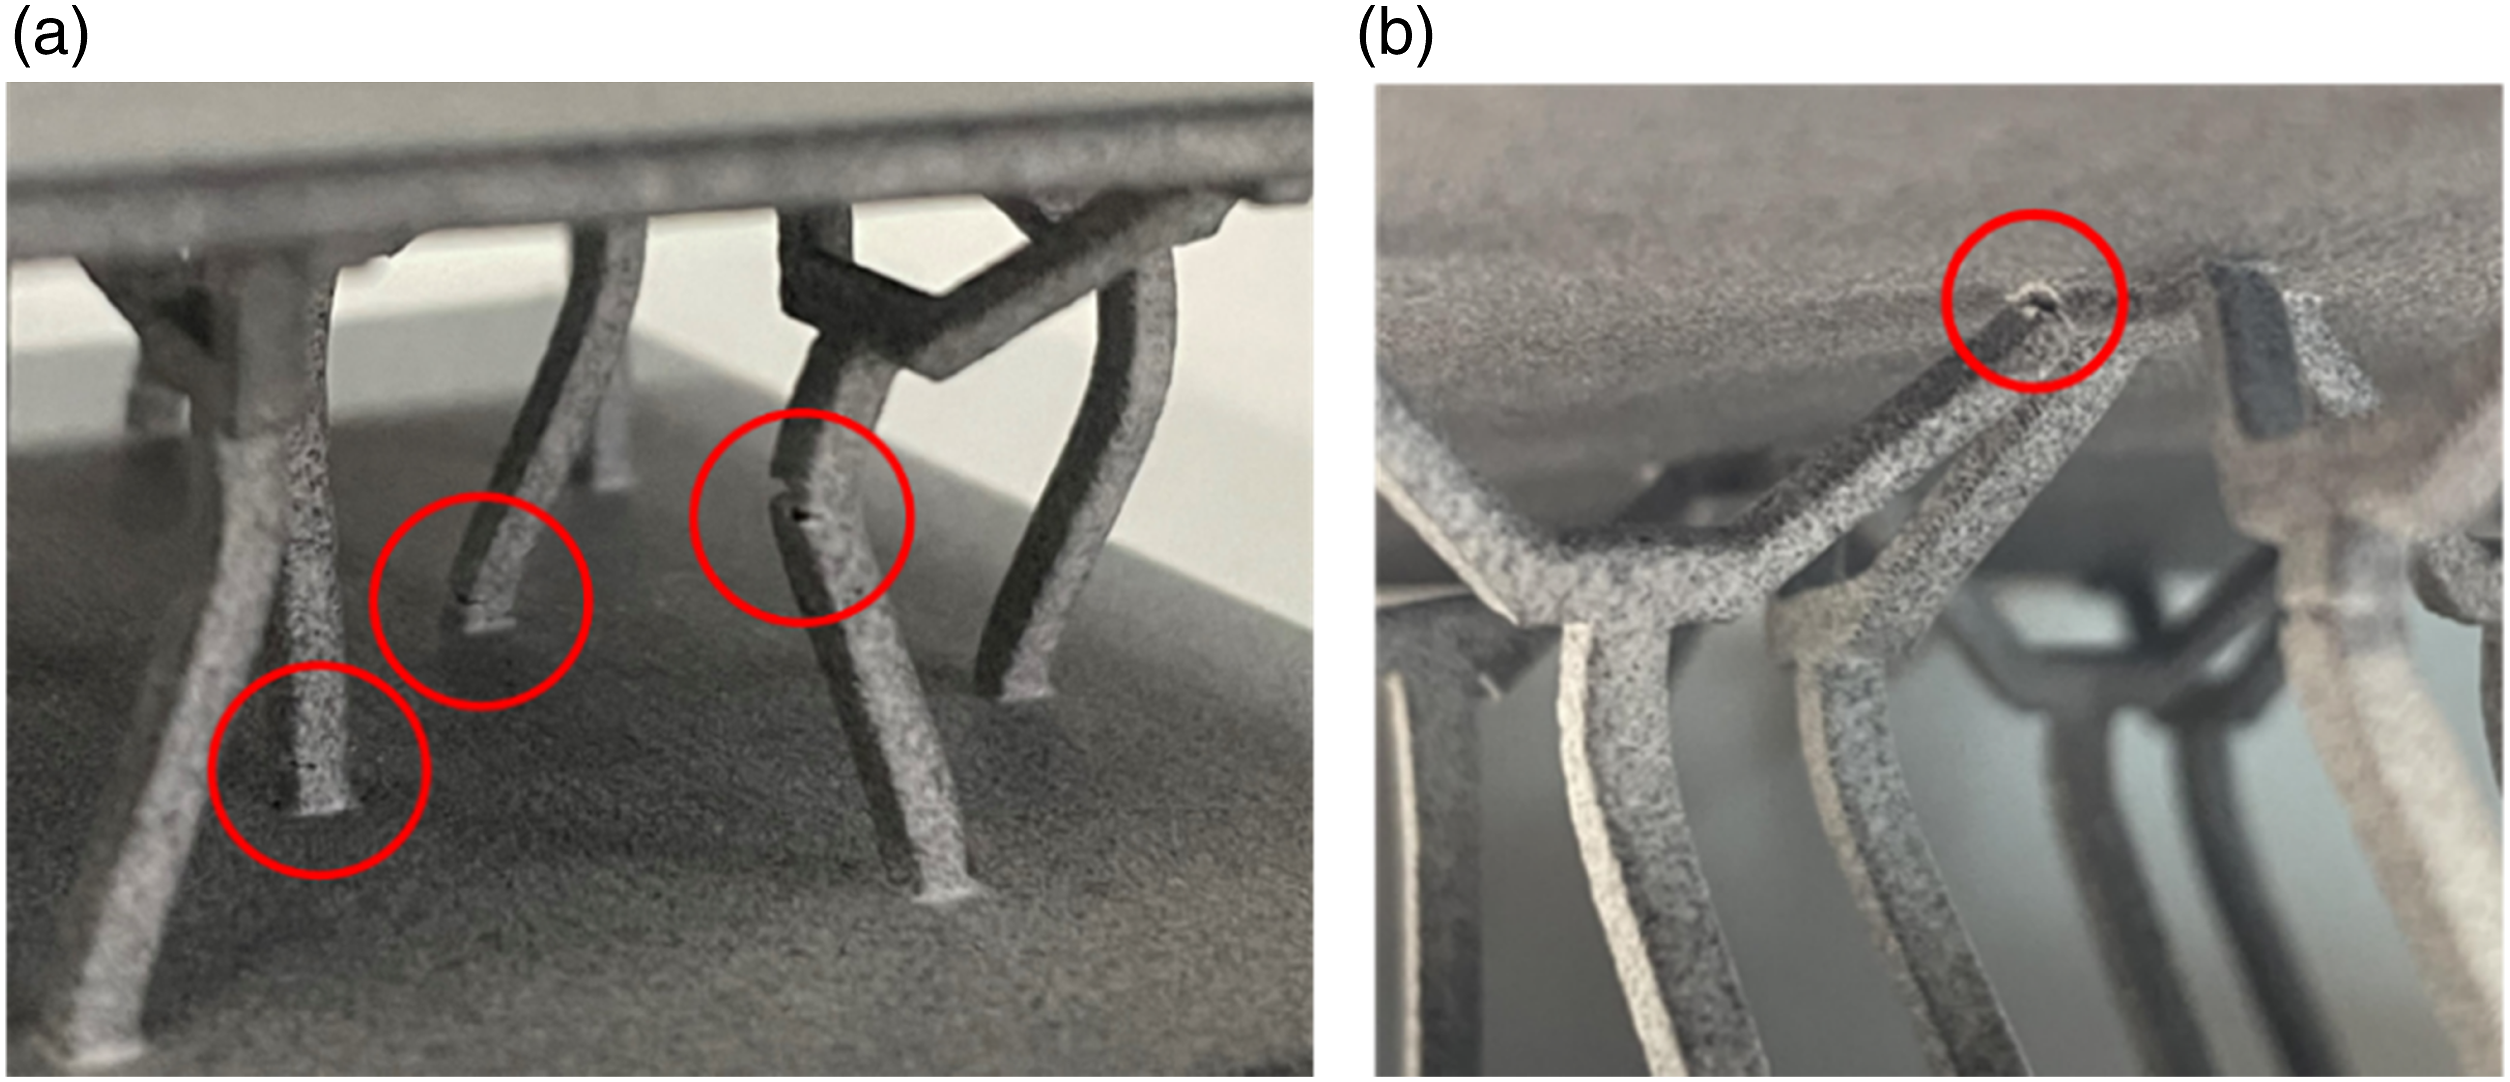
Numerical simulation
Finite element model
A finite element model was developed in Abaqus/Explicit to predict the mechanical behavior and failure mechanisms of the PA12 Y-type lattice structure. The cores and face sheets were simulated in the same manner as the experimental specimens, and the test fixtures were simulated using two square-shaped discrete rigid planes. The material properties of the model were set as described in Design and manufacture. Figure 13 shows the finite element model under out-of-plane compression. The displacement load was applied to a reference point at the top test fixture, and the bottom test fixture was completely constrained. To avoid penetration, general contact was defined between the face sheets and cores, a tie was applied between the face sheets and struts, and surface-to-surface contact was defined between the face sheets and test fixtures. The C3D8R solid element was used to simulate the structure. Finite element model under out-of-plane compression.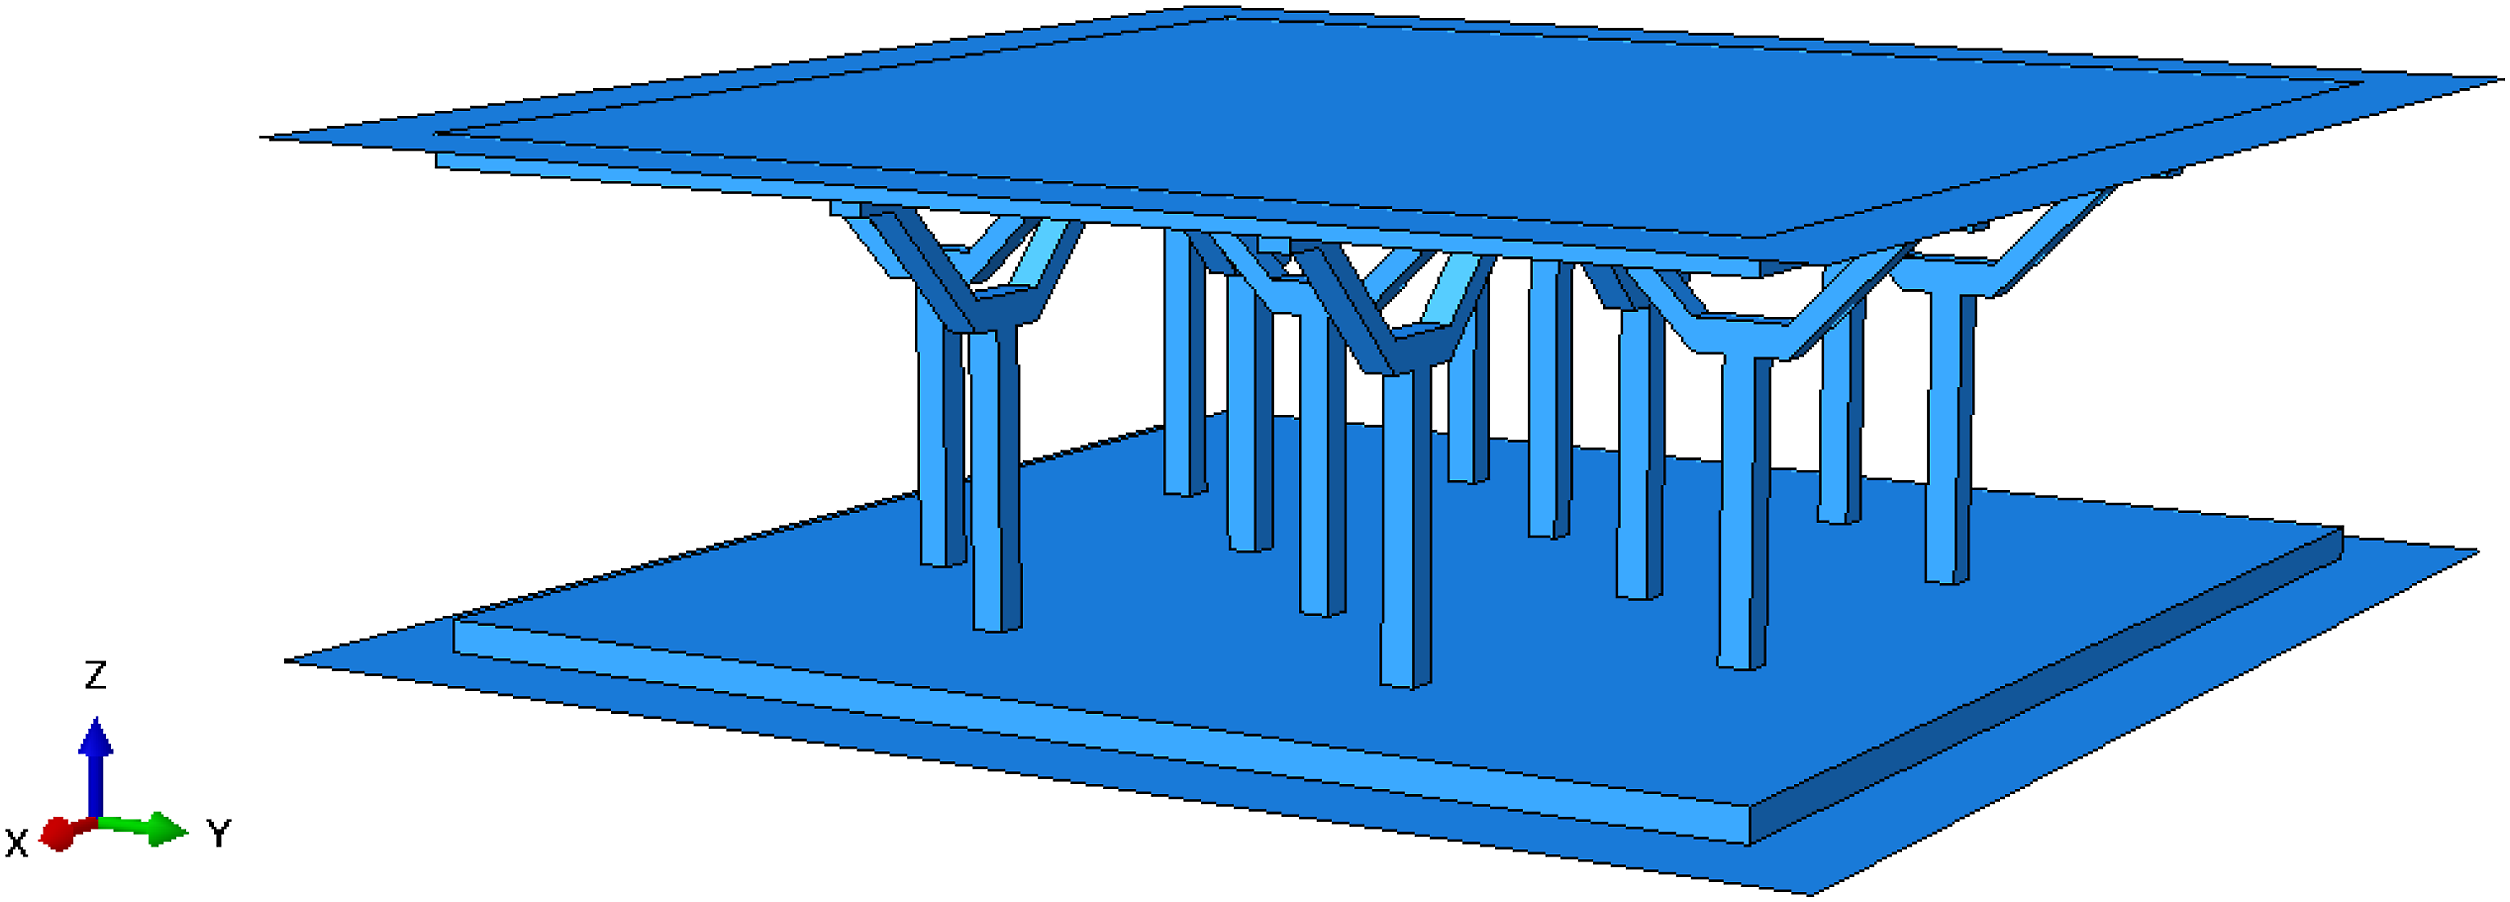
Numerical results and discussion
The numerical simulation results for the PA12 Y-type lattice structure compression process are shown in Figures 14(a)–(f), in which the top and bottom test fixtures are hidden. The simulated compression deformation behavior is similar to the actual experimental behavior and can also be divided into five stages. The main difference between the simulation and experimental results is that all the legs in the finite element model deformed in an opposite-direction deformation pattern without a same-direction deformation pattern because the finite element model is an idealized model without initial defects. The compressive load was therefore borne equally by all the legs, which led to the symmetrical deformation of the legs. Simulation results for core deformation at different stages of loading: (a) initial stage, (b) elastic stage, (c) buckling stage, (d) yield stage, (e) densification stage, and (f) complete failure stage.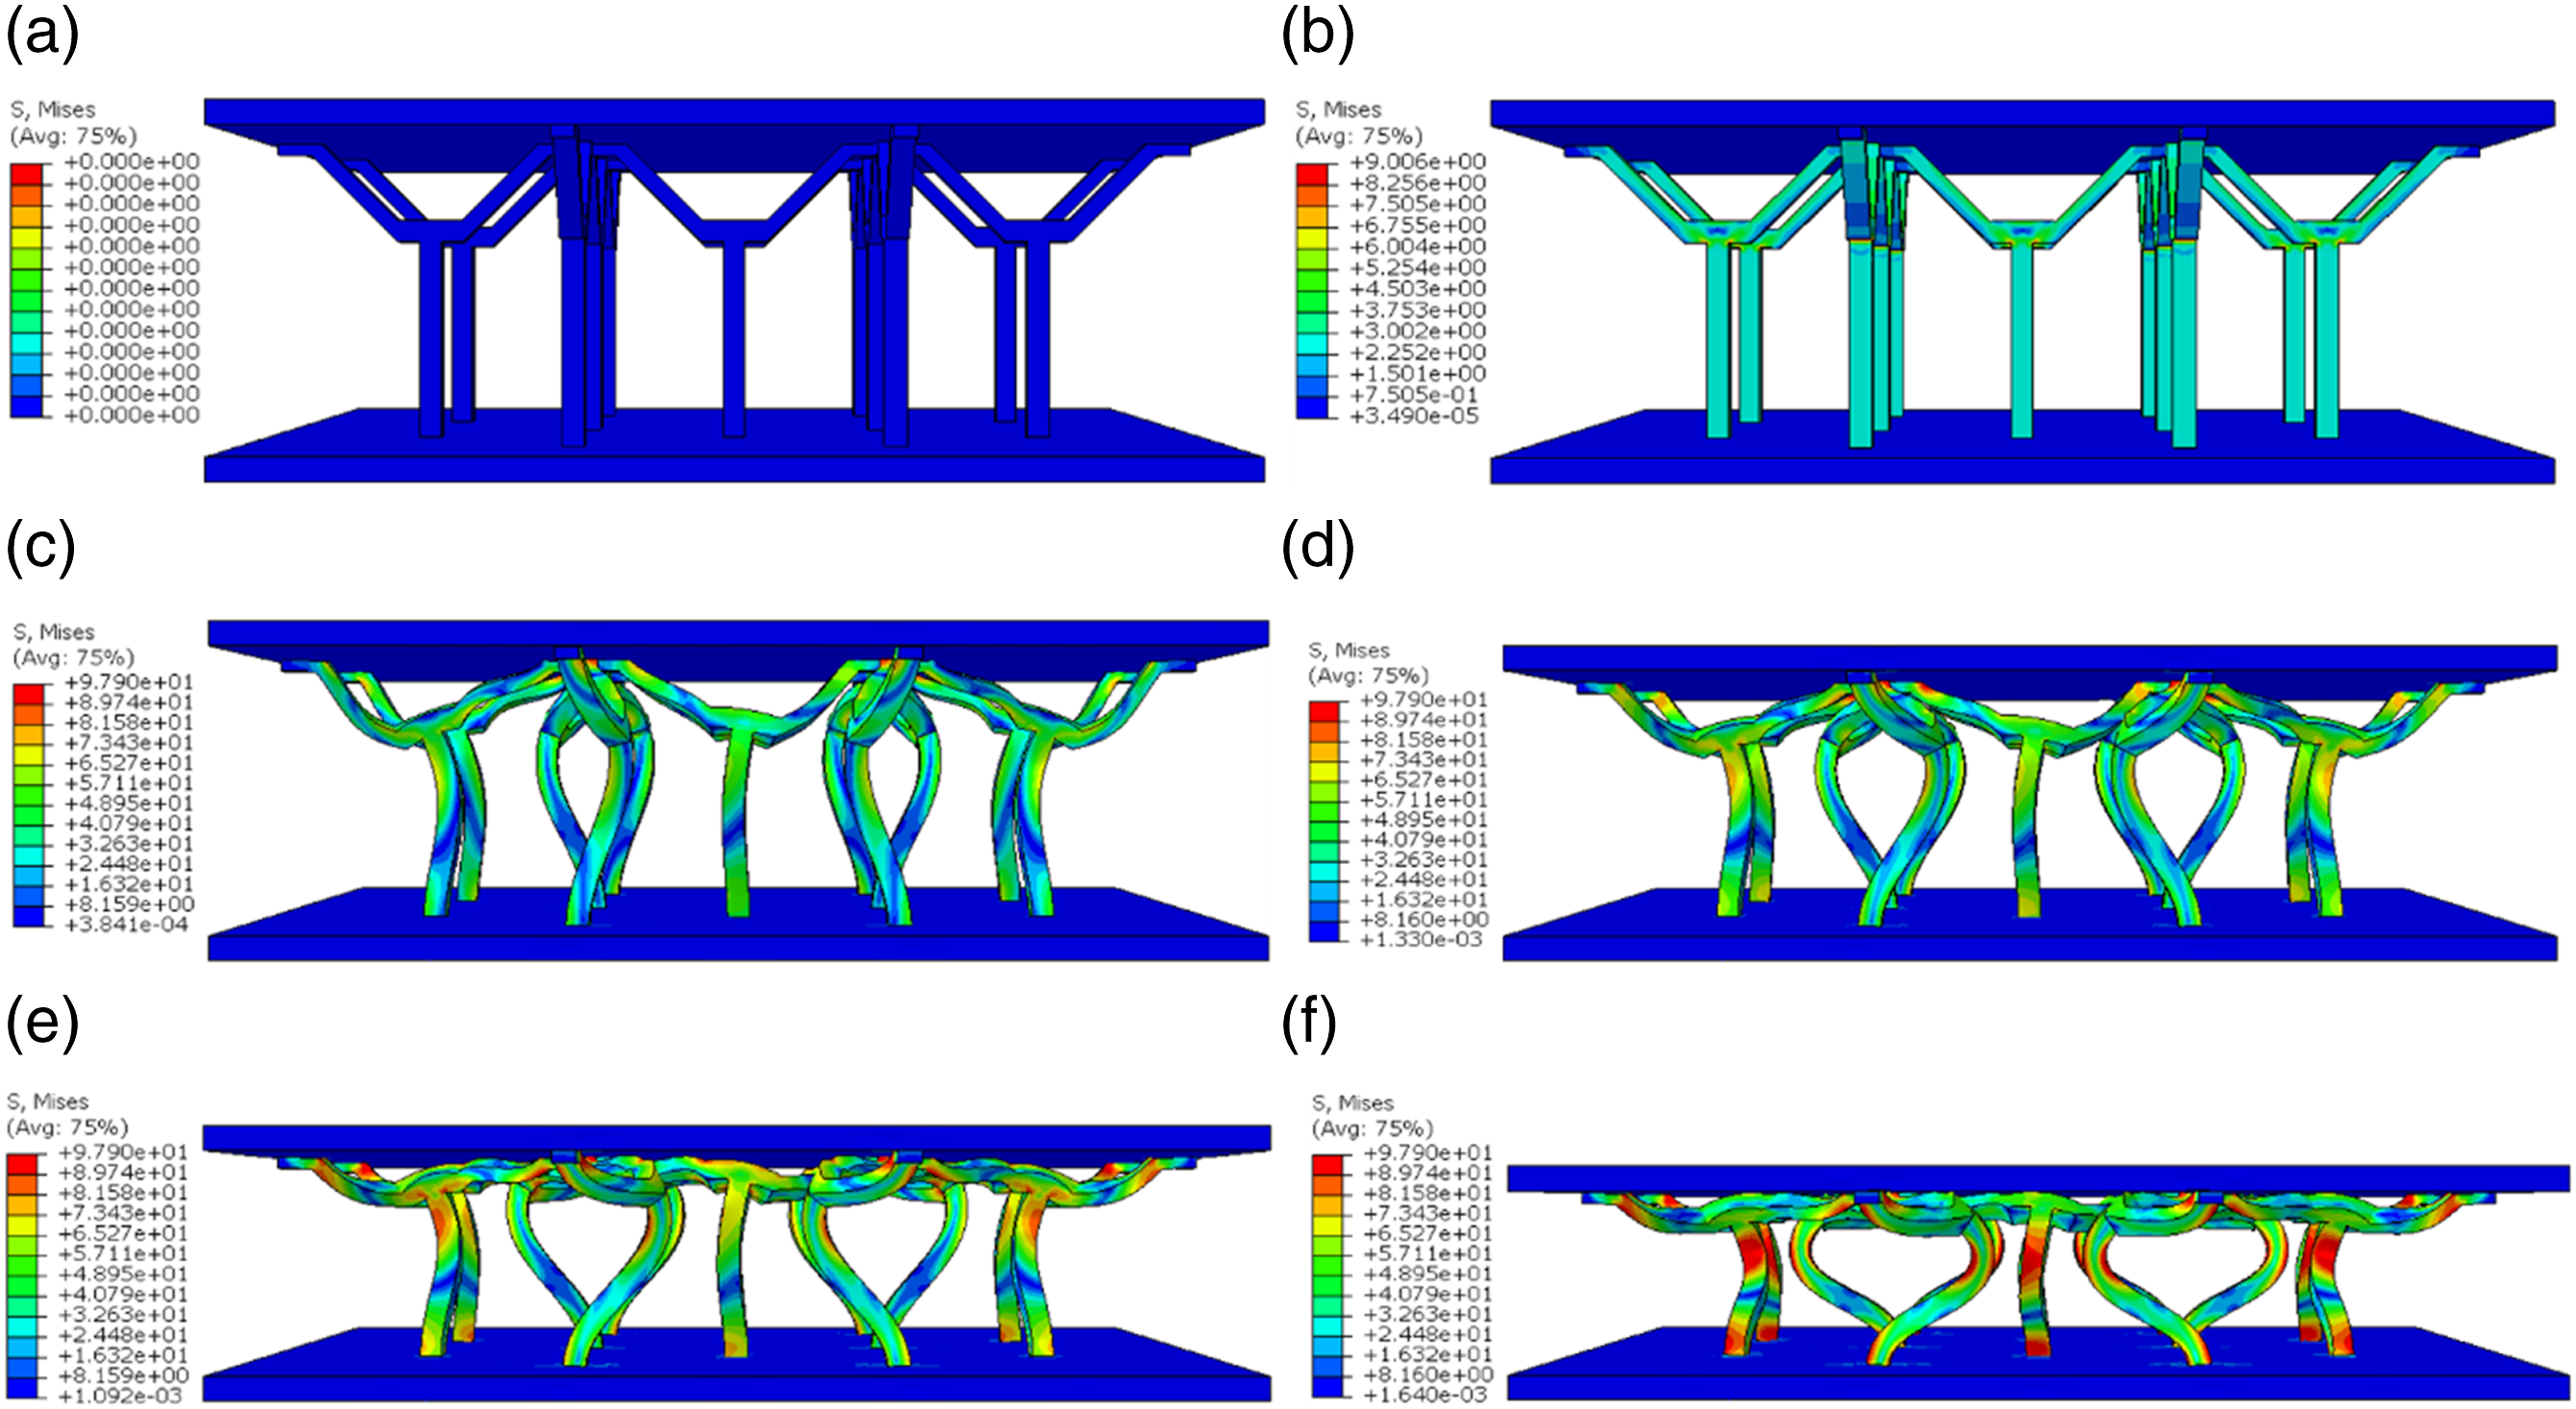
As can be seen in Figure 14(b), stress concentration first occurred at the webs, which exhibited a slight downward bending deformation that is consistent with the experimental results. The entire strut then began to deform. In the yield stage, large stresses occurred in the joints of the Y-flanges and shoulders. In the densification stage, the stress on the legs increased significantly, and the compressive load was mainly supported by the legs at this time. Figure 14(f) shows that near the end of compression, all the struts underwent large plastic deformation and the maximum stress concentration occurred mainly at the three positions of the upper middle of the legs, the joints between the legs and bottom face sheet, and the joints between the Y-flanges and shoulders. Together with Figure 12, it can be seen that the positions of maximum stress were close to the positions of fracture failure in the struts, which indicates that the struts fractured because of excessive stress concentration due to their large deformations.
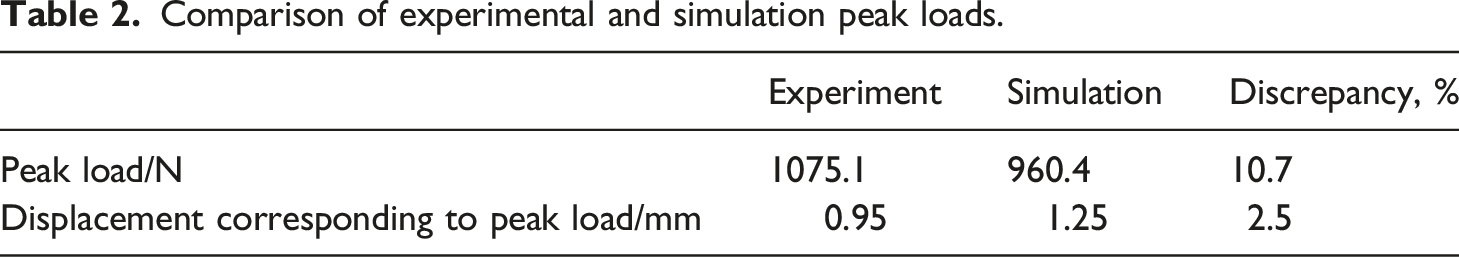
Figure 15 shows a comparison between the experimental and simulated displacement–load curves of the PA12 Y-type lattice structure under out-of-plane compression. The displacement in the simulated curve increased linearly with the load up to the peak load and then decreased sharply, followed by a long and stable plateau. This behavior is similar to that of the experimental curve except for the smaller peak load and slope at the linear elastic stage and the longer and more stable plateau stage. As shown in Table 2, the difference between the experimental and simulated peak loads is 10.7%, and that between the displacements corresponding to the experimental and simulated peak loads is 2.5%, which is within the acceptable range. These results therefore show that the finite element method can be used to simulate the compression mechanical properties and failure behavior of the PA12 Y-type lattice structure. Comparison of experimental and simulation displacement–load curves. Comparison of experimental and simulation peak loads.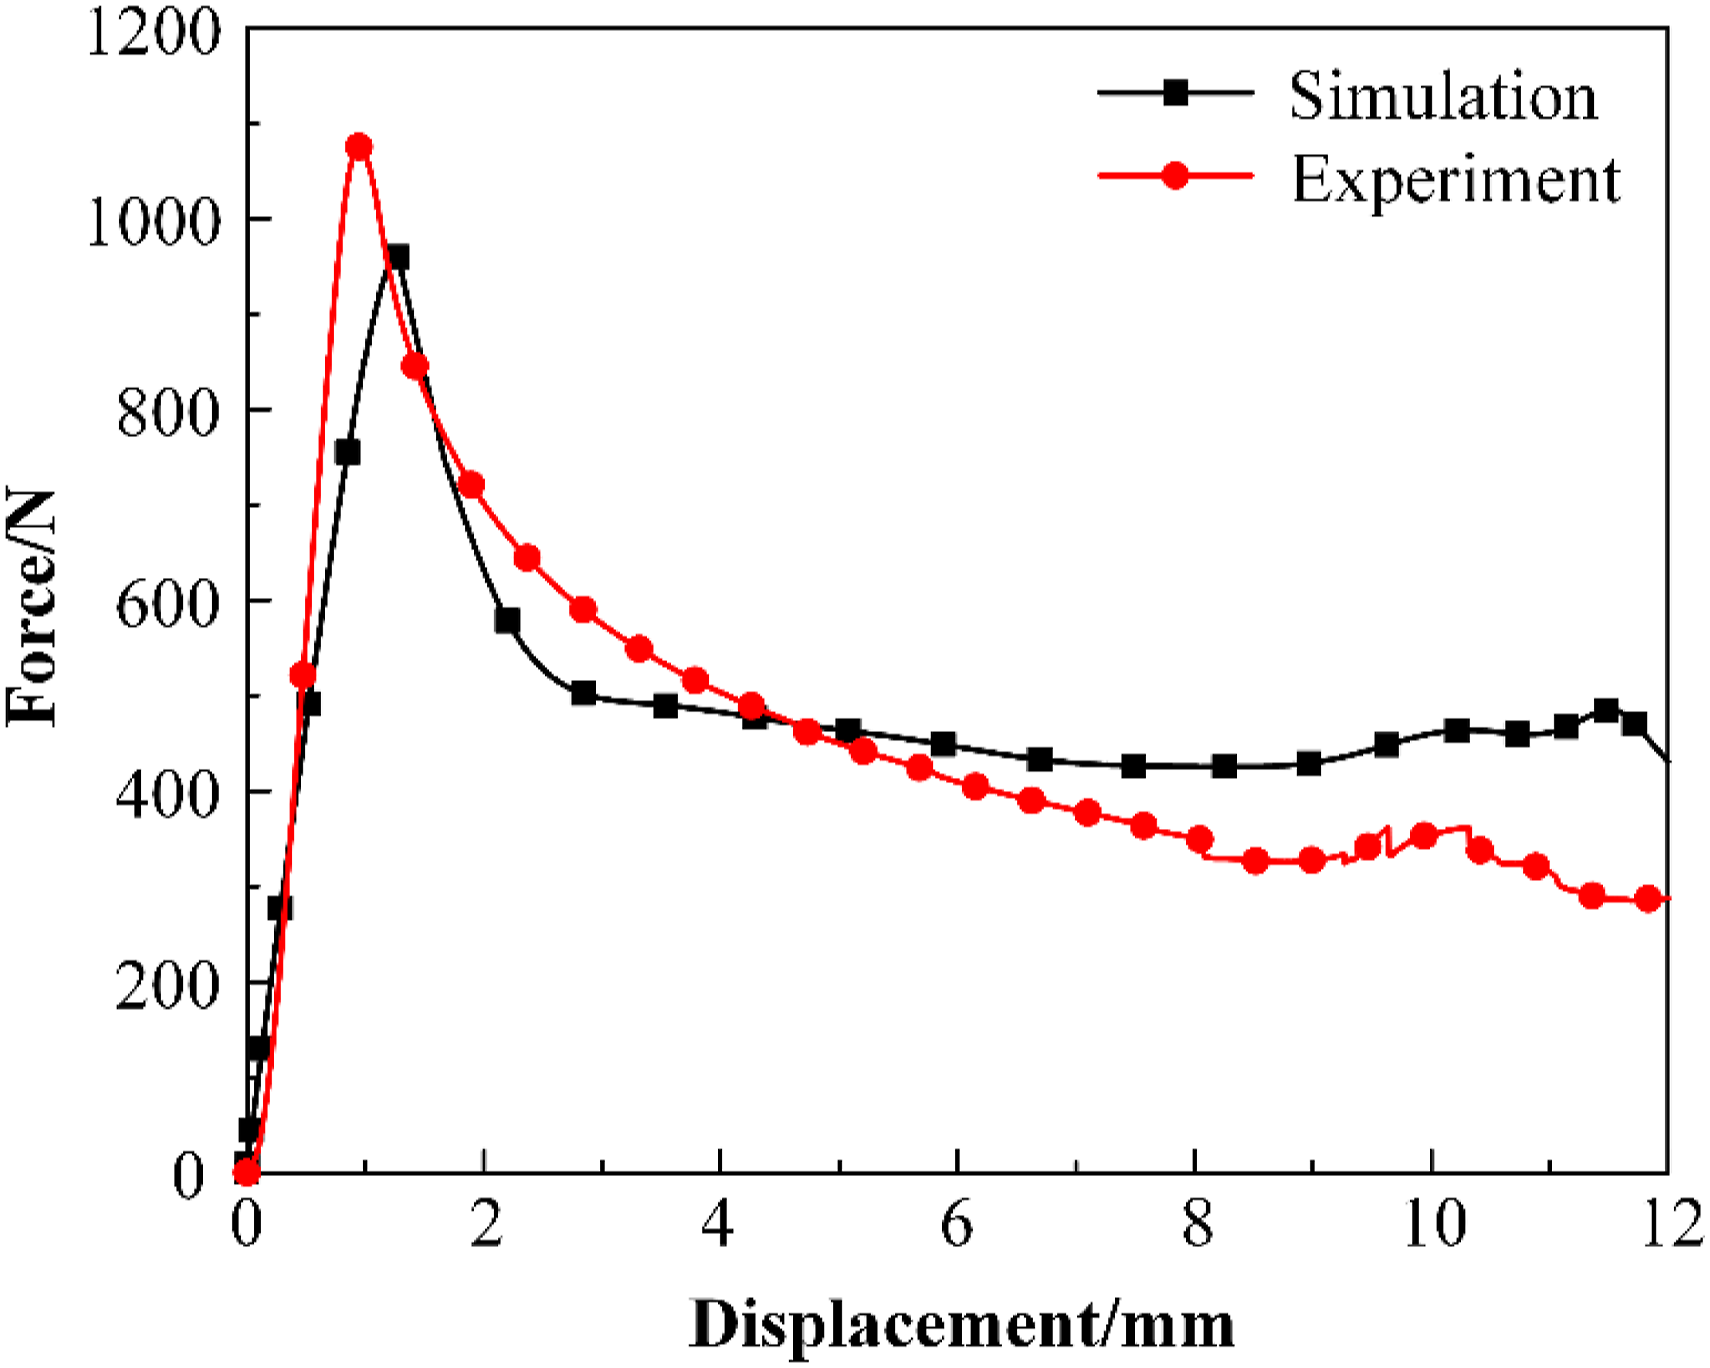
Effects of relative density on compression properties
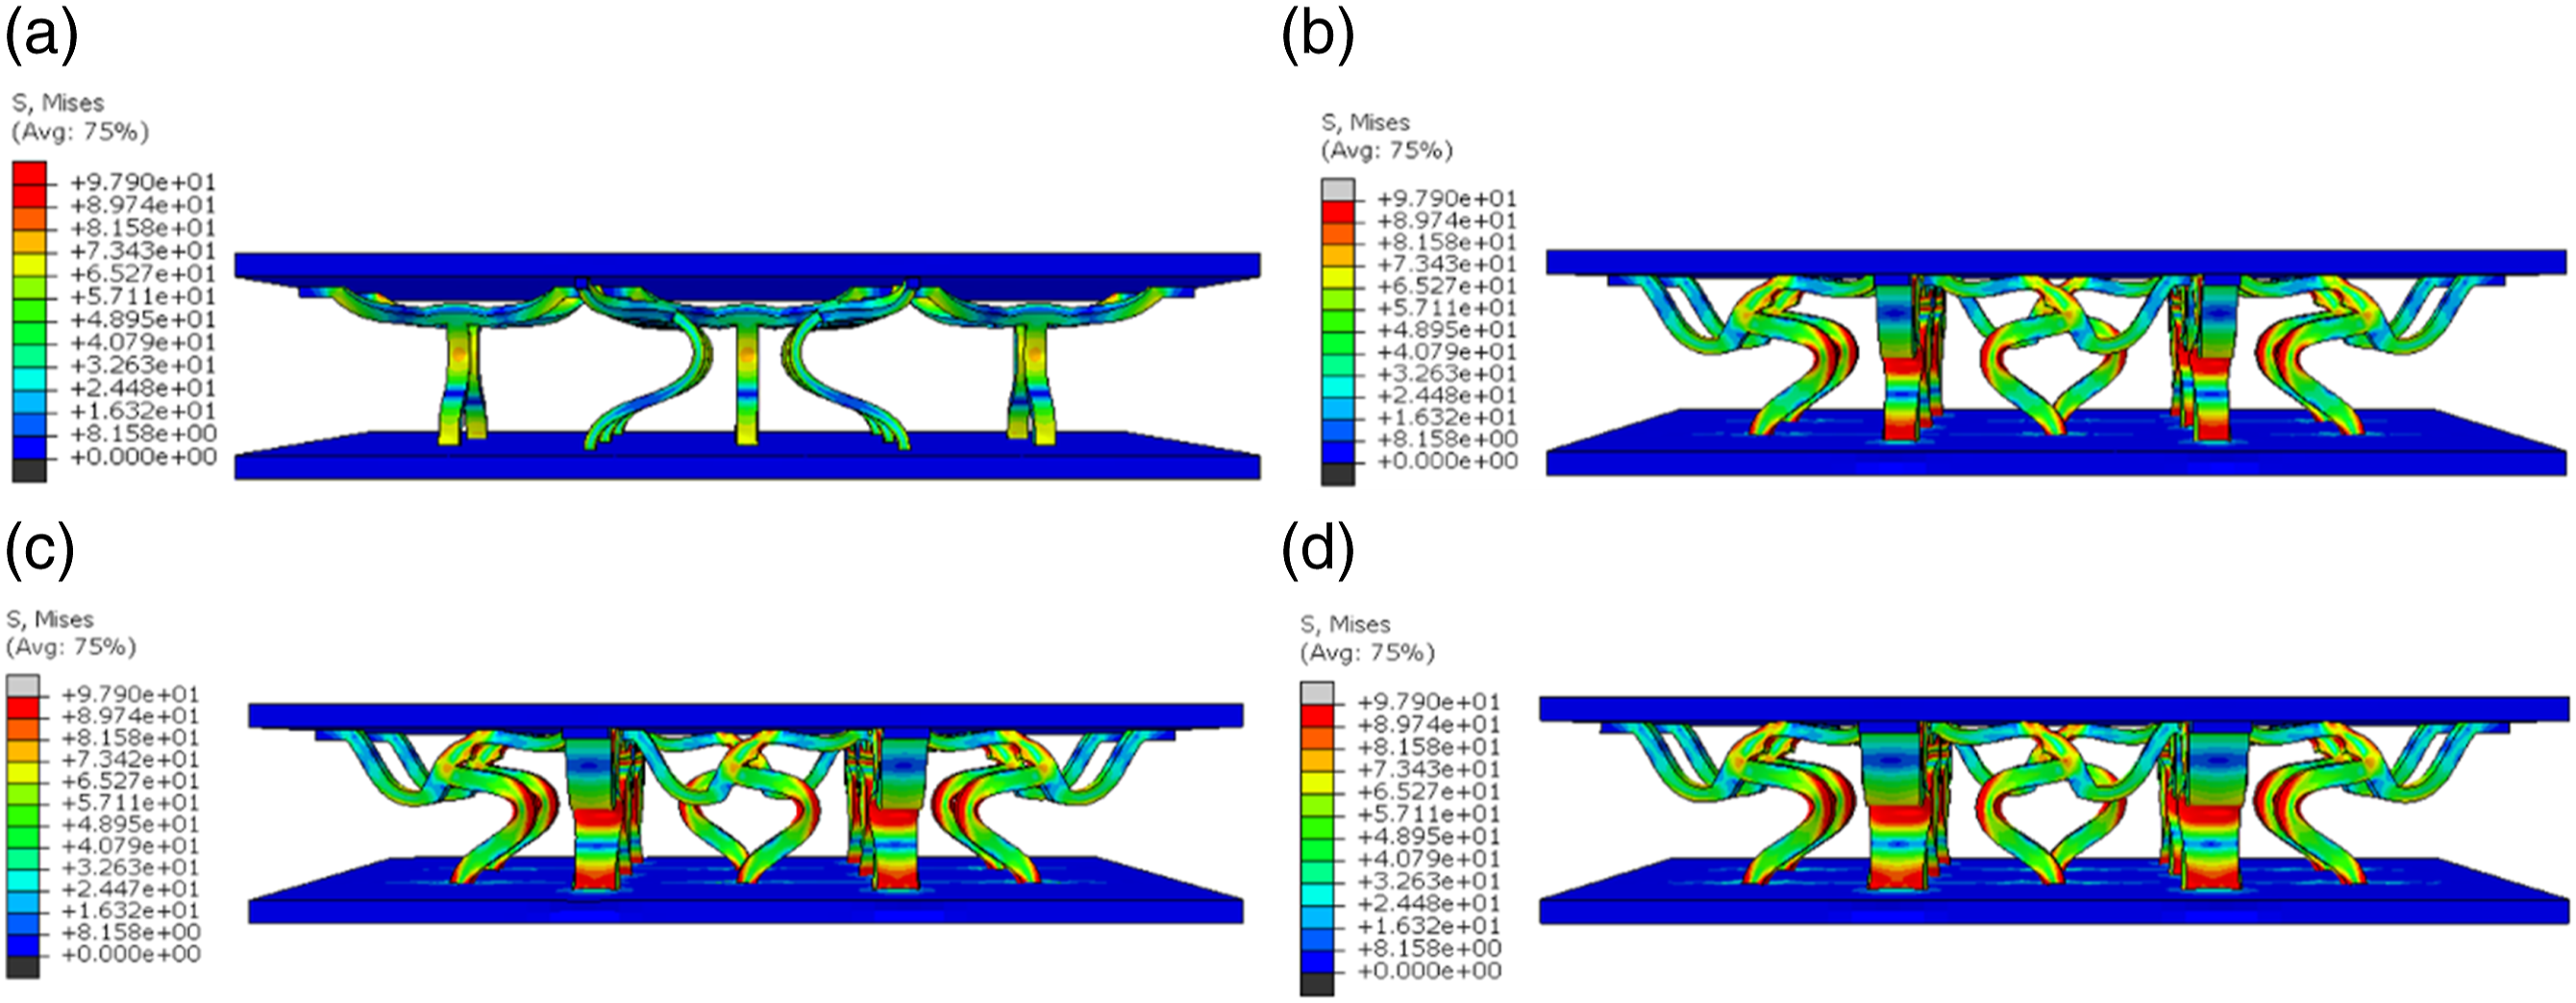
Changing the strut thicknesses changes the relative density of the unit cell, which in turn affects the mechanical properties and failure behavior of the structure. PA12 Y-type lattice structures with different relative densities under compression were simulated by varying the strut thickness T from 1 to 5 mm (the other parameters were kept constant with the values listed in Table 1). Figure 16 shows the displacement–load curves of structures with different relative densities. The deformation processes of these structures were obtained through simulations, and their deformation at the complete failure stage are shown in Figures 17(a)–(d) for subsequent analysis. Displacement–load curves of structures with different thicknesses T. Deformation of structures with different relative densities at the complete failure stage: (a) T = 1 mm, (b) T = 3 mm, (c) T = 4 mm, (d) T = 5 mm.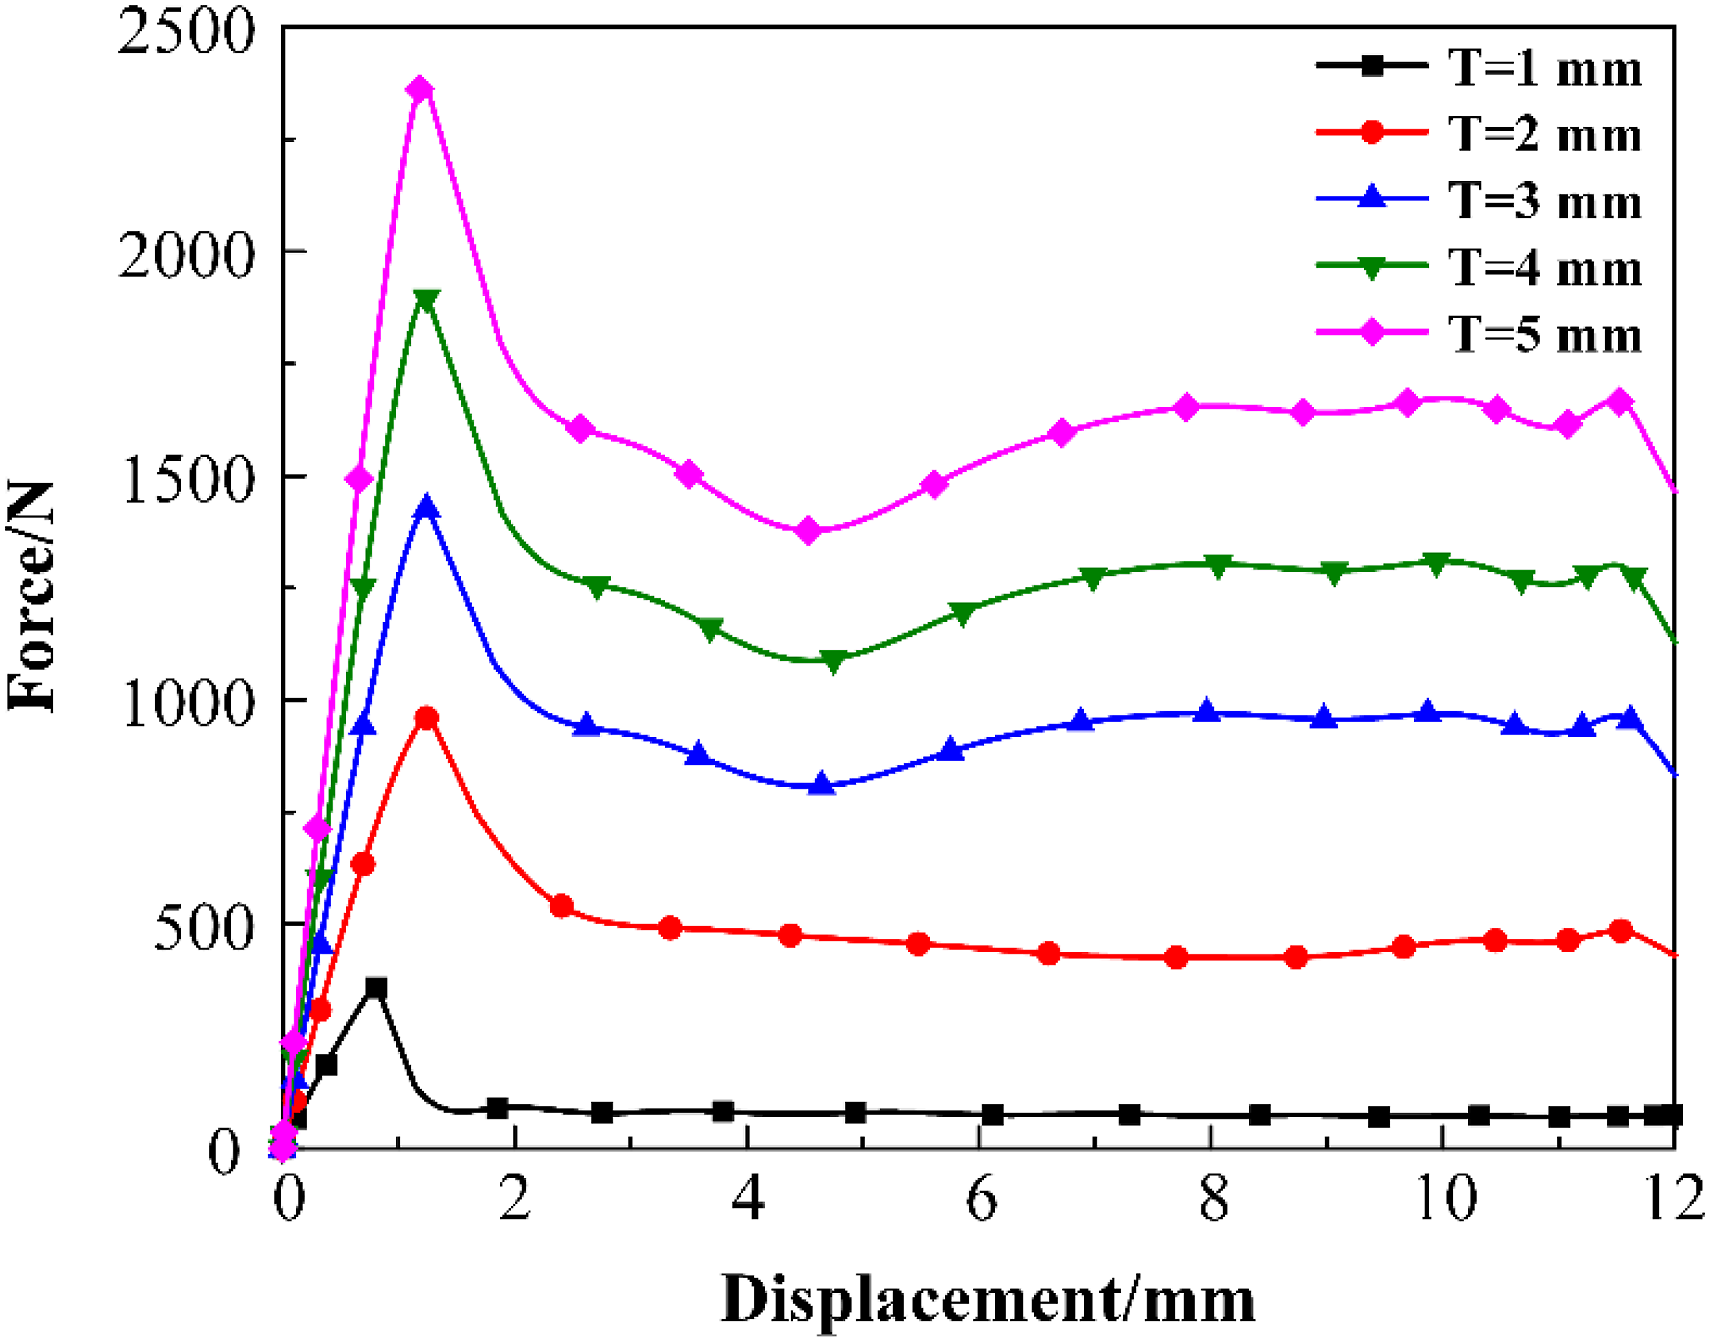
From Figure 16, it can be seen that the curves for T = 1 mm and T = 2 mm have similar trends. Both of them have long and stable plateau stages, but the supporting force in the T = 1 mm curve is far smaller than those in the other curves. The small supporting force is attributed to the weak ability of the thin struts to provide support. The other three curves show similar trends in which the supporting forces increased in the plateau stage because of the better ability of the corresponding structures to provide support due to their thicker legs. As the relative densities of the structures increased, their compression strengths and stiffnesses increased monotonically because the structures with higher relative densities have thicker struts with larger peak stresses and stiffnesses.
From Figures 17(a) and 14, it can be observed that the deformation of the legs (which are located at positions similar to those of the legs highlighted by circles in Figure 11) in the T = 1 mm and T = 2 mm lattice structures occurred in the YZ plane in Figure 13. In contrast, Figures 17(b)–(d) show that the deformation of the legs in the T = 3 mm, T = 4 mm, and T = 5 mm lattice structures occurred in the XZ plane in Figure 13. This difference can be attributed to the increased difficulty for the structure to deform in the thickness direction as the thickness increased. The structure therefore deformed in another direction. These results show that changing the relative density by changing the strut thickness has a significant effect on the direction of strut deformation.
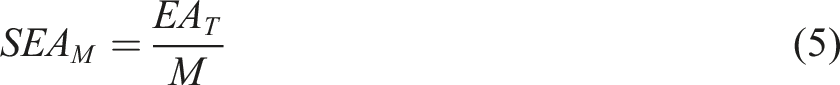
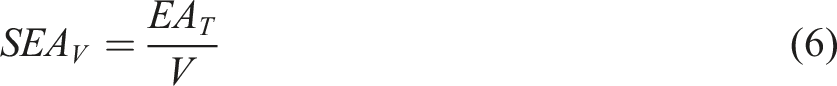
The specific strength and stiffness of a lattice structure, which are respectively defined as the ratios of the compressive strength and stiffness to the equivalent density, are important indicators for the compressive properties of the structure. The energy absorption capacity is also an important indicator. The total energy absorption (EAT) and specific energy absorption (SEA) are commonly used to quantify the energy absorption capacity of a structure. The total energy absorption is defined as the mathematical area of the displacement–load curve, the specific energy absorption SEA
M
and SEA
V
are given by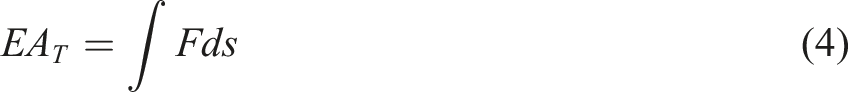
Compressive properties of lattice structures with different thicknesses.
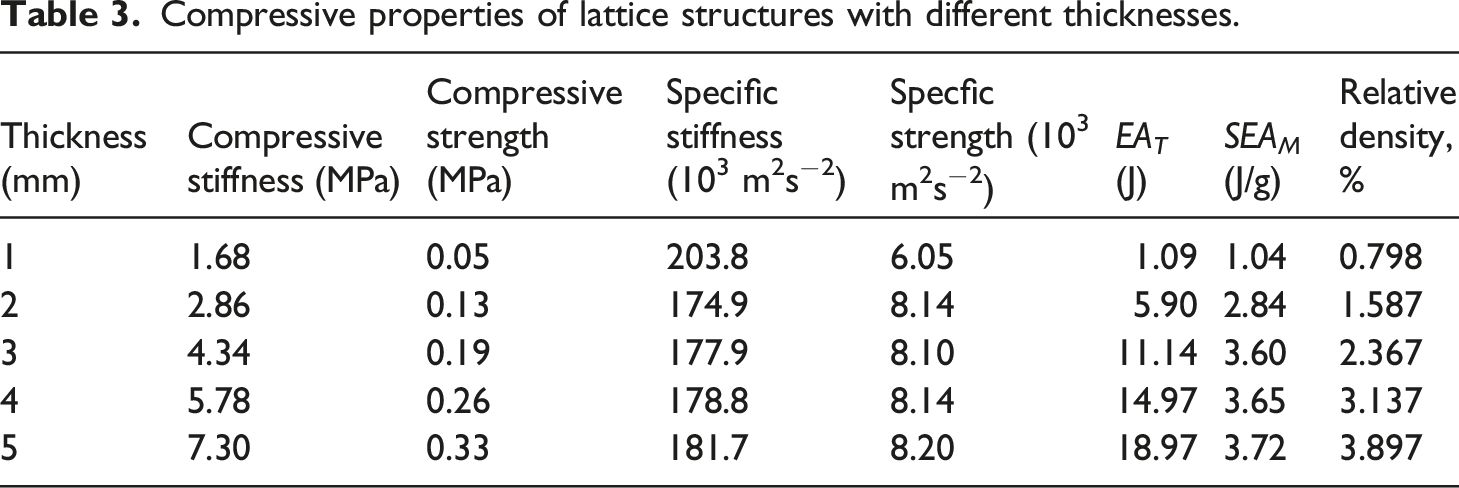
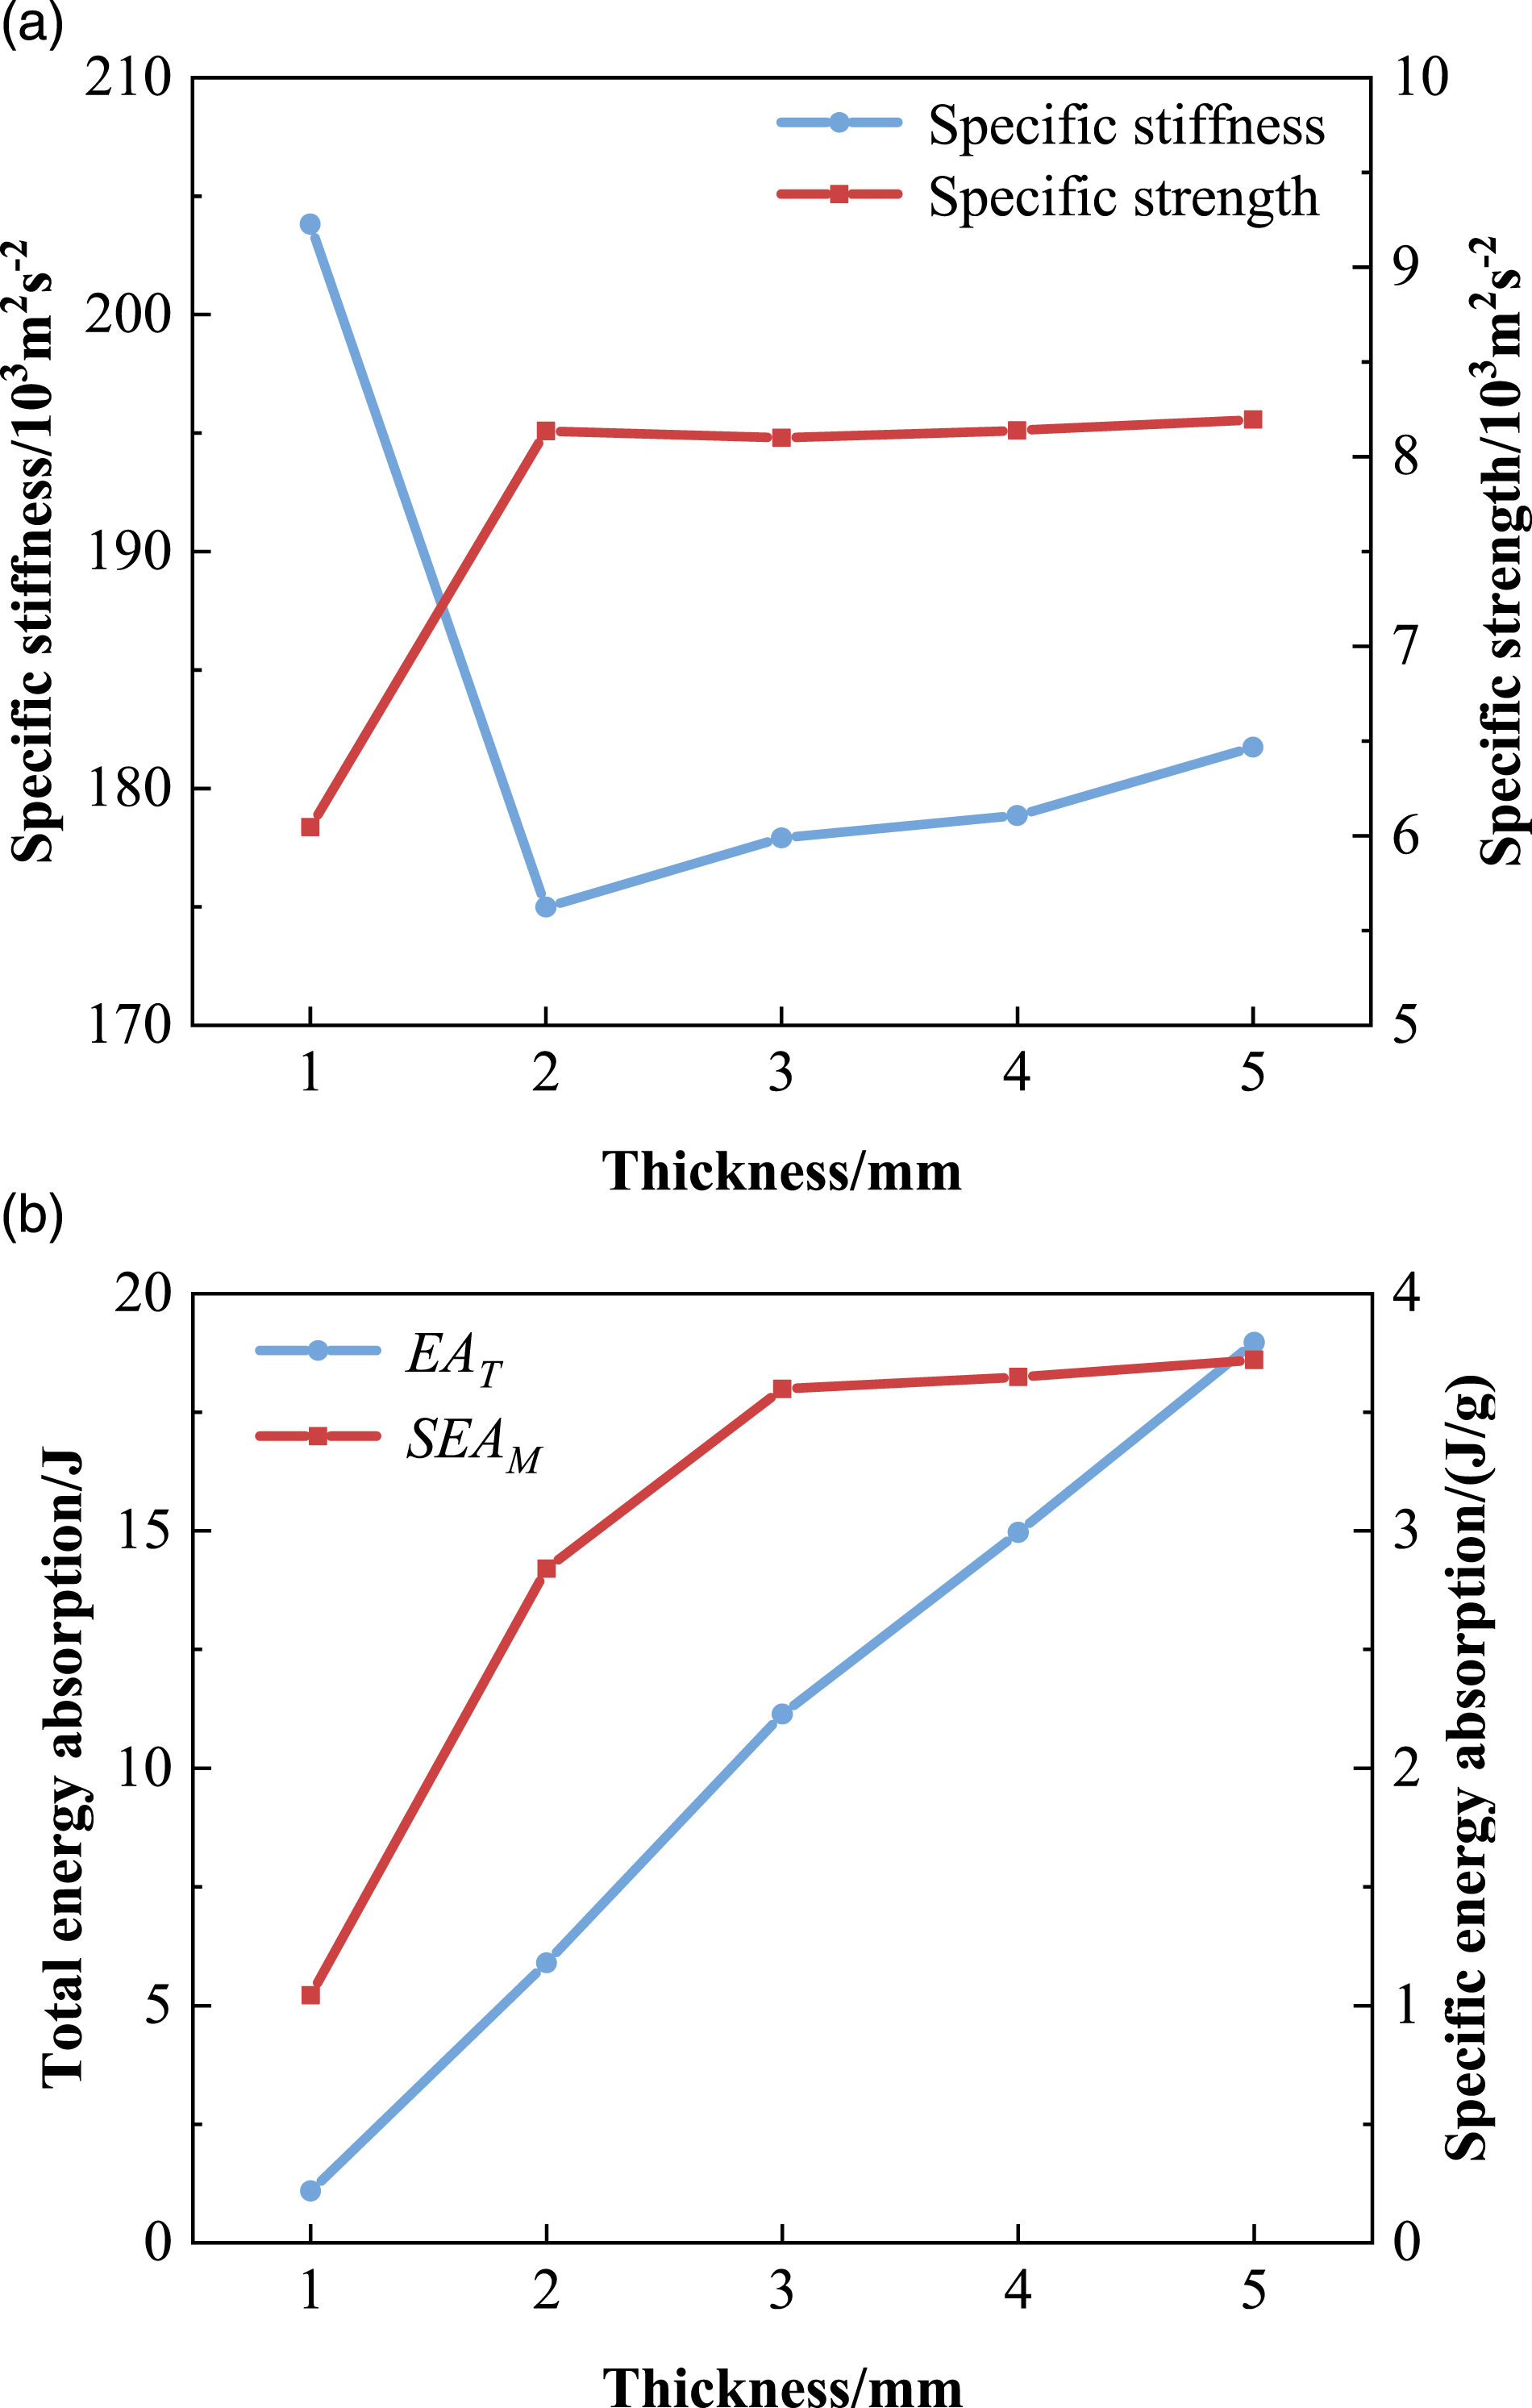
Compressive properties of structures with different thicknesses: (a) specific stiffness and specific strength, (b) total and specific energy absorptions.
Changing the inclination angles of the strut will also change the relative density of the unit cell, which in turn affects the mechanical properties and failure behavior of the structure. PA12 Y-type lattice structures under compression with different relative densities were simulated by varying the strut inclination angle Stress–strain curves of structures with different inclination angles Deformation of structures with different relative densities at the complete failure stage: (a) 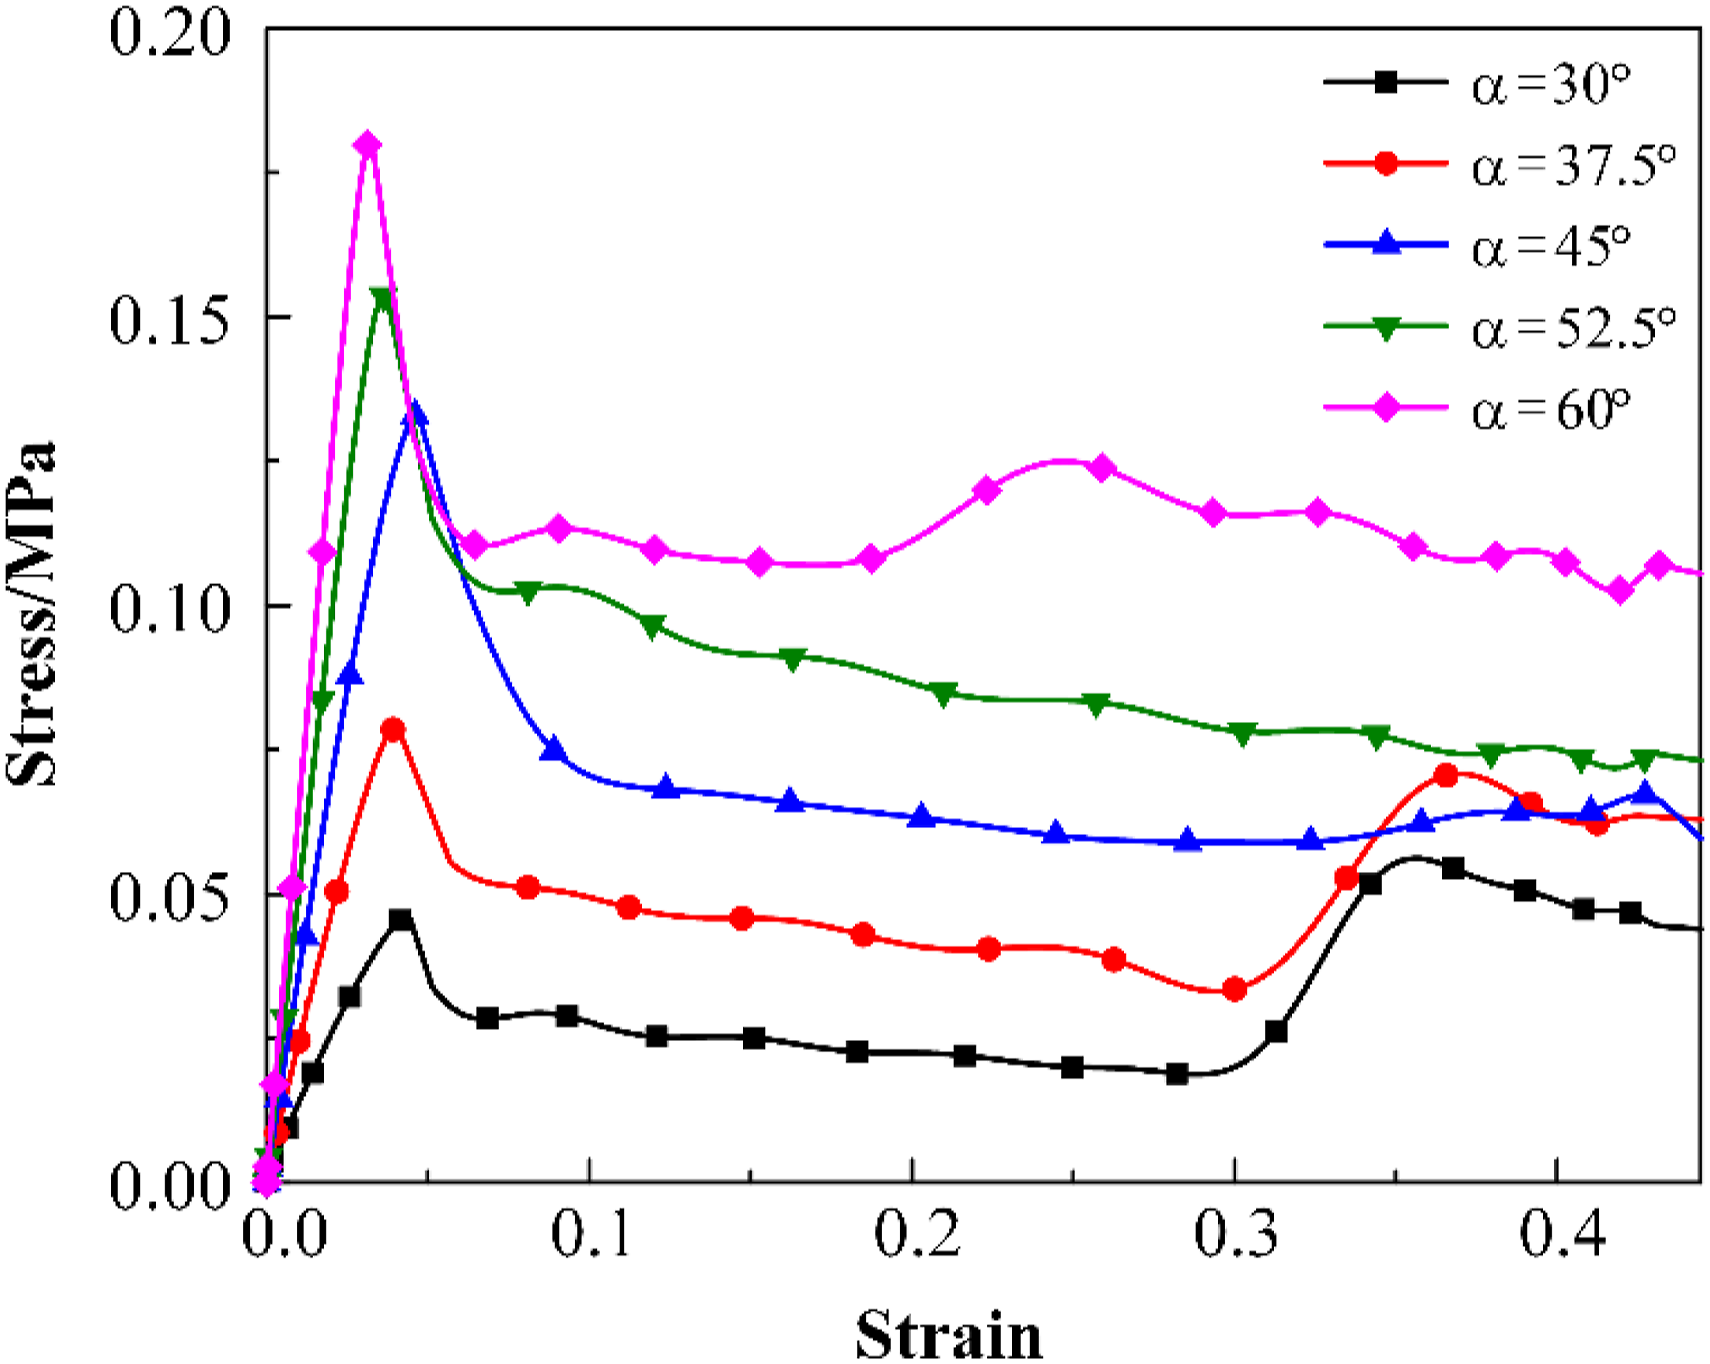
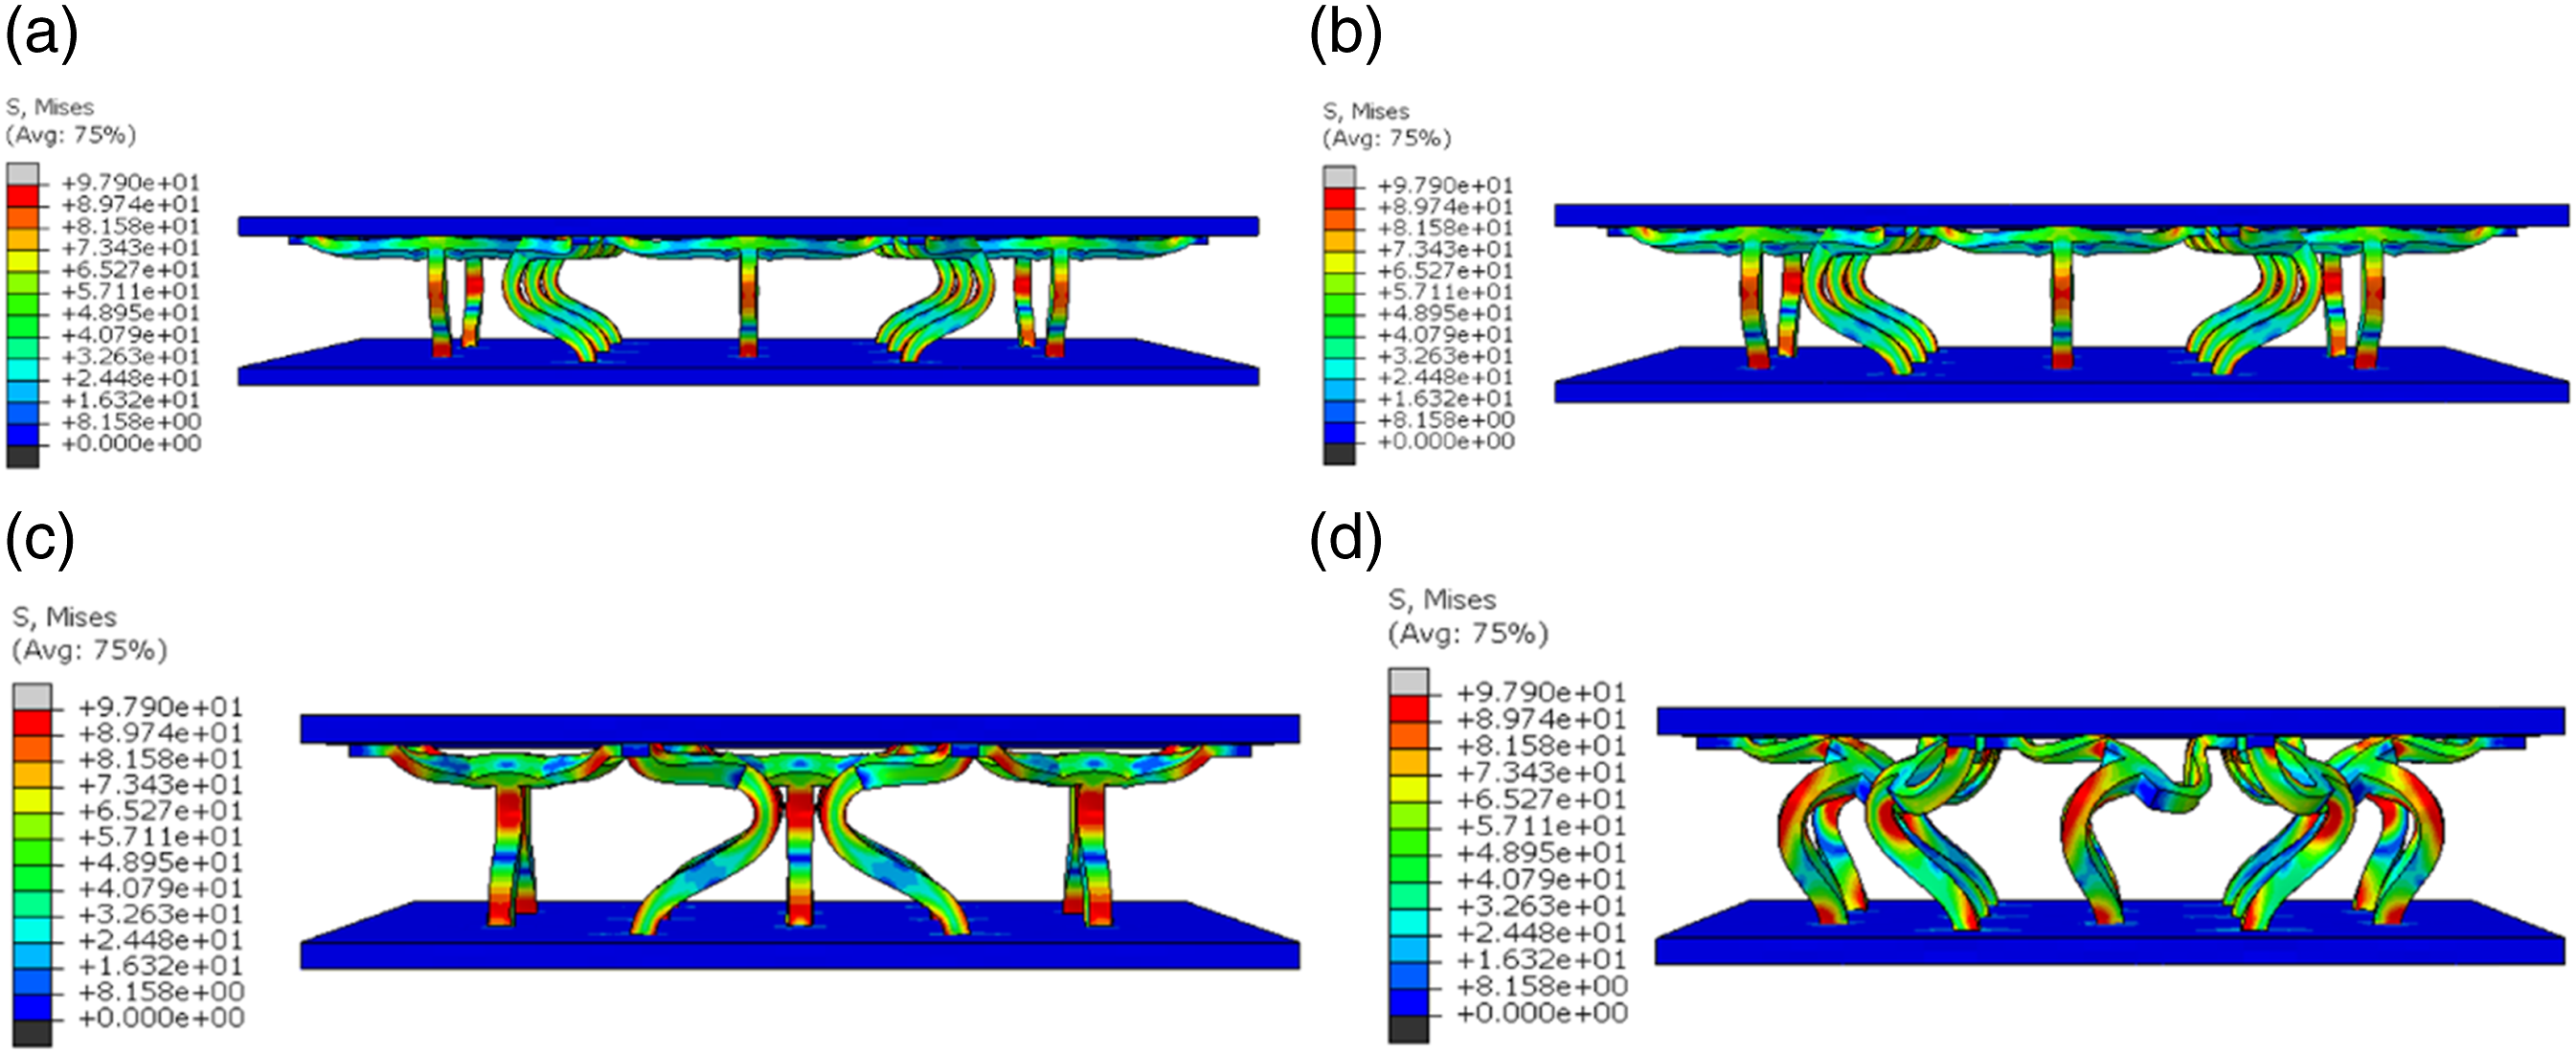
Figure 19 shows that the curves of the
Compressive properties of lattice structures with different inclination angles.
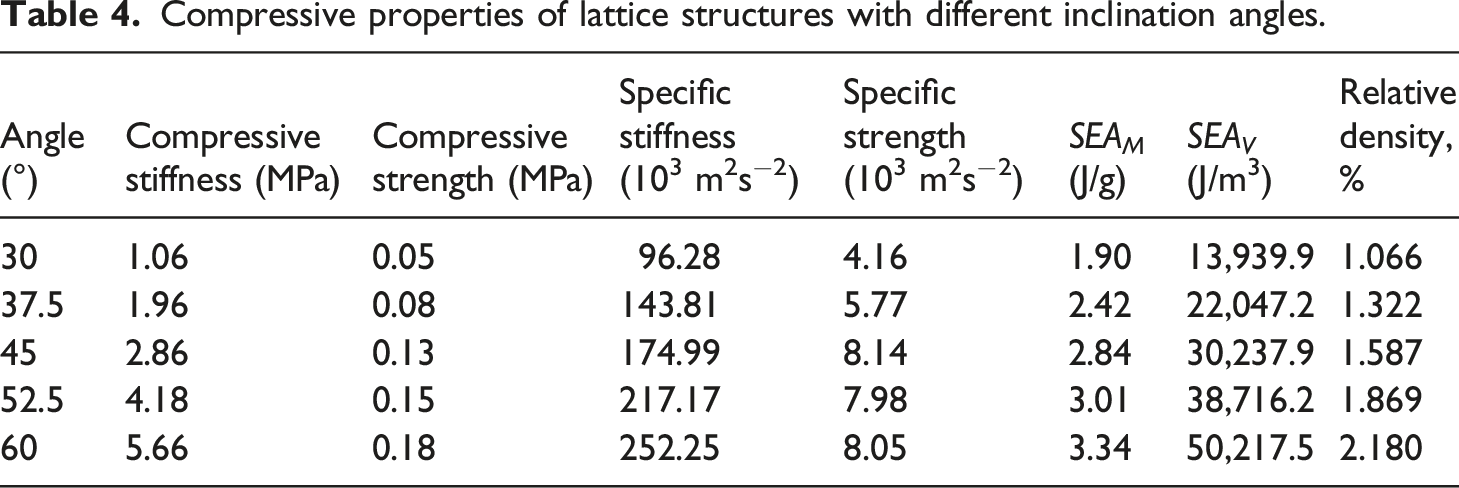
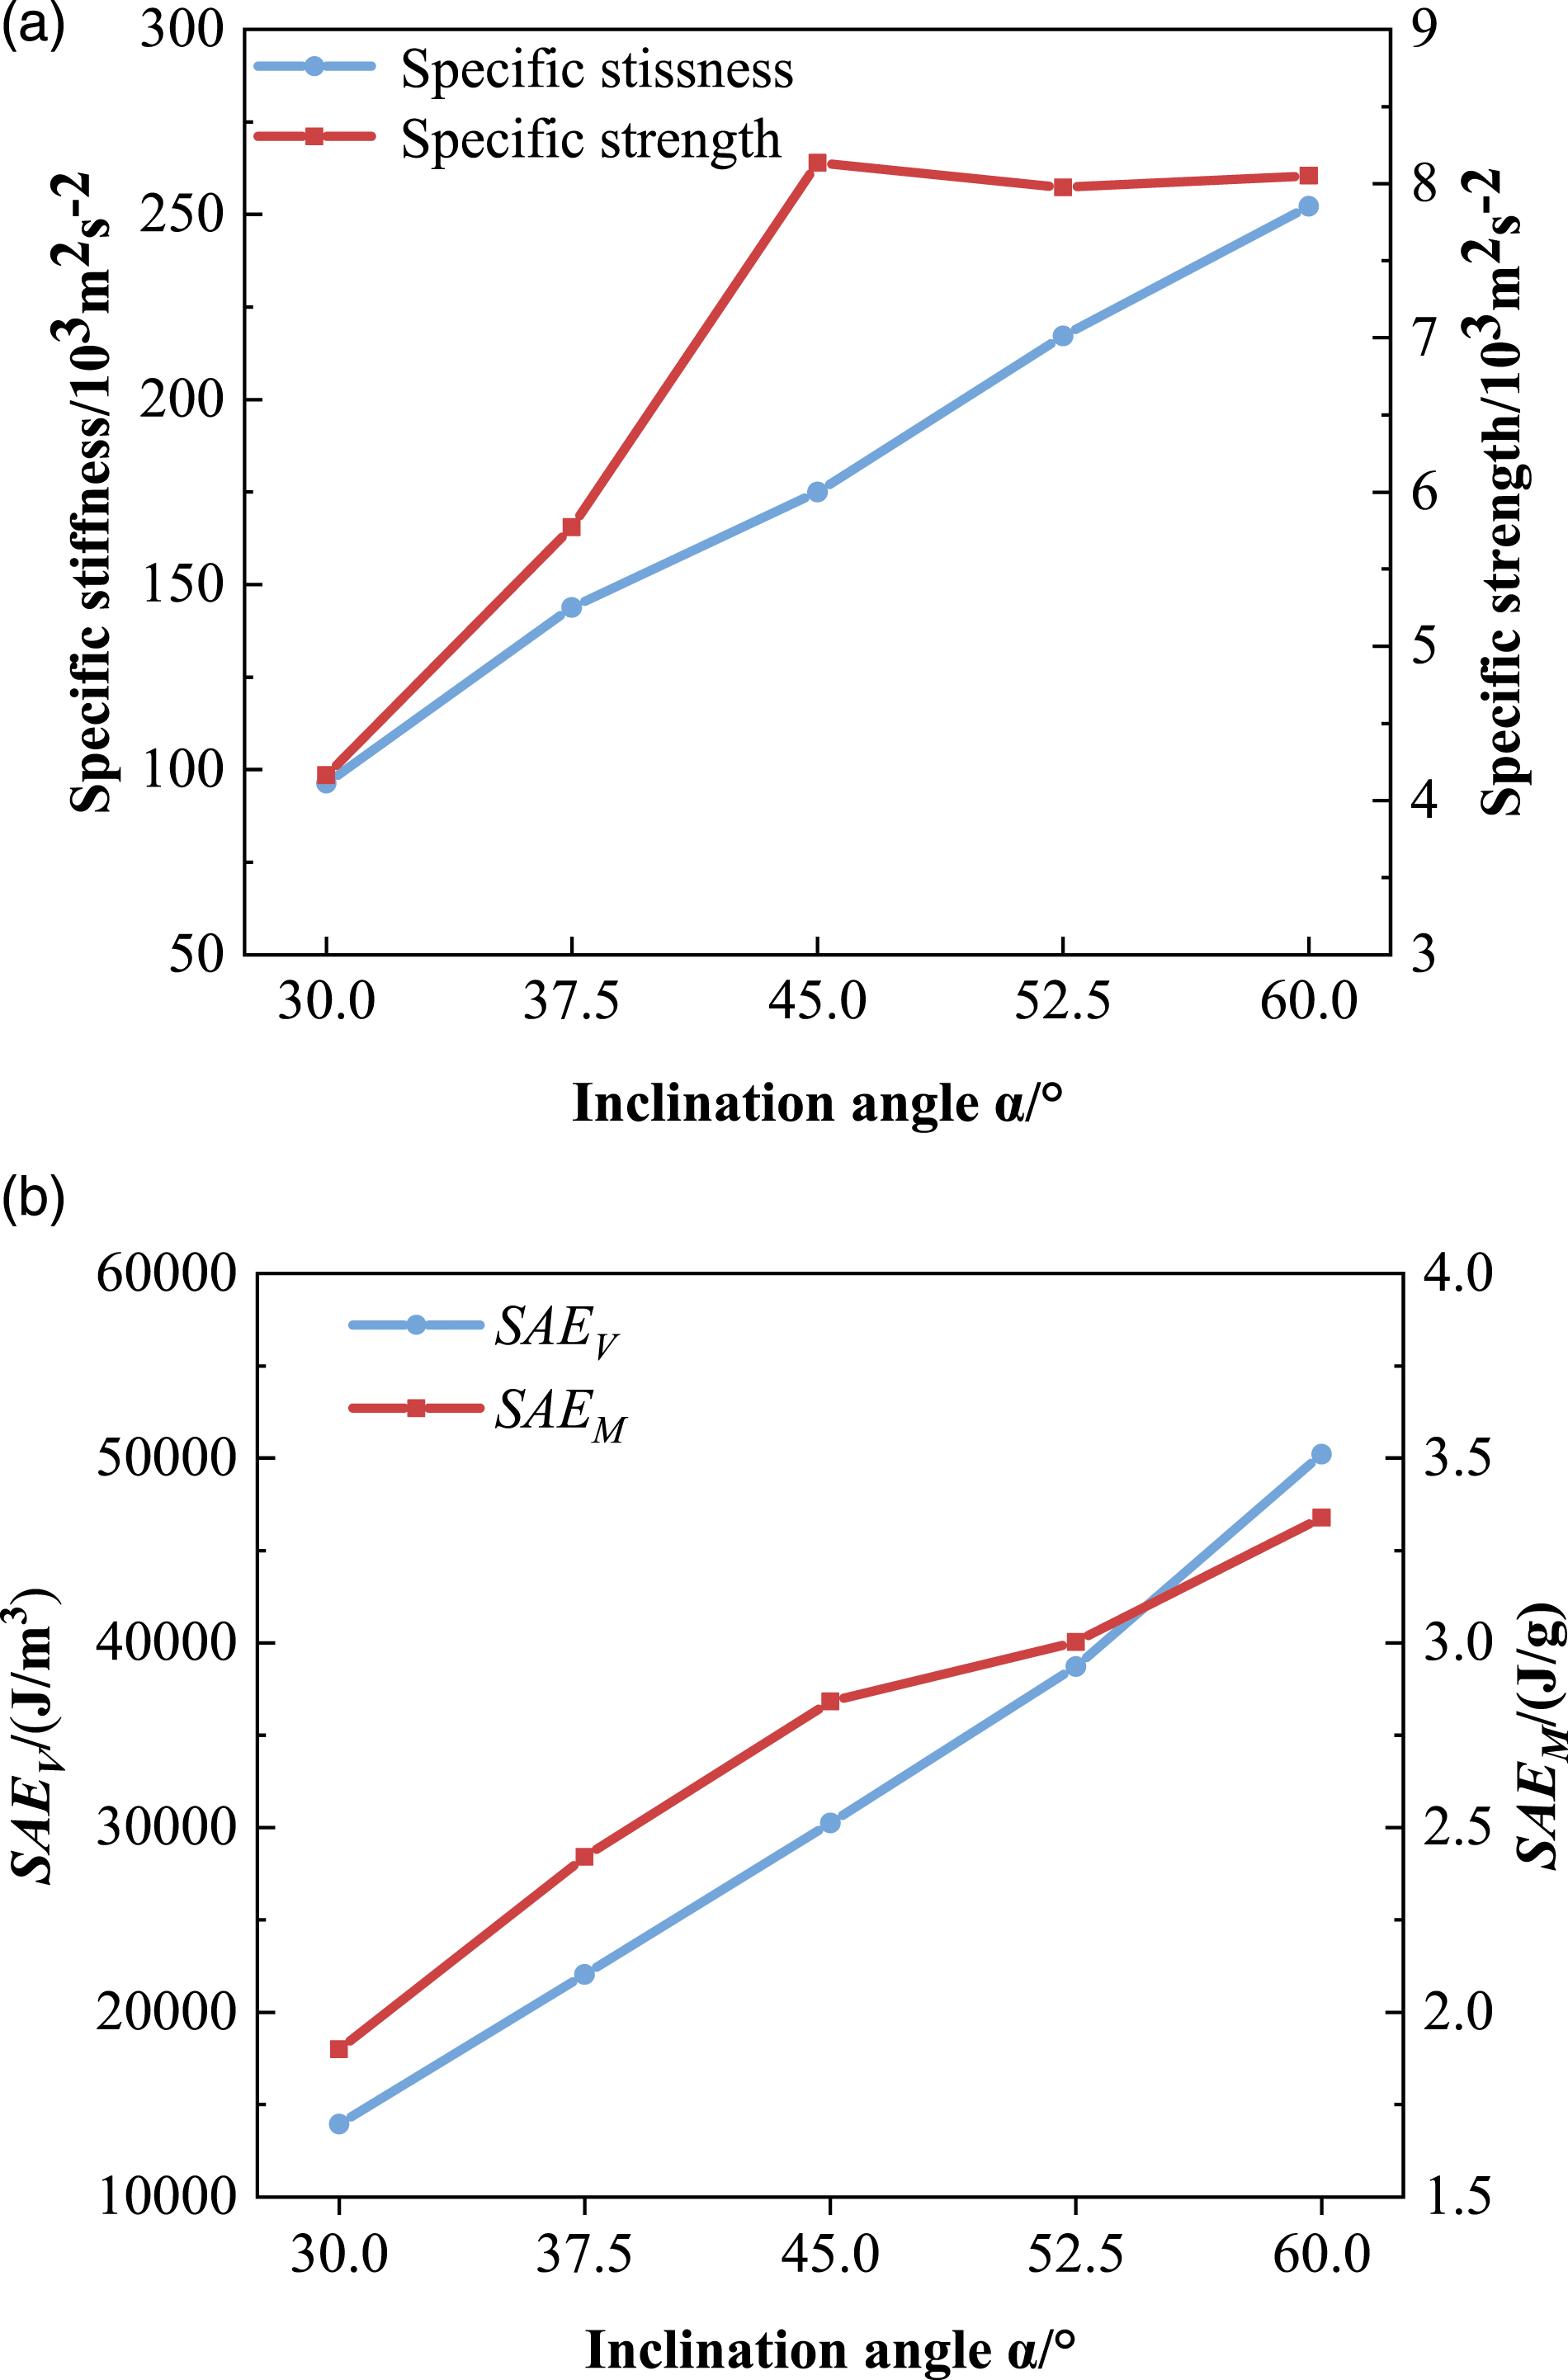
Compressive properties of structures with different inclination angles: (a) specific stiffness and strength, (b) specific energy absorptions.
Conclusions
In this study, a Y-type lattice structure with Y-shaped cores was designed based on a corrugated structure. PA12 specimens of the structure were fabricated using MJF 3D printing technology. Compressive experiments and finite element simulations were conducted to study and analyze the mechanical properties and failure behavior of the new structure. The numerical results are in good agreement with the experimental results. The finite element method was used to investigate the compressive properties and energy absorption capacity of the Y-type lattice structure at different relative densities obtained by changing the thickness and inclination angle of the struts. The results showed that the compressive strength, compressive stiffness, and energy absorption capacity increased with the relative density, and the relative density had a significant effect on the mechanical behavior of the lattice structure. Moreover, different methods of changing the relative density resulted in different effects on the specific strength and specific stiffness of the structure under compression. These results provide insight into the future applications and design of PA12 Y-type lattice structures.
Footnotes
Declaration of conflicting interests
The author(s) declared no potential conflicts of interest with respect to the research, authorship, and/or publication of this article.
Funding
The author(s) disclosed receipt of the following financial support for the research, authorship, and/or publication of this article: The present work is supported by the Natural Science Foundation of Shandong Province under Grant No. ZR2020ME129, the Open Fund of National Innovation Institute of Lightweight Technology & Equipment (111902Q-B), the National Natural Science Foundation of China under Grant No. 51905121, and by HIT Wuhu Robot Technology Research Institute.