
Abstract
This study focuses on reducing pollution and promoting sustainability by exploring the use of fly ash (FA), an industrial byproduct, in polymer composites through rotational molding. By incorporating FA into a polymer matrix, the research evaluates the performance of these composites. Results show that the tensile strength increased slightly from 16.54 MPa for pure LLDPE to 17.2 MPa with 5% FA but decreased to 13.5 MPa at 10% FA. The modulus significantly improved, rising from 5.1% to 31.3% with 5% to 20% FA content. Hardness also increased, with a maximum rise of 10.25% at 5% FA and 6.2% at 10% FA. However, elongation at break, bending, and impact strength decreased with higher FA content. The density of the composites increased with up to 10% FA, indicating effective integration of FA particles. These findings demonstrate that FA can be successfully used to develop polymer composites in rotational molding, supporting both environmental sustainability and innovative production practices.
Introduction
In recent years, concerns about environmental pollution have increased due to its harmful effects on humans and animals. 1 This has led to a focus on developing eco-friendly technologies to reduce pollution, conserve raw materials, and enhance recycling. There is a growing trend to convert industrial waste into valuable resources, reflecting a broader move towards sustainability.2,3 Energy, essential for transportation, industry, and more, is derived from various sources, including nuclear, coal, hydroelectric, solar, and wind.4,5 In India, approximately 50.7% of the power is generated from coal-based plants. 6
FA, a byproduct of coalfired power stations, has been identified as a contributor to pollution affecting land, water, and air. Despite these environmental concerns, it has recently attracted considerable interest due to its potential applications in various industries such as hydro power sector, cement, roads & flyovers etc.
4
Every year, the volume of FA produced by India’s power plants continues to grow. The Ministry of Power reports that in the first half of the year 2021–22, India produced 133.9 million tons of FA and 142.07 million tons in 2022–23. In the year 2022–23, out of the 142.07 million tons of FA produced, Figure 1 illustrates how it was utilized across various sectors, including in the production of cement, bricks & tiles, and in the construction of roads & flyovers.
7
Utilization of FA during 1st half of the year 2022–23.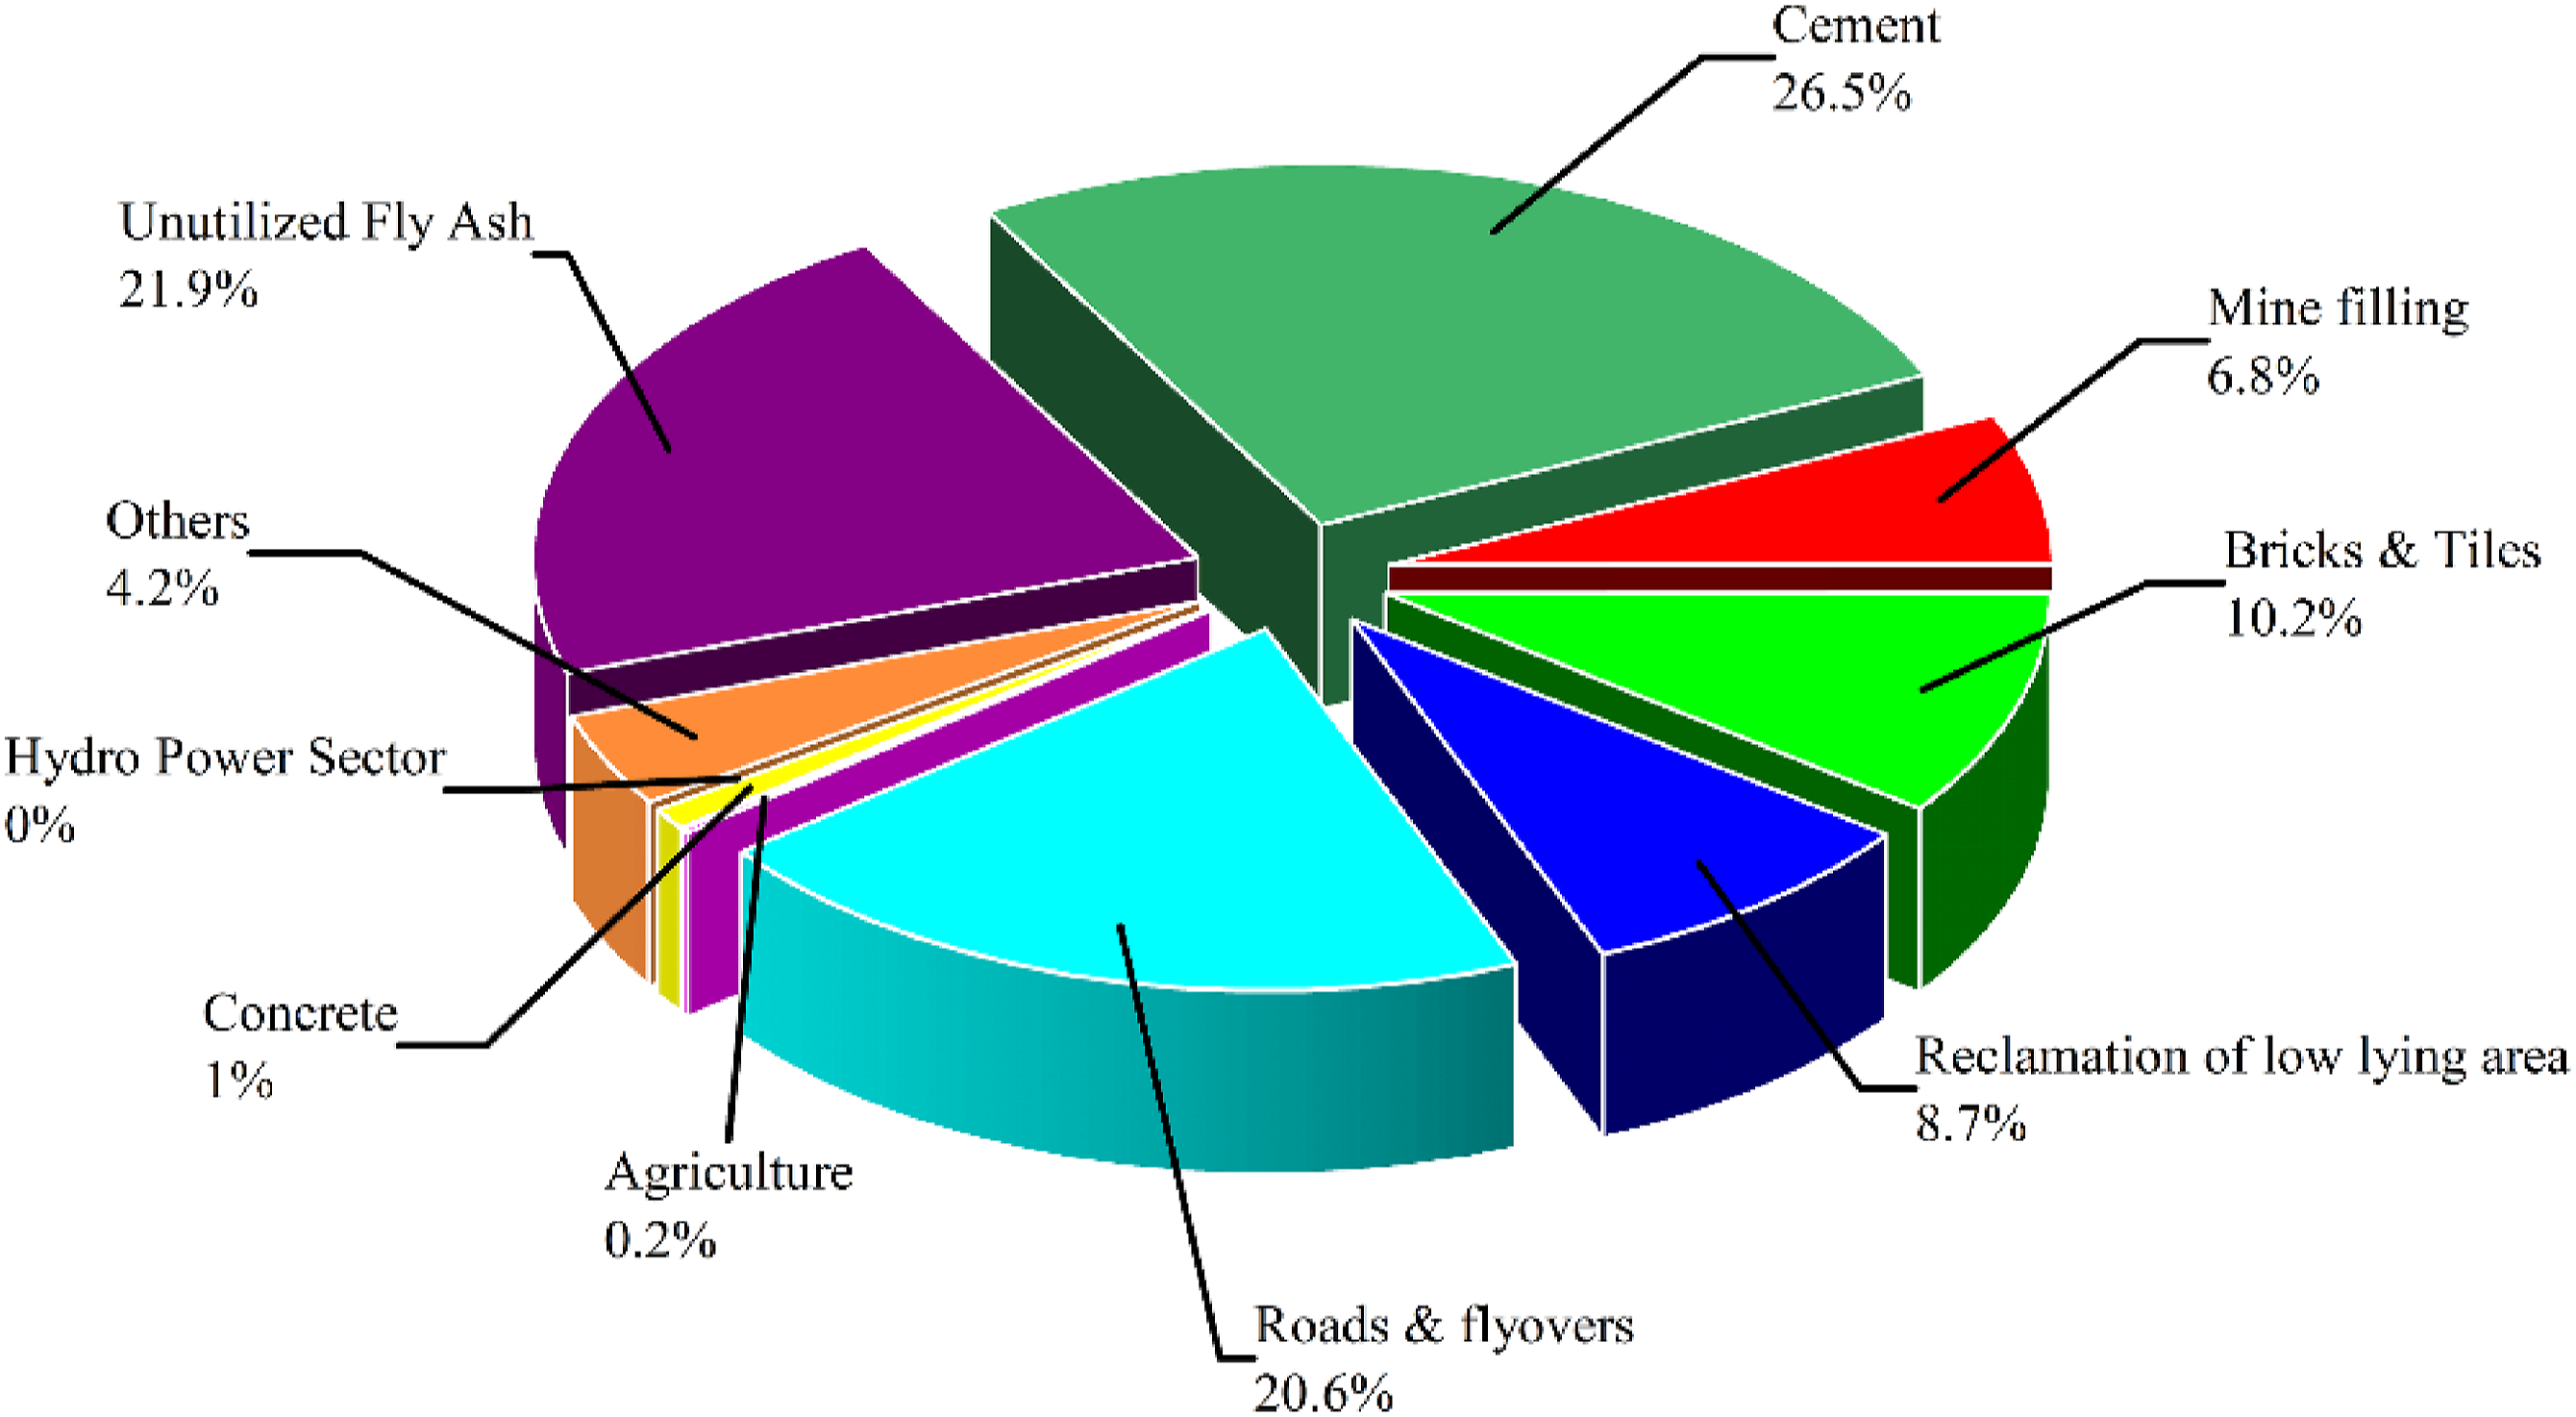
Different compositions of FA.
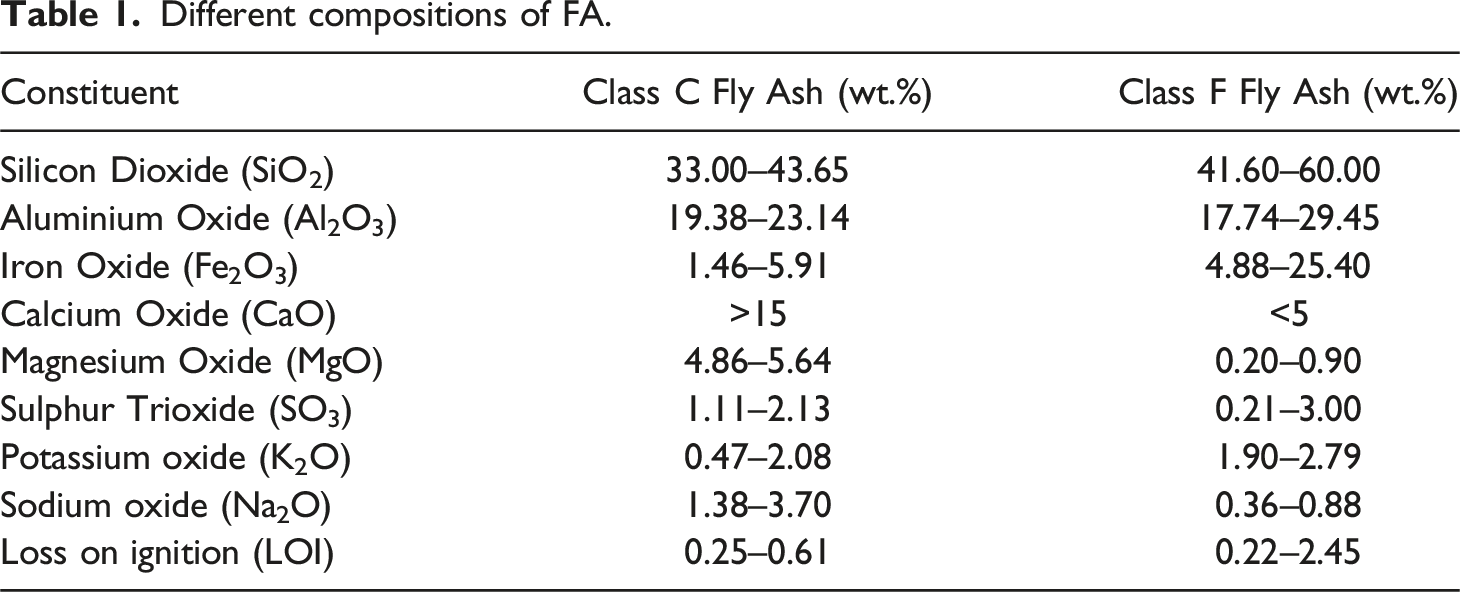
The data indicates that FA is composed of a range of inorganic compounds, extensively used by researchers as fillers to fabricate thermoplastic composites through various processing methods. Additionally, significant research has been conducted to investigate how these fillers influence the properties of polymers.16,17 Previous studies have examined the effects of utilization of natural filler like bamboo, 18 Azadirachta Indica (AI) wood,19,20 Jute 21 etc. and inorganic fillers such as calcium carbonate, 22 mica, 23 quartz flour, 24 and kaolin. 25 Likewise, silicon dioxide (SiO2) is extensively employed as an additive in polymer matrices owing to its outstanding chemical and hardness durability, along with its lower dielectric constant and low thermal expansions’ coefficient. 26 Several studies have highlighted the significant potential of SiO2 nanoparticles in improving the wear resistance of the composites.27,28 Another substance, aluminum oxide (Al2O3), also known as alumina, is characterized by its hardness and higher value of modulus. Incorporating alumina particles to PVA (polyvinyl alcohol) can significantly enhance its thermal and mechanical properties. 29 The properties of particulate polymer composites can vary widely due to the diverse range of polymer and additives used and the differences in manufacturing methodologies, making it difficult to directly compare results reported in individual studies. The incorporation of FA in polymer composites could offer considerable advantages to the plastics industry due to its significant volume and properties. Although various studies have utilized FA as a filler, these have applied it in diverse manufacturing processes and with different types of polyethylene. In the plastic industry, where demand is application-driven, selecting the appropriate type of filler depends on the specific strength and performance requirements of the end product.
While various techniques like injection molding, extrusion, and blow molding are commonly used in manufacturing polymer composites, this study specifically focuses on the rotational molding process, chosen for its unique advantages, such as producing stress-free, seamless products with minimal material wastage. This study investigates the use of fly ash (FA) as an inorganic additive with LLDPE to assess its potential for creating environmentally sustainable composites specifically designed for rotational molding. Although there have been advancements in using FA in various polymer processes, its impact on the mechanical properties of composites within rotational molding remains underexplored. This research aims to bridge that gap by examining how varying FA/LLDPE compositions influence the morphological structure and mechanical properties of composites specifically in the context of the rotational molding process.
Experimental details
Raw materials
Greenage Industries’ R36A050U grade of linear low-density polyethylene (LLDPE), produced in Ahmedabad, India, was selected as the matrix for this study. This specific polymer’s melt flow index (MFI) is 4.4 g/10 min., measured under the conditions outlined in ASTM D1238 at 190°C and 2.16 kg pressure. In Figure 2(a), the LLDPE crystals are clearly visible, exhibiting soft edges and irregular shapes. Furthermore, its density was specified as 0.936 g/cm3. Raw materials: (a) Pure LLDPE Powder; (b) FA Particles; (c) Dry Blended Mixture of LLDPE/FA (MPC 5).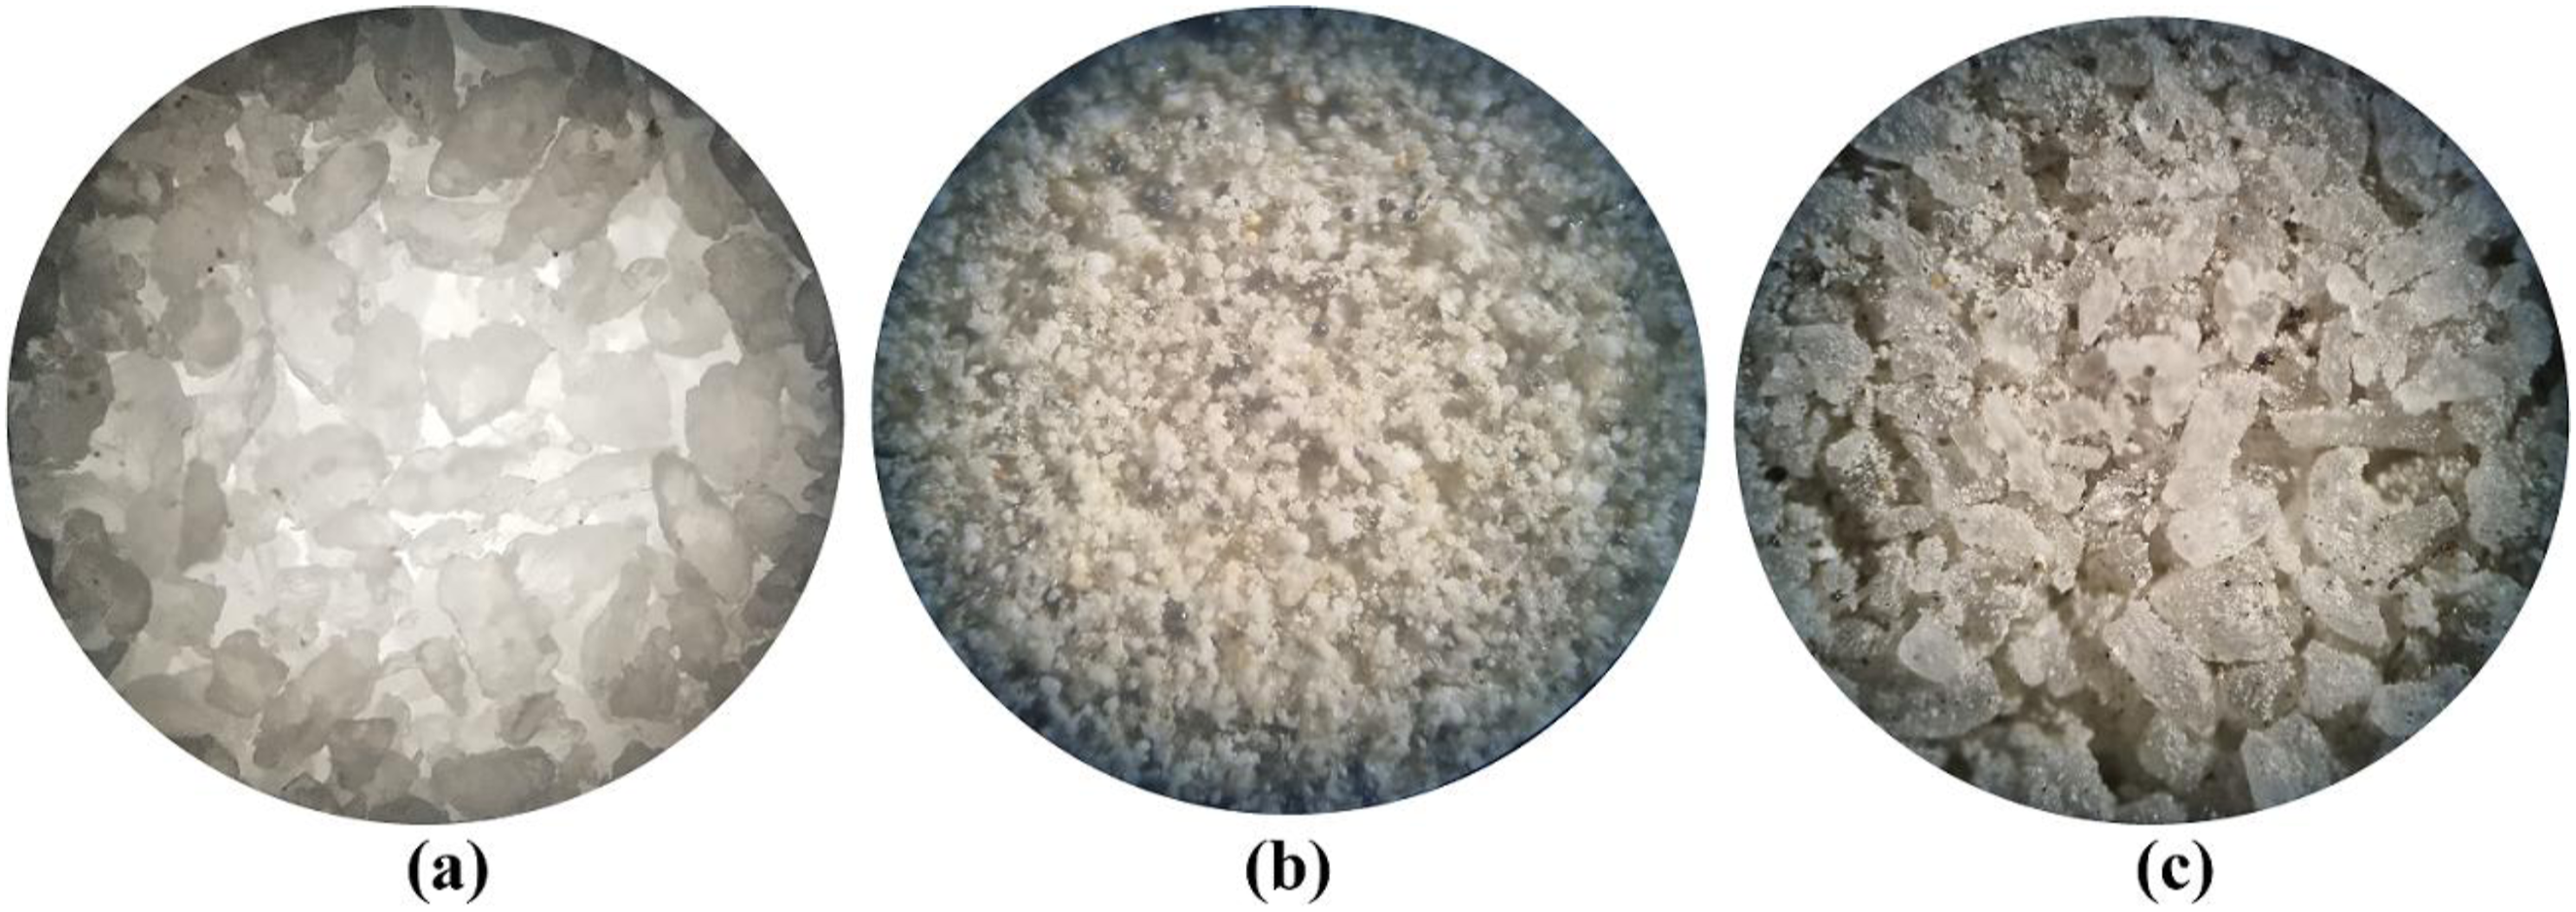
The filler used in this study is type C FA, produced from sub-bituminous coal sourced from the Suratgarh Super Critical Thermal Power Station, Suratgarh, Rajasthan. The study aims to evaluate how fly ash particles, specifically in the size range of 20 to 30 µm, impact the mechanical properties of LLDPE composites when used at varying concentrations (0 to 25%). The composition details of Class C FA are shown in Table 1. This investigation deliberately left the raw FA particles untreated with coupling agents to determine their effect on the polymer. As observed in Figure 2(b), FA particles are spherical, a shape formed during the burning process. The tiny, black spherical particles are primarily composed of carbon.
Rotational molding machine & its parameters
Figure 3 depicts the rotational molding machine utilized in this study. The machine is equipped with a 28 kW electric oven and features a biaxially rotating mold with adjustable speeds ranging from 2 to 20 r/min for each axis. It is advisable to maintain a rotational speed ratio of 4:1 between the primary and secondary axes.30,31 It also includes two fans for air circulation to facilitate both heating and cooling. For the manufacturing process, a stainless-steel mold measuring 150 mm × 150 mm on the bottom face, with a height of 150 mm and a thickness of 5 mm, was employed. The mold is also designed with a 2-degree draft angle. Rotomolding machine.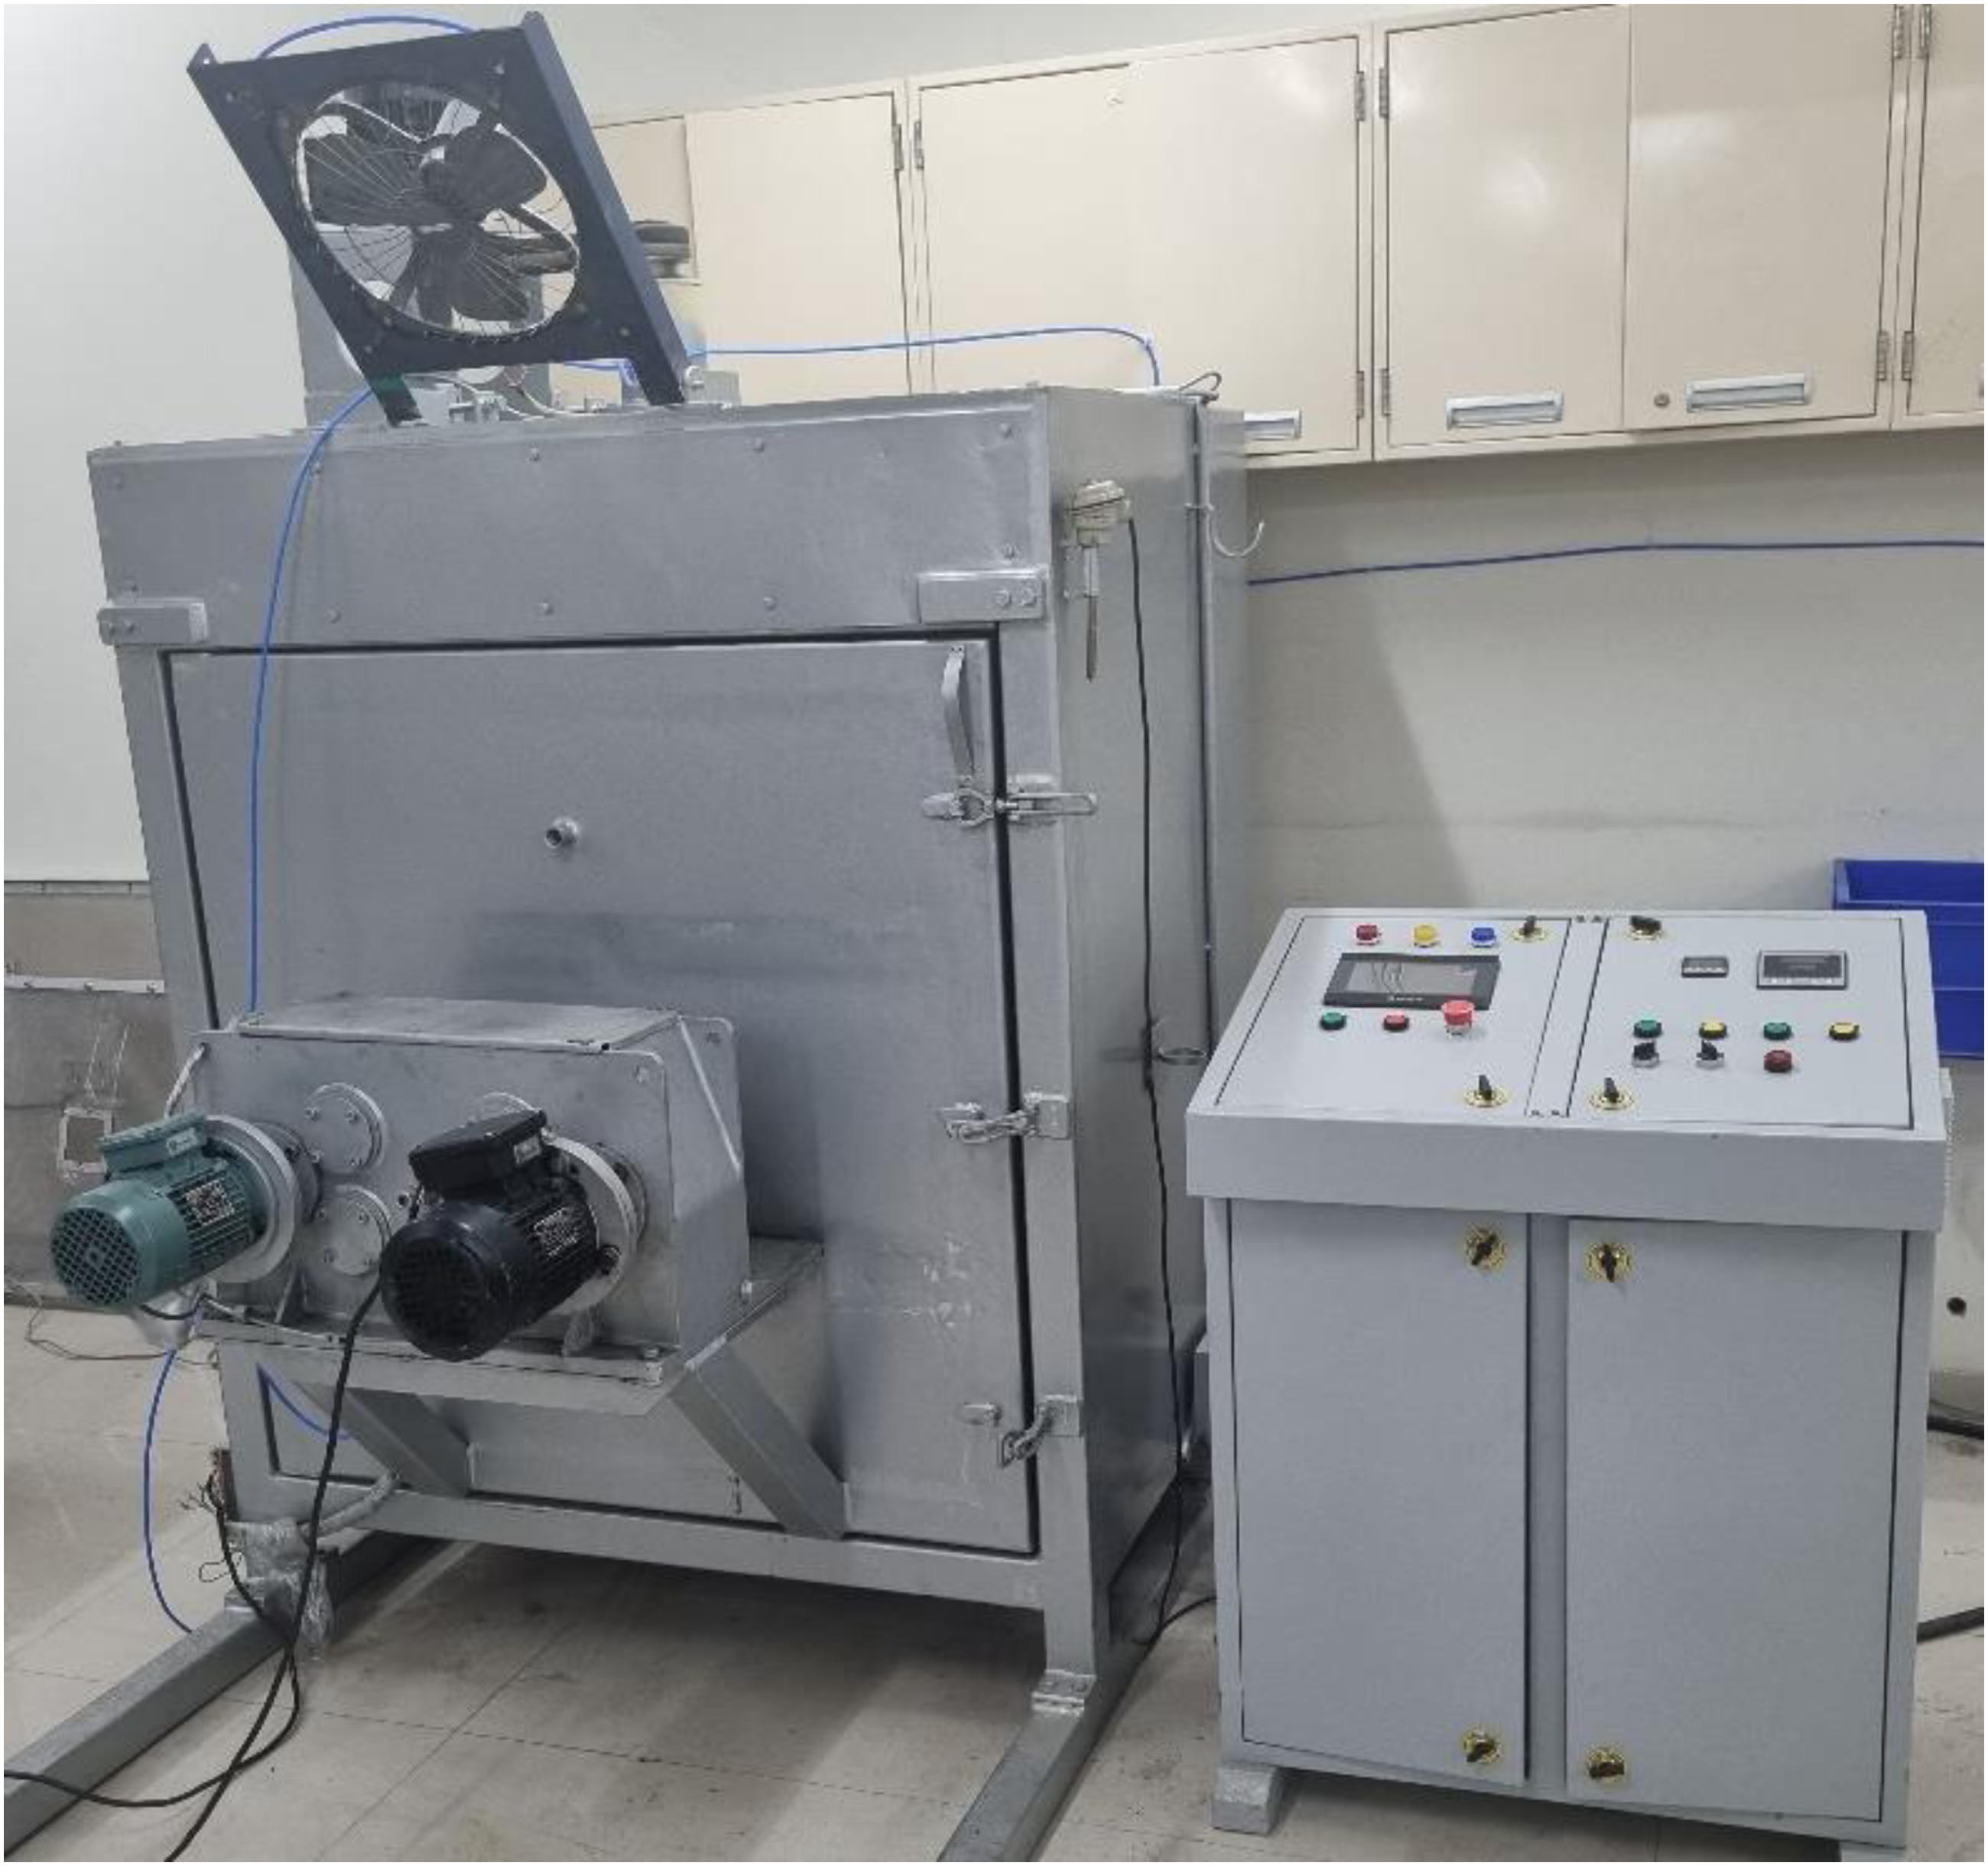
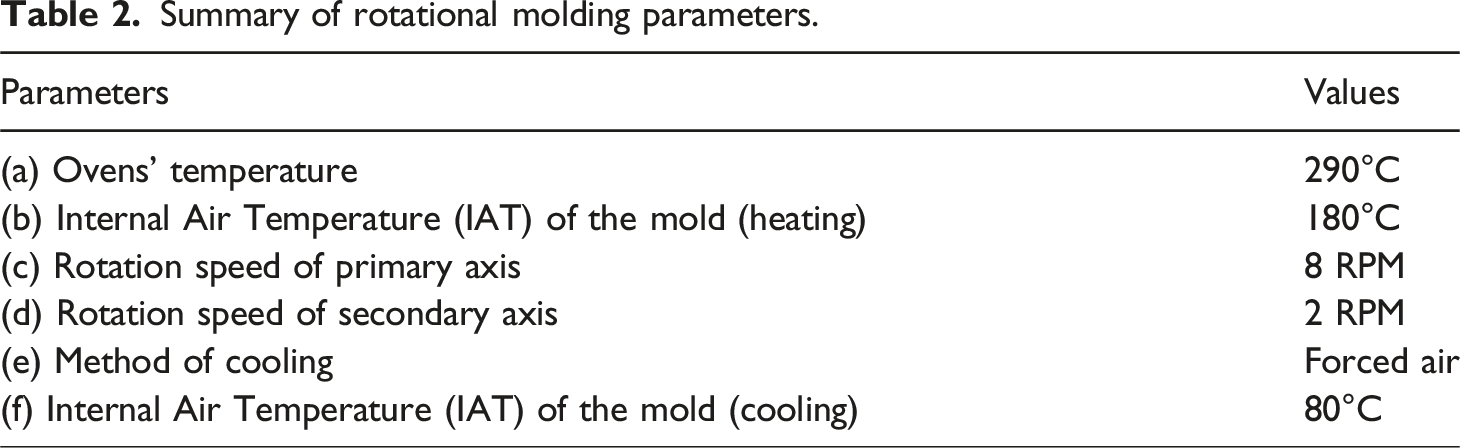
Summary of rotational molding parameters.
Fabrication process of composites
Masses of LLDPE/FA and correspondence samples codes.
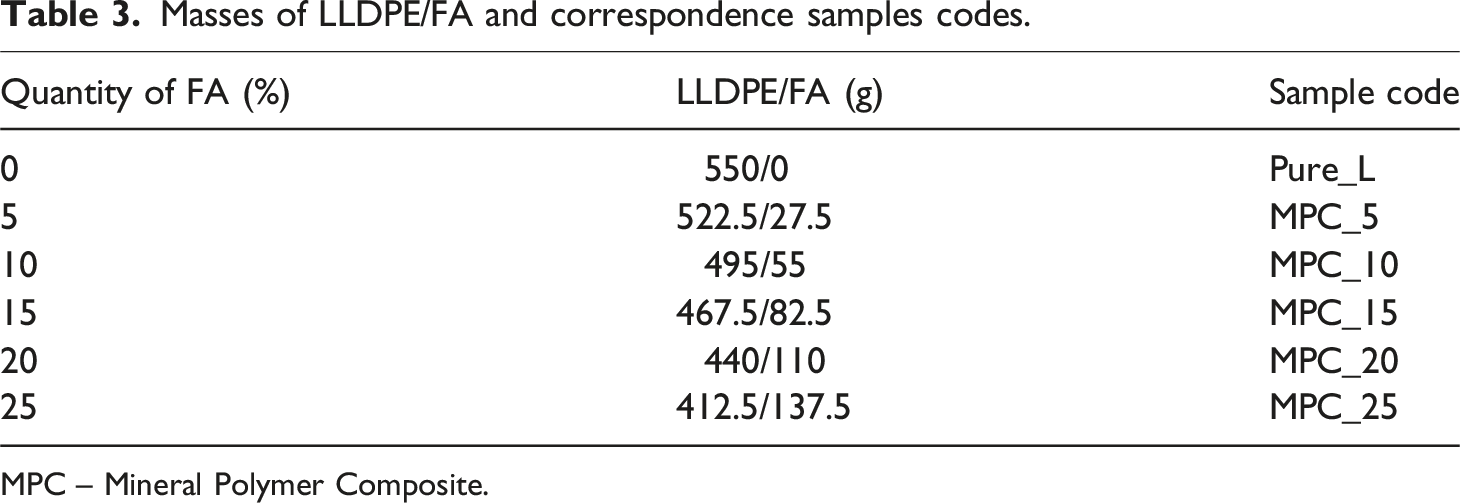
MPC – Mineral Polymer Composite.
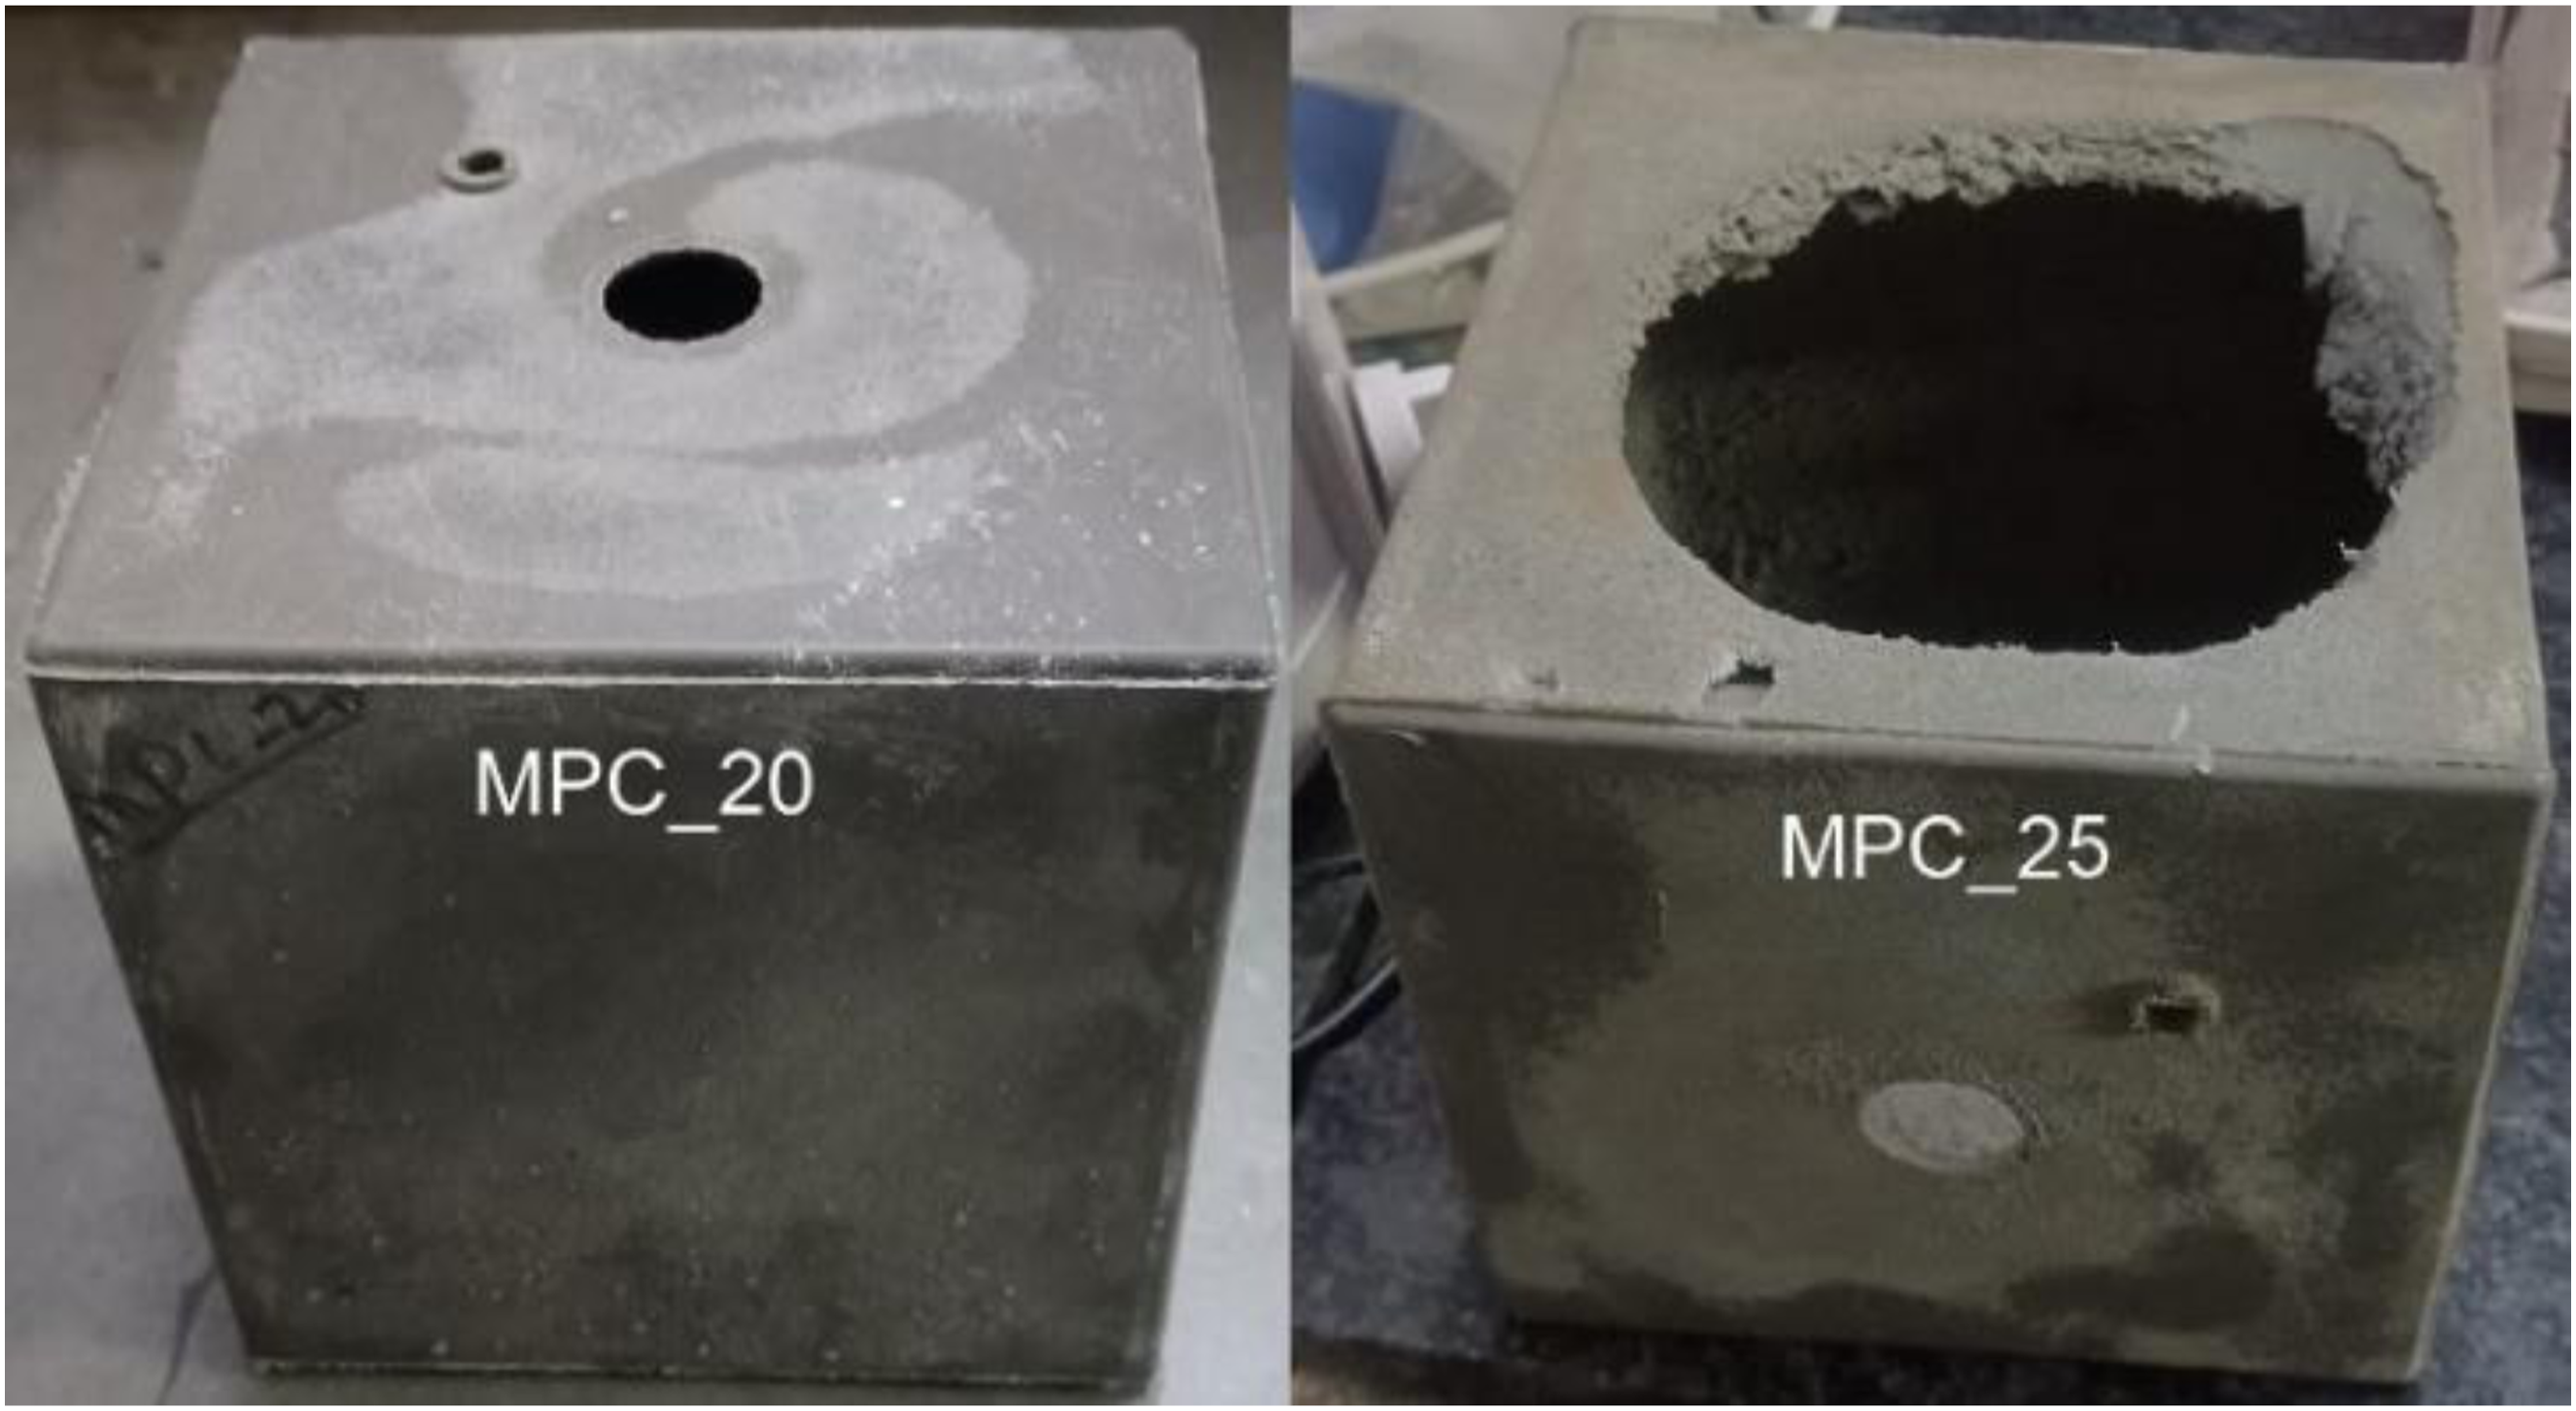
The thoroughly blended mixture is then poured into a mold that has been pretreated with silica oil spray to act as a release agent. The mold is sealed and placed in a 290°C oven, where it rotates biaxially at 2 RPM and 8 RPM for the primary and secondary axes, respectively, until the Internal Air Temperature (IAT) of the mold reaches 180°C. After cooling, the sample is removed. The resulting composite material, shown in Figures 4 and 5, has a grey hue that deepens with increased FA content. Notably, a composite with 25% FA did not form successfully due to the excessive amount of FA particles, as indicated in Figure 5. Various samples of hollow cubes (MPC 5, MPC 10, and MPC 15). Samples of hollow cubes with FA 20 wt.% (MPC 20%) & unsuccessful product with 25 wt.% (MPC 25).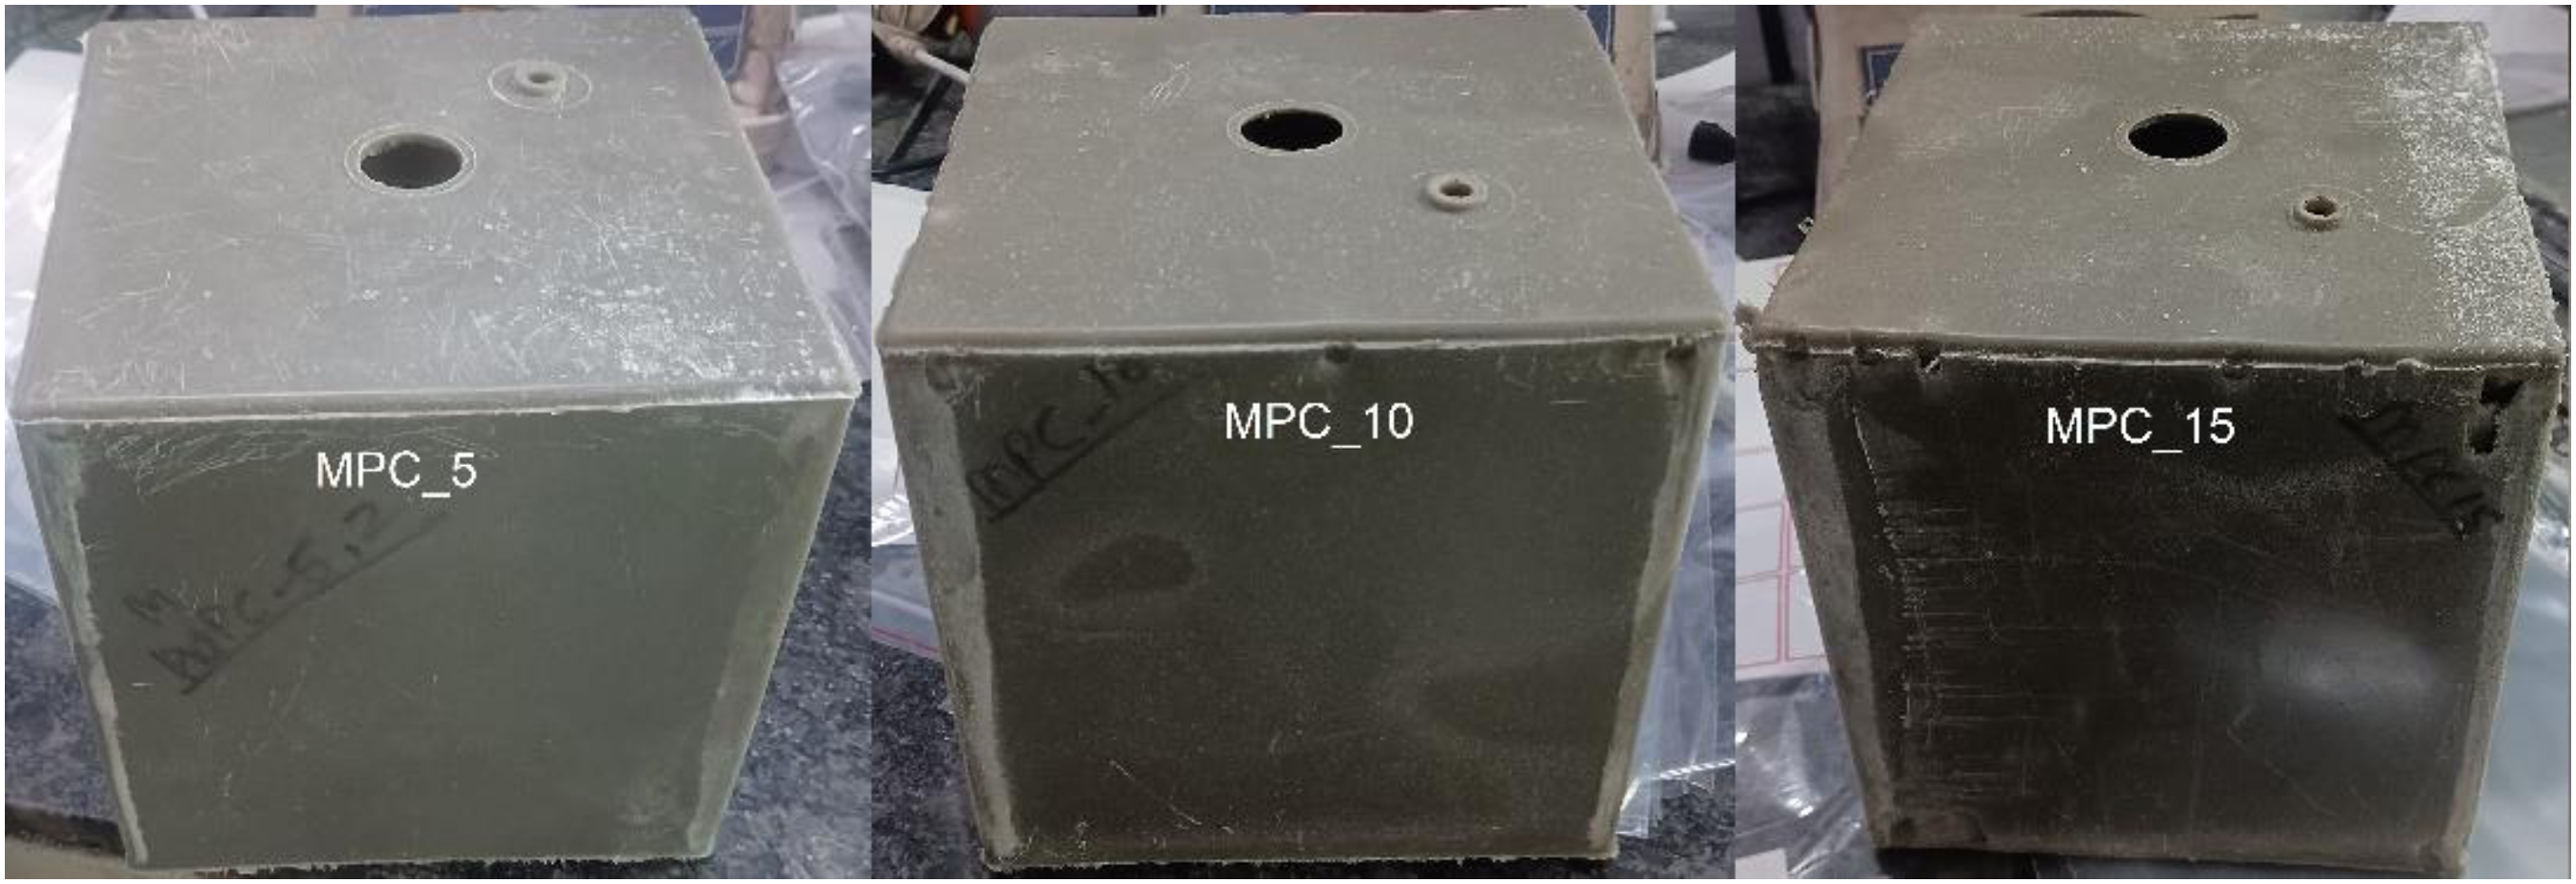
Characterization
To determine the density of each LLDPE/FA composite, the volumetric displacement method was employed in accordance with the guidelines specified in ASTM D792. The specimen was dried in an oven for 24 hours at 103°C then it is cooled using a desiccator.
33
After that, the dry mass of the specimen was measured by weighing it before measuring its volume by submerging it into distilled water. Afterward, the density is calculated by finding the ratio of the dry mass to its volume. Similarly, the quantity of water absorption by each specimen was calculated using ASTM D590 standards. The specimens underwent almost similar process where it was first oven-dried for 24 hours at 50°C, then cooled using a desiccator. Following this, the dry mass was promptly measured, after which the specimen was submerged in distilled water for the next 24 hours. After removing the water, a dry cloth was used to wipe off the specimen, and subsequently, the wet mass of the specimen was measured. Now, by subtracting the specimen’s dry mass from its wet mass, we can calculate the weight gain of the specimen after water immersion. By calculating the ratio of the weight gain by the specimen to its dry weight, we can determine the water absorption. Furthermore, the porosity of the materials (denoted by “P”) was estimated by equation as below: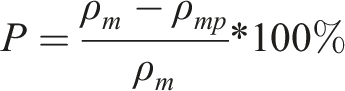
High-resolution imaging of surface morphology was performed using scanning electron microscopy (SEM) at 10 kV on a MIRA3 TESCAN field-emission FESEM equipped with energy dispersive X-ray microanalysis (EDX). Operating at 20 kV ensures optimal electron beam penetration and interaction with the sample, facilitating in-depth morphological scrutiny on a microscopic scale. EDX analysis is employed for the chemical compositions of the FA particles. Surface analysis via SEM was performed on rotomolded objects. Before analysis, samples were prepared from the object and subsequently underwent gold coating.
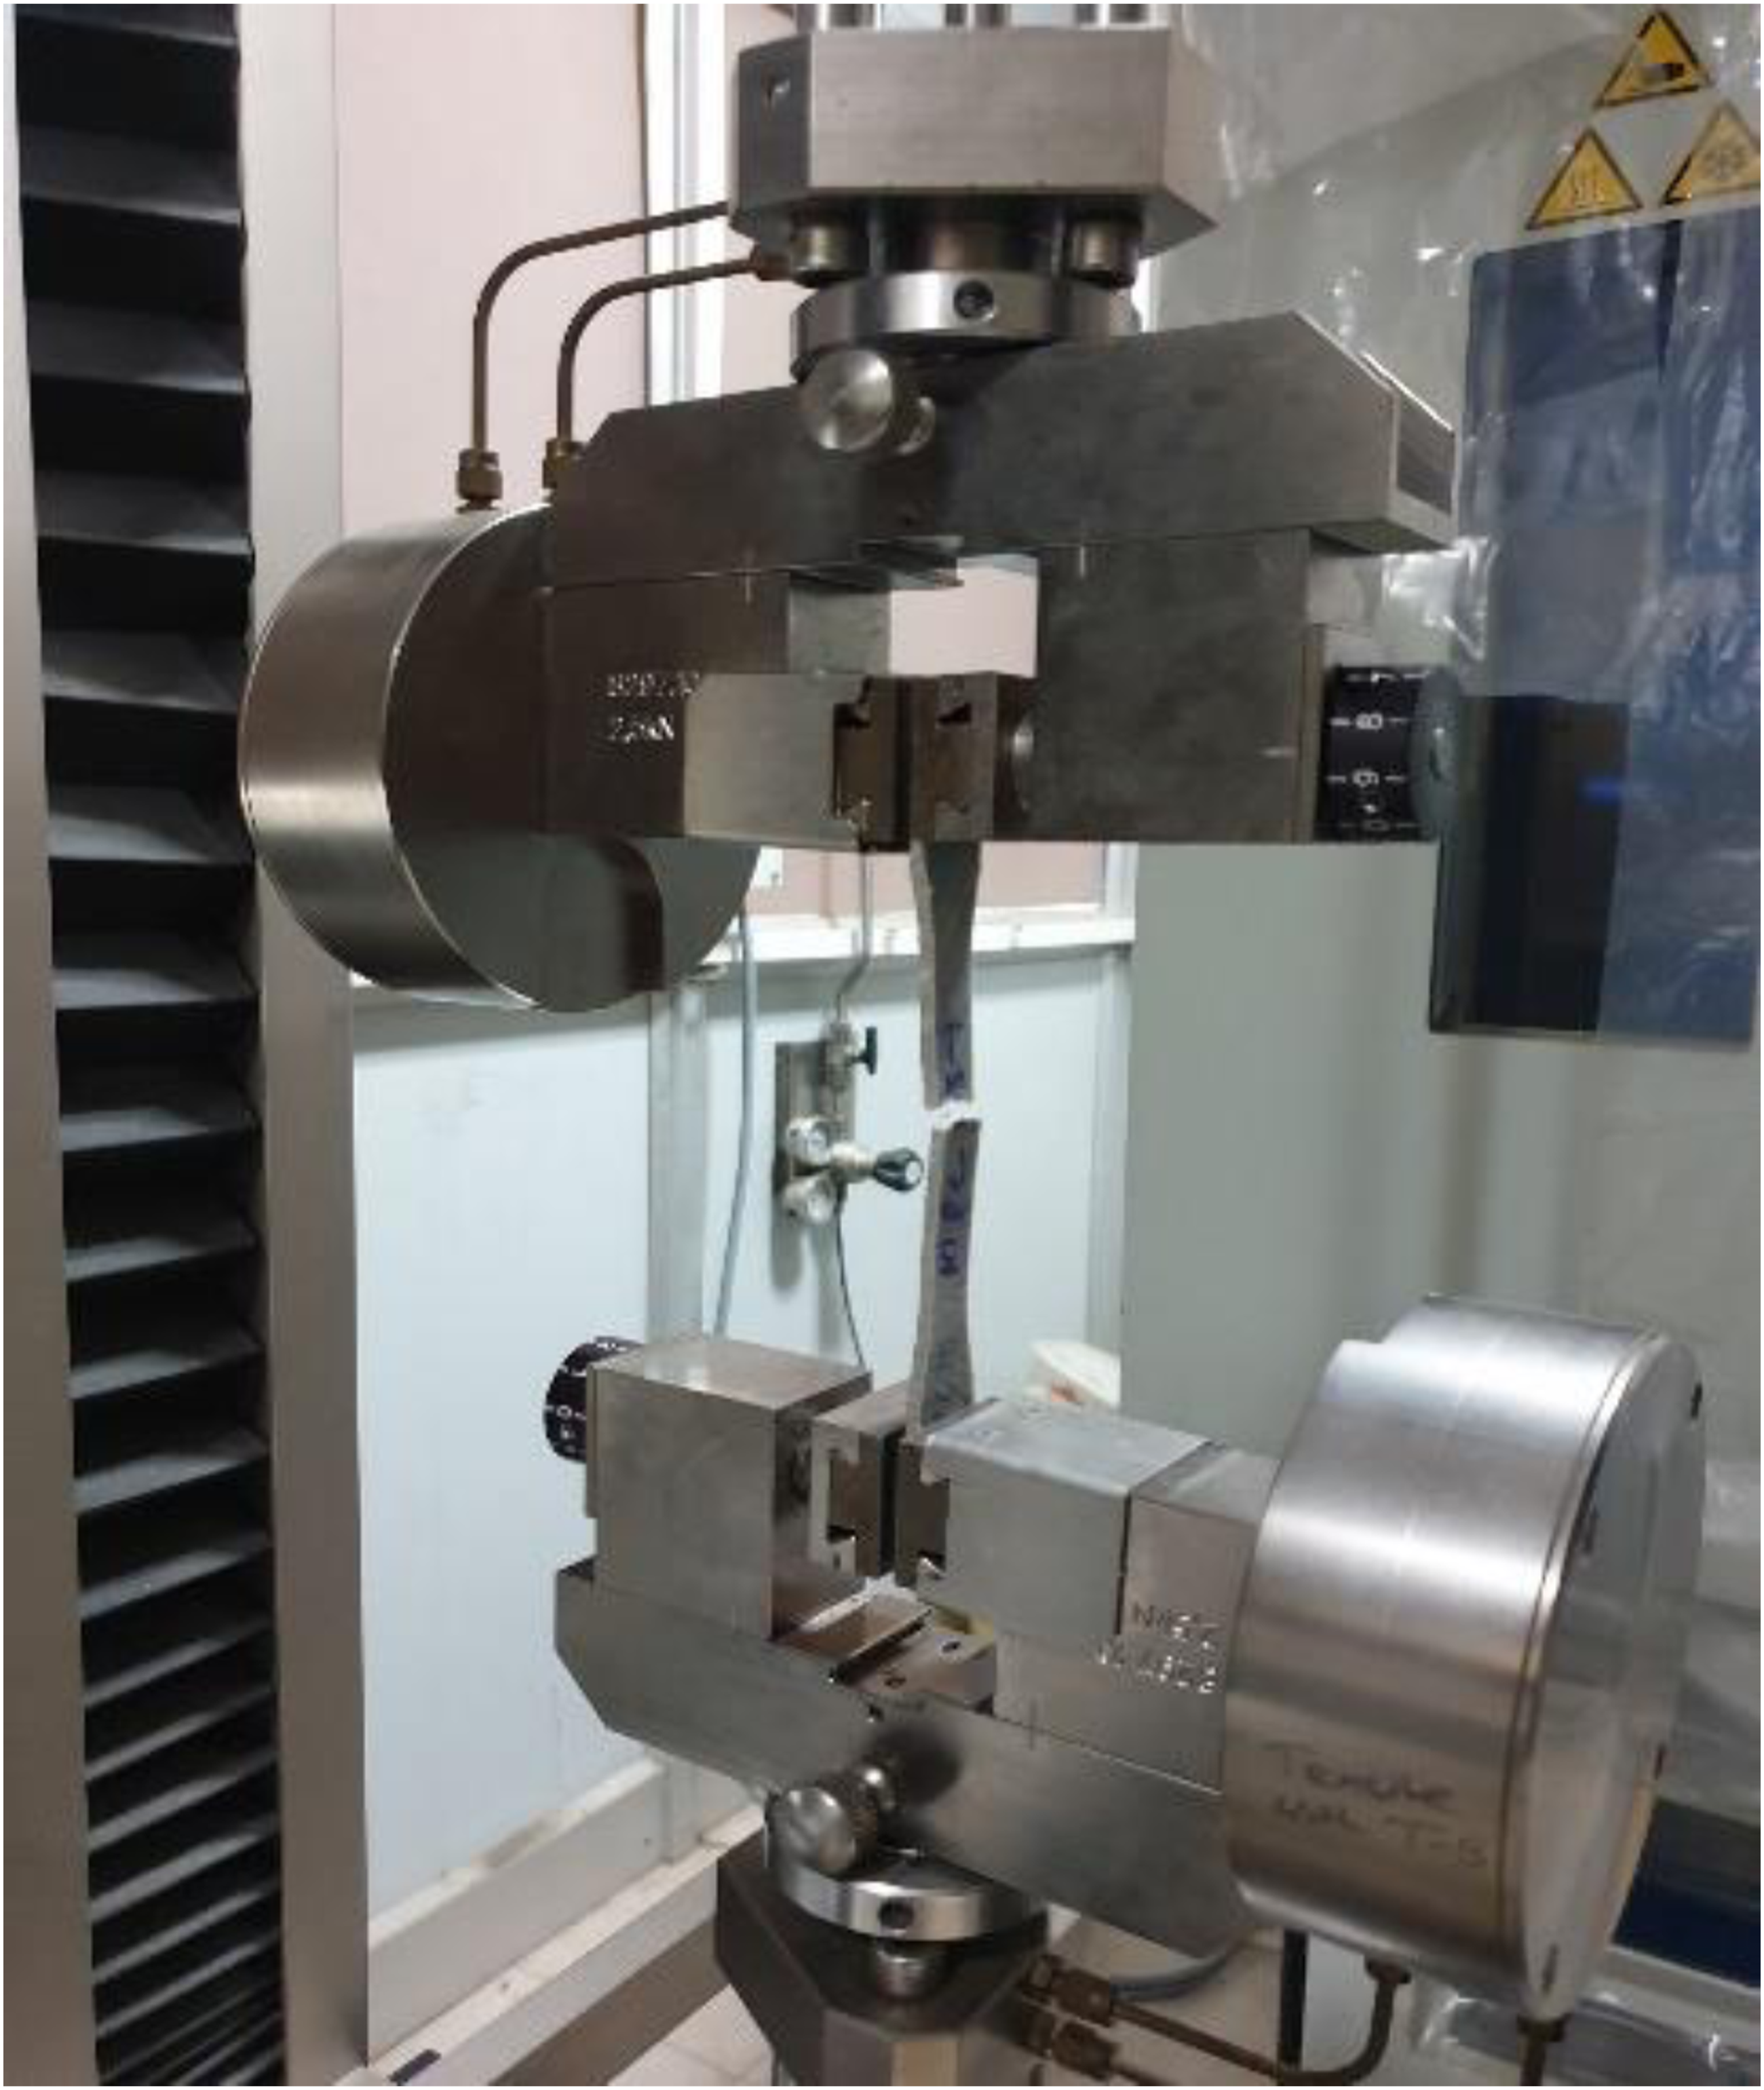
The mechanical properties of the samples were assessed through tensile, flexural, impact, and hardness tests. With the same molding conditions, two hollow cube samples of every composite material were produced. For each test, three specimens were prepared from three different walls of each sample. Data from six specimens are averaged for the various mechanical properties. For the tensile test, type I specimens, in accordance with the ASTM D638 standard, were cut with the help of a die and press, as depicted in Figure 6(a). The Zwick Roell Z005 UTM, with a 5 KN load capacity, was then used to test the specimens’ tensile strength at a speed of 50 mm/min (Figure 7). Testing specimens: (a) Tensile; (b) Impact. Specimen Undergoing a tensile test.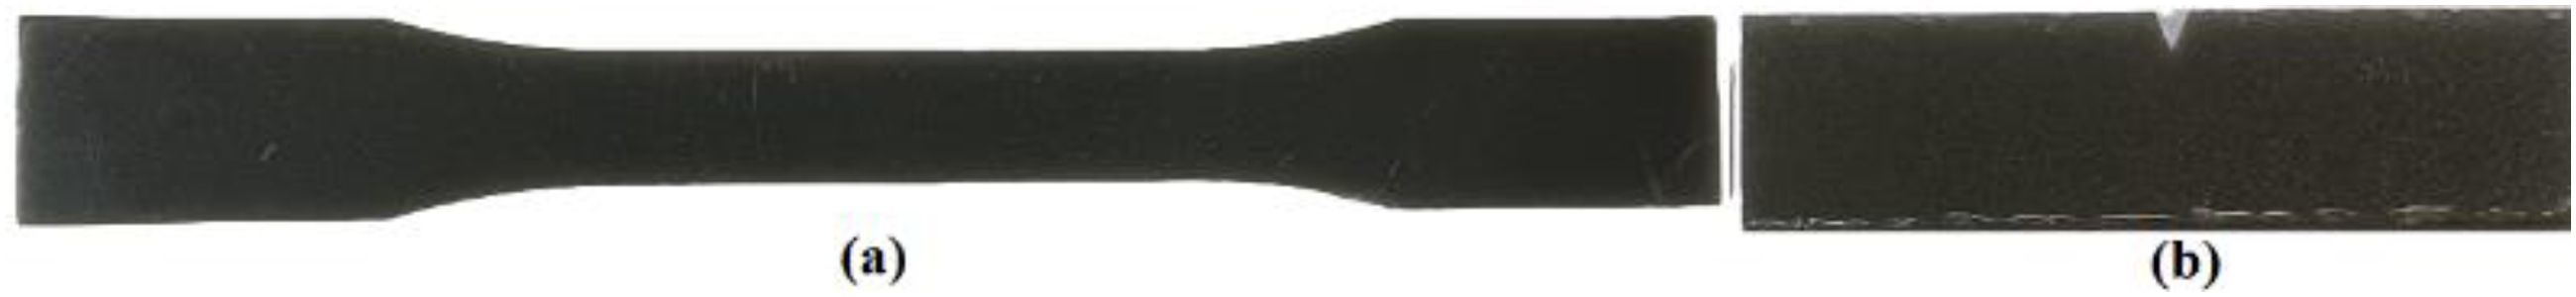
Flexural tests were conducted in compliance with the ASTM D790 standard using the same UTM, a Zwick Roell Z005 universal testing machine equipped with a 50 kN load cell, but operating at a different speed of 2 mm/min. Samples for the three-point bending tests were cut from the rotomolded box measuring 125 × 12.7 × 3 mm3, with a span length of 60 mm.
In accordance with ASTM D256, the Izod impact strength was assessed using a 242 g (2J) pendulum weight through a CEAST RESIL Impactor (USA) testing apparatus. Rectangular specimens, each measuring 65 mm × 12.7 mm × 3 mm, are cut for impact testing. These specimens are notched with a “V” shape through an automated specimen notcher from Tinius Olsen USA. Figure 6(b) illustrates the specimens intended for the impact test. Each test was carried out at room temperature, and the results are presented using the average of six measurements.
Hardness assessment using a Titanium durometer was conducted, adhering to the Shore D scale specified for thermoplastics in ASTM D2240. Total six specimens are extracted from each of the three walls of every cubic prototype manufactured through rotational molding under identical molding conditions.
Results & discussion
Assessment of density, porosity, and water absorption
Density serves as a primary indicator revealing the presence of porous structures within the material. In ordinary composite materials made by extrusion or injection molding, the incidence of voids is usually limited by the high pressure and shear forces applied. This observation also applies to composites incorporating buckwheat husk filler.
34
However, in rotational molding, the absence of pressure and force may result in a higher incidence of voids, leading to increased porosity in the final product. The figures in Figure 8 display the outcomes of density assessments and porosity (void content) for LLDPE-based samples. The density of the FA filler, determined using a pycnometer, is recorded as 2.15 g/cm3, sufficient higher than the LLDPE.
34
In this scenario, it’s reasonable to anticipate an increase in the composite density. Density initially reaches around 0.970 g/cm3, compared to the density of pure LLDPE products, which is about 0.929 g/cm3 till FA content reaches 10%. Porosity increases along with density because FA filler causes tiny pores to form inside polymer composites (Figure 9). The addition of FA to the polymer matrix leads to an increase in composite density, owing to the high density of FA. FA wt.% content versus (a) Density, (b) Porosity in LLDPE composites. Microscopic view of the composite surface; (a) Pure P, (b) MPC 5, (c) MPC 10, (d) MPC 15, (e) MPC 20, (f) MPC 25.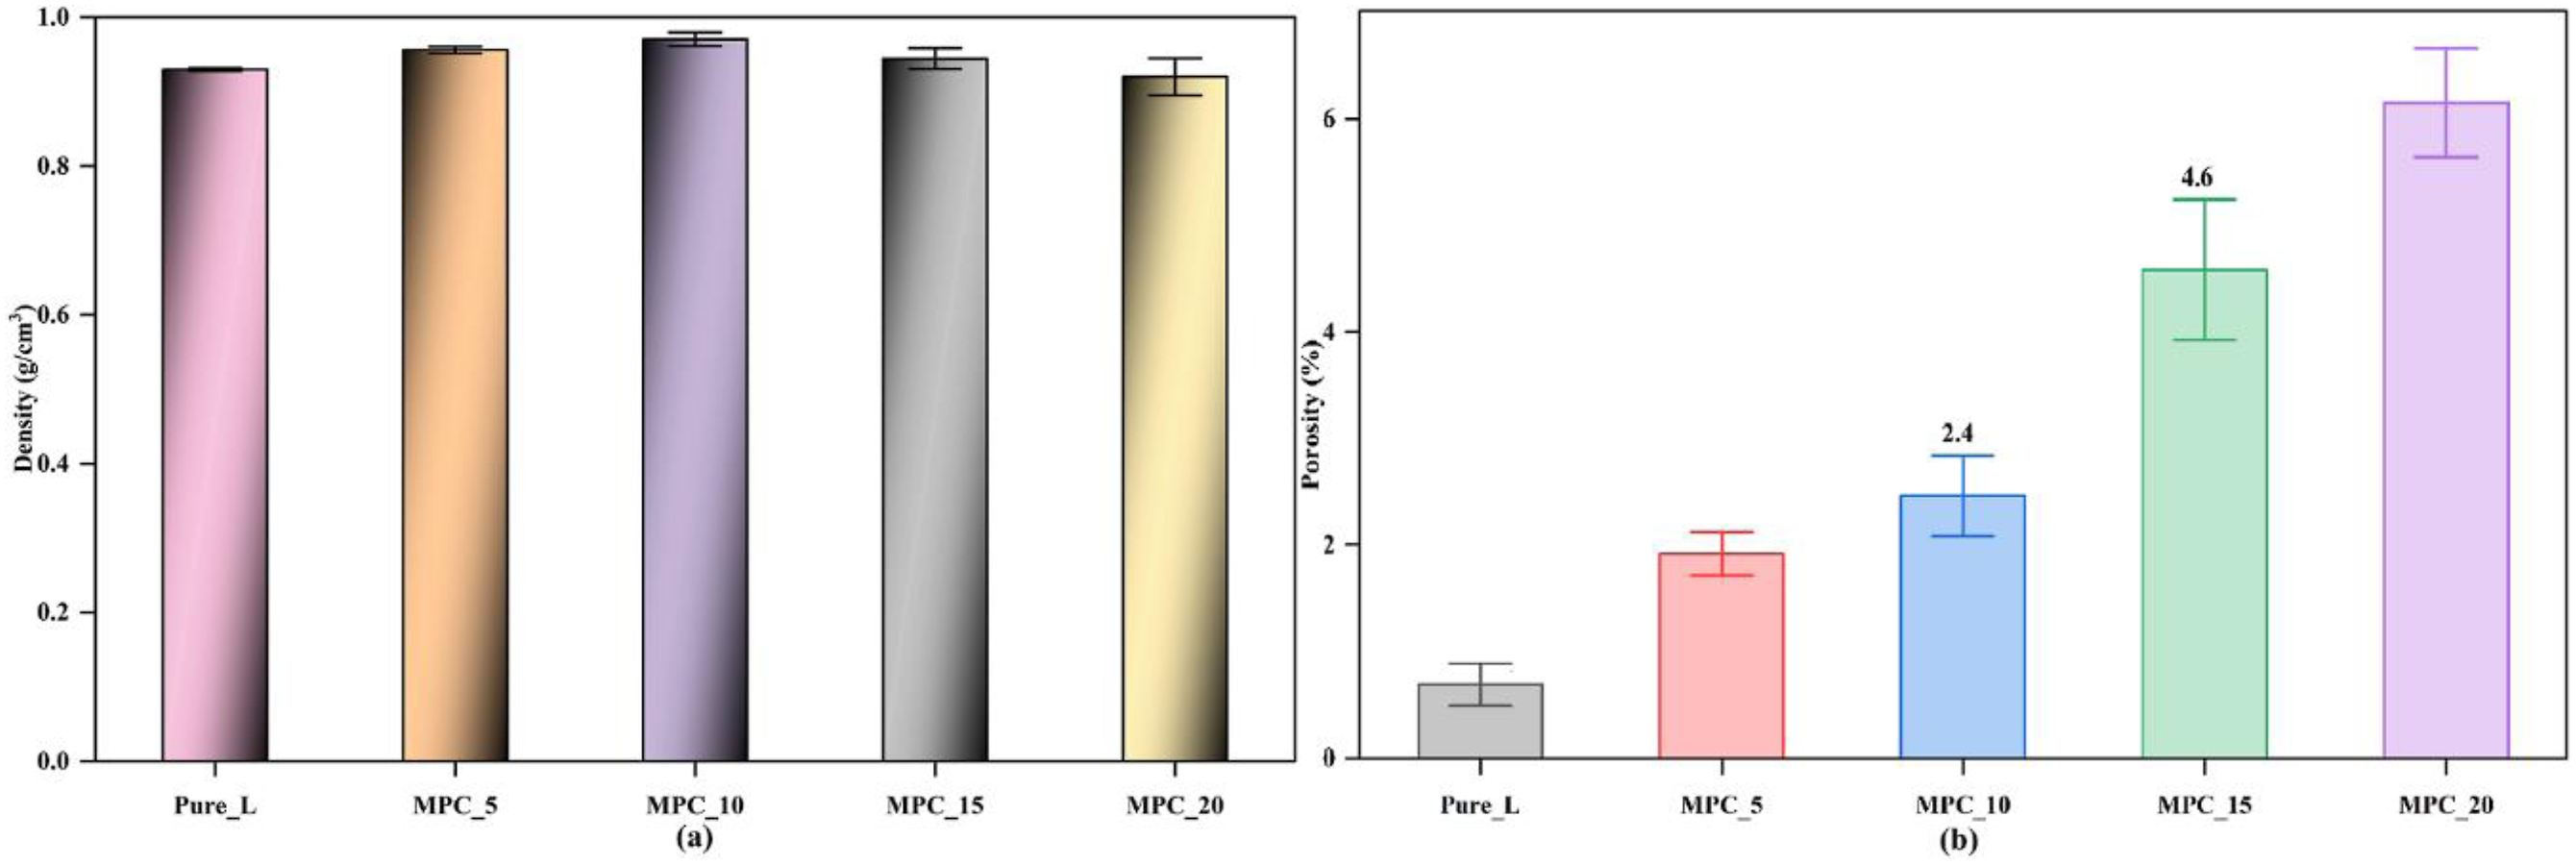
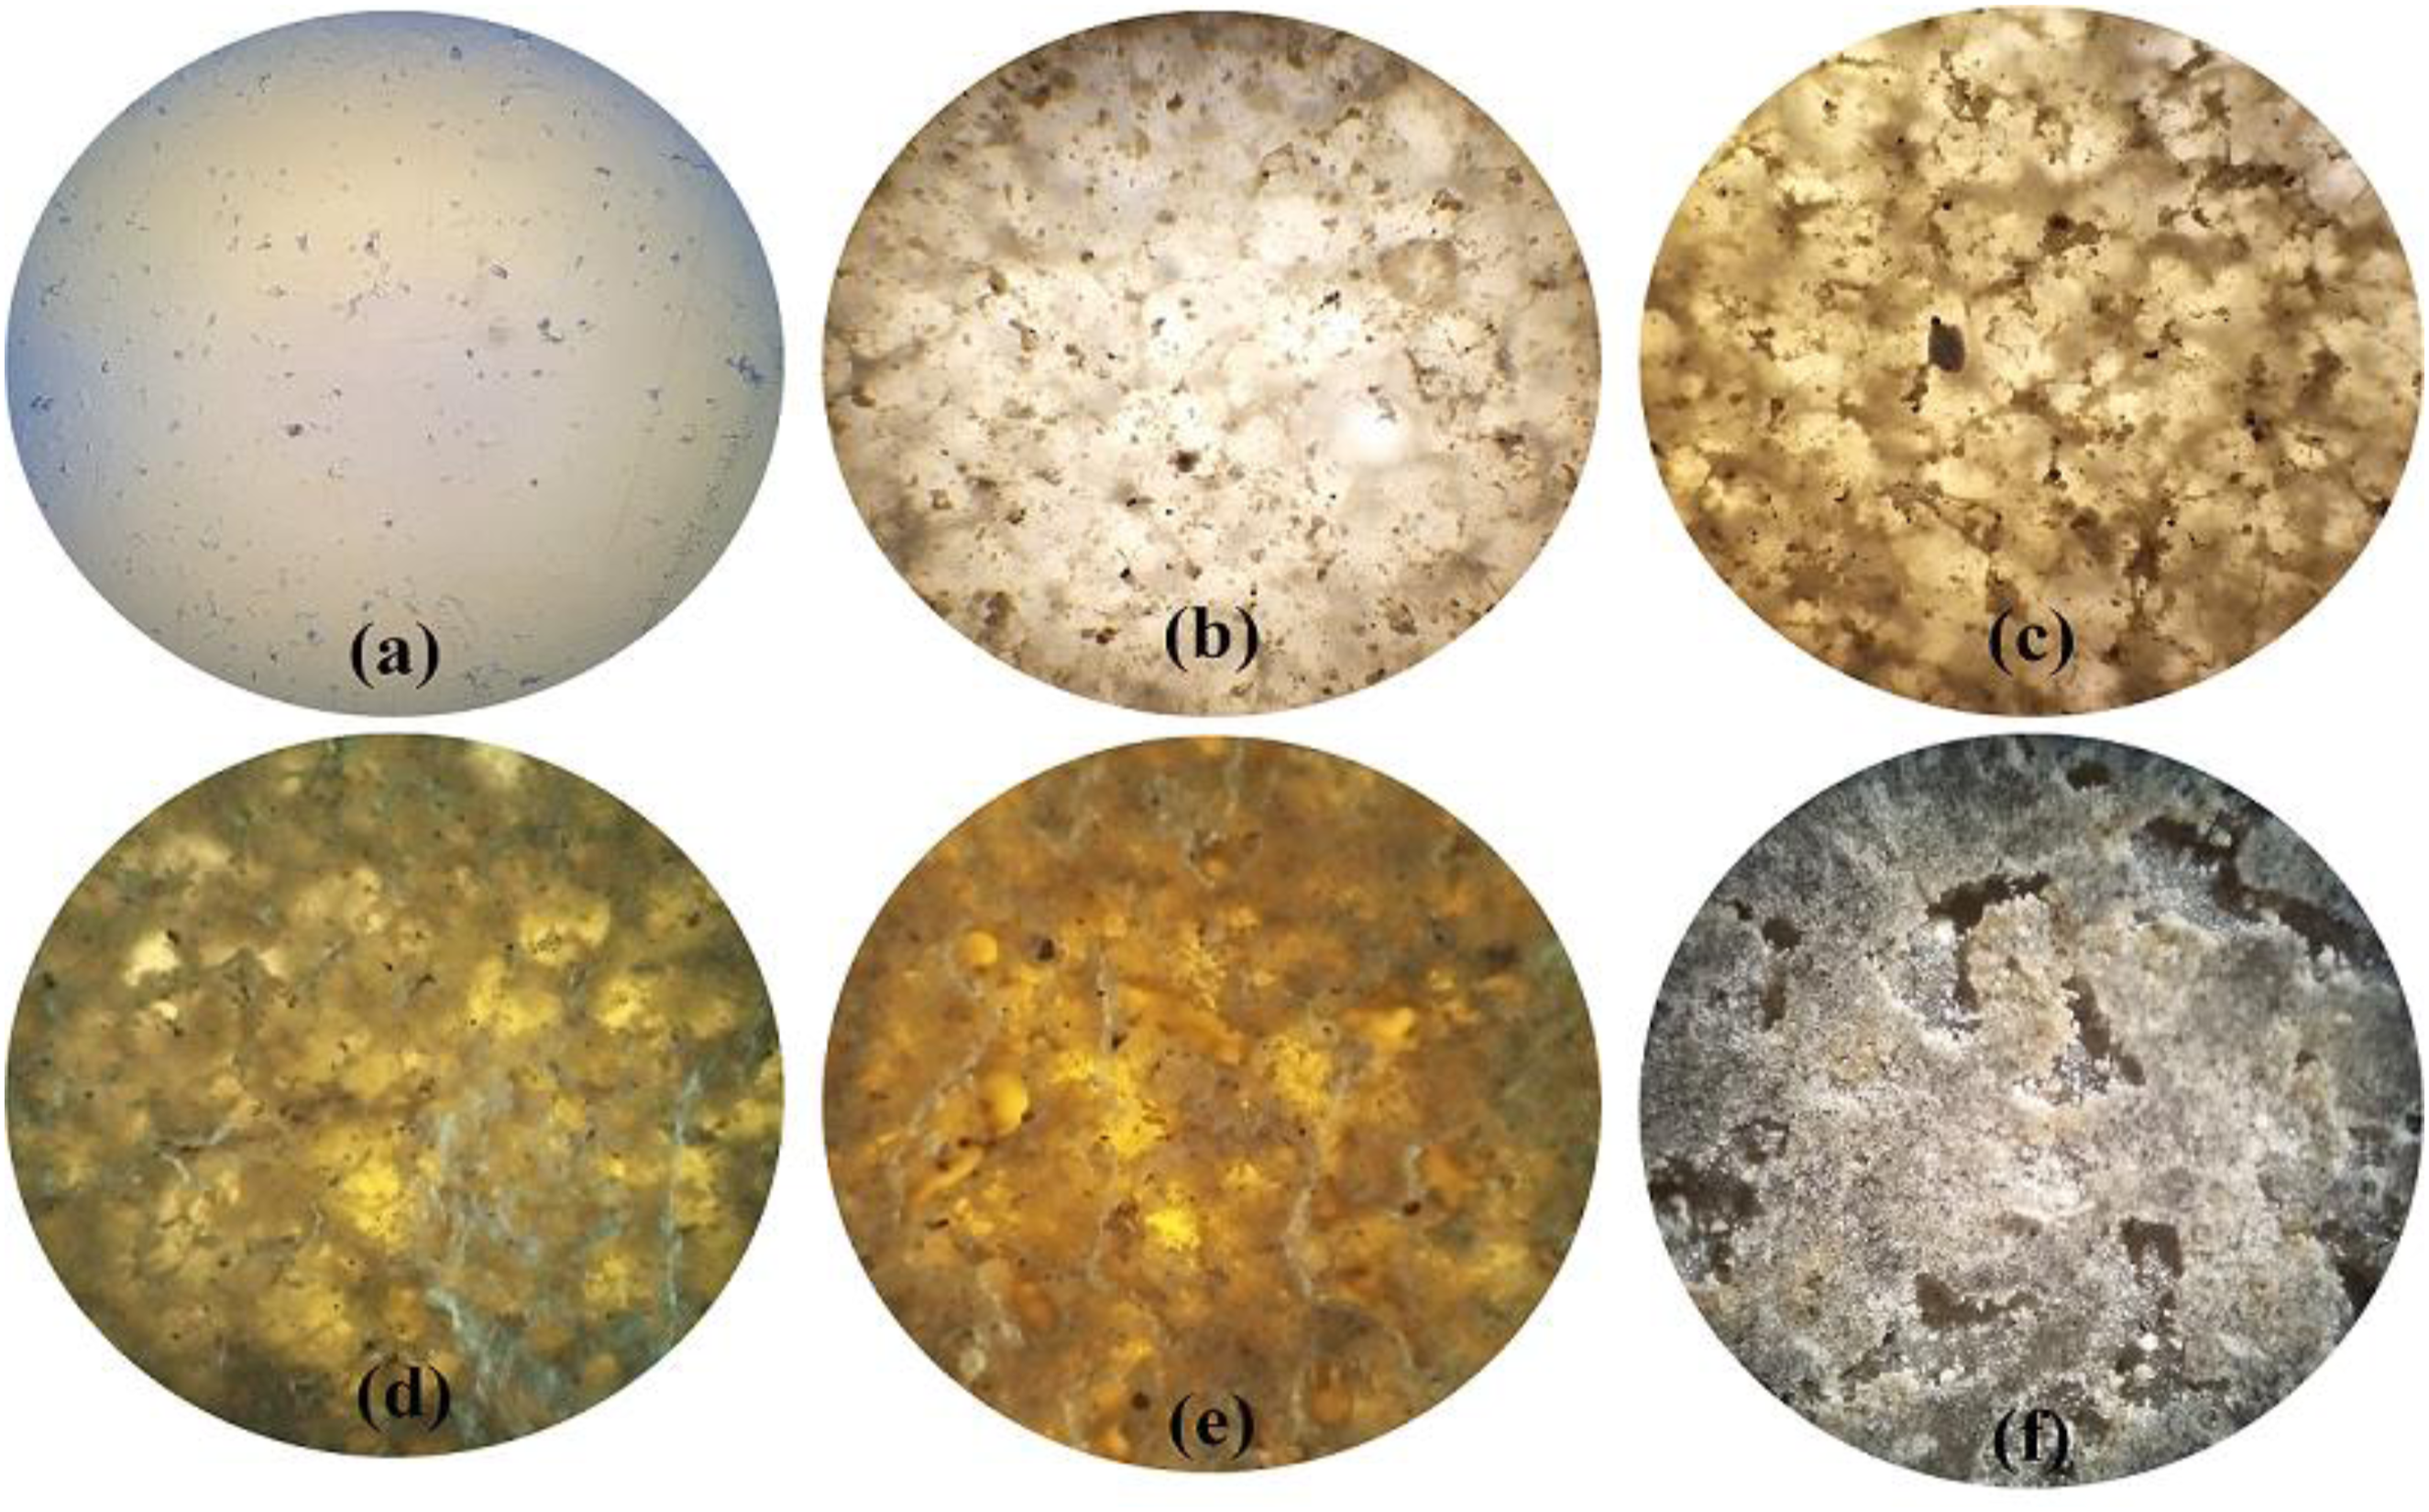
However, as the concentration of FA increases, there is a trend of decreasing density, although it remains higher than that of pure LLDPE. Notably, porosity shows a sharp increase as we approach MPC_15 and MPC_20 (Figure 8). These unfavourable changes are primarily attributed to the elevated viscosity of the LLDPE employed in this method, which hampers the polymer matrix’s ability to encapsulate the FA particles, leading to the formation of significant voids within the polymer composites 35 (Figure 9). The significant size of the pores, coupled with their obstruction by the filler particles, restricts the natural processes of gas migration toward the free surface. Multiple studies36,37 indicate that the reduction in pore content within the structure primarily occurs through gas dissolution within the matrix, rather than pore migration. Consequently, an increase in porosity must be associated to a dysfunction of this mechanism. Spence & Crawford 38 propose that these voids can be minimized by ensuring proper sintering of the product or by augmenting the internal pressure within the mold during the molding process. The increased presence of filler particles near the exposed surface of the molded component leads to pronounced surface roughness, as illustrated in Figures 9(d)–(f). Challenges in interpreting measurement results lead to the conclusion that the density of the tested FA/LLDPE composites is influenced by various factors, with polymer viscosity, filler content, adhesion, and tendency to agglomerate being the most significant among them.
The water absorption capacity of various samples of FA/LLDPE composites, as depicted in Figure 10, exhibits a trend like that observed in porosity. Pure LLDPE, owing to its hydrophobic nature, exhibits minimal water absorption, approximately 0.06%, which is attributed mainly to small surface pores visible in Figure 9(a). Figure 10 may primarily reflect the impact of increased void content rather than any hygroscopic nature of the FA particles themselves, as FA is generally known for its limited moisture absorption capacity. The water absorption increases from 0.08% to 3.38%. This increase is attributed to the rise in voids with the FA content, which encapsulates water molecules within them. This porosity-driven moisture uptake aligns with our findings, emphasizing that water absorption beyond 10% FA content may impact mechanical properties. Results of water absorption by various FA/LLDPE composites.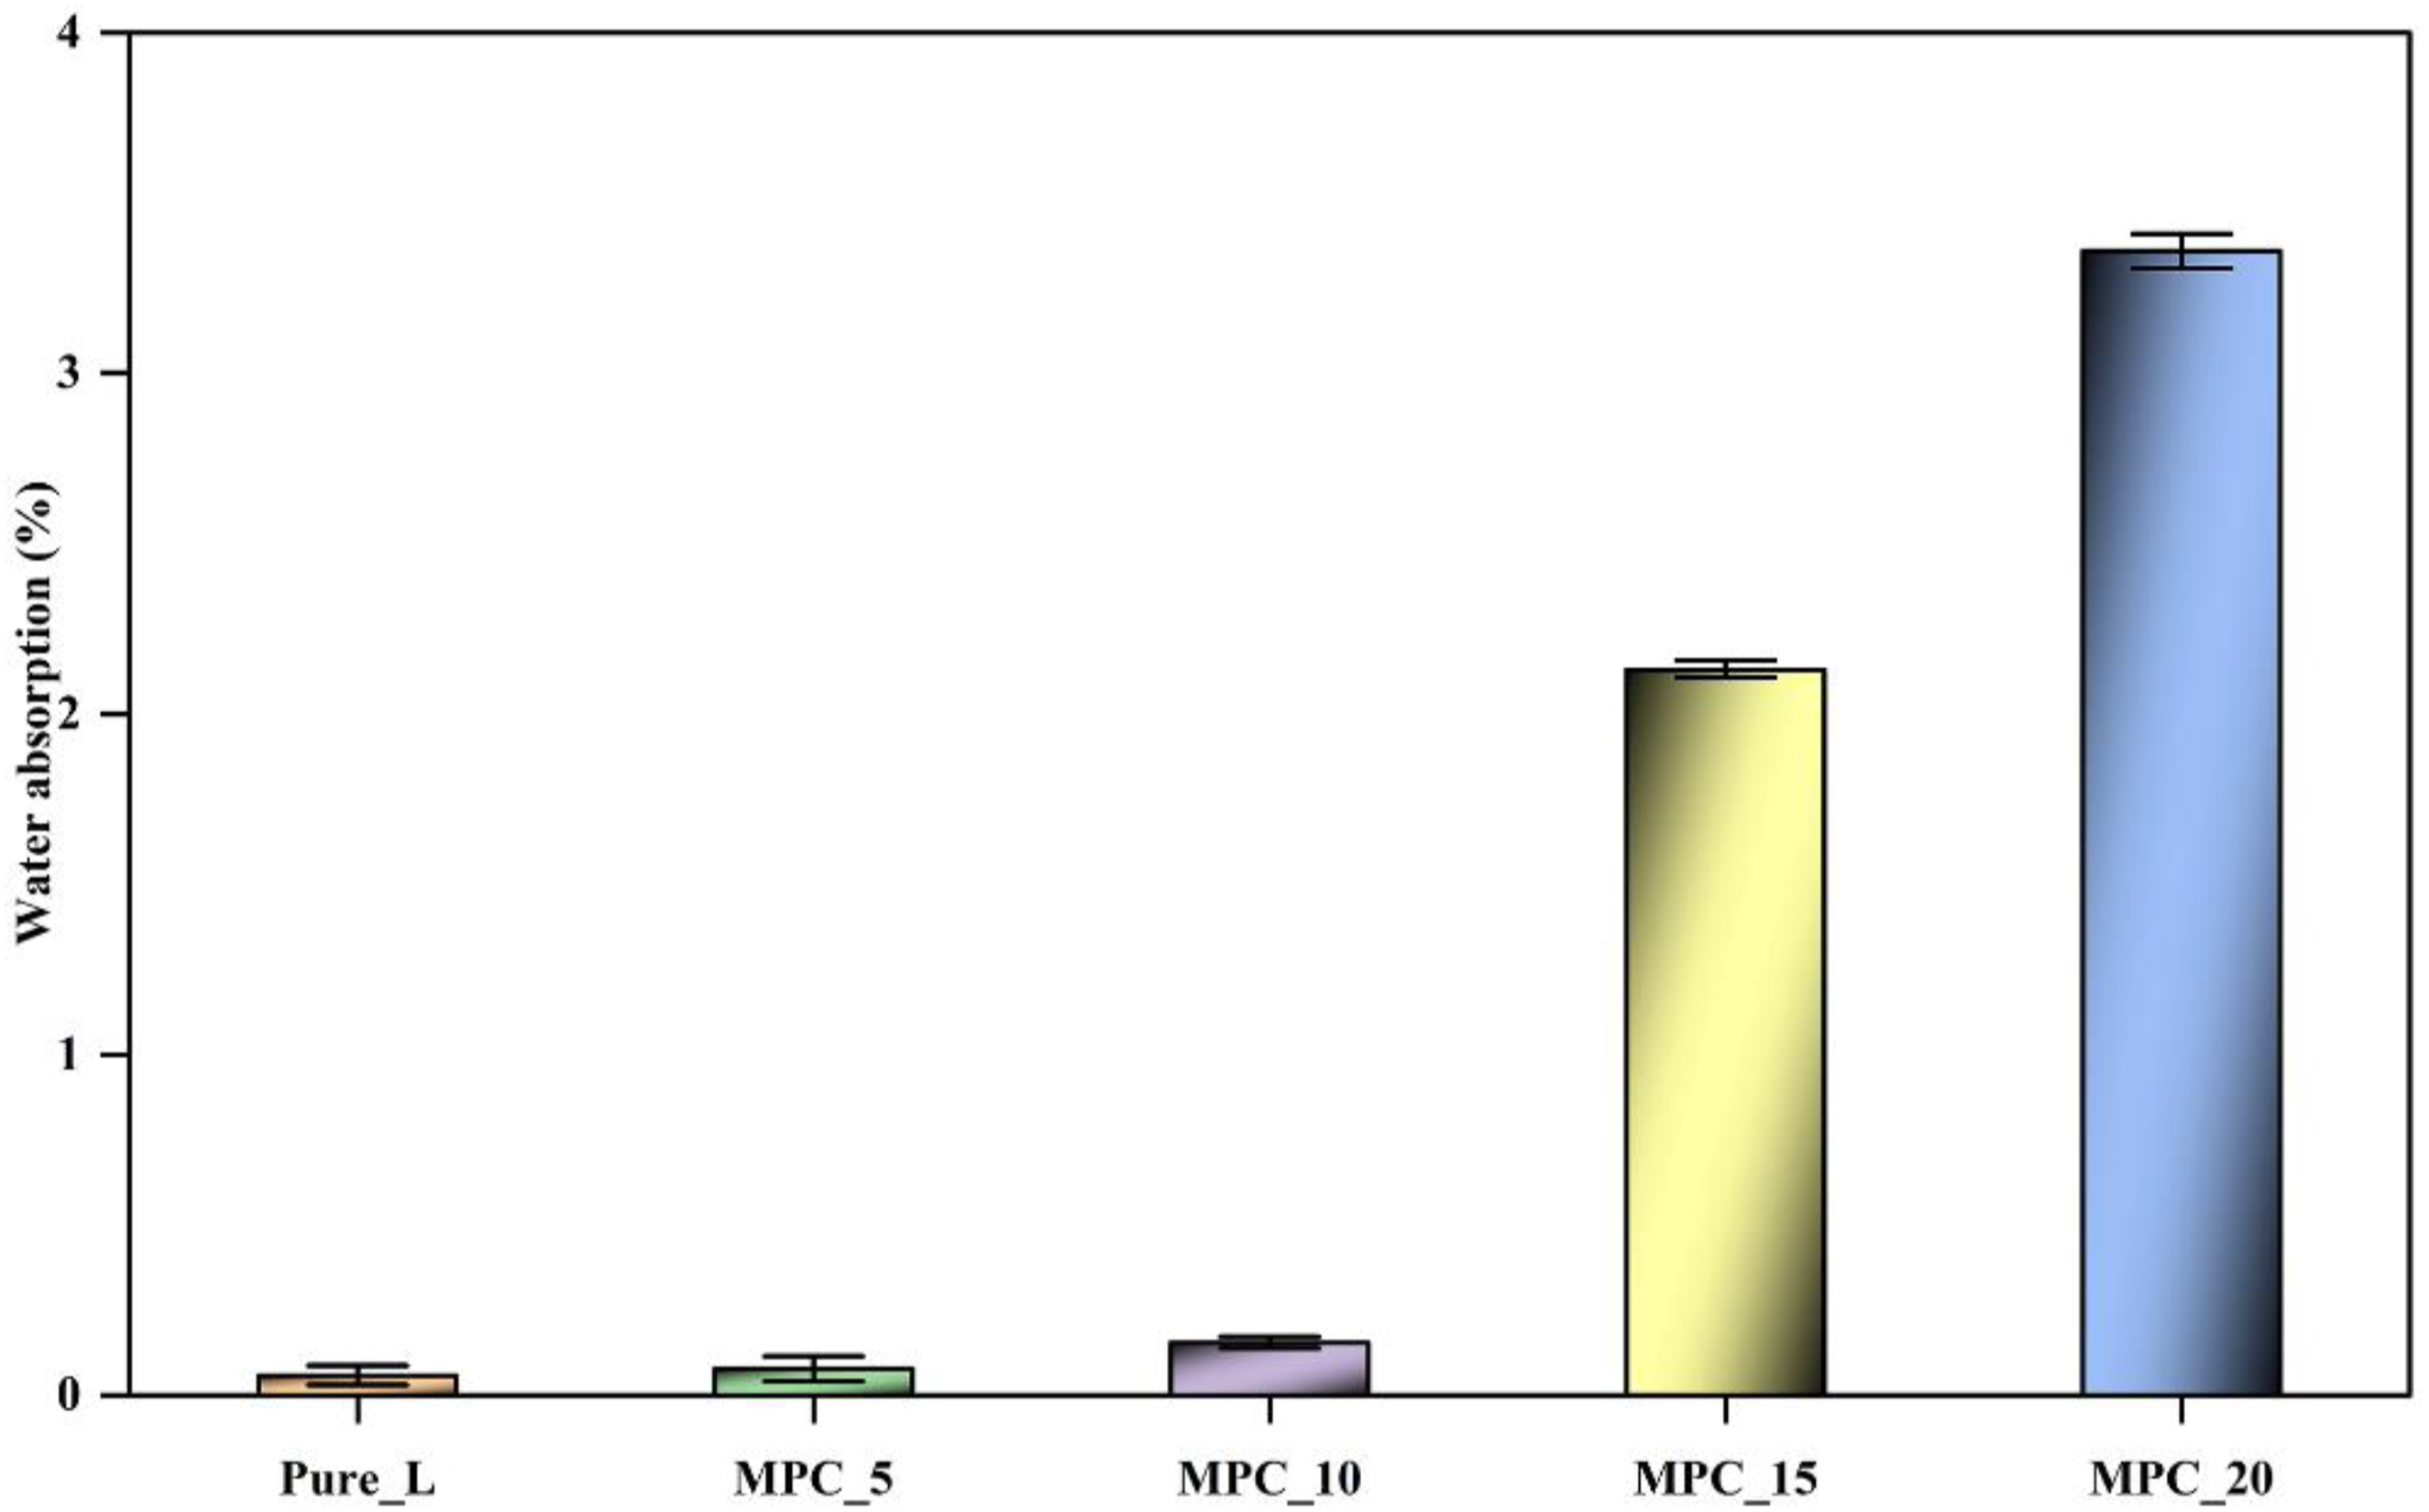
Morphology analysis
Figures 11 and 12 presents SEM micrographs illustrating the surfaces of various mineral polymer composites. Figure 11(a) and (b) display SEM images showcasing the surface characteristics of composite materials composed of 5% and 10% FA/LLDPE, respectively. The micrographs indicate a uniform dispersion of mineral particles throughout the matrix, suggesting optimal processing conditions were employed. However, the presence of noticeable pores on the surface might lead to a reduction in the melt flow rate. The heightened porosity suggests that either a prolonged heating duration in the furnace chamber is necessary or utilizing a material with a higher melt flow rate (MFR) may be beneficial.24,39 Additionally, in MPC_10, there are some instances of agglomeration, which can potentially diminish the mechanical strength of the material. SEM images of mineral polymer composites; (a) MPC 5, (b) MPC 10, (c) MPC 15, (d) MPC 20. Surface morphology of mineral polymer Composite MPC 25.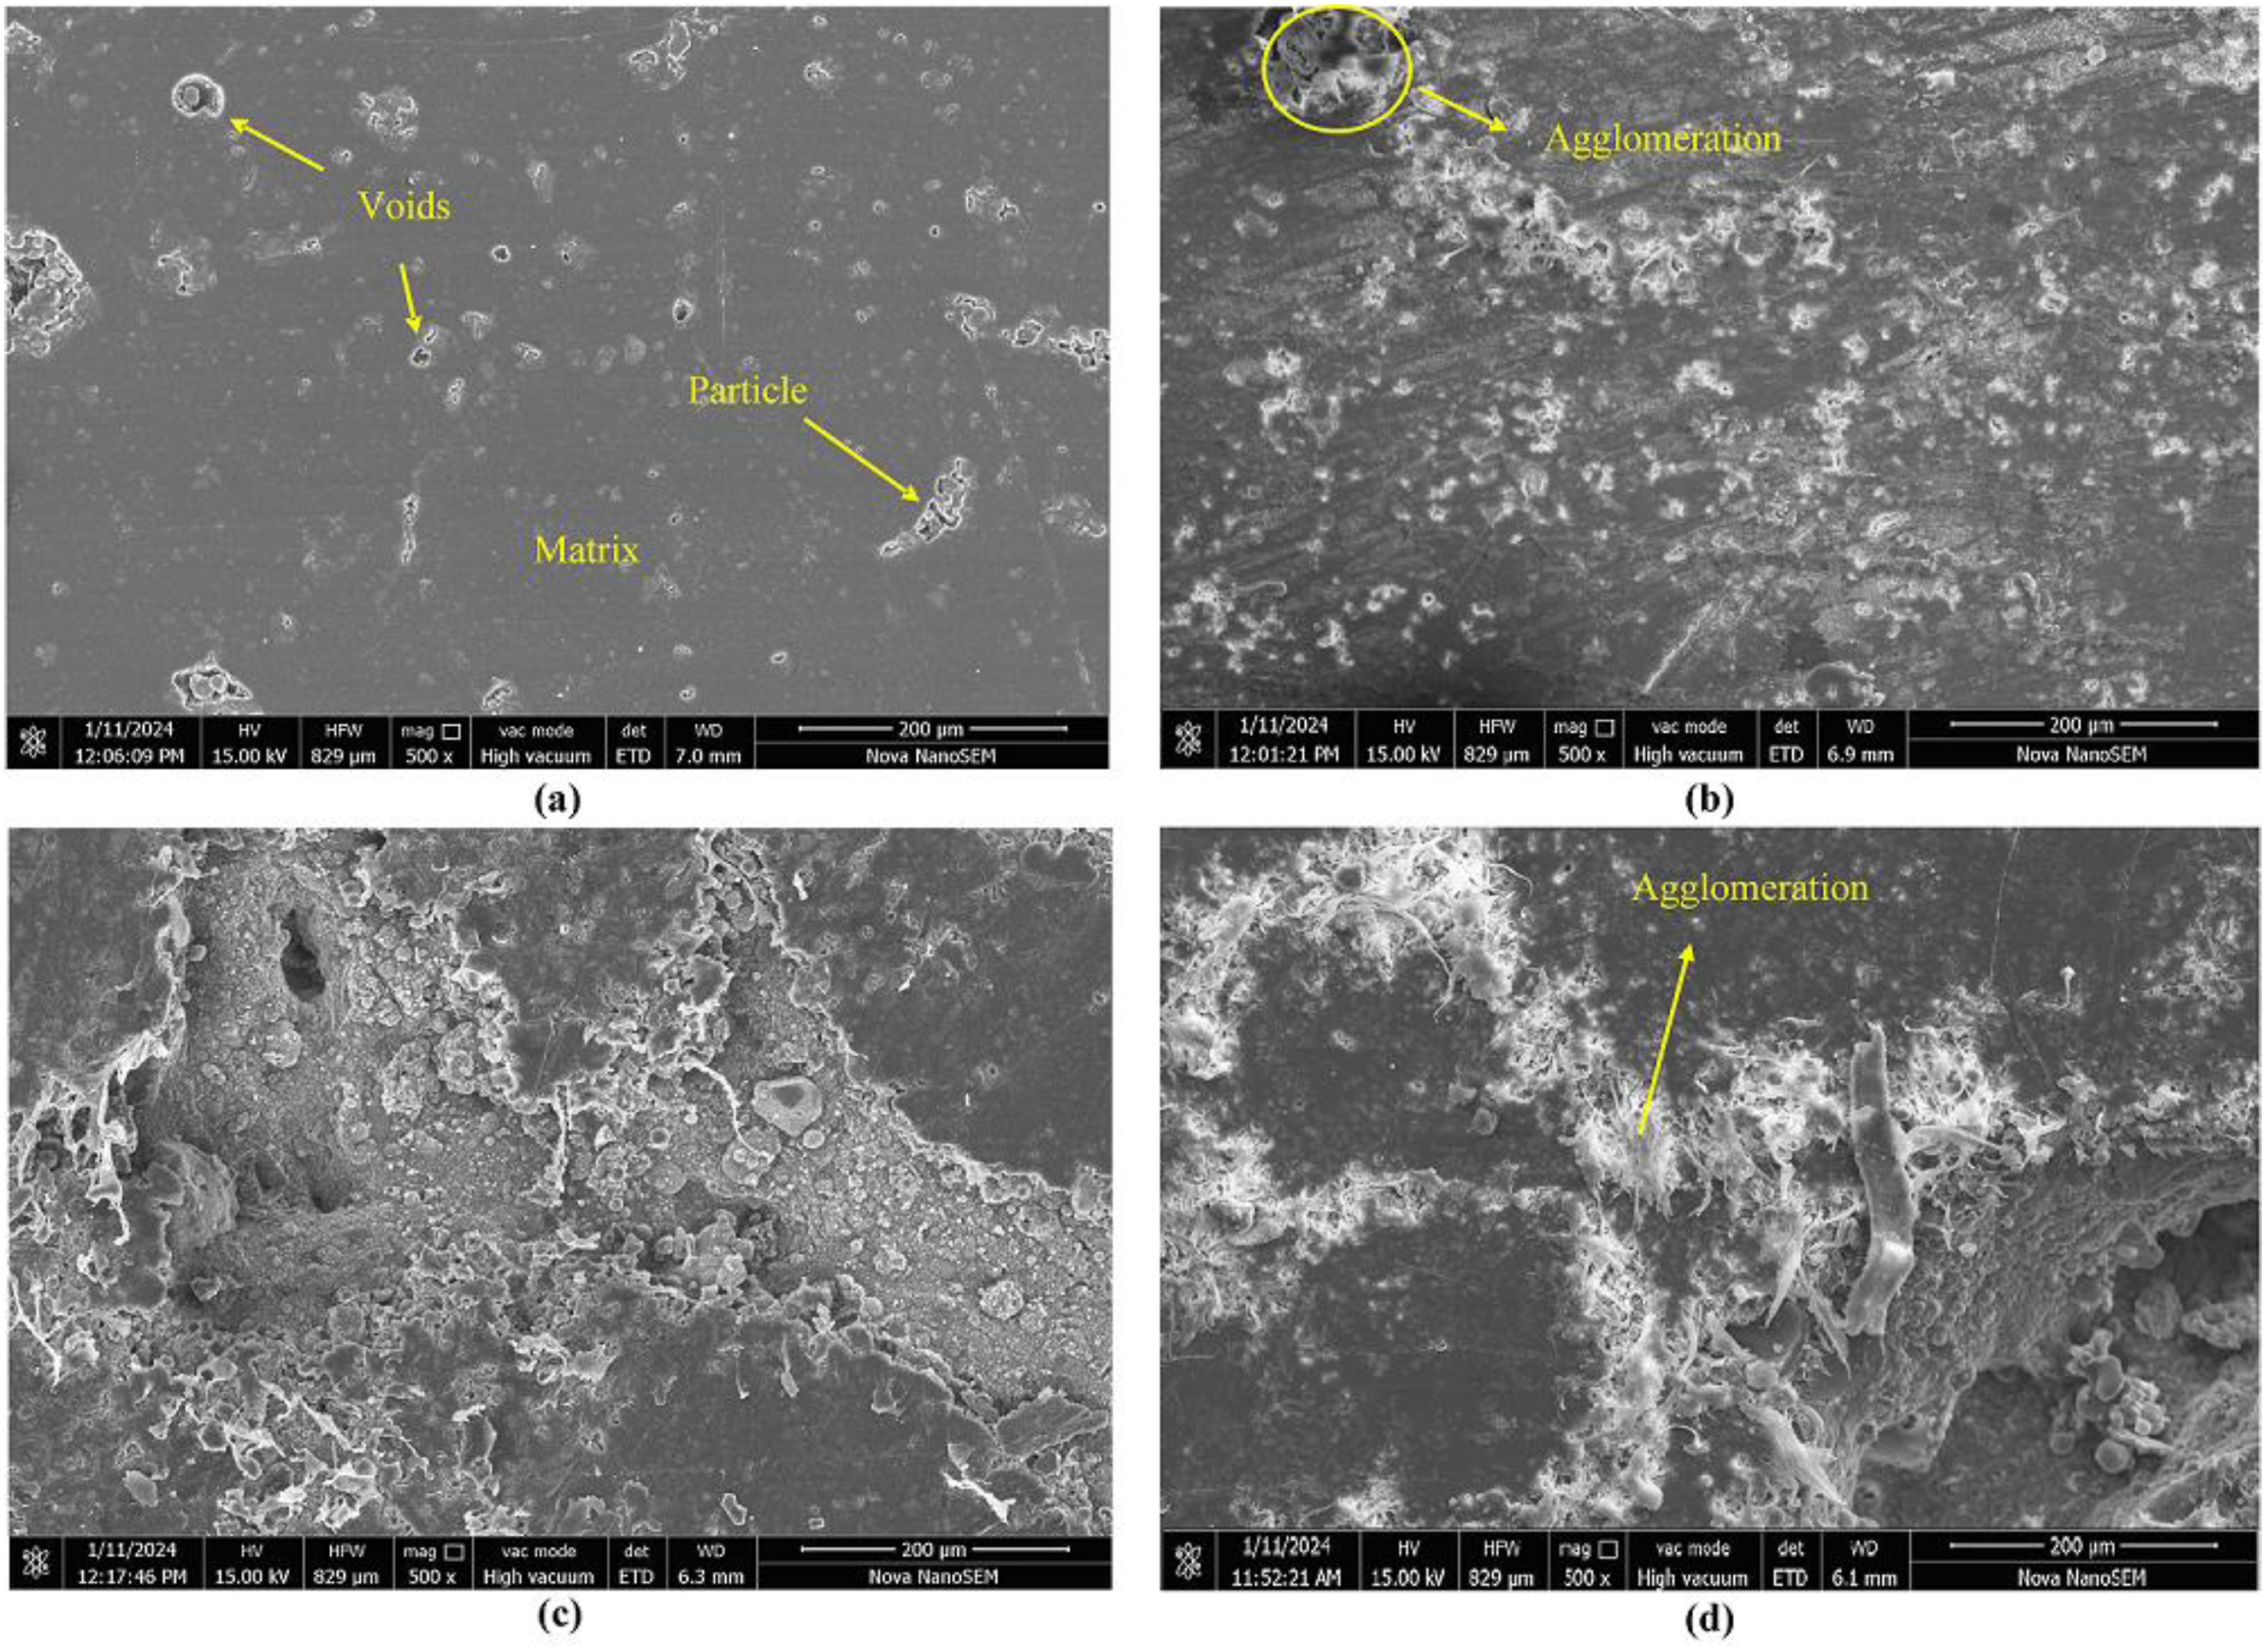
With an increase in FA content, both agglomeration and surface erosion become apparent, as observed in the morphology images of MPC_15 and MPC_20 in the Figure 11(c) and (d). This occurs because the polymer matrix is unable to fill the mineral agglomerations due to their extensive surface area. The increase in pore size observed in MPC_20 compared to MPC_15 is attributed to the escalated agglomeration with higher FA content. This is primarily due to the greater density of minerals as opposed to the polymer matrix. The agglomeration and large pores may exacerbate the degradation of mechanical characterization.
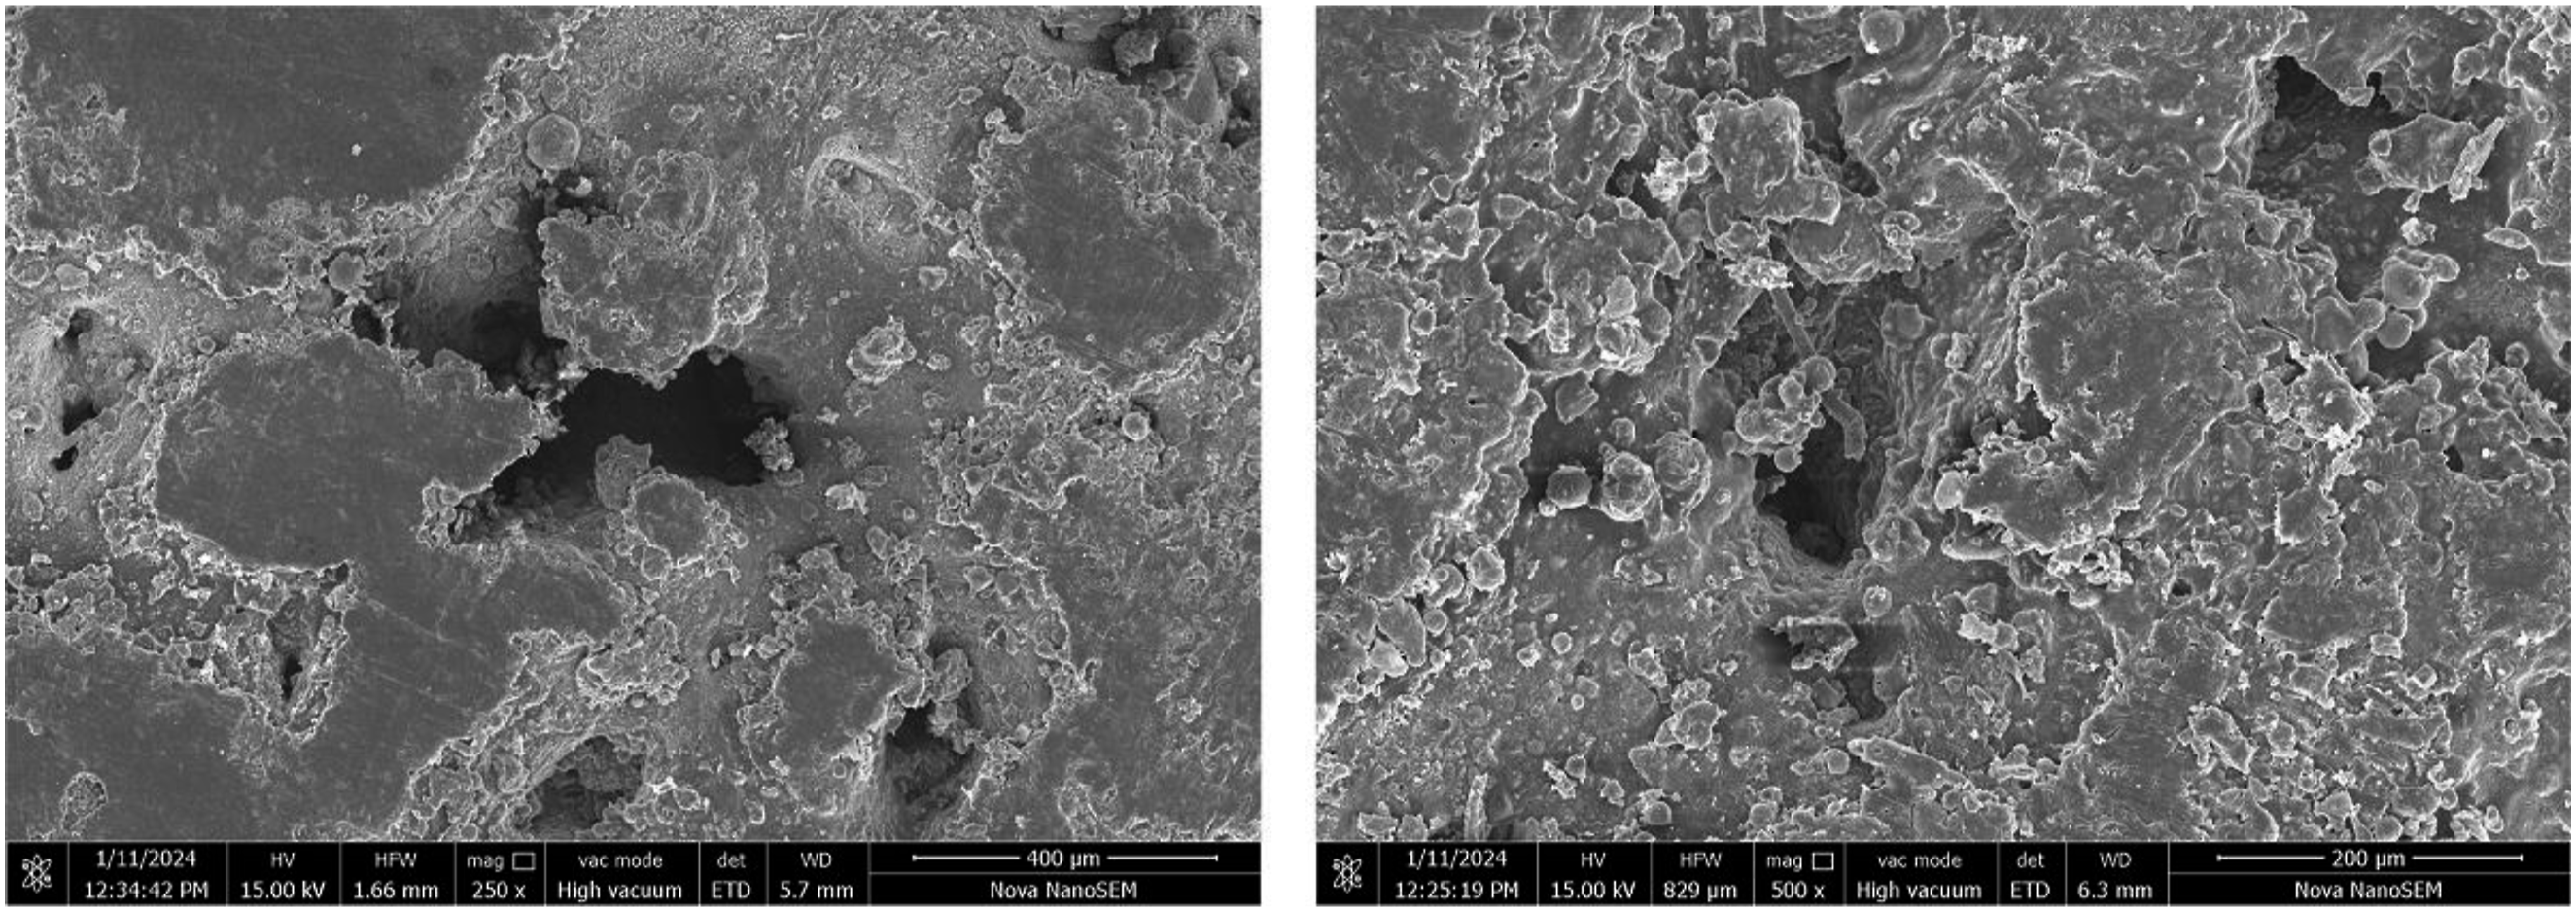
The increase in FA content from 20% to 25% results in a significant increase in agglomeration, consequently leading to the formation of large holes (can be seen in Figure 12), causing the polymer matrix to fail in effectively encapsulating the mineral particles. This situation is indicative of a high mineral content in the composite. As a result, the product made from the MPC_25 polymer composite could not be successfully produced shown in Figure 5. The observed agglomeration of fly ash (FA) particles can be attributed to insufficient adhesion between the FA and LLDPE particles. As illustrated in Figure 2(b), the microstructure of the FA particles is round and smooth, which limits the mechanical interlocking between the FA and LLDPE particles. This lack of interlocking can lead to a reduction in the mechanical properties of the resulting composites.
To enhance adhesion, surface treatments for FA particles can be employed. These treatments, such as silane coupling agents, can improve the wettability and compatibility between the hydrophilic nature of fly ash and the hydrophobic character of LLDPE. By facilitating chemical bonding, silanes can effectively lower interfacial tension, thereby enhancing adhesion at the interface, as recommended by different researchers.40,41
Energy dispersive x-ray spectroscopy (EDX)
The EDX spectra of LLDPE composites is illustrated in Figure 13. Observations reveal that the peaks in the spectrum are situated within the range of 0 to 4 keV. The peak observed at 0.15 keV originates from carbon, whereas the peak at 0.5 keV is attributed to oxygen. The presence of alkyl chains provides an explanation for the existence of carbon and oxygen within the spectrum.
42
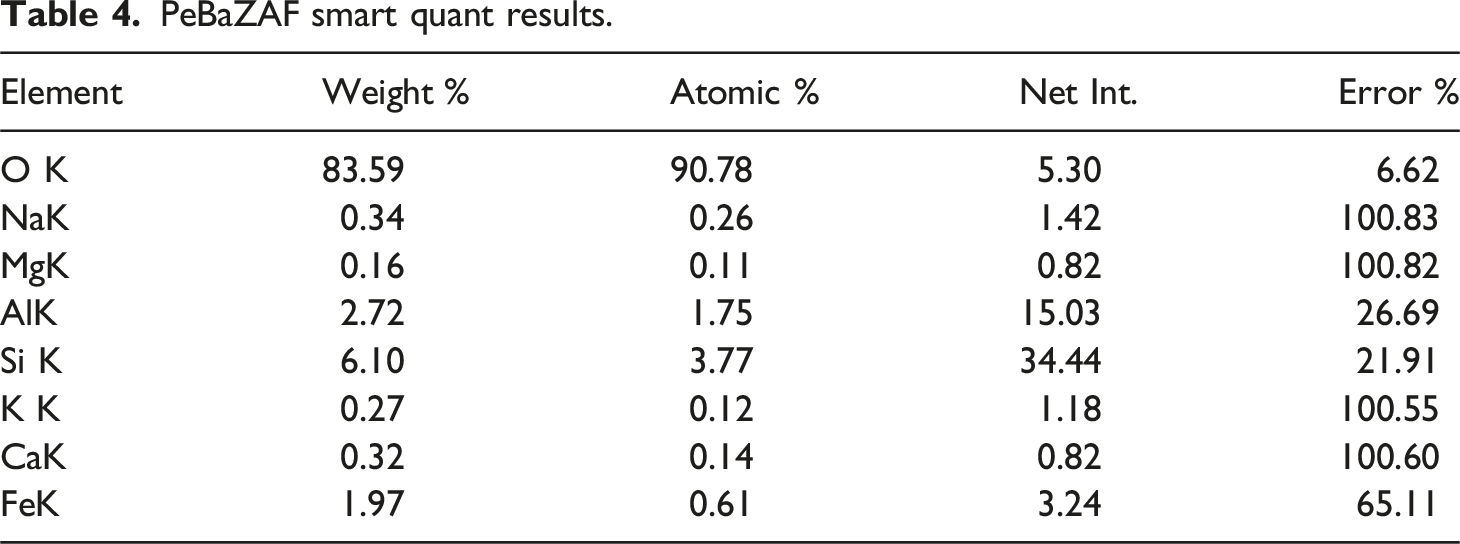
EDX spectrum of LLDPE composites.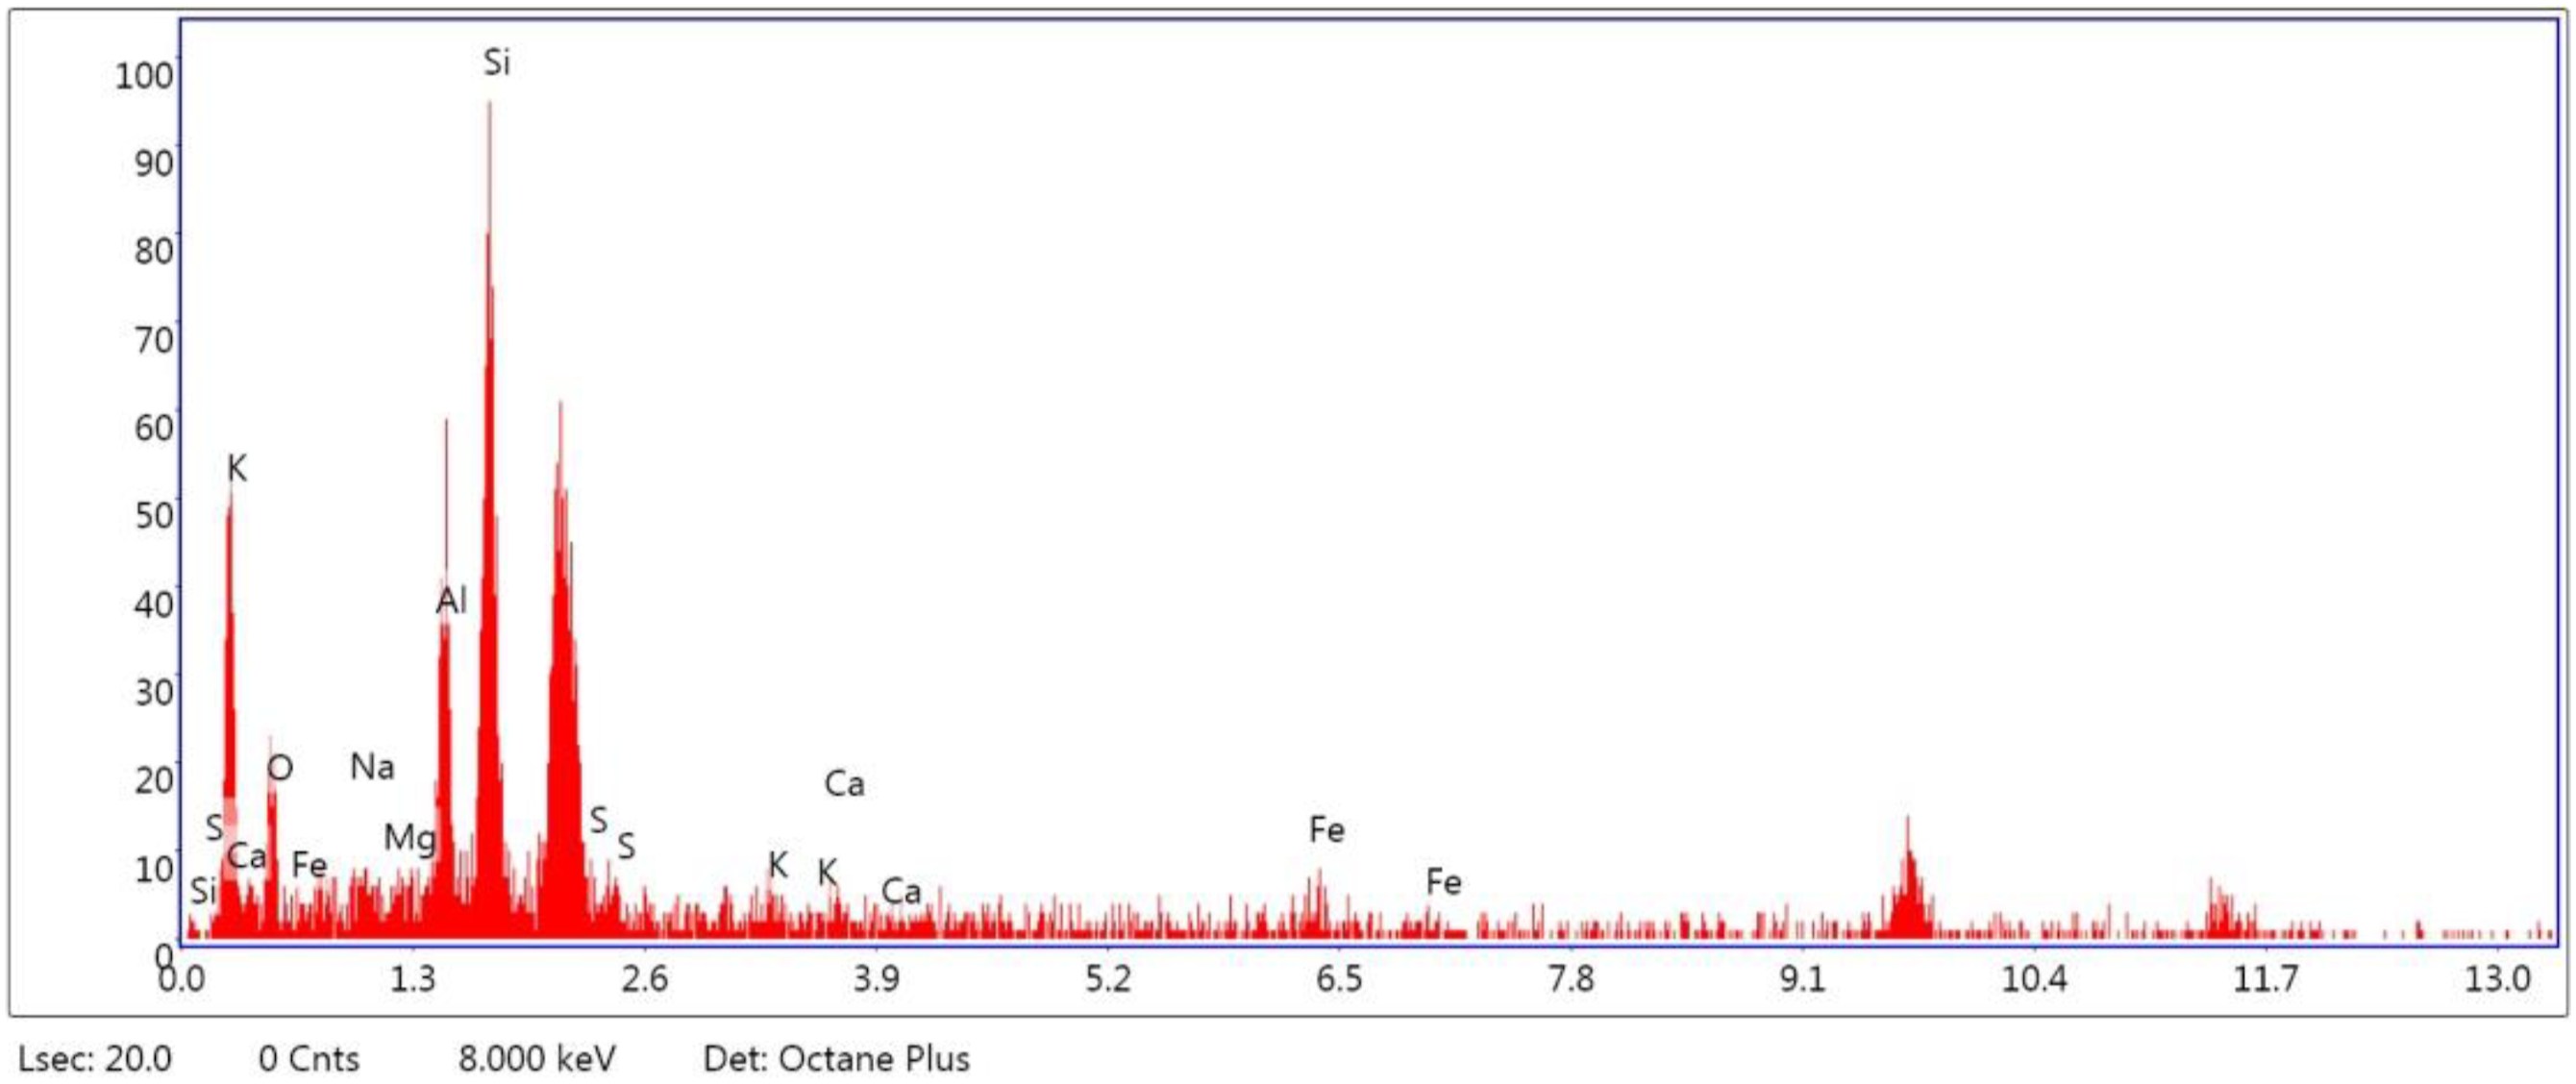
PeBaZAF smart quant results.
Tensile test
Figures 14 and 15 display the tensile outcomes of composites at varying levels of FA content. Adding FA particles to the LLDPE improved the composites’ Young’s modulus, as seen in Figure 14. The tensile modulus experiments revealed that incorporating filler content enhanced the stiffness of LLDPE/FA composites by approximately 5% to 23.8% across FA content variations from 5% to 20%. The maximum tensile modulus increased from 2.6 MPa to 3.4 MPa for the LLDPE containing 20% FA. The obtained results align with findings from other studies on polymer composites.43,44 A similar trend was reported by Chaochanchaikul et al.
45
in their study on LDPE with FA composites. The tensile strength initially increased for MPC_5 by approximately 3%, but subsequently decreased by 20%, 38%, and 58% for 10%, 15%, and 20% FA content in the composites, respectively. At lower concentrations (up to 5% FA), FA particles exhibit optimal dispersion within the polymer matrix as shown in SEM images 11a, effectively reinforcing the material and facilitating improved load transfer. The tensile strength results obtained in this study are superior to those reported by Chaochanchaikul et al.
45
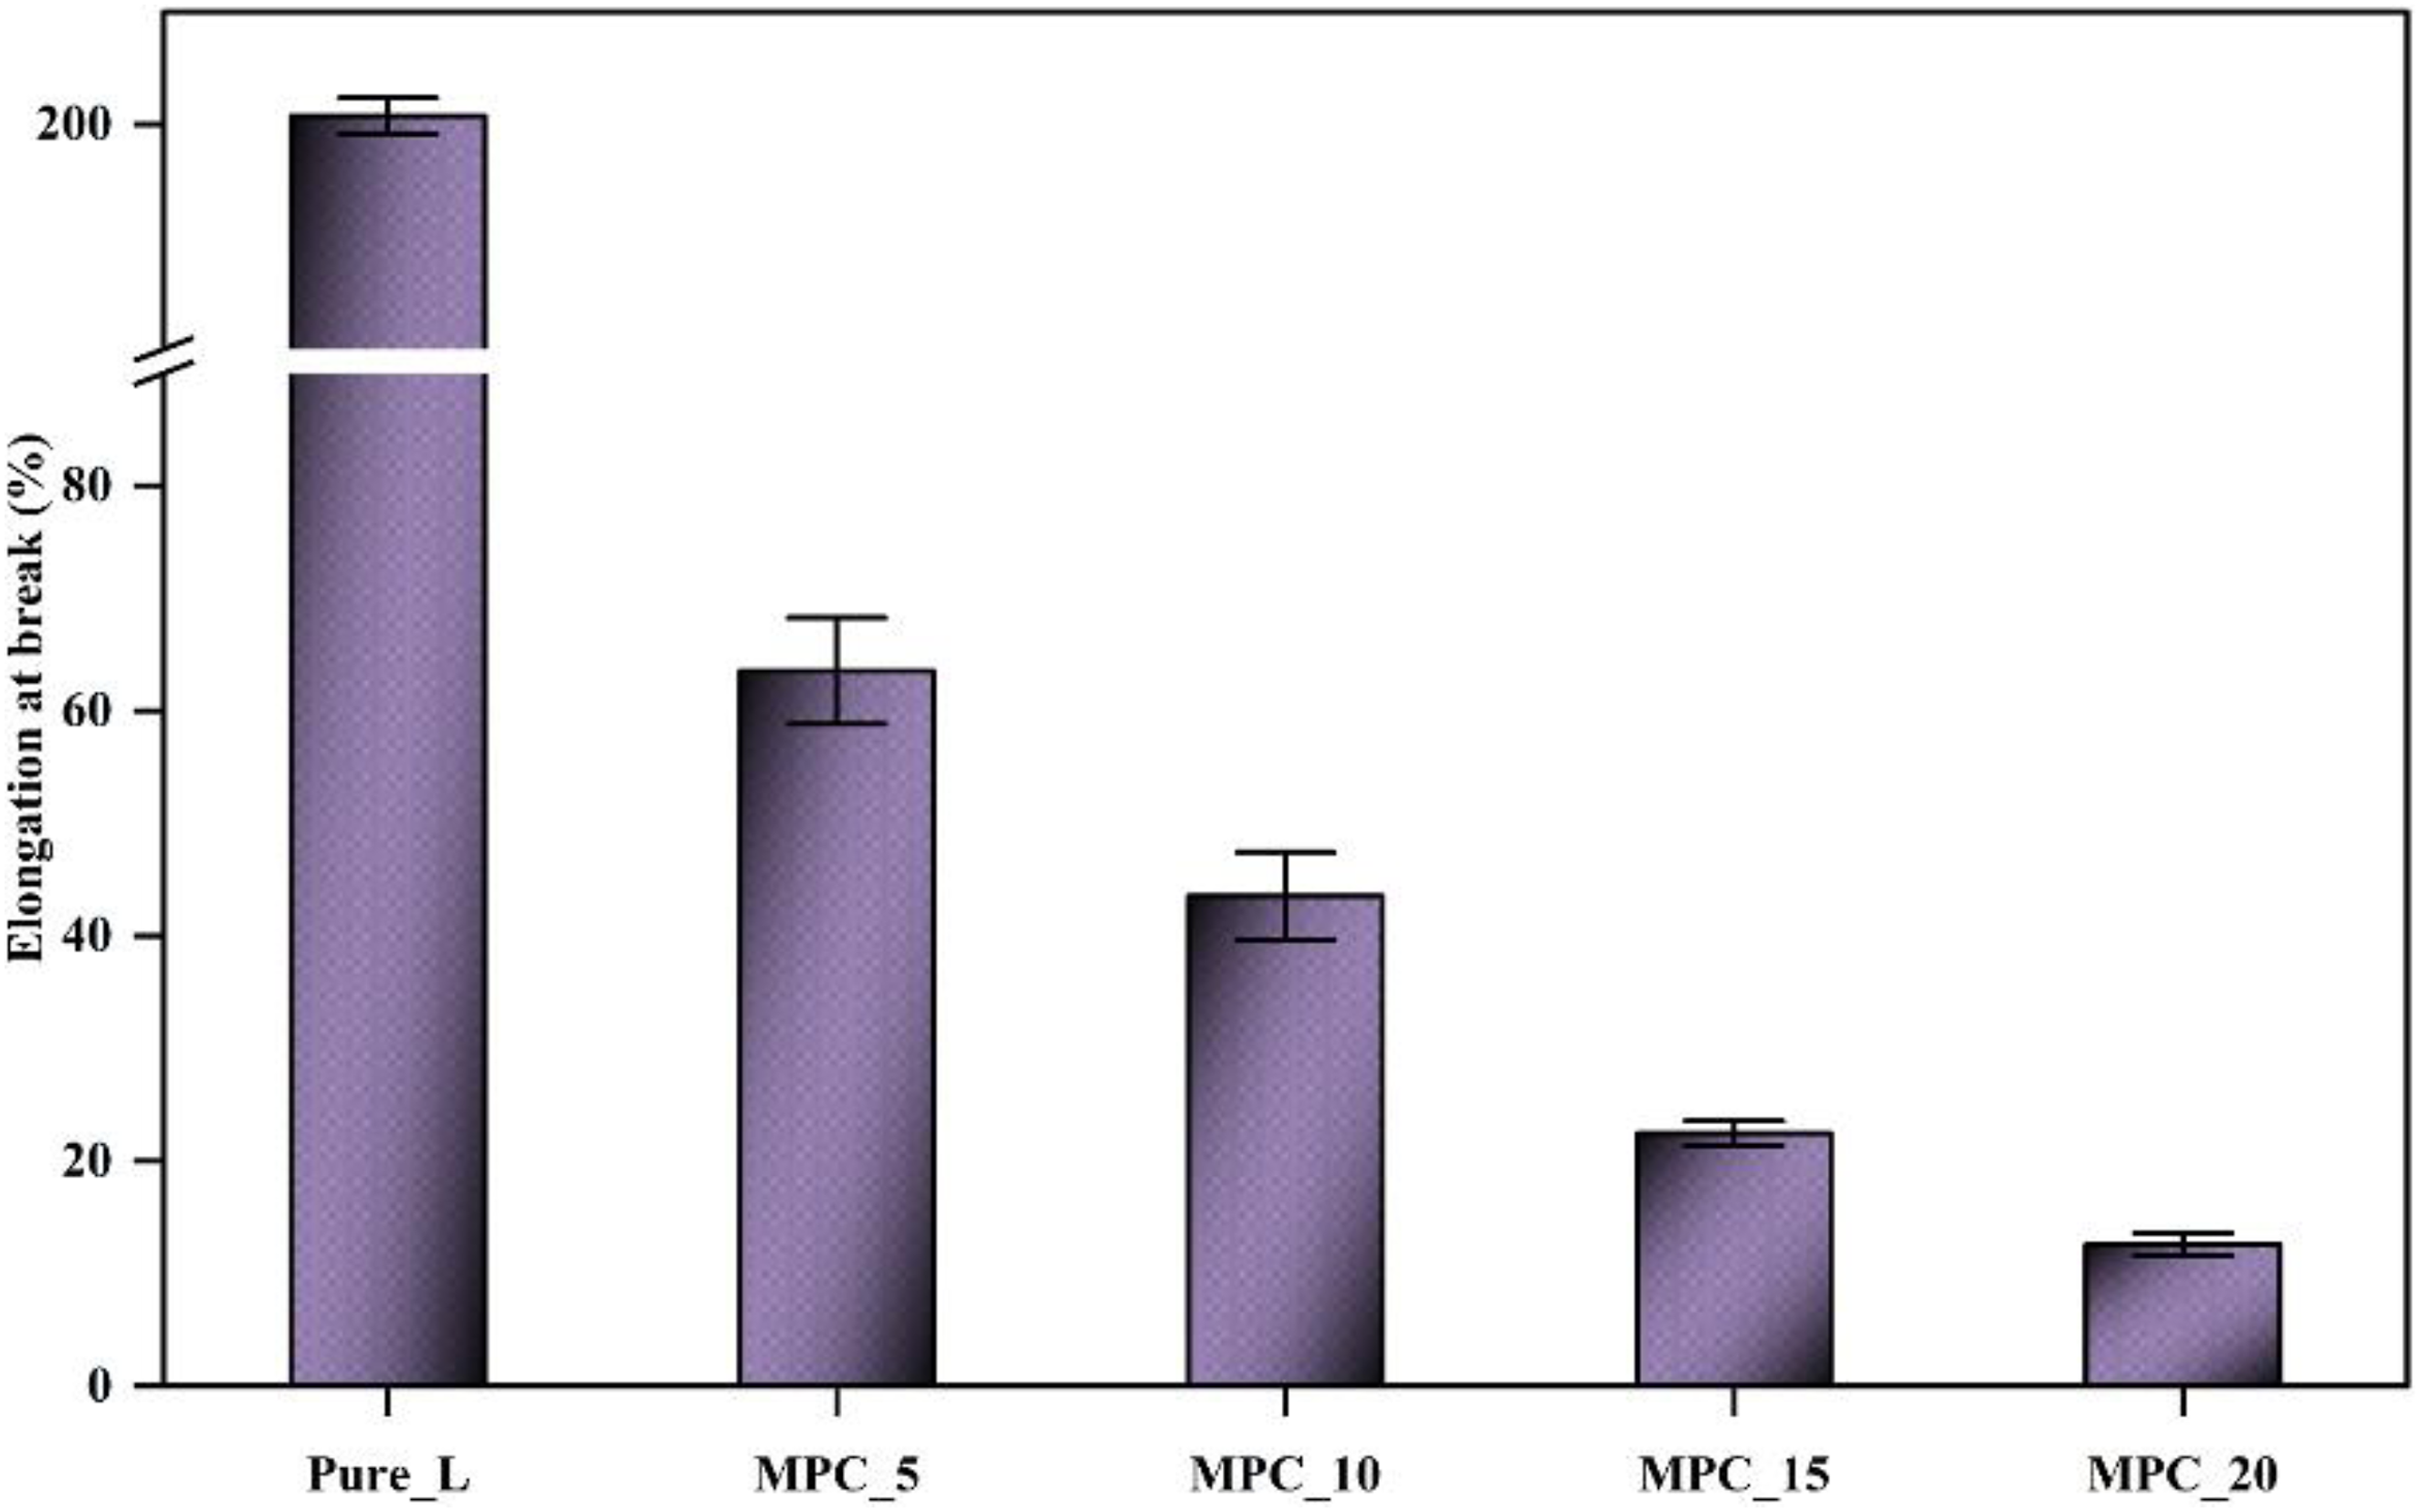
in their research on LDPE with FA composites. Tensile testing for LLDPE/FA composites; (a) tensile strength, (b) Young’s modulus. Elongation at break as a function of FA content.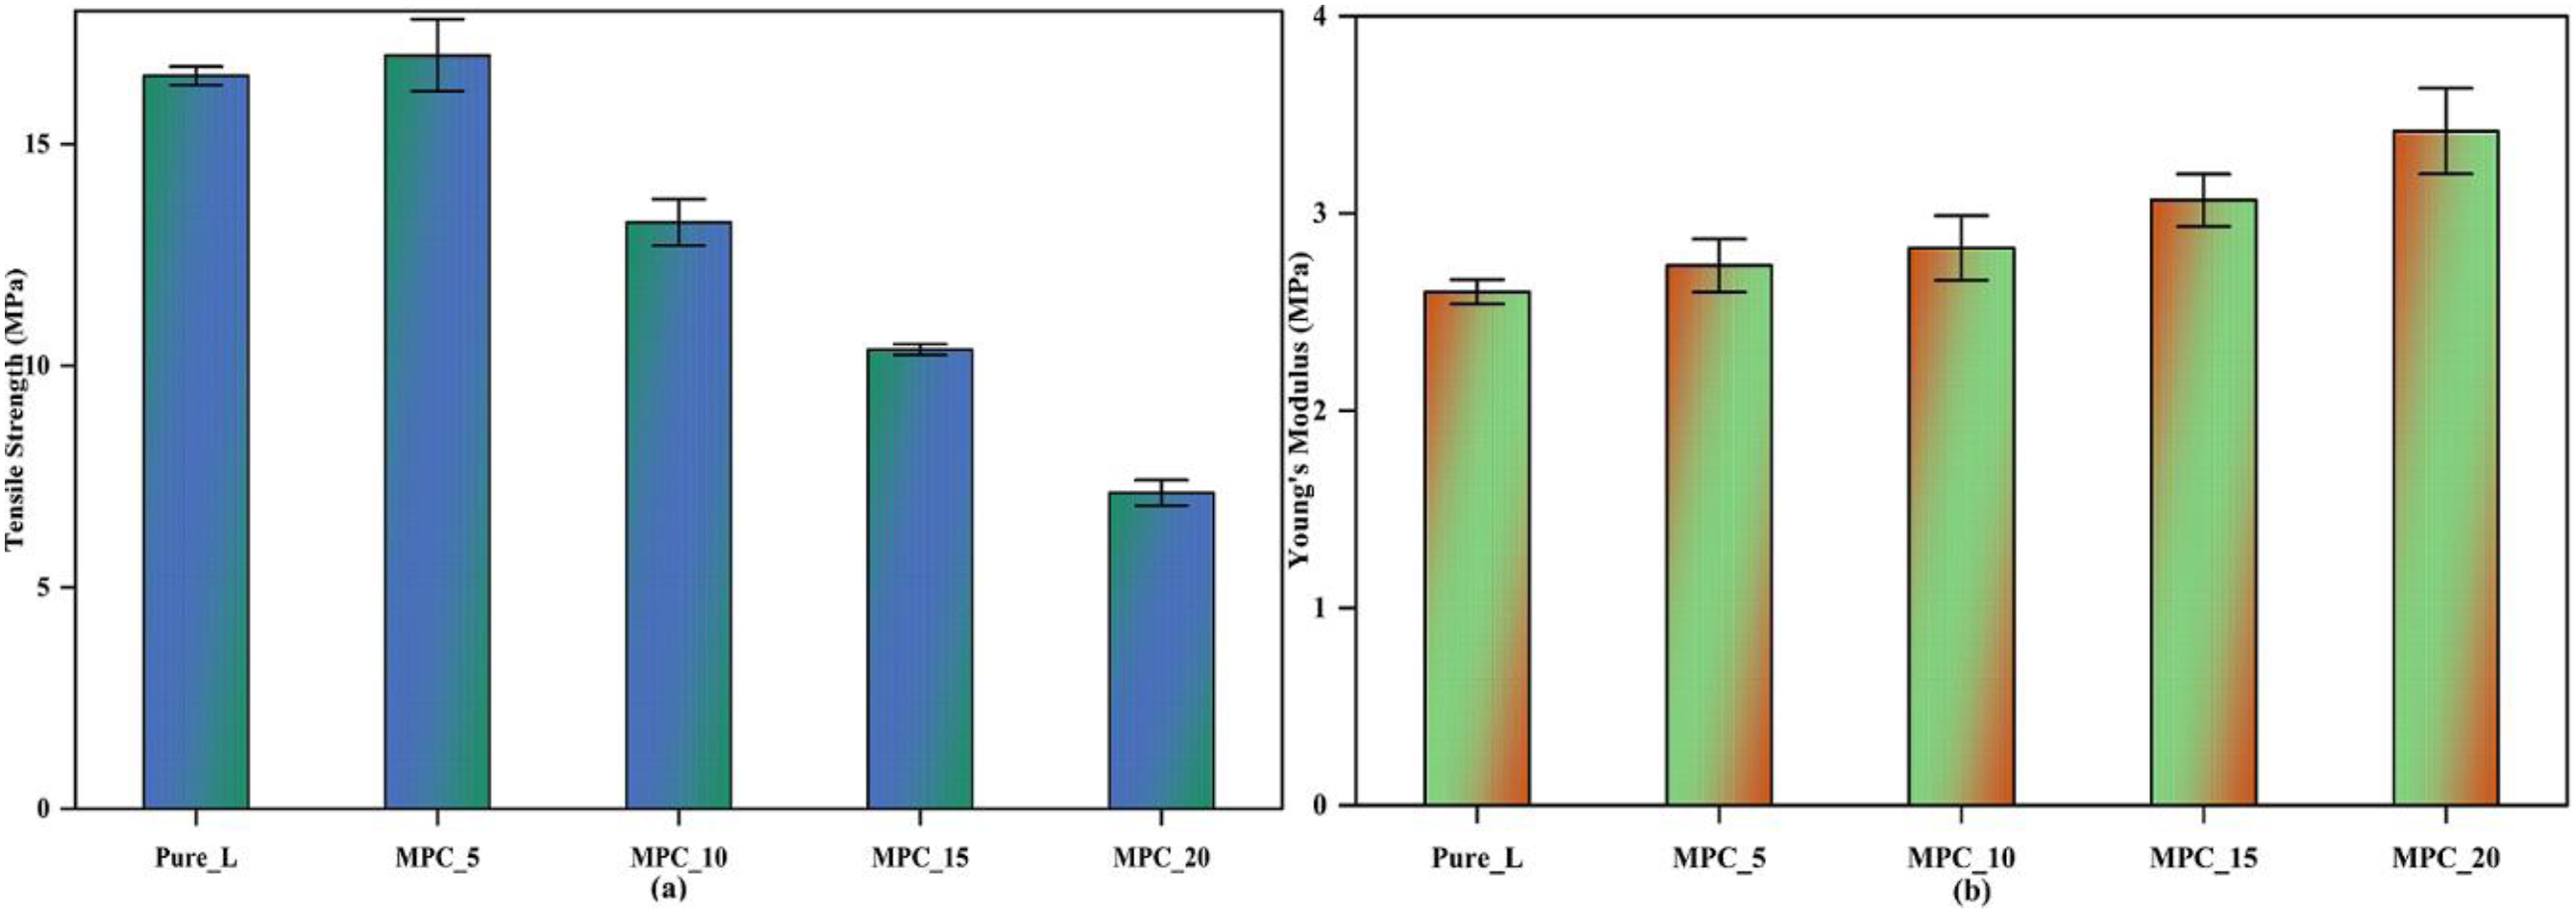
Moreover, the presence of active polar sites, stemming from the significant presence of silicon and oxygen atoms in the FA, contributes to improved adhesion with the base matrix. Consequently, this enhancement leads to increased tensile strength and modulus in the final product. As the FA content increases above to 5%, particles tend to agglomerate, resulting in poor dispersion and the formation of stress concentrators. These agglomerates act as weak points within the composite, diminishing the reinforcing effect and consequently leading to a reduction in strength. Various researchers reported similar outcomes for different composite materials.39,46
The reduction in tensile strength is correlated with a significant reduction in elongation at break. As Figure 15 illustrates that the elongation at break decreased from 200% for pure LLDPE to 12% for a 20% concentration of FA particles. The reduction in elongation at break with increasing FA particles is attributed to the higher stiffness of the particles, consequently diminishing the ductility of the composite. Introducing stiff (low elasticity) particles creates localized flaws in the polymer network, leading to reduced elongation at break for composites compared to the virgin matrix. This tendency is consistent with prior findings for mineral polymer composites. 43 Figure 11(a) confirms that the 5% FA/LLDPE composite exhibits a uniform distribution with few agglomerations. However, with an increase in FA content, agglomeration becomes more prominent. This may result in inadequate load transfer between the FA particles and polymer matrix, consequently reducing the tensile strength and strain.
Flexural test
The three bending tests yield a standard flexural curve showing how flexural strain changes over the course of the test. Through this test, the flexural strength and flexural modulus values of the novel LLDPE composites were determined. Figure 16(a) depicts the relationship between the weight percentage of FA and the flexural strength of LLDPE composites. With the increase in FA concentration, there was a decrease in the flexural strength of LLDPE composites. The flexural strength decreased by 6.65% as we transitioned from MPC_5 to MPC_10. However, when the weight content as further increased to 15%, this decrement escalated to 16.76%. Furthermore, the highest decrement, approximately 32%, was observed at 20% FA content. Variation in (a) Flexural strength; (b) Flexural modulus with FA content.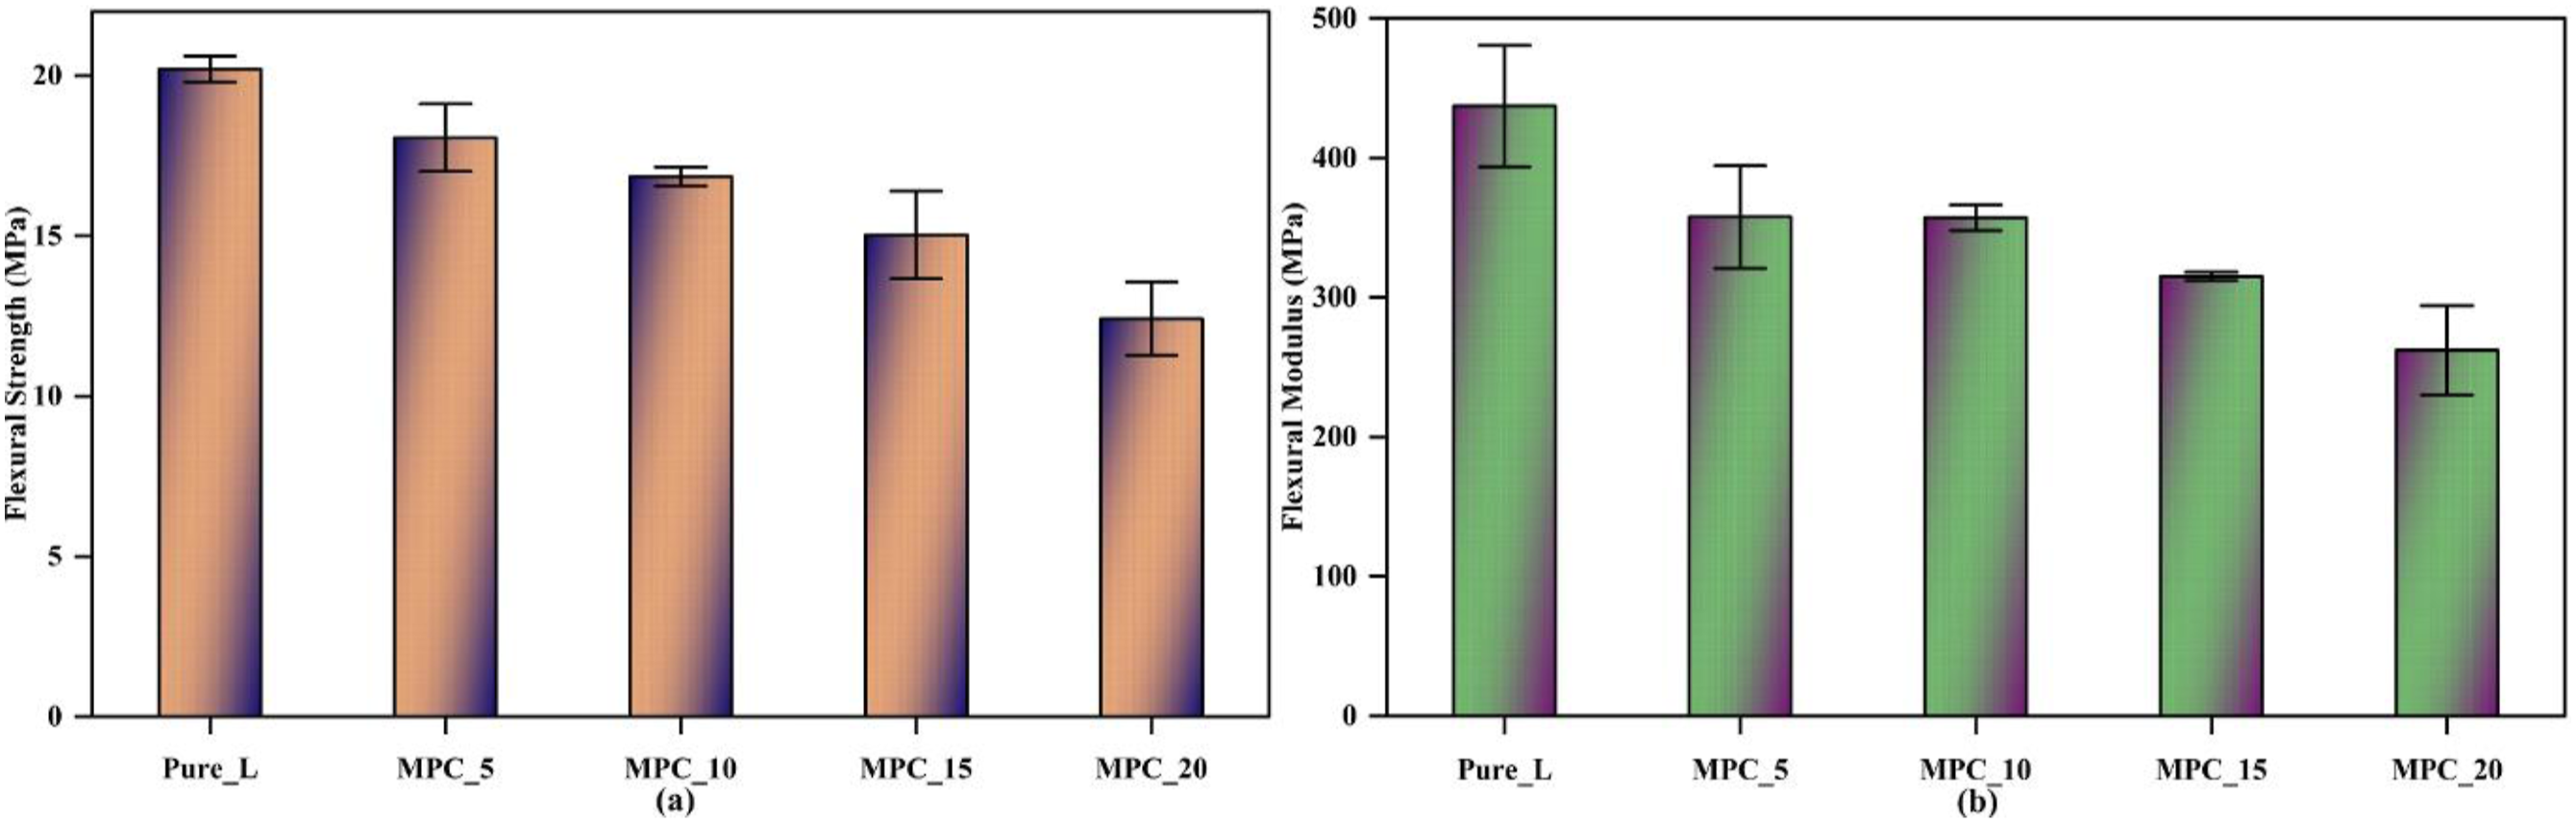
The flexural modulus exhibited a similar trend to the strength. It decreased by less than 1% when transitioning from 5 to 10% FA content. However, with an increase in FA content to 15%, there was a sudden decrease of approximately 12%. Subsequently, with further increase to 20% FA content, the flexural modulus decreased by 27%. The aggregation of particles and the subsequent decrease in interface contact area between the LLDPE matrix and FA particles are account for the loss in flexural characteristics. 47 An increase in the percentage of FA weight causes the particles to aggregate and lose strength.
Impact test
The impact specimens exhibited a similar pattern to the flexural properties (Figure 17), showing a reduction of approximately 6% when transitioning from 5 to 10% (from 99.8 MPa to 93.4 MPa) of FA particles. However, there was a notable decrease of 39% in impact strength when the FA content was further increased to 15%. The incorporation of FA content into the matrix impeding the deformation and ductile mobility of the polymer matrix, while concurrently increasing stiffness. This is due to the heightened interaction between the FA particles, leading to increased agglomeration within the polymer matrices. These agglomerates act as crack initiators, facilitating crack propagation and ultimately resulting in diminished impact properties of the composite part. Impact testing results of various samples of polymer composites.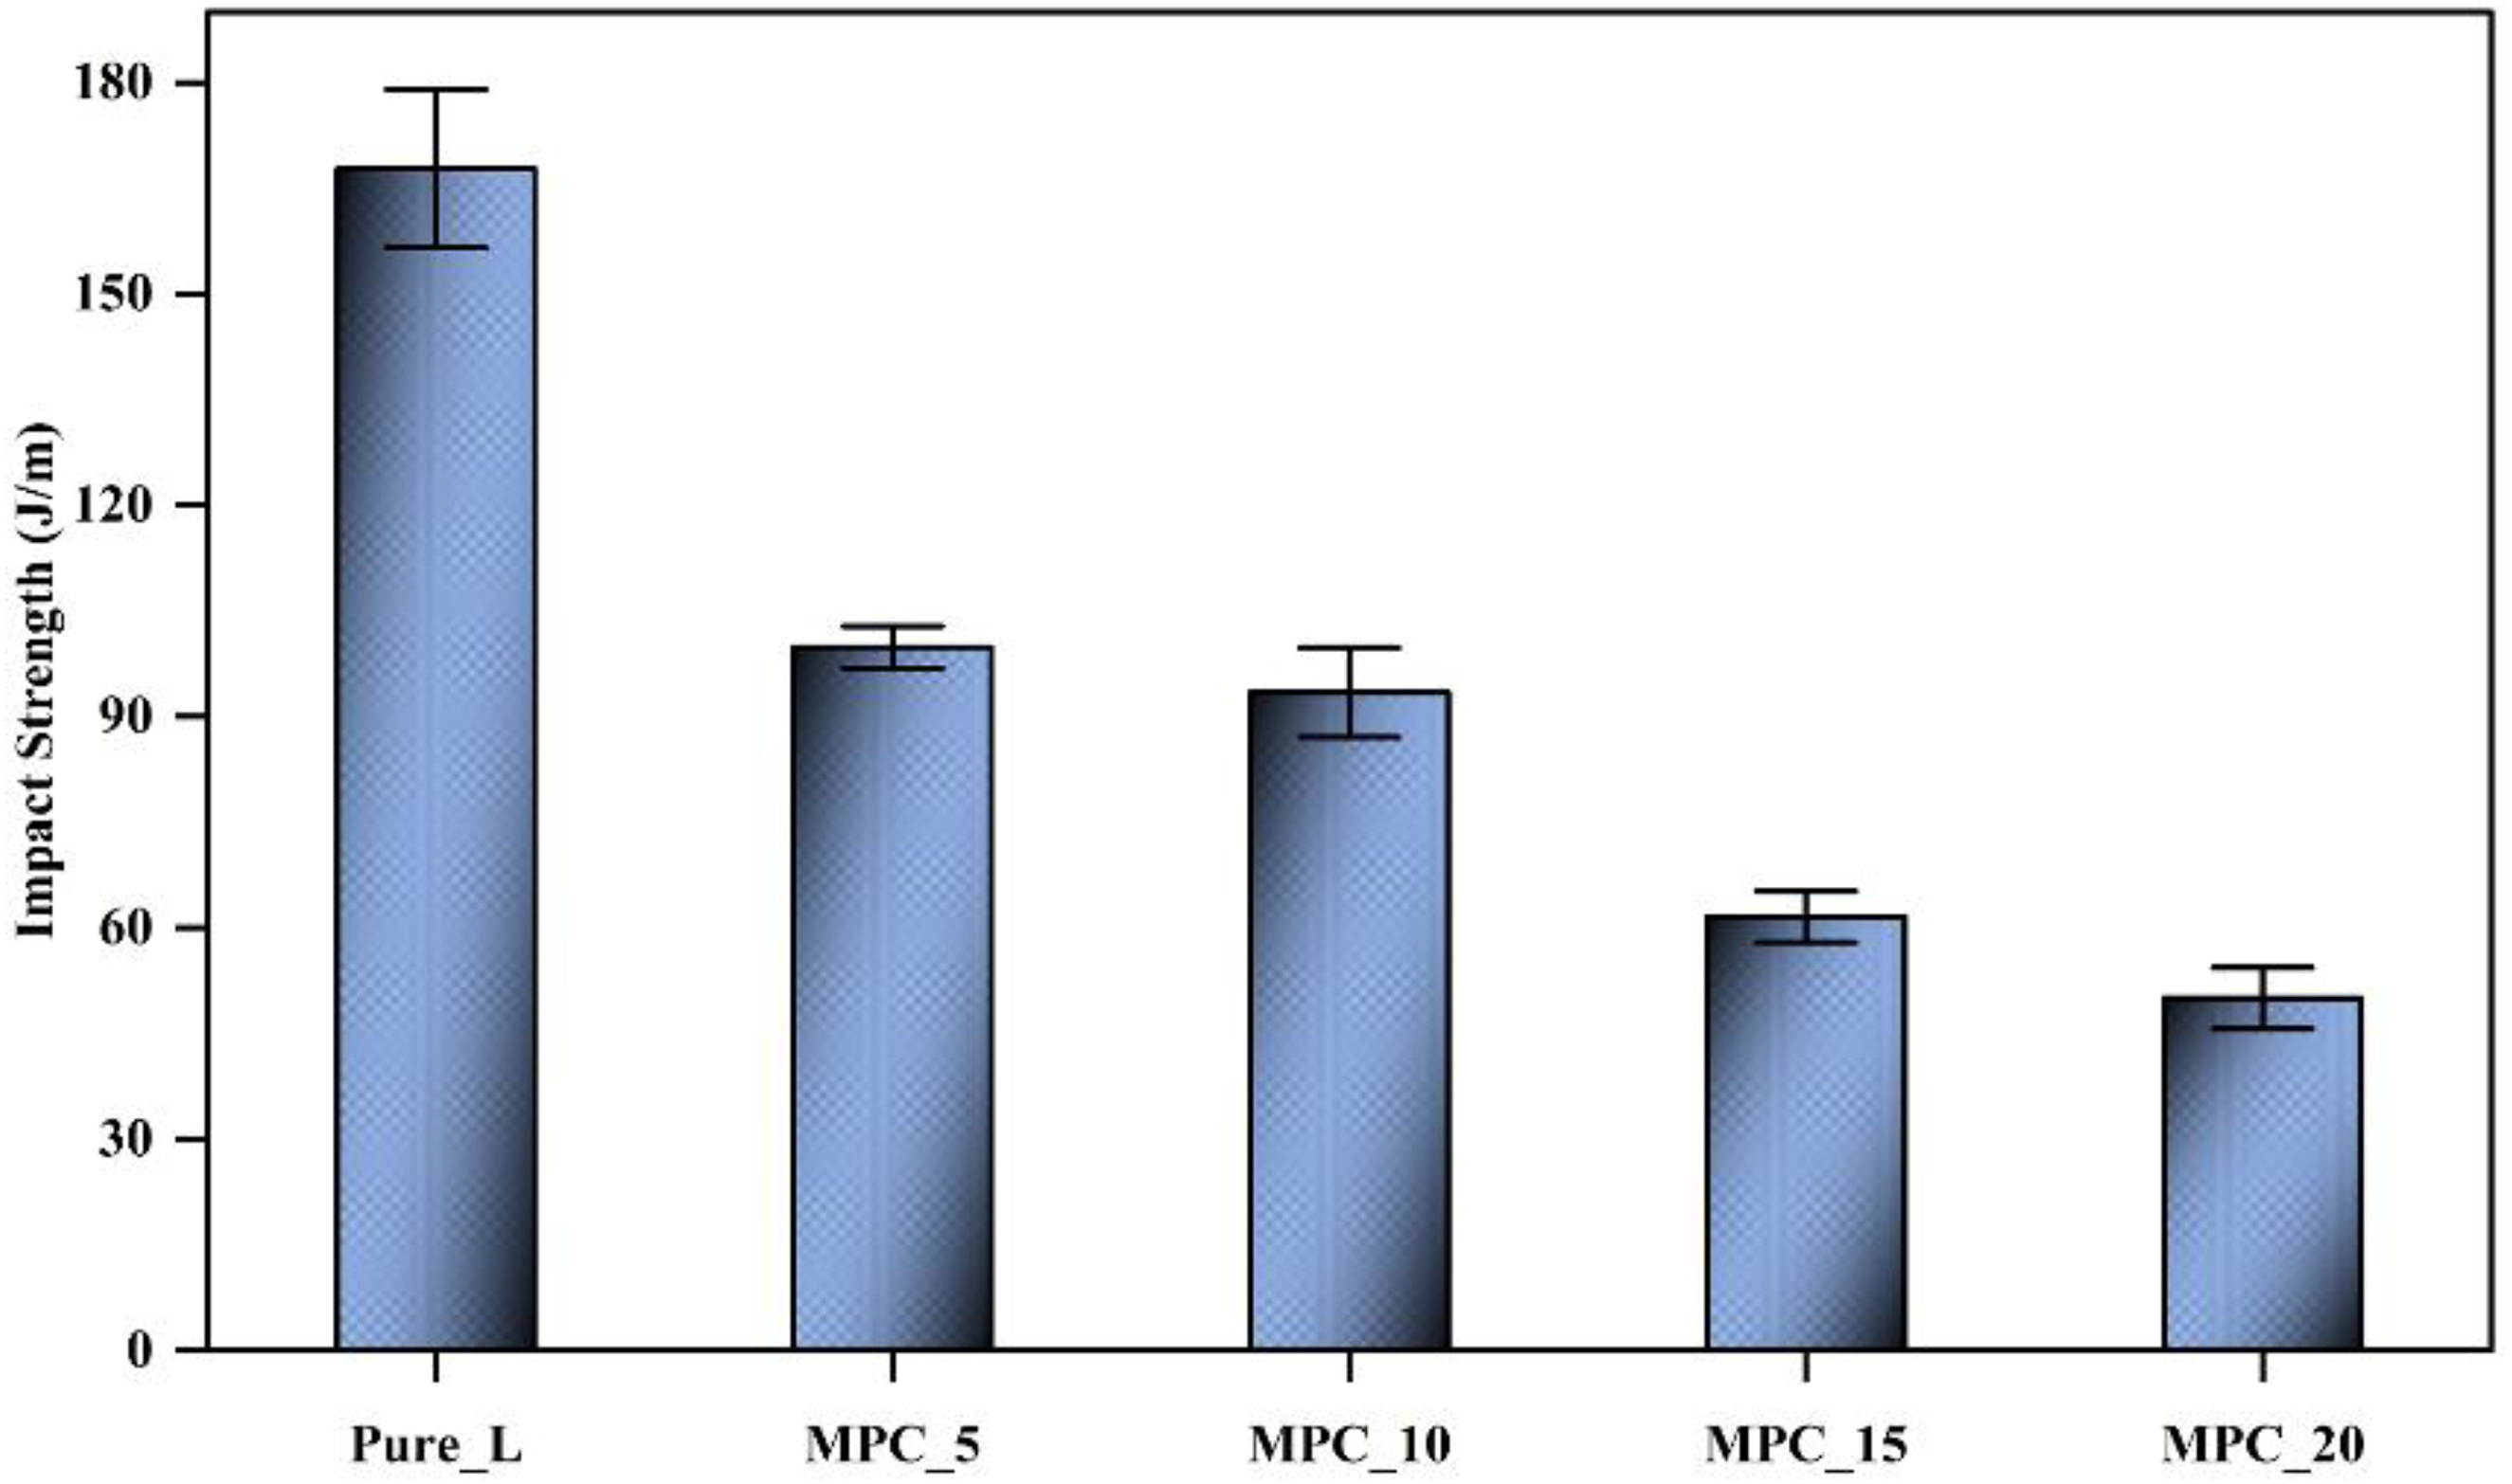
The composites exhibited fewer agglomerations and smaller voids on the surface, as depicted in Figure 11(a) and (b), in contrast to other SEM images showing 15 and 20 weight % of FA. Moreover, it is evident that the impact strength decreased by 50% as the FA content increased from 5 to 20% in the polymer. A similar pattern was observed in the study on FA with LDPE composites by Chaochanchaikul et al. 45 The deterioration could stem from deficiencies introduced during production, potentially caused by clustered FA particles within the composite material, as illustrated in Figure 11(c) and (d). The presence of these voids negatively impacts impact strength, as cracks tend to initiate from them. Furthermore, FA particles create zones of high concentration where cracks can initiate with less energy. These regions are prone to areas of poor interfacial bonding, especially where FA content segregates. Achieving an optimal level of adhesion is crucial to enhancing impact strength. 48 The outcomes retain the characteristics and enable a 10% increase in weight of FA in LLDPE while still maintaining rotomoldability.
Hardness
Figure 18 illustrates the correlation between the weight percentage of FA and hardness of the composites. The incorporation of FA into the LLDPE matrix significantly impacts the hardness of the composites, aligning with findings by Najim et al.
49
Incorporating FA particles into the polymer matrix results in an increase in the hardness value, with the maximum hardness reaching 54 Shore D for a 5% FA content, compared to pure LLDPE, which has a hardness of 49 Shore D (improved by 10.2%). This can be attributed to the particles enhancing the matrix’s ability to resist plastic deformation. Relationship between FA wt% and shore D hardness of LLDPE composites.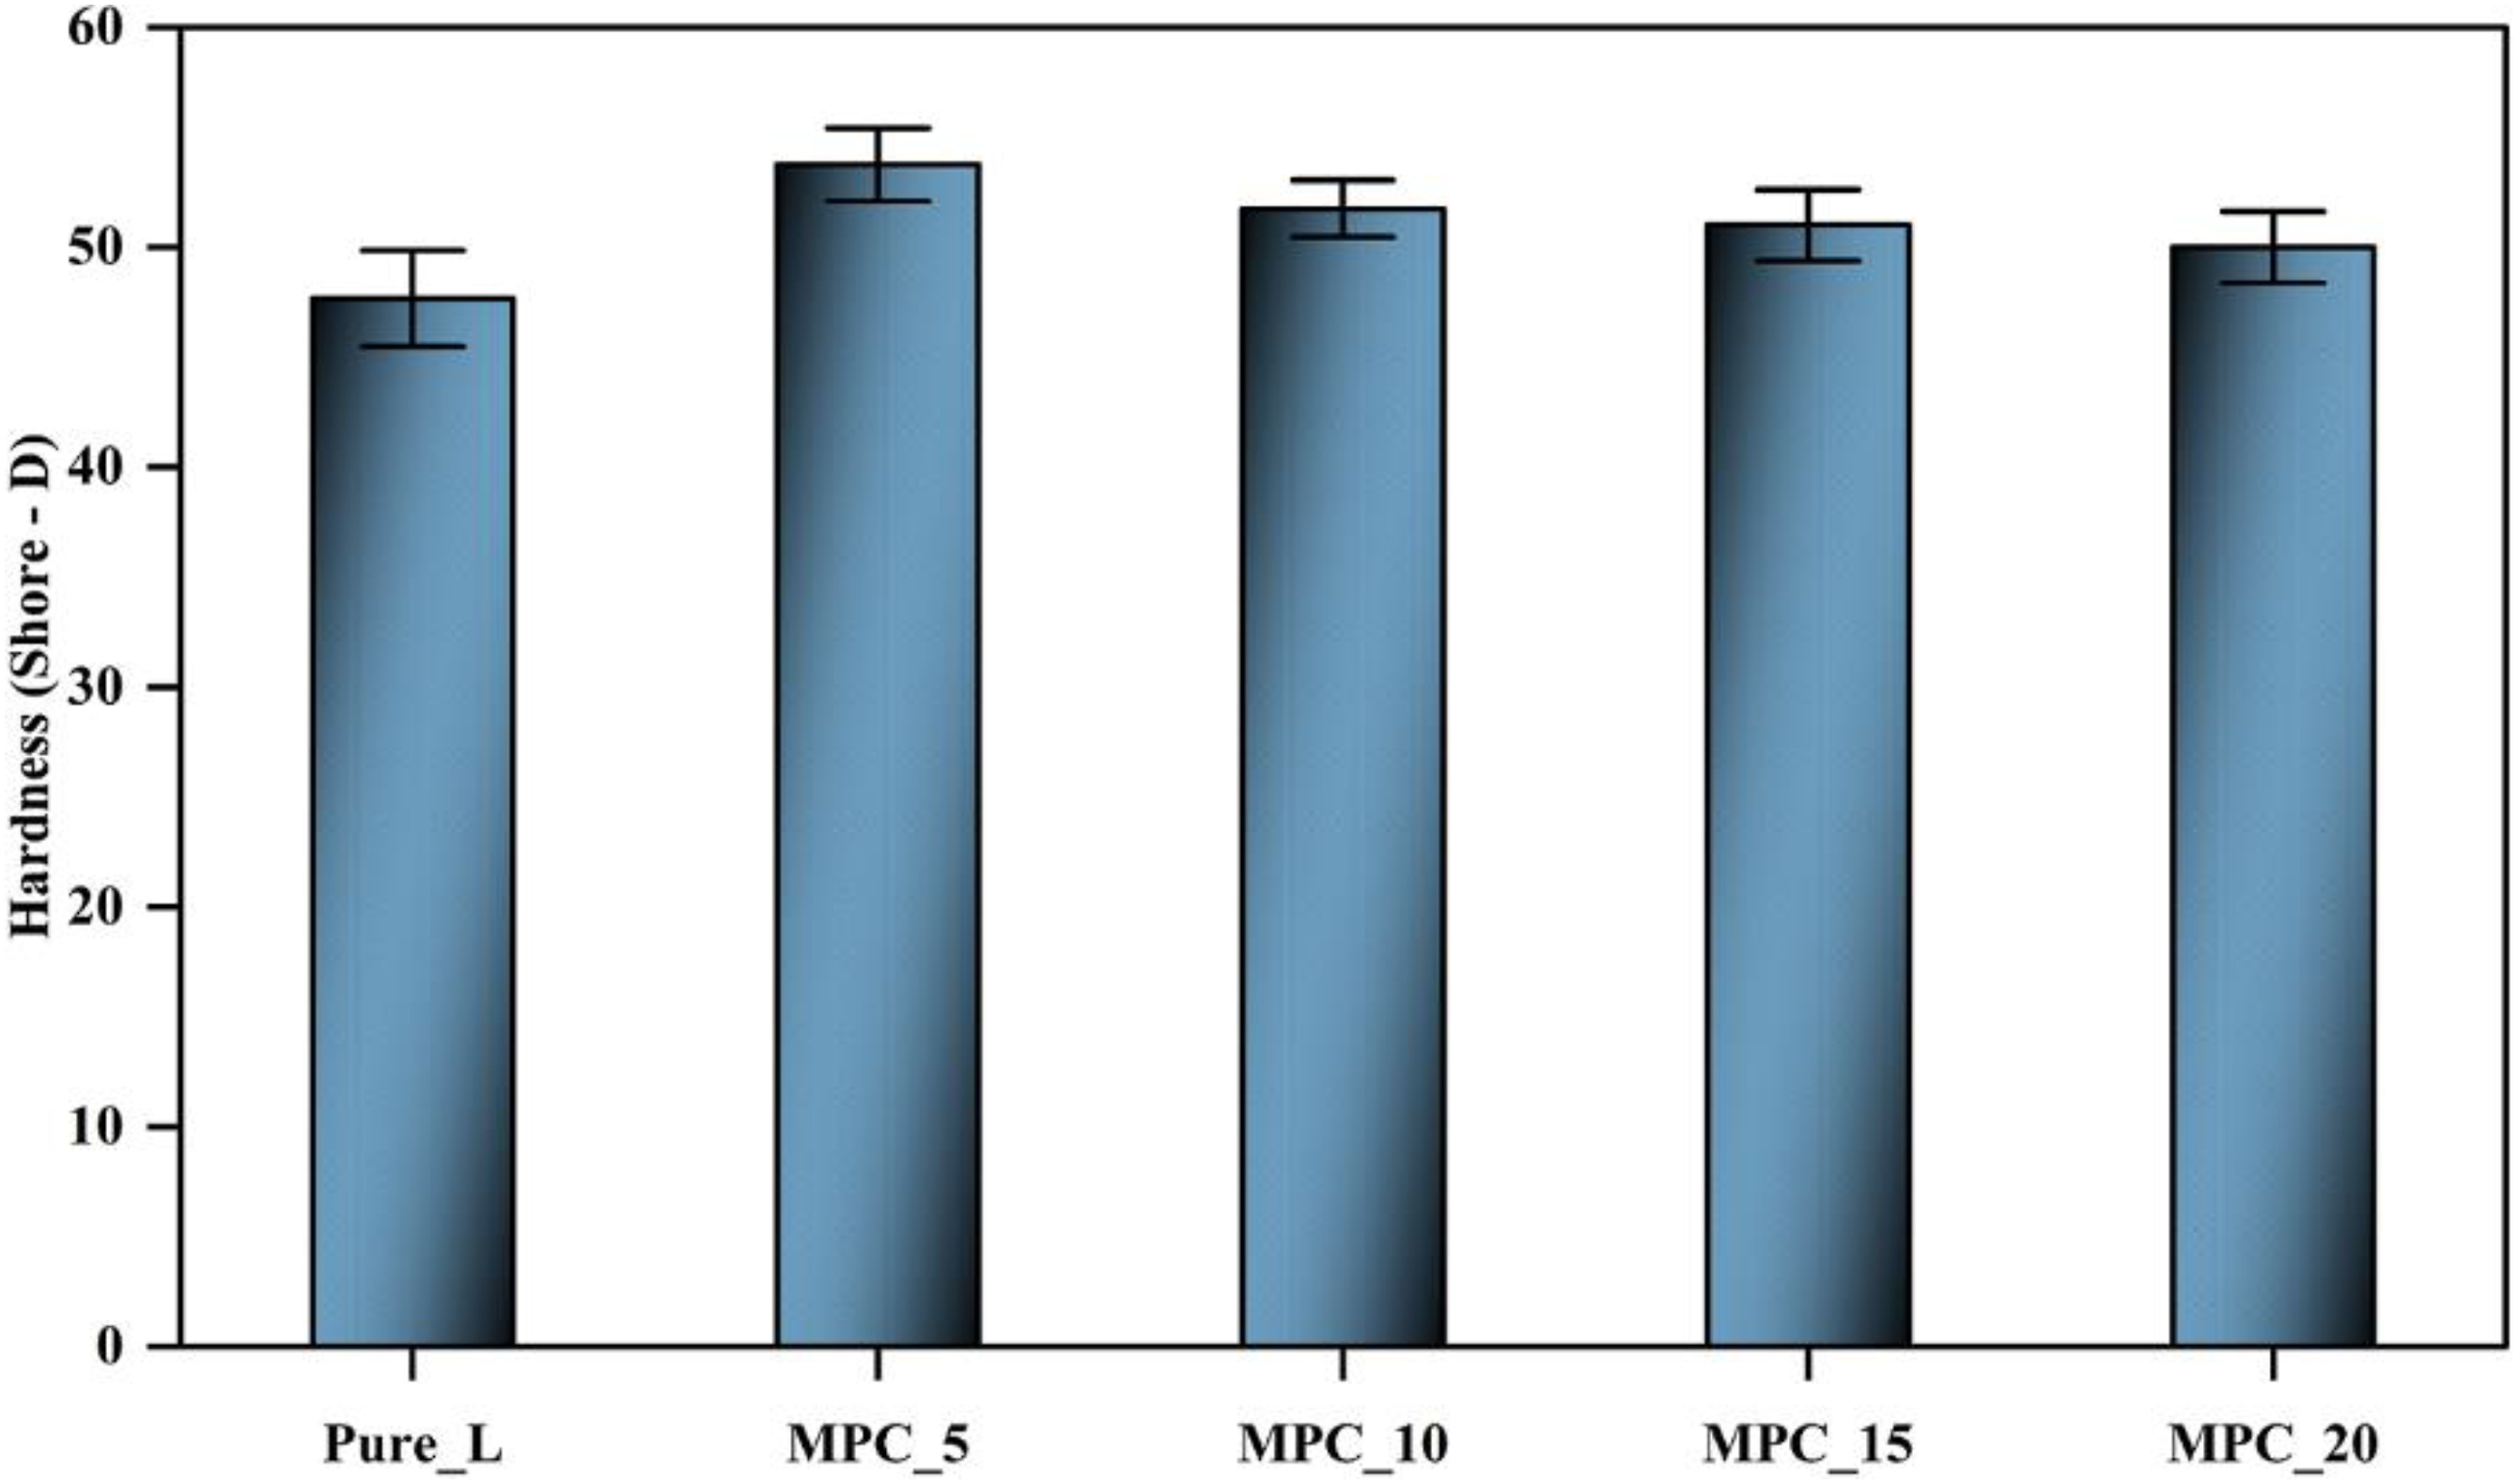
The hardness of PP composites is expected to rise due to the hard nature of the dispersed FA particles, juxtaposed with the relatively soft LLDPE matrix. The results indicate that as we increase the FA content from 5% to 20%, there is a decrease in the hardness of the composites. This phenomenon may be attributed to the increase in voids, which transition from being fewer and smaller in size to becoming larger and more numerous as the FA content rises.
This observation is supported by SEM and microscopic images, as depicted in Figures 9, 11 and 12. Even with the lowest hardness recorded at 50 Shore D, the samples containing 20 wt.% FA content still exhibit hardness higher than that of pure LLDPE. The author has effectively created a novel LLDPE composite material that demonstrates desirable strength and hardness properties, offering a practical solution for re-purposing waste FA into valuable products. The results clearly demonstrate that polymer composites maintain satisfactory performance levels up to a filler content of 10%.
Conclusion
This research not only addresses the sustainability challenges posed by FA but also improves the mechanical properties of LLDPE composites through rotational molding, presenting a multi-dimensional solution to current dilemmas in materials science. Through the utilization of FA, a residual from power plants, in the rotational molding process of polymer composites, the study showcases substantial advancements in some mechanical characteristics such as tensile strength, young’s modulus and hardness. The observed trend in density highlights a critical threshold effect in the incorporation of FA into the polymer composite. Up to a 10% concentration of FA, the density of the composite steadily increased, indicating successful integration of the FA particles into the polymer matrix. Beyond this threshold, a significant observation emerged: FA particles prematurely accumulated on the polymer surface, hindering the complete melting and fusion of polymer granules. This premature coverage disrupted the cohesive joining of granules, resulting in a notable increase in material porosity and surface roughness. This highlights the crucial need to meticulously regulate FA content in composite formulation to enhance material properties and performance. In summary, the results indicate that due to the nature of the rotational molding process, the incorporation of substantial amounts of FA filler leads to a notable decline in mechanical properties. Considering the existing literature, it’s essential to highlight that with a well-chosen surface modification method and employing a matrix with the necessary low viscosity, there’s potential to produce a composite material with improved mechanical properties. Therefore, this work can be seen as a stepping stone for further research in this area. Indeed, while demanding structural applications may not be suitable, adjusting the FA content allows for tailoring FA/LLDPE composites to various applications based on their specific requirements. Moreover, the utilization of FA as a raw material promotes recycling, reuse, and energy conservation. Since FA is a byproduct of an existing process, its production requires no extra energy, aligning with the principles of a circular economy. This approach effectively addresses environmental concerns linked to waste disposal.
Footnotes
Acknowledgements
We also extend our thanks to Mr. Ravi Kadiwar, Managing Director of Greeange Industries Pvt. Ltd., Ahmedabad, for his support and provision of facilities.
Author contributions
Conceptualization: J. Yadav and P.L. Ramkumar; Methodology: J. Yadav; Formal Analysis: J. Yadav, P.L. Ramkumar, and A.K. Parwani; Writing—Original Draft Preparation: J. Yadav; Writing—Review and Editing: P.L. Ramkumar and A.K. Parwani; Supervision: P.L. Ramkumar and A.K. Parwani; Funding Acquisition: P.L. Ramkumar. All authors have read and approved the final version of the manuscript.
Declaration of conflicting interests
The author(s) declared no potential conflicts of interest with respect to the research, authorship, and/or publication of this article.
Funding
The author(s) disclosed receipt of the following financial support for the research, authorship, and/or publication of this article: This research was funded by the Science & Engineering Research Board (SERB), a statutory body of the Department of Science & Technology, Government of India, under grant number CRG/2021/000144.