
Abstract
The long-term performance of composite materials produced within the scope of lightweighting, should be examined with fatigue tests. Nonetheless, these tests take a long time and require a lot of energy. For overcoming these limitations, the thermographic method was used during the fatigue test and recorded temperature changes. Before starting the fatigue tests, the mechanical properties of glass fiber-reinforced Elium-based composites were clarified via tensile and three-point bending tests for two different fiber orientations (0/90 and 0/90/45). Then, the fatigue tests were carried out to identify the long-term performance of these materials. During the test, temperature values were recorded with an infrared camera. These values were converted to energy dissipated per cycle and temperature increase. These data established high cycle fatigue strength limits for both fiber orientations. In addition, using the fatigue test data, the potential cycles at lower stress values were calculated using a mathematical model and were validated with verification tests. With this method, the fatigue cycle has been predicted for high cycle fatigue tests and it carried out the validation test successfully with 93% similarity of fatigue cycle. Finally, the cycle numbers of all low-stress high-cycle fatigue tests were determined.
Keywords
Introduction
Lightweighting efforts still continue to be important, especially in the aerospace and automotive industries, due to increasing energy costs. However, these sectors expect their materials to be durable in dynamic conditions for a long time. Also, with the increase in climate awareness, importance has been given to the lightweighting of mass-produced passenger cars, trucks and the recycling of materials all over the world.1,2 As a result of this concern, materials that can be recycled and high density to weight ratio have started to be preferred in all products. Although materials with these features are produced with the contribution of new material technologies, it should always be checked whether the materials are suitable for the mechanical properties that will perform these processes.
Composite material studies continue to meet the expectations of a plenty of industries in engineering fields. Thermoset composite materials are still the dominant materials in the automotive 3 and aviation industries.4,5 Since these materials are not recyclable, they increase the quantity of polymer materials in the world and the nature suffers from these polymer wastes. Hence, the production of recyclable lightweight materials is encouraged all around the world.
Unlike thermoset materials, thermoplastic materials are recyclable and the desired strength level of them can be increased with reinforcements materials.5–7 Although studies on these materials appear gradually in the literature, fatigue testing studies on characterization of their long-term performance is still not sufficient. Especially at low stress level, fatigue tests take quite a long time.8,9 These efforts return as both energy waste and labour waste. On account of this, these innovative materials must be carefully monitored throughout fatigue tests.
As a result of some studies, it has been observed that the temperature values of the surface on thermoplastic composite materials increase during the fatigue tests.10–12 While only temperature values can be read with laser thermography, thermographs can be photographed at the same time via an infrared camera. In addition, this glass fiber reinforced thermoplastic composite material shows self-heating during the fatigue test. In other words, the temperature of this material increases after each cycle. In this way, if the temperature change can be monitored, the fatigue life can also be monitored. Moreover, fatigue tests take a very long time, so if the temperature change method is used and an analytical formula can be established between the temperature change and fatigue life, the temperature change can be recorded and monitored from moment to moment when such a long test is to be performed. For this reason, the thermography method with an infrared camera is increasing its popularity due to provability.13,14
It has been determined by various studies that the temperature increase during the fatigue test is caused by the stiffness degradation of material during the fatigue test.15,16 Research on the effect of this temperature change on the fatigue life of the material are limited only to thermoset based fiber reinforced thermoset matrix composite materials with numerous techniques.17–19 However, when environmentalism is gaining importance these days for decreasing the amount of CO2 emissions and global warming, dynamic tests of recyclable and novel Elium® thermoplastic based composite materials should be analysed more carefully.20–22 Even though mechanical characterizations of this material have been carried out, the fatigue life estimation in different fiber orientations has not been studied yet.23,24
At the same time, this novel Elium® matrix composite material can be cured in the microwave without any additives.25,26 This additional process increases the productivity and decreases the material usage directly. Since it makes the manufacturing of this material quite straightforward, it can often be used in automotive and aviation industry.27,28 Therefore, research on this material should be increased in order to enhance the use of environmentally friendly materials.
In this study, the mechanical characterization of two different laminates with fiber orientation 0/90 and 0/90/45 novel glass fiber reinforced Elium® based composite materials has been done. This innovative material will be used as soon as possible in transportation vehicles in the European Union countries, so fatigue life tests must be carried out to understand the long-term life of this material. Although there are fatigue prediction studies on thermoset matrix composite materials, there has not been enough study on the determination of fatigue life prediction of innovative recyclable materials by thermographic approach method. Firstly, the tensile tests have been done for identifying the ultimate tensile strength. After that, the fatigue tests have been completed with six different stress levels. During the fatigue test, the temperature increase of the material has been monitored via IR thermography method. The collected data of displacement and stress have been used for calculating the energy dissipation for all cycles. This data has been correlated with the temperature increase via a mathematical equation. By observing this correlation, both the high cycle fatigue strength of the material has been determined and the cycle of low stress levels, which the tests are time consuming, has been estimated. Thus, temperature increase can be monitored instantly and high cycle fatigue can be made using various mathematical equations. Finally, the fatigue limit has been determined with stabilized temperature method. Moreover, by determining the coefficients within the temperature change numerically, the number of fracture cycles at low stress values was accurately predicted.
Material and methods
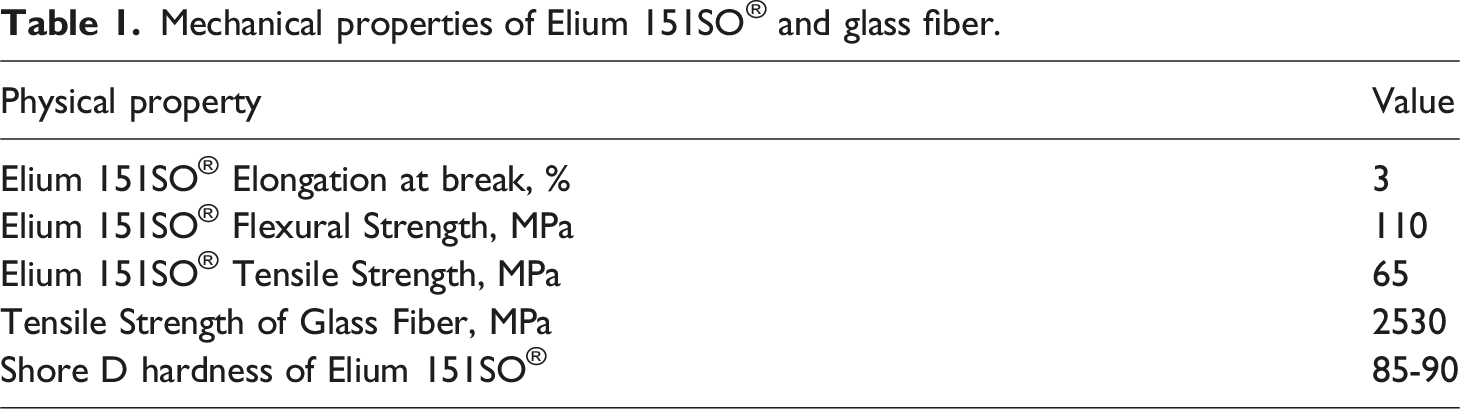
Mechanical properties of Elium 151SO® and glass fiber.
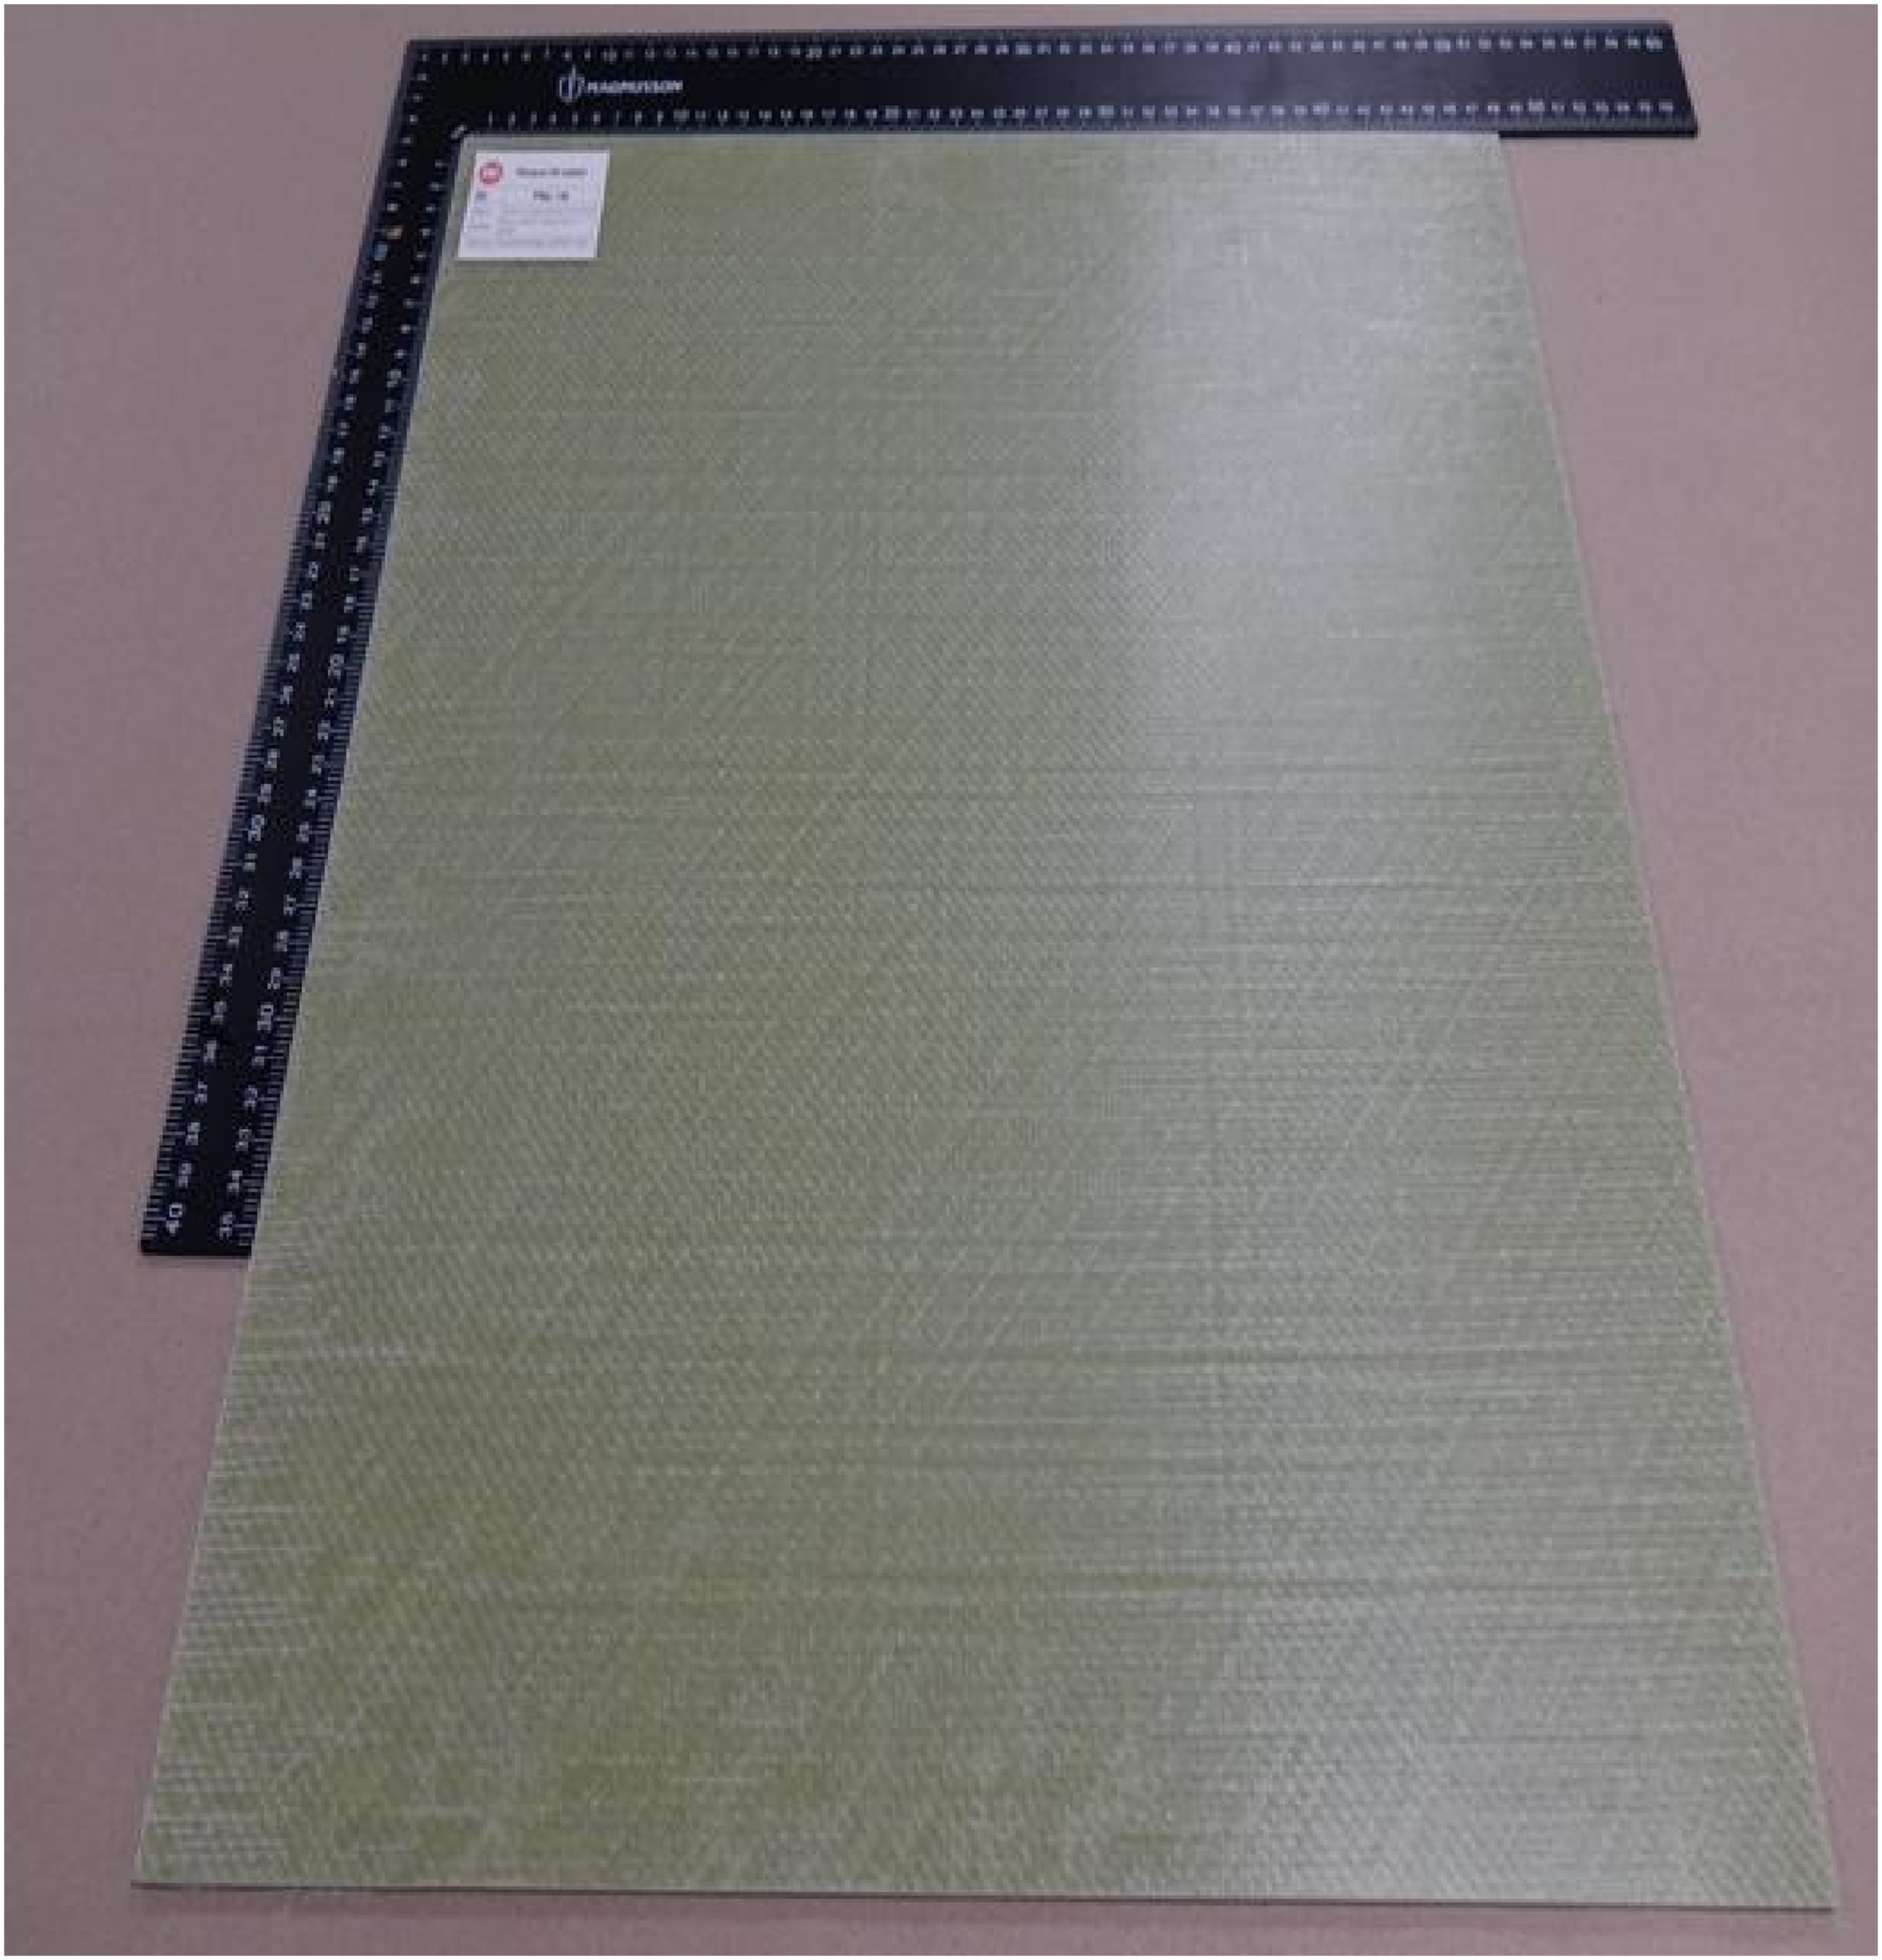
An example of glass fiber reinforced Elium composite plaque.
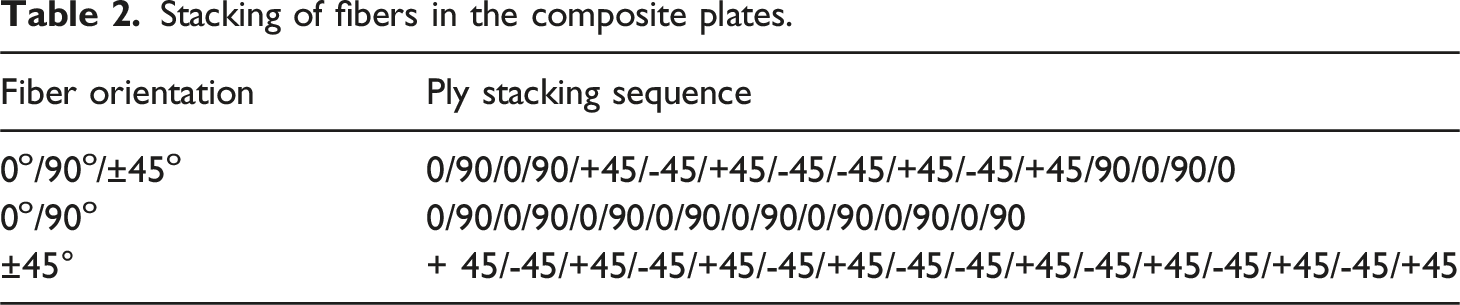
Stacking of fibers in the composite plates.
The desired specimen dimension has been prepared both by abrasive water jet cutting and user- controlled saw for tensile and fatigue testing. The dimensions of these specimen are same and they are 25 mm in width, 150 mm in length and 3.6 mm in thickness for both different fiber orientation. The height of the sample remained the same as the height of the plaque. Both tensile and fatigue testing samples are represented in Figure 2. The tensile and fatigue testing samples.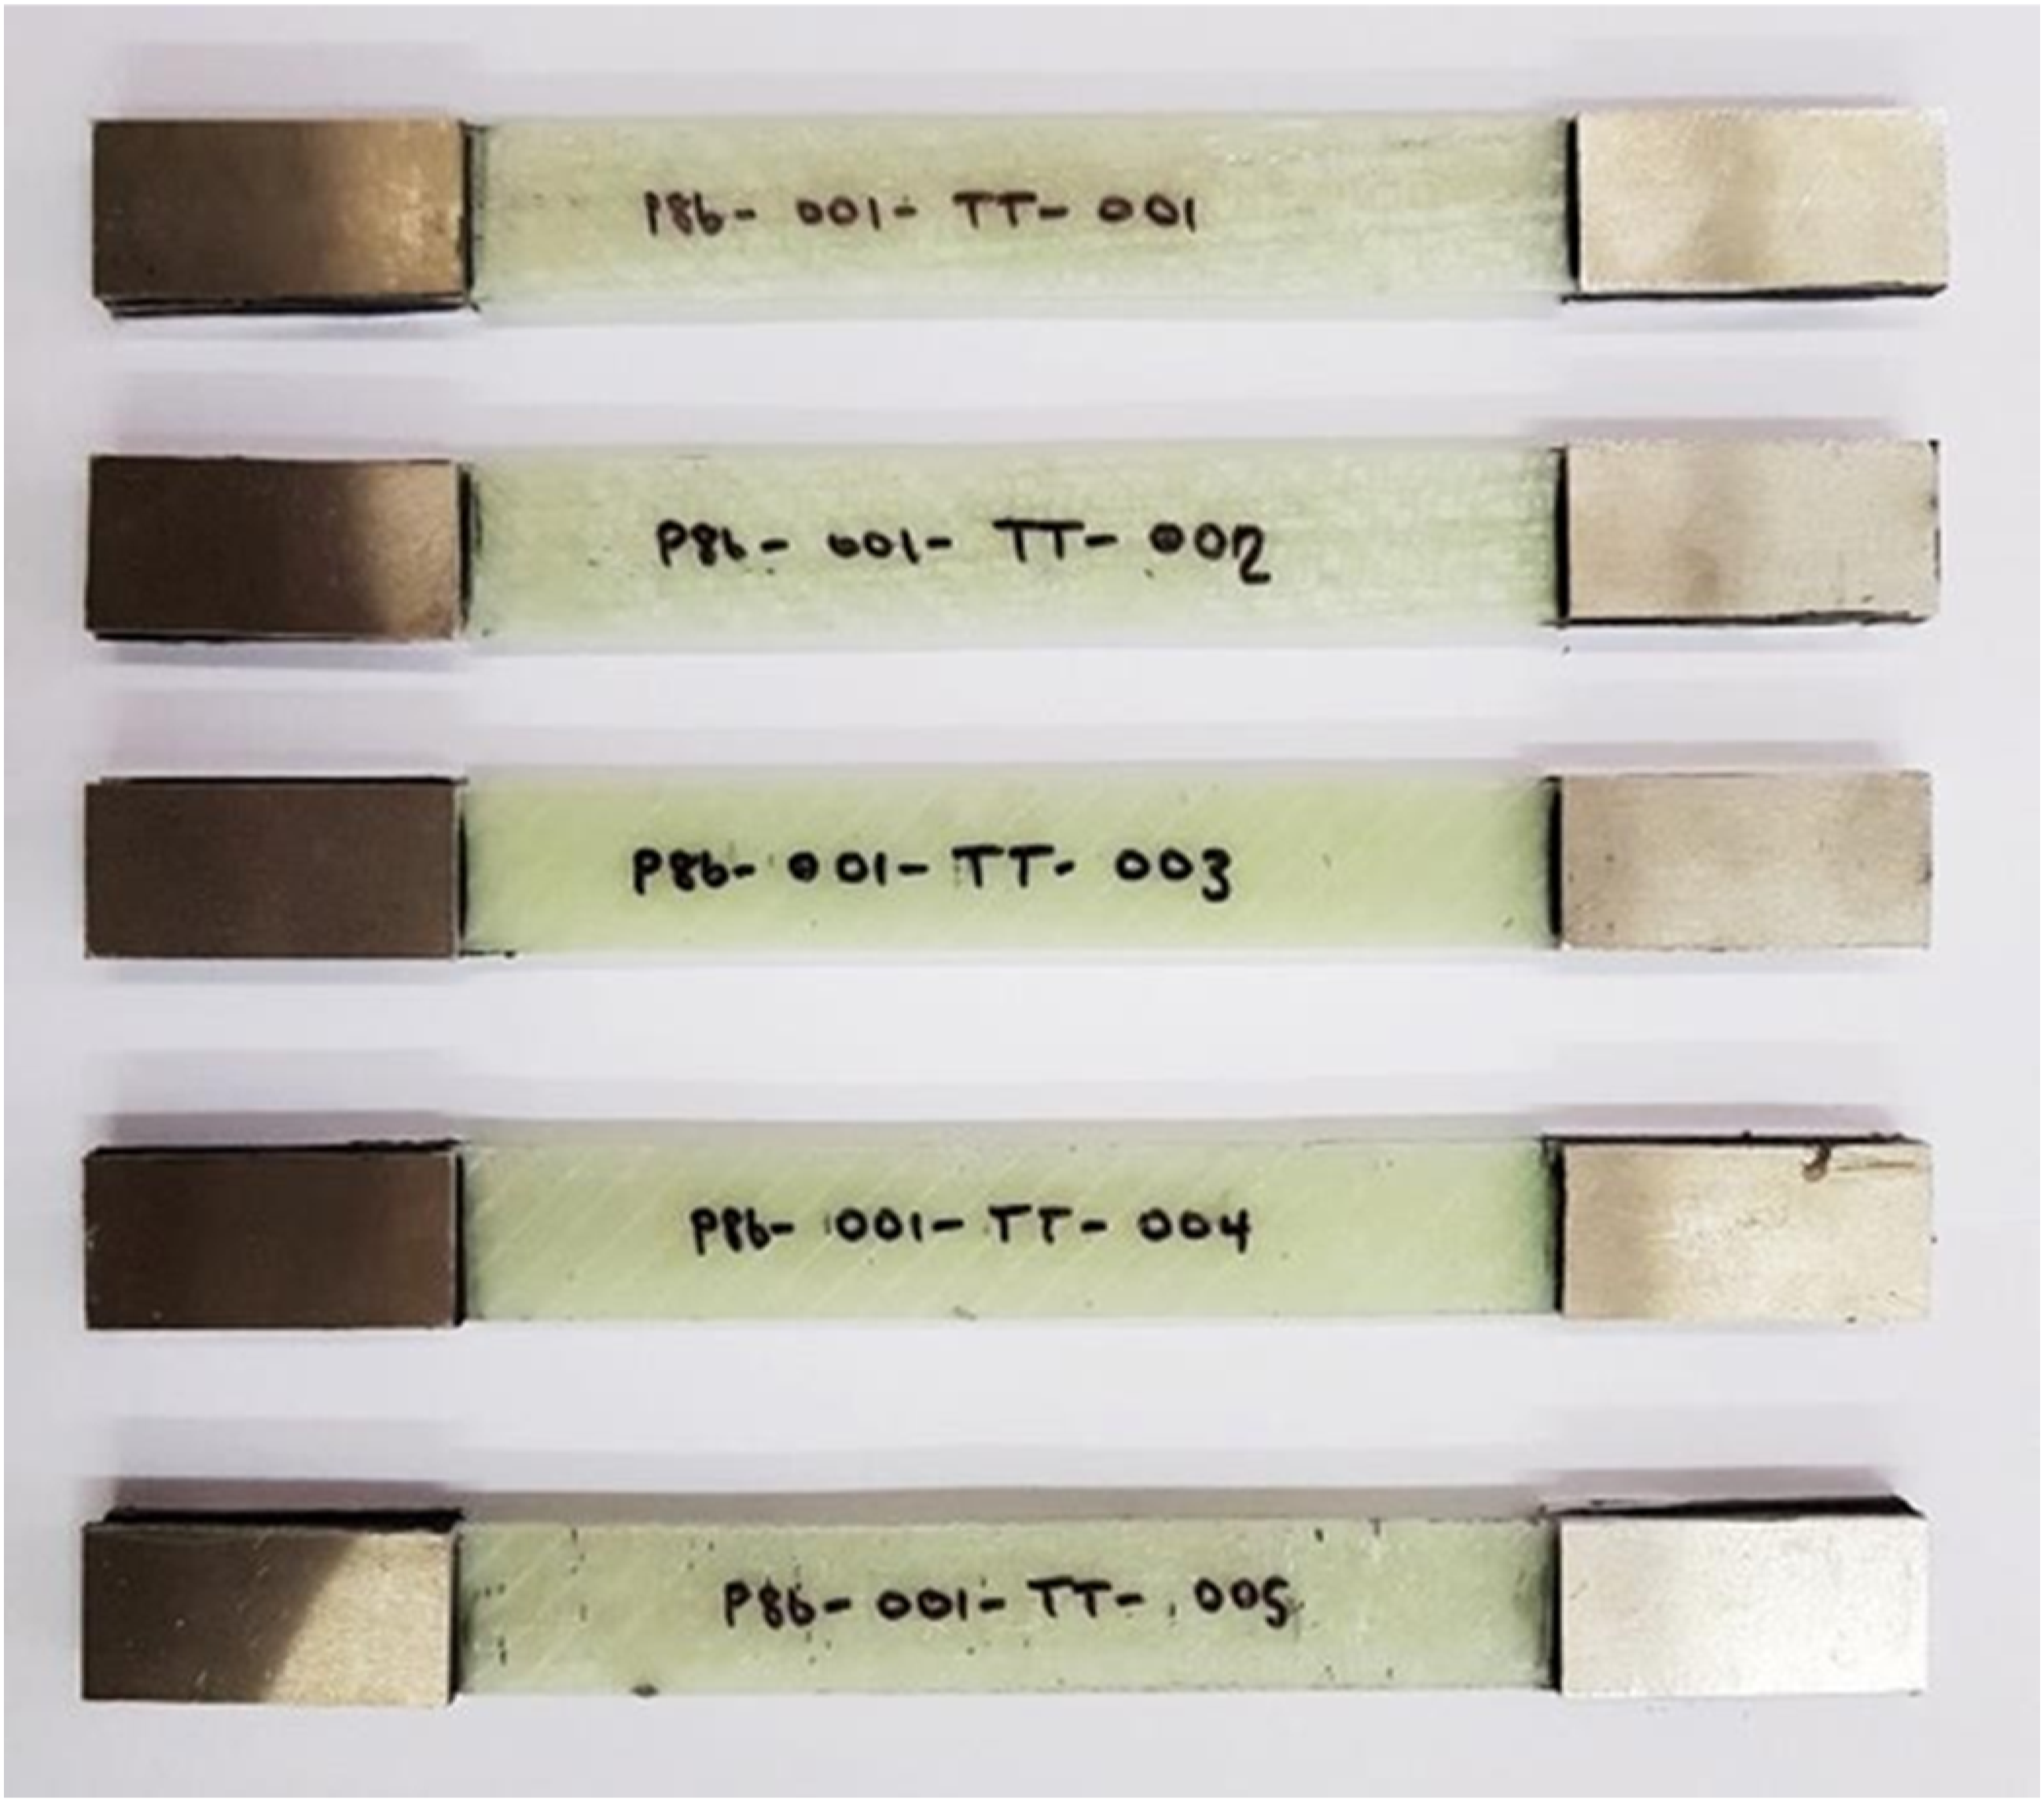
Tensile test
Mechanical properties of the specimen.
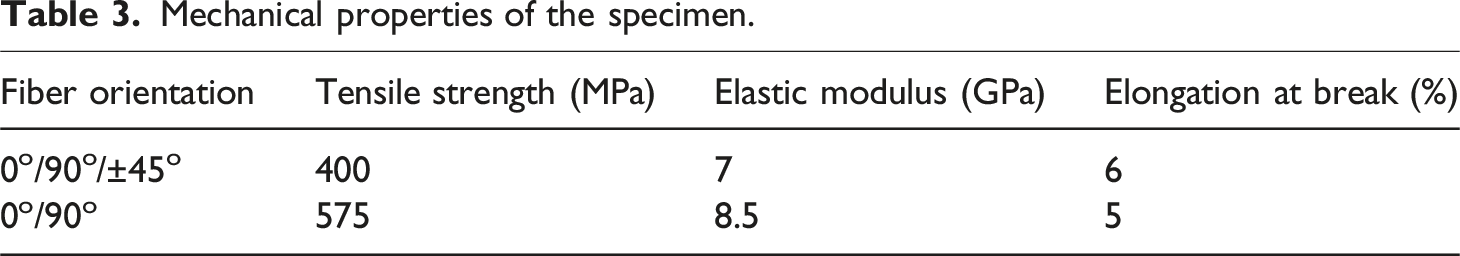
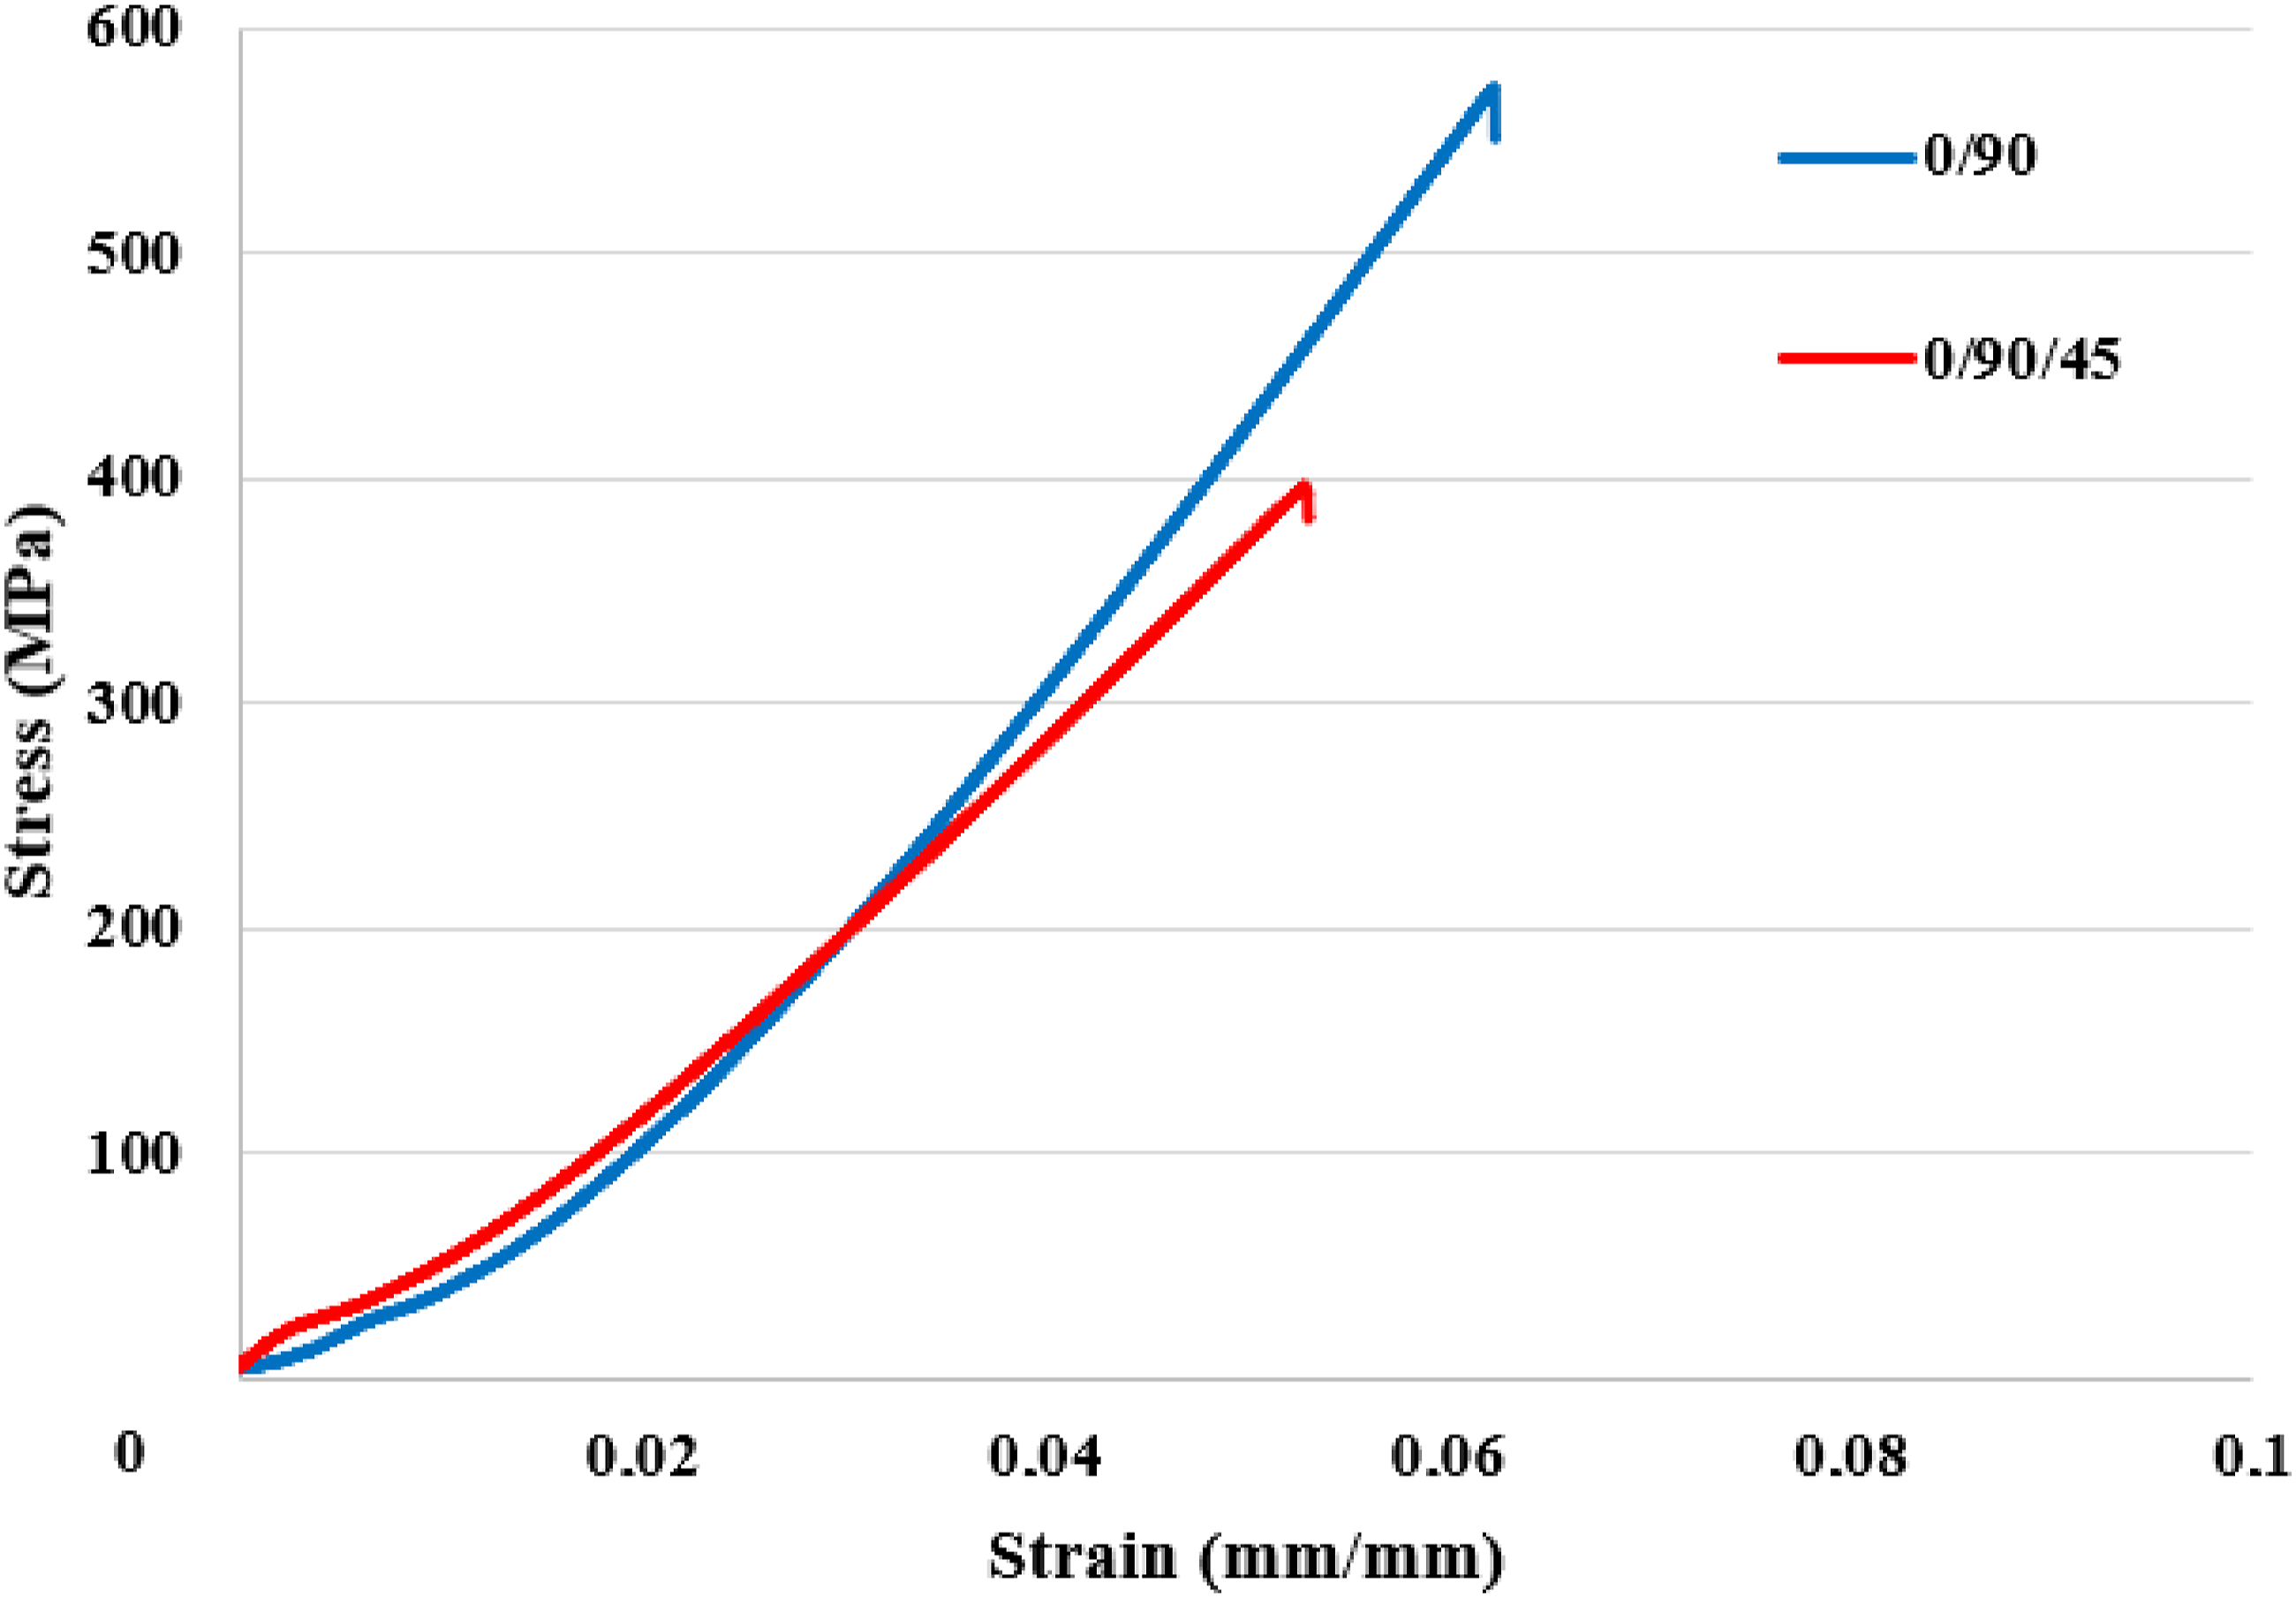
Tensile test of 0/90 and 0/90/45 fiber orientation. (UTS values: 0/90 575 MPa & 0/90/45 400 MPa).
Fatigue test
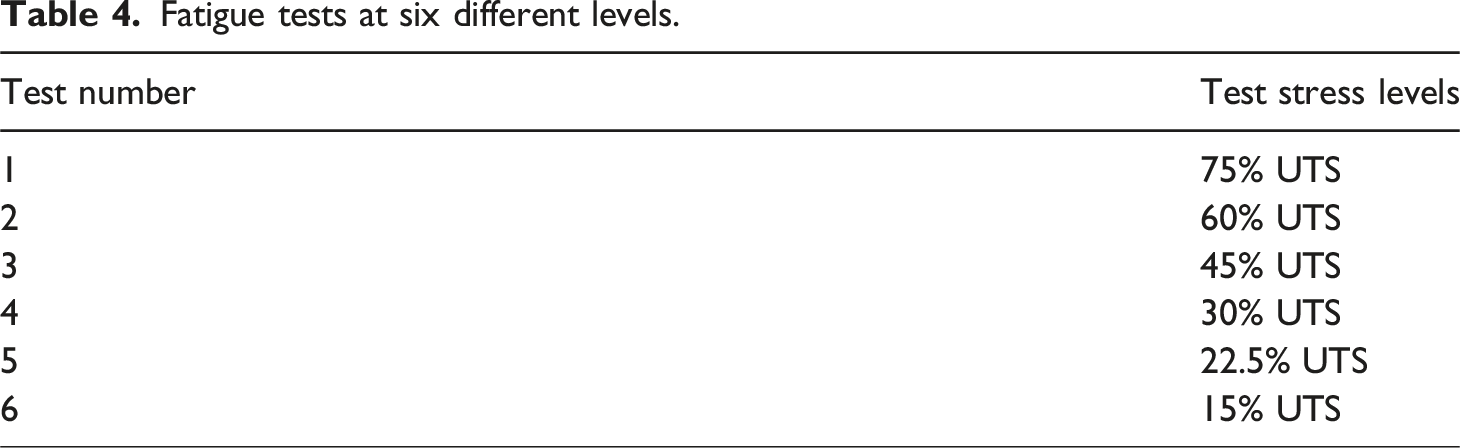
Fatigue tests at six different levels.
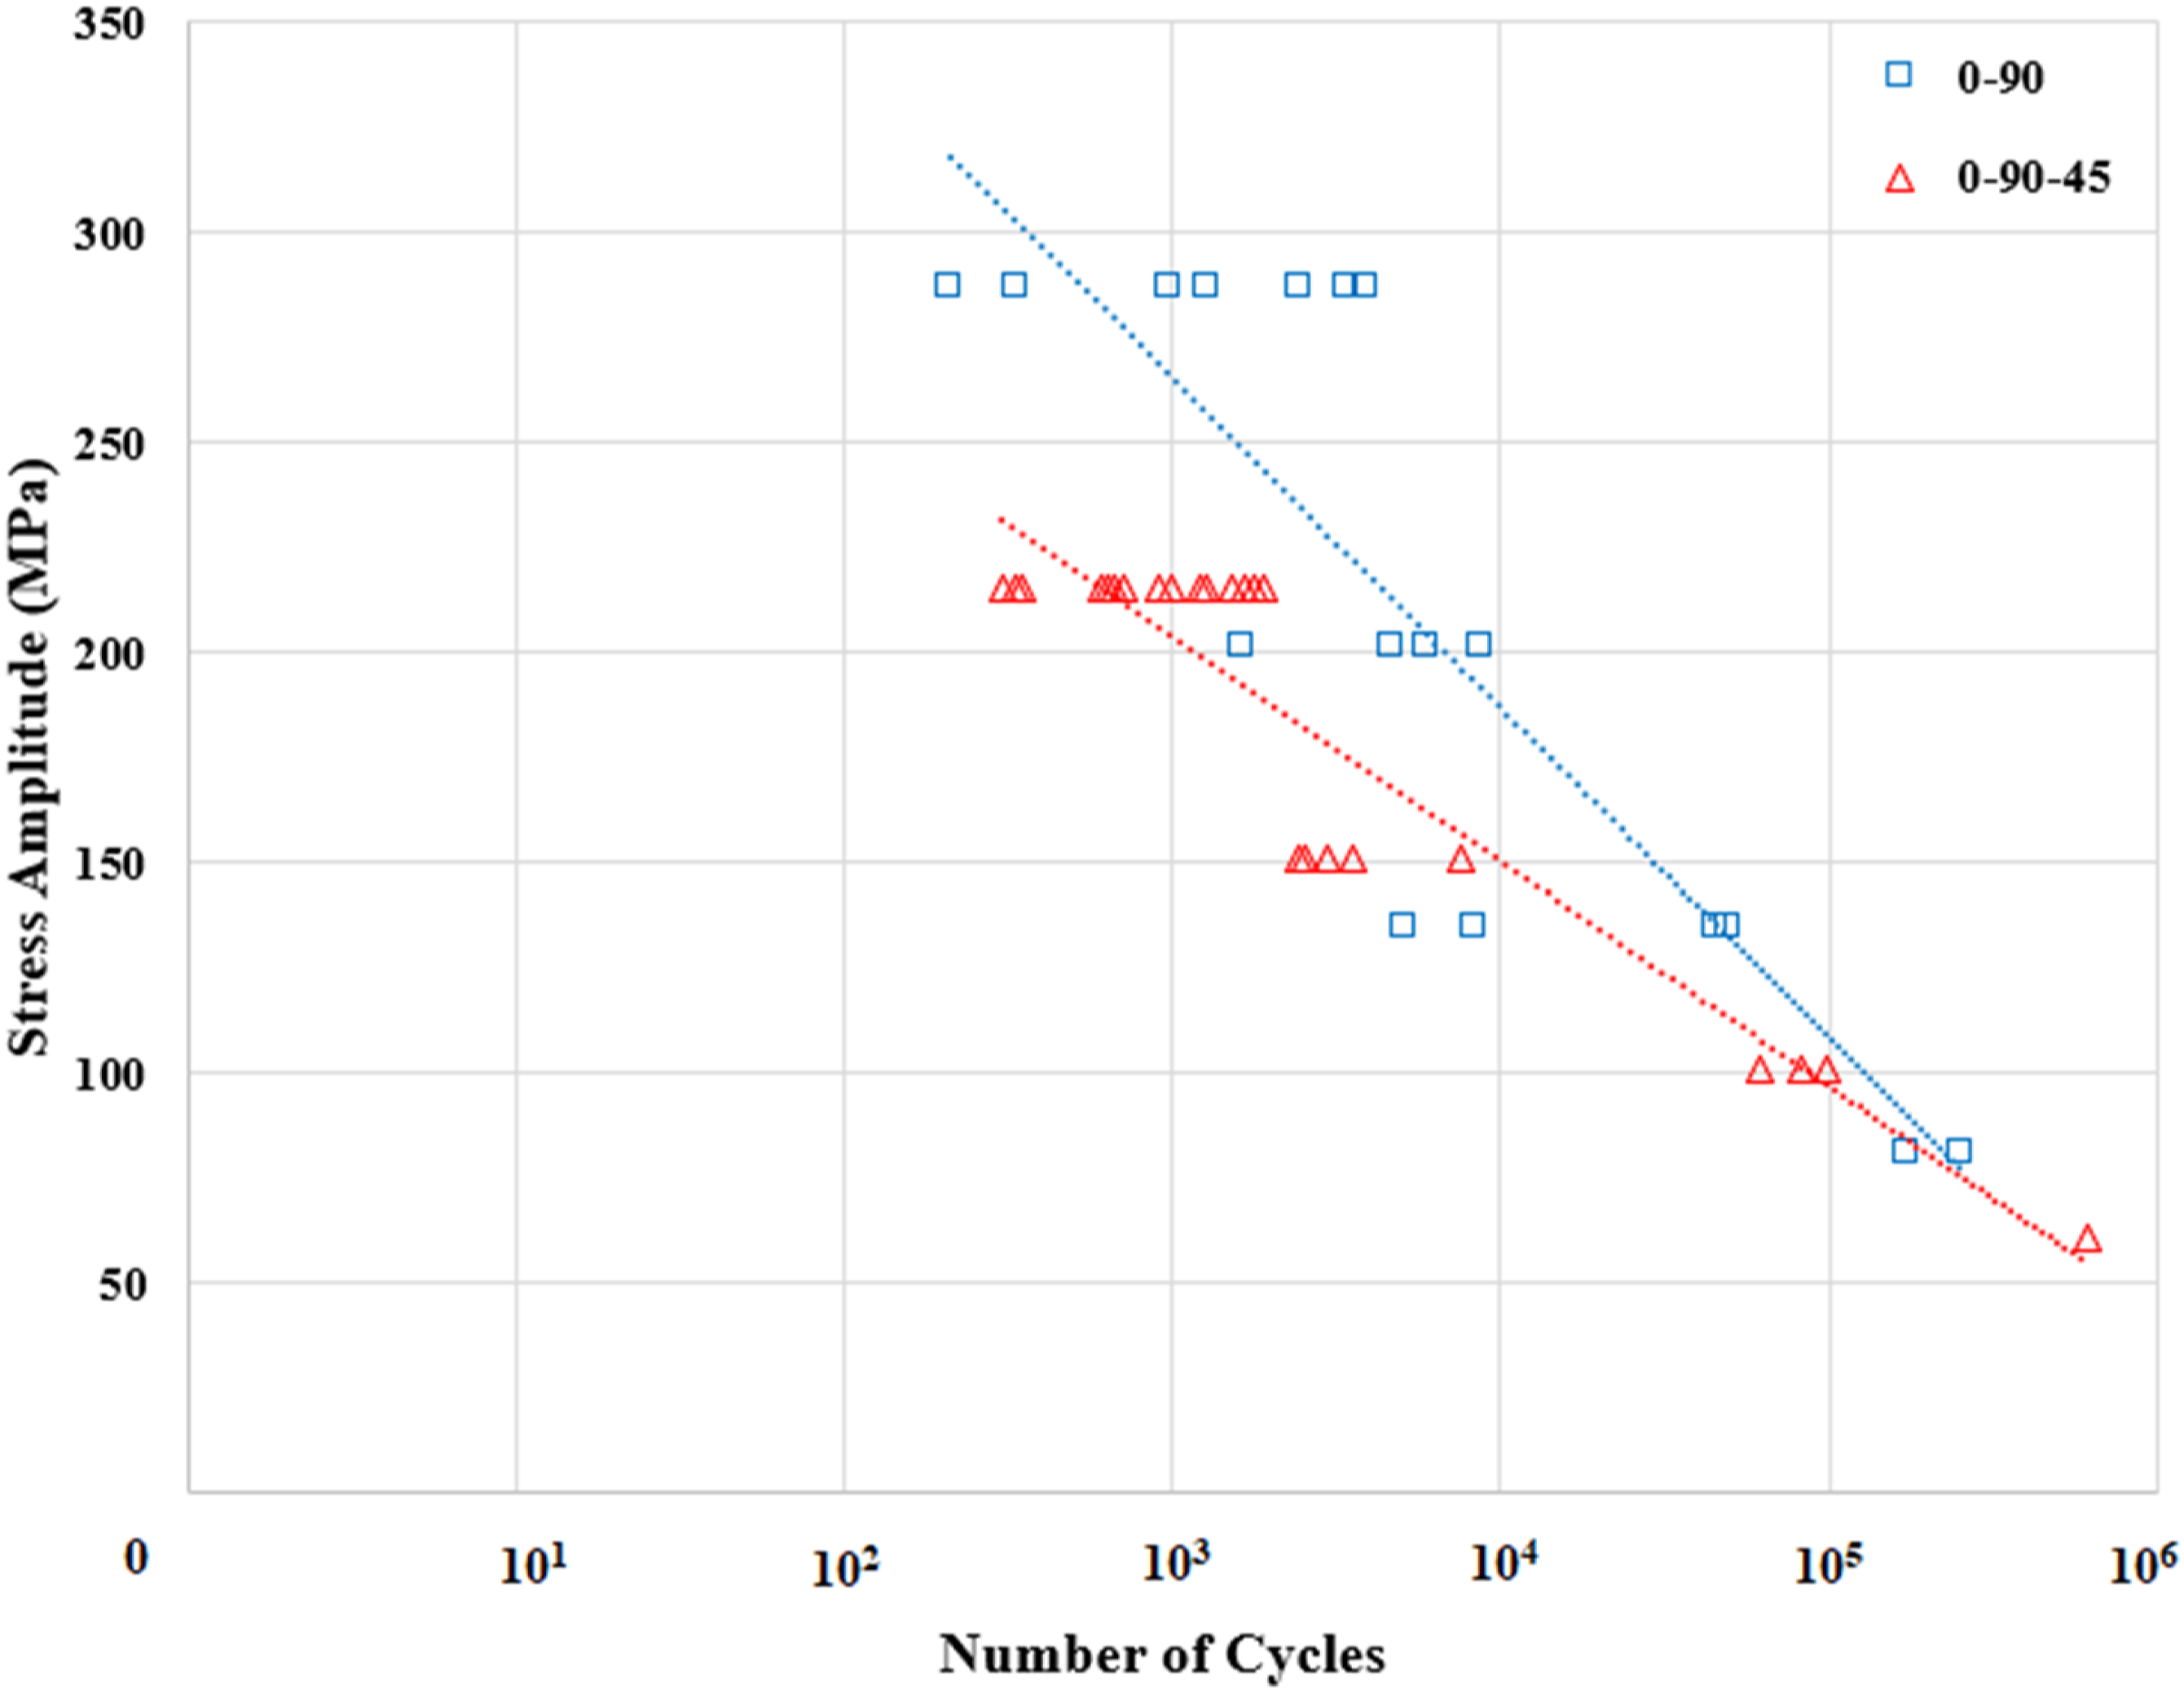
S/N diagram of 0/90 and 0/90/45 fiber orientation.
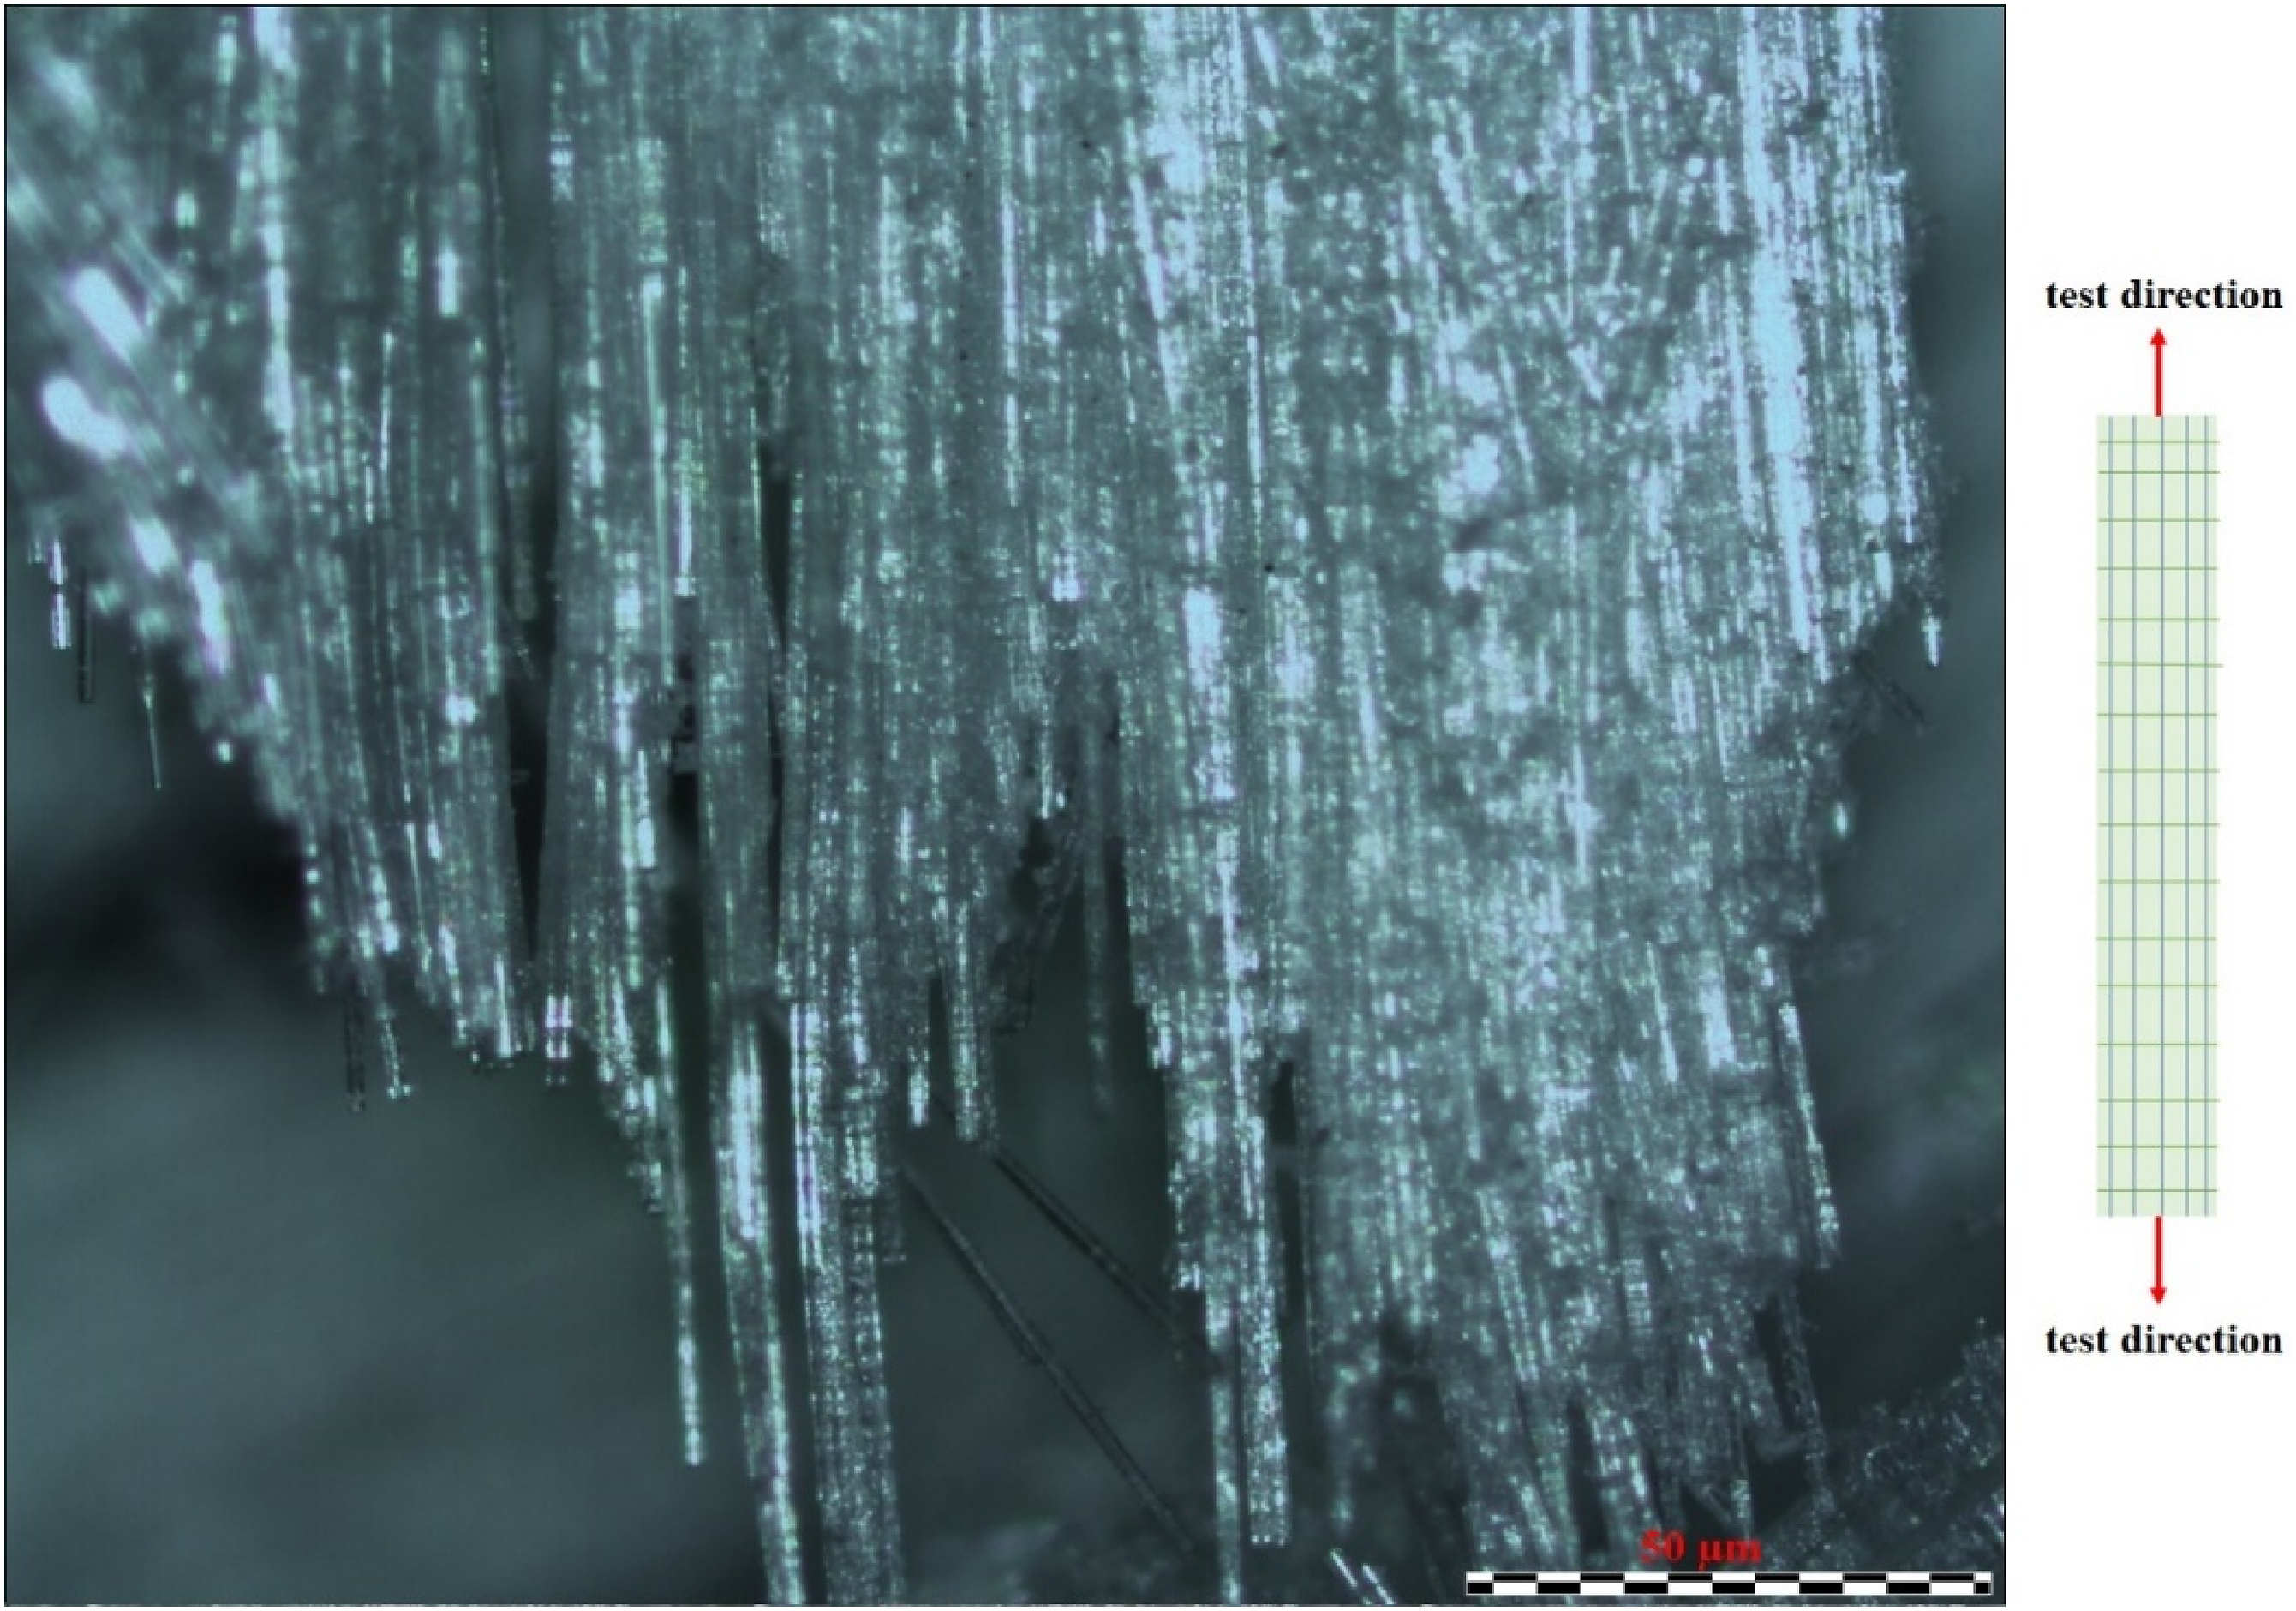
After fatigue test, the fractures of the specimen have been examined with an optical microscope Nikon SMZ800 stereo optical microscope and DeltaPix View Pro. The final fractures can be observed in Figures 5 and 6. The 45° fiber angles for 0/90/45 fiber orientation can be seen apparently in the Figure 5. Also, shear stresses are active for this fiber orientation at 45° angle. On the other hand, for the specimen of 0/90 fiber orientation involves different fracture characteristics forcing delamination and longitudinal crack initiation along the 0° fibers which can be observed in Figure 6. The micrograph of 0/90/45 fiber orientation specimen. The micrograph of 0/90 fiber orientation specimen.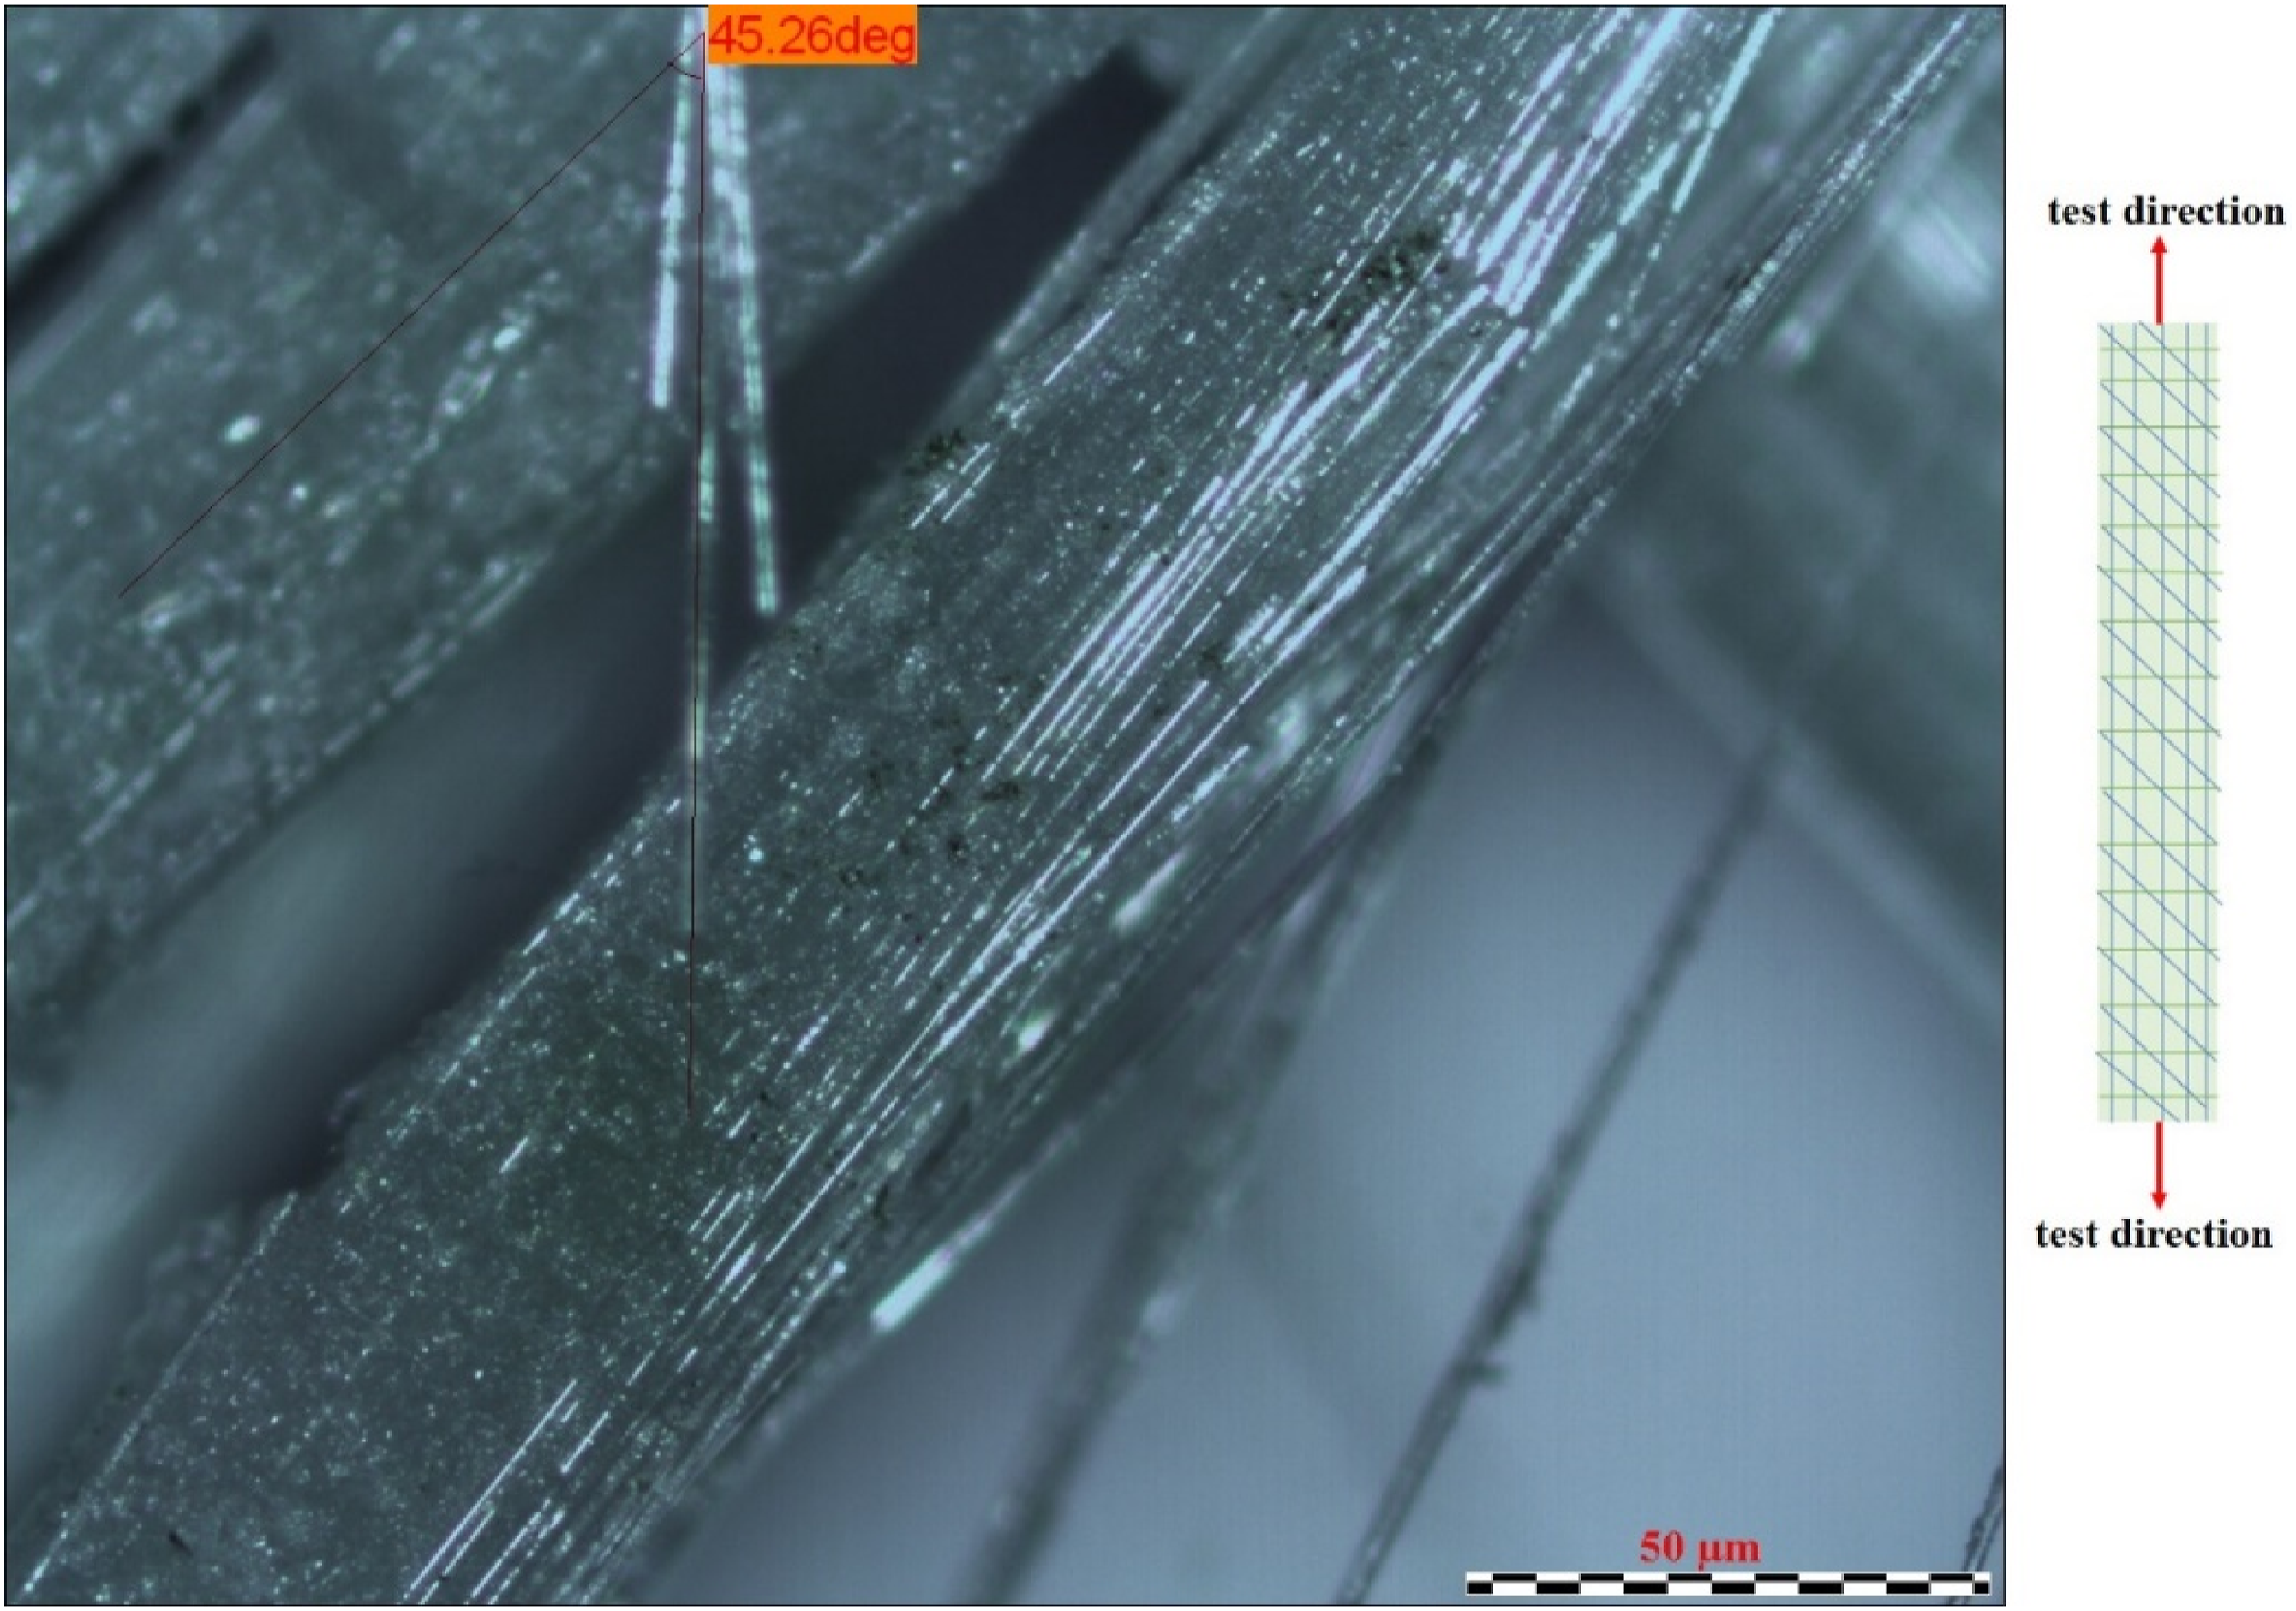
Results and discussion
The observation of temperature rises via infrared thermography method
A certain temperature increase is observed on the surface of glass fiber reinforced thermoplastic composite material as a result of the energy dissipation in the cyclic stresses.34–36 For this reason, it is a must to record the temperature measurement during the fatigue test. During the measurement, infrared thermography (IRT) method has been used via FLIR T540. This equipment works with 464 × 348-pixel resolution, <40 mK thermal sensitivity/NETD and 30 Hz frame rate.
37
The IR thermography method is advantageous to the regional analysis of these temperature values. Therefore, the stress and strain values recorded during the fatigue test by the MTS controller has been recorded throughout the entire tests. By using the IR thermography method during the fatigue test, the instantaneous maximum temperature of the surface of specimen has been measured. The experimental setup is shown in Figure 7. In Figures 8 and 9, they can be seen that the temperature increases of samples during the fatigue tests for both two different fiber orientations and six different stress levels. Also, the temperature changes thermo photos have been given in Figure 10. Experimental setup of IR thermography during fatigue test. The temperature increase in fatigue tests with six different stress levels with 0/90/45 fiber orientation samples. The temperature increase in fatigue tests with six different stress levels with 0/90 fiber orientation samples. Thermographs taken by IRT Thermography method of some experiments.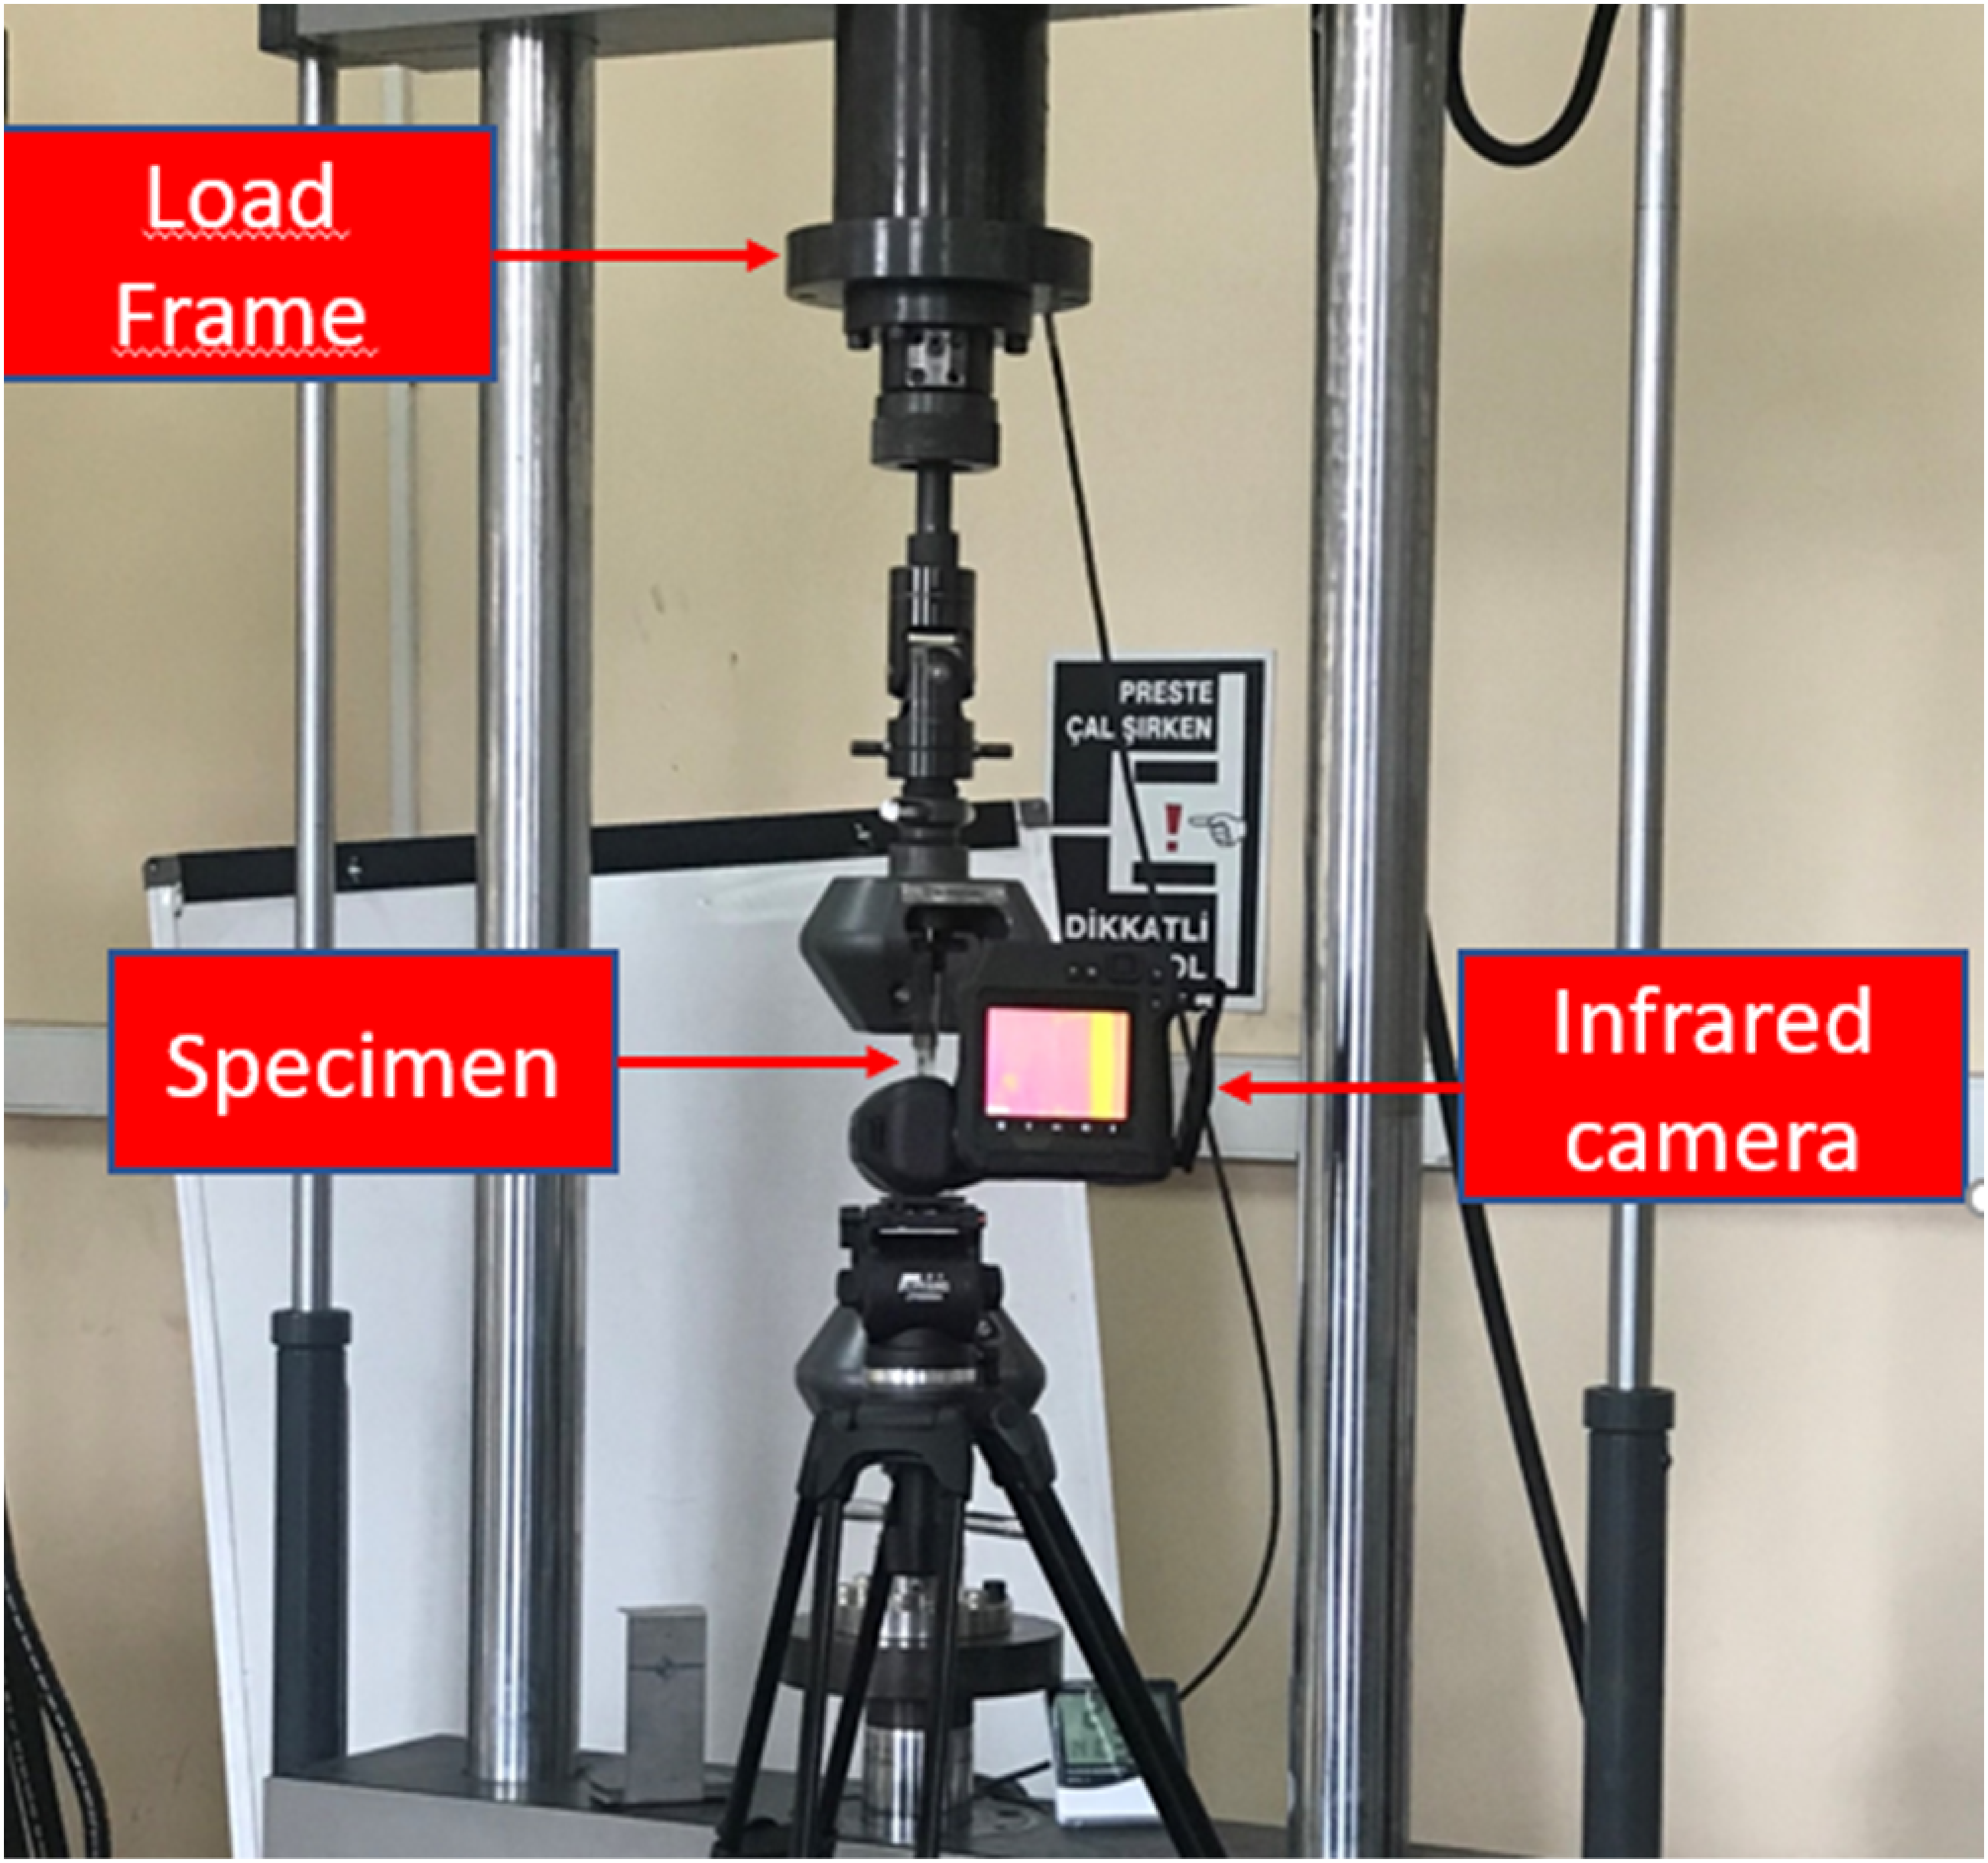
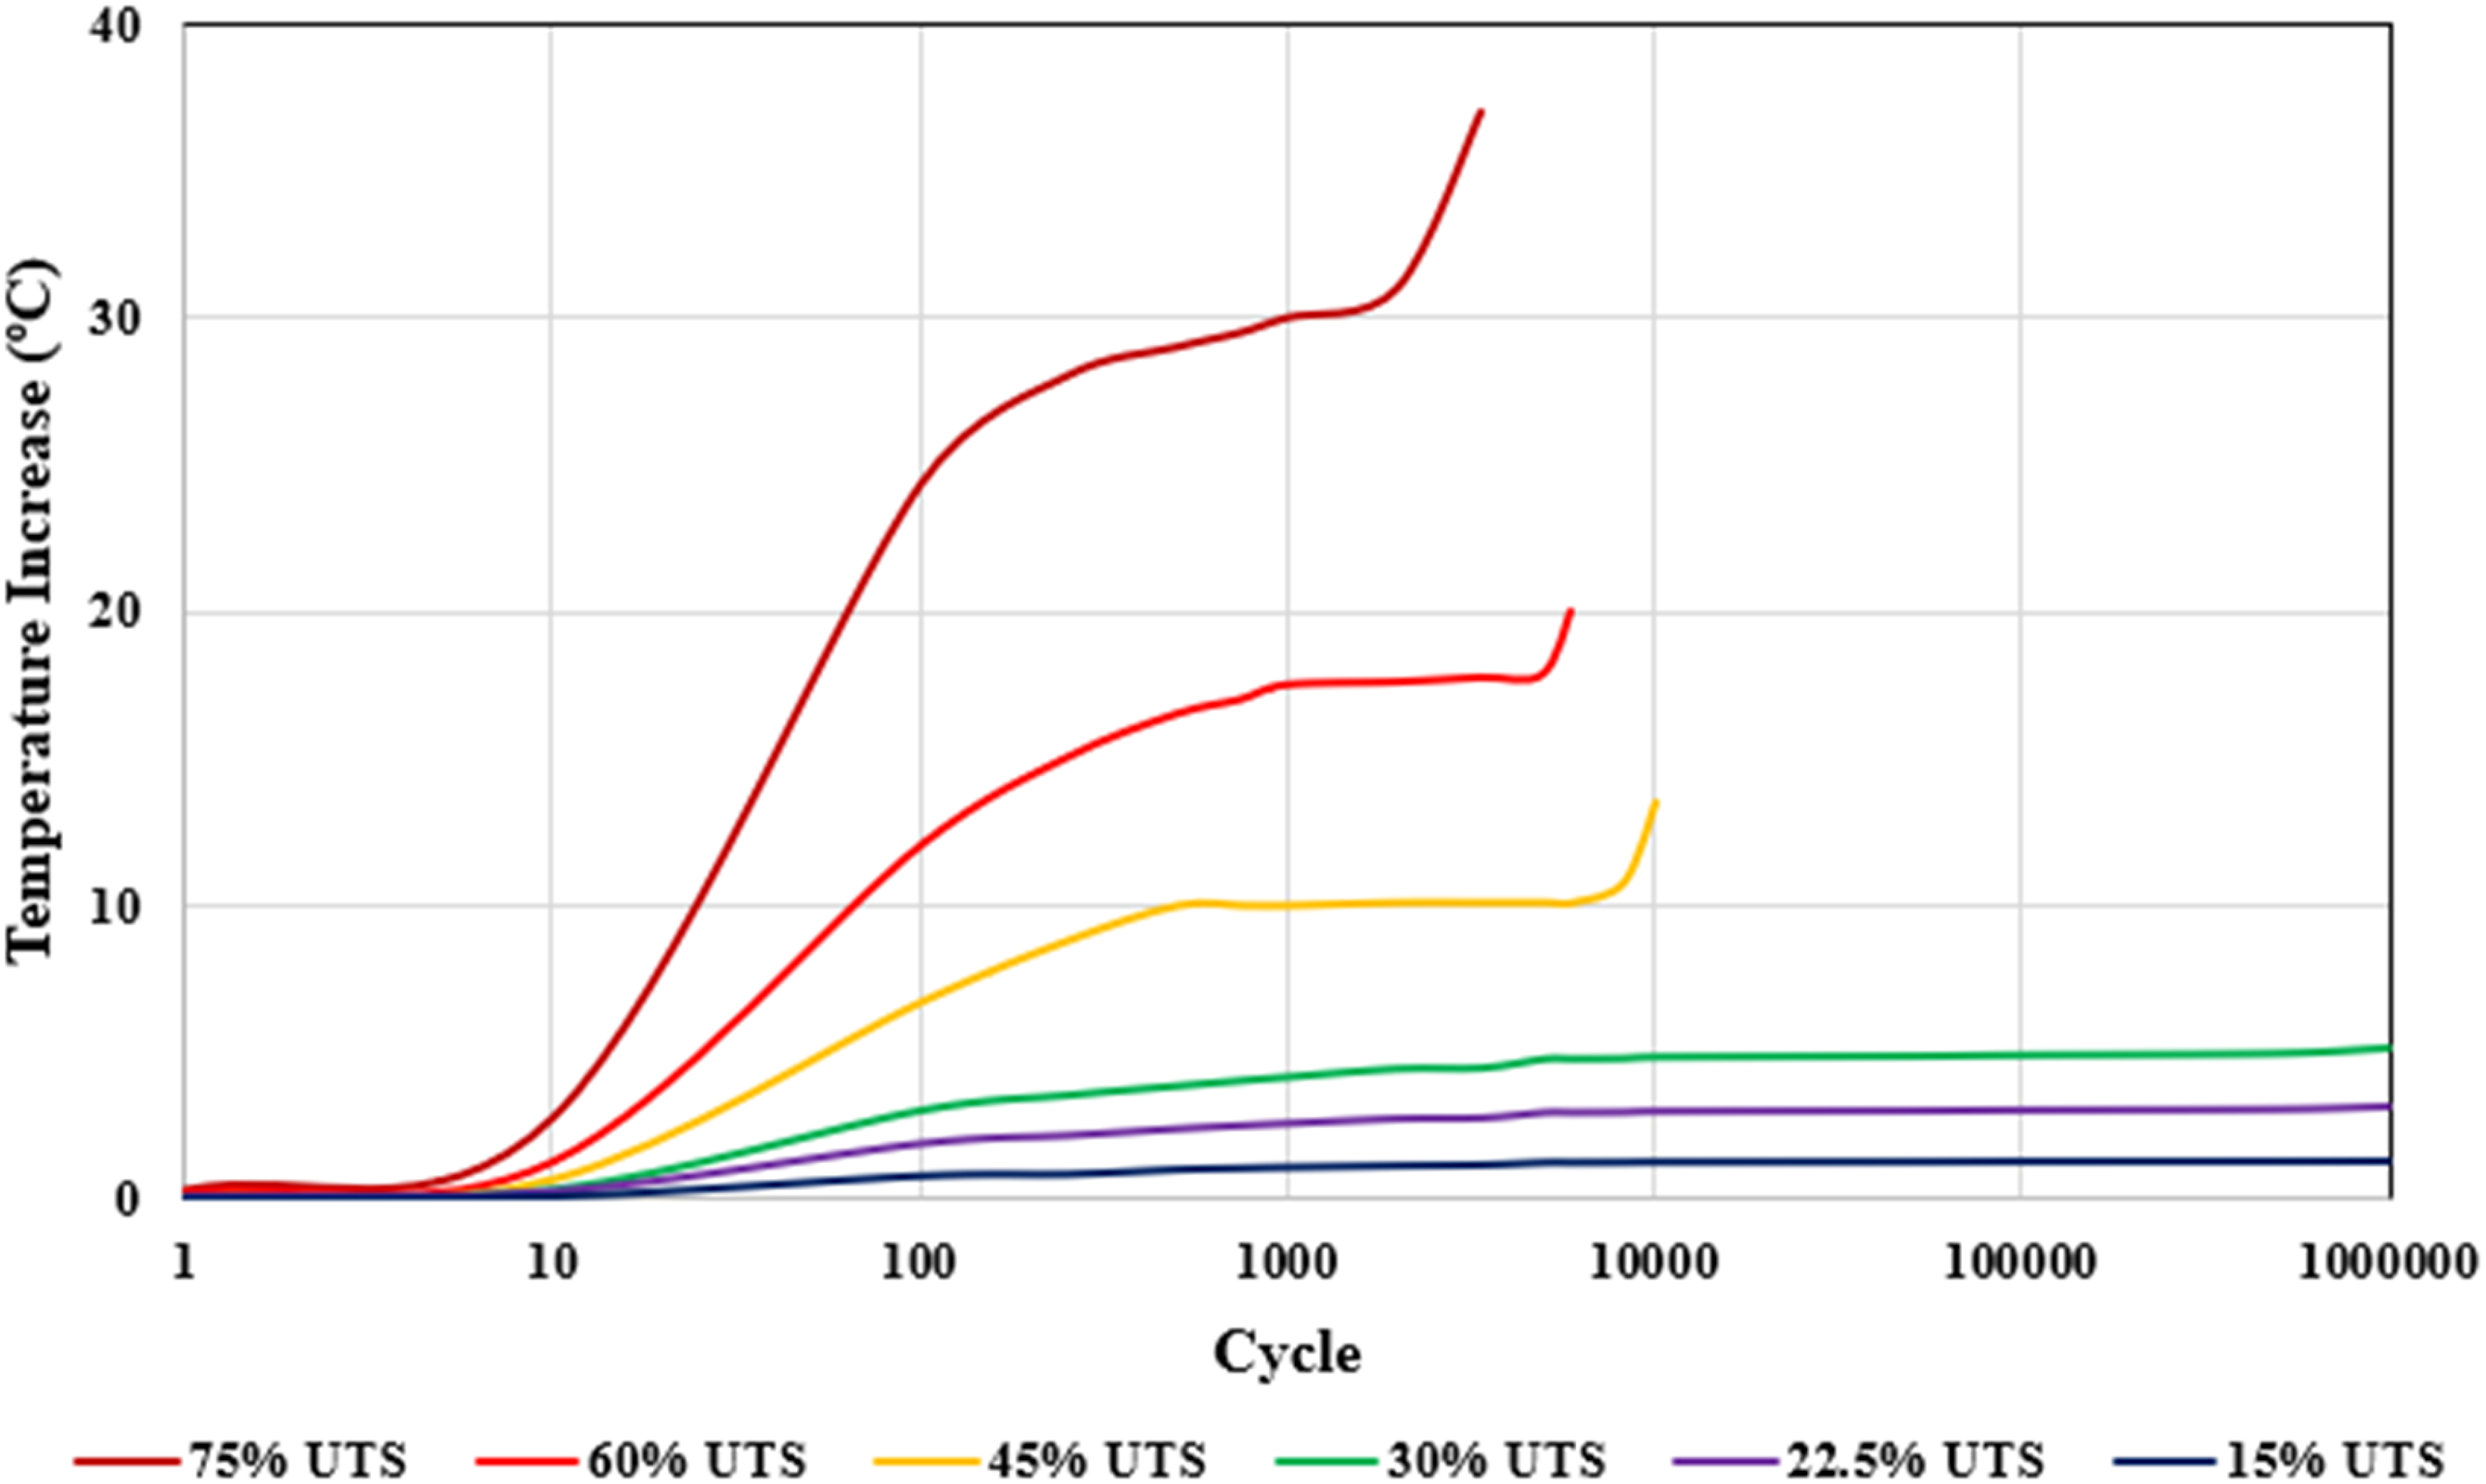

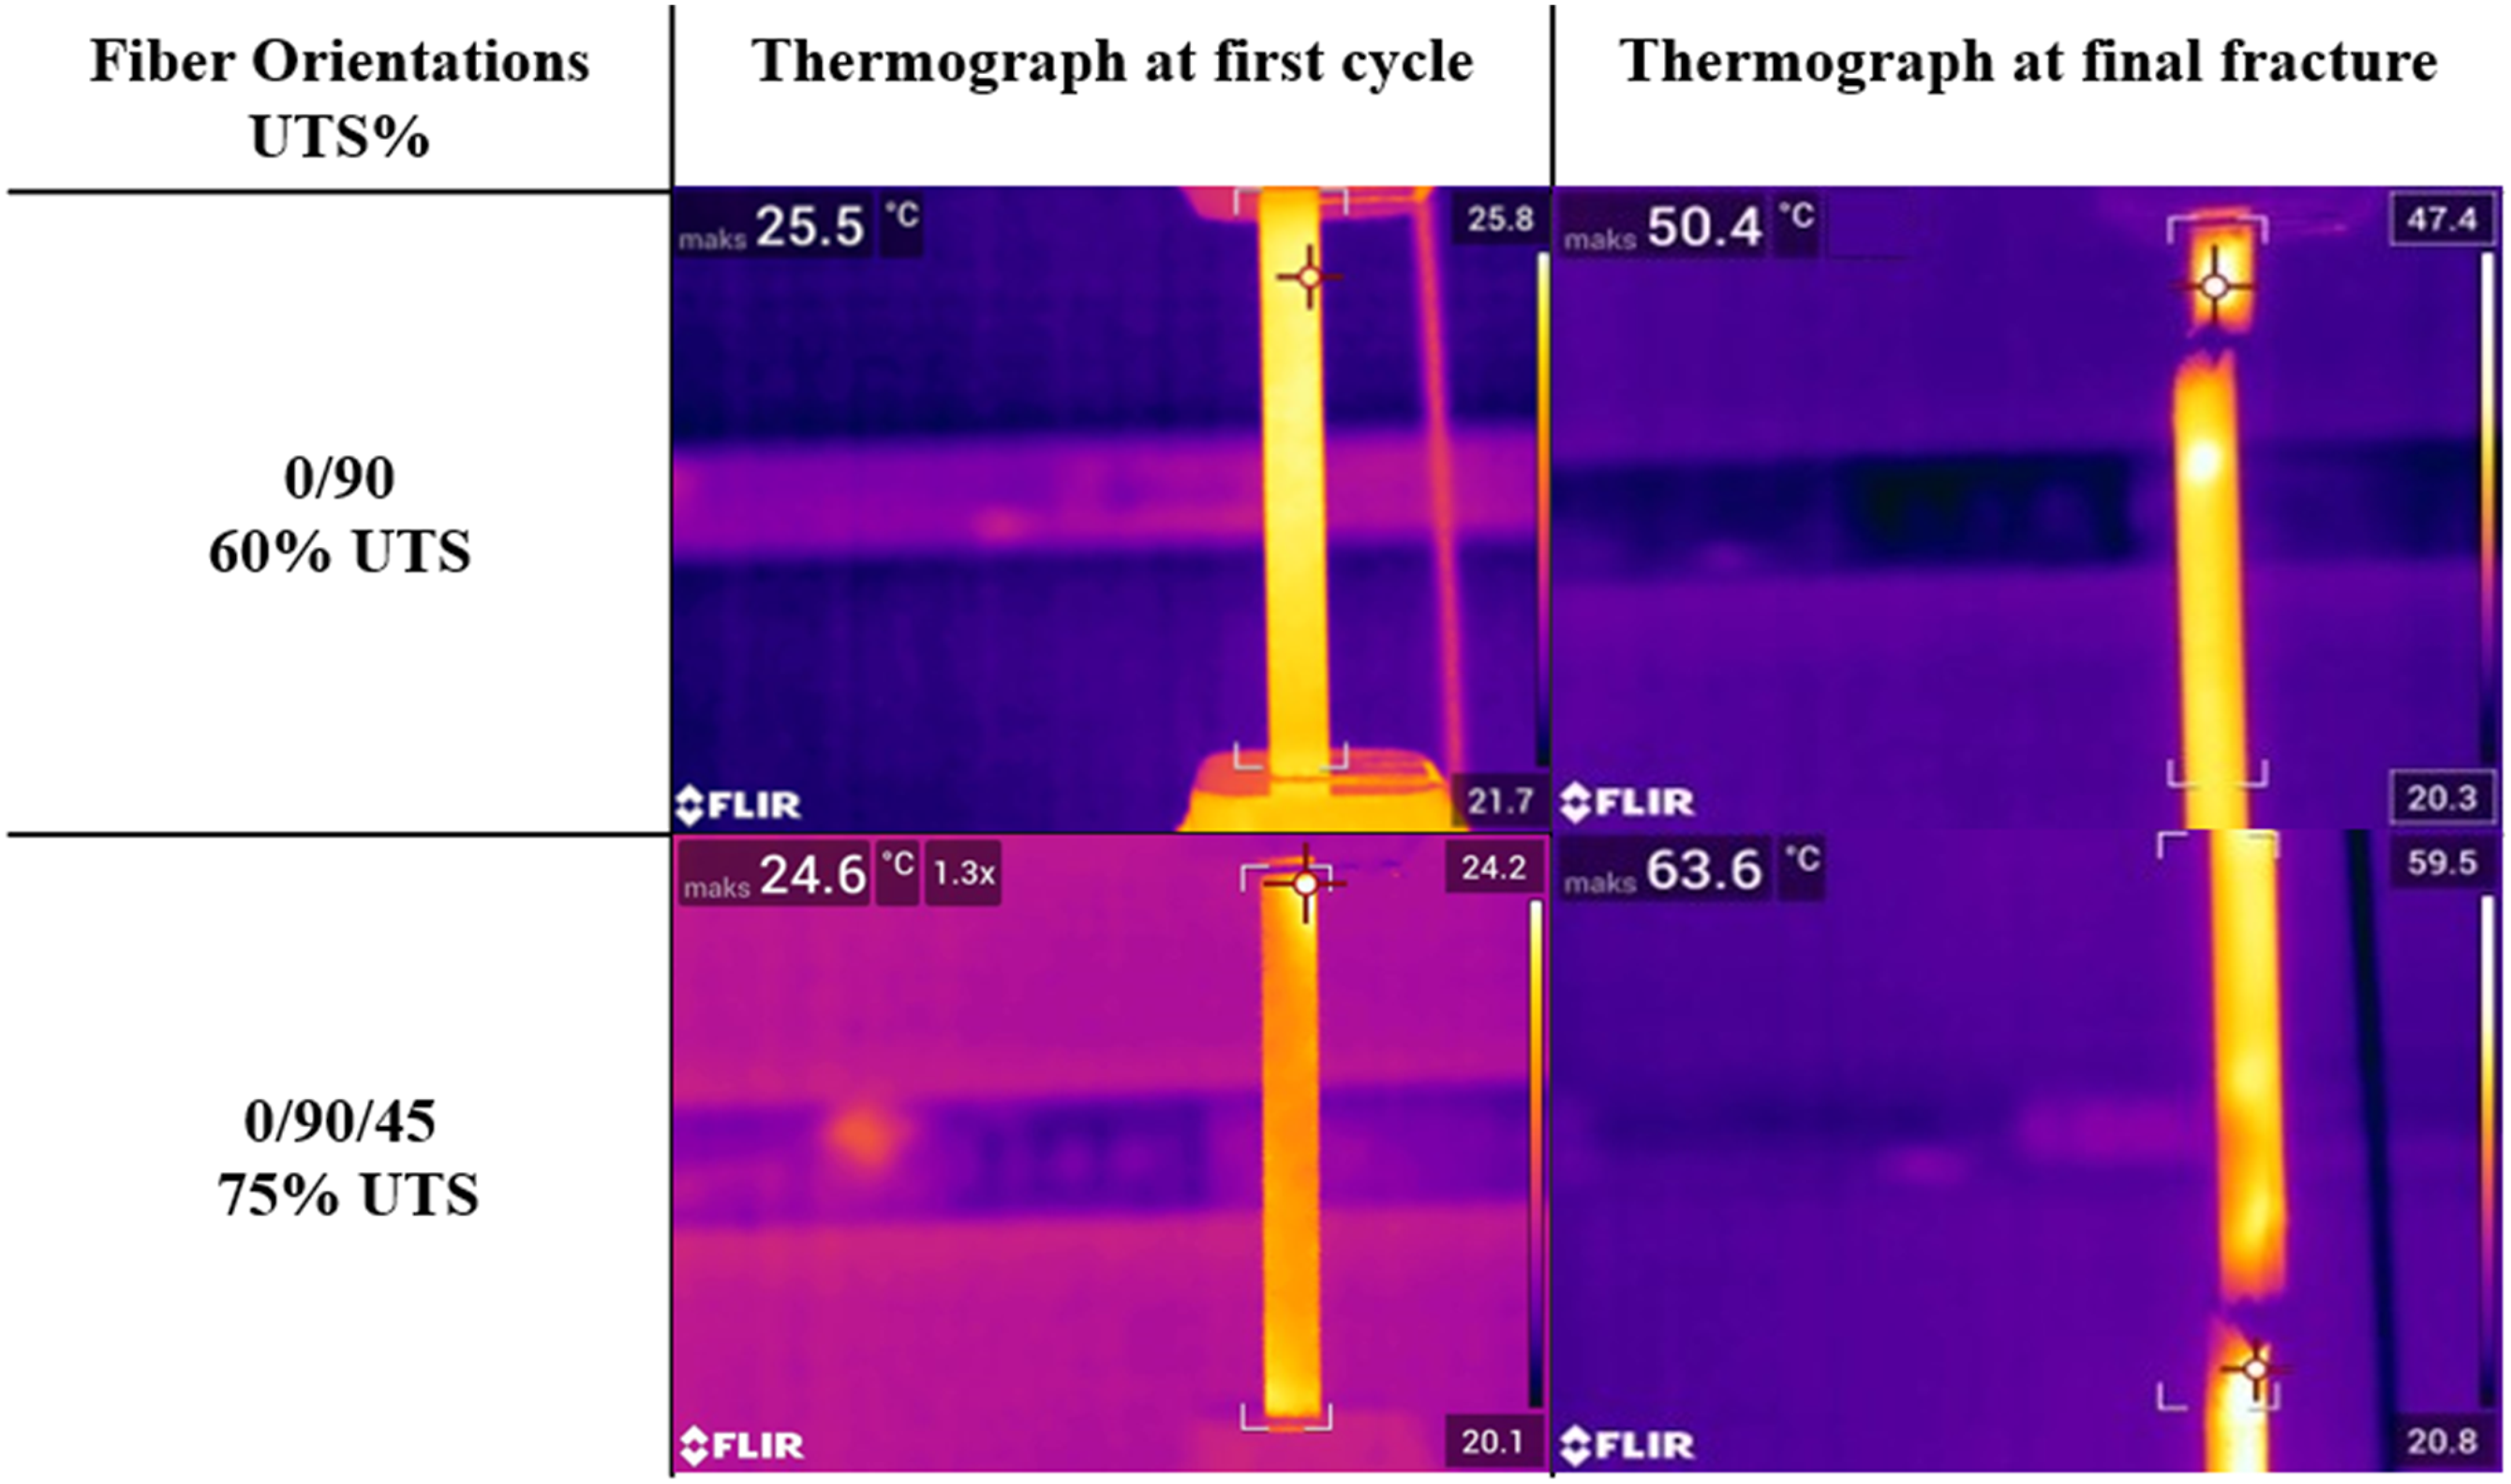
In the composite material with 0/90 fiber orientation, the temperature increase of 39°C was measured at 75% UTS value, 22°C at 60% UTS value, and 12°C at 45% UTS value, where final fracture was observed. While the 0/90/45 fiber orientation, the temperature increase of 38°C was measured at 75% UTS value, 29°C at 60% UTS value, and 23°C at 45% UTS value, when final fracture was occurred. In the other two stress values which are 30% UTS and 22.5% UTS, where no fracture occurred, the temperature change remained below 8°C. Whereas for the same stress values the temperature change remained below 10°C and no fracture was seen. In the composite material with 0/90 fiber orientation, the temperature increase until fracture remained lower under 75% UTS value. This is due to the higher rigidity of this fiber orientation.
Energy dissipation per cycle
As mentioned earlier, the dissipated energy per cycle was used to estimate the high cycle fatigue life of carbon fiber reinforced thermoplastic composites.
37
However, it has not been observed in the literature research that thermoplastic matrix glass fiber composites are used in the determination of high cycle fatigue life. For this reason, the determination of the energy dissipation per cycle has been investigated carefully. Figure 11 shows a load-displacement diagram of a single hysteresis curve. The upper part of the hysteresis curve represents the loading cycle and the lower part represents the unloading cycle respectively in Figure 11 with two different colours. It is observed that some mechanical work is done on the sample during the loading cycle. The area between the loading and unloading cycle represents the energy dissipated for a single fatigue cycle.
38
To record load and displacement data during fatigue testing, the data collection frequency was adjusted to obtain at least 10 data points for a single fatigue cycle. Since it was observed that the desired load value was not reached in the first 50 cycles, the first measurement was taken in the 100th cycle. The area between the loading- unloading force-displacement graph which gives the dissipated energy.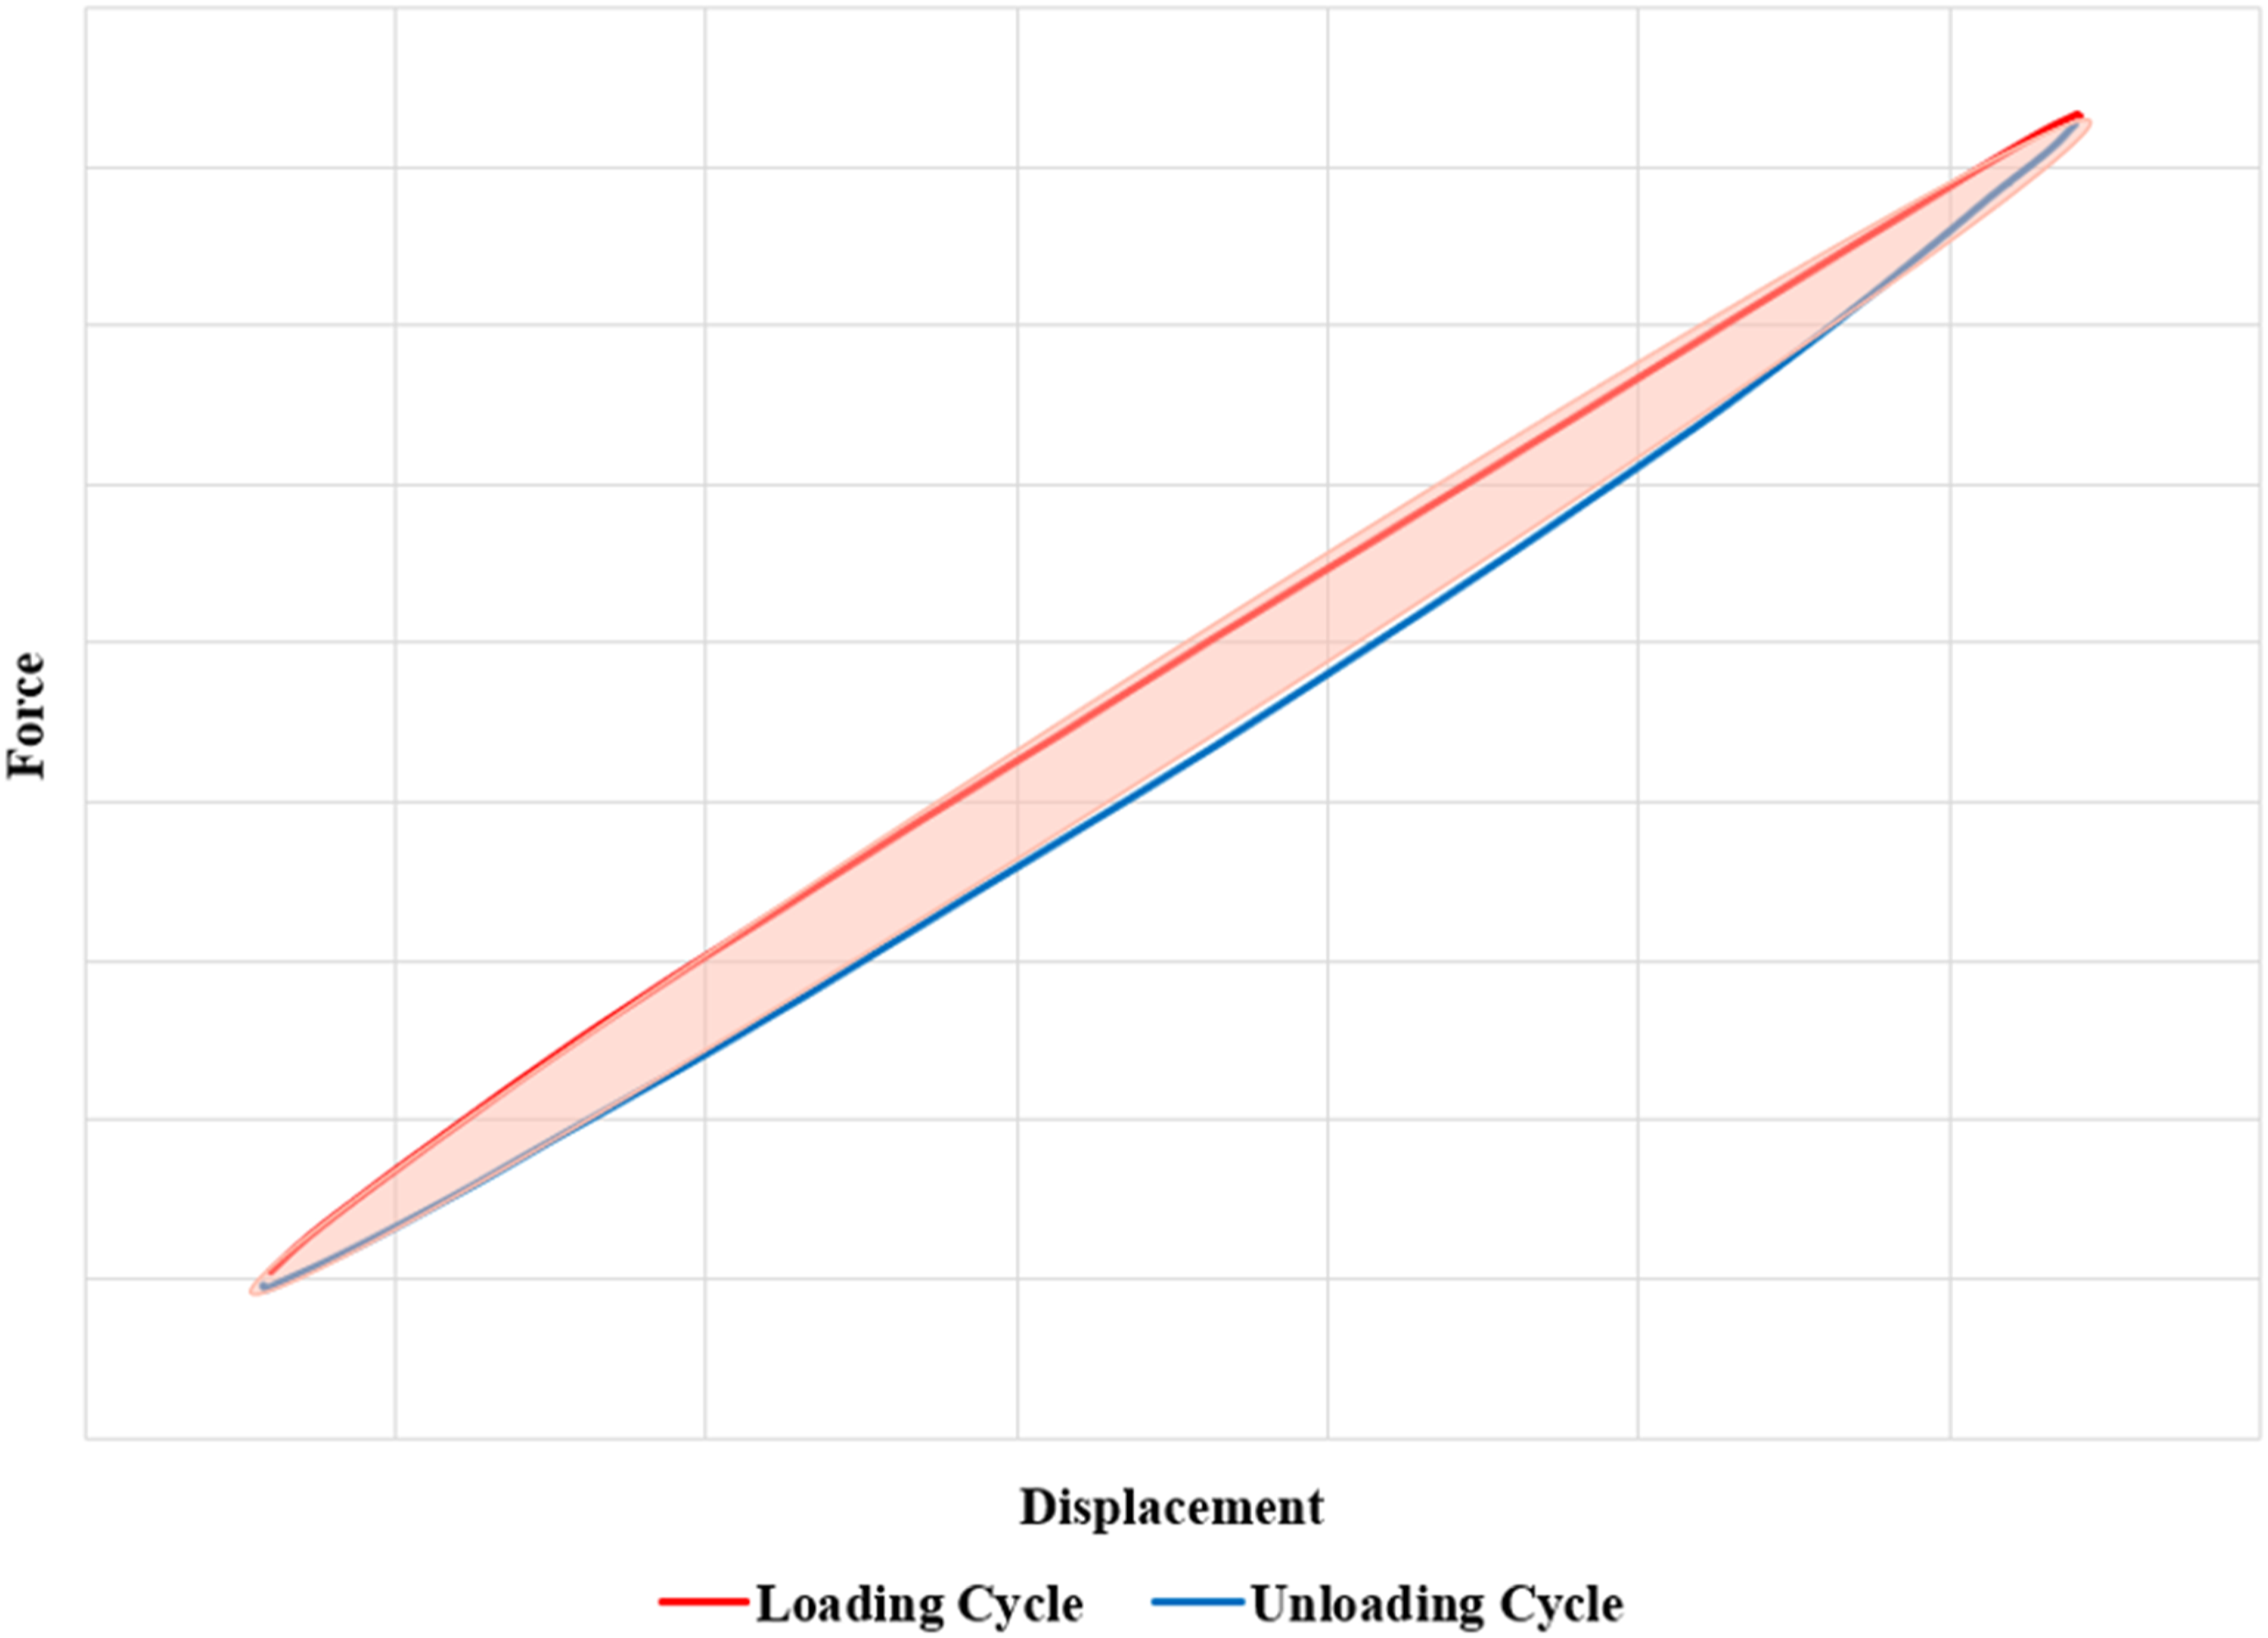
With this cycle value, hysteresis cycles of 10 cycles have been created until the sample was damaged, and the energy dissipation per cycle was measured for samples with both fiber orientations and plotted in Figures 12 and 13. In general, it was observed that the energy dissipation per cycle decreased as the number of cycles increased. However, it was determined that the energy value measured before fracture increased suddenly. This is explained by the increase in the energy required for the breaking of fibers to occur. For all applied stress percentages, the energy dissipated per cycle is higher during the first fatigue cycles. This is mainly due to the extremely high initial micro-damage occurring on the entire composite specimen during the first fatigue cycles. As with the temperature rise and stiffness degradation results, after a few cycles of hysteresis, the energy dissipation per cycle begins to decrease and eventually tends to stabilize, representing a steady progression of damage over the remainder of the fatigue life. It can be apparently seen that it has been a significant energy dissipation decrease in the high stress values of the 0/90/45 samples. Graph of dissipated energy per cycle obtained for the sample with 0/90/45 fiber orientation. Graph of dissipated energy per cycle obtained for the sample with 0/90 fiber orientation.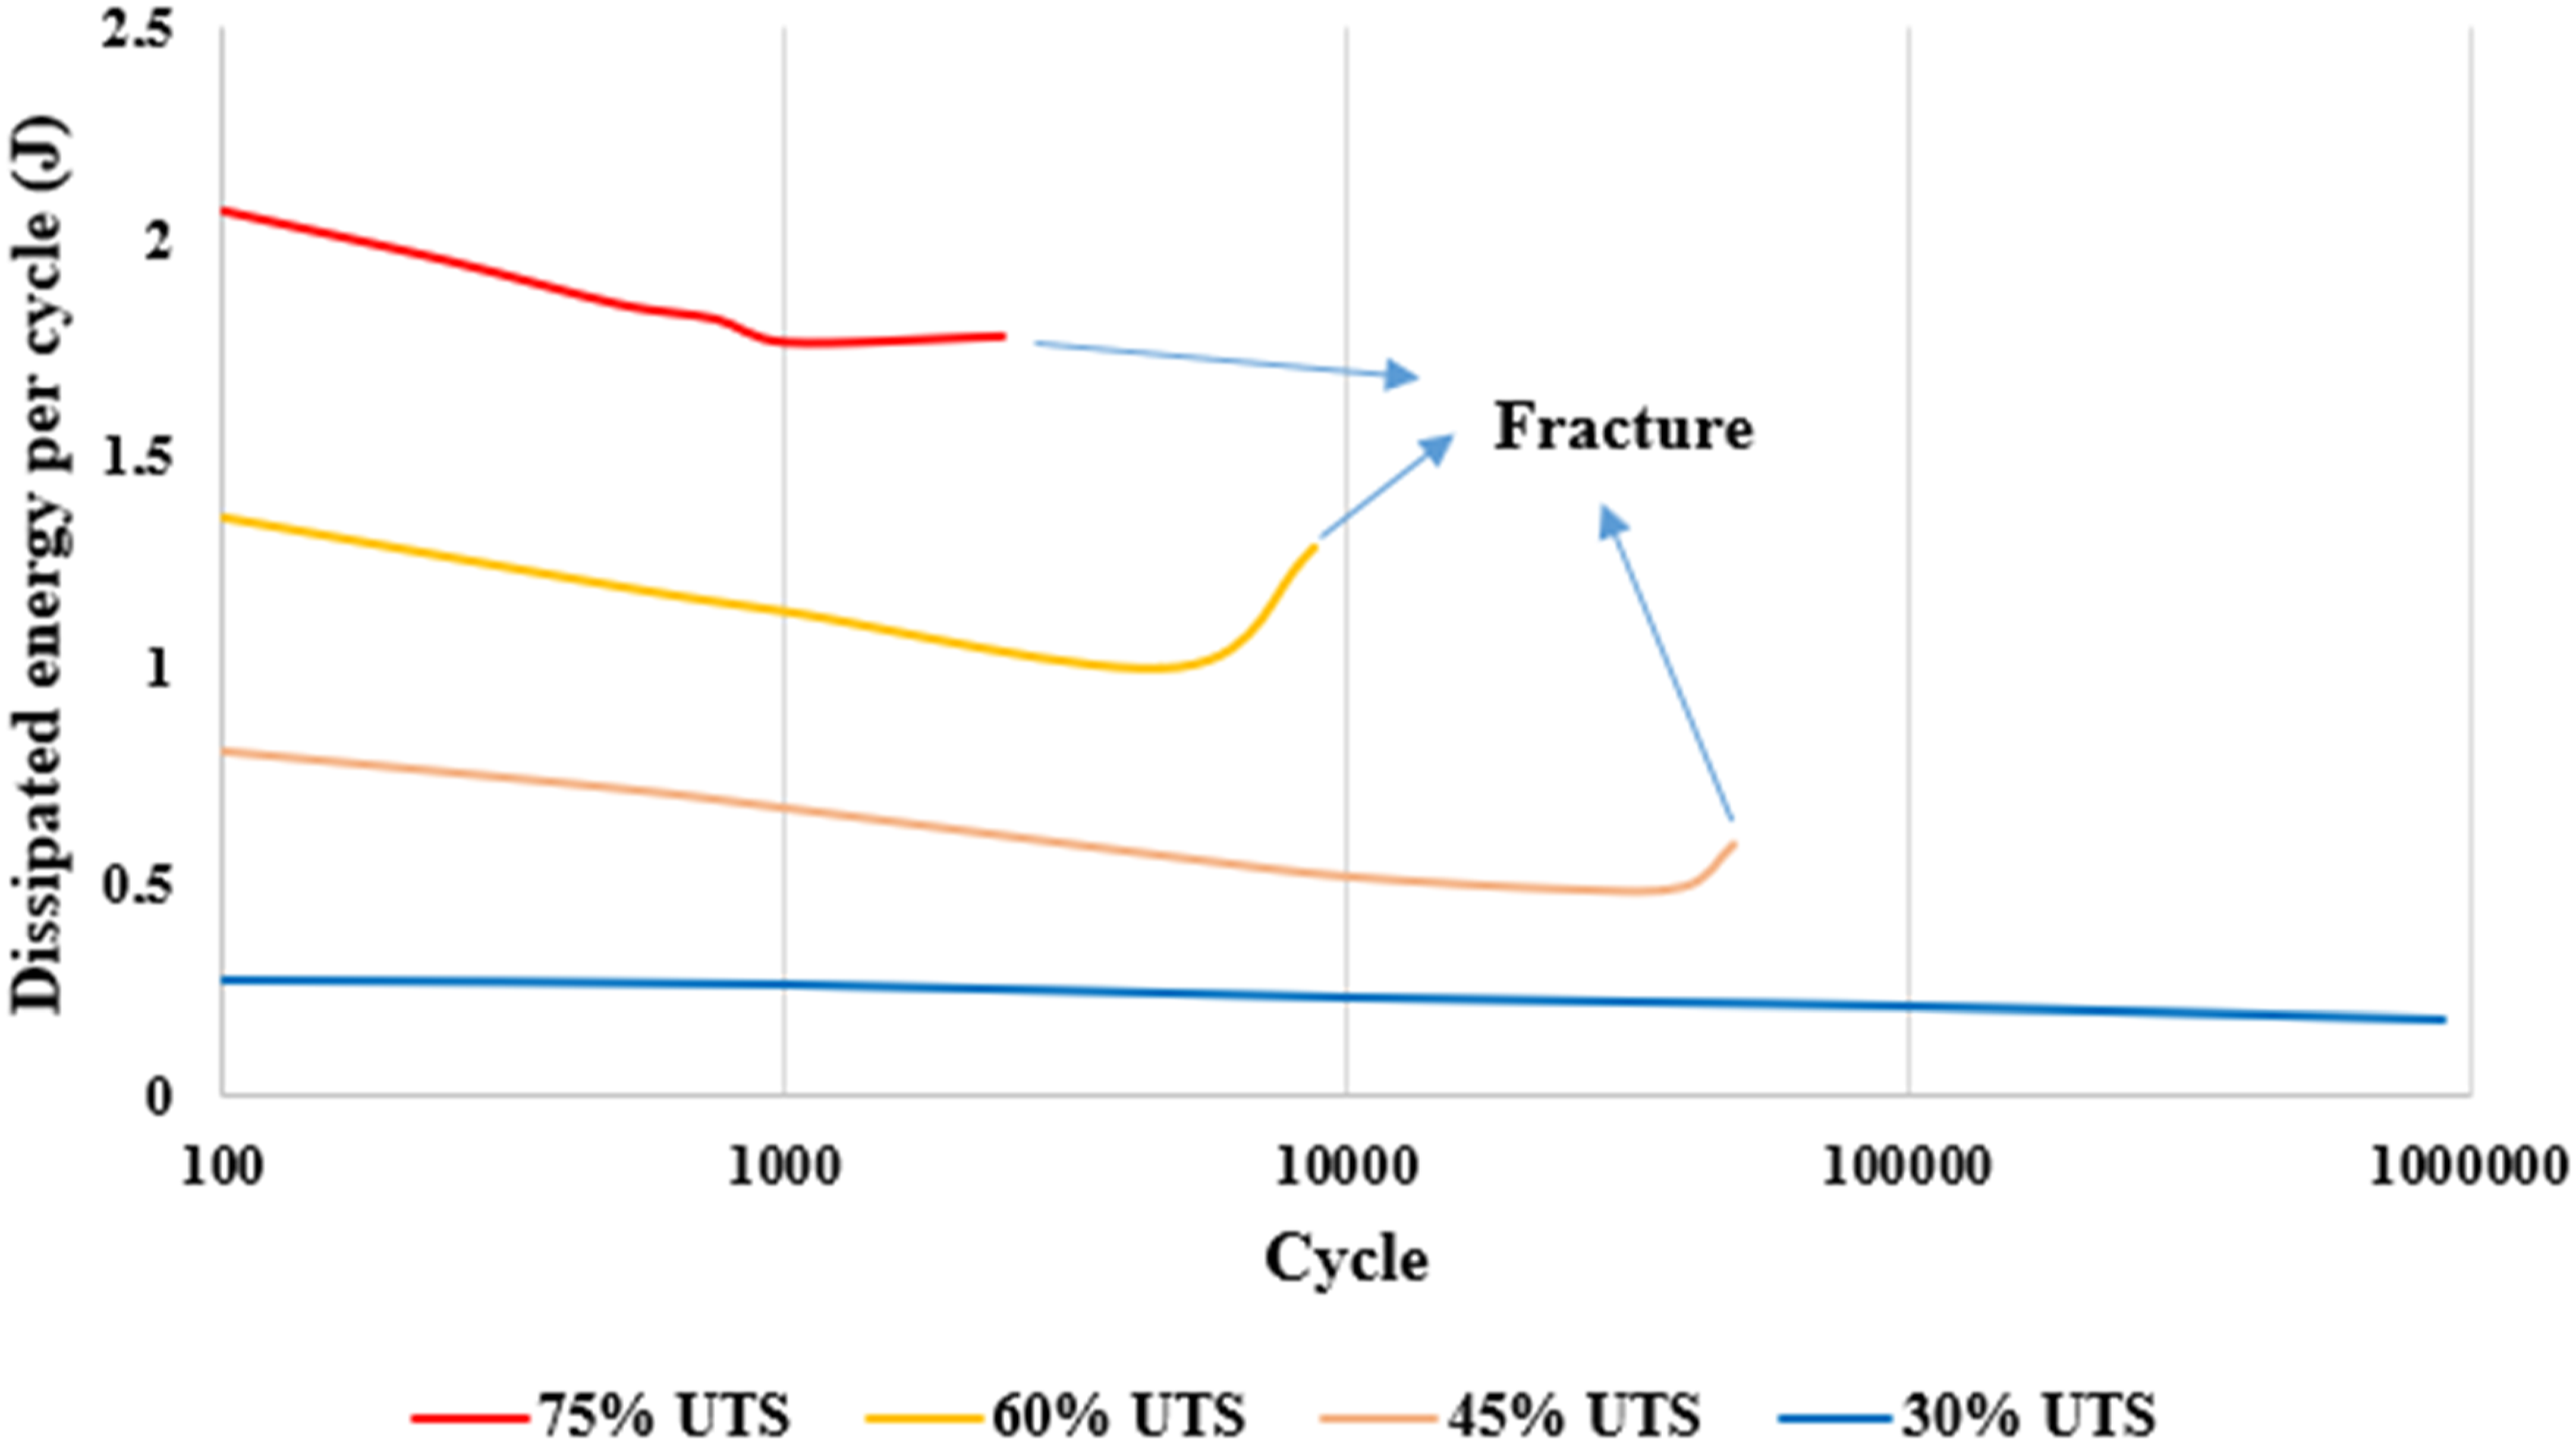
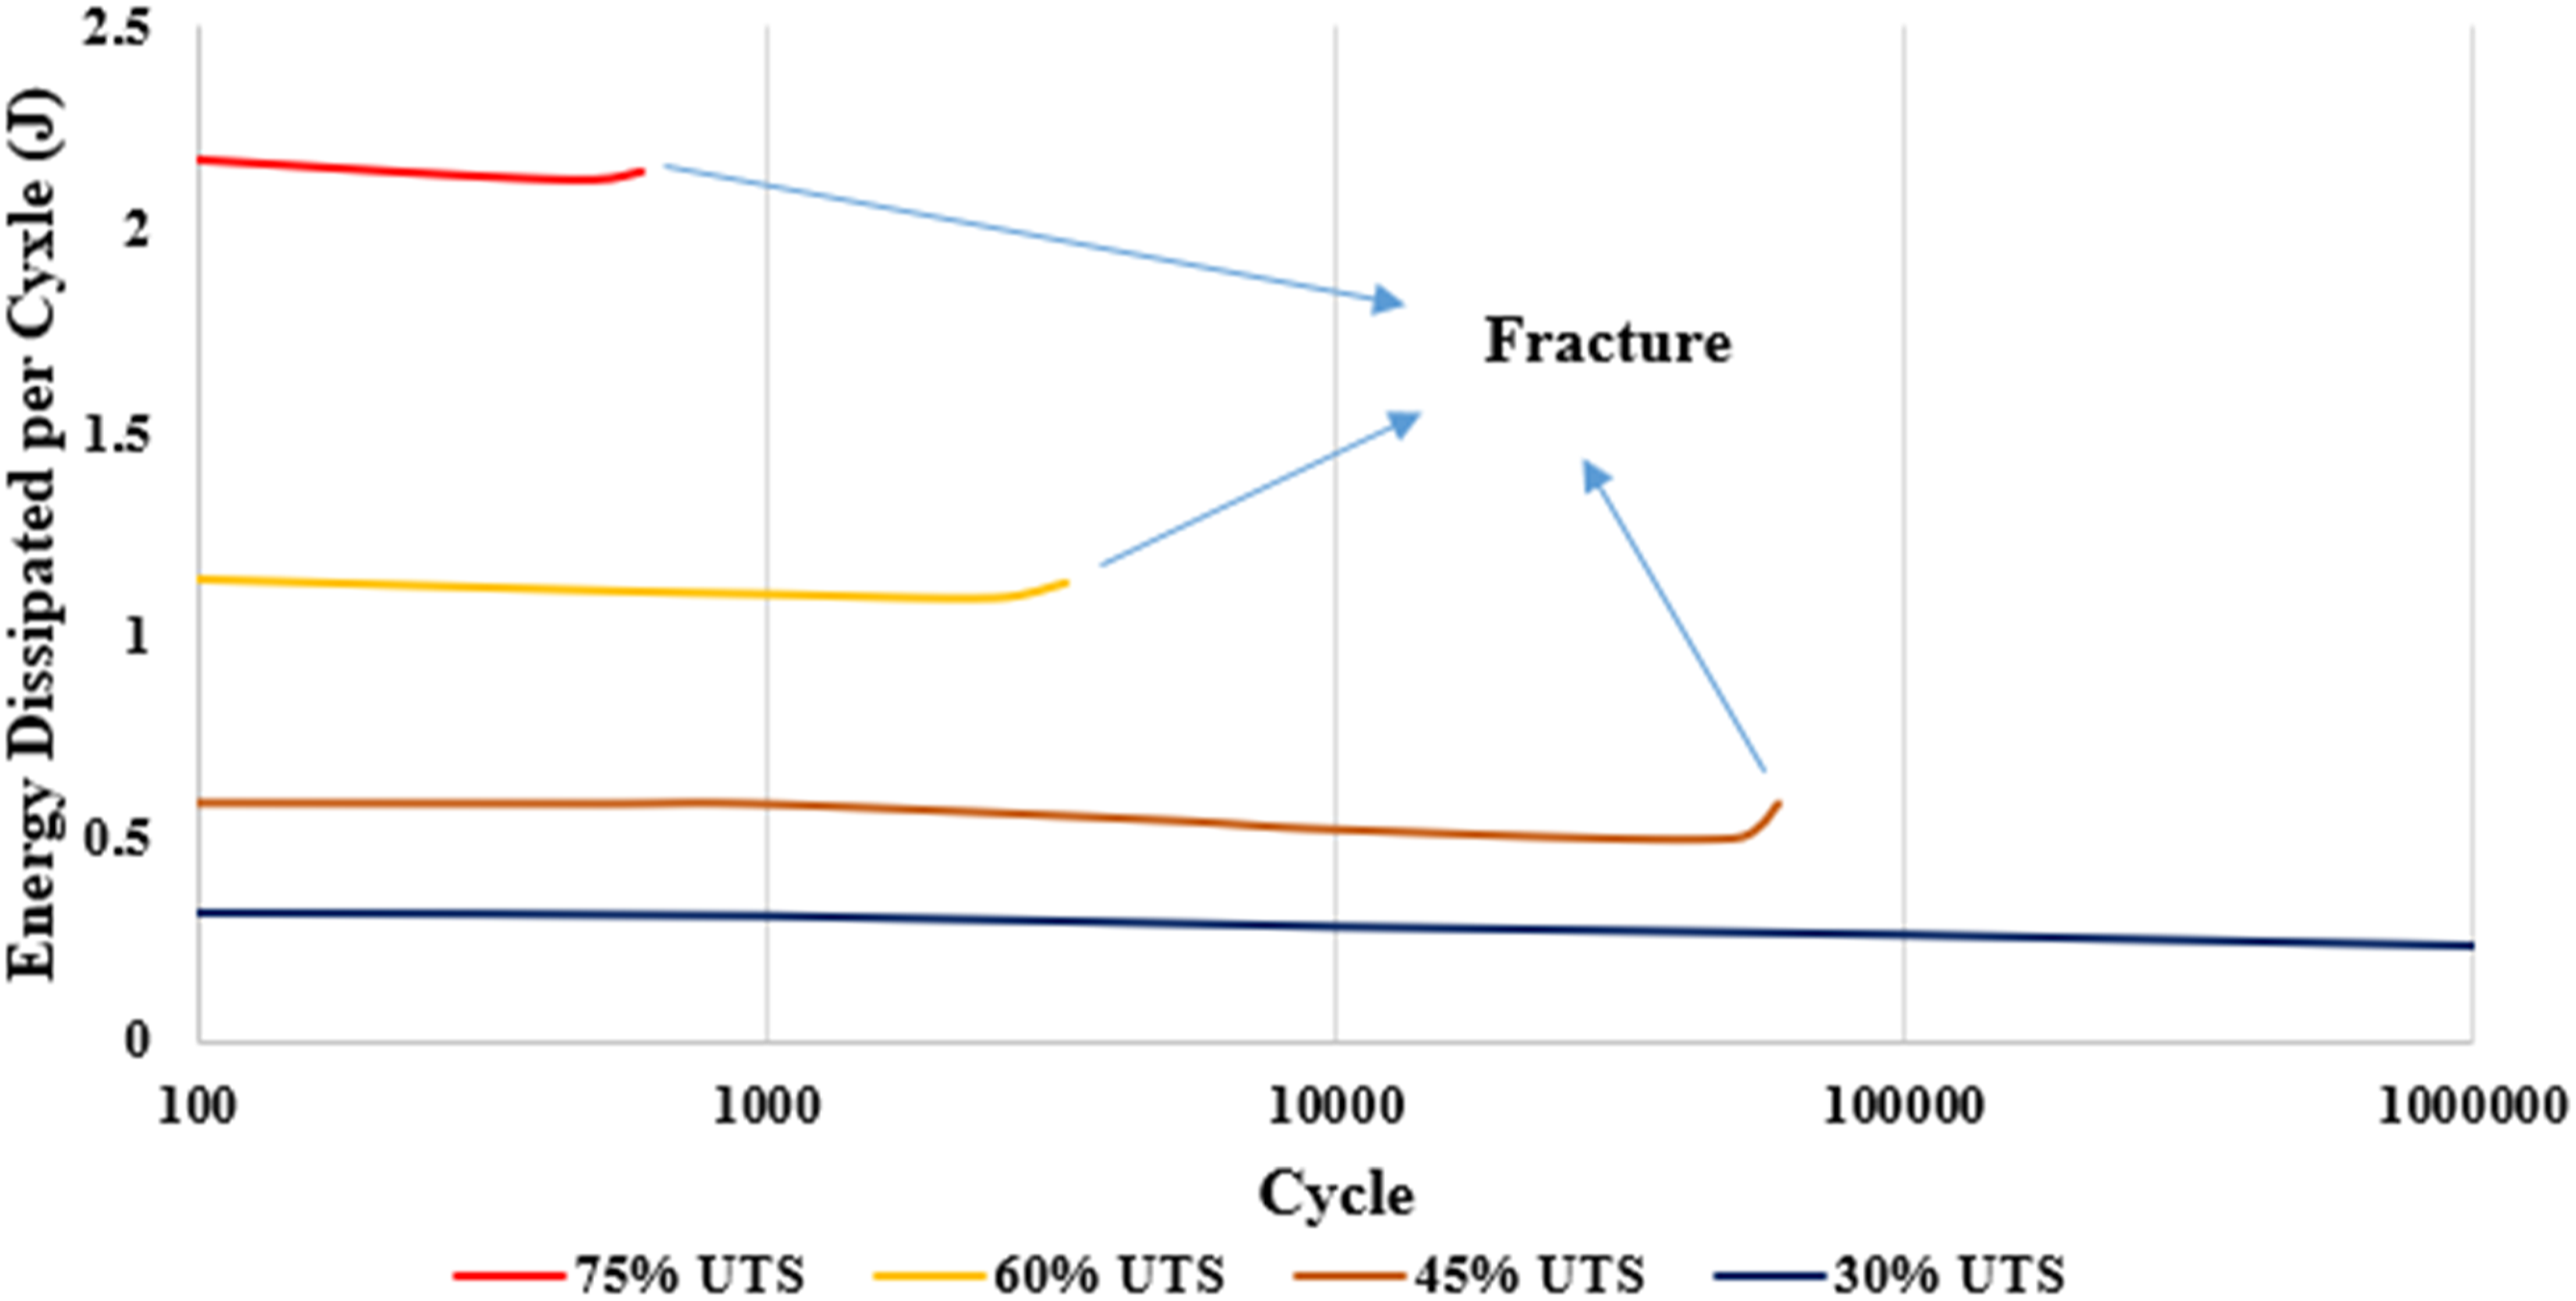
In tests performed at high stress values, the energy consumed per cycle decreases rapidly, while at low stress values, the difference in energy dissipation per cycle during the initial and stabilized fatigue cycle is not that so much. In other words, initial fatigue damage is not so detrimental at lower percentages of stress of applied stress. Moreover, it can be said that 0/90/45 directional samples have a slower decrease of energy dissipation than 0/90 directional samples.
Relationship between energy dissipation per cycle and temperature change during the fatigue test
As a result of the energy released in cyclic stresses applied to polymer materials, a certain temperature increase is observed on the material surface. Due to this feature, these materials are also called self-heating materials.
8
In polymer matrix composites, the dissipated energy per cycle acts as an increase in temperature on the surface of the material. This effect was investigated in carbon fiber reinforced thermoset matrix composites and proved to have a linear effect.
35
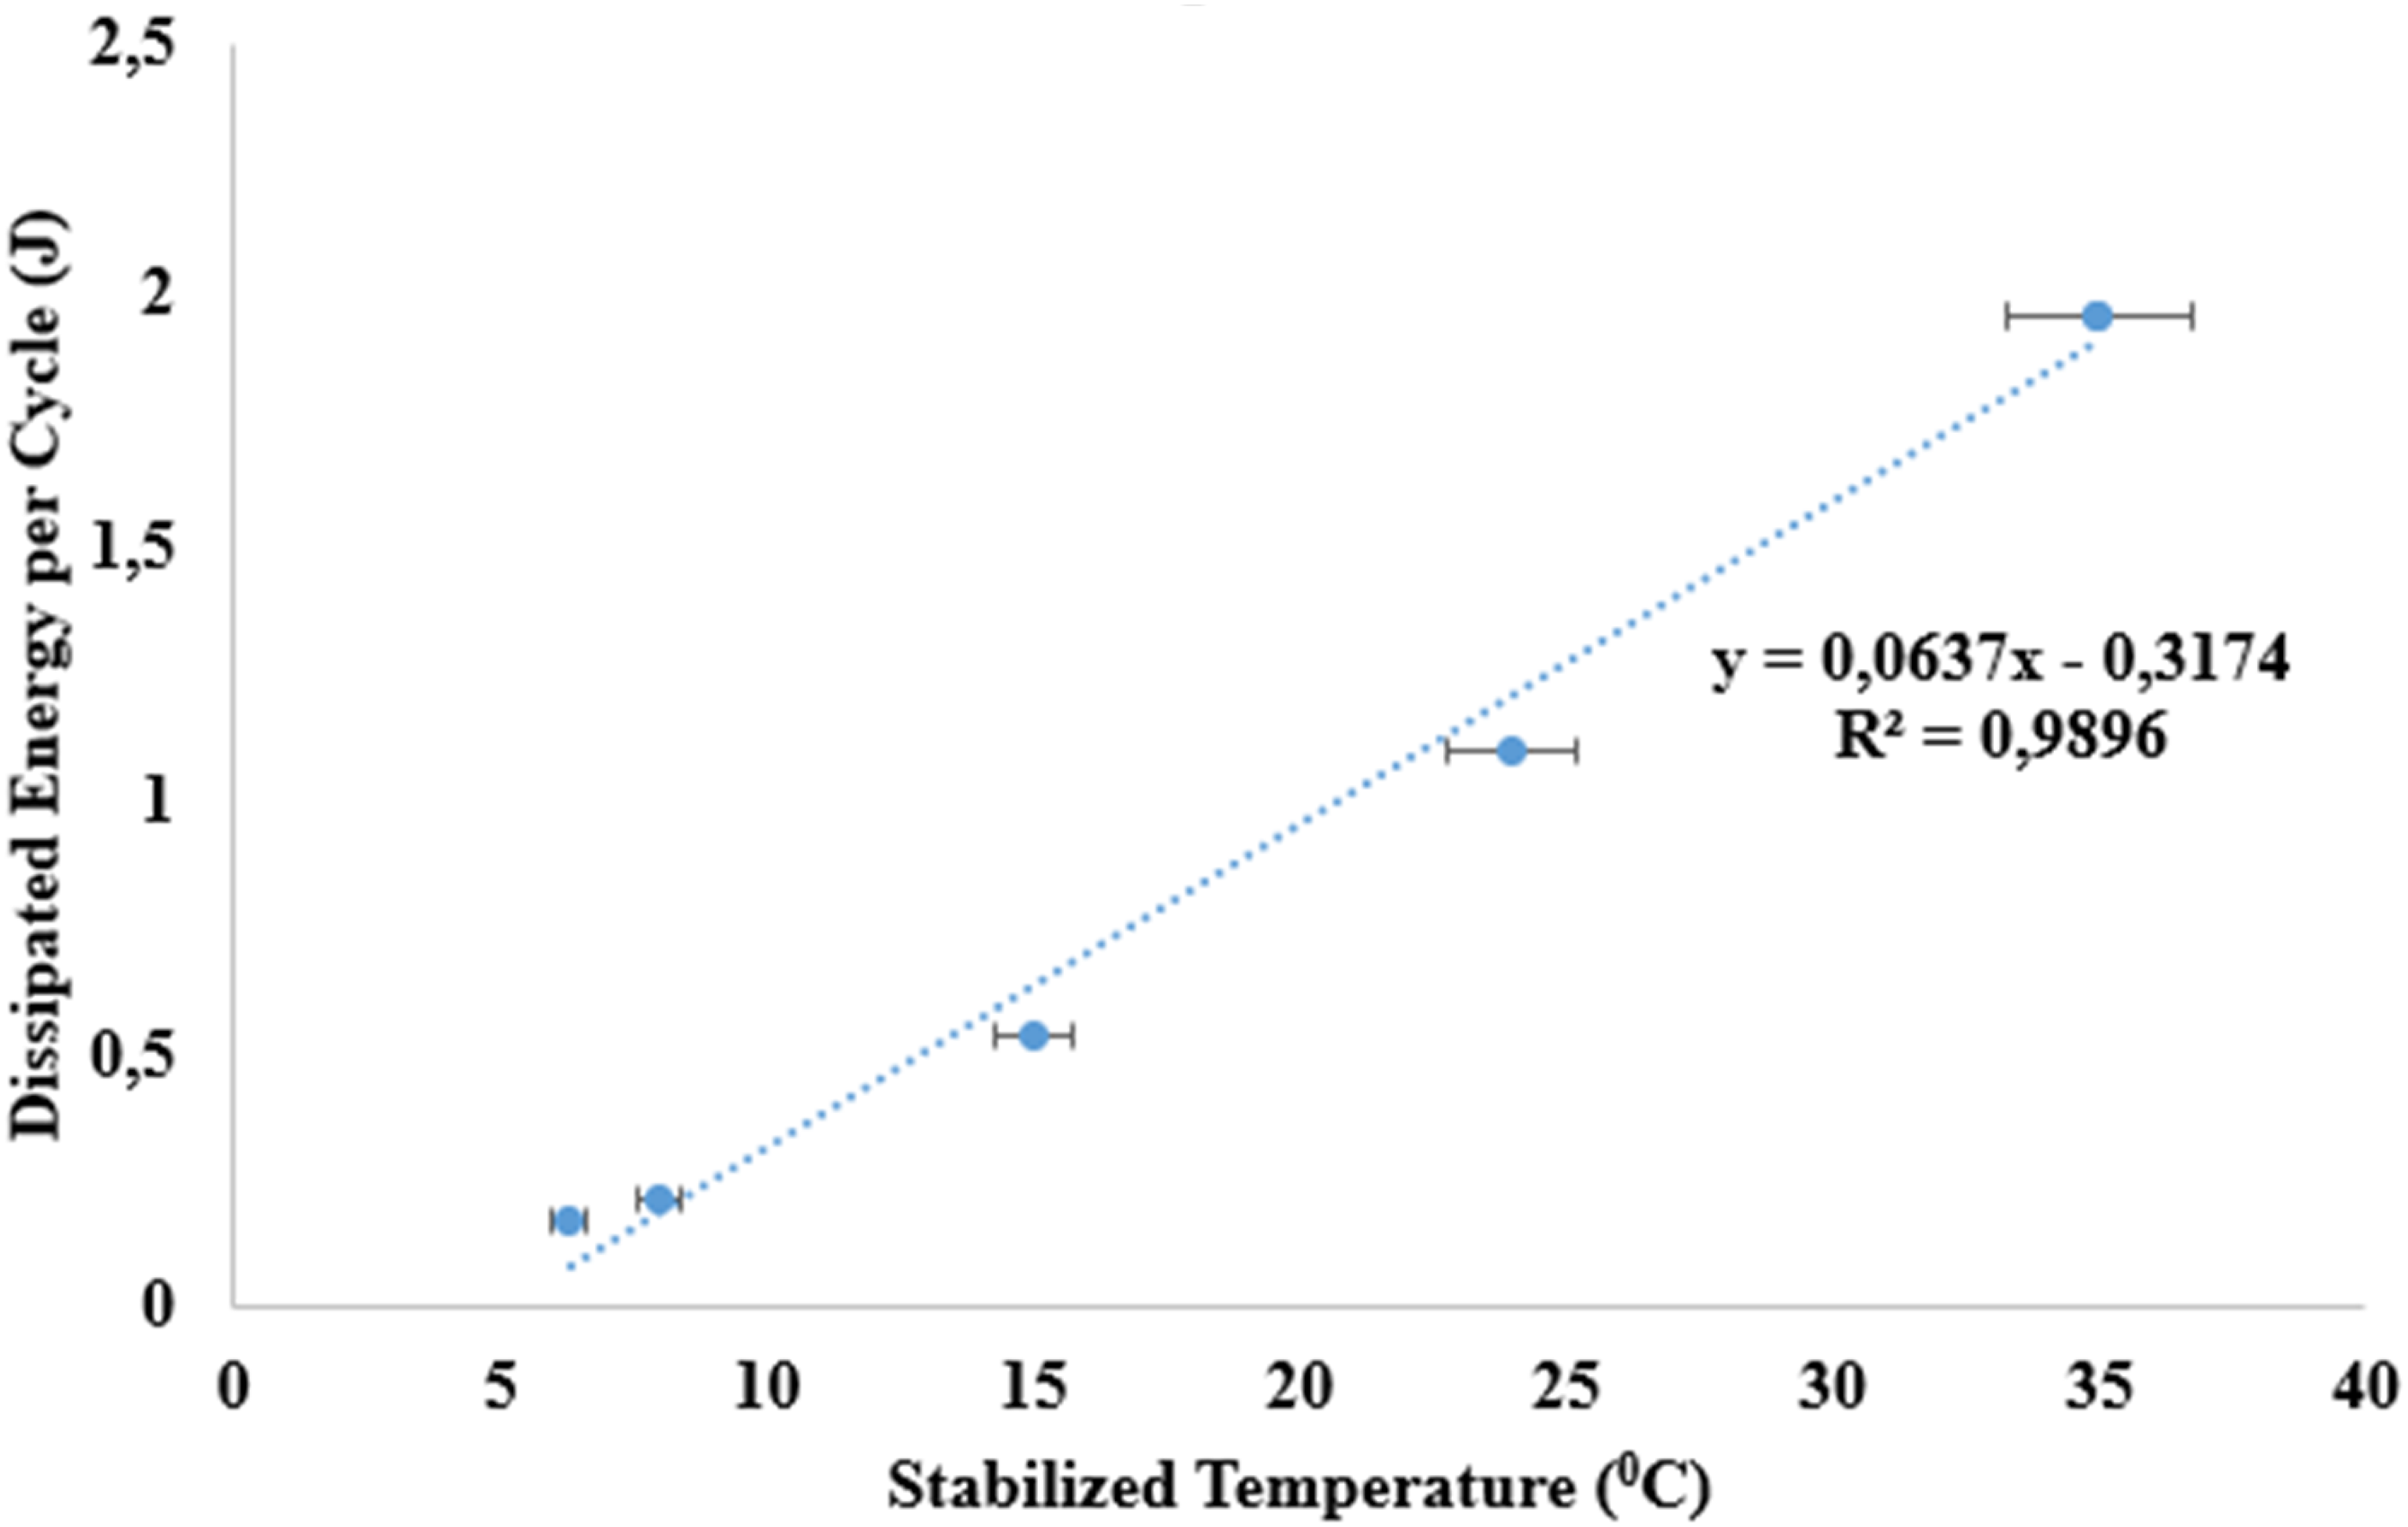
In Figures 14 and 15, the graphs between the energy dissipation per cycle and the stabilized temperature in the different fiber orientation of the material, respectively, are obtained. As the percentage of applied stress (%UTS) increases, the energy consumed per cycle increases. However, a highly accurate linear correlation can be established between the energy consumed per cycle and the stabilized temperature. Regression result obtained in high and low cycle fatigue tests for the sample with 0/90 fiber orientation. Regression result obtained in high and low cycle fatigue tests for the sample with 0/90/45 fiber orientation.
Fatigue limit prediction related to stabilized temperature
When a fatigue test was performed, the researchers want to know whether the operation will be over an infinite lifetime, for example more than 1 million cycles. Because these tests require quite a long time and excessive amount of energy. With this fatigue cycle estimation method, the long cycle fatigue life of glass fiber reinforced Elium thermoplastic composite materials has been estimated. In such a test, the temperature change limit was determined according to each laminate. According to this temperature increase test, if the surface temperature of the sample remains below 10°C, it is estimated that it will be in the 106 cycles.
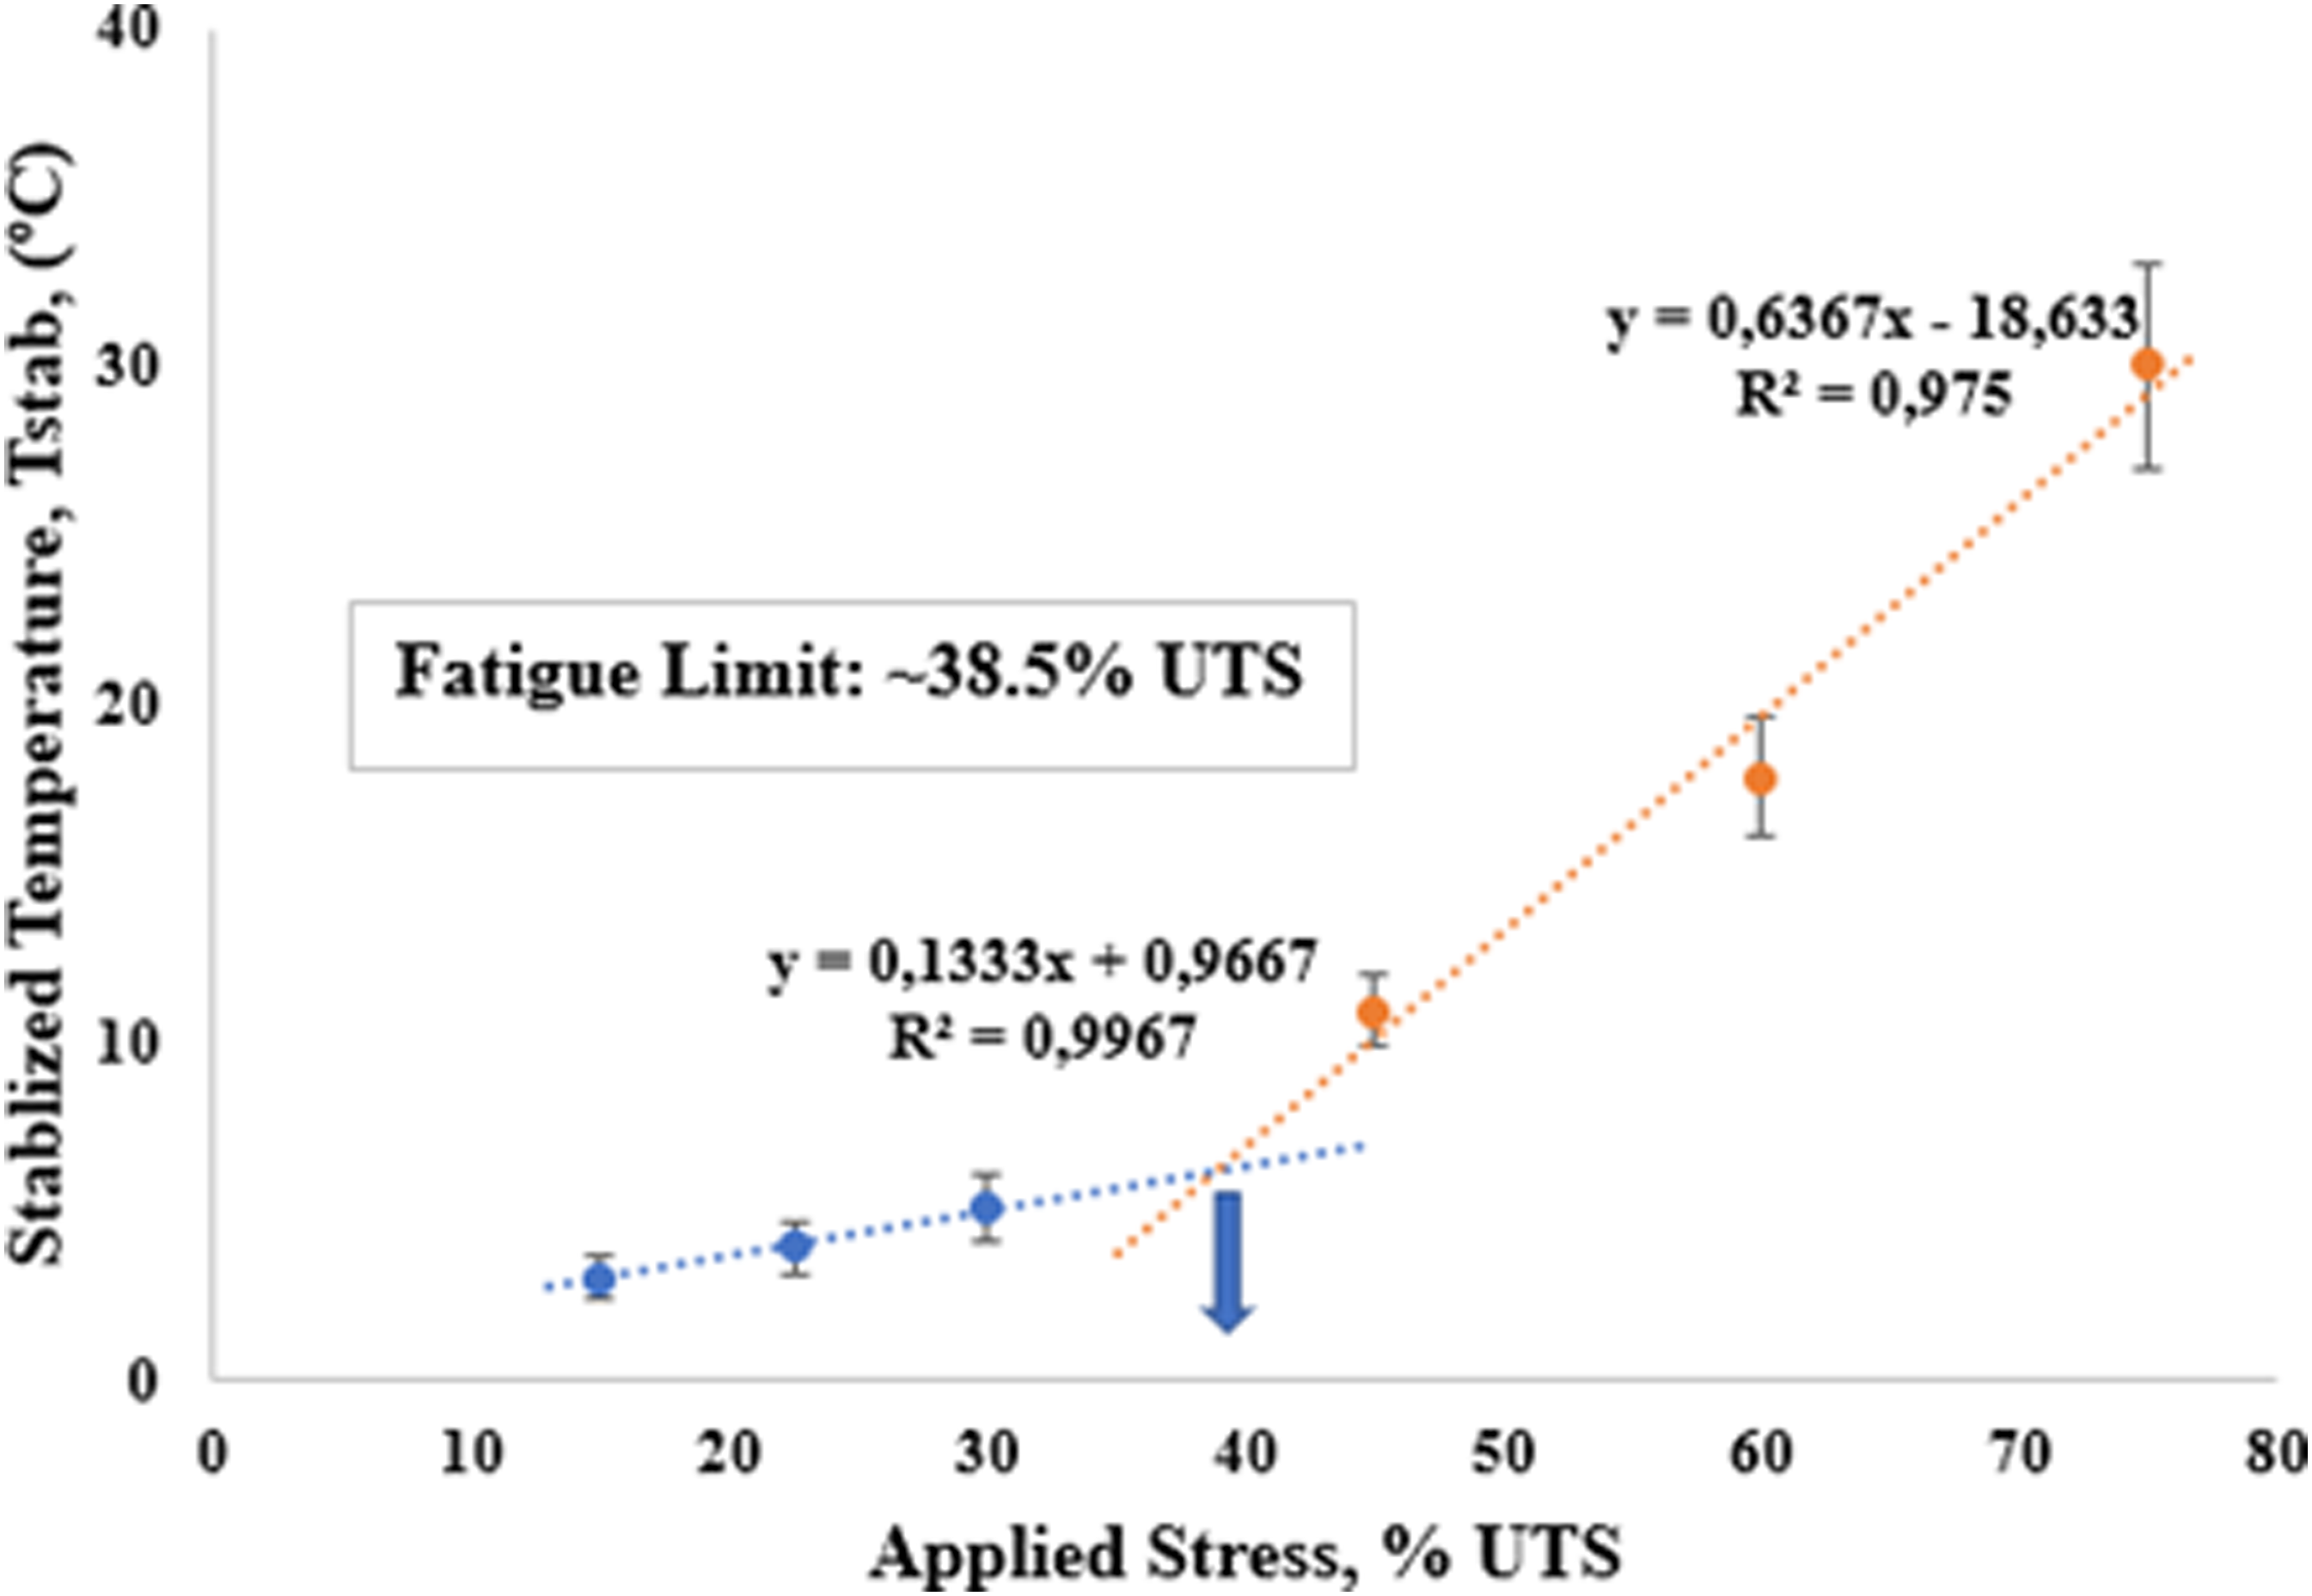
At the same time, fatigue life estimation will be made between regions (between 30% UTS and 45% UTS) that have not been tested and especially where the fatigue limit is not completely clear. It has been observed that the relationship between low-cycle fatigue tests and high-cycle fatigue tests is different by plotting the equilibrium temperature and the applied stress. An estimated fatigue limit can be determined by extending the linear graph of the equilibrium temperature-applied stress graph obtained as a result of these tests. Then, tests will be organized at these fatigue limit values and whether it reaches these temperatures and the fatigue life during fracture will be checked. These estimated values are given in Figures 16 and 17. Estimated fatigue limit obtained for the sample with 0/90/45 fiber orientation. Estimated fatigue limit obtained for the sample with 0/90 fiber orientation.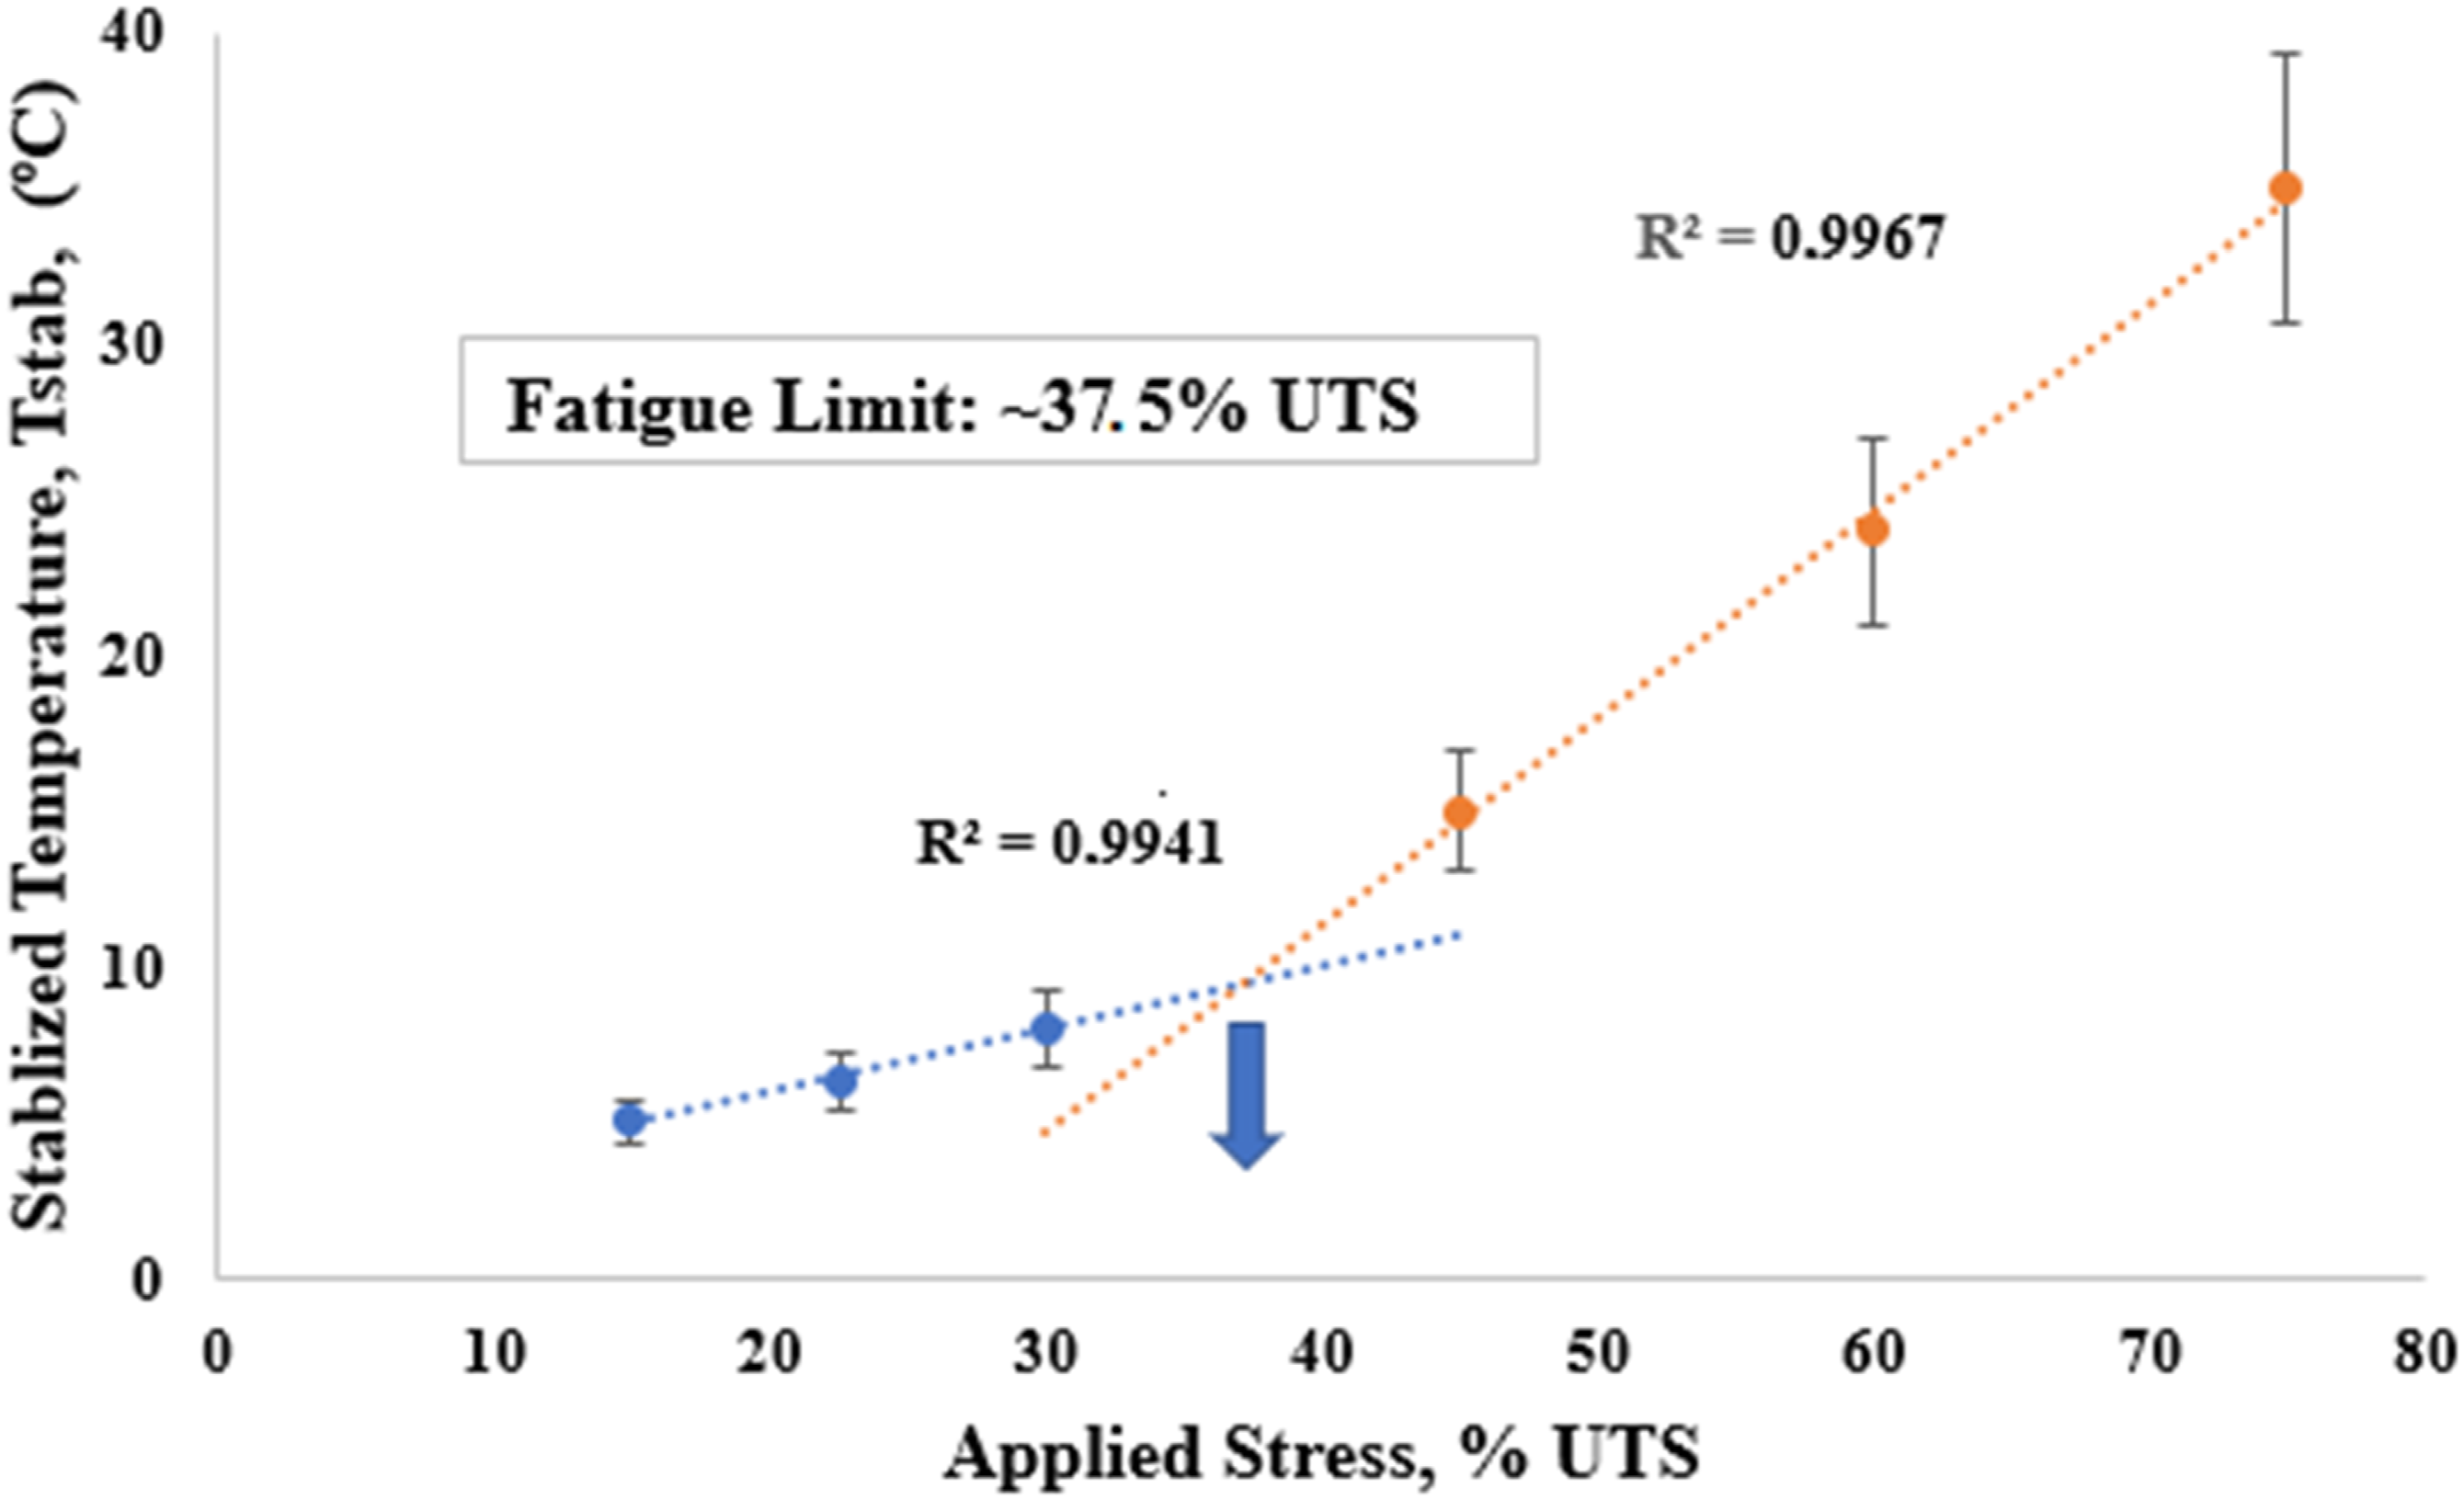
Micro-mechanical damage becomes significant above the high-cycle fatigue stress value. Therefore, the results recorded in the tests performed above these fatigue limits should be followed carefully. At stress levels below the high cycling fatigue limit, the micromechanical damage to the material is insignificant.
At the same time, the relationship between temperature rises and fatigue life has been tried to be combined into some formulas.
38
As Huang and his co-authors pointed out, the product of the temperature change with the fatigue life can be summed up to a constant, and the fatigue life at all stress levels can be determined by simply measuring the temperature change. This formula is given in equation (1).

Equation (1) is transformed into the shape in equation (2), and coefficient values for both fiber orientation are determined. Equation (3) gives the fatigue life with 0/90/45 fiber orientation, while equation (4) formulates the fatigue life for 0/90 fiber orientation. Thanks to these coefficients, the fatigue life at all stress values can be determined. The k values have been found approximately 6.12 for 0/90/45 fiber orientation and 4.48 for 0/90 fiber orientation. The constant values are calculated 94.9 for 0/90/45 fiber orientation and 110.27 for 0/90 fiber orientation.

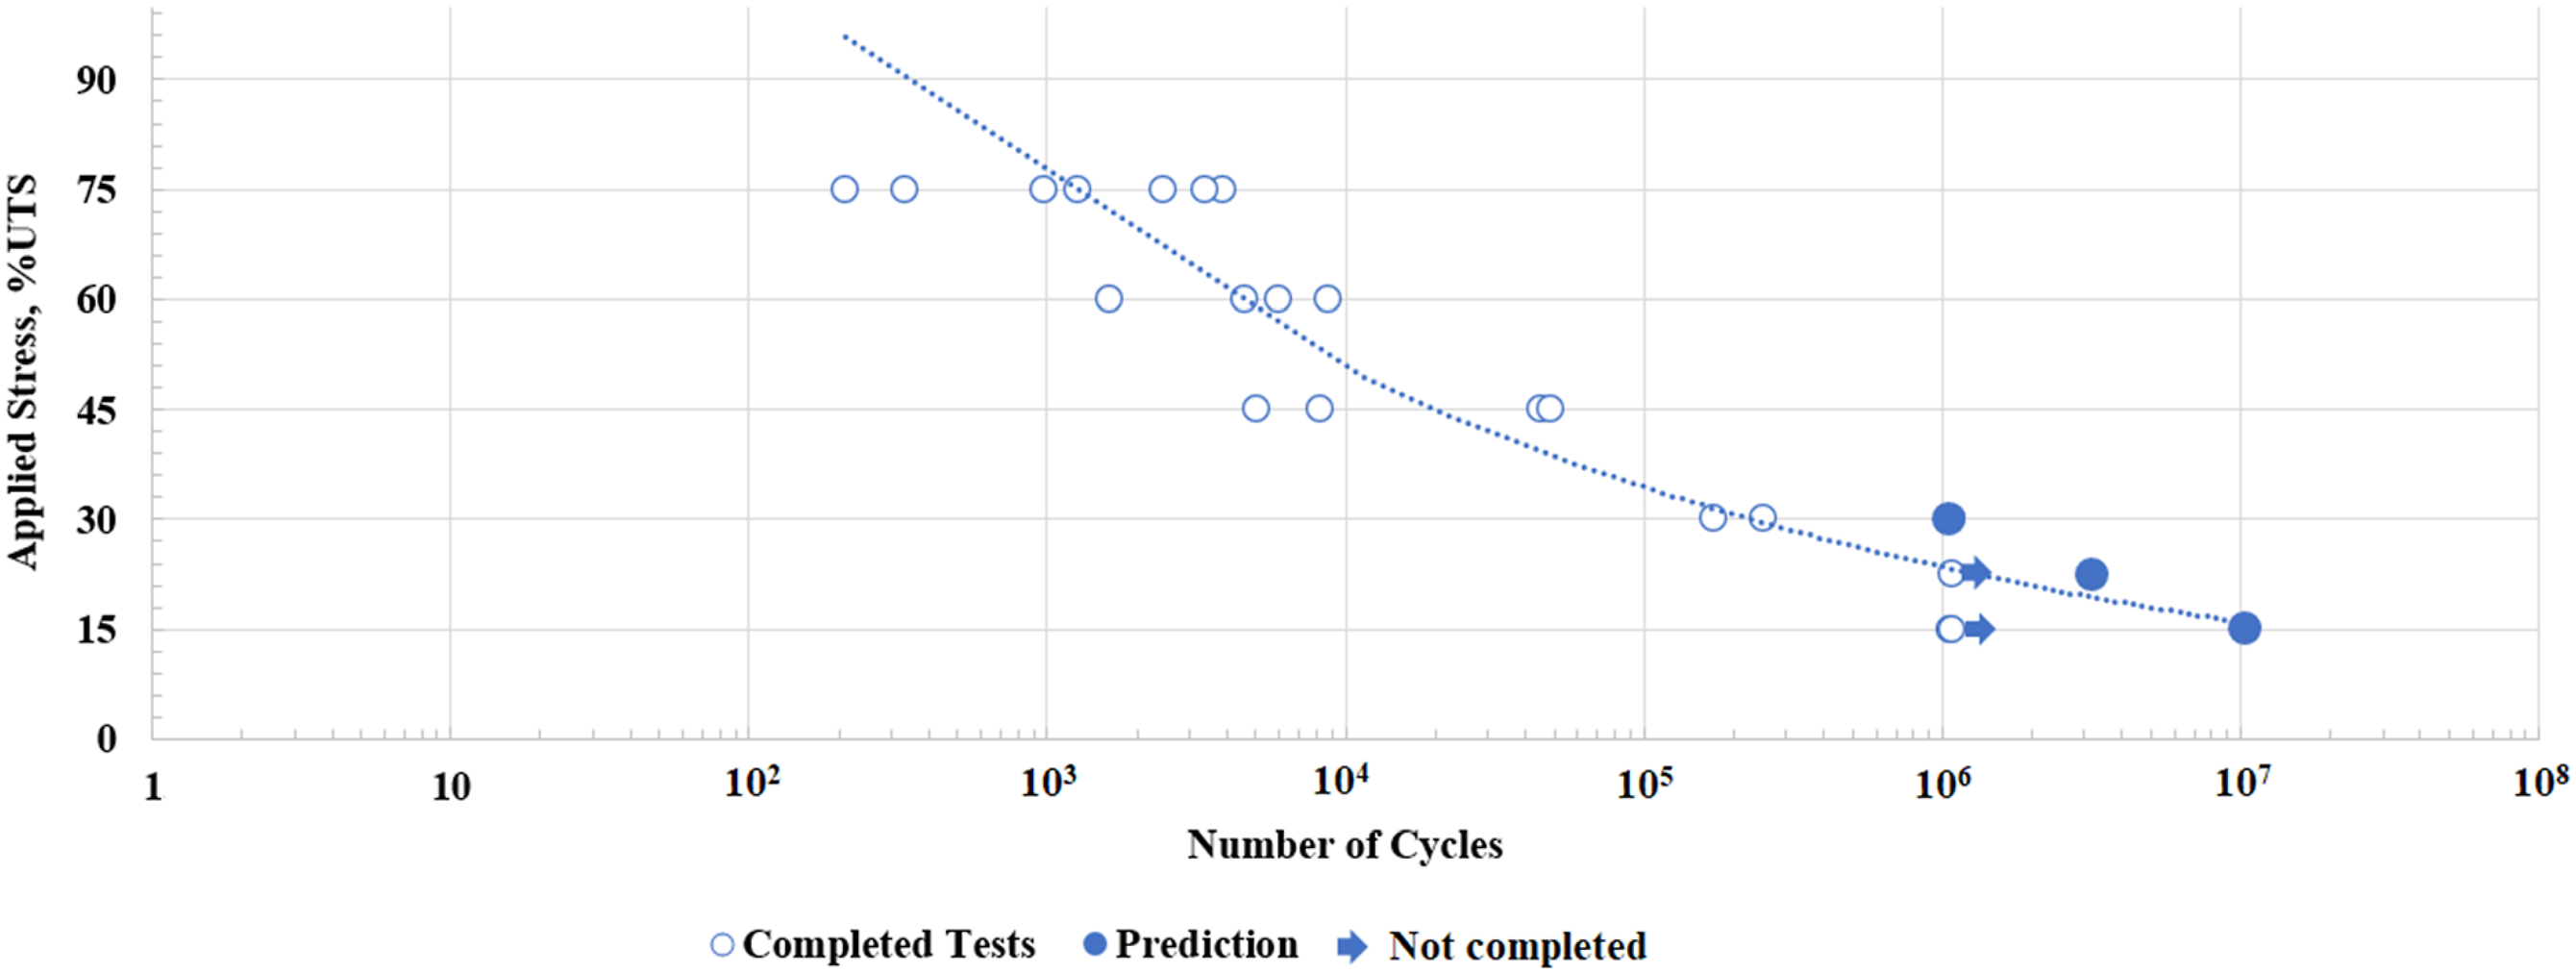
As a result of the study, it was determined that the life of the 0/90/45 fiber orientation sample at 30% UTS level has been predicted 3782340 (3.78 × 10⁶) cycles, at 22.5% UTS level has been calculated 1.63 × 10⁷ and 15% UTS tension level has been estimated 6.72 × 10⁷ cycles. Furthermore, it has been determined that the life of the 0/90 fiber orientation sample performed at 30% UTS level has been calculated 1055365 (1 × 10⁶) cycles, at 22.5% UTS level has been foreseen 3.2 × 10⁶ and at 15% UTS level has been predicted 1.04 × 10⁷ cycles. The graphs with the estimations fatigue cycles are given in Figures 18 and 19 for 0/90/45 and 0/90 fiber orientations respectively. Predicted high cycle fatigue life for the sample with 0/90/45 fiber orientation. Predicted high cycle fatigue life for the sample with 0/90 fiber orientation.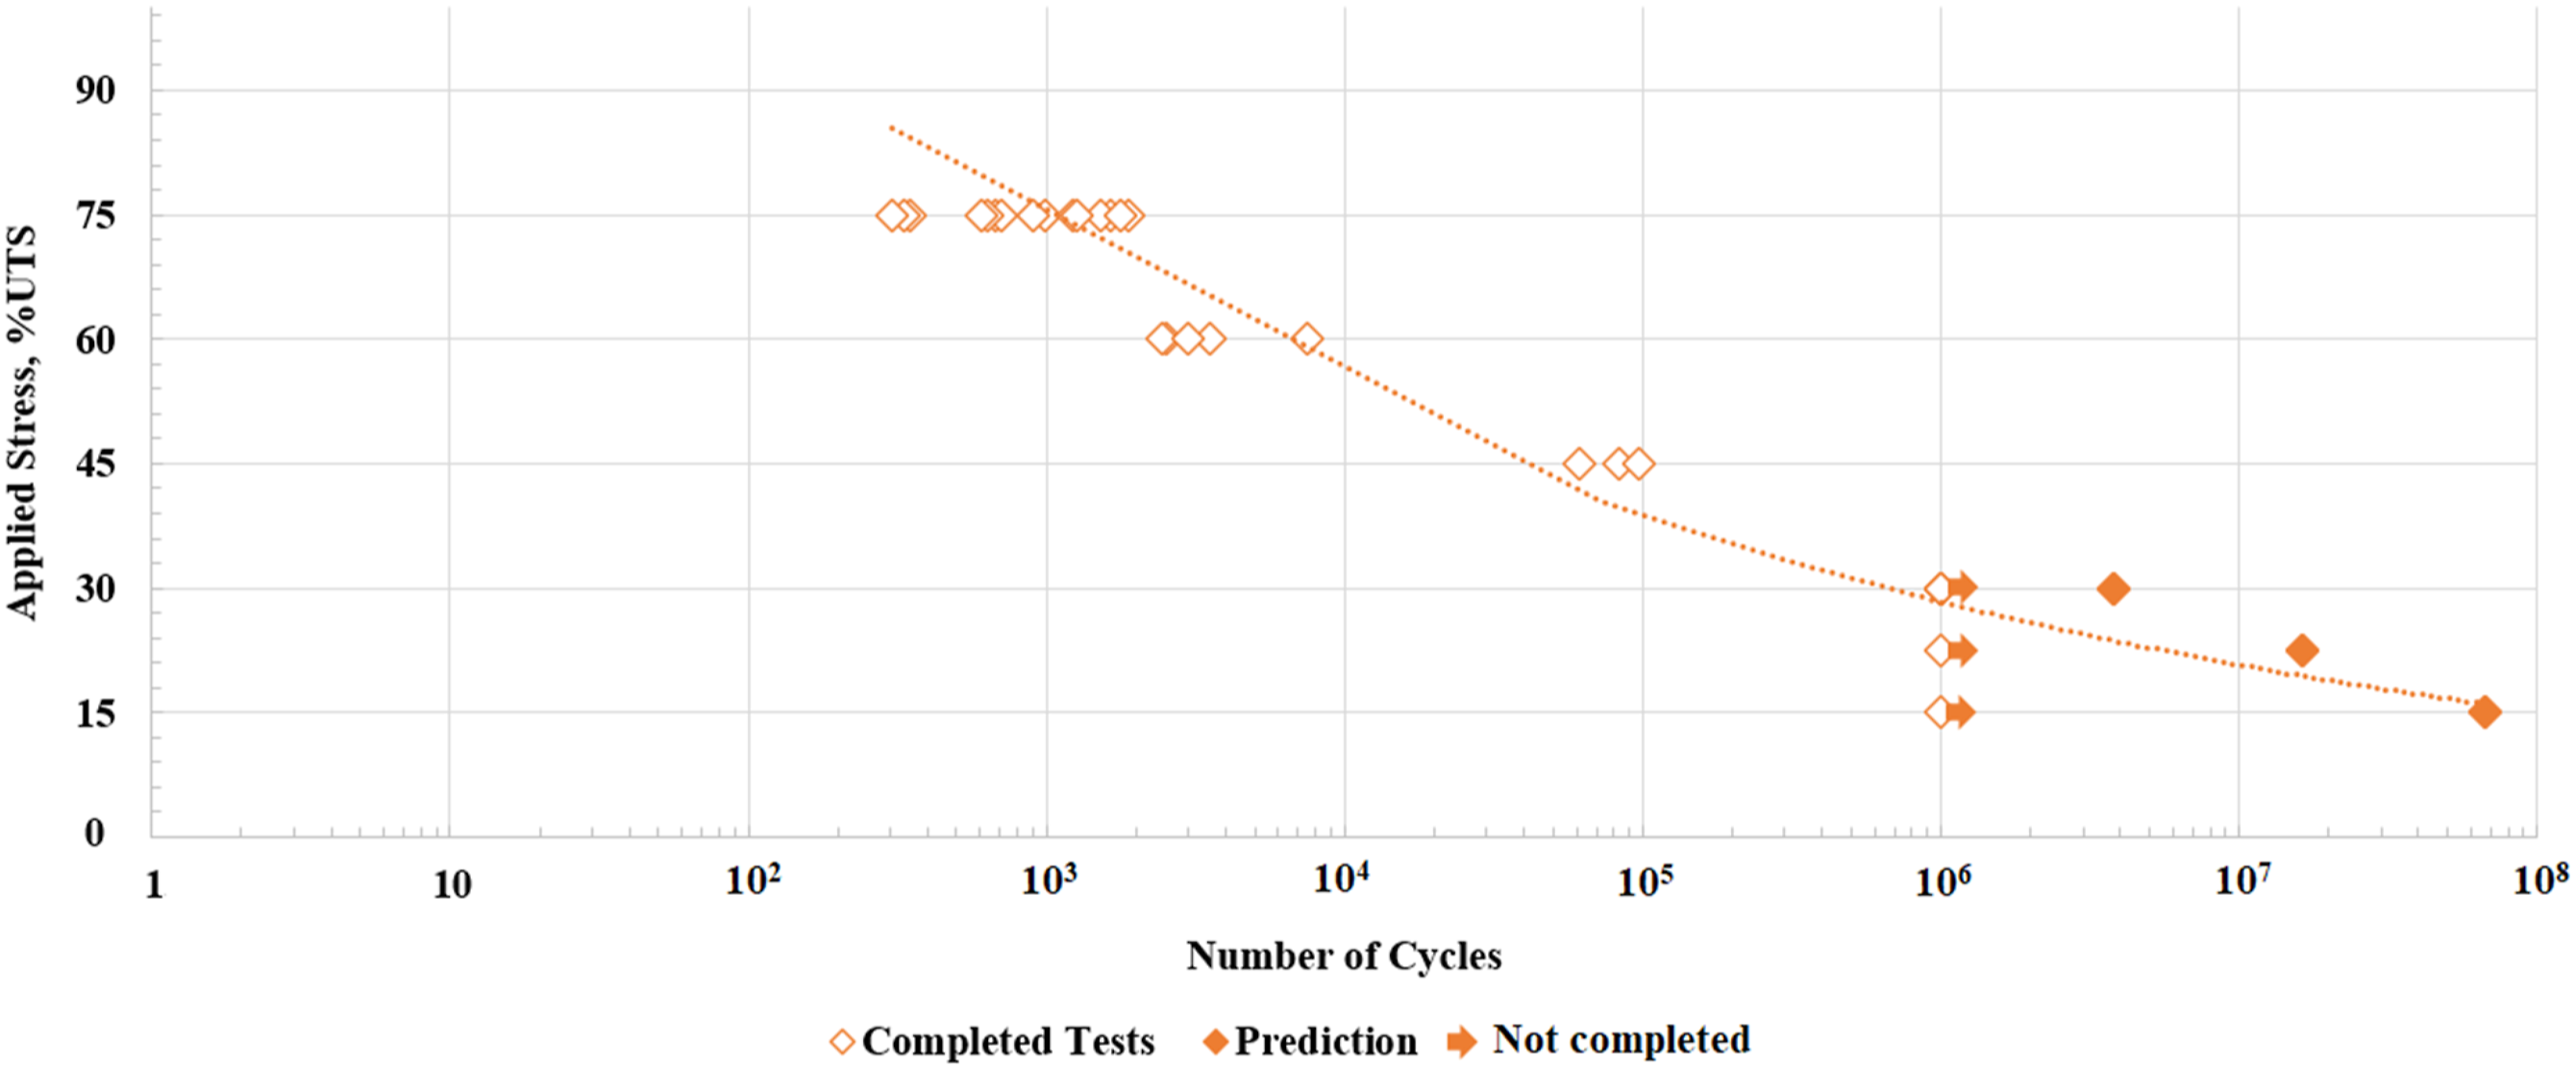
Conclusion
The fatigue prediction process of a glass fiber reinforced acrylic based Elium thermoplastic composite material has been identified deeply. First, static tensile tests were applied to two different fiber orientations to determine the maximum tensile stress values before the fatigue tests. Fatigue tests have been applied at six different stress values from the values obtained from these tensile tests. Temperature measurement has been also carried out during these tests via IR camera. 1. During the temperature measurement, the temperature remains constant for a long time and in the near-fracture period, the temperature shows a sudden increase. The main goal in this article is to predict the fatigue life from this temperature increase. Since especially long cycle fatigue tests take a very long time and this creates an intense energy requirement. 2. It has been proven that stabilized temperature and dissipated energy depend on the positive correlation according to the results obtained from the recorded data. Although the fatigue limit of 106 is accepted for polymeric materials, it is important to predict the final fracture cycle. Therefore, temperature change and fatigue cycle have been balanced with a constant and coefficients have been found by numerical methods. 3. As a result of these measured coefficients, fatigue lives have been estimated for high cycle fatigue strength and it passed the validation test successfully with 93% similarity of fatigue cycle. 4. As a result of these tests, it has been determined that the fatigue cycle at 30% UTS, at 22.5% UTS and at 15% UTS has been estimated 3.78 × 10⁶, 1.63 × 10⁷ and 6.72 × 10⁷ respectively for 0/90/45 fiber orientation. In addition, the fatigue cycles have been predicted at 30% UTS, at 22.5% UTS and at 15% UTS 1 × 10⁶ cycles, 3.2 × 10⁶ cycles and 1.04 × 10⁷ cycles respectively for 0/90 fiber orientation.
Footnotes
Acknowledgements
We are We are thankful for the support received from the Istanbul Technical University Scientific Research Projects Coordination Unit number of MDK-2021-43084 and EU Horizon 2020 Program under the RECOTRANS project with the Grant Agreement number of 76873.
Declaration of conflicting interests
The author(s) declared no potential conflicts of interest with respect to the research, authorship, and/or publication of this article.
Funding
The author(s) disclosed receipt of the following financial support for the research, authorship, and/or publication of this article: This work was supported by the Bilimsel Arastirma Projeleri Birimi, Istanbul Teknik Universitesi; MDK-2021-43084, EU Horizon 2020; 76873.