
Abstract
Polymer nanocomposites based on polystyrene and polycrystalline Si nanoparticles have been successfully synthesized using the solution-casting method. The scanning electron microscope and x-ray diffraction methods show that the Si nanoparticle size in the obtained nanocomposite was up to 50 nm. The thermostability of the obtained nanocomposite was studied depending on the concentration of Si nanoparticles in the PS matrix. It was found that Si nanoparticles that are distributed homogeneously in the polymer matrix act as a thermal barrier. By adding 3% Si nanoparticles into polystyrene polymer, the thermal degradation temperature of PS increases by 20°, and the decomposition rate reduces from −42,460 mg/min to −35,099 mg/min. In addition, it was shown that Si nanoparticles do not affect the PS glass transition temperature, which explains that the porous Si does not reduce the free volume for the polymer molecules to move. The polymer macromolecules just are adsorbed on the porous silicon surface, which partially limits their mobility.
Keywords
Introduction
Numerous factors influence thermal, thermomechanical, electrical, optical, magnetic, and other properties of polymer nanocomposites.1–5 The dynamics of the polymer chain can be strengthened or weakened by the addition of nanoparticles, depending on the filler’s shape, size, quantity, chemical makeup, and type.5–10 Since polystyrene (PS) is affordable, easily manipulated, transparent, and has dielectric properties, it is being thoroughly studied for the production of polymer nanocomposite (PNC).11–14 Numerous researchers looked at the effects of various nanoparticles on the thermal characteristics and structure of polystyrene. It was reported that when hydrophobic silica particles were utilized as fillers for the polystyrene matrix, polystyrene glass transition temperature depended on their concentration. A mathematical approach is presented to explain how the polystyrene/silica ratio affects the glass transition temperature. Based on the findings of the experiments and computations, a nanocomposite with an 18% silica concentration has the maximum thermal stability. 15 High permittivity Sr2TiMnO6(STMO) was added to polystyrene (PS) in a different study. It was discovered that adding STMO increased the PS polymer’s permittivity and dielectric loss. The glass transition temperature of composites was found to be greater than that of pure PS. The composites showed improved thermal stability, and it is possible to investigate these composite films as dielectric materials for use in capacitors. 16
Additionally, hybrid materials based on graphene oxide (GO) and polystyrene (PS) were created. The effect of the grafted polymer brush-modified GO on PS’s thermal stability was investigated using a simultaneous thermal analyzer. The findings demonstrated that in comparison to pure PS, the polymer nanocomposites’ thermal stability, glass transition temperature (Tg), and thermal conductivity were noticeably better. 17 The addition of silver nanoparticles (AgNPs) into PS polymer was investigated, and it was shown that the PS-AgNPs encapsulating 10% AgNPs showed optimum tensile strength and bacteria disinfection properties. 18 The cell structure of the polystyrene-based (PS) nanocomposites was studied. The findings showed that, in these systems, the nucleation process mostly determines the properties of the cellular structure.
Consequently, compared to the pure polymer, increasing the dispersion degree is a crucial strategy for reducing the cell size by 90%. 19 The study examined the blending of nano-alumina powder into a thermoplastic polystyrene matrix to adjust the material’s mechanical and thermal characteristics. According to the measured data, the thermal decomposition temperature stayed almost the same, but the melt flow index increased from 12.3 to 13.4 g/10 min when 5 wt.% TPE was added to the plain polystyrene. Furthermore, by increasing its storage modulus, a tiny quantity of nano-alumina powder might rapidly enhance its mechanical characteristics. For instance, adding 3 wt.% nano-alumina powder increased the storage modulus by 7.3%. However, over-doping the composite with 10 wt.% nano-alumina powder reduced the storage modulus. 20
Phlogopite filler improves the mechanical and thermal characteristics of PS/phlogopite composites. The impact of the phlogopite on the PS was contrasted with that of silica and kaolin. 21 MWCNTs were dispersed in syndiotactic PS gel in both pristine as well as functionalized form to observe its effect on the structure, morphology, thermal as well as dielectric properties of the resulting hybrid polymer gel. It was shown that the conformation change from trans planar to s(2/1)2 helical occurred in this system. The dielectric behavior indicated the percolate nature of the hybrid sPS-gel. The pure sPS-gel displayed no response to the frequency change, whereas due to interfacial polarization, hybrid sPS-gel responded to frequency change. 22
Nanocomposites were prepared by mixing the Al2O3, MWCNT, hexagonal boron nitride (h-BN), and polystyrene using a novel technique to obtain excellent thermal conductivity. The thermal conductivity of the nanocomposites was 3.36 W/mK when 0.5 wt.% MWCNT, 0.5 wt.% Al2O3, and 30 wt.% h-BN particles were incorporated in the polymer matrix. Additionally, the composite has strong insulating qualities. 23 The filler employed in the polystyrene matrix was fullerene. It was discovered that the orientations, interfacial effects, processing, and nanofiller contents all affected the thermoplastic/fullerene nanoparticles’ improved mechanical, electrical, and thermal qualities. For polystyrene and block copolymer systems, it has been discovered that using a combination of fullerene and graphene nanofiller significantly improves the electrical conductivity in the region of 1.8–2.5 S/cm. 24
This study examined the impact of silicon nanoparticles on the characteristics of polystyrene. The main objective of the paper is to study thermal behavior, as the paper focuses on how the thermal stability, decomposition rates, and glass transition temperature are affected by the incorporation of Si nanoparticles. Preparation, structural characterization, and thermal behavior of the polystyrene + polycrystalline silicon nanoparticle-based polymer nanocomposites were studied and interpreted elaborately for the first time. The information gathered shows that PS + Si-based nanocomposites have intriguing features that will help expand the application areas of the polymer nanocomposites.
Experimental part
Materials
The chemicals that were used in this study: High impact polystyrene (HIPS 7240) was purchased from Tabriz Petrochemical Company (Tabriz, Iran) with a melt flow index of 4.5 g/10 min tested at 200°C using a load of 5 kg.
Silicon nanoparticles were prepared by carbothermal reduction of silica. 25 Silica nanoparticles were extruded from the pre-ground air-dry rice husk. 26 Carbon materials were also obtained from lignocellulosic raw materials. 27 A high-temperature vacuum furnace from Linn High Therm HT-1800-Vac was used to synthesize silicon nanoparticles from the obtained silicon dioxide and carbon at 2100°C.
Preparation of the nanocomposite
Composites were prepared through a combination of the two methods, namely mixing in solution and hot pressing. PS was dissolved in toluene by stirring the mixture for about 30 min on a magnetic stirrer at 120°C.28,29 The filler with different weight content was added into the polymer solution and was mixed for 2 h until the homogeneous system was obtained. Then the solvent was evaporated and in the final step nanocomposite films were prepared by the hot pressing method. 29
Methods
The morphology of the samples was investigated by the Vega Tescan.
X-ray diffraction was performed on the Rigaku Mini Flex 600 XRD diffractometer at ambient temperature. In all the cases, Cu Kα radiation from a Cu X-ray tube (run at 15 mA and 30 kV) was used. The samples were scanned in the 2θ angle range of 20°–70°.
IR spectra of the samples were recorded on a spectrometer FT-IR Varian-3600 Excalibur Series, allowing recording the spectra in the range of 4000–400 cm−1.
Thermogravimetric analysis of samples was conducted in a thermogravimetric analyzer (TGA) Model Seiko Exstar 6000 TG/DTA 6300. Nanocomposite samples were heated from 30 to 650°C with a heating rate of 100°C/min in a nitrogen atmosphere.
Differential scanning calorimetric analysis of nanocomposites was performed on nanocomposites by using the DSC 6100 (Seiko Instruments Japan) model of Differential Scanning Calorimeter (DSC). Samples were placed into aluminum sample pans and experiments were carried out under a nitrogen atmosphere with a purge rate of 20 mL/min. Samples were heated from 20 to 250°C then cooled to 25°C.
Results and Discussion
Figure 1 shows the scanning electron microscope images of PS + Si nanocomposite. The morphology of the PS + Si nanocomposite and the size and shape of the Si nanoparticles in the polymer matrix were discovered at various magnifications. It was investigated that Si nanoparticles dispersed throughout the polymer matrix as clusters. Individual spherical Si particle size is up to 50 nm. SEM images of PS/silicon nanocomposites microstructure reflected at various magnifications.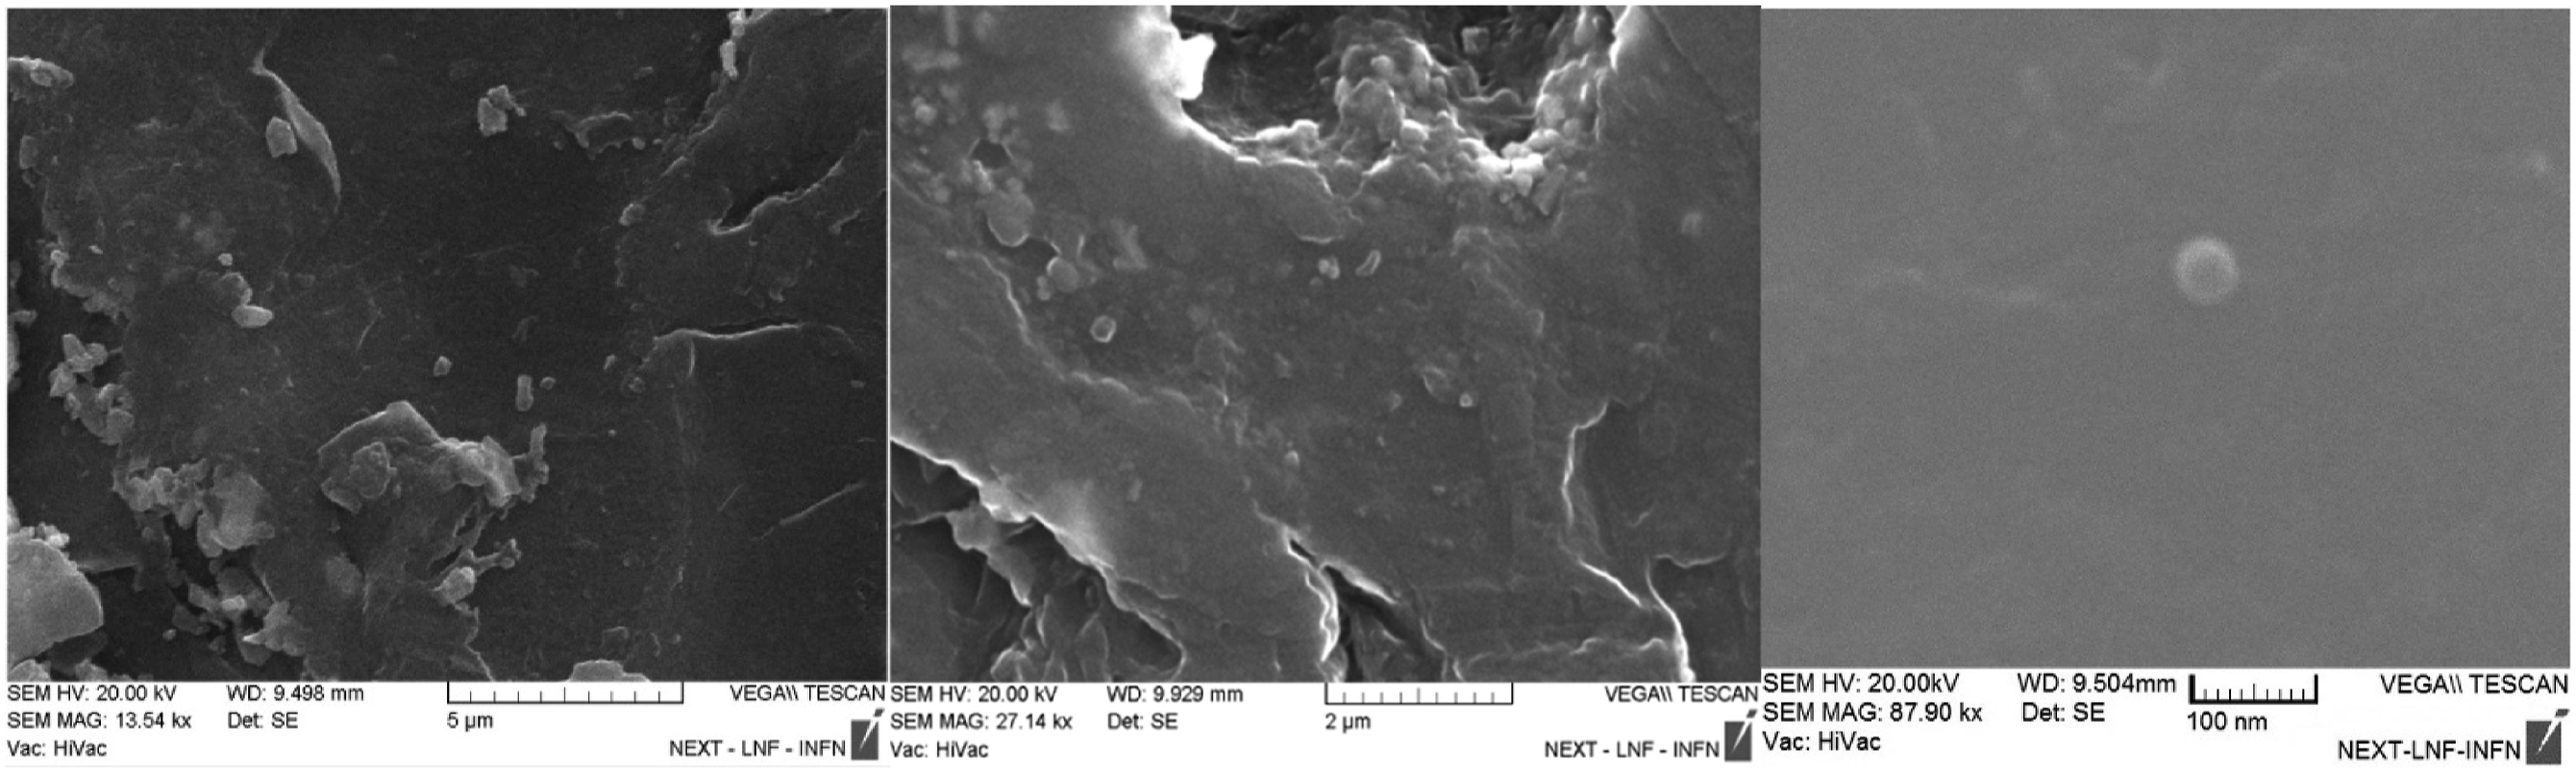
The interaction between the nanoparticles and the polymer in PS + Si nanocomposite in the 300–3300 cm−1 wave number region was investigated by Infrared spectroscopy. The infrared spectra of nanocomposites of silicon and polystyrene are displayed in Figure 2. For the materials under study, corresponding absorption bands of oscillations of different bonds connected to Si are observed in the 690–1030 cm−1. Thus, the absorption lines recorded at 694, 835, 905, and 1026 cm−1 correspond to symmetrical bending vibrations of the Si–O group, HSi(O)OSi(O)H, Si-H, Si-O-Si, respectively.
30
This fact suggests that Si-O-Si-induced surface oxidation of Si nanoparticles has occurred. Besides, it was known that H atoms are also adsorbed on the surface of Si nanoparticles. The peaks at range 3082-2850 cm−1 are due to the stretching of C-H aliphatic and aromatic groups. The strong absorption band that appeared at 1600 cm−1 has been assigned to C = C, whereas the peak at 1492 cm−1 is due to the C = C stretching of benzene rings.
31
FTIR spectrum of Ps/silicon nanocomposites: PS + 1,5%Si(1); PS + 3%Si(2).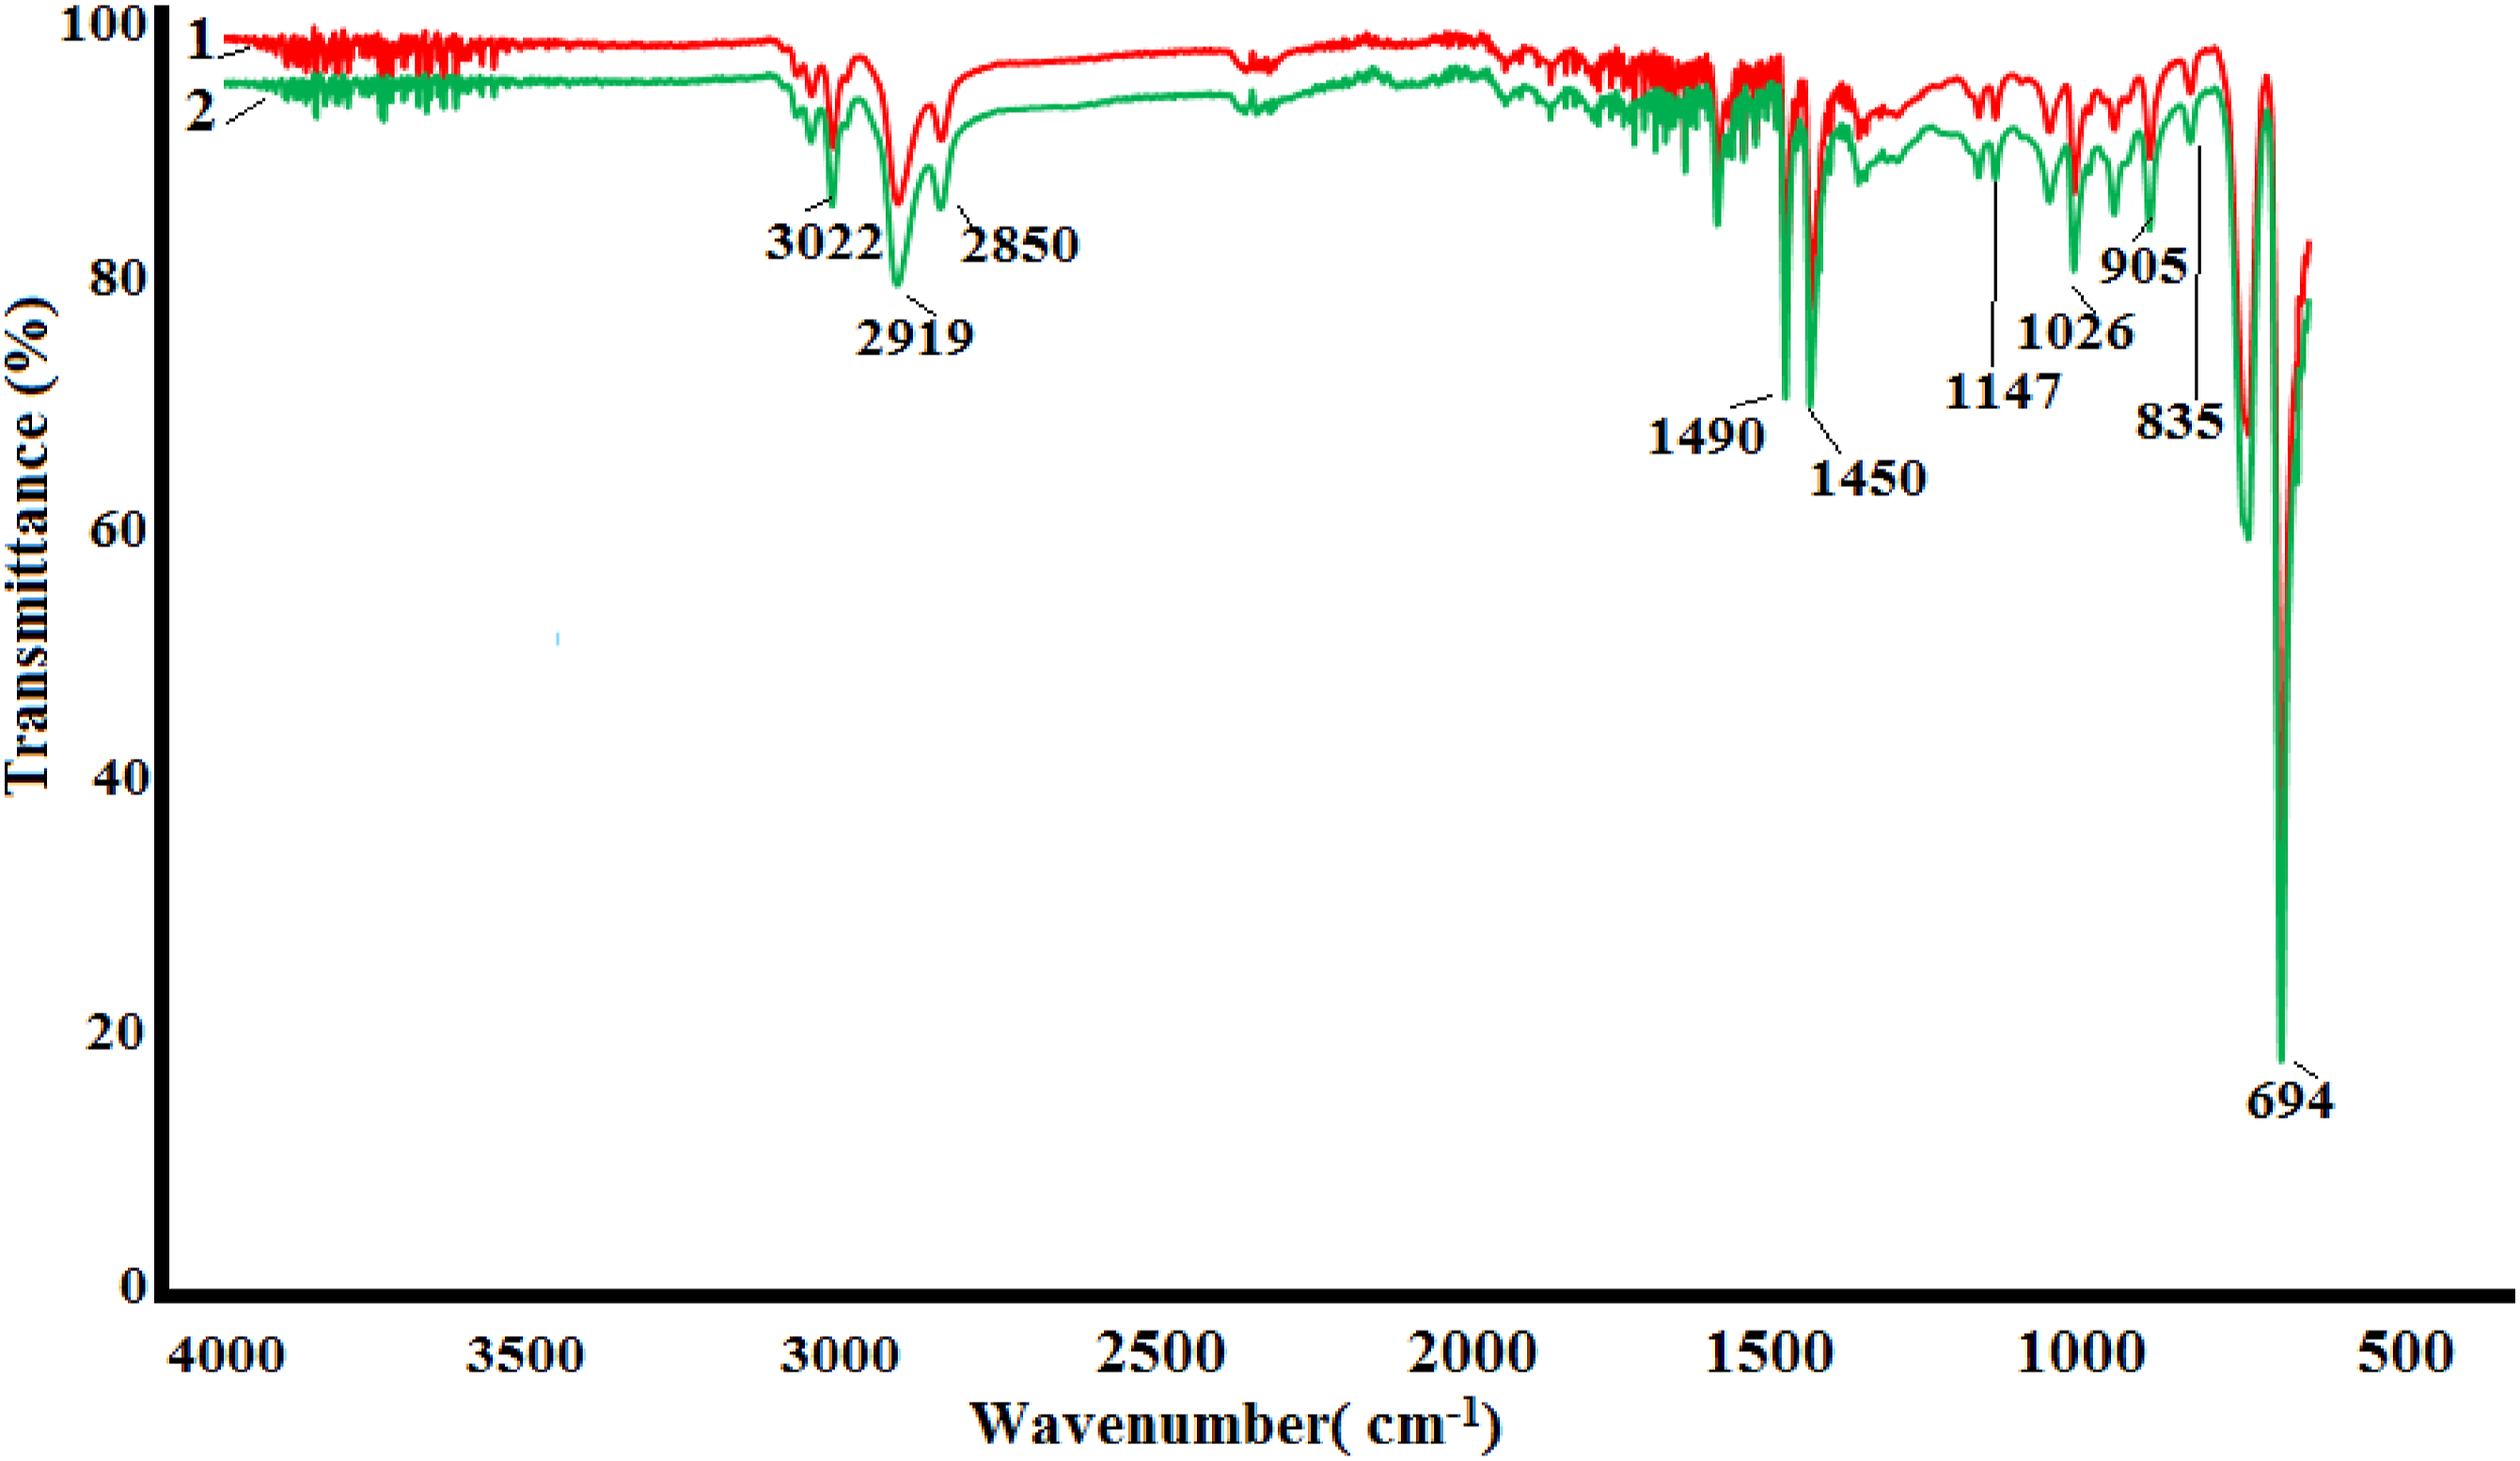
X-ray analysis was used to examine the structure of the pure polymer, synthesized nanocomposite materials, and Si nanoparticles. Figure 3 shows the diffractogram of Pure Si nanoparticles. As can be seen from the figure, the X-ray diffraction of Si nanoparticles is characterized by [111], [220], [311], [400], [331], [422] indexes observed at 28.40°, 47.20°, 56.05°, 69.10° and 76.30° values of 2 theta angle, which corresponds to the polycrystalline structure of Si nanoparticles.
32
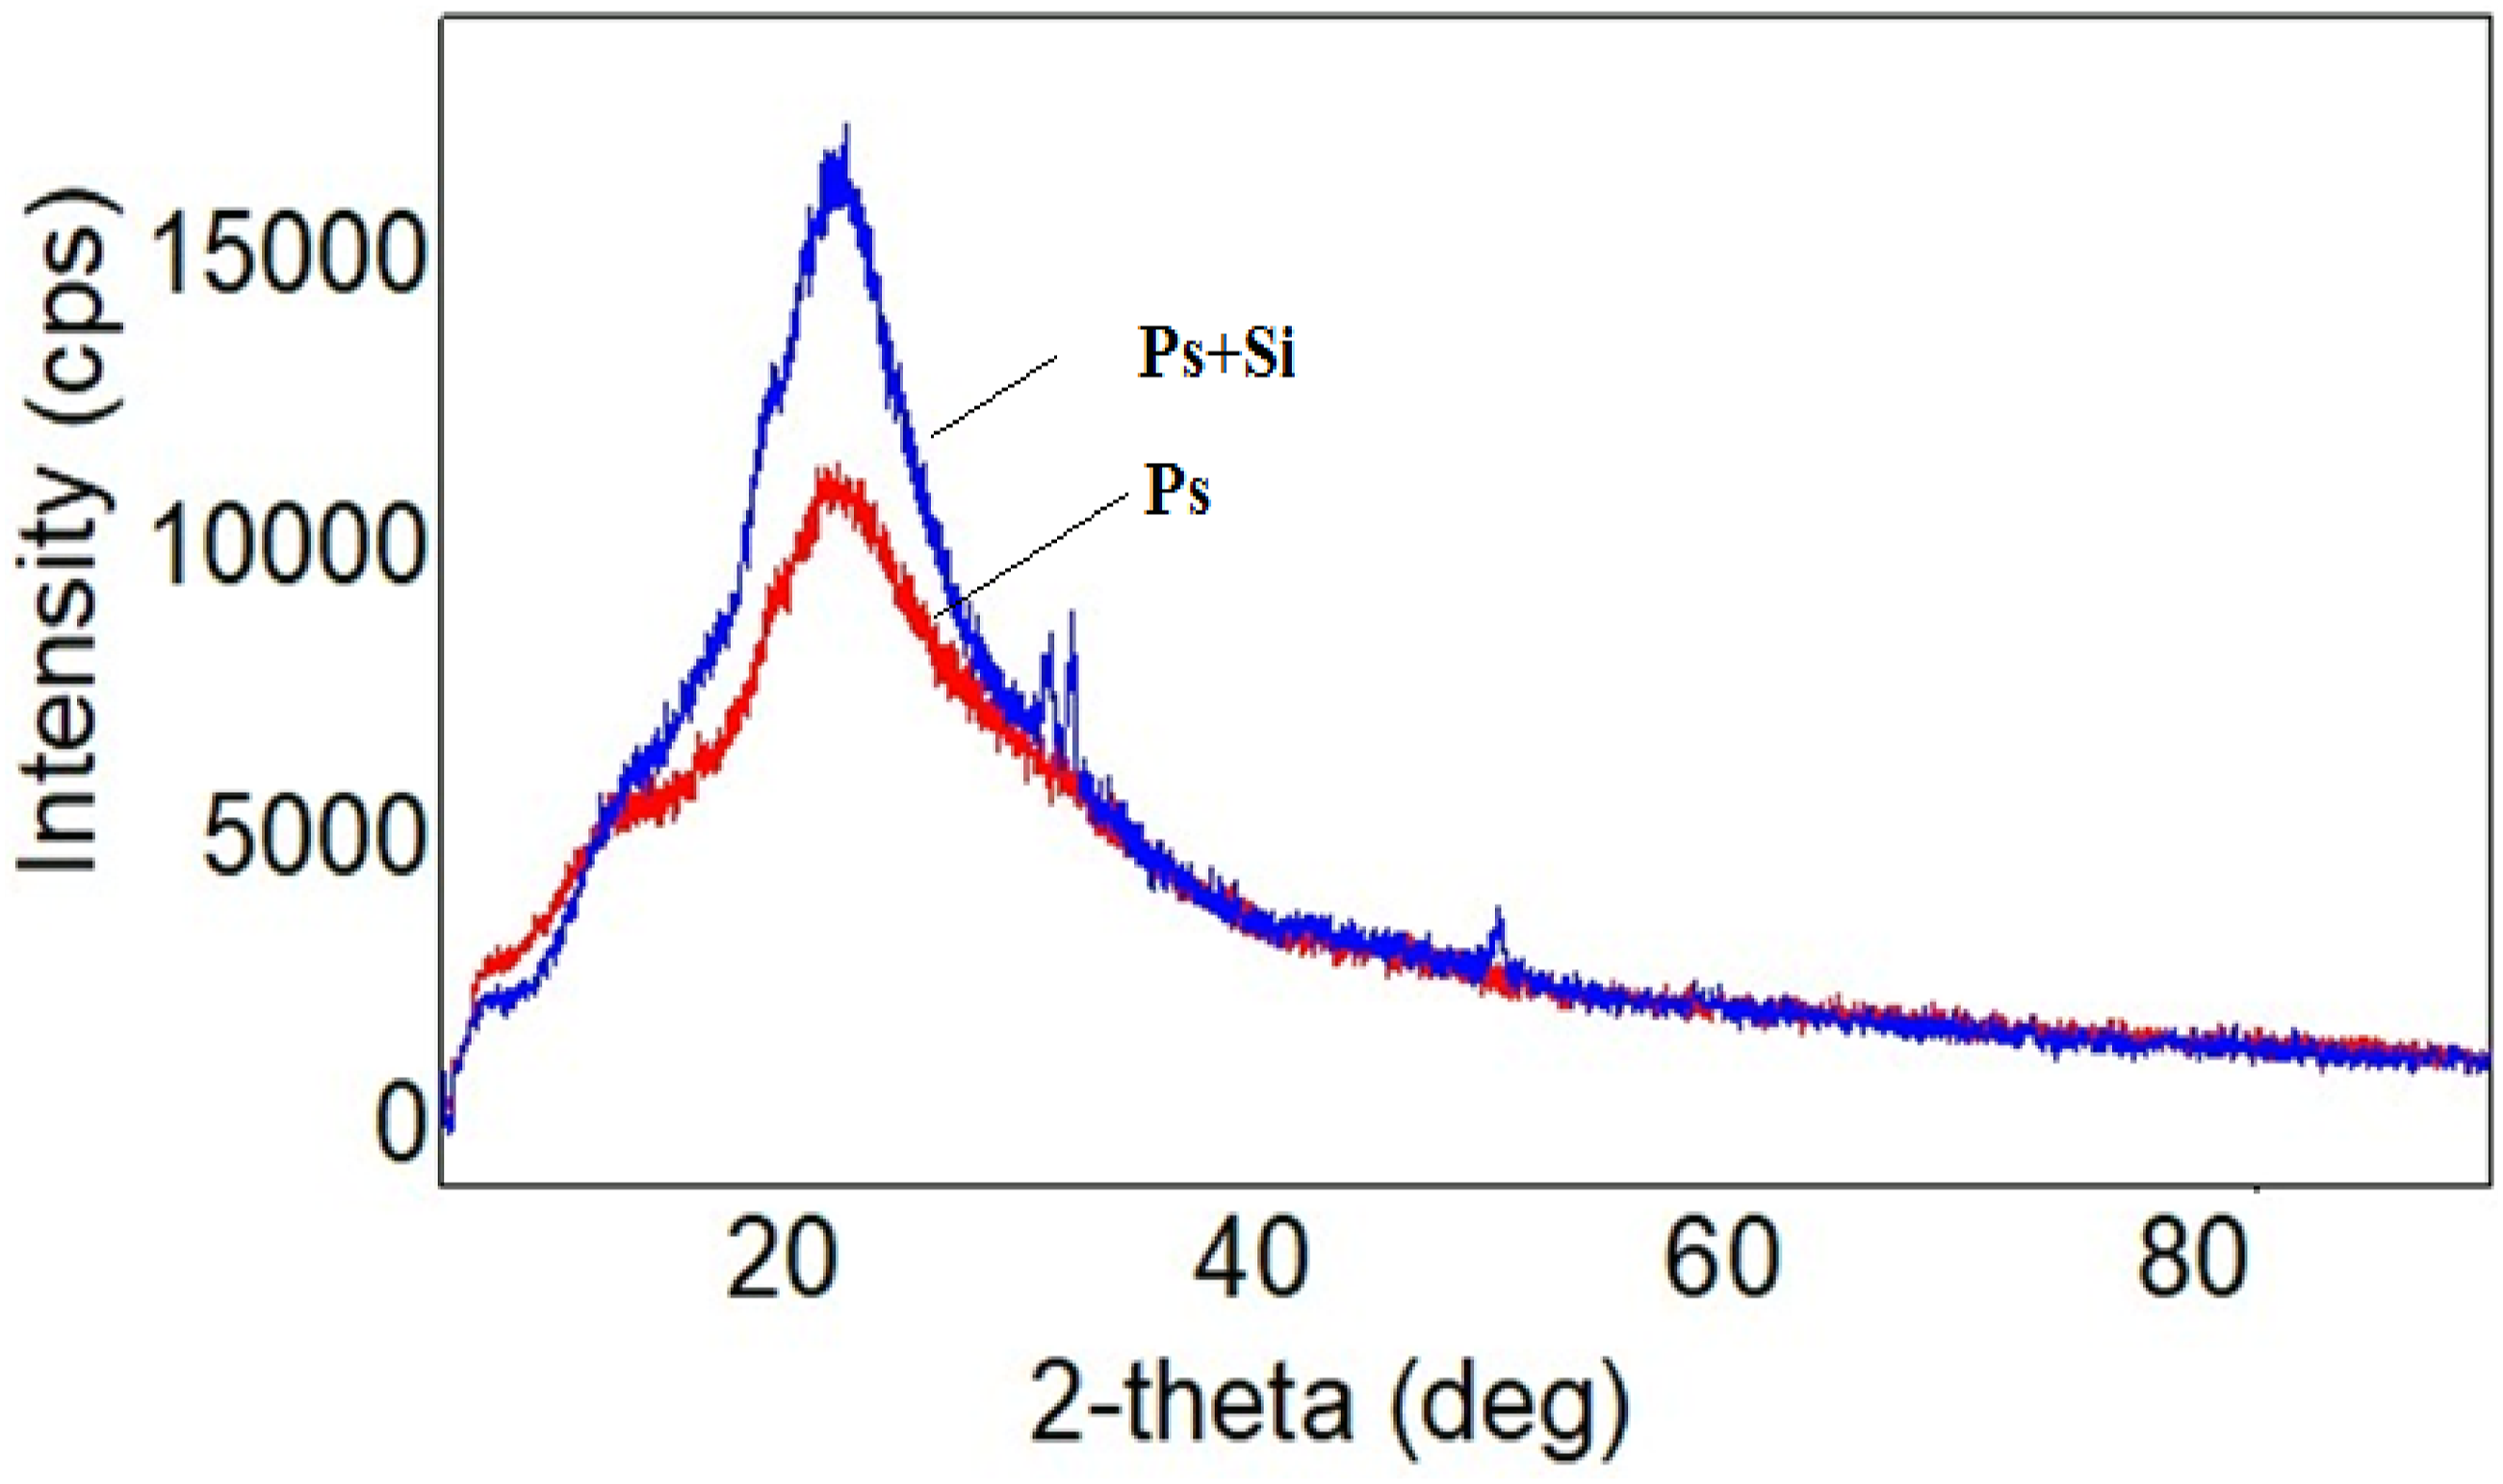
Figure 4 shows the XRD pattern of the pure polystyrene and Ps + Si nanocomposites. X-ray diffraction pattern of polystyrene matrix did not show any sharp and highly intense peaks in the XRD spectrum of polystyrene polymer. The broad-band diffraction patterns at 9.67° and 19.8° values of the 2-theta angle were observed, corresponding to amorphous structure of polystyrene.
33
Obtained nanocomposite based on PS and Si retains the characteristic peaks of both Si and PS.
33
Furthermore, based on the most intense diffraction pattern observed at the 2theta angle of 28.40°, the size of crystallites (nanoparticles) was calculated using the Debye-Scherrer formula: XRD pattern of the Si nanoparticles. XRD pattern of the pspolymer and PS + Si nanocomposite.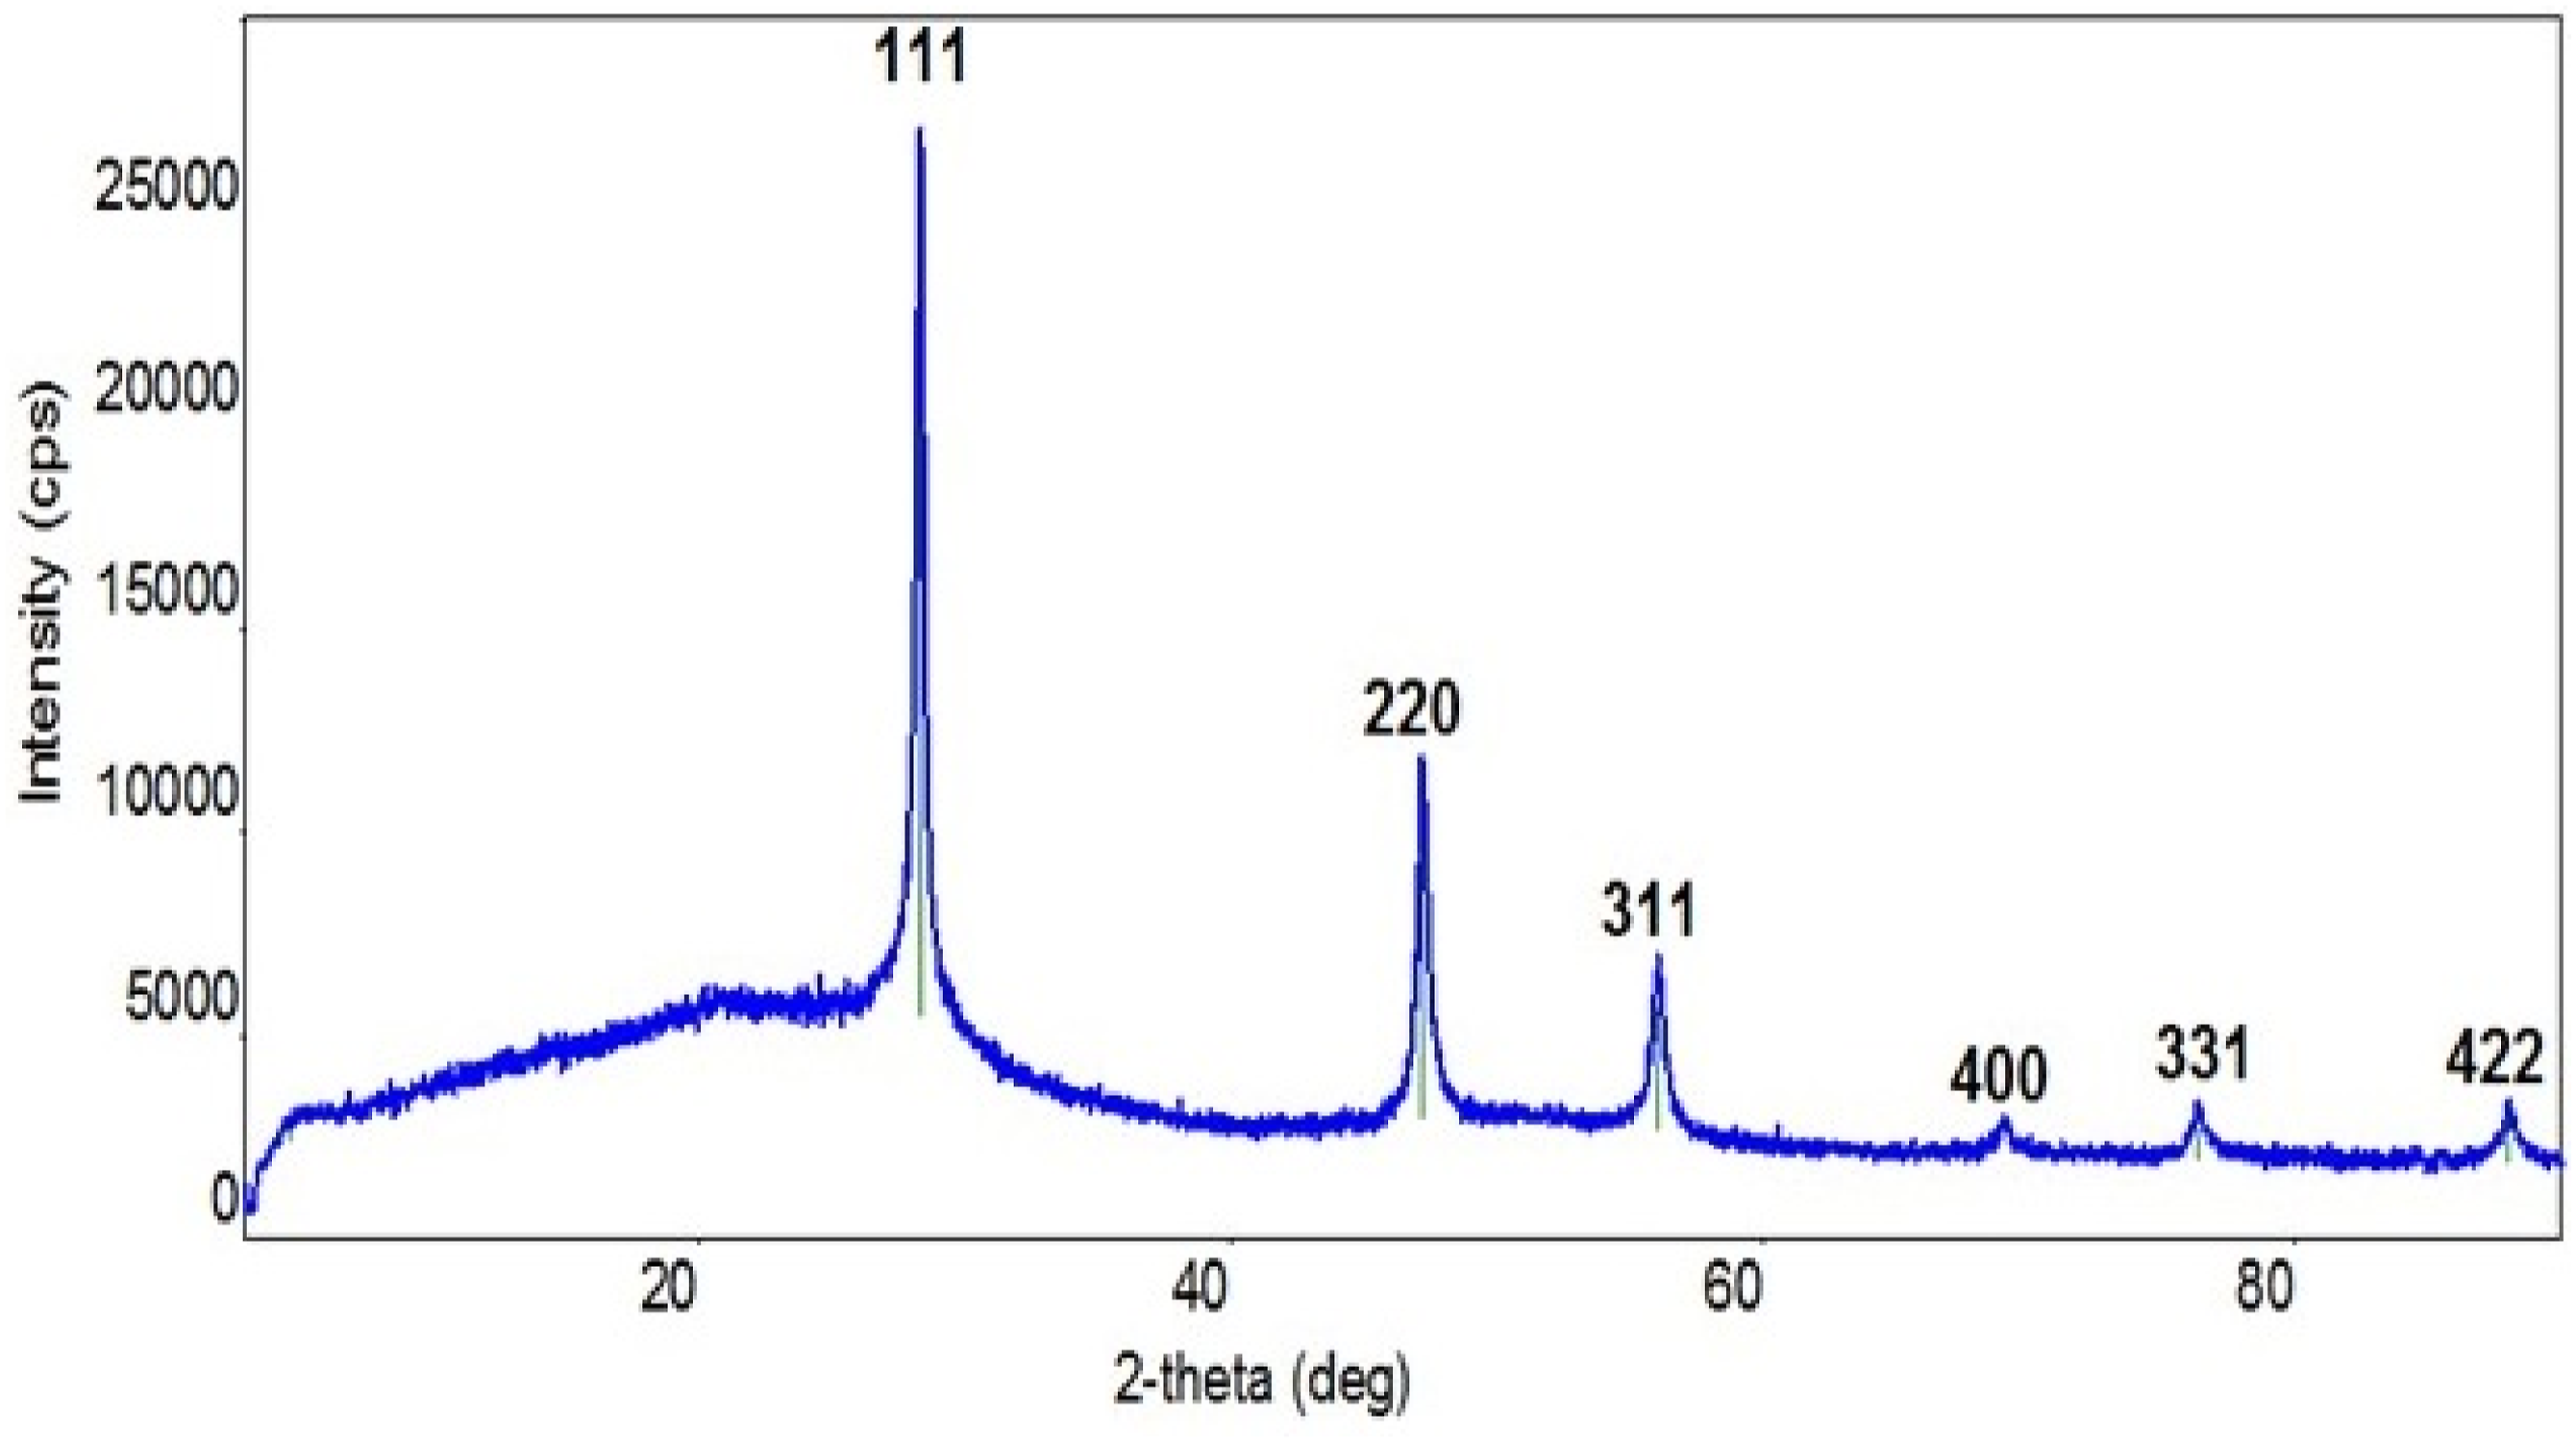
Here - β is the half-width of the height of the maximum corresponding to the [111]. From the calculation, it was found that the average size of Si nanoparticles is approximately 35–50 nm. These results are in agreement with the results obtained from SEM images.
Thermal characterization of PS-based nanocomposites was carried out by TGA, DTA, and DSC methods. The thermal behavior of PS studied in this paper primarily focus on thermal degradation, decomposition temperature, glass transition temperature and heat capacity. TGA analysis shows the dependence of mass loss on temperature. In other words, the TGA study enables interpretation of the substance’s temperature resistance and degradation with rising temperatures.
34
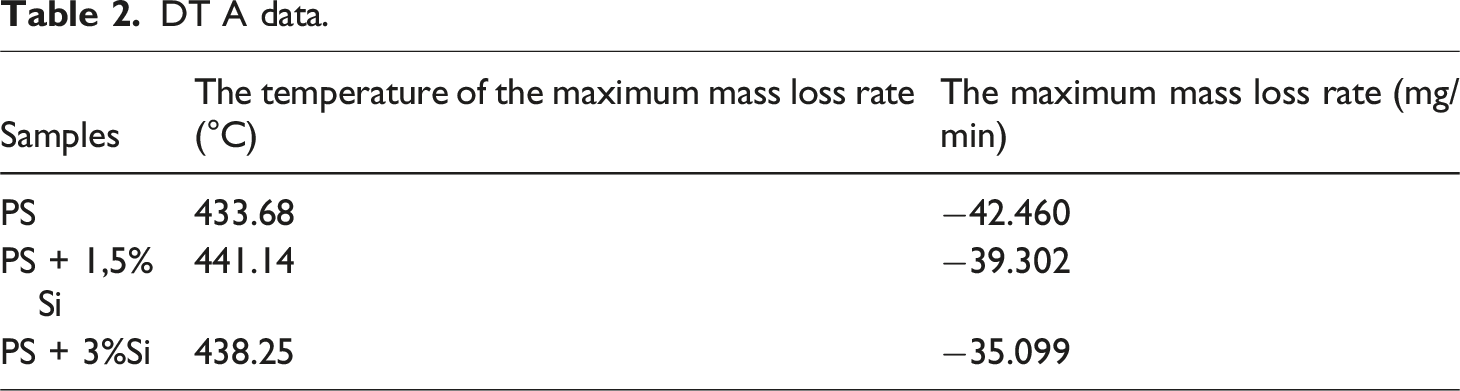
Based on the curve, the temperature range corresponding to the different stages of degradation is marked. TGA and DTA analysis of nanocomposites with different concentrations is given in Figure 5. It is known that the primary destruction components of polystyrene are volatile gases such as methane, acetylene, ethylene, ethane, propylene, benzene, toluene, styrene, etc. Based on the TGA curve, the temperature range corresponding to the different stages of degradation is shown in Table 1. TGA and DTA curves of PS (a) and PS + 1,5%Si (b); PS + 3%Si (c) nanocomposites. TGA data.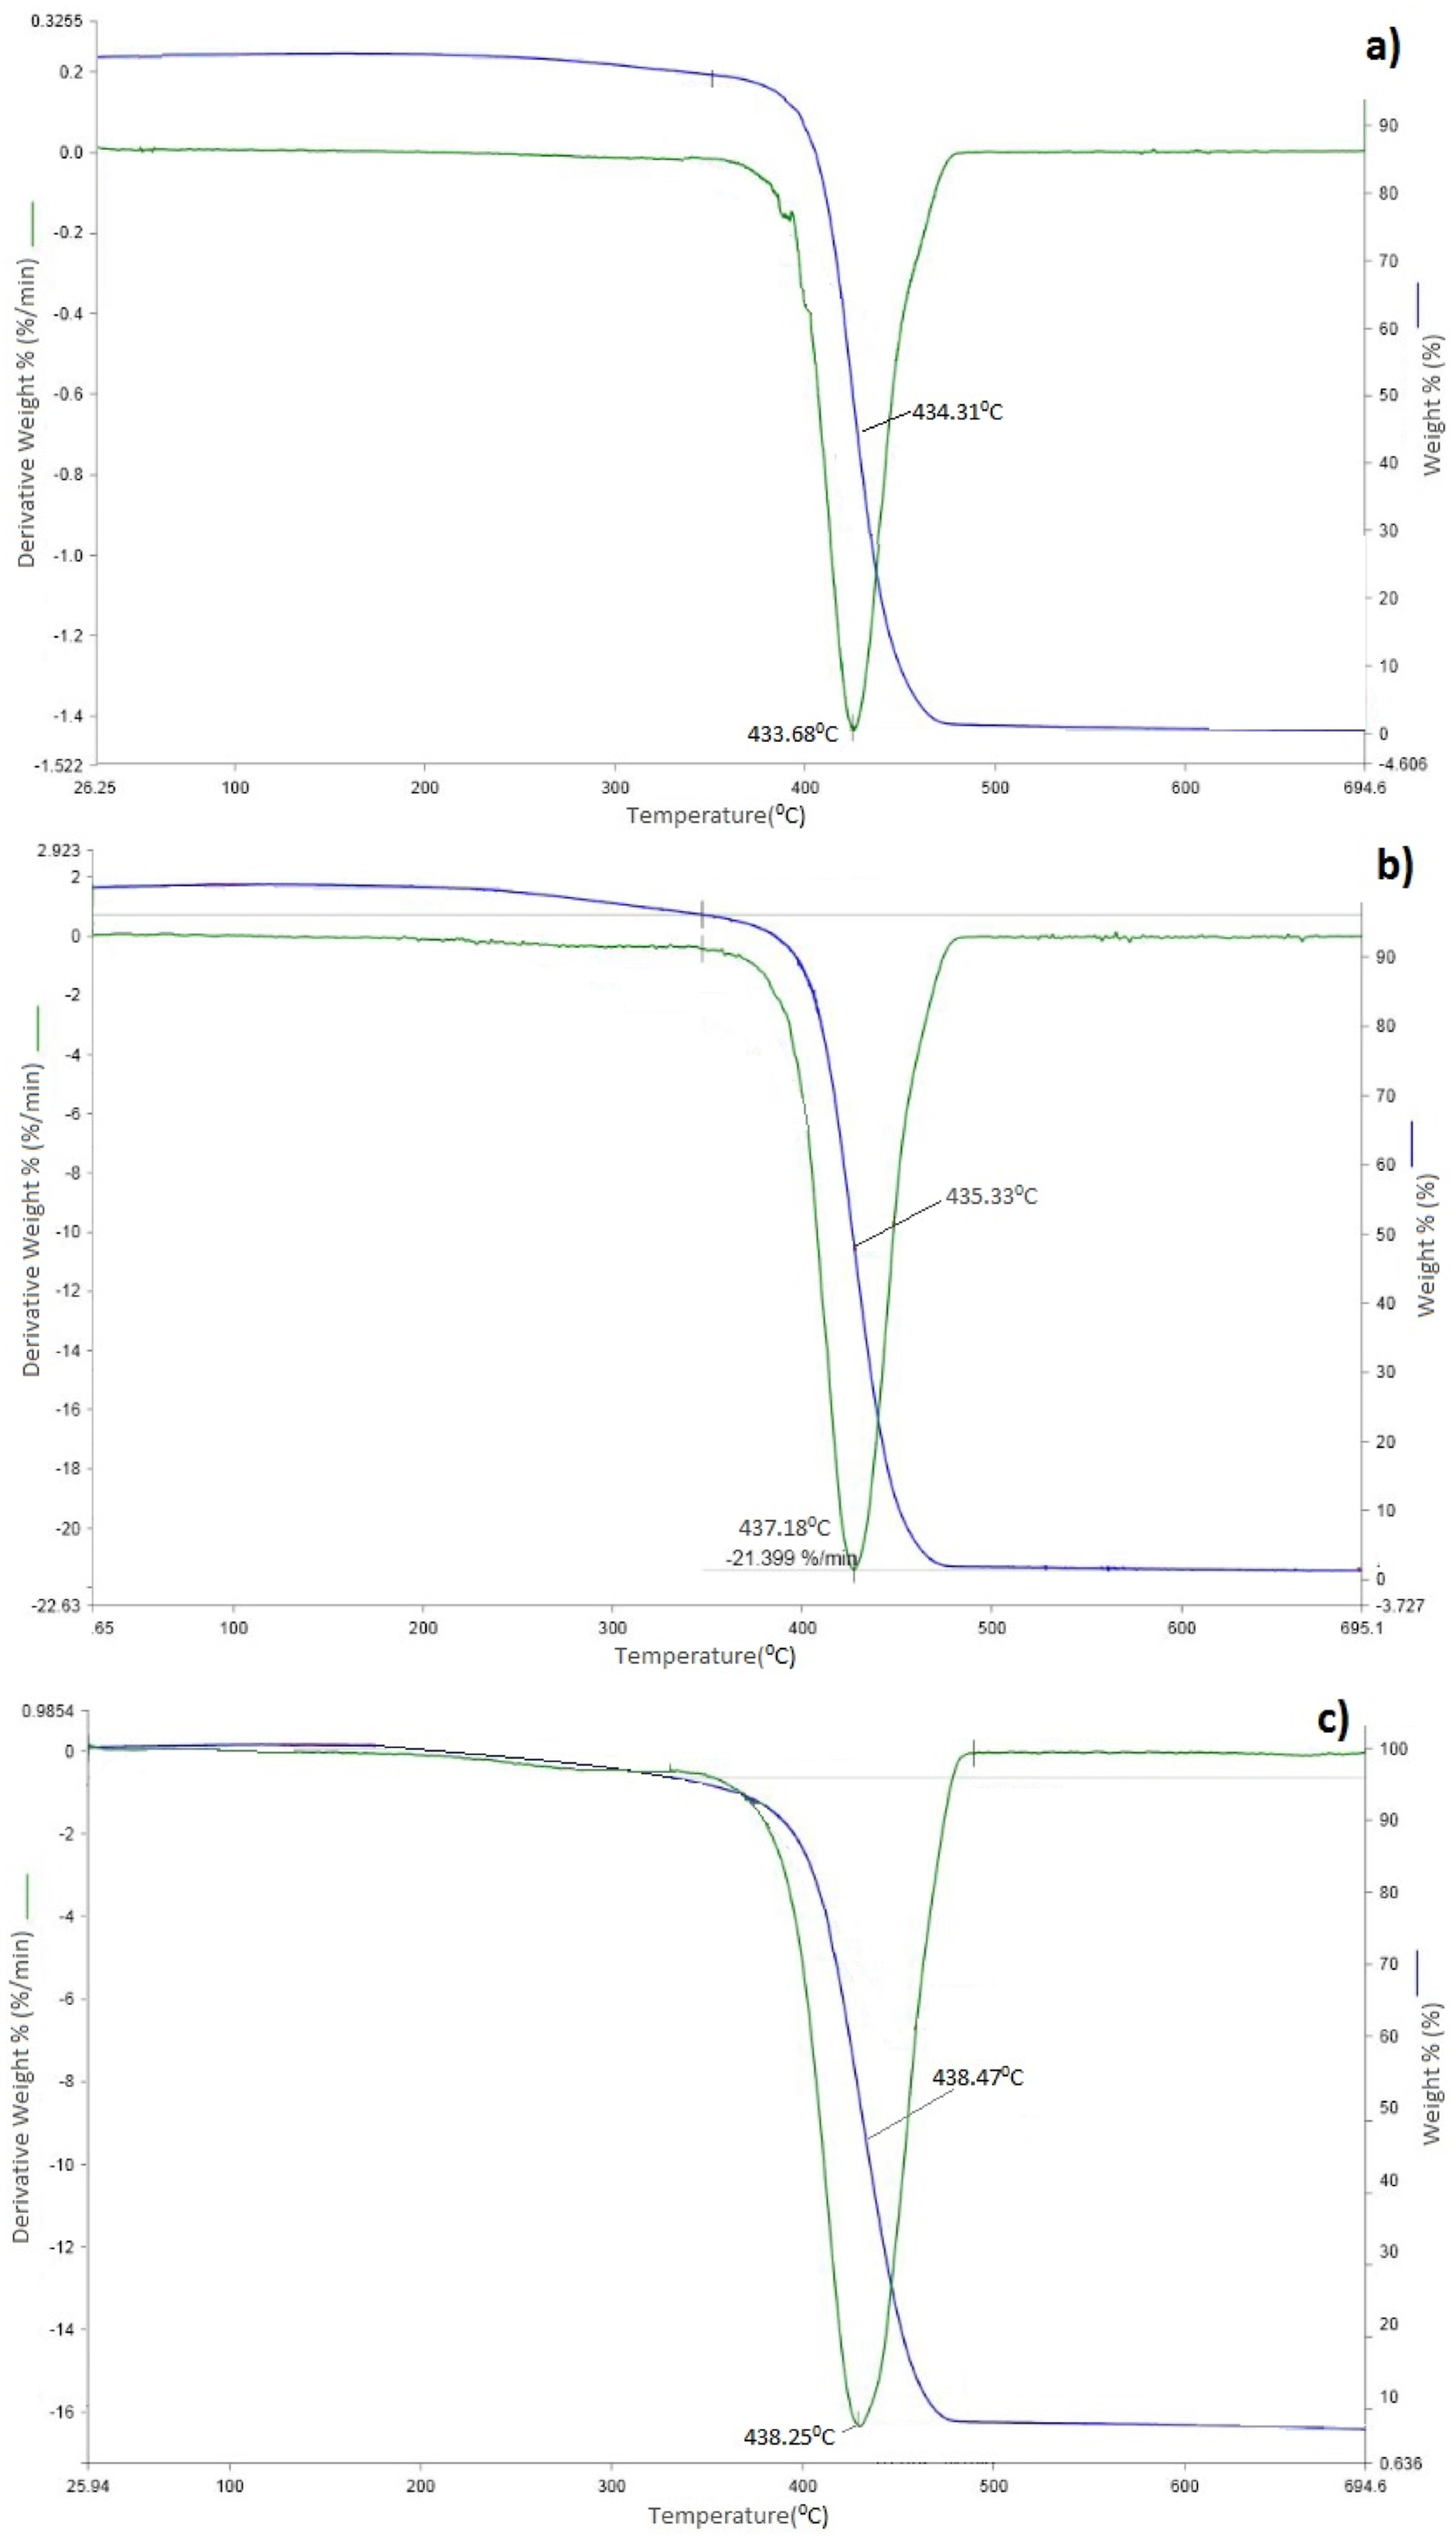
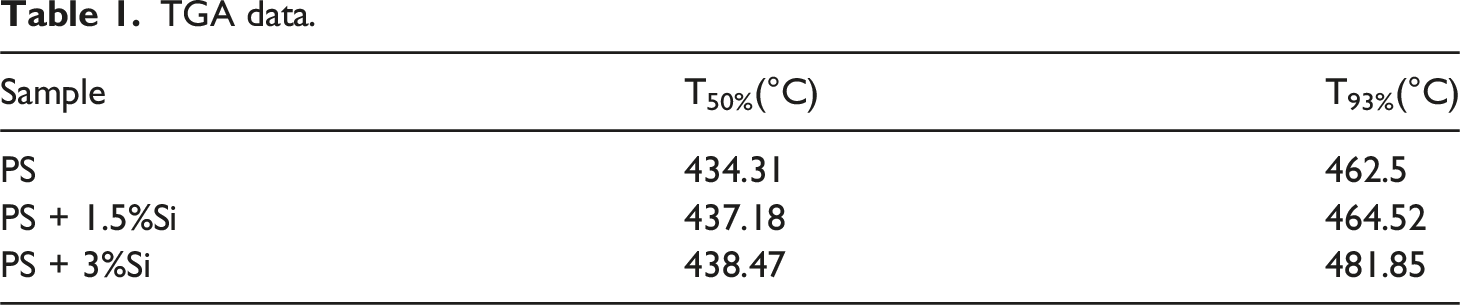
TGA data shows that incorporation of the silicon nanoparticles into the polymer matrix leads to enhancement of the thermal stability of the material. This result confirmed the formation of nanocomposites with high thermal stability. The improvement in the thermal stability of composites by increasing the Si content can be attributed to partially altering the molecular mobility of the polymer chains due to their adsorption on the surface of the filler particles.35–38
DT A data.
One of the methods used to study the thermal behavior of polymer nanocomposites is the differential thermal calorimetric (DSC) method. Figure 6 shows the DSC curves of polymer nanocomposites. Transition peaks for pure polystyrene and polystyrene-base nanocomposites were observed at 90–100°C temperature region. Since amorphous PS doesn’t have a regular structure, it softens progressively at a temperature known as the glass transition temperature, which is between 90 and 100°C.
41
DSC curve of PS (a) and PS + 1,5%Si (b); PS + 3%Si (c) nanocomposites.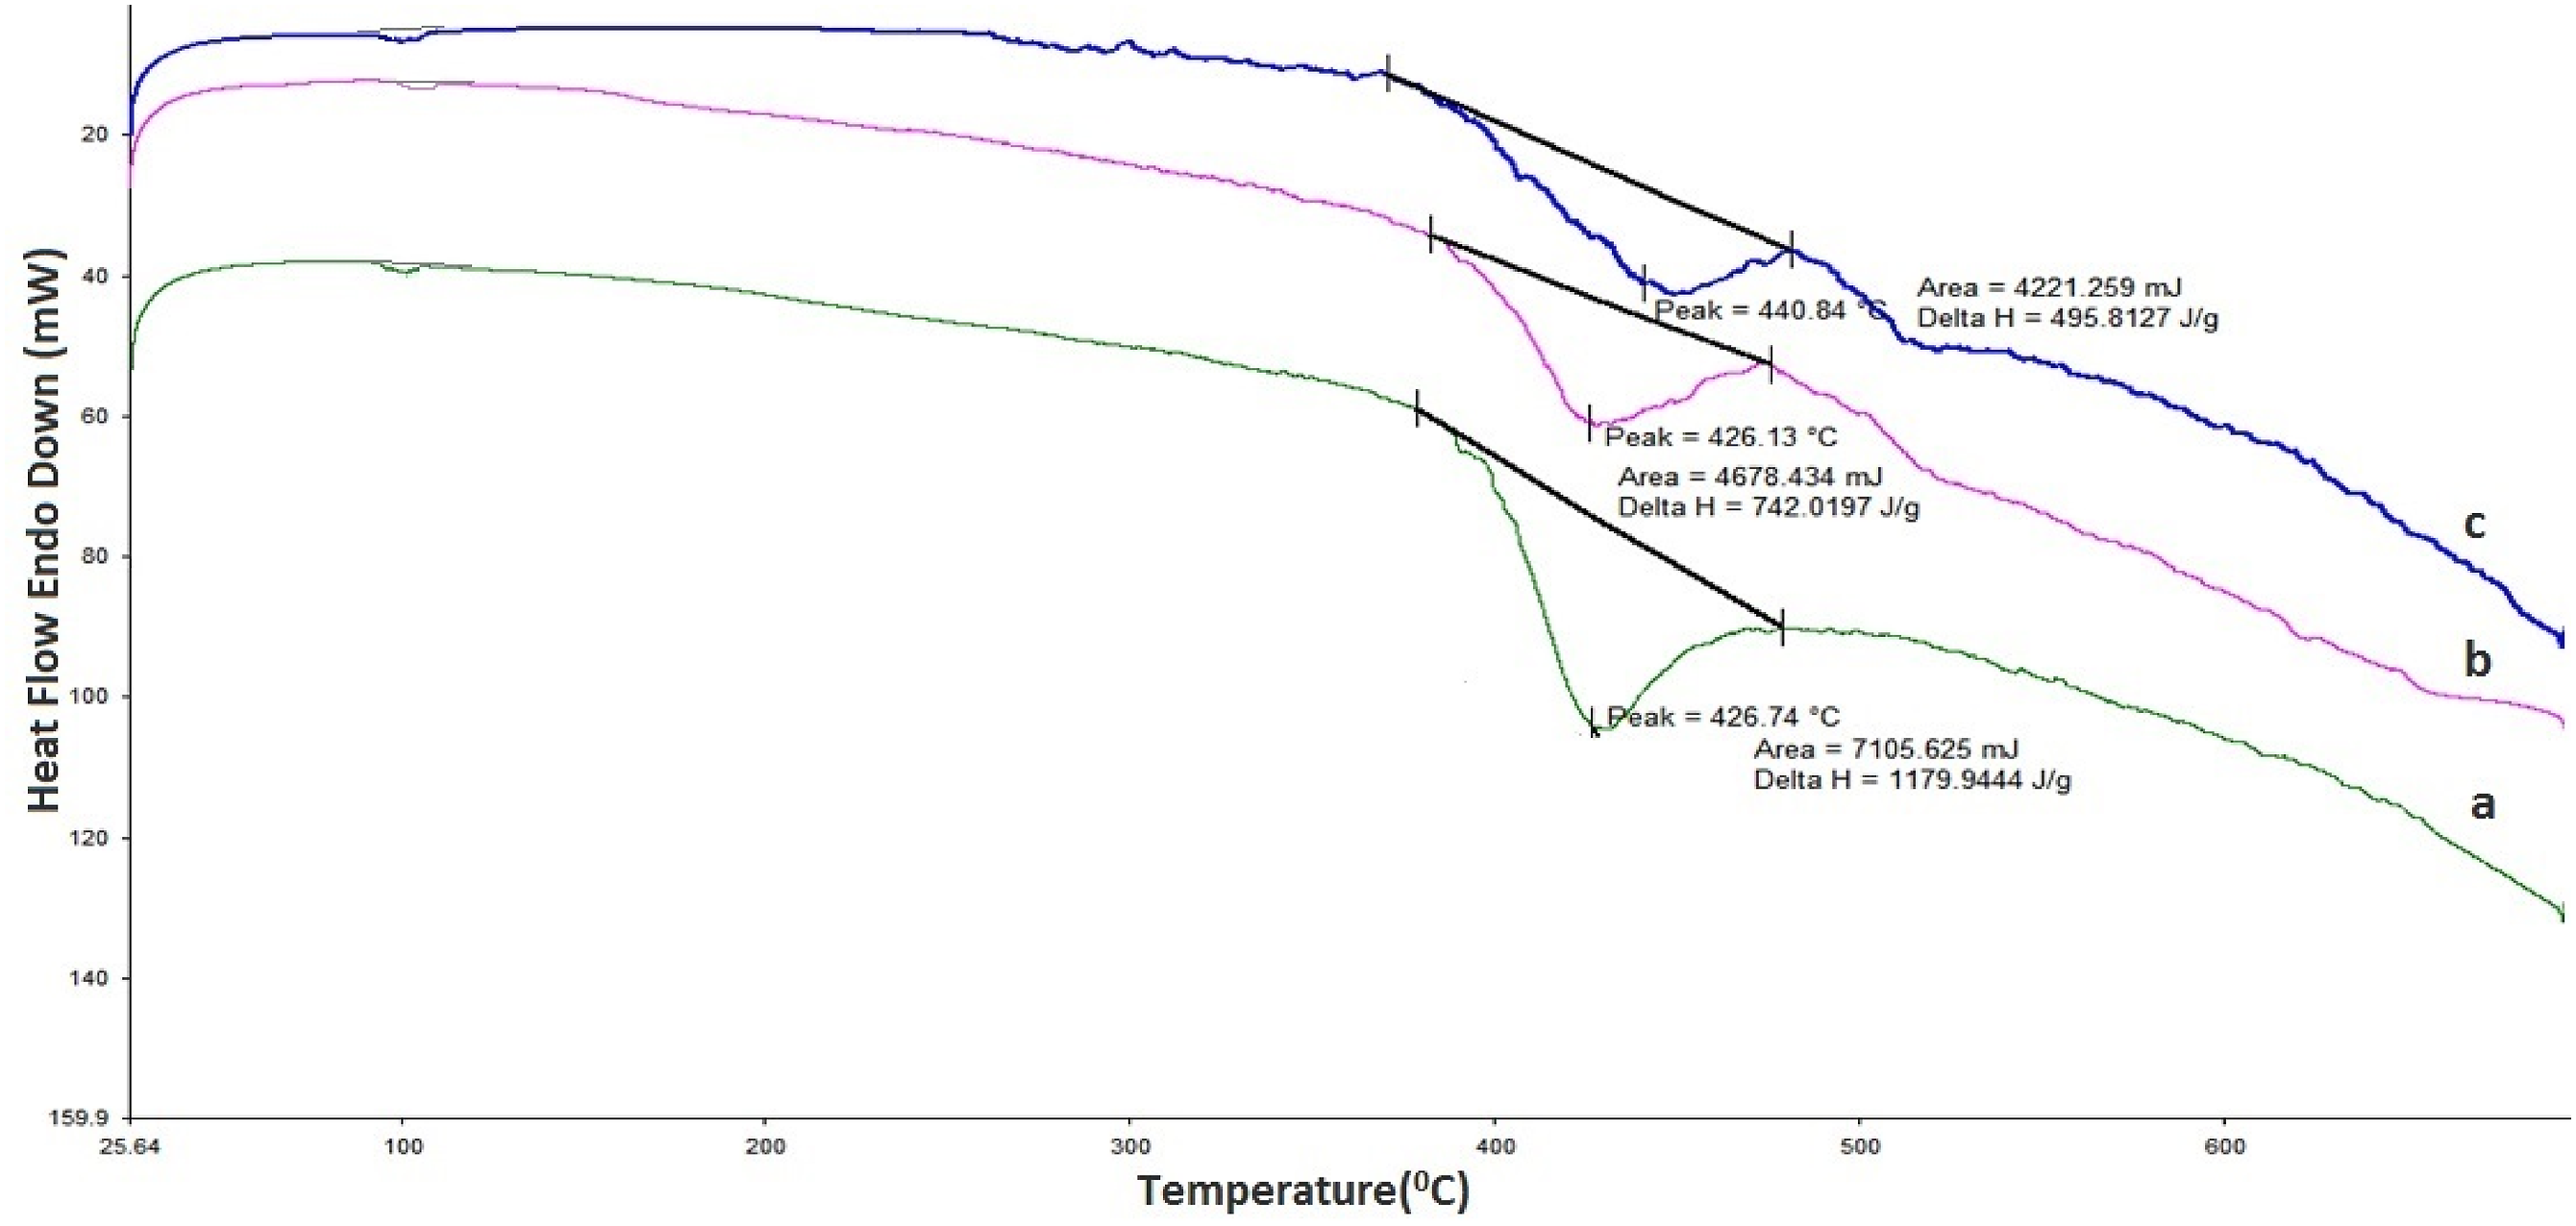
The glass transition temperature represents a free volume that allows polymer molecules to move at low temperatures. The lower glass transition temperature is noted for more free volume that allows molecular mobility. 42 The study shows that when Si nanoparticles are incorporated into polystyrene polymer, there is no noticeable change in its glass transition temperature. Nevertheless, the decomposition temperature of the material shifted to the upper-temperature range. The absence of a significant change in the glass transition temperature of the polymer with the introduction of Si nanoparticles into the polymer suggests that the porous Si does not reduce the free volume for the polymer molecules to move.43–47 However, the macromolecule is adsorbed on the porous surface of silicon, and its mobility is partially limited. Therefore, the glass transition temperature of the polymer nanocomposite does not change, but the thermal decomposition slows down.
Furthermore, an endothermic decomposition peak for pure Ps, PS + 1.5%Si, and PS + 3%Si was observed at 424.74° C, 426.13° C, and 440.84° C. The temperature region (420–440°C), where the endothermic decomposition peak observed for the pure PS and PS + Si nanocomposite is significantly above the PS glass transition temperature. This peak is connected to chemical changes, probably thermal degradation, rather than typical phase transitions. The study demonstrates that the polymer’s decomposition temperature rises when Si nanoparticles are added. The endothermic decomposition peak shifted from 424.74°C (pure PS) to 440.84°C (PS + 3%Si), and the specific heat decreased with the addition of more Si nanoparticles. Apart from the fundamental endothermic peaks, no additional prominent thermal peaks were detected. No other pronounced thermal peaks were observed besides the fundamental endothermic peaks. The endothermic peak could represent the energy required to break down the polymer chains.
Figure 6 also provides information about the specific heat capacity of pure PS and PS + Si nanocomposite. It is clear from the figure that the thermal heat capacity of pure Ps, PS + 1.5%Si, and PS + 3%Si is 1179.9 J/g, 742 J/g, and 495.8 J/g, respectively. The Si nanoparticles interact with the polymer chains, potentially restricting their movement near the nanoparticle’s surface.48,49 The decrease in mobility can be attributed to the following: the polymer chain contributes less to the overall heat capacity when it transitions from a solid to a liquid state; the rise in entropy is less significant; and the thermal heat capacity is decreased by an increase in the content of Si nanoparticles.
All these experimental results increase the potential for practical use of the obtained nanocomposite. The material, which is easily flexible and resistant to decomposition even at relatively high temperatures compared to pure polymer, can act as a valuable construction material. At the same time, taking into account that polystyrene is also used in the food industry and Si, which acts as a nanofiller, is a biologically compatible and non-toxic particle, the nanocomposite based on these two components can be used in food packaging due to its high thermal behavior.
Conclusion
The production, structure, and thermal behavior of polymer nanocomposites based on polycrystalline Si and polystyrene were studied. Ps + Si nanocomposites with different filler concentrations were obtained through the solution casting method. The morphology of the nanocomposite was studied using a scanning electron microscope. Si nanoparticles are distributed in the form of clusters in the polymer matrix. The spherical particles are up to 50 nm in size. X-ray diffraction investigation also demonstrates consistency with SEM results. PS + Si nanocomposite thermal behavior were investigated with the help of TGA, DTA, and DSC methods. TGA data shows that incorporation of the silicon nanoparticles into the polymer matrix leads to enhancement of the thermal degradation temperature of PS. Specifically, adding 3% Si nanoparticles increased the degradation temperature by 20°C compared to pure PS. The decomposition rate also decreased from −42.460 mg/min (pure PS) to −35.099 mg/min (PS + 3%Si), indicating that the filler slows down the degradation process. DSC analysis shows that the glass transition temperature of the pure PS does not change by incorporation of the Si nanoparticles, which can be explained by the fact that the porous Si does not reduce the free volume for the PS polymer molecules to move. The PS macromolecule adsorbed on the porous surface of silicon and its mobility is limited partially. The decrease in mobility can be attributed to the following: the polymer chain contributes less to the overall heat capacity when it transitions from a solid to a liquid state; the rise in entropy is less significant; and the thermal heat capacity is decreased by an increase in the content of Si nanoparticles.
Footnotes
Declaration of conflicting interests
The author(s) declared no potential conflicts of interest with respect to the research, authorship, and/or publication of this article.
Funding
The author(s) received no financial support for the research, authorship, and/or publication of this article.