
Abstract
Most experimental and numerical studies are limited to examining the effect of strain rate on the compressive and tensile yield behavior of Acrylonitrile-Butadiene-Styrene (ABS), an amorphous material of significant industrial relevance, rather than its shear yield behavior; therefore, this study is dedicated to addressing this notable gap in the literature by exploring the effect of strain rate on the shear yield behavior of ABS. To this end, shear tests were carried out using the Wyoming version of the Iosipescu (V-notched) shear test fixture at five distinct loading rates, ranging from 5 × 10⁻³ to 1 × 101 mm/s, which correspond to strain rates between 5.5 × 10⁻⁴ s−1 and 7 × 10⁻¹ s−1. Shear strain distributions in the specimens were measured using the Digital Image Correlation (DIC) technique. The shear test results not only revealed a substantial increase in the shear yield strength of ABS with increasing strain rate, but also demonstrated that the shear yield strength of ABS is more sensitive to strain rate than its compressive and tensile yield strengths. The findings of the study also suggested that using shear-tension test data pairs at the same strain rates is more effective for determining the hydrostatic pressure sensitivity parameter than using tension-compression and shear-compression test data pairs. The experimental results were validated against numerical predictions obtained through finite element analyses employing an elastic-viscoplastic constitutive model, which comprehensively accounted for non-linear material properties, geometric complexities, and non-linearities arising from boundary contacts.
Keywords
Introduction
Acrylonitrile-Butadiene-Styrene (ABS) is an important amorphous thermoplastic widely used in structural applications due to its excellent material properties, including high rigidity, high stiffness, good toughness, and exceptional impact resistance, even at low temperatures.1–6 Specifically, the exceptional impact resistance of ABS significantly enhances its suitability for deployment in designated applications where high impact resistance is compulsory.7–9 Thus, in order to mitigate the risk of head injuries resulting from impact events, sports-related protective headgears are typically made of ABS.10–14 However, akin to other amorphous polymers, the mechanical response of ABS to loads is notably intricate, implying the necessity for a thorough understanding of this complexity to ensure reliable design. The intricate mechanical behavior of ABS primarily arises from its material properties being contingent upon strain rate and hydrostatic pressure, as well as exhibiting strain-softening behavior under both tensile and compressive loading conditions.1–5,8,9,15 Moreover, the initiation and propagation of damage in ABS are governed by intricate mechanisms including cavitation, crazing, micro-void formation, shear yielding, breaking of molecular bonds, and chain rupture, thereby amplifying the complexity involved in comprehending its material behavior.16,17
Investigating the factors that influence the material properties and damage mechanisms of ABS is a critical area of research, with numerous studies dedicated to understanding these phenomena.5,8,15,18–23 Among these factors, the effect of strain rate on the mechanical properties of ABS has particularly intrigued the academic community, leading to numerous studies in this area. However, the majority of this research has focused on examining the impact of strain rate on the tensile and compressive yield behaviors of ABS.1–5,9,15,18,20,24 Studies examining the tensile yield behavior of ABS over a wide range of strain rates, from low to medium (104 s−1),1,4,5,9,15,18,24 and analyses of the compressive yield behavior over a broader range, from low to very high (11,500 s−1), have shown that both the tensile and compressive yield strengths of ABS increase with increasing strain rate.2,3,15,18,20,25 Nevertheless, one key study among them notably reported a significant rise in the compressive yield strength of ABS up to a strain rate of 1200 s−1, with further substantial increases beyond this rate. 20 This observation has also been supported by another noteworthy study, signifying that the compressive yield strength of ABS is more sensitive to strain rate than its tensile yield strength. 18 The greater sensitivity of the compressive yield strength of ABS to strain rate is attributed to differences in chain mobility and alignment under tension and compression, akin to other amorphous polymers.24,26,27 Beyond strain rate sensitivities, comparative studies assessing the tensile and compressive stress-strain curves of ABS at identical strain rates have clearly demonstrated that the compressive yield strength of ABS is considerably higher than its tensile yield strength, suggesting that the yield behavior of ABS is hydrostatic pressure dependent.1,2,4 Moreover, research has proposed that tensile and compression tests can provide a useful estimate of shear strength. 28 Specifically, the Tresca criterion, which assumes shear strength is about half of compressive strength, has been suggested as a viable method for this estimation. 28 However, the ratio of compressive yield strength to shear yield strength has been reported to vary from 1.5 to 2.4, depending on the particular polymeric material. 28 Valuable studies have emphasized the importance of prioritizing the distinct yield behaviors of ABS under tension, compression, and shear over its differing strain rate sensitivities between tension and compression in simulations involving three-point bending and impact tests, where tensile, compressive, and shear stresses co-occur, to ensure calculation.1,2,4,5,8,15,29 The hydrostatic pressure sensitivity parameter (α), which characterizes the dissimilar yield behaviors of materials under tension, compression and shear, can be ascertained by applying varying levels of pressure to materials at a constant strain rate, regardless of the type of mechanical test, or by performing uniaxial tension, uniaxial compression, and shear tests separately at the same strain rate.30–32 Investigations employing either tension-compression or shear-tension stress pairs at identical strain rates to determine the parameter α have reported varying values, ranging from 0.2 to 0.58.1,4,15 These discrepancies are noteworthy and are attributed not only to the selection of different stress pairs for calculations but also to plastic strains at which stresses are chosen in the same stress pairs.1,4 In addition to the previously mentioned findings, the aforementioned studies have also underscored the pronounced non-linearity of the tensile and compressive stress-strain curves of ABS, characterized by initial hardening, followed by strain softening, and subsequent hardening.1–5,9,18,20,24 In the context of finite element analysis, the highly non-linear characteristics of the tensile and compressive stress-strain curves of ABS at various strain rates have been reproduced with varying levels of success using the DSGZ (Duan-Saigal-Greif-Zimmerman)8,15 and Anand-Gurtin1,33 models, both of which account for the distinct material behaviors in tension and compression as well as strain rate dependency.
The literature review above clearly demonstrates that a substantial number of rigorous experimental studies have investigated the influence of strain rate on the tensile and compressive yield behaviors of ABS, and a sufficient number of numerical studies have focused on predicting its tensile and compressive yield characteristics as well as reproducing its highly non-linear stress-strain curve features Despite extensive research into the strain rate-dependent yield behavior of ABS under tension and compression, there is a notable deficiency in research specifically examining the strain rate dependence of shear yield behavior of ABS, with most existing studies predominantly limited to quasi-static loading conditions. For instance, results from the study have signified that, although the yield behavior of ABS under shear at a low constant strain rate (4 × 10⁻³ s−1) differs from its tensile and compressive yield behaviors, with the shear yield strength being much lower than both, the shear stress-strain curve remains highly non-linear, exhibiting initial hardening, strain softening, and subsequent hardening, similar to its tensile and compressive counterparts. 4 Nevertheless, emphasis has been placed on the observation that the strain softening behavior exhibited by ABS under shear stress is less pronounced than that under tensile and compressive stresses. 4 This observed strain softening behavior has been linked to the formation of a shear band.4,34,35 The similar observations have also been reported by various studies.2,9 Shear tests conducted on two different amorphous polymers, polycarbonate (PC) and polymethyl methacrylate (PMMA), rather than ABS, over a strain rate range from 500 s−1 to 2200 s−1 demonstrated that strain rate exerts only a modest influence on their upper yield limit. 34 Furthermore, these results highlighted that yielding in amorphous polymeres, like ABS occurs through a thermally activated process.34,35
Current research highlights a significant gap in studies exploring the impact of strain rate on the shear strength of ABS. Addressing this gap, the present study investigates the effect of strain rate on the shear yield of ABS and determines the hydrostatic pressure sensitivity parameter using shear test data alongside other stress state data, including tension and compression. Motivated by the need for precise data on shear yield stress versus strain rate for ABS, this research aims to offer a comprehensive understanding of ABS’s mechanical response to shear loads at various strain rates through the application of an elastic-viscoplastic material model in numerical simulations. The novelty of this study lies in its focus on bridging this critical gap in the literature and providing new insights into the shear behavior of ABS.
Materials and methods
Material
ABS is an amorphous polymer composed of three monomers: acrylonitrile, butadiene, and styrene.3,9,36 Acrylonitrile enhances chemical resistance and thermal stability, butadiene imparts toughness and impact resistance, and styrene provides rigidity and ease of processing.2,9 This unique combination endows ABS with excellent mechanical properties and versatility, making it a preferred material in various manufacturing processes.23,24,29,36 The polymer used in this study was Cycolac EX58 ABS, manufactured by Sabic and distributed by K-Mac Plastics. 36 This material possesses a density of 1.03 g/cm³, a melting temperature range of 215 °C–230°C, and a melt flow rate (MFR) of 4 g/10 min. 36 The composition of Cycolac EX58 includes styrene (65%–70%), butadiene (20%–25%), and acrylonitrile (10%–15%). 36 The molecular weights of the styrene, butadiene, and acrylonitrile monomers are 104.15 g/mol, 54.09 g/mol, and 53.03 g/mol, respectively. 36 Hence, ABS plates with a thickness of 3.2 mm were sourced from K-Mac Plastics.
Experimental characterization
Iosipescu (V-notched) shear test method
Various testing methodologies, such as the Iosipescu (V-notched) shear test37–41 the two-rail shear test,
42
the short beam shear test,
43
and the +45° tensile shear test,
44
are commonly employed for assessing the shear properties of composite materials. Numerous researchers have compared the efficacy of these methods, documenting their findings in the literature.45–47 Among these methods, the Iosipescu shear test has garnered significant attention from researchers for evaluating the shear properties of both composite materials and neat polymers due to its simplicity, cost-effectiveness, and accuracy.3,28,38–40,48–56 Wyoming version of the Iosipescu (V-notched) shear test fixture used in the relevant tests is illustrated in Figure 1. As shown in Figure 1, the Iosipescu shear test involves the placement of a V-notched test specimen on both sides of the Iosipescu test fixture. As one side of the fixture experiences vertical displacement, the other side remains fixed, and opposing force couples are employed to counteract in-plane bending of the specimen.
38
Wyoming version of the Iosipescu (V-notched) shear test fixture.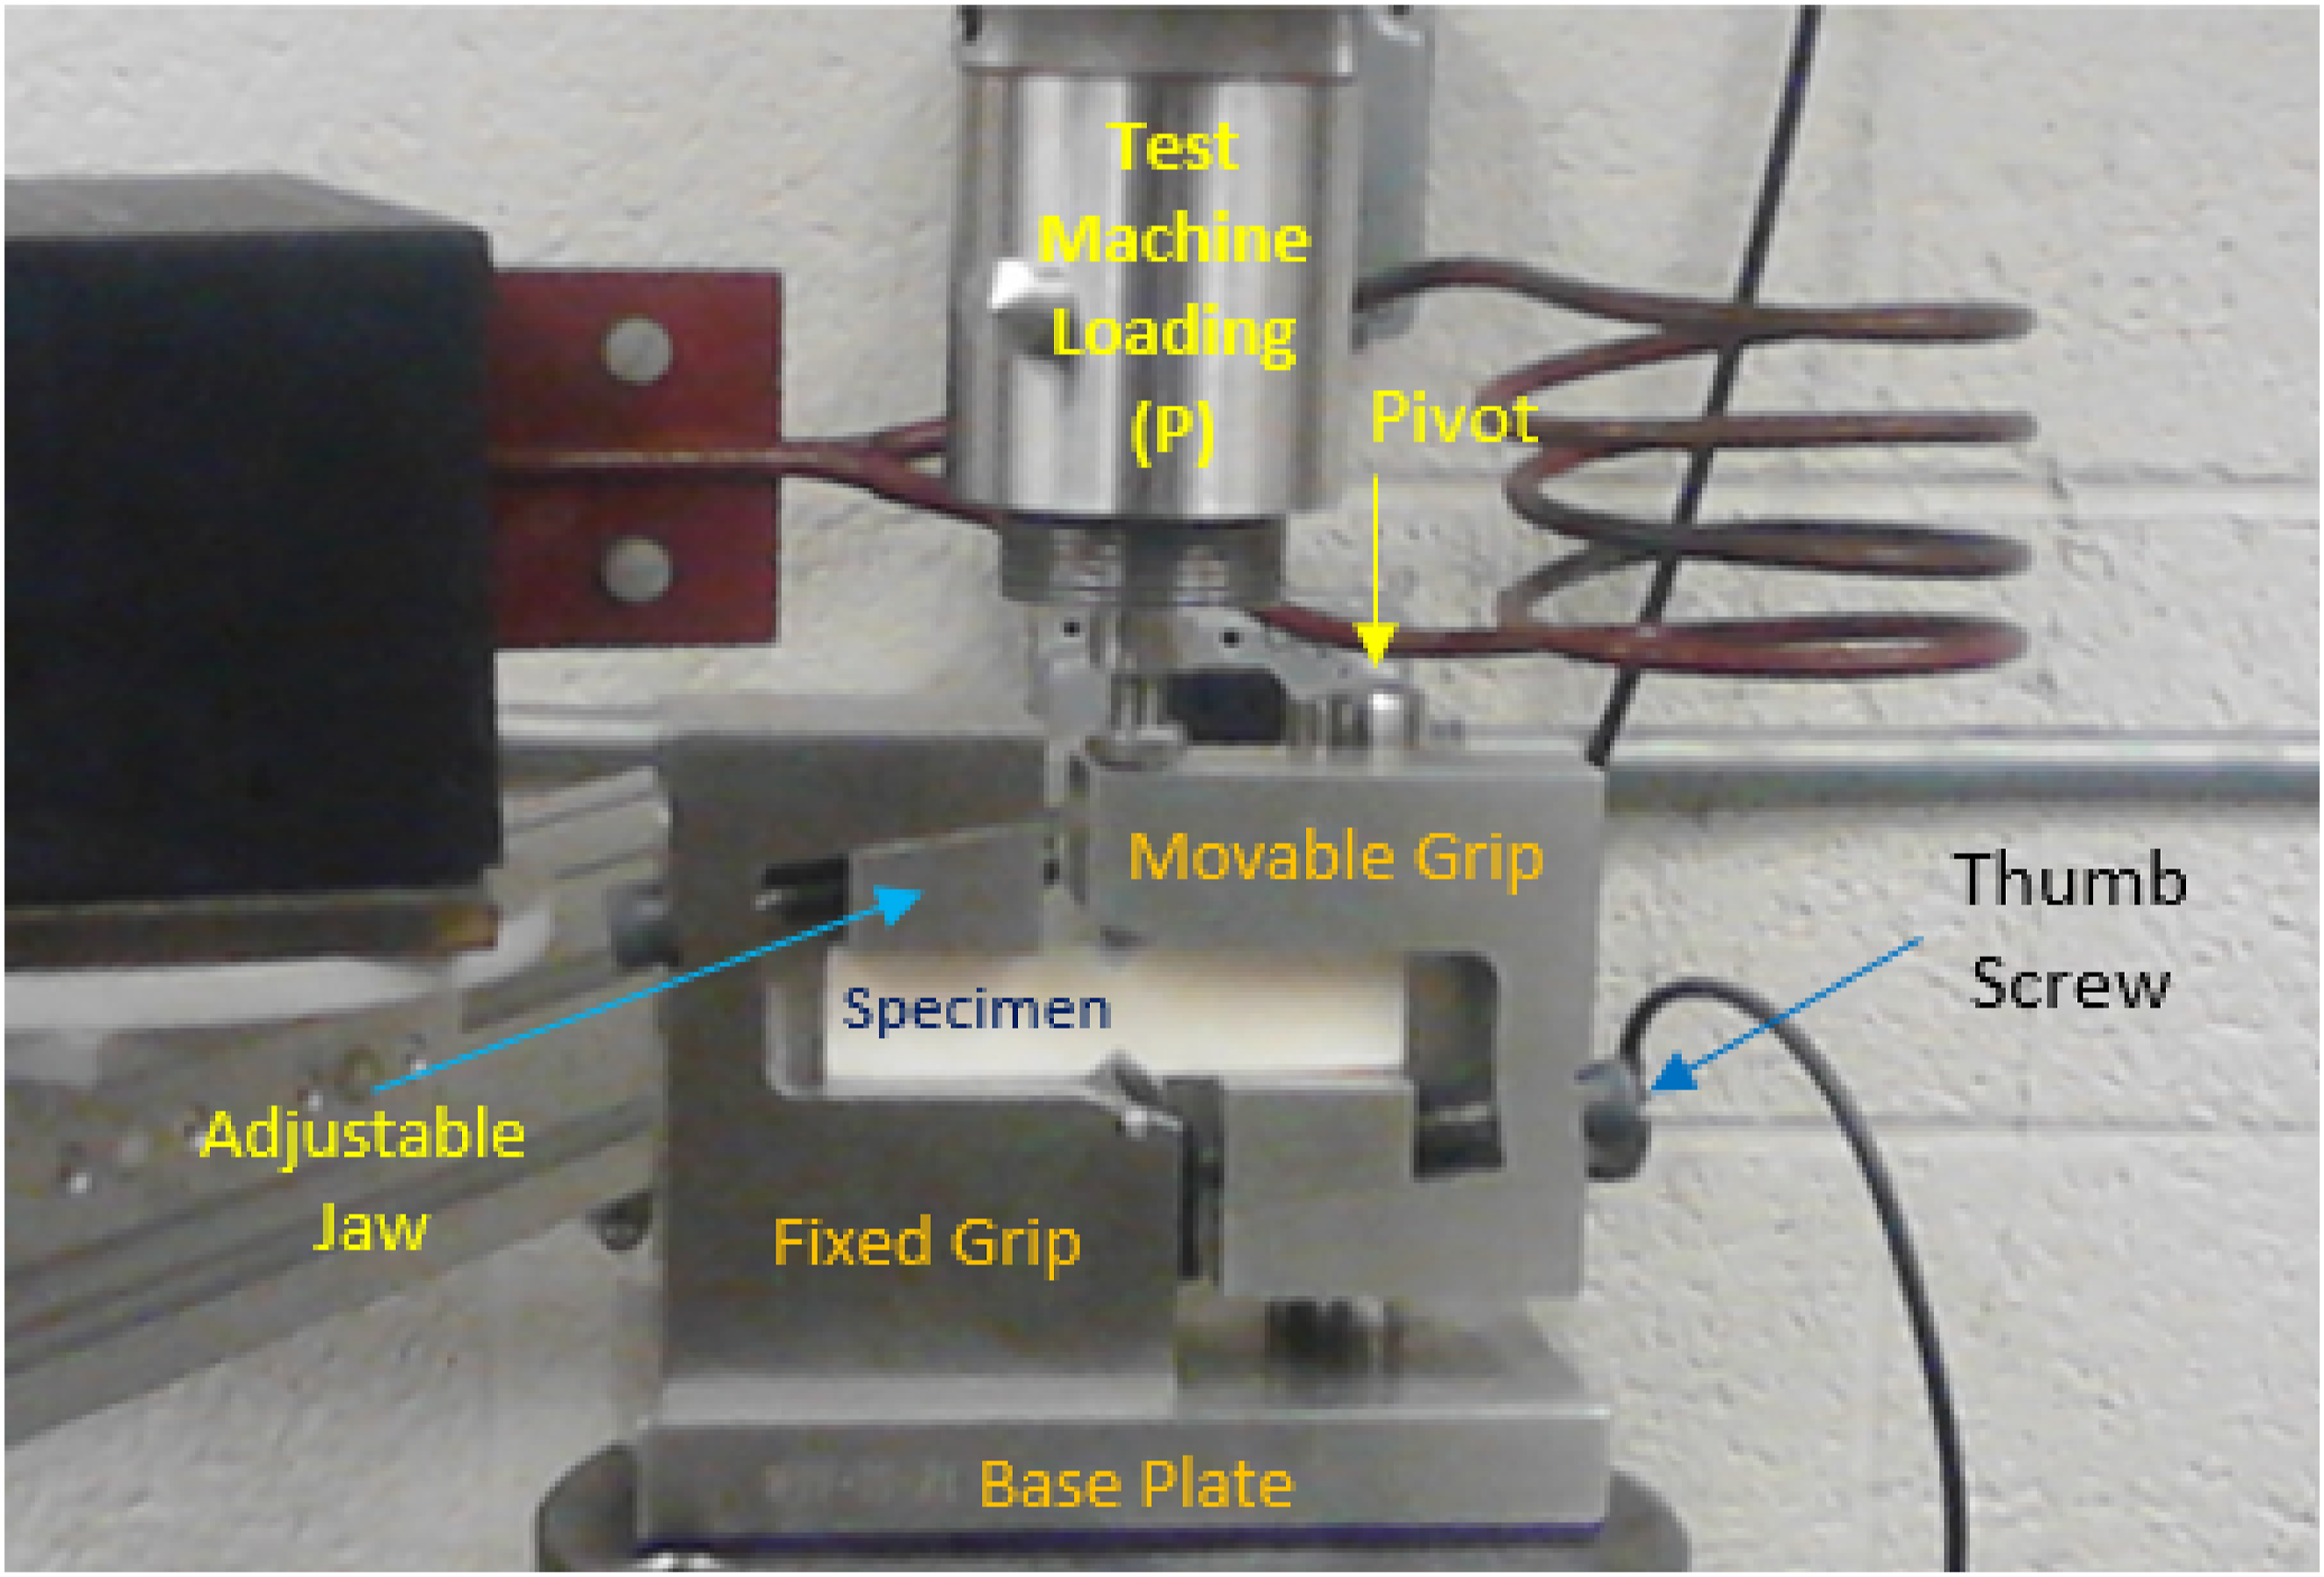
Employing a double edge-notched flat specimen with two counteracting moments (Figure 1), the Iosipescu shear test technique aims at achieving a region of pure, uniform shear stress57,58; however, numerous studies have clearly demonstrated that shear stress between the notch tips is non-uniform due to stress concentrations taking place near these tips.58–62 Additionally, significant tensile components develop in polymers at the notch regions even with relatively small displacements, 28 primarily due to their capacity to endure substantial plastic deformations under shear loading. In essence, the Iosipescu (V-notched) shear test method outlined in ASTM D5379 standard 41 was followed in the present study to assess the material behavior of ABS under shear loads.
Shear test procedure
A schematic representation of the Wyoming version of the Iosipescu (V-notched) shear test fixture is shown in Figure 2(a), while the geometric specifications of the double-notched shear test specimen detailed by the relevant standard
41
are illustrated in Figure 2(b). The shear test specimens shown in Figure 2(c) were attained through a two-step machining process. Initially, a Raptorex Pro laboratory-style CNC router machine was utilized to cut a large ABS plate, 3.2 mm in thickness, into rectangular pieces measuring 76 × 19 mm. A 4-flute High-Speed Steel (HSS) end mill with a diameter of 6 mm was employed for this task. Given the specifications of the end mill and the mechanical properties of ABS, the cutting parameters were set to a spindle speed of 4500 r/min, a feed rate of 800 mm/min, and a depth of cut of 0.85 mm. These parameters were selected to ensure precision while minimizing heat generation, which could lead to melting and adversely affect the material’s mechanical properties. During the cutting process, compressed air was used to cool the specimens, preventing overheating and preserving the mechanical integrity of the material. Following this, notches were created on the attained rectangular samples using a Testform brand notching machine, which can achieve a micrometer precision of 0.01 mm. (a) Schematic representation of the Wyoming version of the Iosipescu (V-notched) shear test fixture, (b) Geometrical specifications of the test specimen (thickness of the specimen, t = 3.2 mm), (c) actual shear test specimen.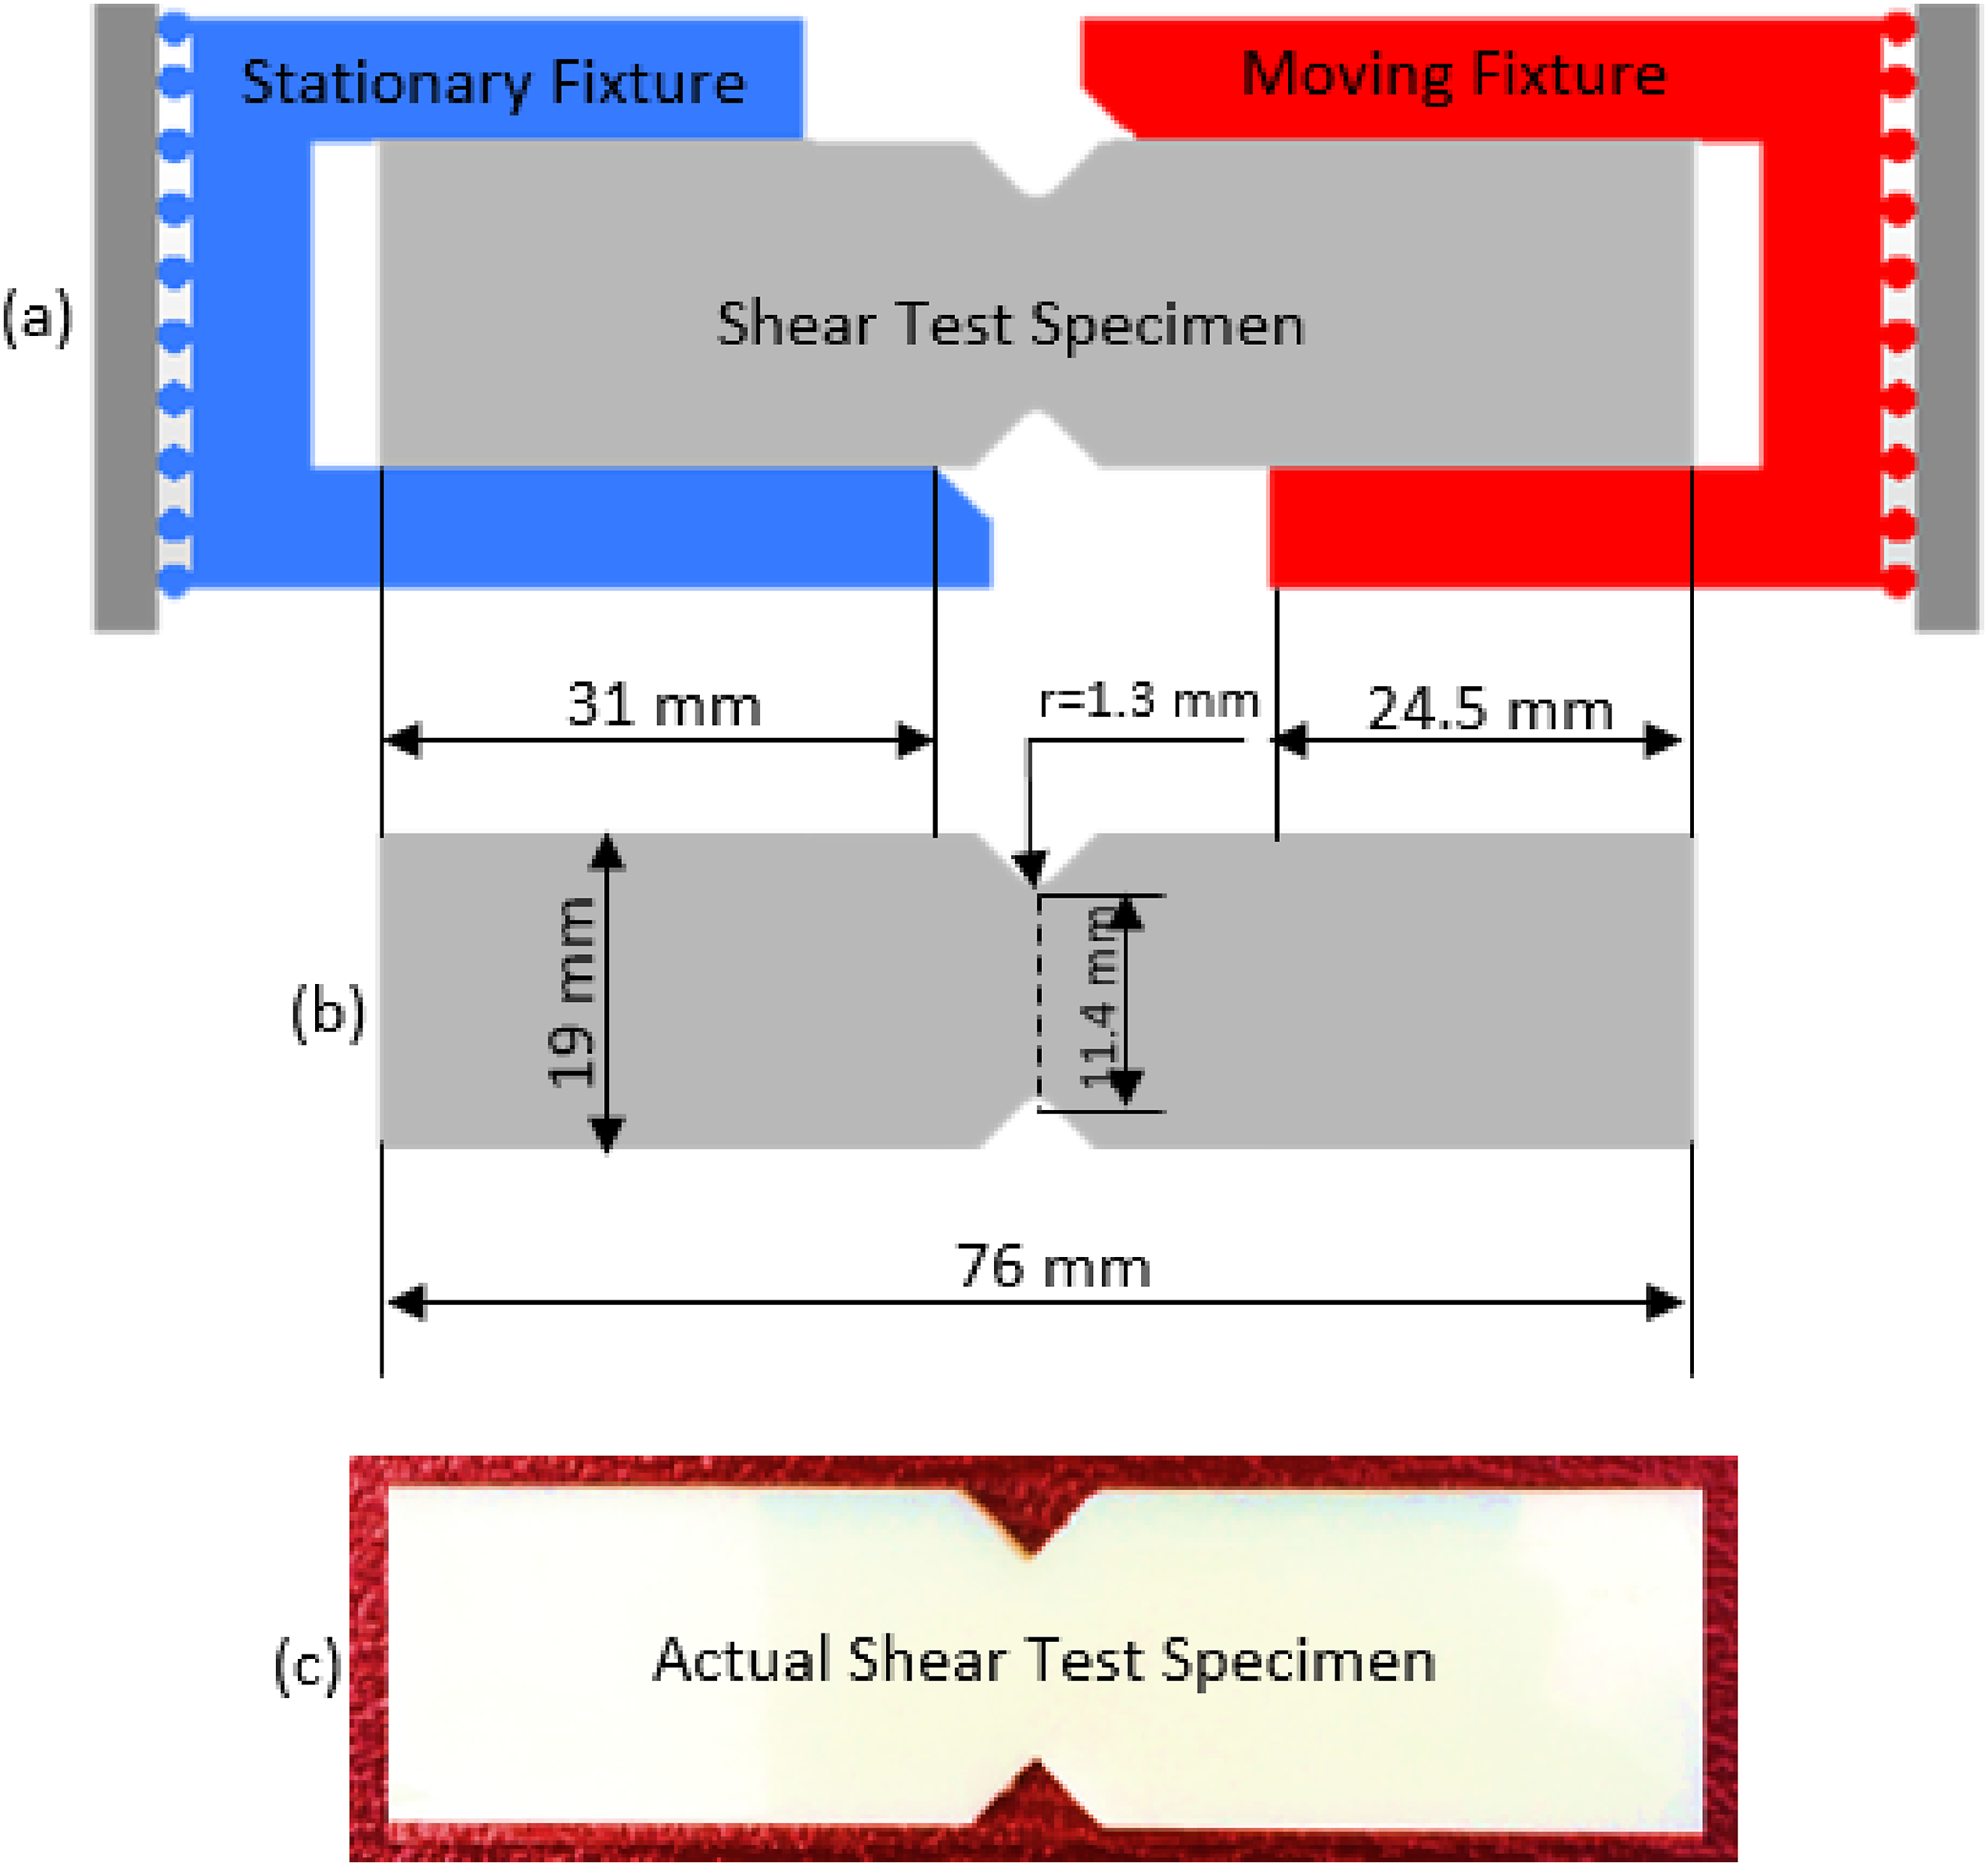
For reliable shear testing, sample notches were precisely aligned to avoid material damage, and specimen edges were prepared to be flat and perpendicular to the sample faces to ensure uniform loading, as illustrated in Figure 3. Non-compliance with these standards can result in non-uniform loading and potential out-of-plane bending.
63
Given that the Iosipescu (V-notched) shear test does not directly measure shear strain, strain measurements during the tests were achieved using the Q400 Digital Image Correlation (DIC) system procured from Dantec Dynamics. The movement of specular markers applied to the test specimens, as shown in Figure 3, was monitored and tracked by a single camera, with strain evaluation performed using Istra4D software.
64
The monitored region of the specimen during the shear tests.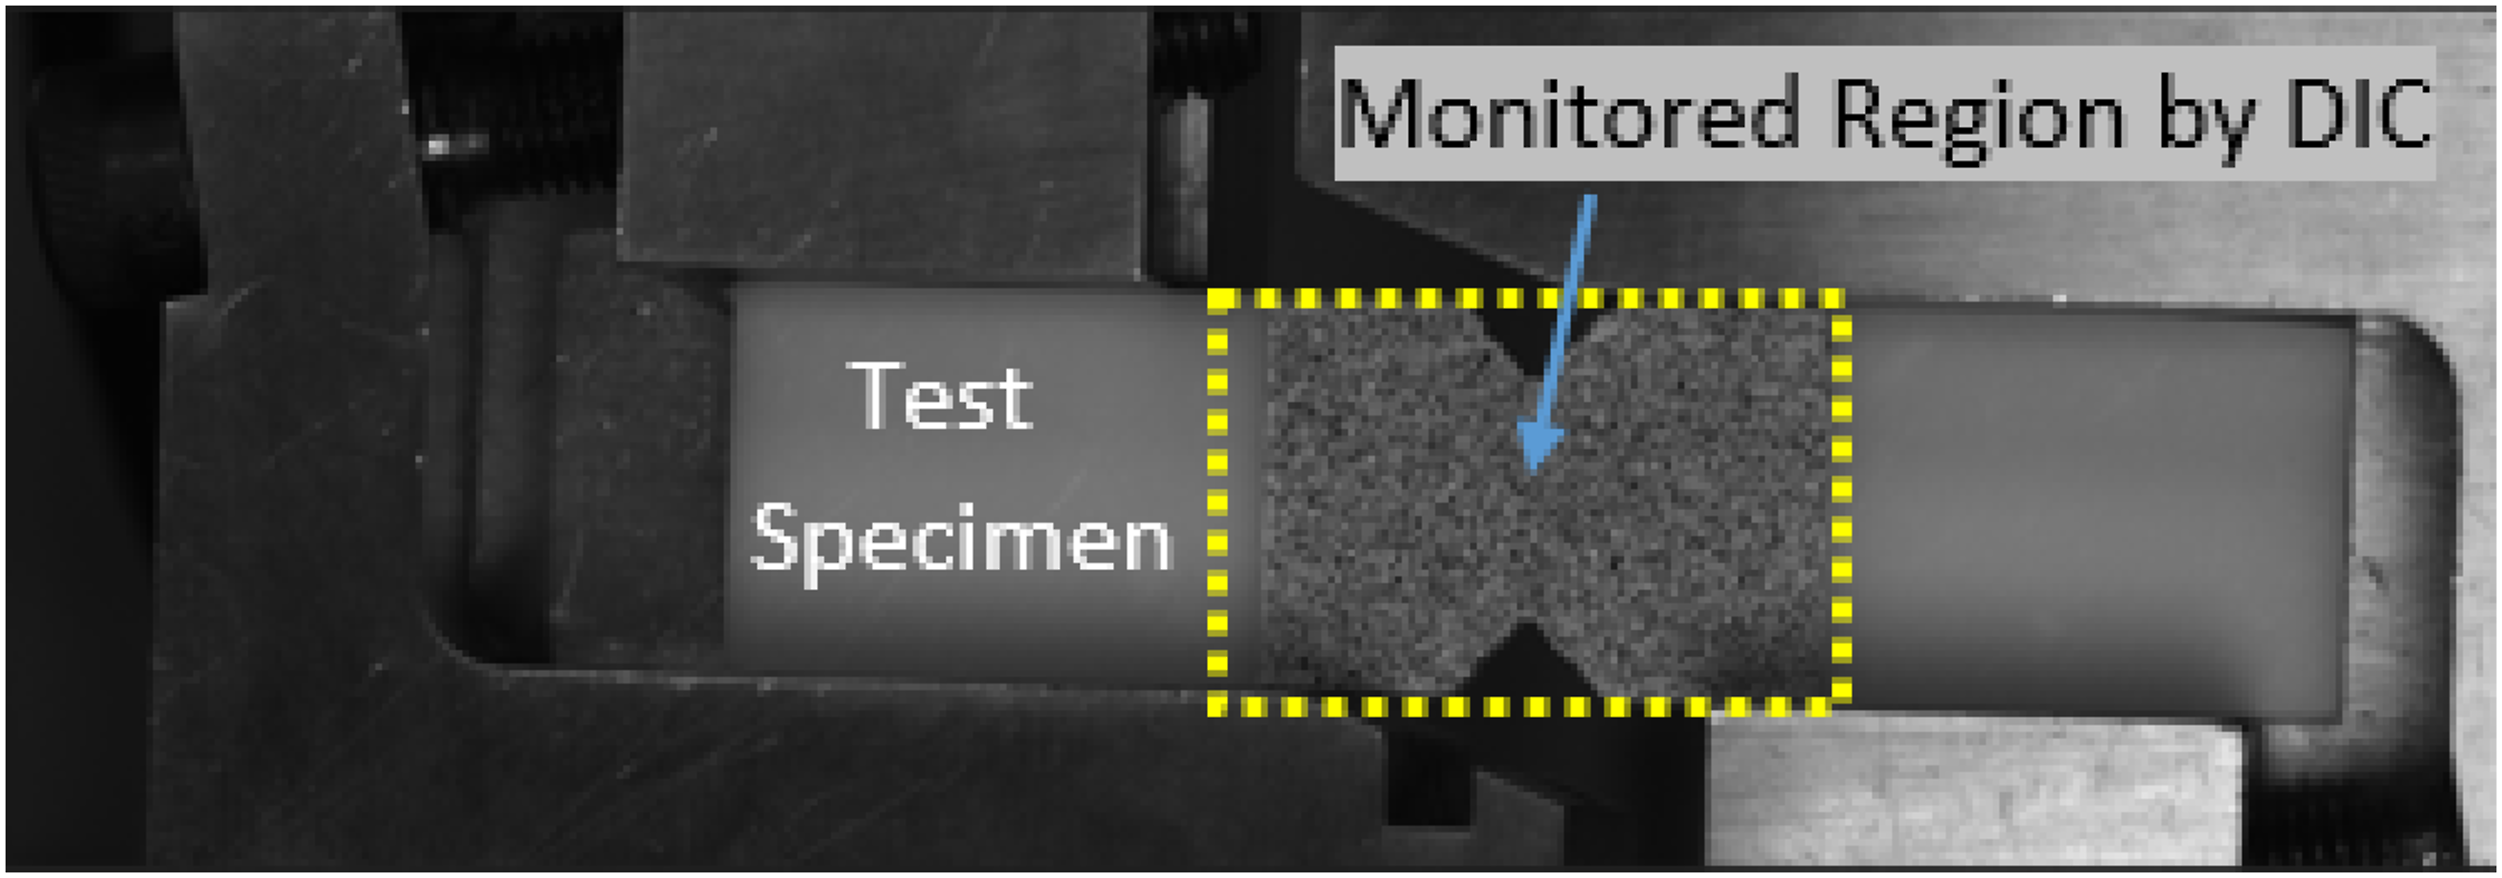
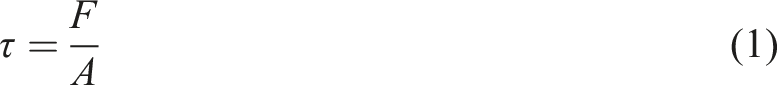
The shear tests were conducted using an Instron universal testing machine with a 10 kN load capacity at five distinct loading rates, ranging from 0.005 to 10 mm/s. These loading rates correspond to strain rates varying from 5.5 × 10⁻⁴ s−1 to 7 × 10⁻¹ s−1, respectively. For each loading rate, a minimum of five tests was performed. Shear stresses were calculated using the following expression.41,50
Building on the methodology of strain measurement outlined in the literature, which assumes a uniform shear stress distribution in the sheared region between the notches,
50
shear strains were obtained from the DIC data by averaging the central strains over a circular region with a radius equal to 1%–2% of the distance between the notches.50,64 The shear strain rate for each loading speed was calculated with the following expression, accounting for the DIC strain-time data.
50
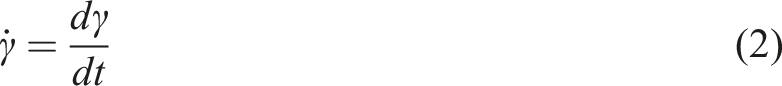
Herein,
Finite element modeling
Finite element simulations for the Wyoming version of the Iosipescu (V-notch) shear tests were performed using LS-DYNA engineering software. The finite element model of the relevant test, comprising the grips and specimen, is shown in Figure 4. The simulations assumed geometric, material, and boundary contact non-linearity between the specimen and grips.
38
The simulations were implemented for two distinct loading rates, 0.05 mm/s and 10 mm/s, corresponding to strain rates of 5.5 × 10⁻³ s−1 and 7 × 10⁻¹ s−1, respectively. The shear stress-strain data obtained from the finite element analyses was compared to the experimental results to validate the accuracy and reliability of the finite element model and the material model used. The finite element model of the Wyoming version of the Iosipescu shear tests, (a) front view, (b) iso-metric view.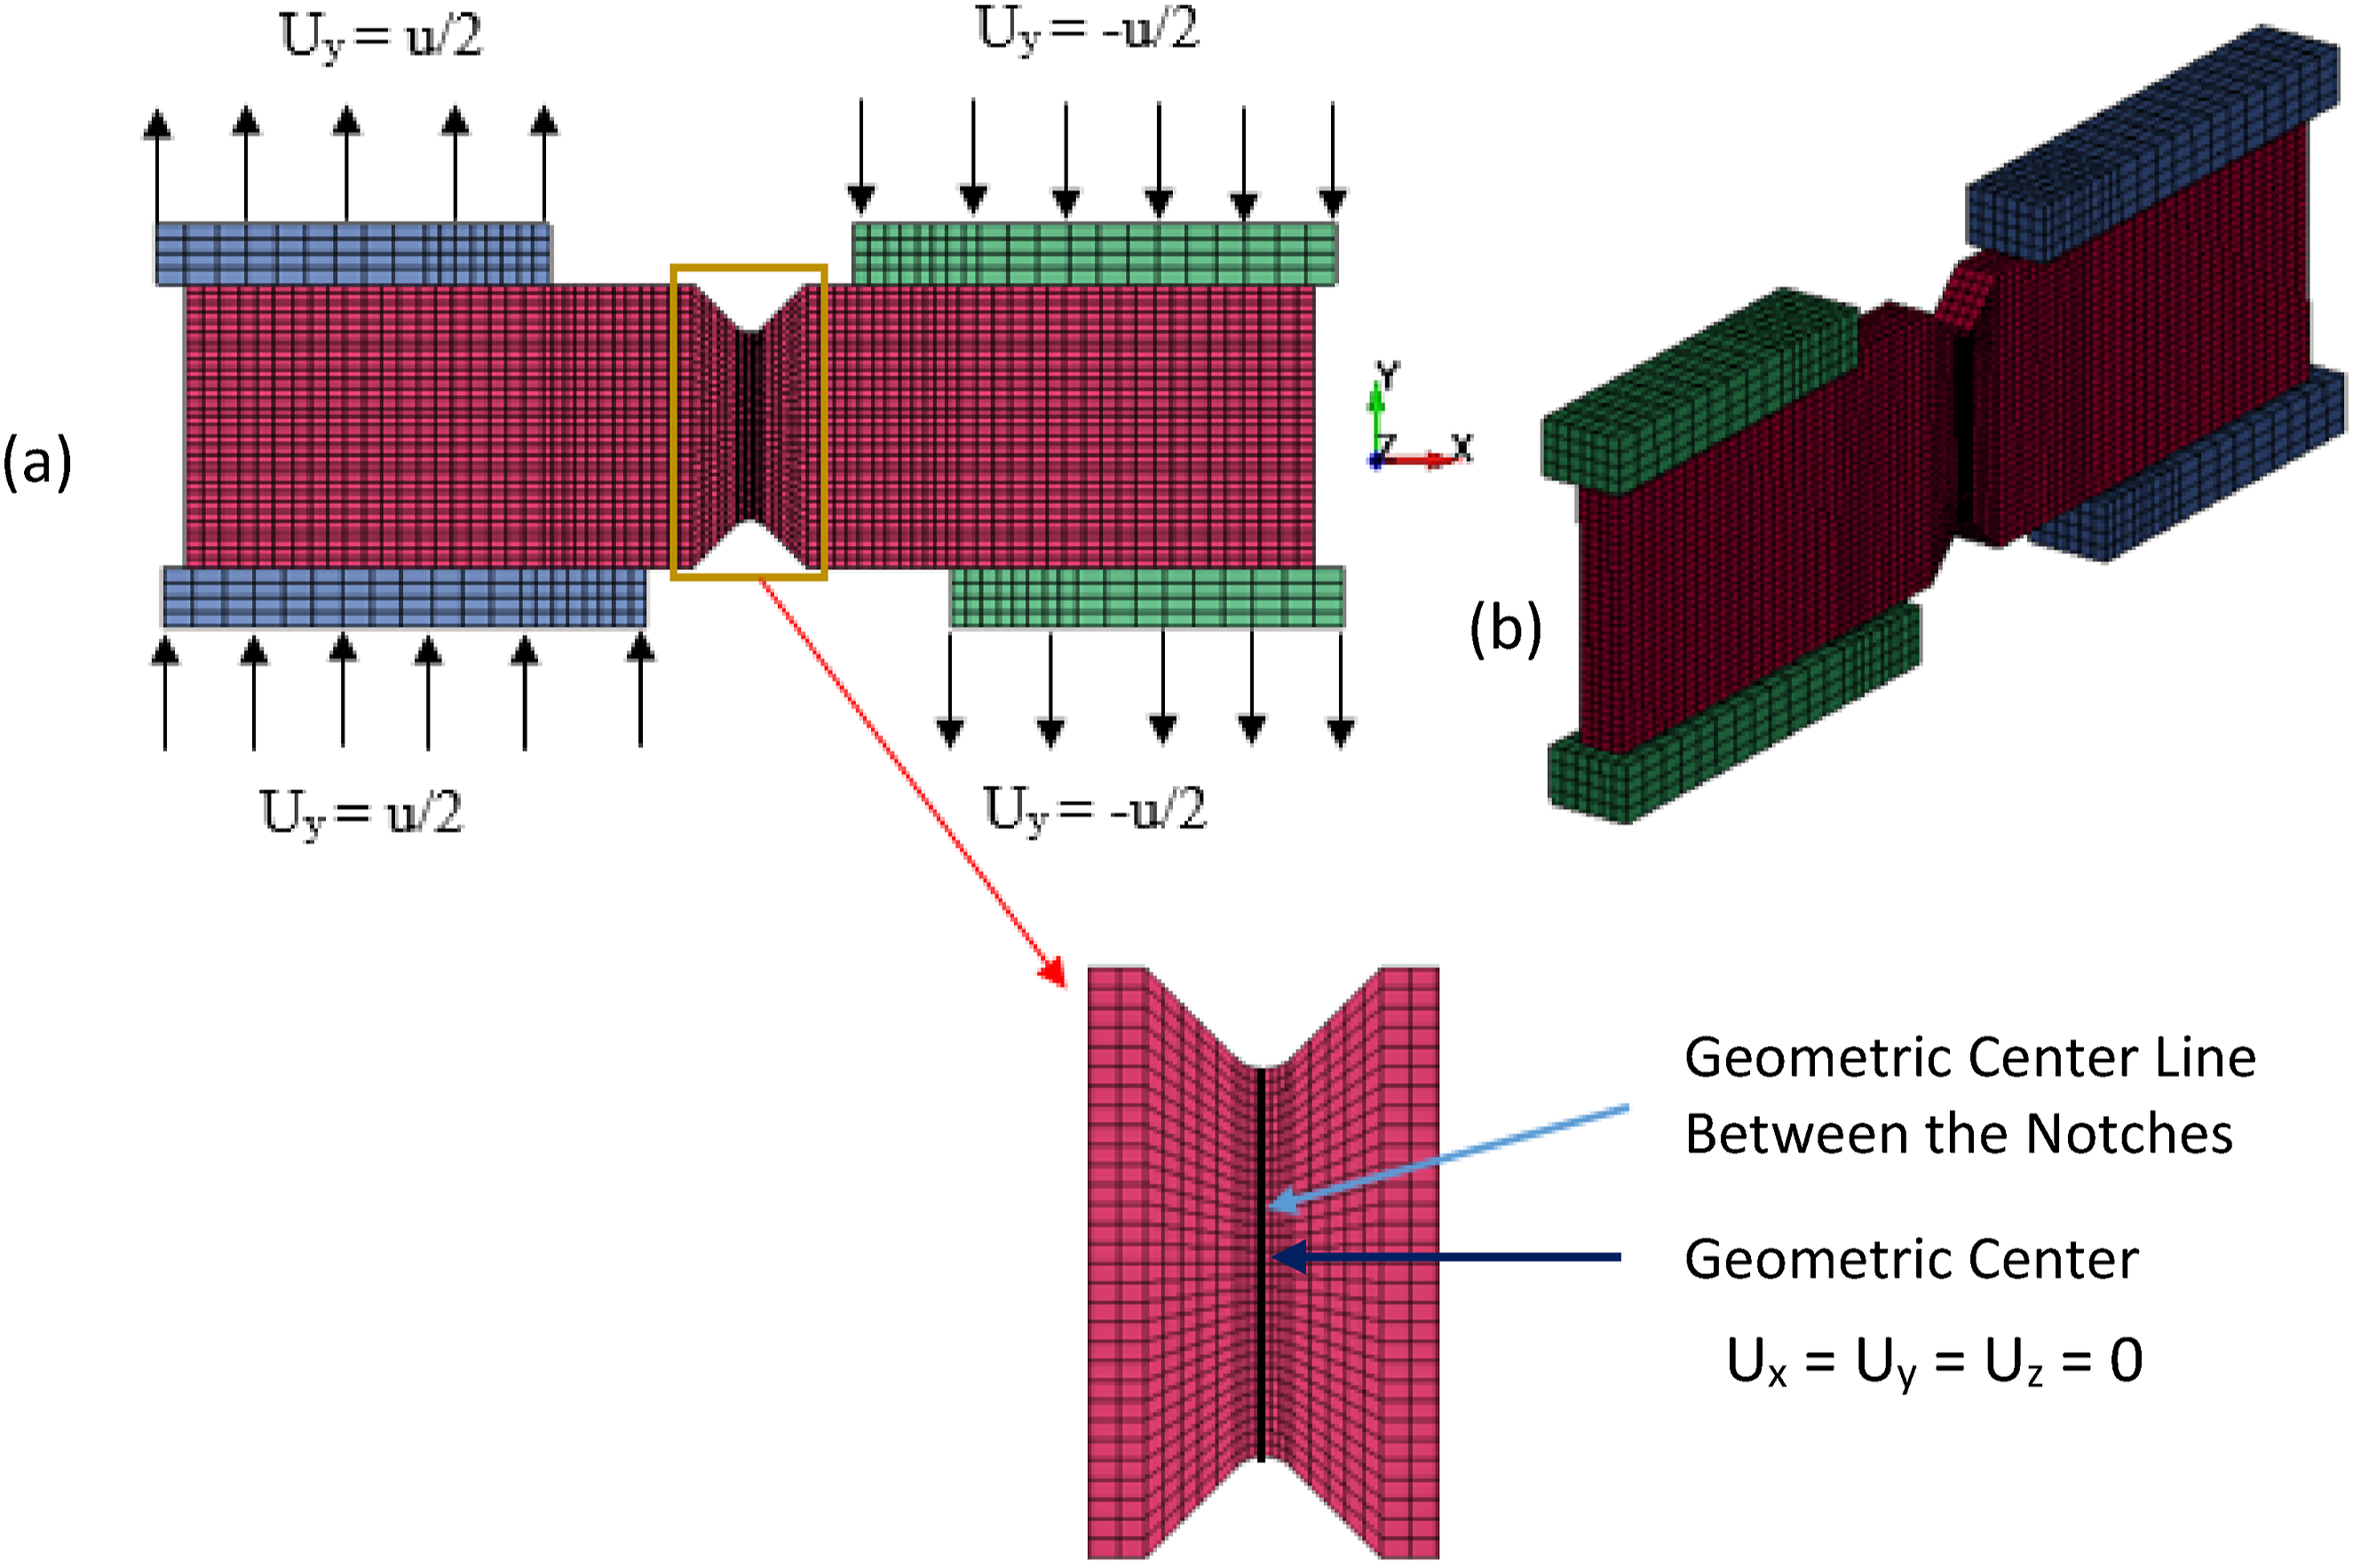
Element types and mesh
The Wyoming version of the Iosipescu (V-notch) shear test, depicted schematically in Figure 2(a), was treated as a three-dimensional problem; therefore, the grid geometries of all the components were meshed using 8-node hexahedral solid elements trilinear shape functions,65,66 as shown in Figure 4
The ELFORM 1 element formulation has been applied to the hexahedral solid elements. This formulation, representing constant stress solid elements, incorporates reduced integration, with a single integration point located at the center of the element.2,65,66 By streamlining the stiffness matrix calculations, ELFORM-1 enhances computational efficiency, making it ideal for severe deformations and large-scale simulations with complex geometries and loading scenarios. Each node of the element supports three degrees of freedom: translations in the x, y, and z directions.65,66 While reduced integration improves computational performance and addresses potential element distortion, it may introduce numerical issues such as hourglassing, which requires careful meshing and control measures.1,3,65 Being prone to hourglass mode requires hourglass control, but selecting hourglass stabilization is quite complicated. 65 The Flanagan-Belytschko stiffness form with exact volume integration was employed for hourglass control in the simulations to effectively manage non-physical deformation modes. This hourglass stabilization type (IHQ 5) was chosen for its ability to introduce artificial stiffness to counteract hourglassing while preserving the physical accuracy of the model.2,3,65,67 The use of exact volume integration ensures precise force calculations, which is essential for achieving reliable and accurate simulation results, especially in scenarios involving complex deformations.65,68,69 The hourglass coefficient (QM), quadratic bulk viscosity coefficient (Q1) and linear bulk viscosity coefficient (Q2) were set to 0.1, 1.5 and 0.06, respectively. 67
A mesh convergence study was performed on the finite element model of the shear test specimen shown in Figure 4 to ensure accurate and reliable simulation results. The study systematically refined the mesh, particularly in the sheared region between the notches, and analyzed the resulting changes in key output parameters, such as stress and strain. Convergence was achieved when further mesh refinement produced negligible differences in these parameters, confirming that the mesh density was sufficient to accurately capture the specimen’s response to shear loading. As a result, 11,616 elements corresponding to 15,595 nodes were used in the simulations. Furthermore, the size of the elements used in meshing the region between the notches was recorded as 0.25 × 0.4 × 0.8 mm. The sizes of the elements employed to mesh the remaining parts of the shear test specimen varied between 0.9 × 0.63 × 0.8 mm and 1.2 × 0.63 × 0.8 mm.
Boundary conditions, loading, and contact type
Both fixtures, modeled as rigid bodies and illustrated in Figure 4(a), were constrained in all directions except along the y-axis. The physical constraints of the test were effectively mirrored by this configuration, with movement permitted along the y-axis while motion in all other directions was restricted. The geometric center of the shear test specimen was constrained against all translational directions to prevent rigid body motions, consistent with the existing literature.38,58,70,71
To achieve the loading rates attained in the actual shear tests, a time-dependent rigid body displacement was applied to both fixtures, as depicted in Figure 4. The left fixture was displaced by u/2 in the positive y direction, while the right fixture was displaced by u/2 in the negative y direction, resulting in a total displacement of u along the y-axis. 38 In the simulations, two loading rates of 0.05 and 10 mm/s, corresponding to the strain rates of 5.5 × 10⁻³ s−1 and 7 × 10⁻¹ s−1 respectively, were achieved using the defined time-dependent rigid body displacements. Furthermore, mass scaling values of 1 × 10⁻⁴ and 5 × 10⁻⁶ were used in the simulations for the strain rates of 5.5 × 10⁻³ s−1 and 7 × 10⁻¹ s−1, respectively. The mass scaling values were rigorously validated by comparing the time-strain data extracted from the finite element analyses with the experimental results. This process confirmed that the simulations accurately represented the experimental timing and strain responses. Any discrepancies led to adjustments in the mass scaling values and reruns of the simulations to ensure accuracy.
An Automatic-General contact type with an interior option was specified between all contacting surfaces. Additionally, a friction coefficient of 0.3 was defined between all contacting surfaces, guided by benchmark studies indicating that friction coefficients ranging from 0.1 to 0.5 do not impede the accuracy of numerical results.61,72
Material model
The constitutive model parameters for ABS used in the simulations. 1
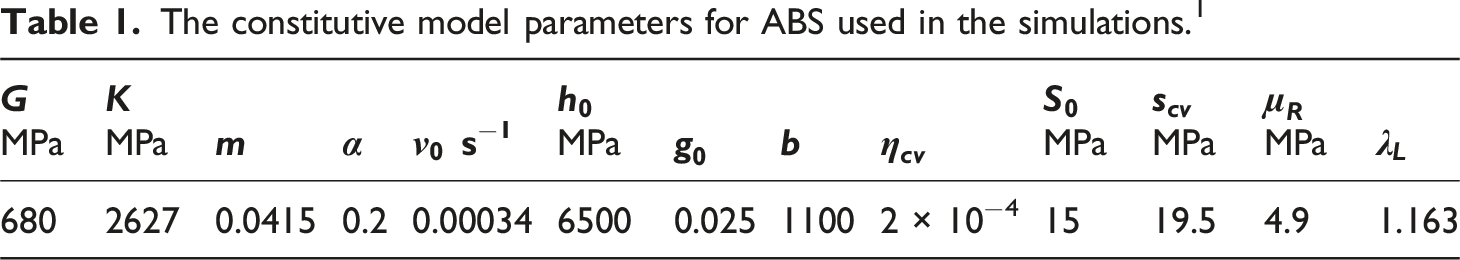
The methodology for determining the model parameters for ABS, tabulated in Table 1, has been described comprehensively in the cited reference. 1 However, brief descriptions of these parameters are provided here to facilitate a better understanding of the material model utilized in the shear test simulations.
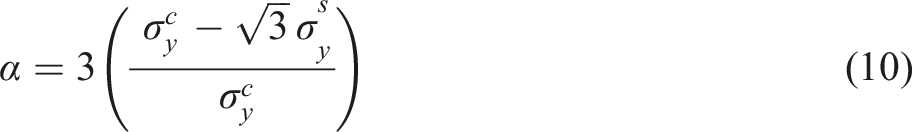
G and K represent the shear modulus and bulk modulus, respectively. Furthermore, m and α are the strain rate sensitivity and hydrostatic pressure sensitivity parameters, respectively. Additionally,
Note that the aforementioned material parameters, including the strain sensitivity, were basically calibrated deploying the compressive stress-strain curves of ABS obtained at various strain rates. The susceptibility of ABS yield strength to strain rate may exhibit variance from one loading configuration to another, including tension, compression, and shear. Another salient aspect is that the hydrostatic pressure sensitivity parameter, presented in Table 1, has been computed based on ABS tensile and compression test data at identical strain rates. However, it is pertinent to acknowledge that this parameter’s variability may also be contingent upon the specific type of employed test data, including tension-compression, shear-tension, and shear-compression.
Results and discussion
Experimental results
The stress-strain response of ABS subjected to shear loading at varying strain rates is presented in Figure 5. The results given in Figure 5 clearly demonstrate that ABS exhibits greater stiffness with increasing strain rate. The shear yield strength of the focus material for each strain rate was ascertained by using the experimentally measured stress-strain data in Figure 5. These findings are subsequently showcased for comparative analysis in Table 2. The shear stress-strain curves of ABS at various strain rates. The shear yield strength variation of ABS with strain rate.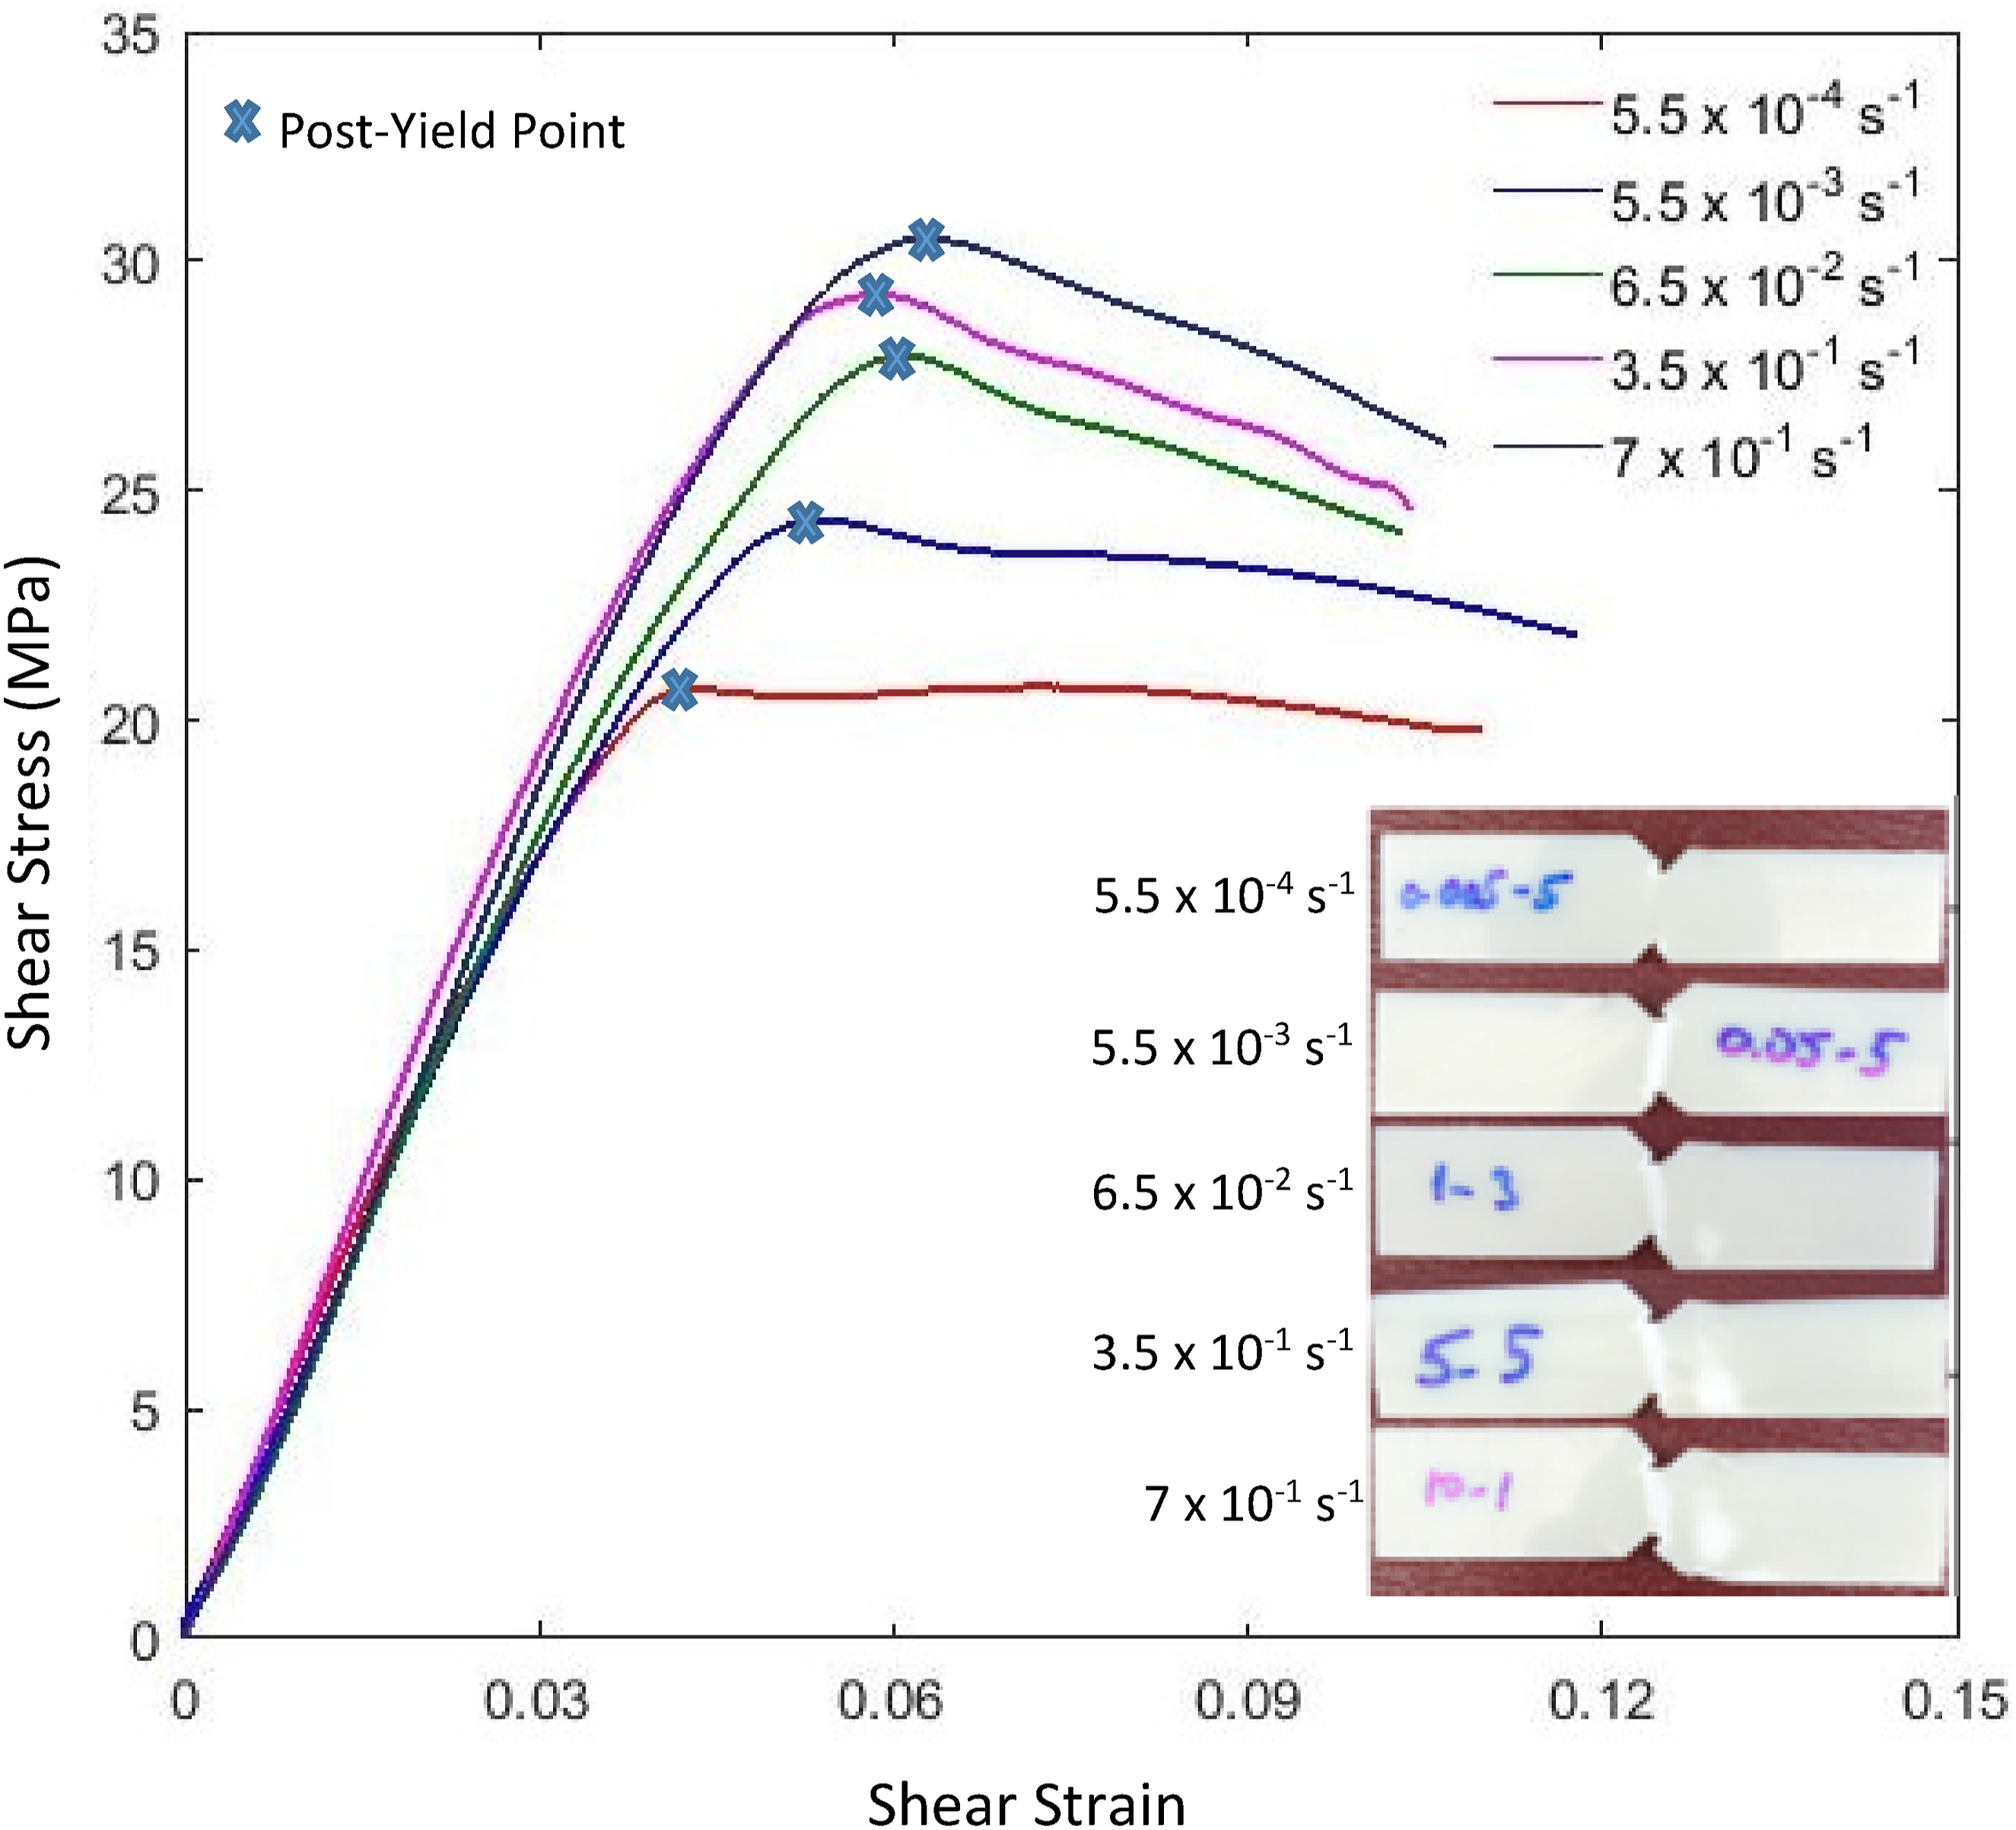
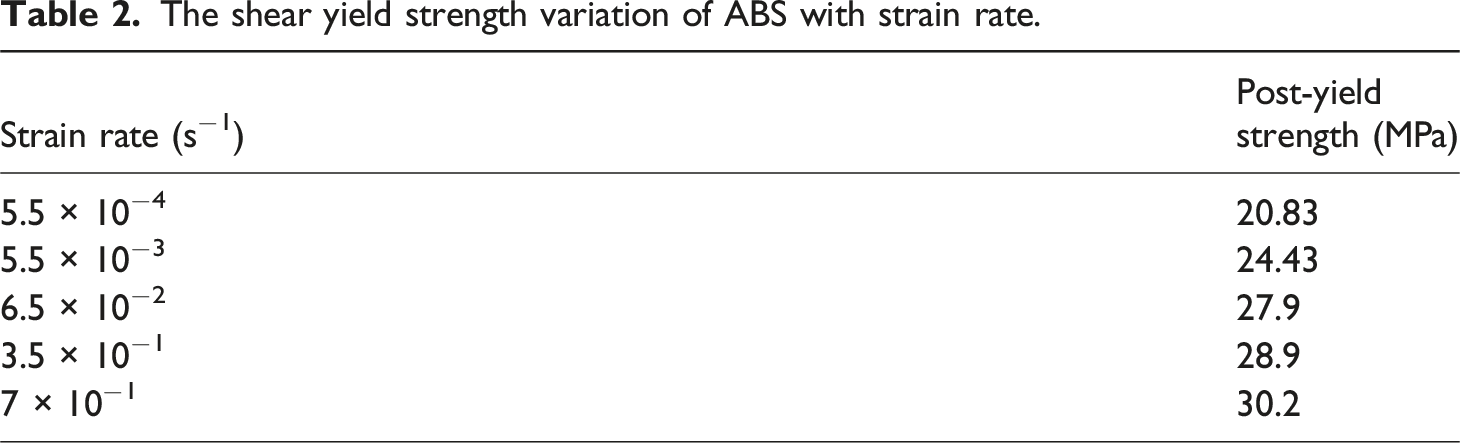
It is widely acknowledged that two distinct yield points, namely the lower and upper yield limits, are discernible in amorphous polymers. The lower yield value corresponds to the point at which the stress-strain curve transitions from a linear to a non-linear behavior. Conversely, the upper yield limit (post-yield strength) demarcates the onset of strain softening, commonly referred to post-yield strength.33,73–75 The yield strength values documented in Table 2 signify the post-yield strength of ABS, which coincide with the peak stress values observed in the representative curve corresponding to each strain rate in Figure 5.
As seen in Figure 5, ABS exhibits slight strain hardening following initial strain softening at the two lowest shear strain rates. This behavior corresponds, to some extent, with previously reported findings on the shear stress-strain response of ABS at a strain rate of 4 × 10⁻³ s−1.
4
On the contrary, at the three highest strain rates, ABS loses its load-carrying capacity following upper yielding, without exhibiting any strain hardening behavior. This phenomenon is attributed to the crushing-induced damage observed in the specimens, which intensifies with increasing strain rate, as shown in Figure 5. The stress whitening phenomenon, a visual indication of craze formation, was particularly observed in the shear zones of the samples, suggesting that the stresses in the region between the notches include a tensile component.
28
The presence of tensile stress in the shear zone can alter the expected failure mechanism, potentially leading to discrepancies in determining shear strength.
28
Thus, research has therefore proposed that tensile and compression tests could provide a reasonable estimate of shear strength.
28
Specifically, the Tresca criterion—assuming that shear strength is approximately half of compressive strength—has been suggested as a potentially adequate method for this purpose.
28
However, the ratio of compressive yield strength to shear yield strength can vary between 1.5 and 2.4, depending on a specific polymeric material considered.
28
Using the strain rate sensitivity parameter
The results presented in Table 2 clearly show that the shear strength of ABS increases with strain rate, from 20.83 MPa at 5.5 × 10⁻⁴ s−1 to 30.2 MPa at 7 × 10⁻¹ s−1. This trend highlights the strain rate sensitivity of ABS, with higher shear strength at higher strain rates. The increase is likely due to factors such as restricted chain sliding, enhanced molecular entanglement, potential shear-induced ordering, and viscoelastic effects. These factors contribute to the observed increase in shear strength with higher strain rates. In other words, at lower strain rates, ABS allows for greater molecular movement, with polymer chains sliding past each other, leading to lower shear strength. As strain rates increase, molecular mobility decreases due to limited time for rearrangements. This results in a stiffer response, with higher shear strength as the material resists deformation more effectively under higher loading rate conditions.27,76
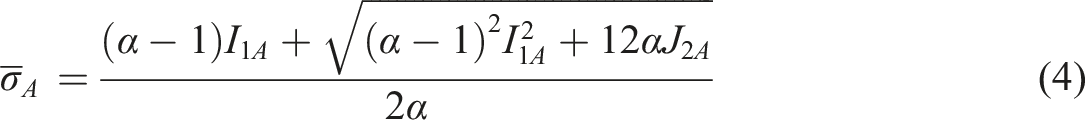
Based on the pressure-dependent yield material model proposed for polymers by Raghava,
77
the definition of the yield surface (
Herein,

Moreover, the parameter 
Herein, independent of the type of mechanical test carried out,
Extracting the parameter 
Herein, 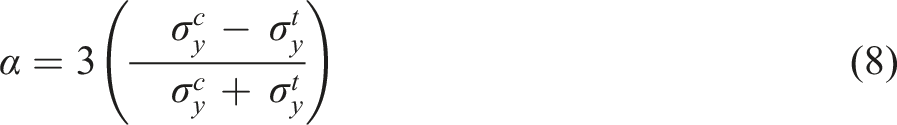
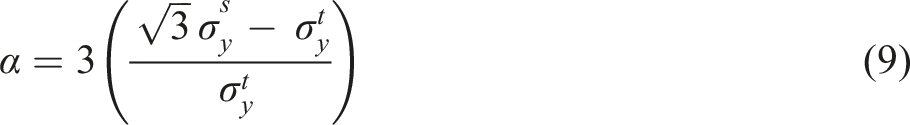
When there exist both tensile and shear test data, the expression given in equation (8) takes on the following form.
4
Similarly, equation (8) or equation (9) can be rearranged for the case where both shear and uniaxial compression test data are available, as given below.
4
Herein,
Previously, the parameter
Drawing upon the thermally activated process proposed by Argon concerning the strain rate’s influence on yield stresses,
35
Boyce
79
described the strain rate-dependent yield behavior of polymers as given below.32,35,79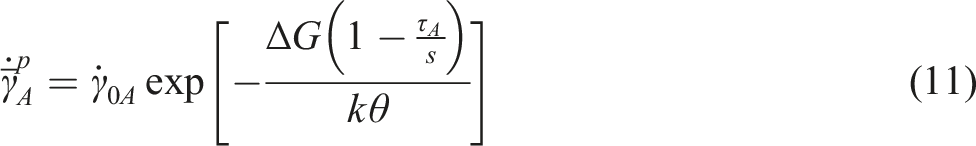
Herein,
Equation (11) can further be arranged for the uniaxial tensile and compression stress states as given below.
78
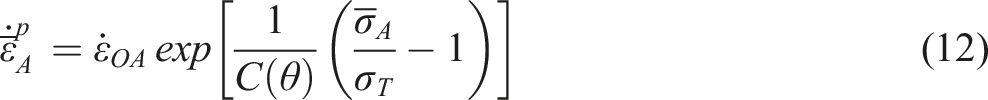
After a simple arrangement, equation (12) takes on the following form.
78
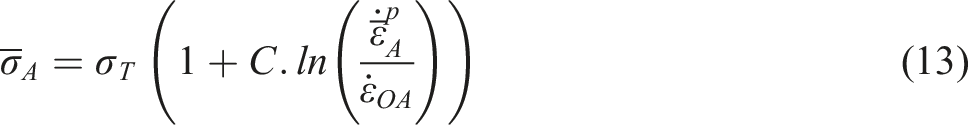
By using equation (13), one can readily compute the sensitivity of the tensile and compressive yield strengths of polymers to the strain rate.
Equation (13) can further be arranged for the shear stress state as follows: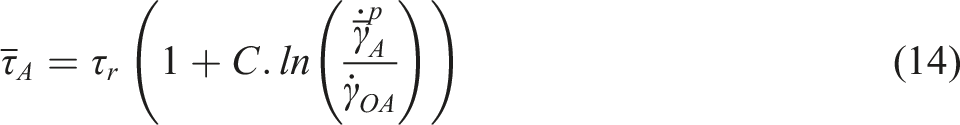
Herein,
Equation (14) can also be expressed as given below.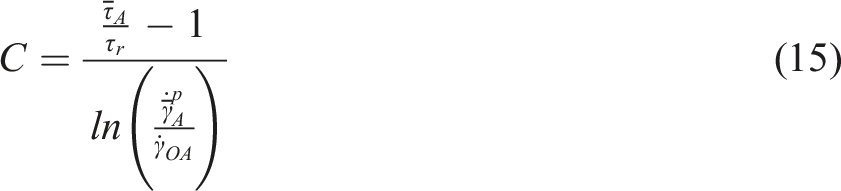
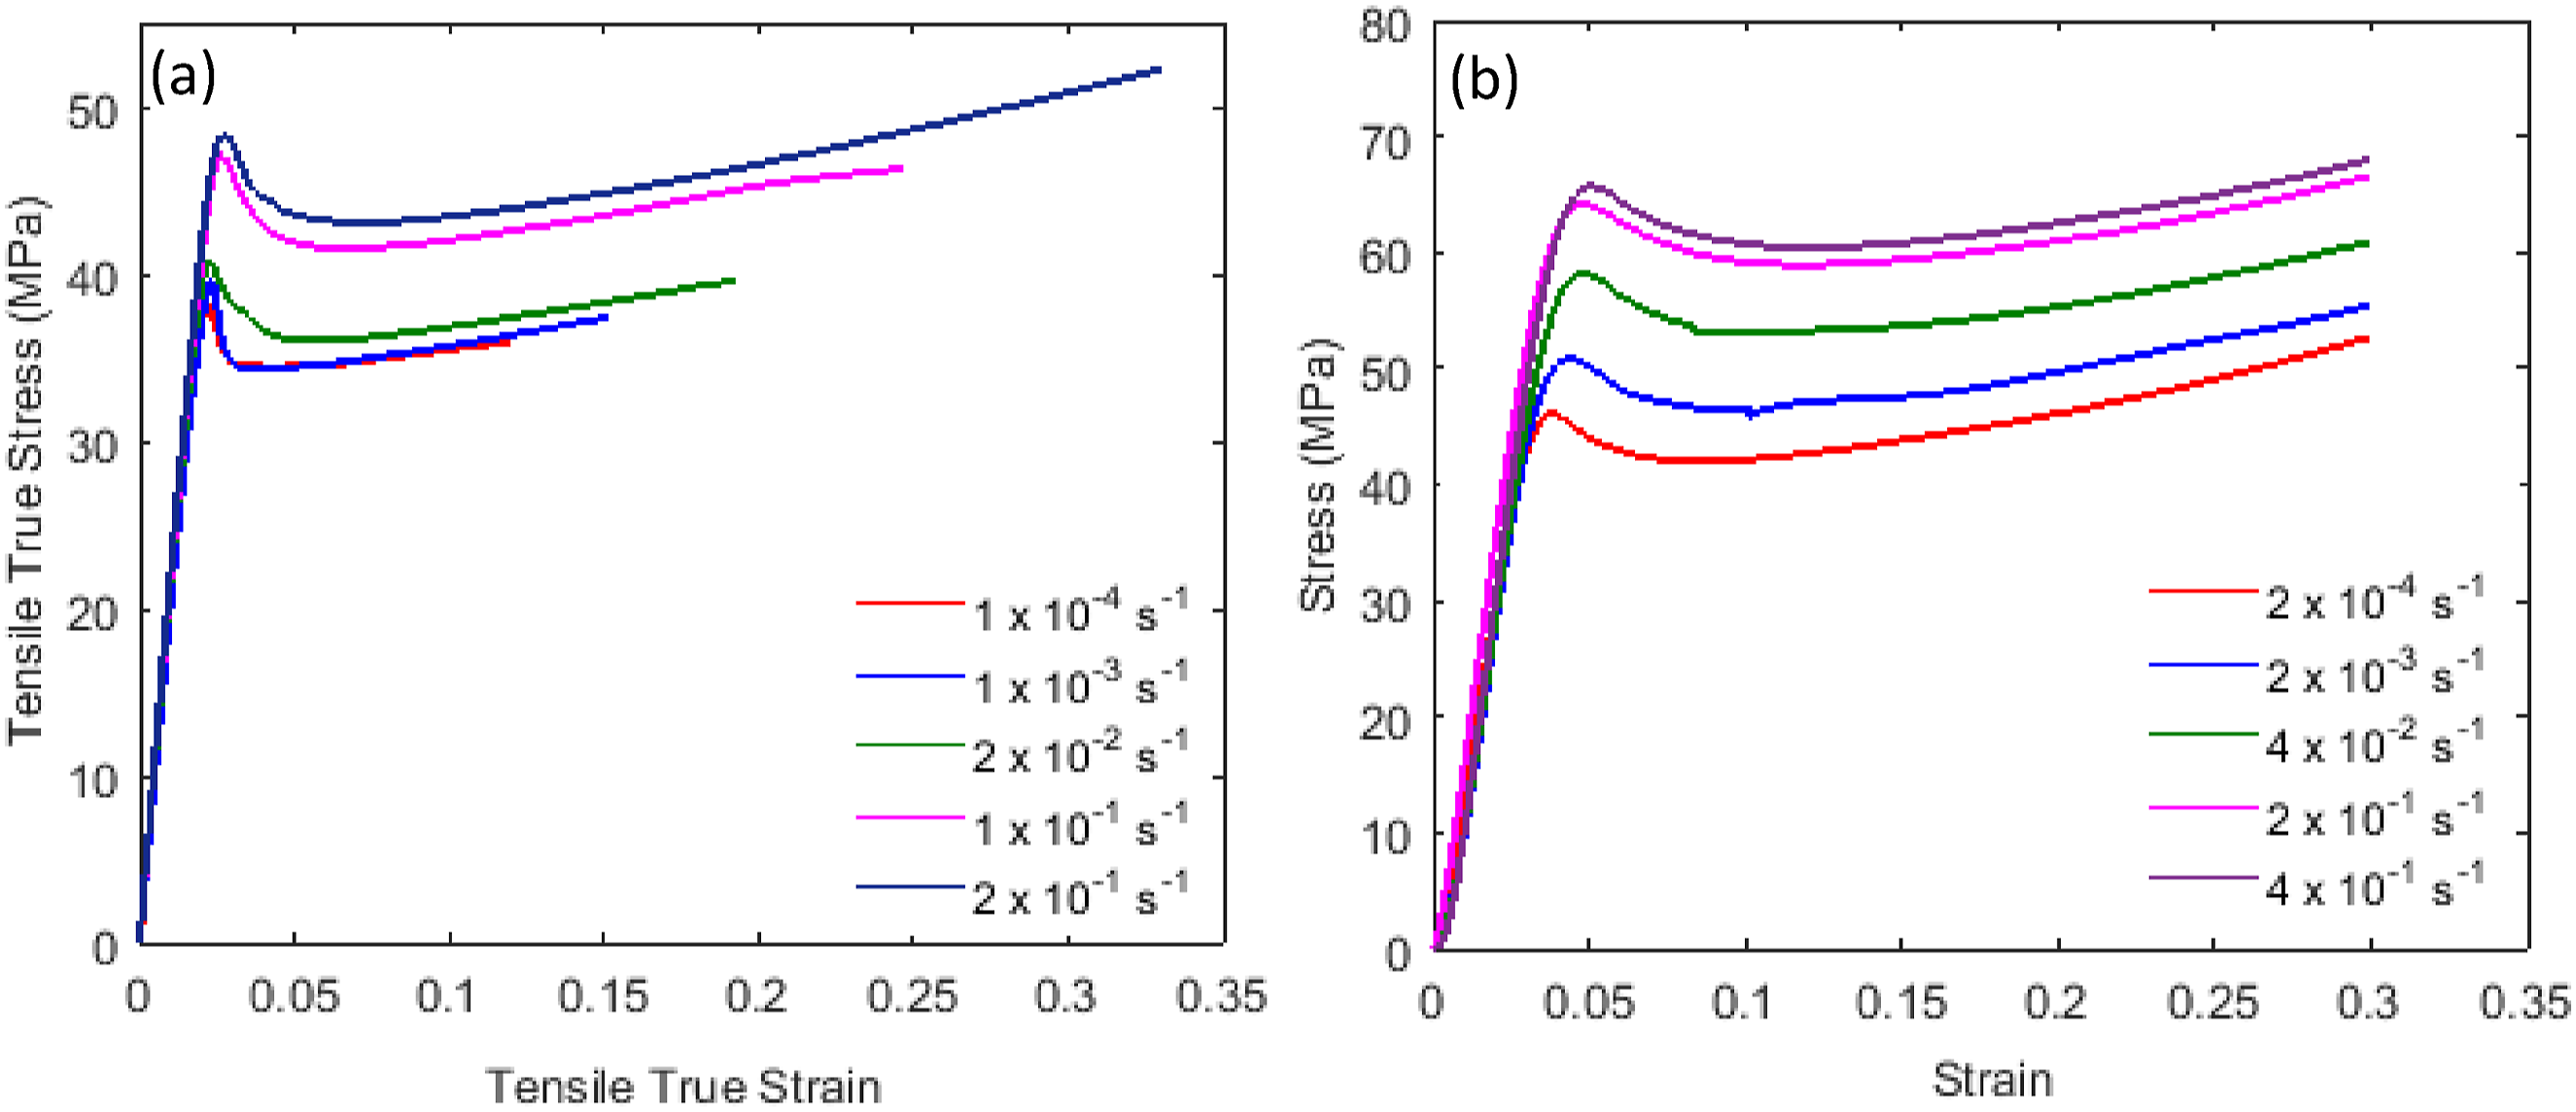
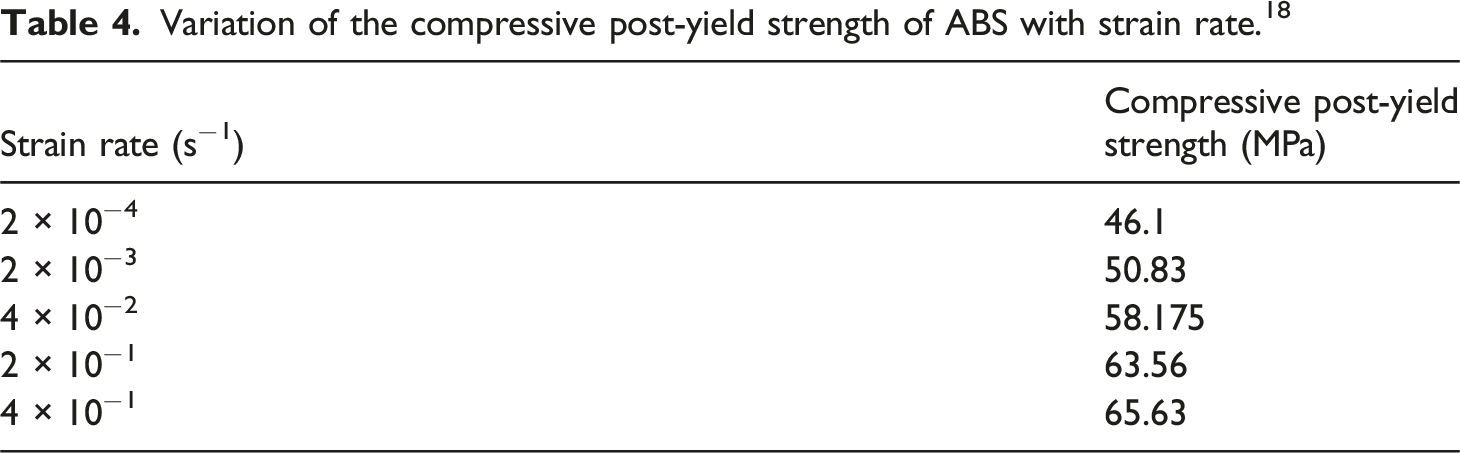
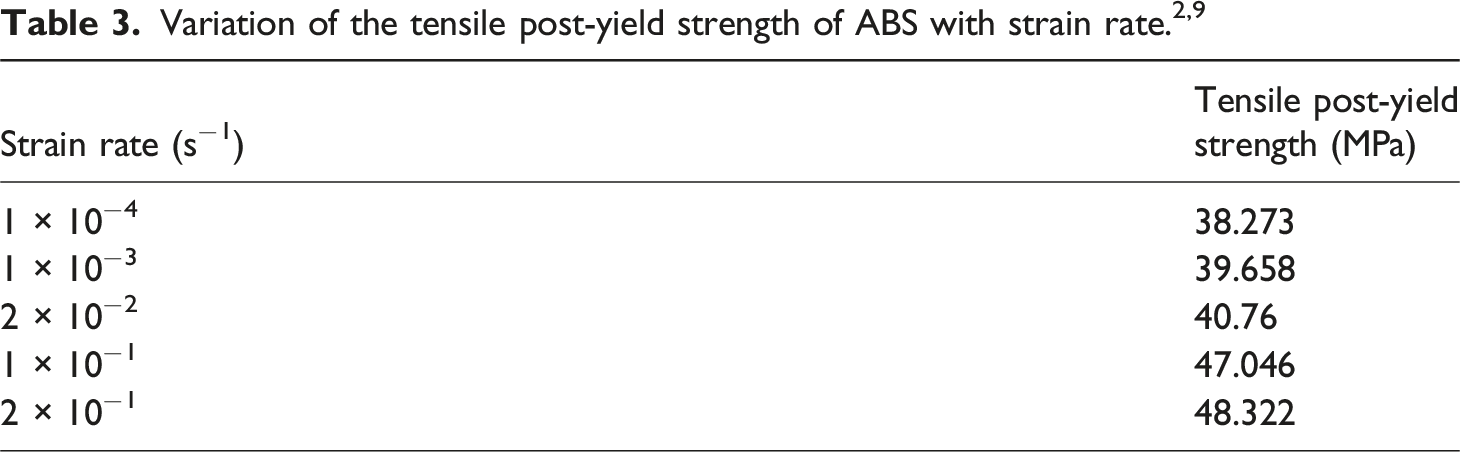
The stress-strain responses of ABS under tension and compression at various strain rates are presented in Figure 6(a) and (b), respectively. Additionally, the variations in the tensile and compressive yield strengths of ABS with strain rate are detailed in Tables 3 and 4, respectively. Variation of the compressive post-yield strength of ABS with strain rate.
18
The strain rate sensitivity parameter
Similarly, the parameter (a) The determination of the strain rate sensitivity parameter for the shear stress state, (b) comparison of the experimental results with model predictions.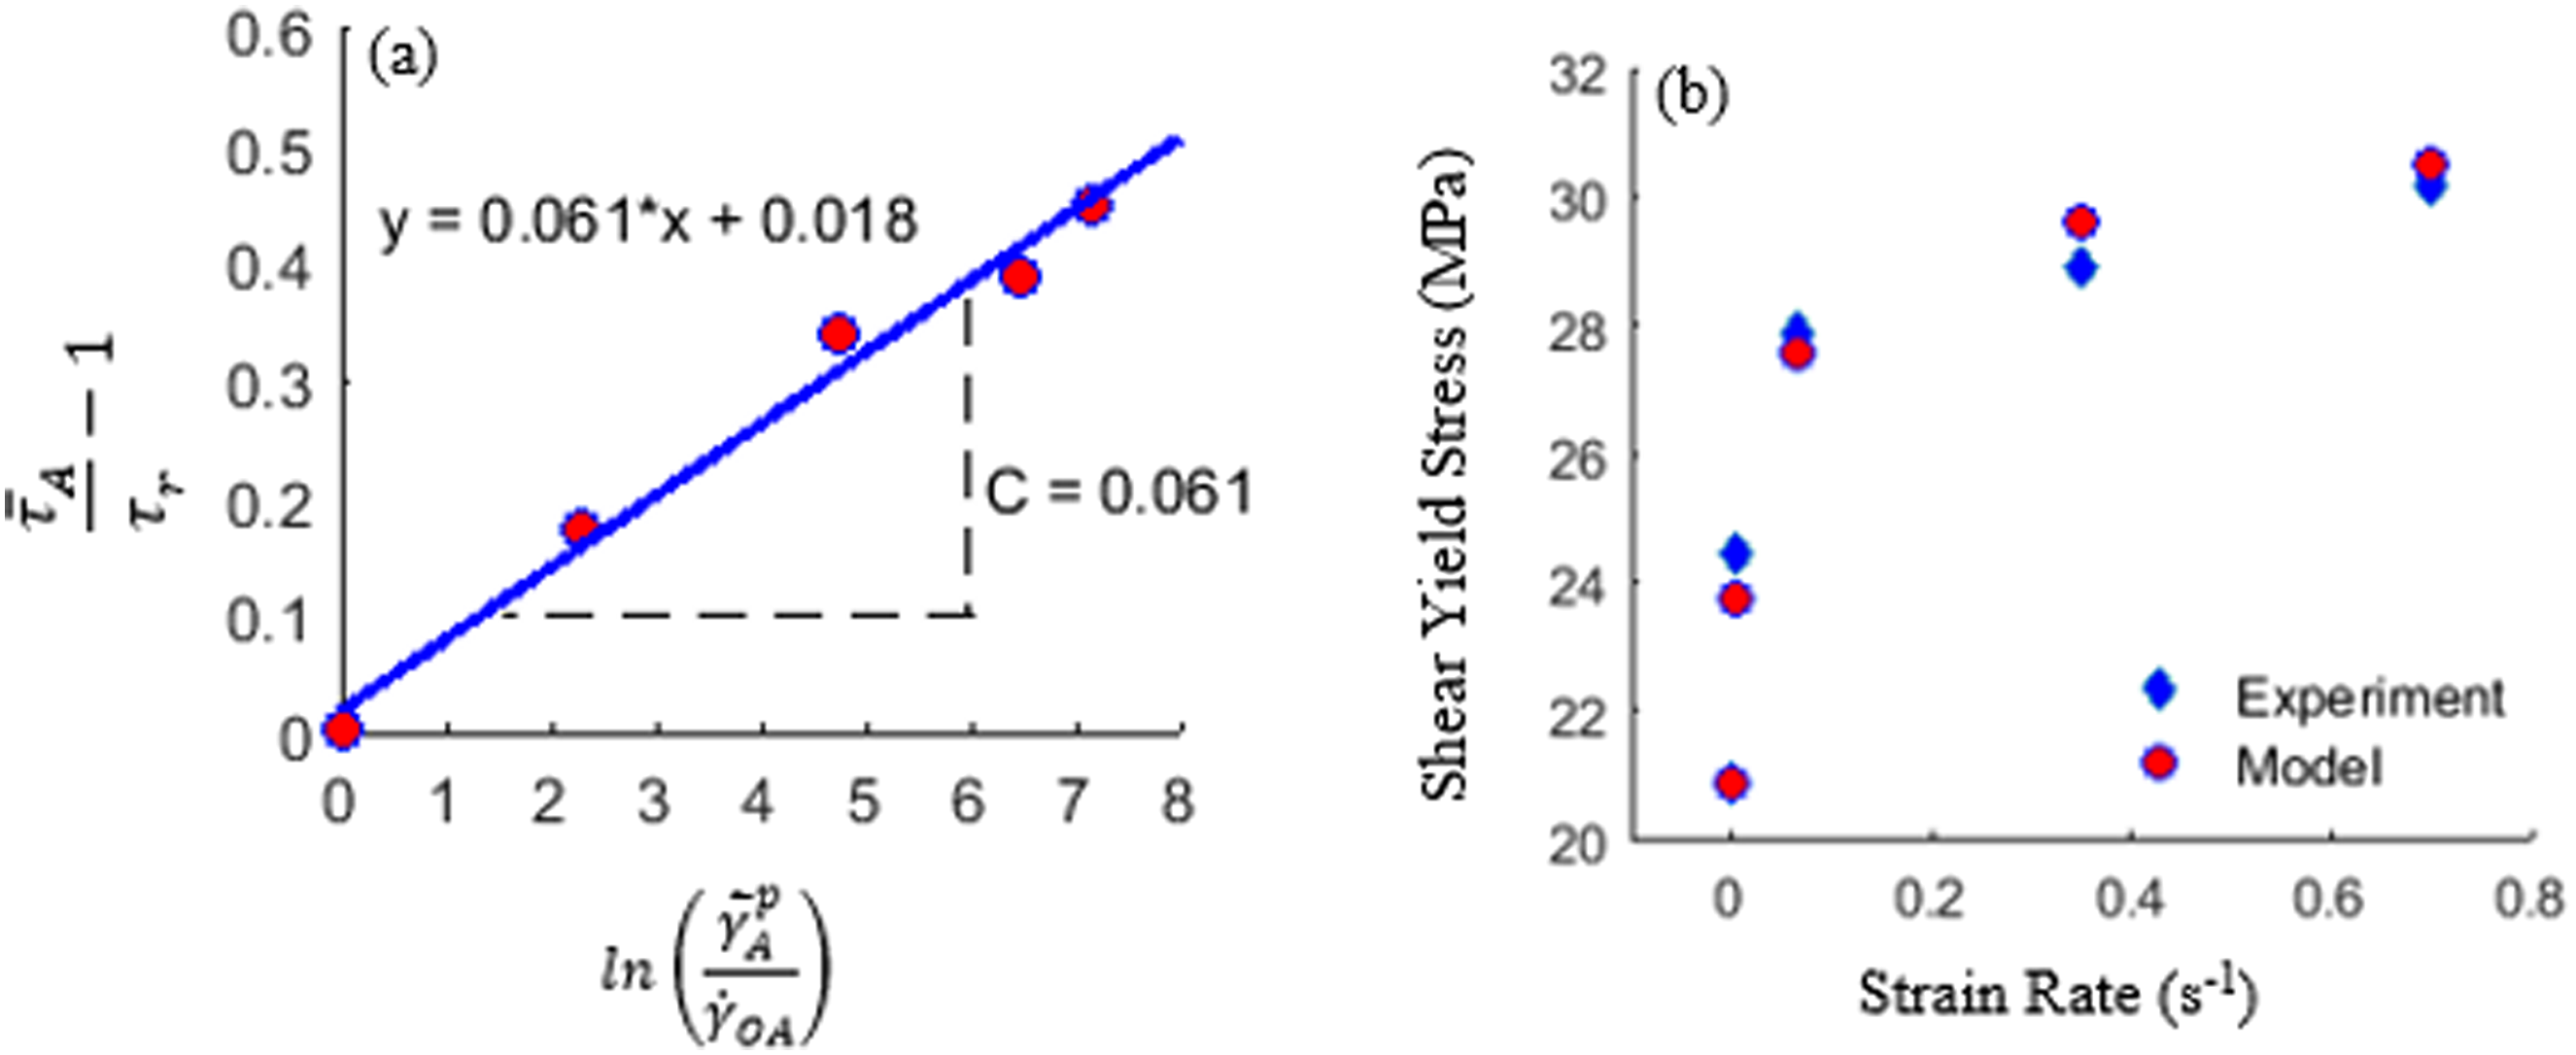
The comparative analysis of the parameter The strain rate sensitivity parameter values for the yield strength of ABS under various stress states.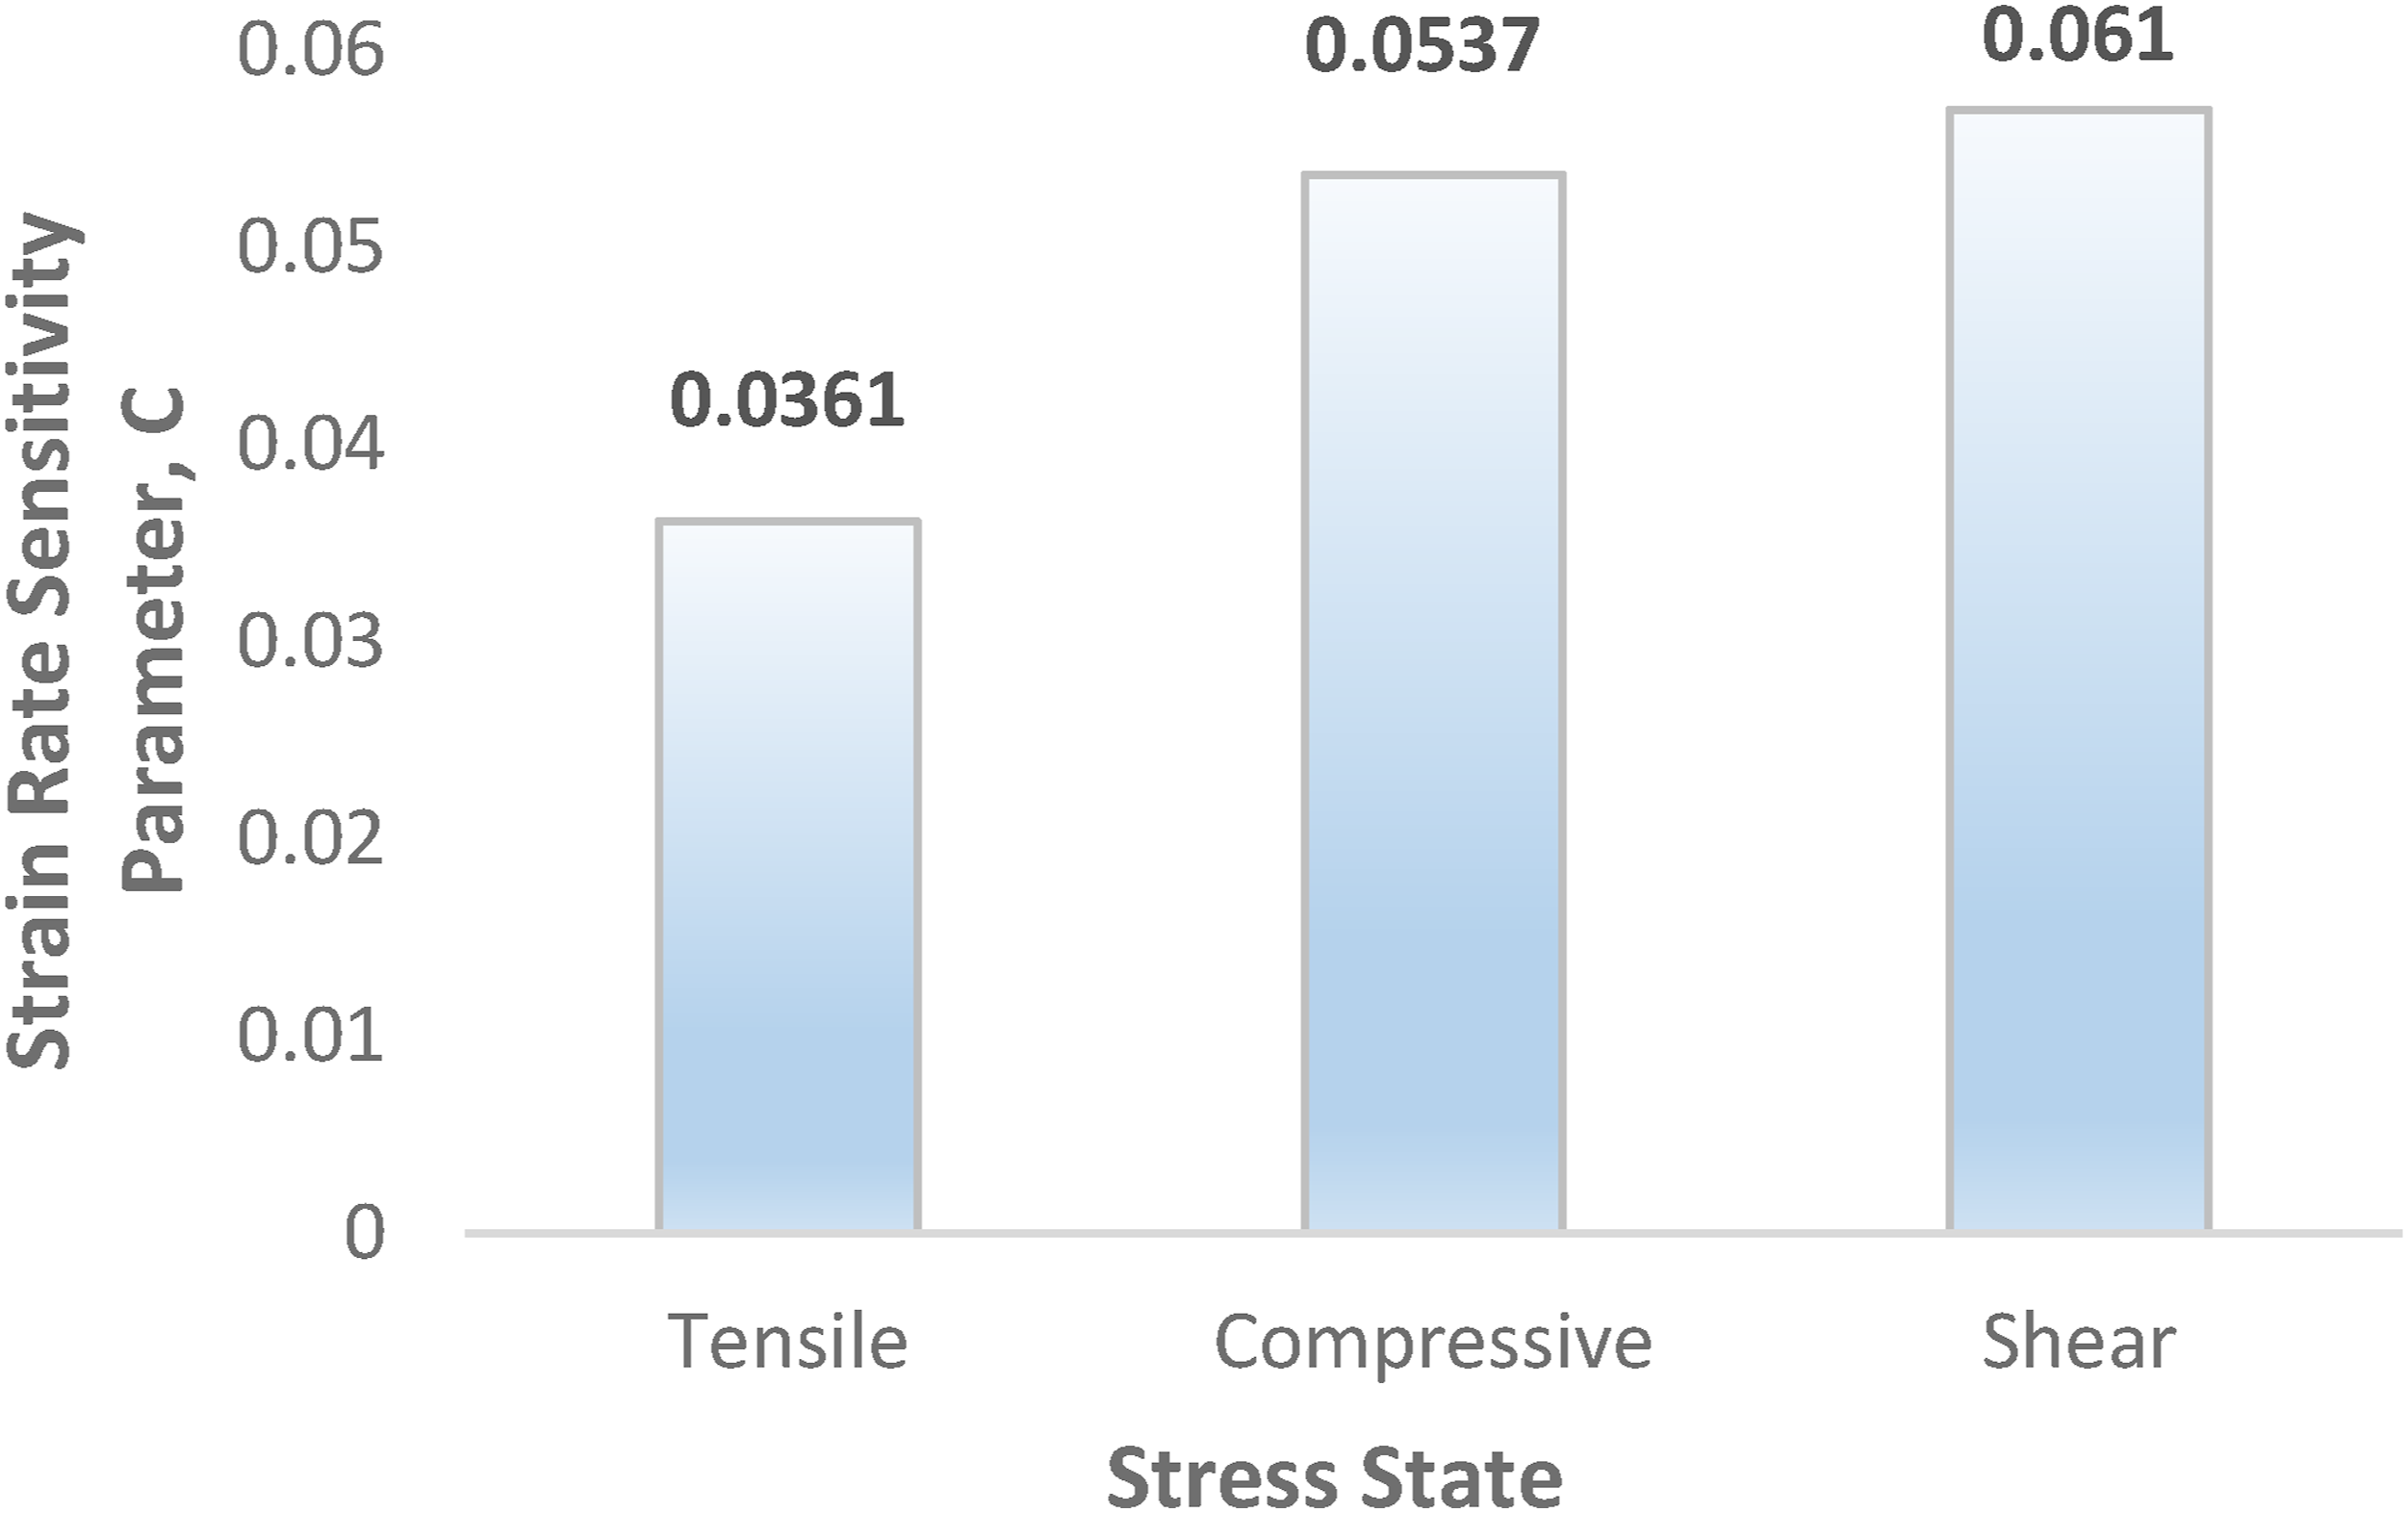
The strain rate sensitivity, which indicates the timescale necessary for the re-orientation of polymer chains, is a crucial material property profoundly impacting the initiation of localized deformation and damage.81,82 The strain sensitivity parameter is also an indicator of the material’s ability to exhibit alterations in its internal resistance under mechanical deformations. 83 This acknowledgement infers that ABS demonstrates heightened resistance to deformation under shear as the strain rate rises. Similar to the other amorphous polymers, strain localization/localized deformation occurs due to cavities/voids/crazes, 84 necking 85 and shear banding, 86 which take place during the deformation of ABS under tension.2,9,87 Specifically, cavitation, voids, and cracks solely occur in ABS under tensile loading.17,87,88 More importantly, these imperfections arise prior to the yield strength of ABS, diminishing its intrinsic response to tensile loads. This may explain why the tensile post-yield strength of ABS is less vulnerable to strain rate compared to other loading conditions.87,89 Studies have reported that the strain distributions in materials during compression tests are notably more uniform compared to tension tests.4,90 On the other side of the coin, the restriction posed by necking in tensile assessments can be circumvented by shear tests. Furthermore, assuming the cross-sectional area of a shear specimen remains constant during testing, the resulting deformation is generally more stable than in tensile loading.91,92 Moreover, the progression of damage is delayed due to the lower stress triaxiality inherent in shear loading conditions. 92 Thus, it can be claimed that the lack of void/cavitation/crazing phenomena in ABS’s damage mechanism under shear loading, as well as the postponement of damage growth due to lower triaxiality, may cause the shear yield strength of ABS to be more sensitive to the strain rate compared to its tensile and compressive counterparts.
Following the prior research,
4
the parameter (a) Plastic stress-strain response of ABS under different stress states at the same strain rate,
1
(b) hydrostatic pressure sensitivity parameter change with plastic strain.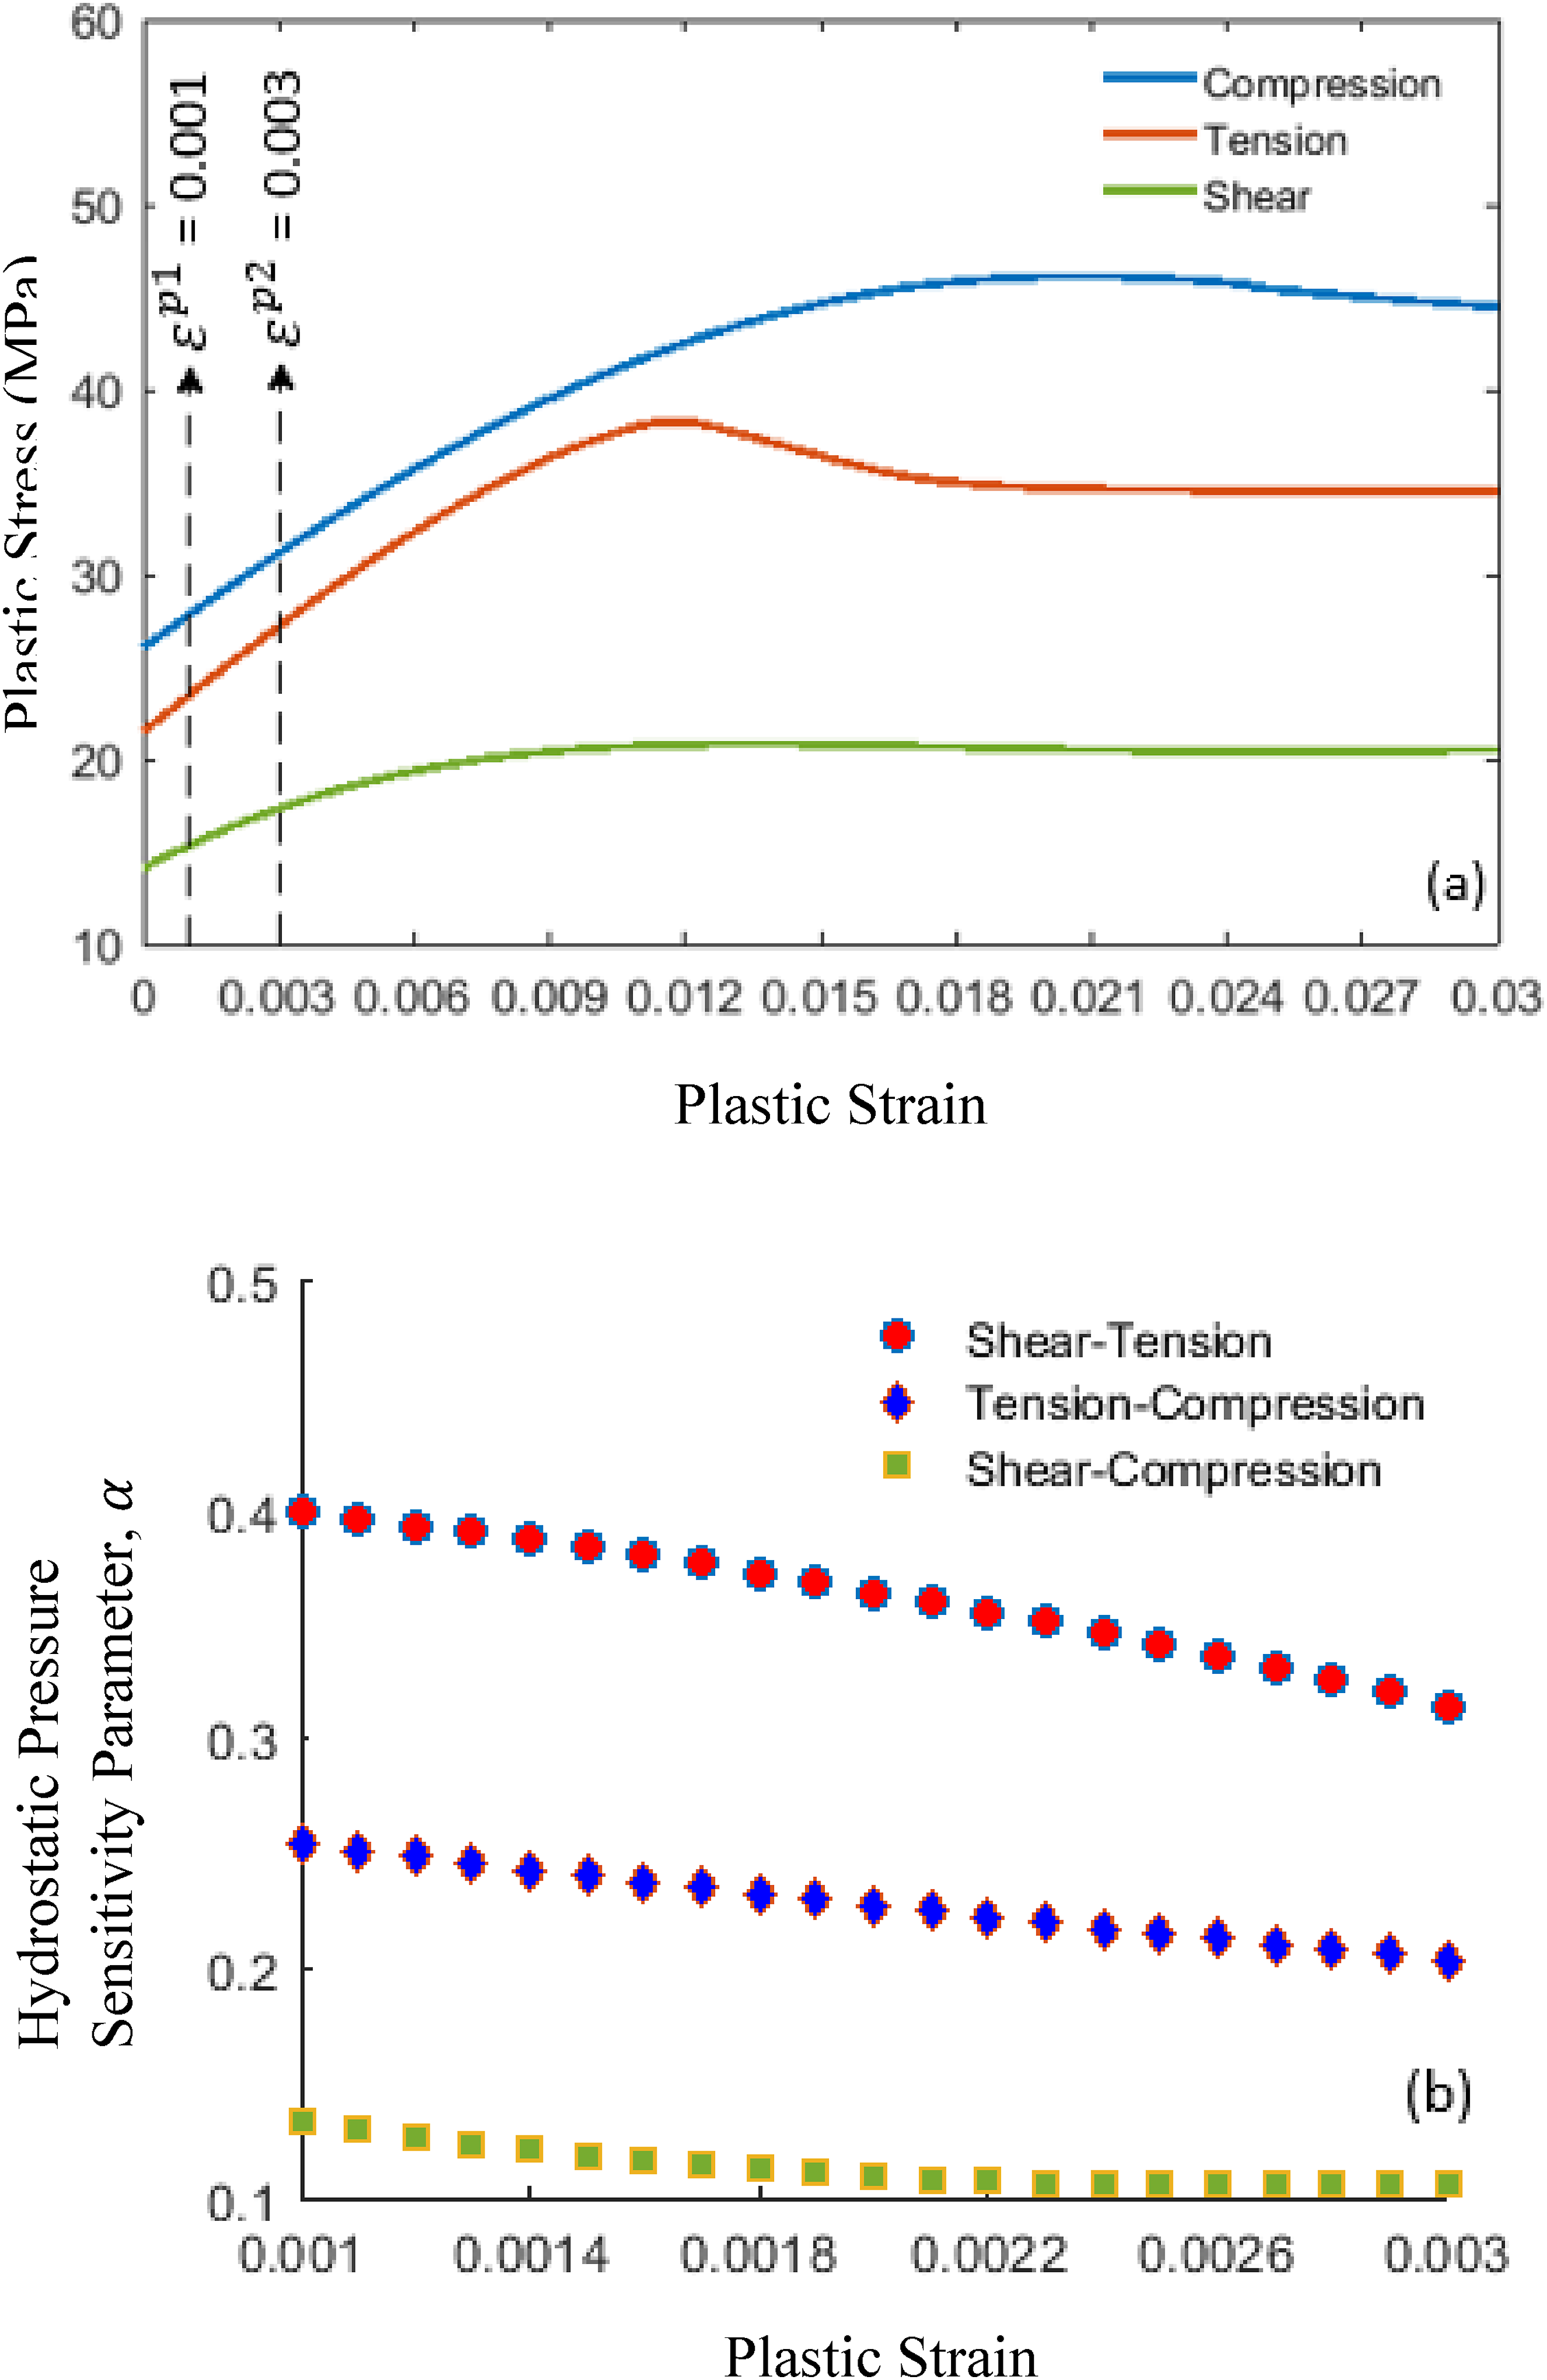
Due to the diverse shapes of the stress-strain curves of ABS as shown in Figure 9(a), the determination of the hydrostatic pressure sensitivity parameter is directly dependent on the specific plastic strain at which stresses are chosen.1,4 Instead of considering stress values at a particular plastic strain, a plastic strain range bounded by
As seen in Figure 9(b), not only are the selected stress pairs a considerable influence, but also plastic strain significantly affects the parameter
In essence, among the considered stress data pairs, the shear-tension stress pair emerges as one of the most suitable choices for determining the parameter The hydrostatic pressure sensitivity parameter 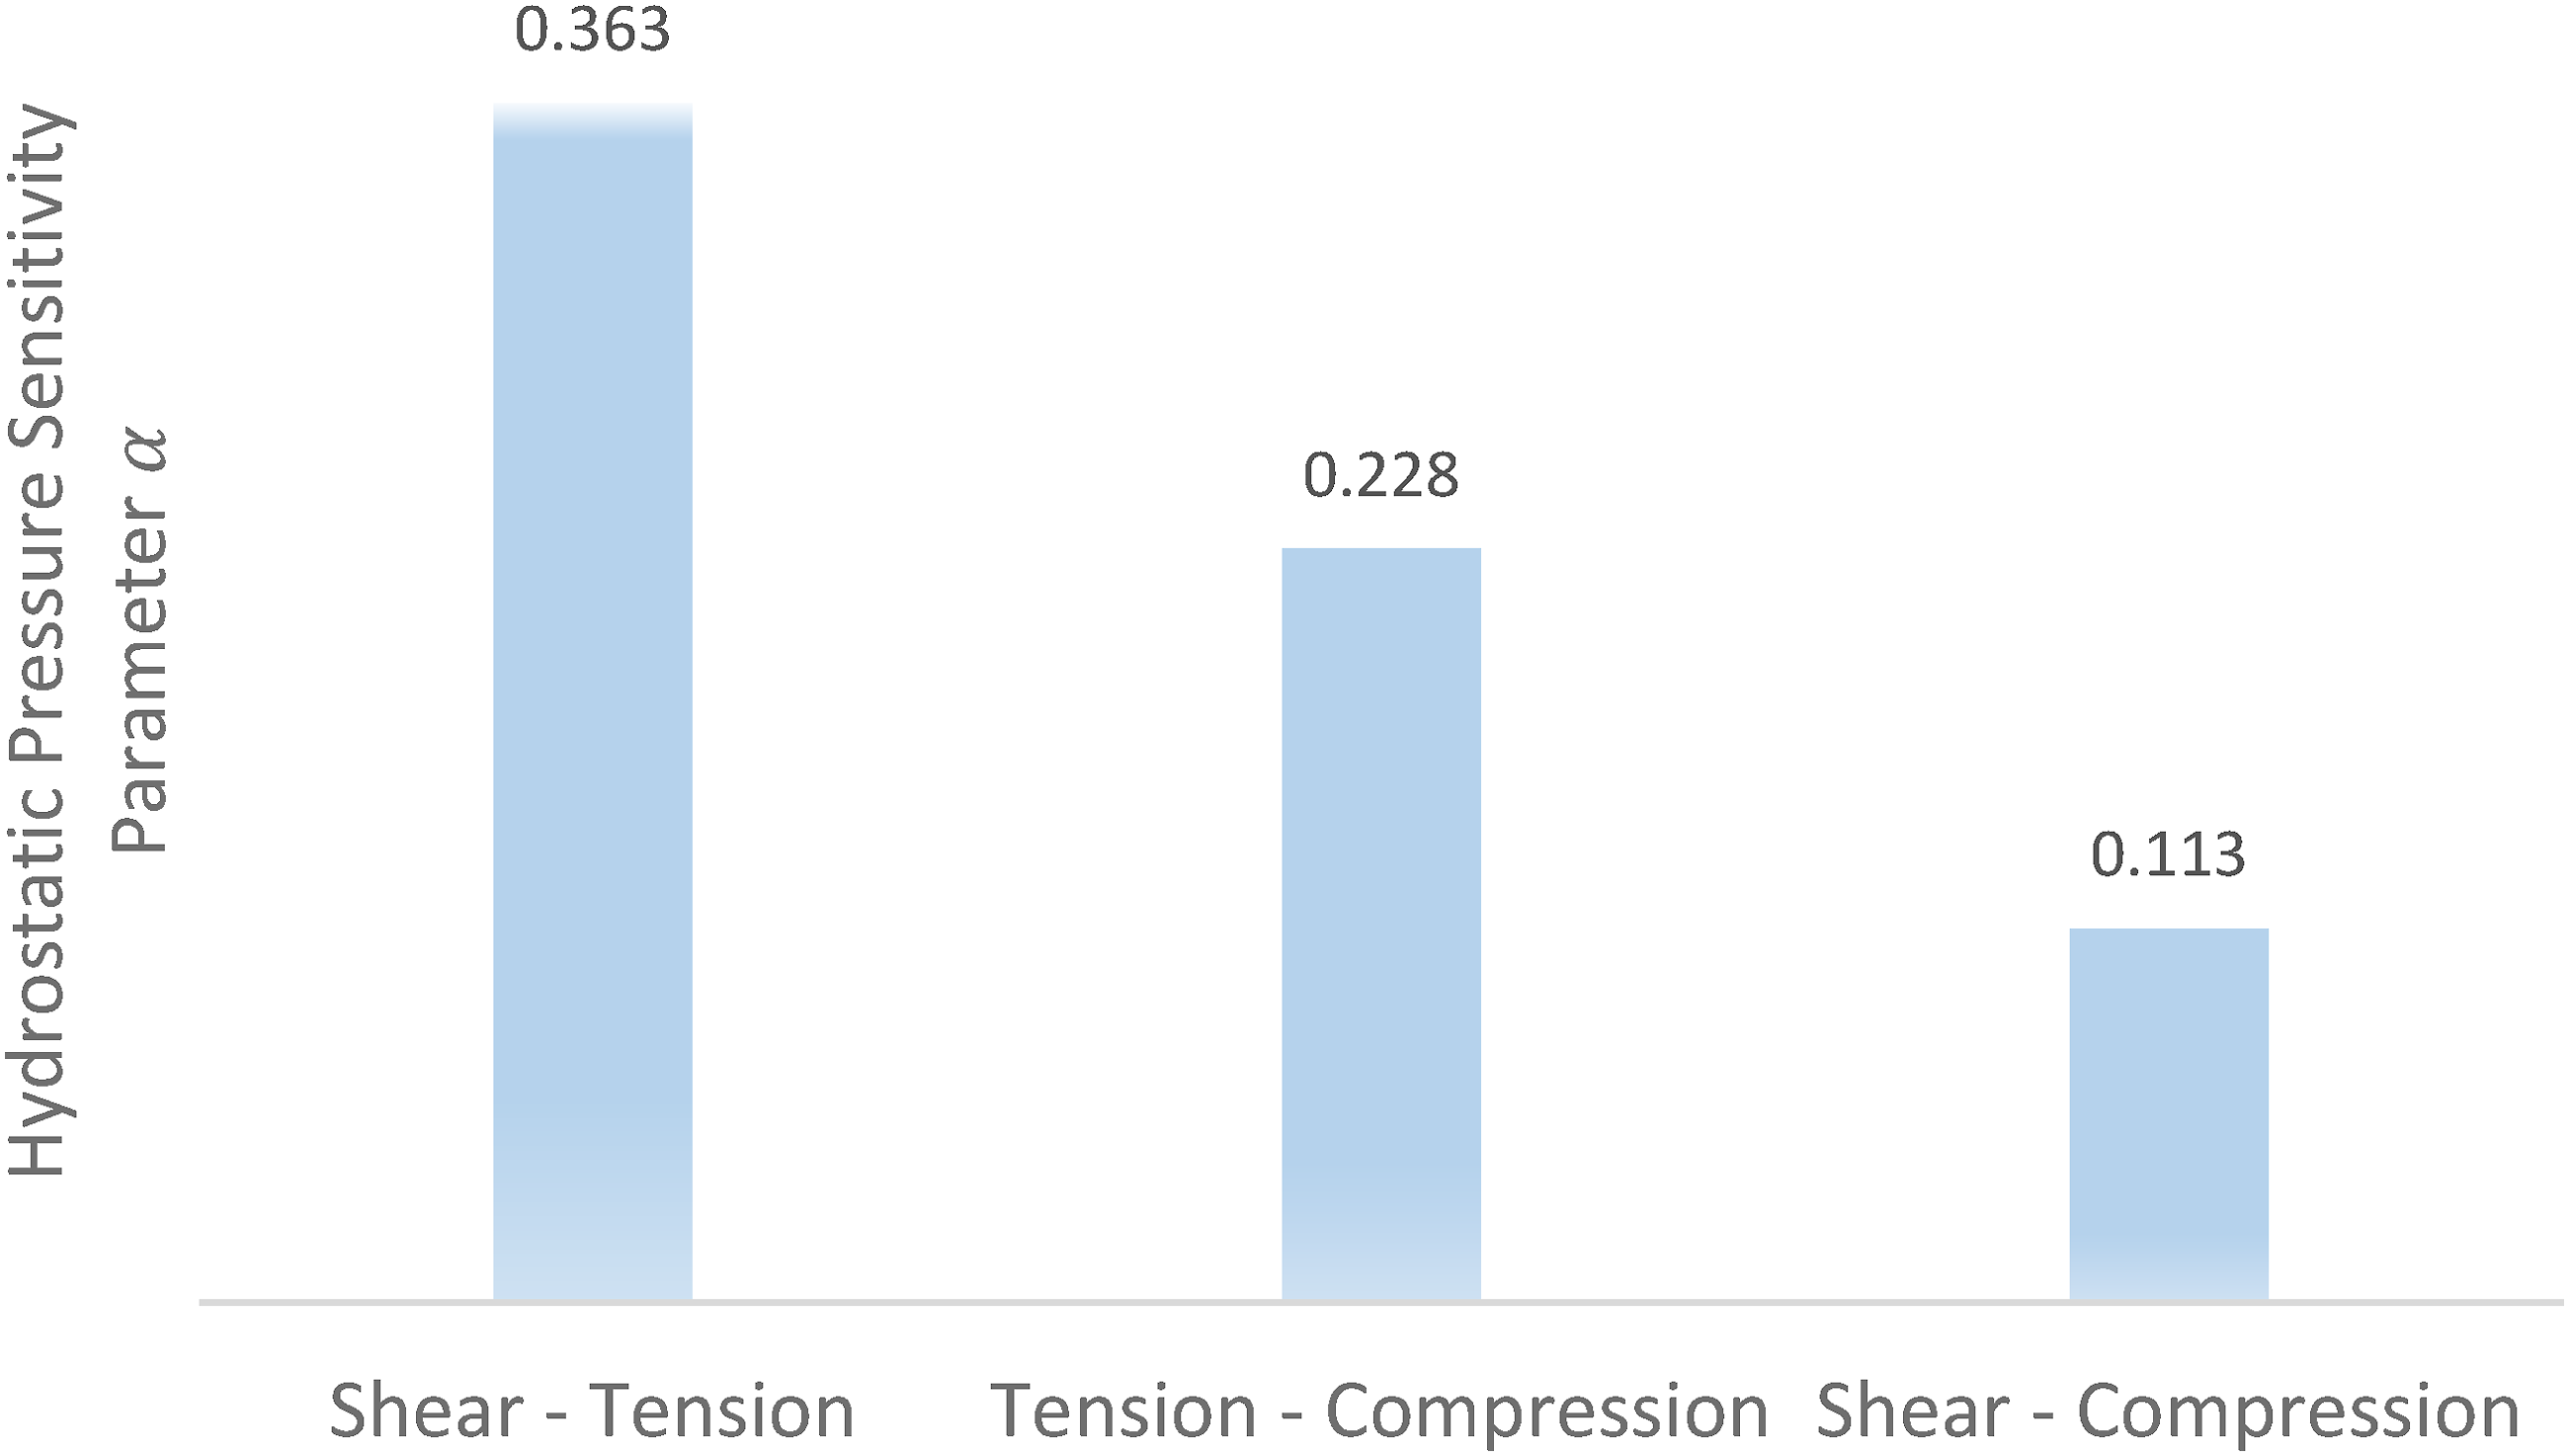
Finite element results
Results in Figure 11 provide a comparative analysis of the shear strain fields observed in the specimens at two different strain rates during the shear tests. As evident from Figure 11, the finite element analysis incorporating three distinct non-linearity phenomena, including boundary contact, geometric, and material, successfully predicts the experimentally measured strain fields. However, the strain distribution between the notches is observed to be non-uniform due to the stress concentration induced by the nature of the notch tips.
48
Beyond the impact of stress concentration on the distributions of shear strain and shear stress, stress whitening, indicative of cavity nucleation, has been observed in the sheared sections of the specimens regardless of the strain rate, as illustrated in Figure 5. The presence of cavities signifies the generation of a tensile component in the specimens during the shear tests.
50
Notably, the occurrence of these imperfections can result in a volume change in the specimens during the shear tests. Comparison of the measured strain fields with the numerical predictions for various strain rates, (a) 5.5 × 10⁻³ s−1, and (b) 7 × 10⁻¹ s−1.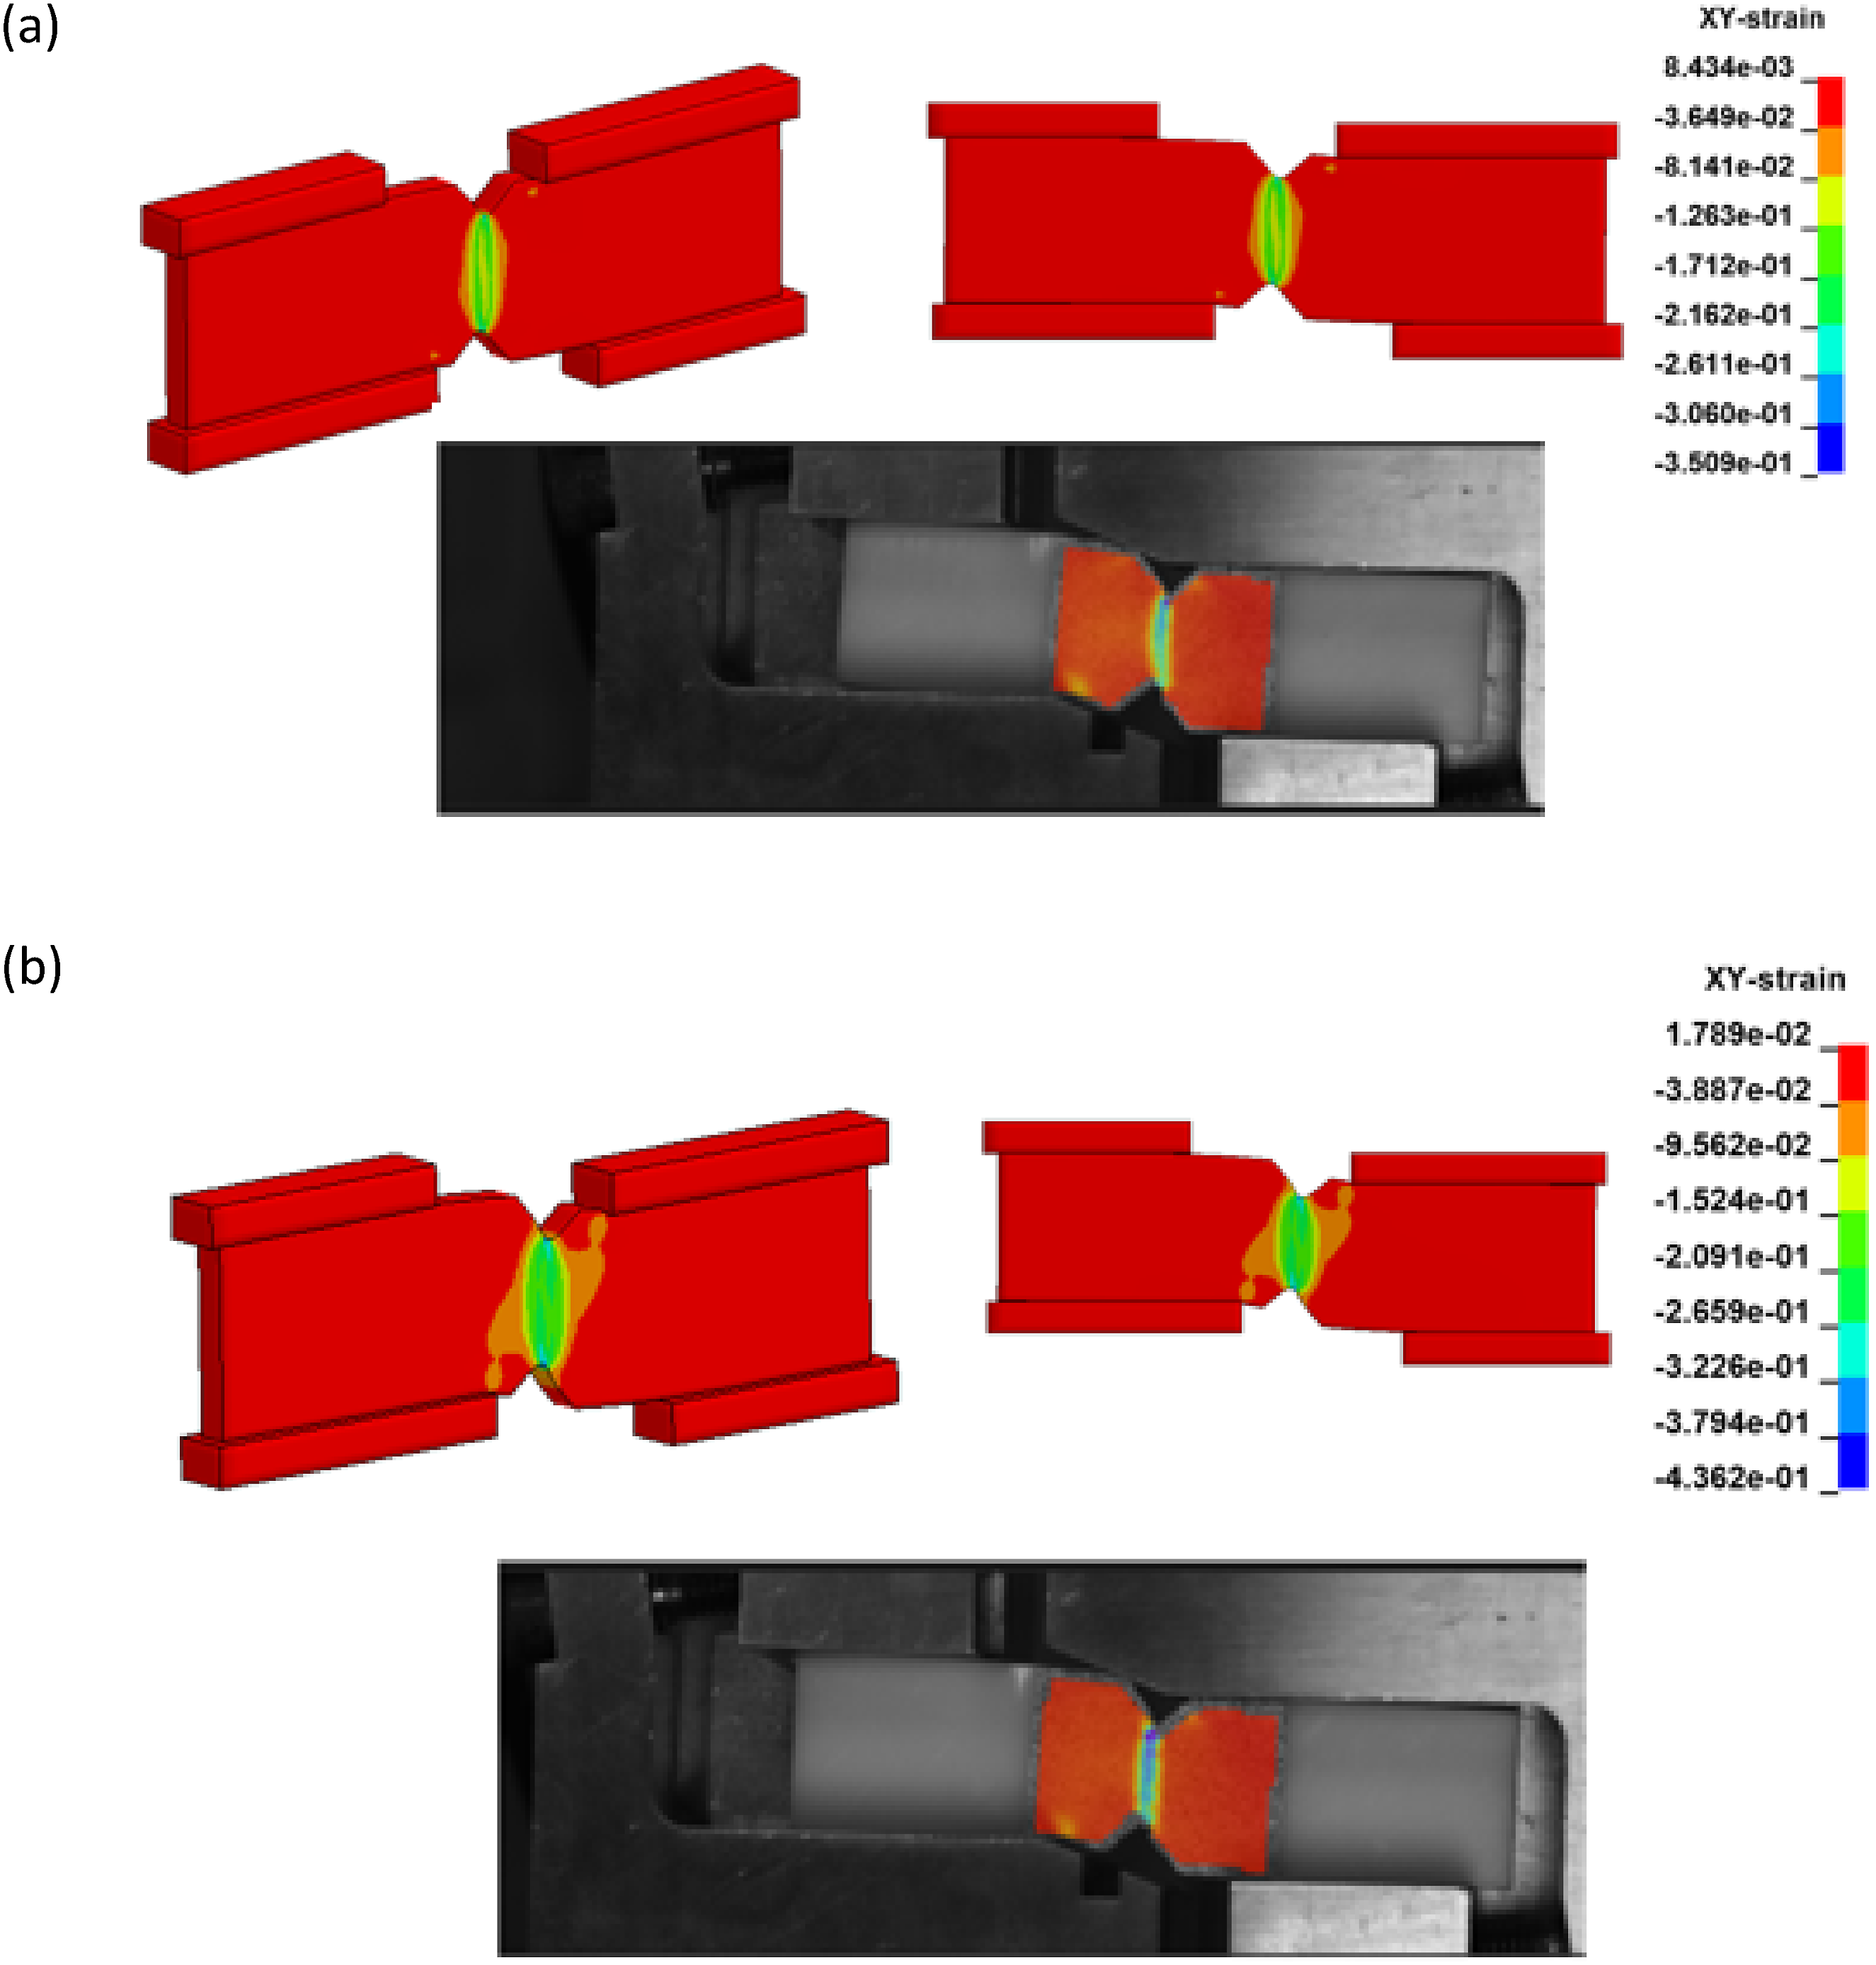
Following the methodology outlined in the literature,
50
this study conducted shear strain measurements by averaging central strains over a circular region with a radius equivalent to 1%–2% of the distance between the notches. Shear stresses were also extracted from the finite element analyses following the same procedure. These suggest an assumption of uniform stress and strain distributions in the sheared sections of specimens. Thus, the comparison between the experimentally measured shear stress-strain response of ABS at two distinct strain rates and the numerical predictions is presented in Figure 12. Comparison of the measured shear stress-strain response of ABS with the numerical predictions for two different strain rates.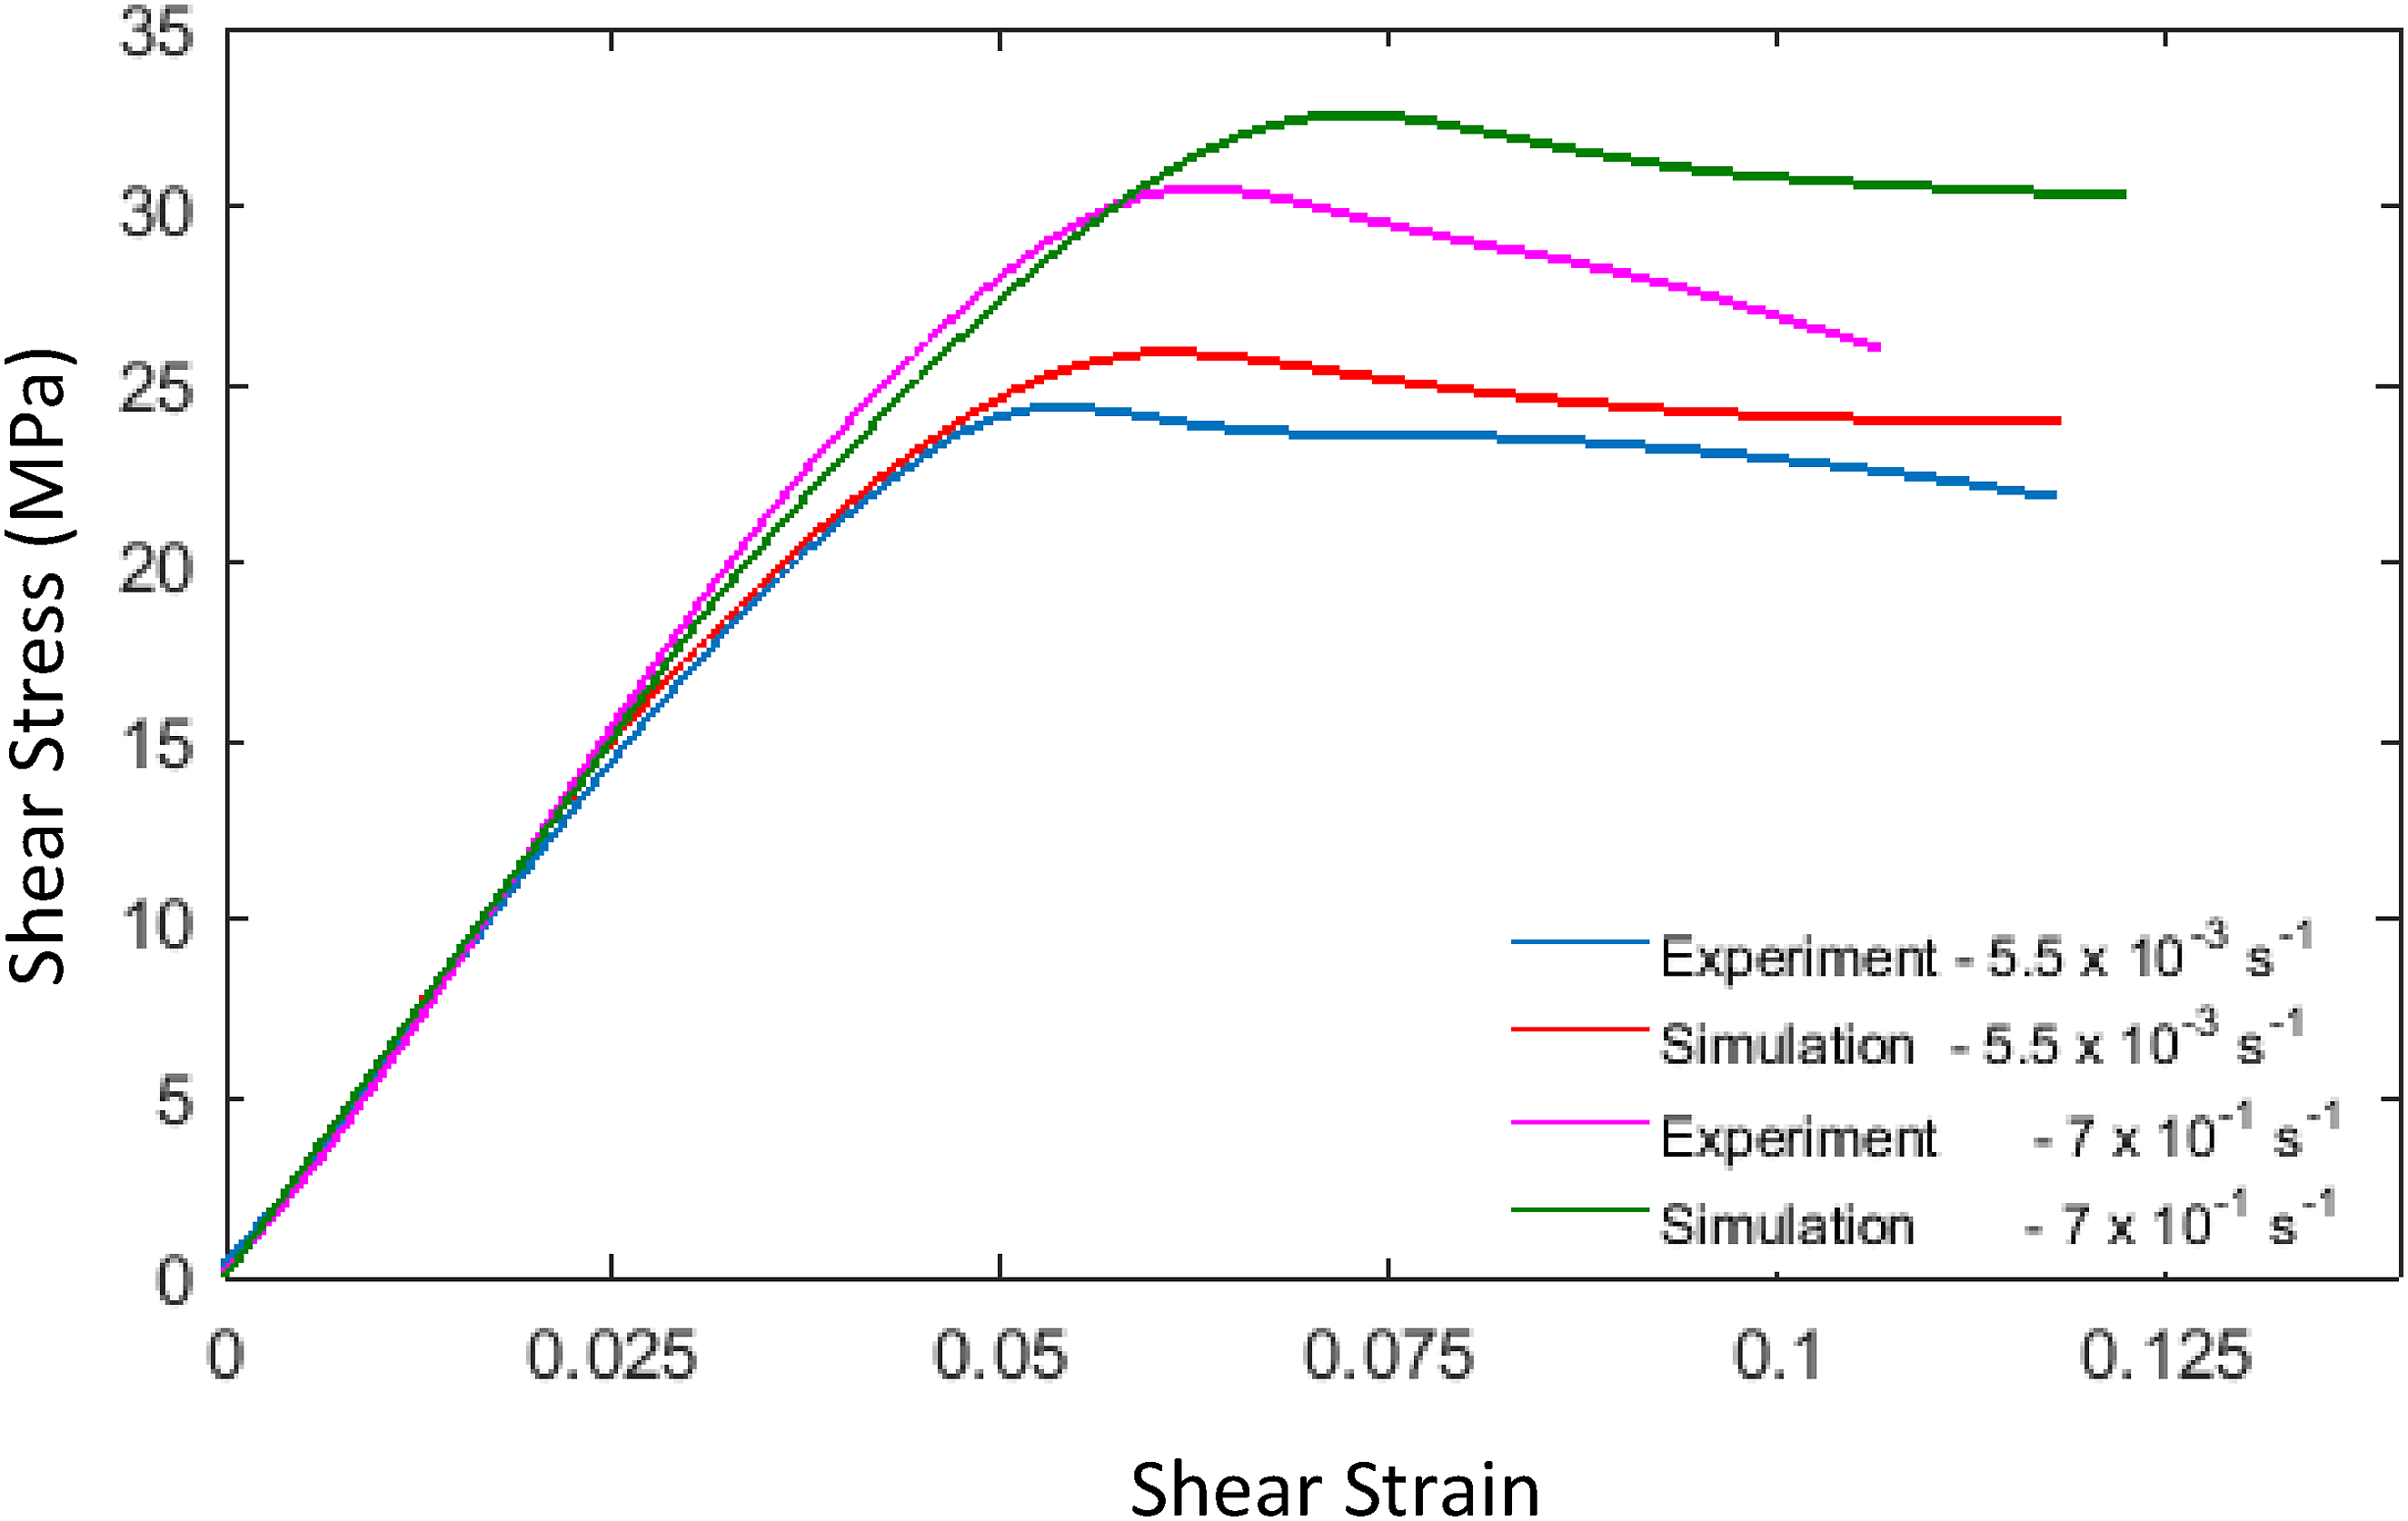
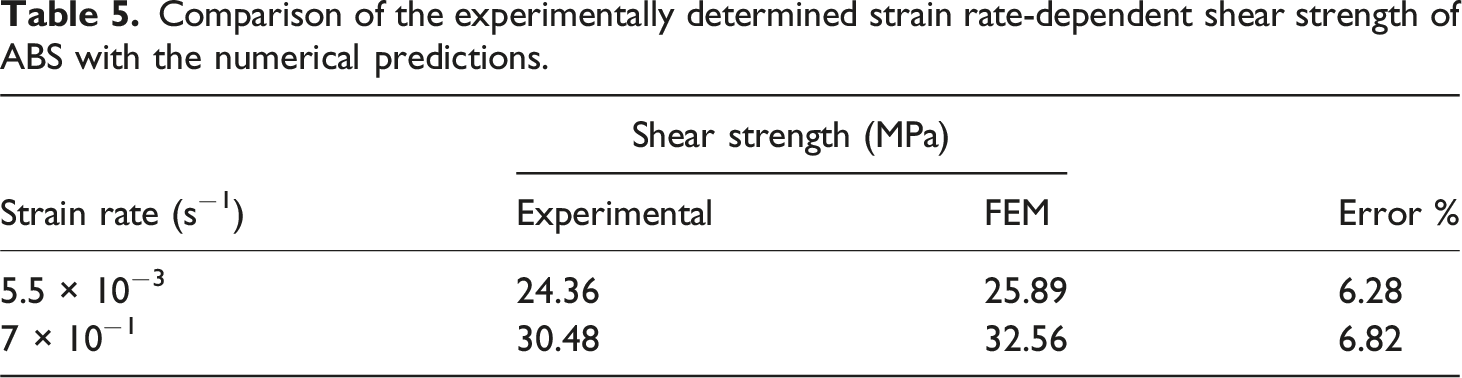
As can be seen in Figure 12, the numerical model, which incorporates geometric, material, and boundary contact nonlinearities, slightly overestimates the shear strength of ABS at two different strain rates. Additionally, the elastic-viscoplastic material model 33 used in the simulations satisfactorily reproduces the features of the shear stress-strain curve of ABS. These findings suggest that the strain rate-dependent material behavior of ABS under shear loads can be accurately specified using finite element analyses with a constitutive model developed by Anand-Gurtin, provided its elastic-plastic parameters are determined based on experimental results. However, as evident from Figure 12, the shear stress-strain curve of ABS at a low strain rate has been more accurately reproduced by the numerical analysis. This can be attributed to two main factors. First, increasing the strain rate leads to more damage accumulation and more pronounced stress whitening near the notch tips, as shown in Figure 5. Second, higher strain rates cause greater damage in ABS due to crushing. However, the material model used in the simulations does not take into account any damage parameters. Incorporating damage parameters of ABS, which can be determined from loading-unloading cyclic tension tests, into the simulations may provide deeper insight into the more pronounced stress reduction observed at high strain rates.
Comparison of the experimentally determined strain rate-dependent shear strength of ABS with the numerical predictions.
Concluding remarks
The experimental and numerical findings reveal several key insights into the strain rate-dependent shear yield behavior of ABS, as follows: • ABS’s shear yield strength is notably more strain rate-sensitive compared to its tensile and compressive yield strengths, significantly increasing with higher strain rates. • The compressive-to-shear yield strength ratio in ABS ranges from 2.17 to 2.33 across the strain rates considered in the study, with an average of 2.2 when strain rate effects are not considered. • Among various stress data pairs, shear-tension data emerges as the most suitable for determining the hydrostatic pressure sensitivity parameter • Finite element analyses, incorporating geometric, material, and boundary contact nonlinearities, accurately predict ABS’s strain rate-dependent shear yield behavior. The elastic-viscoplastic material model tailored for amorphous polymers effectively reproduces ABS’s shear stress-strain characteristics, although slight discrepancies in shear yield strength predictions were observed. • Discrepancies in shear yield strength predictions stem from the strain rate and hydrostatic pressure sensitivity parameters used in simulations. The strain rate sensitivity varies with different stress states, and current polymer models do not account for this variability, warranting further investigation. • The assumption of uniform stress and strain in the shear zones was challenged by the presence of notch effects and stress whitening, indicating tensile components in the shear zone. This suggests that the Wyoming version of the Iosipescu shear test introduces complexities in the stress distribution.
As a result, the study enhances the understanding of ABS’s mechanical behavior under shear loading at different strain rates, providing valuable insights for further research and applications.
Footnotes
Declaration of conflicting interests
The author(s) declared no potential conflicts of interest with respect to the research, authorship, and/or publication of this article.
Funding
The author(s) received no financial support for the research, authorship, and/or publication of this article.