
Abstract
Achieving precise temperature control during the heating process of carbon fibre-reinforced polypropylene thermoplastic composite (CF-PP) using electromagnetic induction heating is crucial for the consolidation effectiveness of the material. This paper begins by constructing a finite element microscopic model for induction heating that incorporates the actual fiber structure and matrix. It systematically analyzes the heating mechanism, temperature field distribution, and surface temperature hysteresis of CF-PP with different fiber weave structures during the heating process. Based on the observed temperature distribution and variation patterns during material heating, an improved particle swarm Fuzzy PID control method is proposed, which effectively reduces temperature overshoot and enhances the system’s resistance to disturbances. Experimental validation demonstrates the effectiveness of this algorithm for controlling the temperature of CF-PP plates during the induction heating process. This research offers an effective control strategy and research approach to enhance the accuracy of temperature control during the CF-PP induction heating process, contributing to improved outcomes in the field.
Keywords
Introduction
Due to the excellent physical and chemical properties of carbon fiber-reinforced polymers (CF-PP),1,2 there has been a growing demand for their use in various fields such as pressure vessels, automotive, aerospace, and rail transportation, leading to increasingly stringent requirements for the consolidation and shaping of CF-PP.3,4 The conventional method of consolidation CF-PP primarily relies on the conduction of heat from the surface to the interior through air thermal convection, thermal radiation, and thermal contact, resulting in noticeable energy wastage. Scholars are exploring a clean and efficient electromagnetic induction as an alternative heating method for CF-PP consolidation.5–8 However, the anisotropy of CF-PP properties, the mixed structure of fibers ands, the laminated structure, and the multi-field coupling during the heating process collectively influence the temperature distribution and heating effects of CF-PP induction heating.9,10 This complex interplay of multiple factors during the induction heating process poses a challenge to the precise temperature control of CF-PP, thereby emphasizing the need to enhance the temperature control precision during the heating process as a prerequisite for integrating induction heating technology with CF-PP consolidation and shaping.
In order to investigate the temperature field variations and achieve precise control of CF-PP through electromagnetic induction, scholars have conducted extensive research on the analysis of CF-PP temperature fields and heating control methods.11–13 For example, Fu Tianyu and his colleagues 14 proposed a finite element microscopic model, enabling independent analysis of the temperature field variations in the fiber structure and matrix during the induction heating process. Du J and his team 15 designed a fuzzy PID temperature controller based on the induction heating crucible, which exhibited faster response rates and higher stability compared to typical PID controllers. Chang C J and his group 16 developed a self-calibration module, and they simulated the control capabilities of the self-calibrating fuzzy logic controller through finite element analysis, verifying its effectiveness in an induction heating system. Despite these achievements in temperature control strategies during induction heating, there is a lack of relevant research in the field of CF-PP induction heating.
Due to the encapsulation of fiber structures within the matrix in CF-PP and the complex layered structure of composite materials, along with the heat generated within the material during the induction heating process, heat conduction between the layers results in temperature differences between the interior and surface of the material. Moreover, the inherent lag in the temperature control system further exacerbates the challenges in controlling the heating process of CF-PP. Therefore, in this study, to characterize the distribution of temperature fields in CF-PP during the induction heating process and provide a more intuitive representation of the changing temperature within the material, a combined approach of finite element macro-micro models was employed for temperature field analysis. Furthermore, an improved particle swarm PID control algorithm was proposed to achieve adaptive parameter control during the induction heating process.
First, based on the equivalent electromagnetic-thermal characteristics of CF-PP, a multi-physics finite element microscopic analysis model for electromagnetic-thermal coupling in CF-PP induction heating was established. This model independently represents the geometric bodies of the fiber structure and the matrix. The fiber structure is encapsulated within the matrix, allowing it to reflect the conduction of temperature from the fiber structure to the surface during the heating process. Subsequently, through a finite element macro model, a multi-layer CF-PP structure was established to simulate the heat conduction between the material layers during the induction heating process, ultimately revealing the temperature field variations within the material. Furthermore, an improved particle swarm Fuzzy PID (IPF-PID) control strategy was developed, incorporating inertia weight parameters to reduce the overshoot of the temperature curve during the heating process. This improvement enhanced the accuracy of CF-PP temperature control during induction heating. Finally, the effectiveness of this control strategy in CF-PP induction heating temperature control was validated through experiments.
Analysis of temperature field changes during CF-PP induction heating process
CF-PP induction heating theoretical model
During the induction heating process, the heat generated in the CF-PP pre-preg layer structure primarily relies on the Joule heating produced by the eddy currents generated within it flowing along closed loops, as illustrated in Figure 1. It can be observed that the internal heat sources in CF-PP during induction heating consist of resistive heating, capacitive heating, and resistive-capacitive heating. Previous research by scholars has shown that the majority of the Joule heating generated within the material is due to resistive heating resulting from the contact resistance between fiber bundles and the axial self-resistance of the fibers themselves.
17
Therefore, in the model development in this paper, the capacitive heating characteristics of the material were not considered. Circuit conduction between CF-PP induction heating fibers.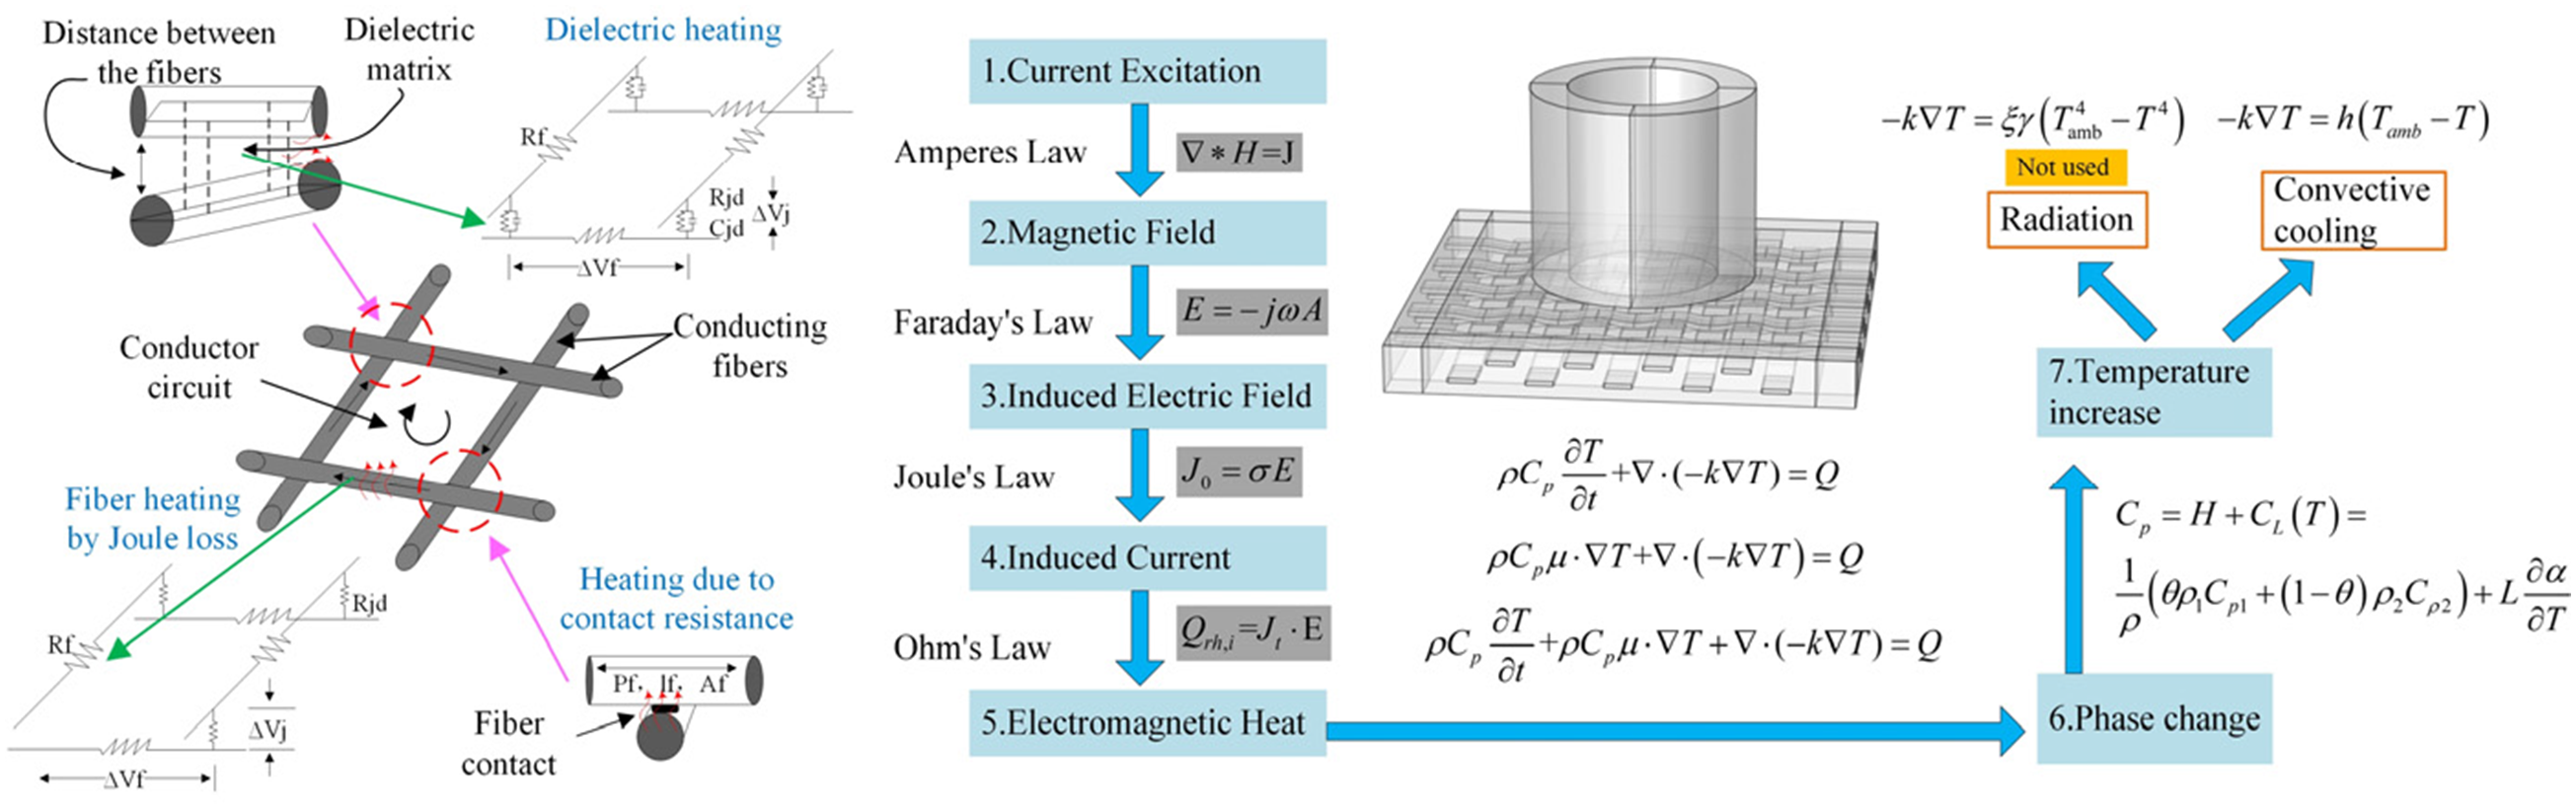
The changing magnetic flux can induce an induced electric field E (V/m) in the carbon fiber, which can be expressed in the form of frequency by Faraday’s law as:

The total current generated in the carbon fiber is composed of a conduction current

Substituting the constitutive relationship

The heating of composite materials mainly comes from Ohm’s law, and the heat is the Joule heat generated in the resistance of the carbon fiber filaments. The heat source Qrh (W/m3) can be expressed as:

The heat generated by the induced current in the fiber bundle is transferred to the surrounding fiber bundle, and the external environment. The heat conduction of the fiber part can be expressed by the Fourier heat conduction law:

Since epoxy is a phase change material, exothermic phenomenon occurs during the consolidation process. The heat conduction formula when phase change occurs in the is:

Establishment of finite element model analysis type
This study focuses on CF-PP. Figure 2 illustrates the process of creating a three-dimensional geometric model of CF-PP. Initially, the end surface geometry of the carbon fiber bundle is established. A cubic Bézier curve is then created based on the flatness of the fiber bundle, and sweeping is used to obtain the geometric shape of the fiber bundle. After arranging the fiber bundles along the width direction, alternate bundles are mirrored and rotated along the width to form the geometric model of the carbon fiber texture. The bundles are overlapped to enhance the flow of eddy currents within the fiber texture. The carbon fiber bundles in the geometric model are overlapped, and the polypropylene matrix is combined with the carbon fiber texture model to create a plain woven carbon fiber composite. The dimensions of the fiber bundle model are a width of 5.5 mm, a thickness of 1.2 mm, and a protrusion height of 0.9 mm, with width-to-thickness-to-protrusion ratio of 6:1.3:1. Geometric model of induction heated plain weave CF-PP flat plate.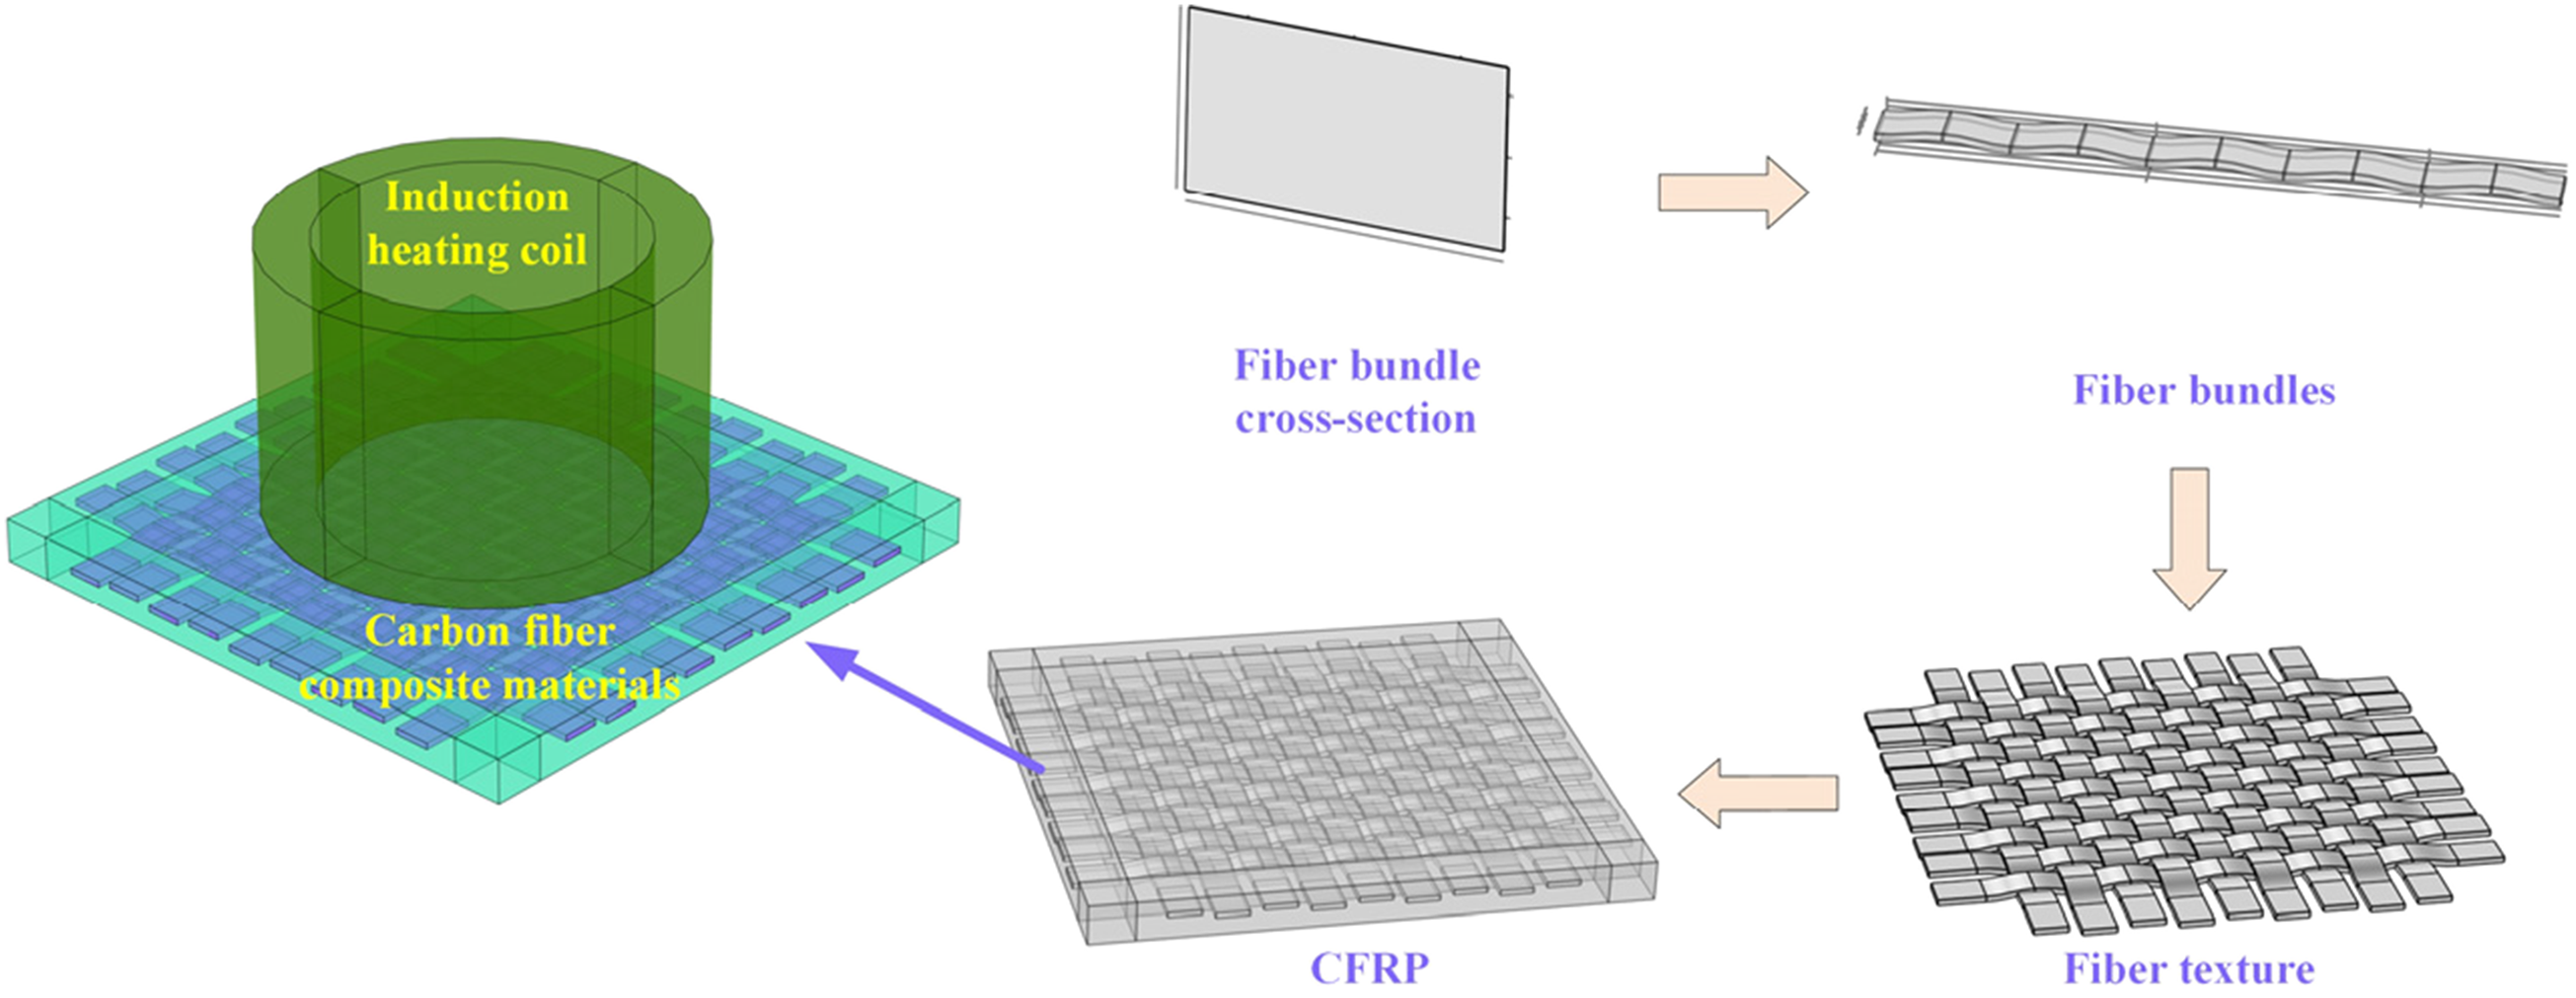
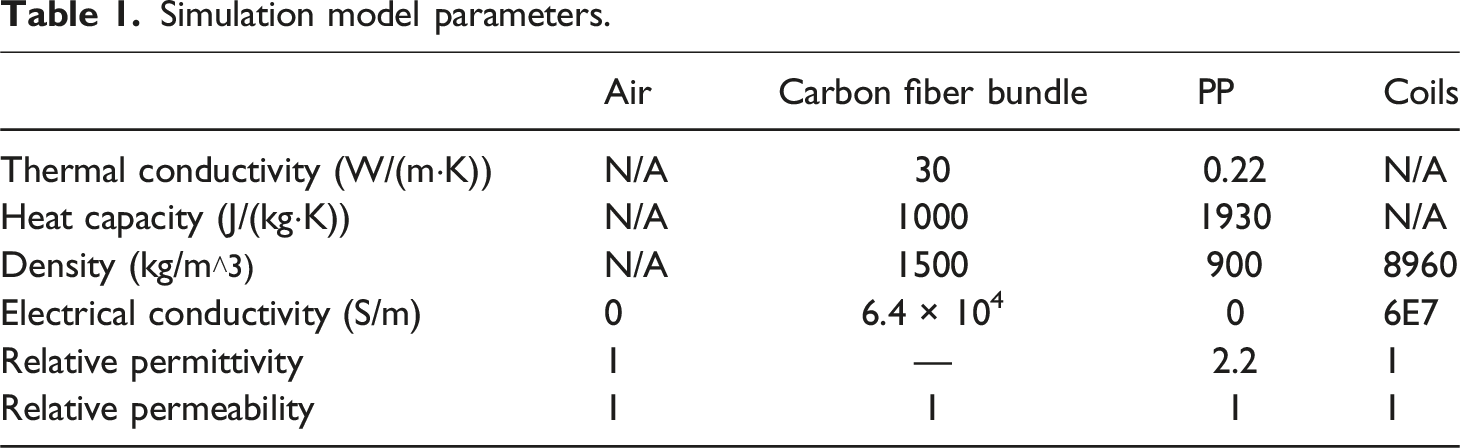
Simulation model parameters.
Analysis of temperature field changes during CF-PP induction heating process
Figure 3 illustrates the temperature field distribution within CF-PP during the initial stages of induction heating. It shows the temperature changes in the fiber structure within the material and the surface of the matrix. During the heating process, it is evident that the fiber structure, serving as the heat source, exhibits a very rapid response to temperature changes. After just 1 s of heating, there is a noticeable circular temperature field increase in the region corresponding to the coil, with a temperature rise of approximately 5.2°C. This observation indicates that CF-PP responds quickly and has a high heating efficiency with induction heating. However, heat transfer from the fiber structure to the material’s surface occurs through the matrix as an intermediary. Due to the lower thermal conductivity of the matrix, the surface temperature of CF-PP at this point is only about 20.4°C. This temperature difference between the surface and the fiber structure demonstrates a certain degree of lag in the surface temperature compared to the fiber structure during the heating process. Therefore, when using induction heating to raise the temperature and cure CF-PP, it is essential to consider the issue of temperature lag in the material’s surface relative to the fiber structure. Addressing this lag is necessary to enhance the accuracy of temperature control during the heating process. Temperature field distribution of fiber texture and matrix surface.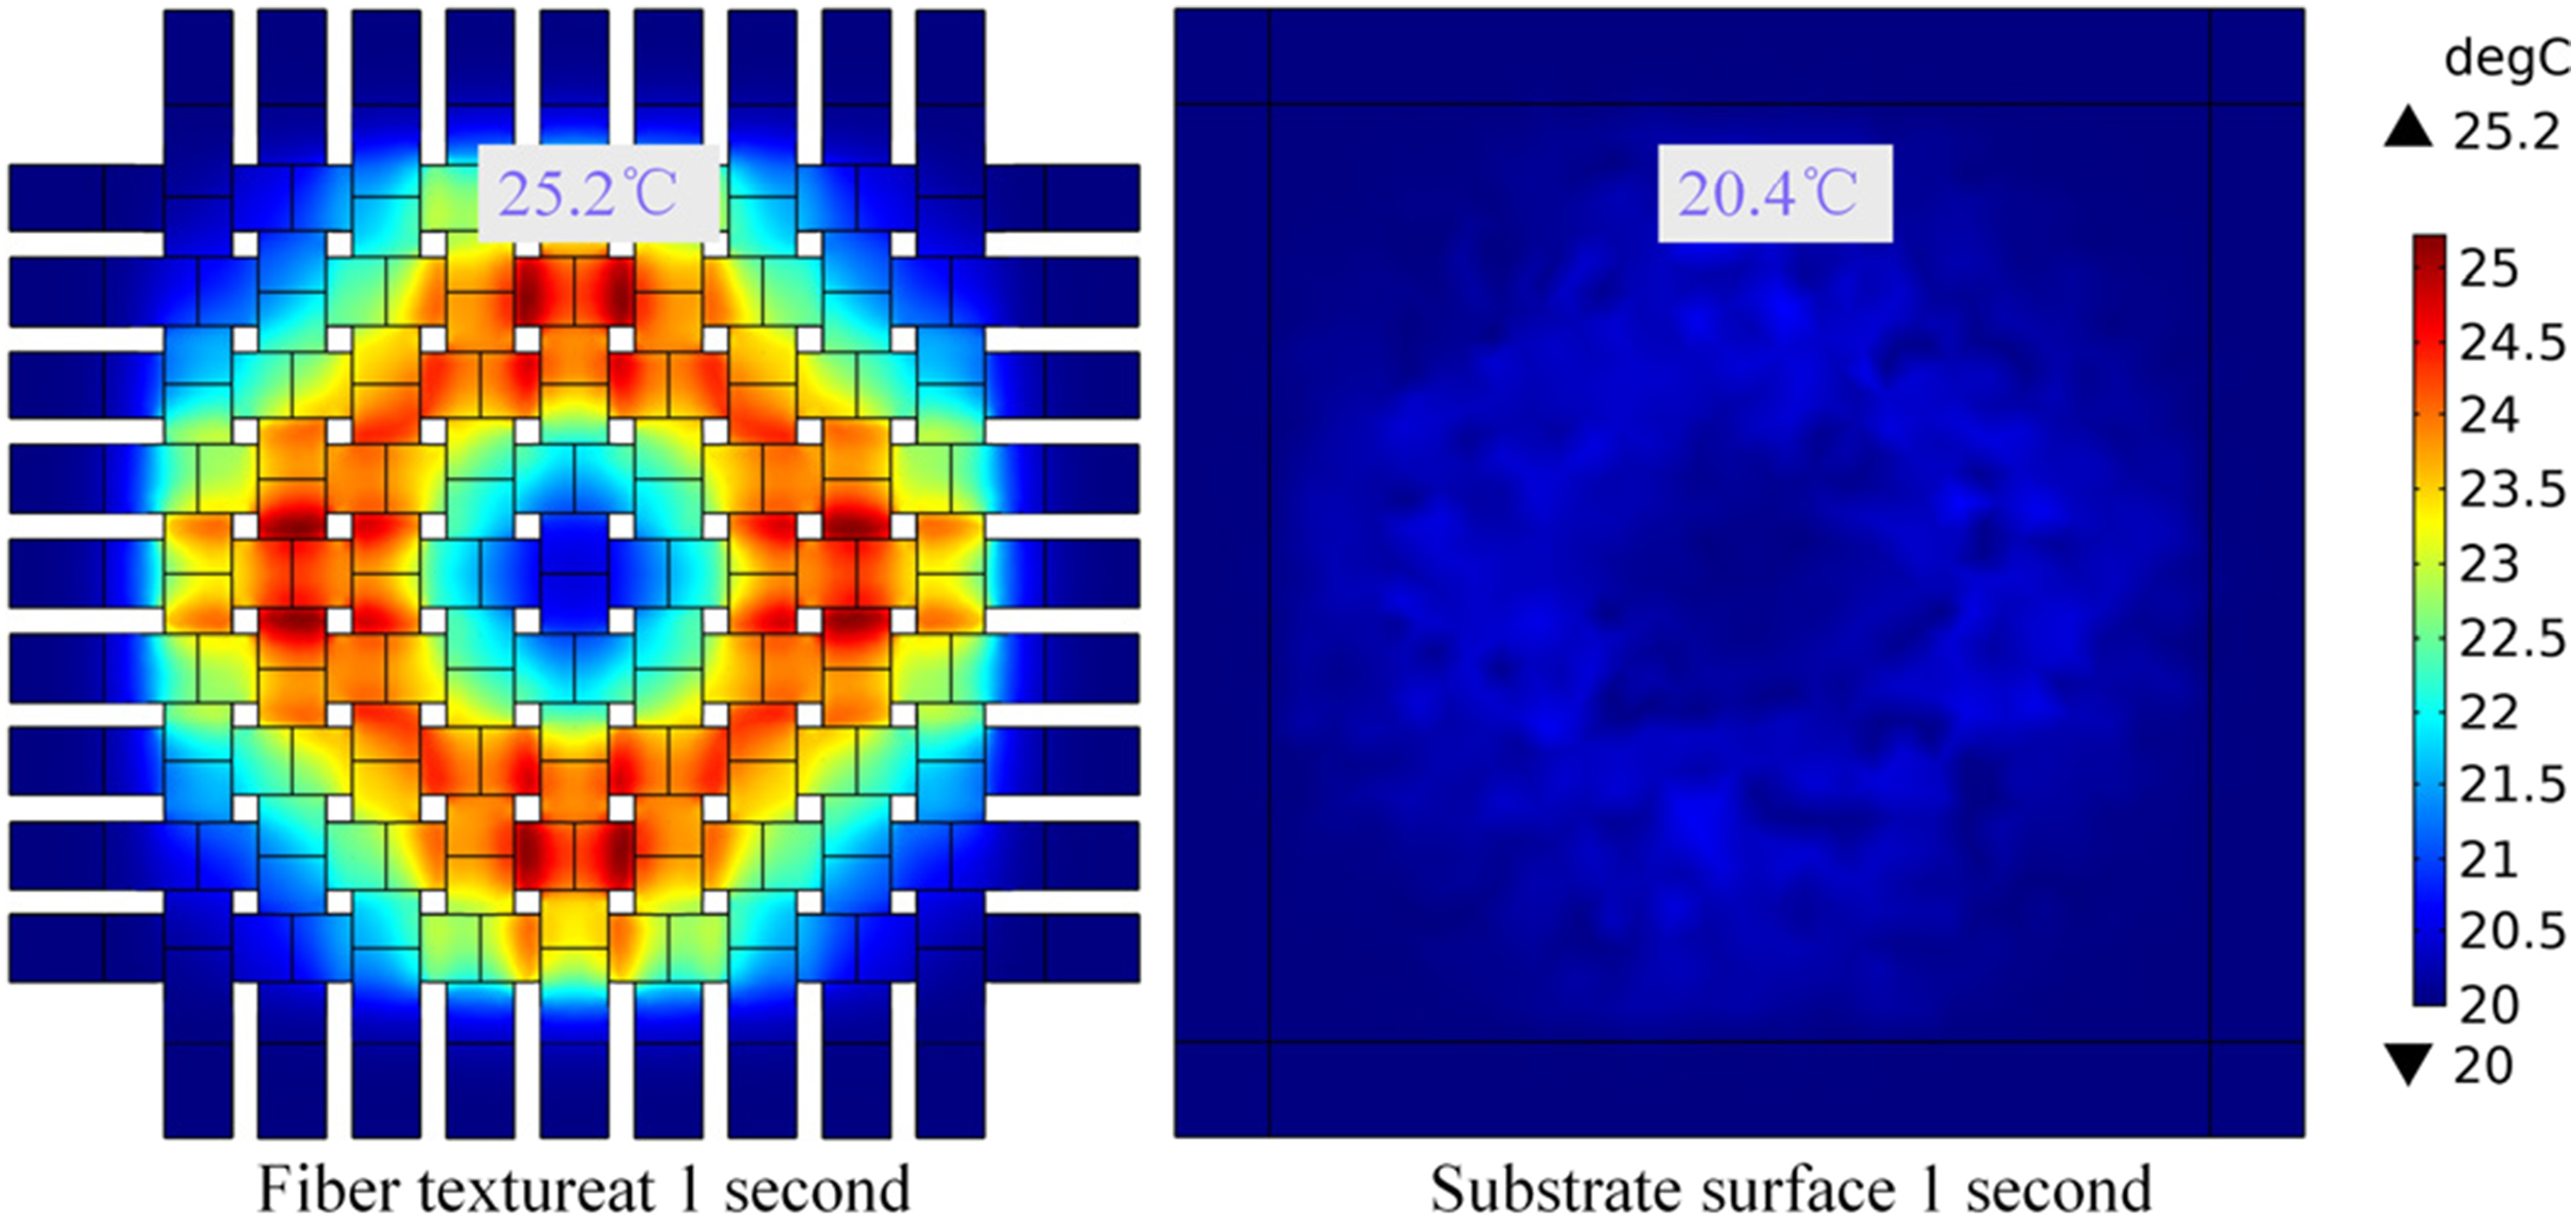
Figure 4 shows the temperature distribution pattern of the fiber texture and matrix surface of the CFRP plate during induction heating, from 5 s to 30 s. The figure reveals that the fiber texture heats up quickly during induction heating. Subsequently, the temperature gradually transfers from the internal fiber texture to the material surface, causing a rise in surface temperature. The temperature field mainly concentrates in the outer circular region corresponding to the coil and conducts along the direction of the fiber texture. Both the temperature distribution in the texture and the matrix surface exhibit a cross-shaped pattern. During induction heating temperature control, the infrared temperature sensor collects temperature data points set on the material surface corresponding to the outer coil area. Temperature field variation during material surface heating process.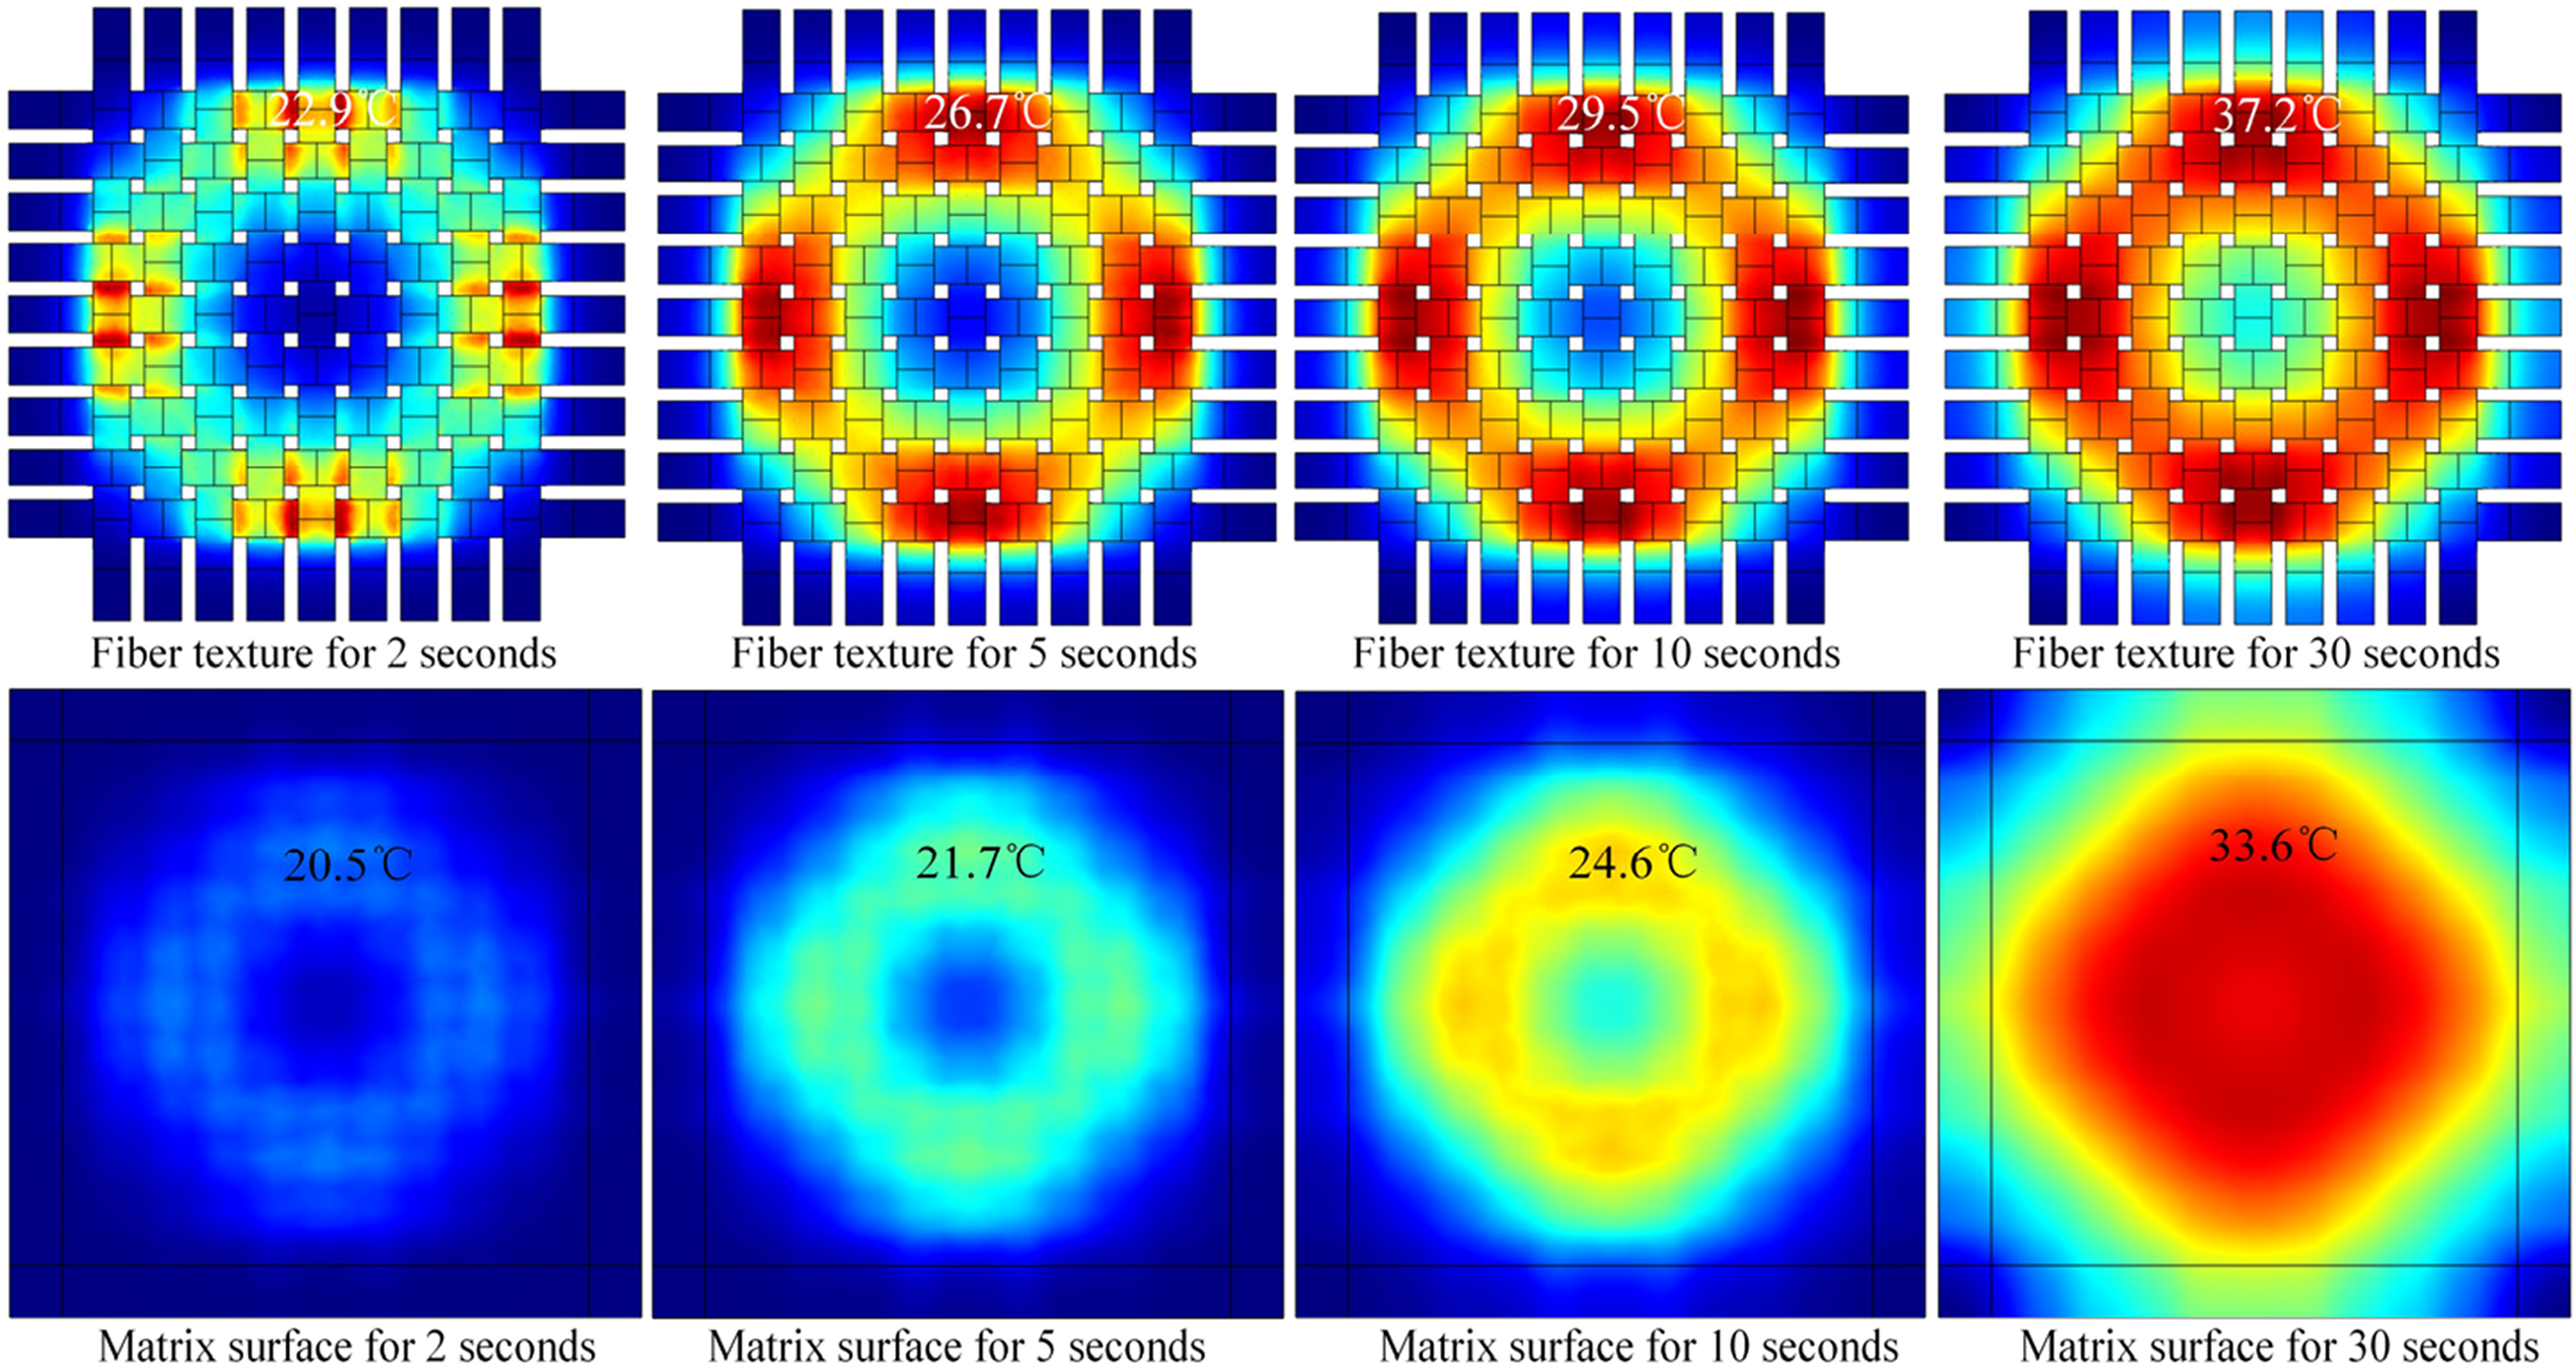
Figure 5 displays the temperature change curves, along with the change in the heating rate of carbon fibers during the initial stages of induction heating. At this time, temperature collection points are set on the fiber structure and matrix surface corresponding to the outer circular region of the coil. The heating rate variation during the heating process from 0 to 35 s is shown in the temperature curves. The curves demonstrate the variation in the heating rate during the initial 35 s of heating. It can be observed that, at the beginning of heating, the temperature field within the carbon fiber structure responds rapidly, resulting in a faster heating rate. On the other hand, heat needs to gradually transfer from the inside to the material’s surface, leading to a slower initial response in the surface temperature. Especially in the first 2 s of heating, the surface temperature rises slowly, with minimal changes in temperature values, causing the temperature difference between the fiber and surfaces to increase gradually. By the time 8 s have passed, the temperature difference between the fiber structure and the material’s surface reaches its maximum, with a temperature difference of 5.4°C. Additionally, it can be seen from the graph that as heating continues, the temperature difference gradually decreases. By the time it reaches 50 s of heating, the temperature difference between the fiber and material surface is reduced to only 3.6°C, indicating that the heating rate of the matrix is gradually accelerating at this point. Fiber texture and material surface temperature rise curve.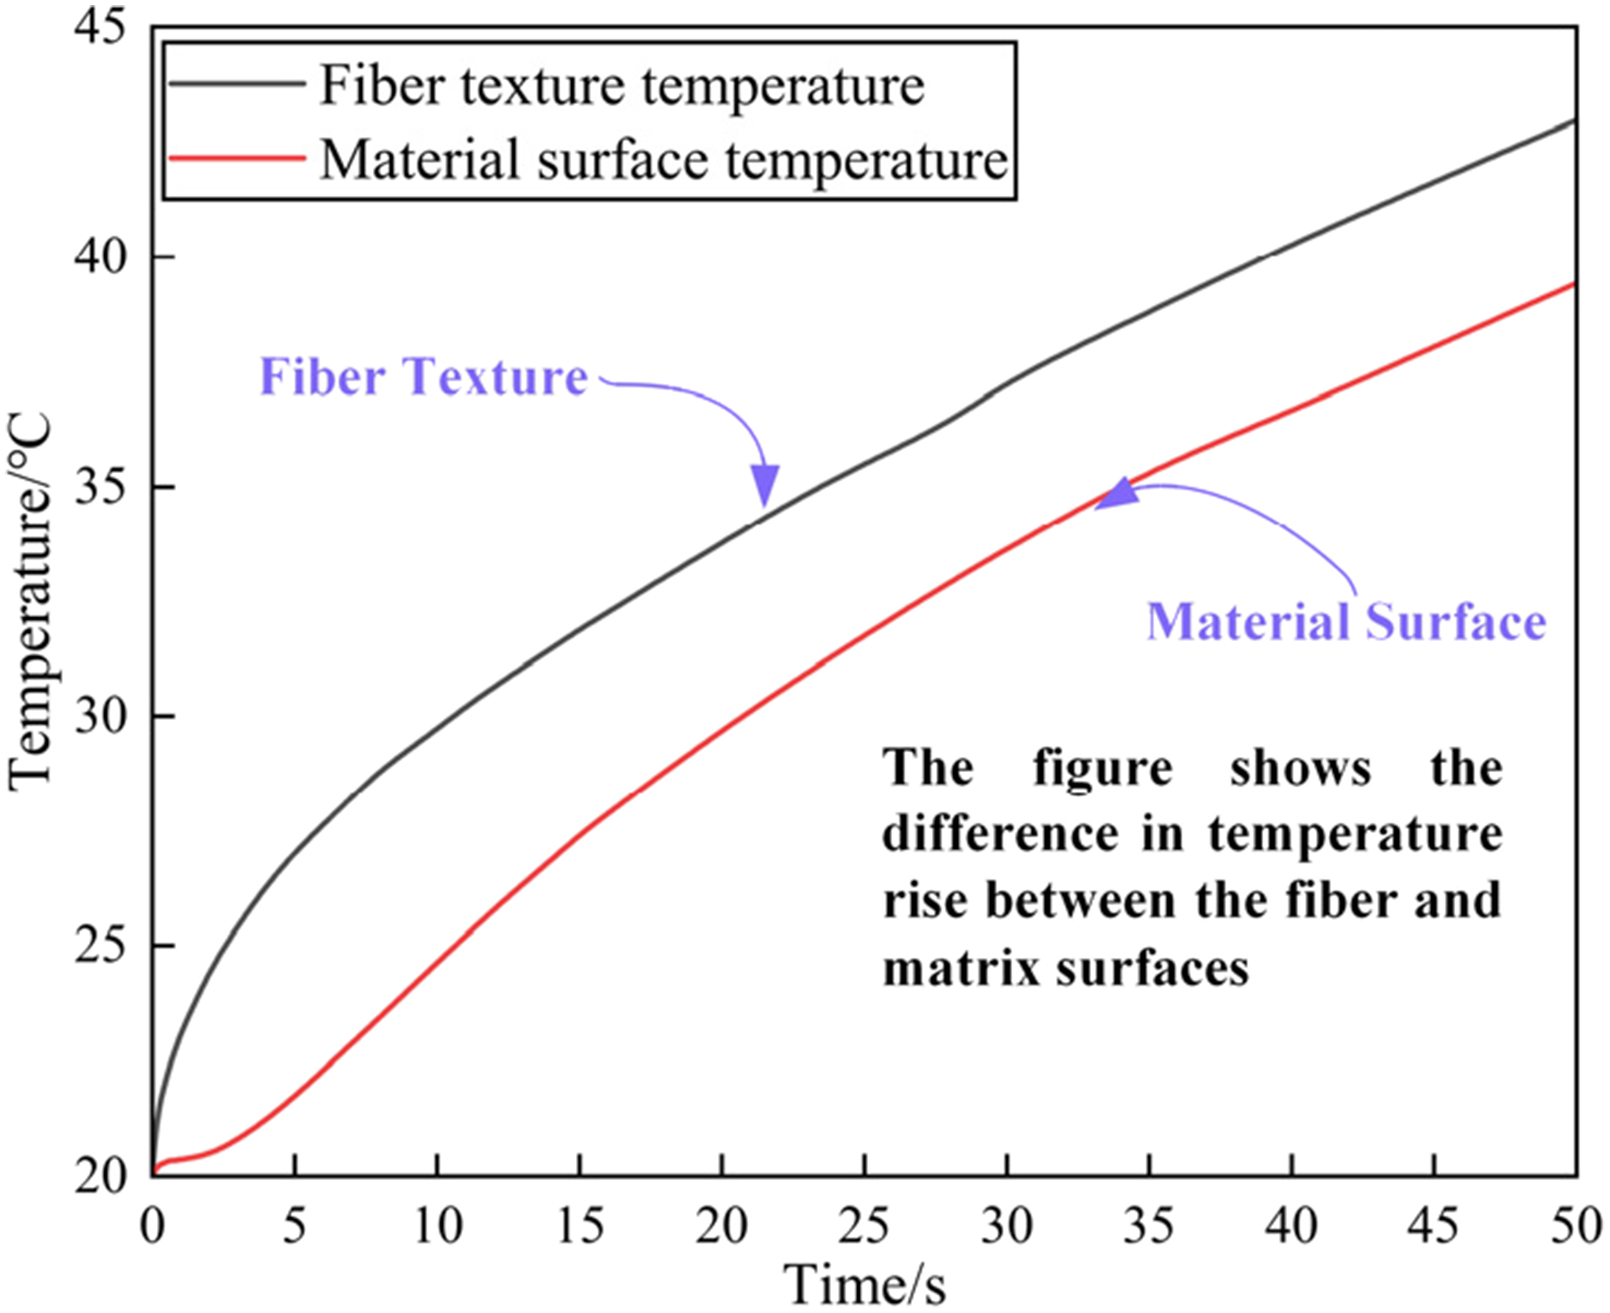
The figure presented in Figure 6 depicts the temperature rate change of the fiber structure during a heating process lasting 100-150 s, along with the temperature variation on the material’s surface. From the graph, it is evident that during this period, the temperature difference between the fiber structure and the material surface gradually increases. At 100 s into the heating process, the temperature within the fiber structure reaches 55.7°C, while the material surface temperature is 52.2°C, resulting in a difference of 3.4°C. By the time we reach 150 s of heating, the temperature difference between the fiber structure and the matrix reaches 3.7°C. This gradual increase in the temperature gap between the fiber and the material surface is noticeable. Through the analysis of temperature field values in the CF-PP induction heating process, it becomes clear that there is a noticeable difference in temperature values between the two, and this difference is progressively changing. Therefore, achieving precise control over the material’s heating process is a crucial aspect of applying induction heating technology in the field of CF-PP. Temperature rise curve of 100-150 s fiber texture and material surface.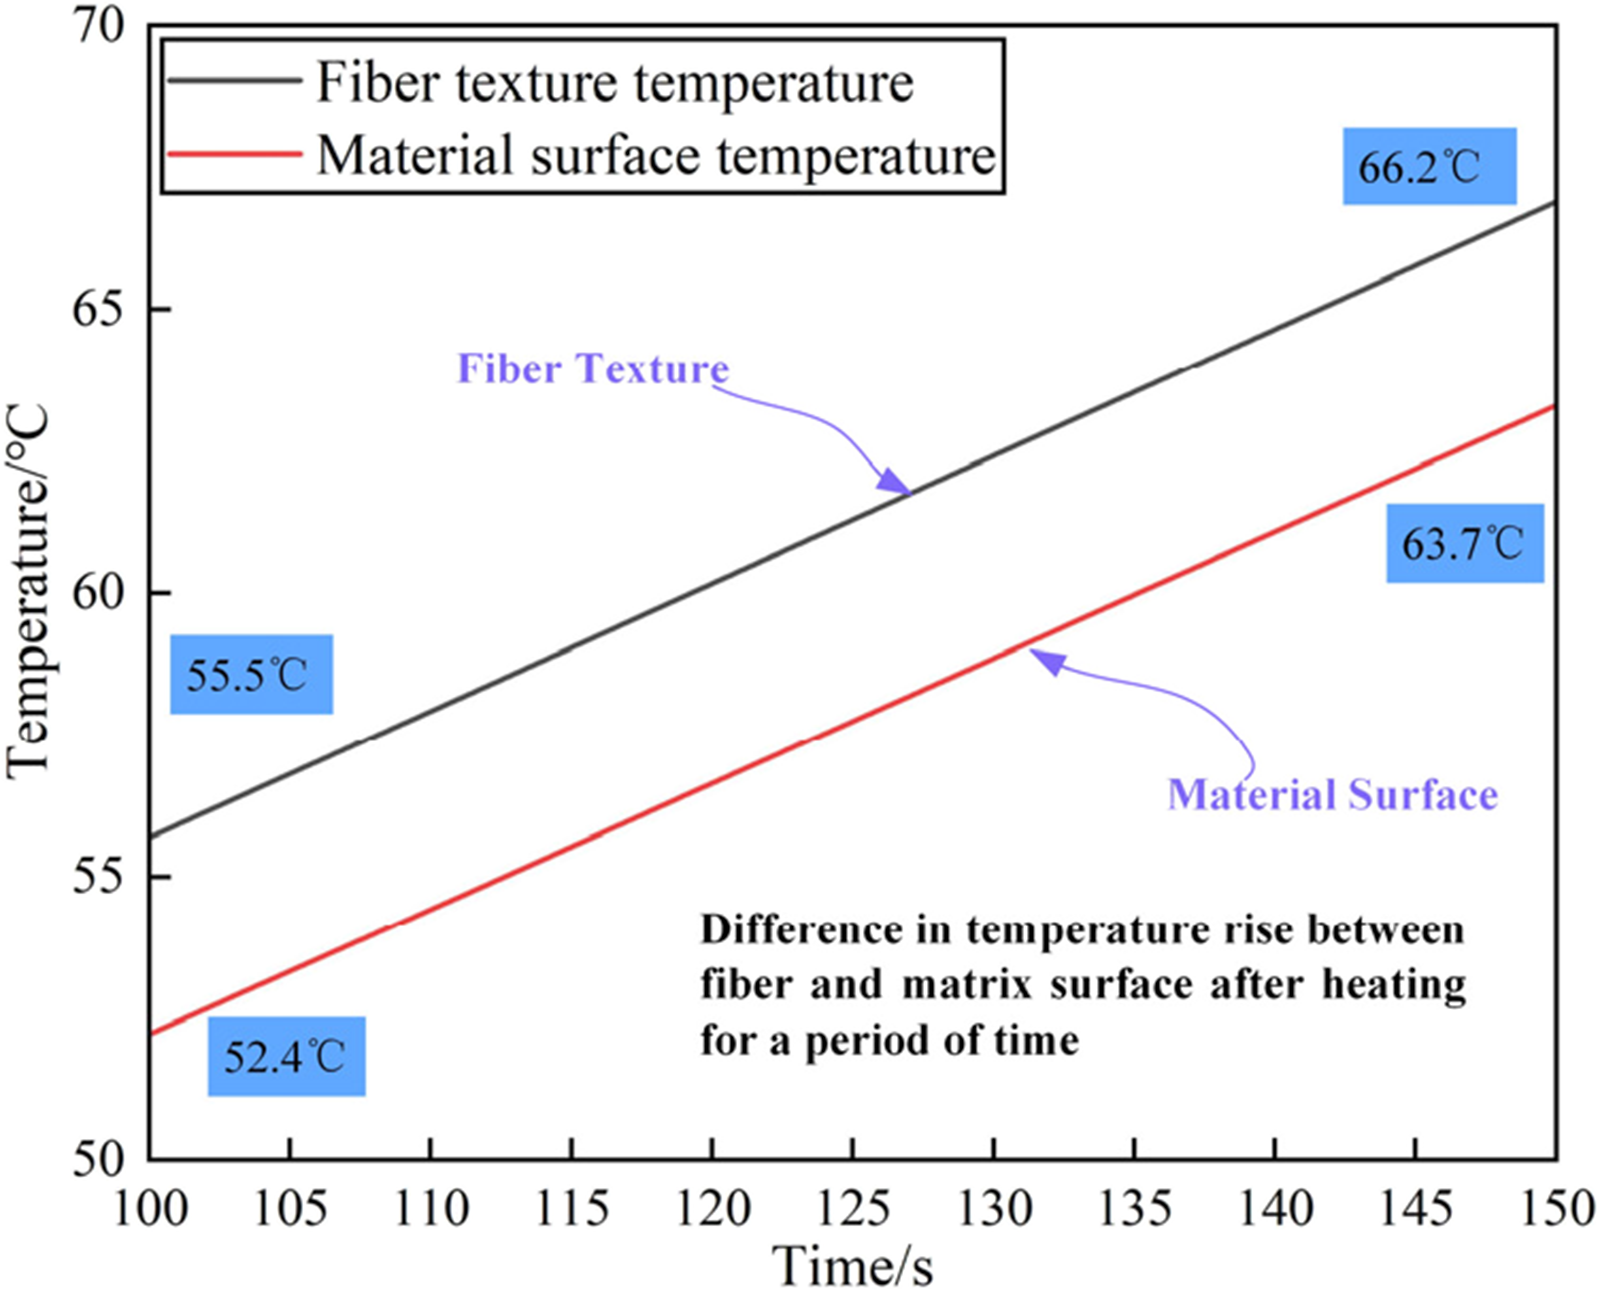
Figure 7 displays the temperature field distribution within the CF-PP material after heating for 15 min, during which the material’s temperature field has essentially reached a steady state. In Figure (a), we observe the temperature field within the fiber structure in this stable state. At this point, the maximum temperature value within the temperature field reaches 161°C, while the highest temperature value on the matrix surface is only 156°C. This indicates that even after heating for 15 min, the temperature value on the matrix surface remains lower than that within the fiber structure. There is still approximately a 5°C difference between the temperature in the fiber and the surface at this stage. This also reaffirms that the temperature difference between the fiber and the material surface continues to widen since the initial 100 s of heating. Surface temperature field of fiber texture and matrix after heating to 15 min.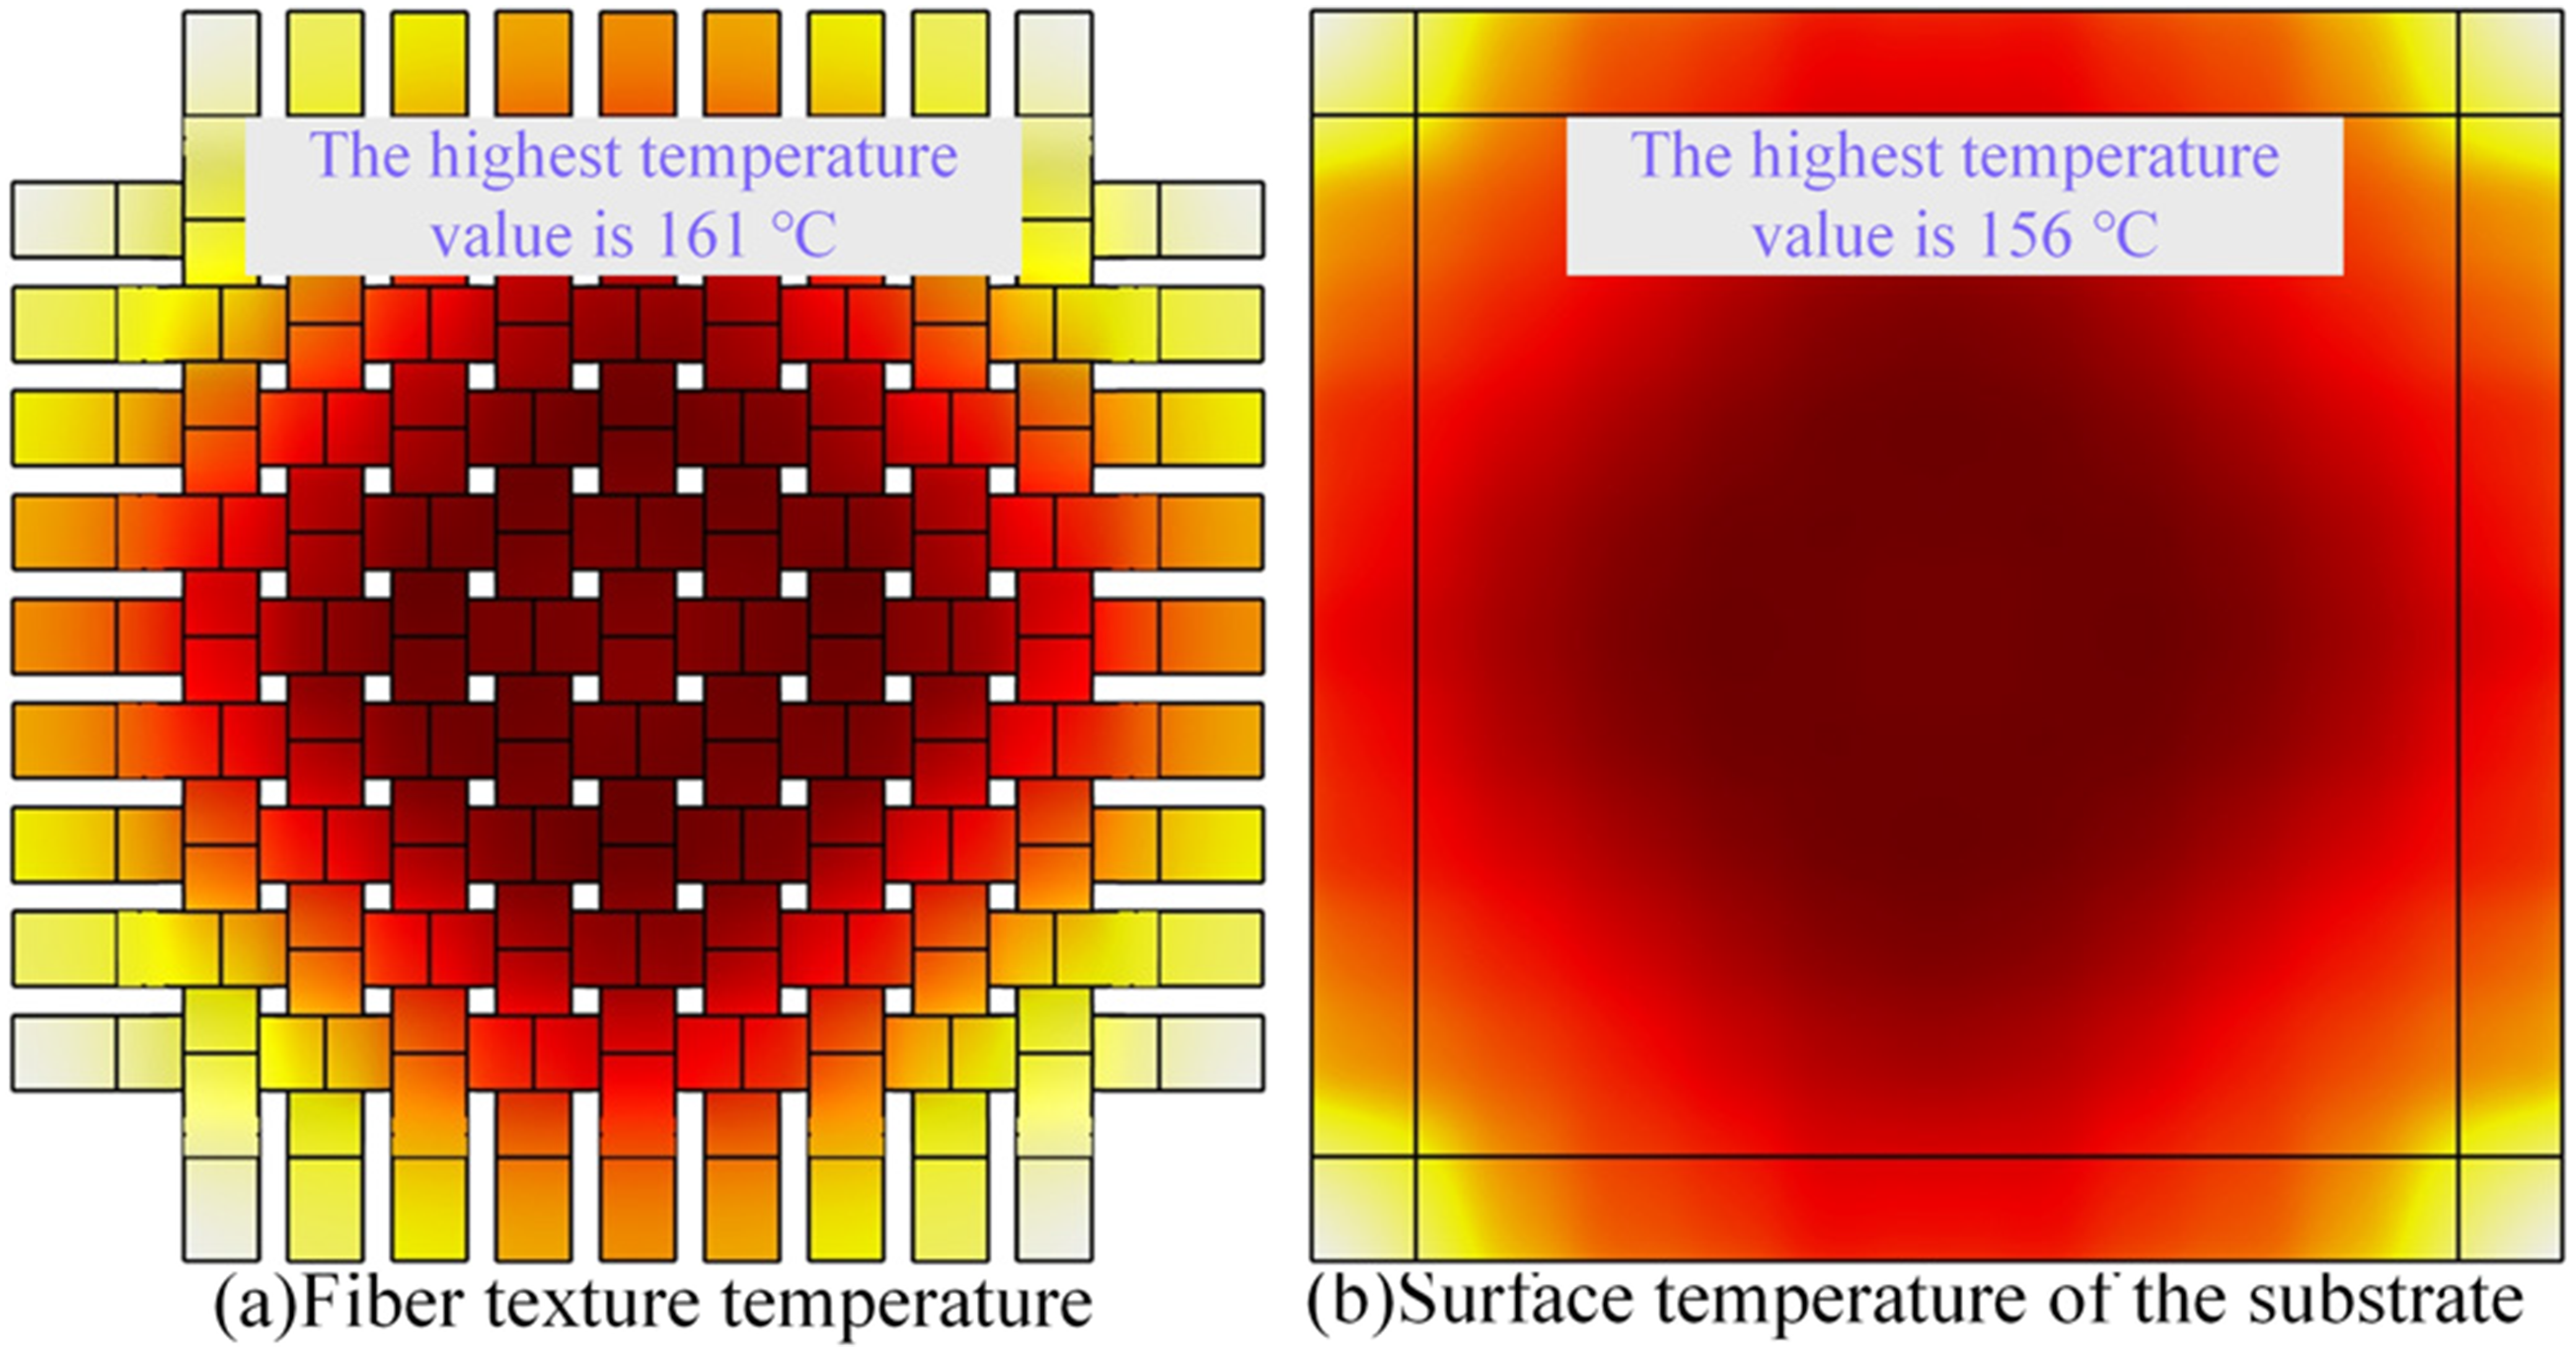
Figure 8 illustrates a finite element macro model of the temperature field for a plain weave CF-PP (Carbon Fiber Reinforced Polymer) during induction heating. The diagram represents a multi-layer structure of CF-PP prepreg material, with each individual layer having a thickness of 1.5 mm. There is a film between the prepreg layers, with a film thickness set to 0.15 mm. In the finite element software, the contact between material layers is modeled using an equivalent thin film resistance approach. The initial ambient temperature for the simulation is set at 20°C. Macro model of plain weave CF-PP.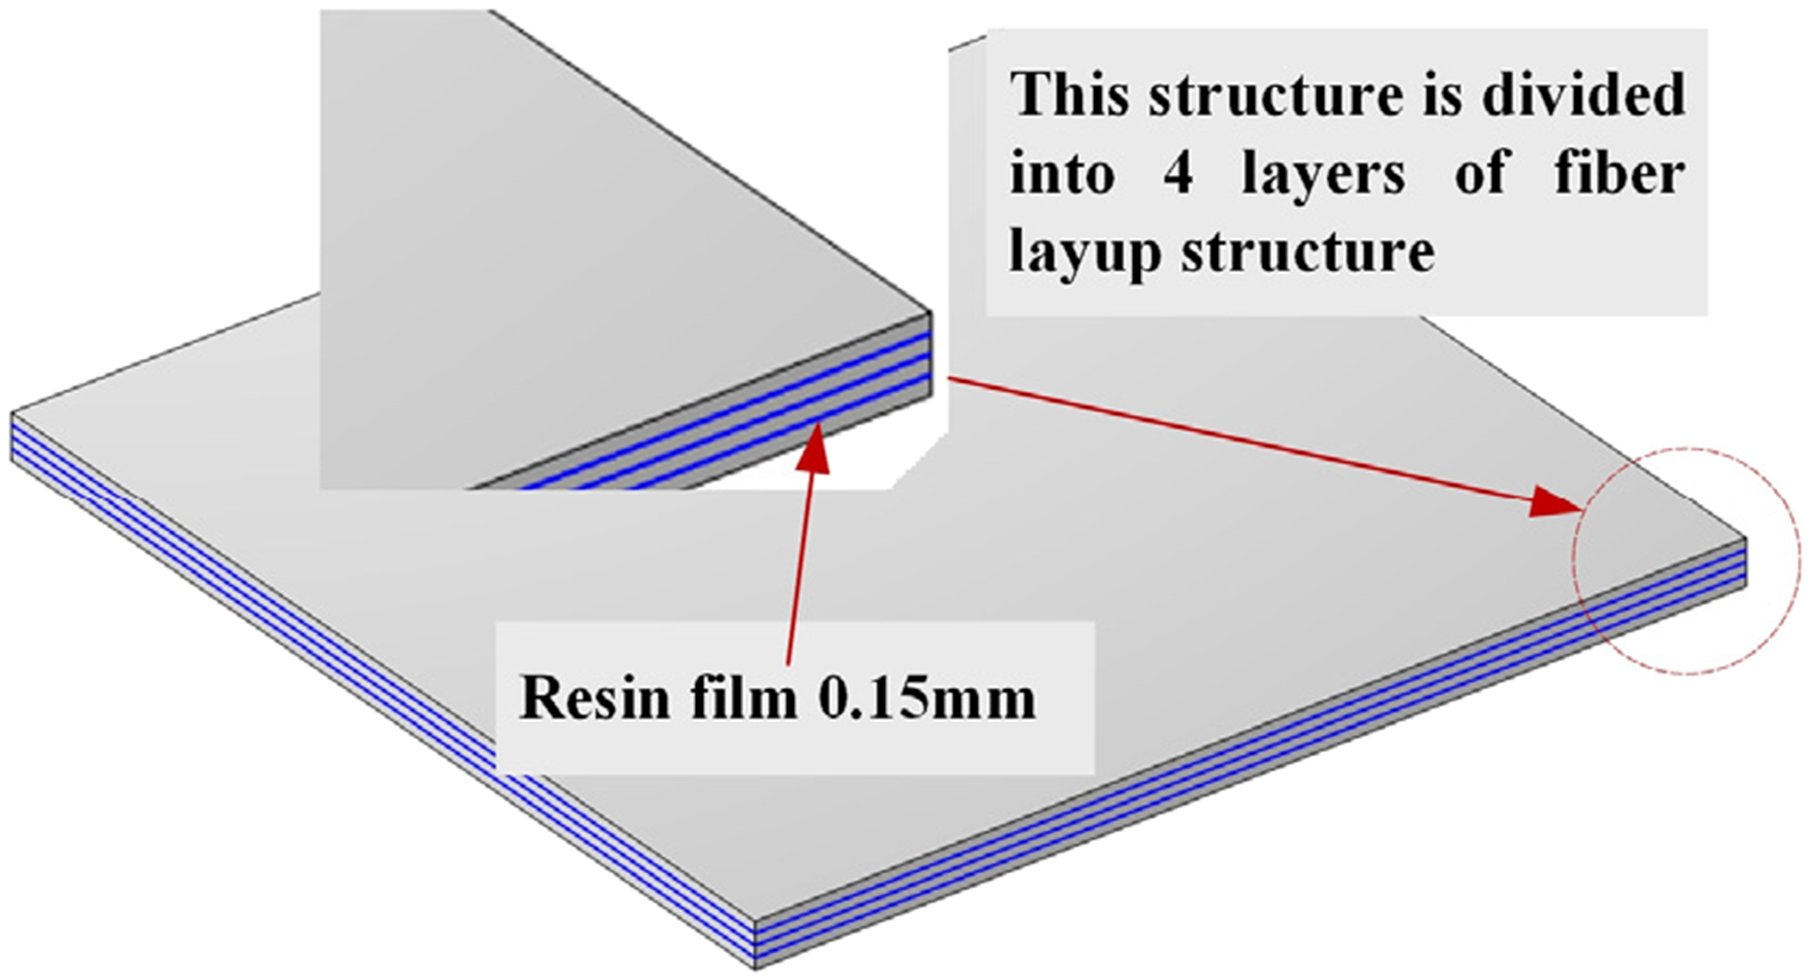
In the macroscopic context, the specific heat capacity of CF-PP is obtained by mixing and fibers in a certain proportion. In this study, the fiber volume fraction of the CF-PP prepreg used is 60%, and the formula for calculating the overall specific heat capacity of the material is as follows.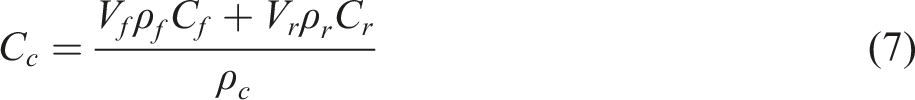
Simultaneously, based on the steady-state method, the thermal conductivity of carbon fiber composite materials is measured and calculated. In a stable thermal conduction state, the temperature at various points on the material remains constant, as do the temperature gradient and heat flux density. The thermal conductivity can be calculated based on the measured temperature gradient and heat flux density, with the formula as follows: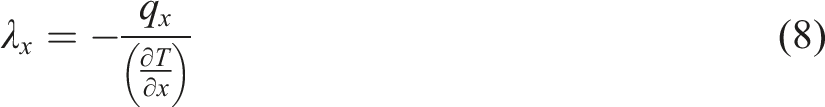
In the formula,
The electrical conductivity and other parameters of plain woven CF-PP in this model are obtained from the manufacturer. As shown in Figure 9, it illustrates the temperature field distribution pattern of the CF-PP macroscopic model after 10 s of induction heating. In Figure a, when the CF-PP plate is close to the induction heating coil, the highest temperature reaches 31.2°C, while in Figure b, when the CF-PP plate is far from the coil, the highest temperature is 26.8°C. Figure c represents the temperature field distribution along the central cross-section of the CF-PP plate in the X-direction. From Figures a and b, it can be observed that the temperature field distribution on both sides of the material is similar, but the numerical values are notably different. Figure c reveals the temperature field variation in the thickness direction of the CF-PP. The temperature values gradually decrease from the upper side of the material downwards, especially at the interlayer interfaces, where the temperature values decrease significantly. This indicates that there is a certain lag in the heat conduction process between the layers as heat is transferred. Temperature field distribution pattern of CF-PP macroscopic model under induction heating up to 10 s.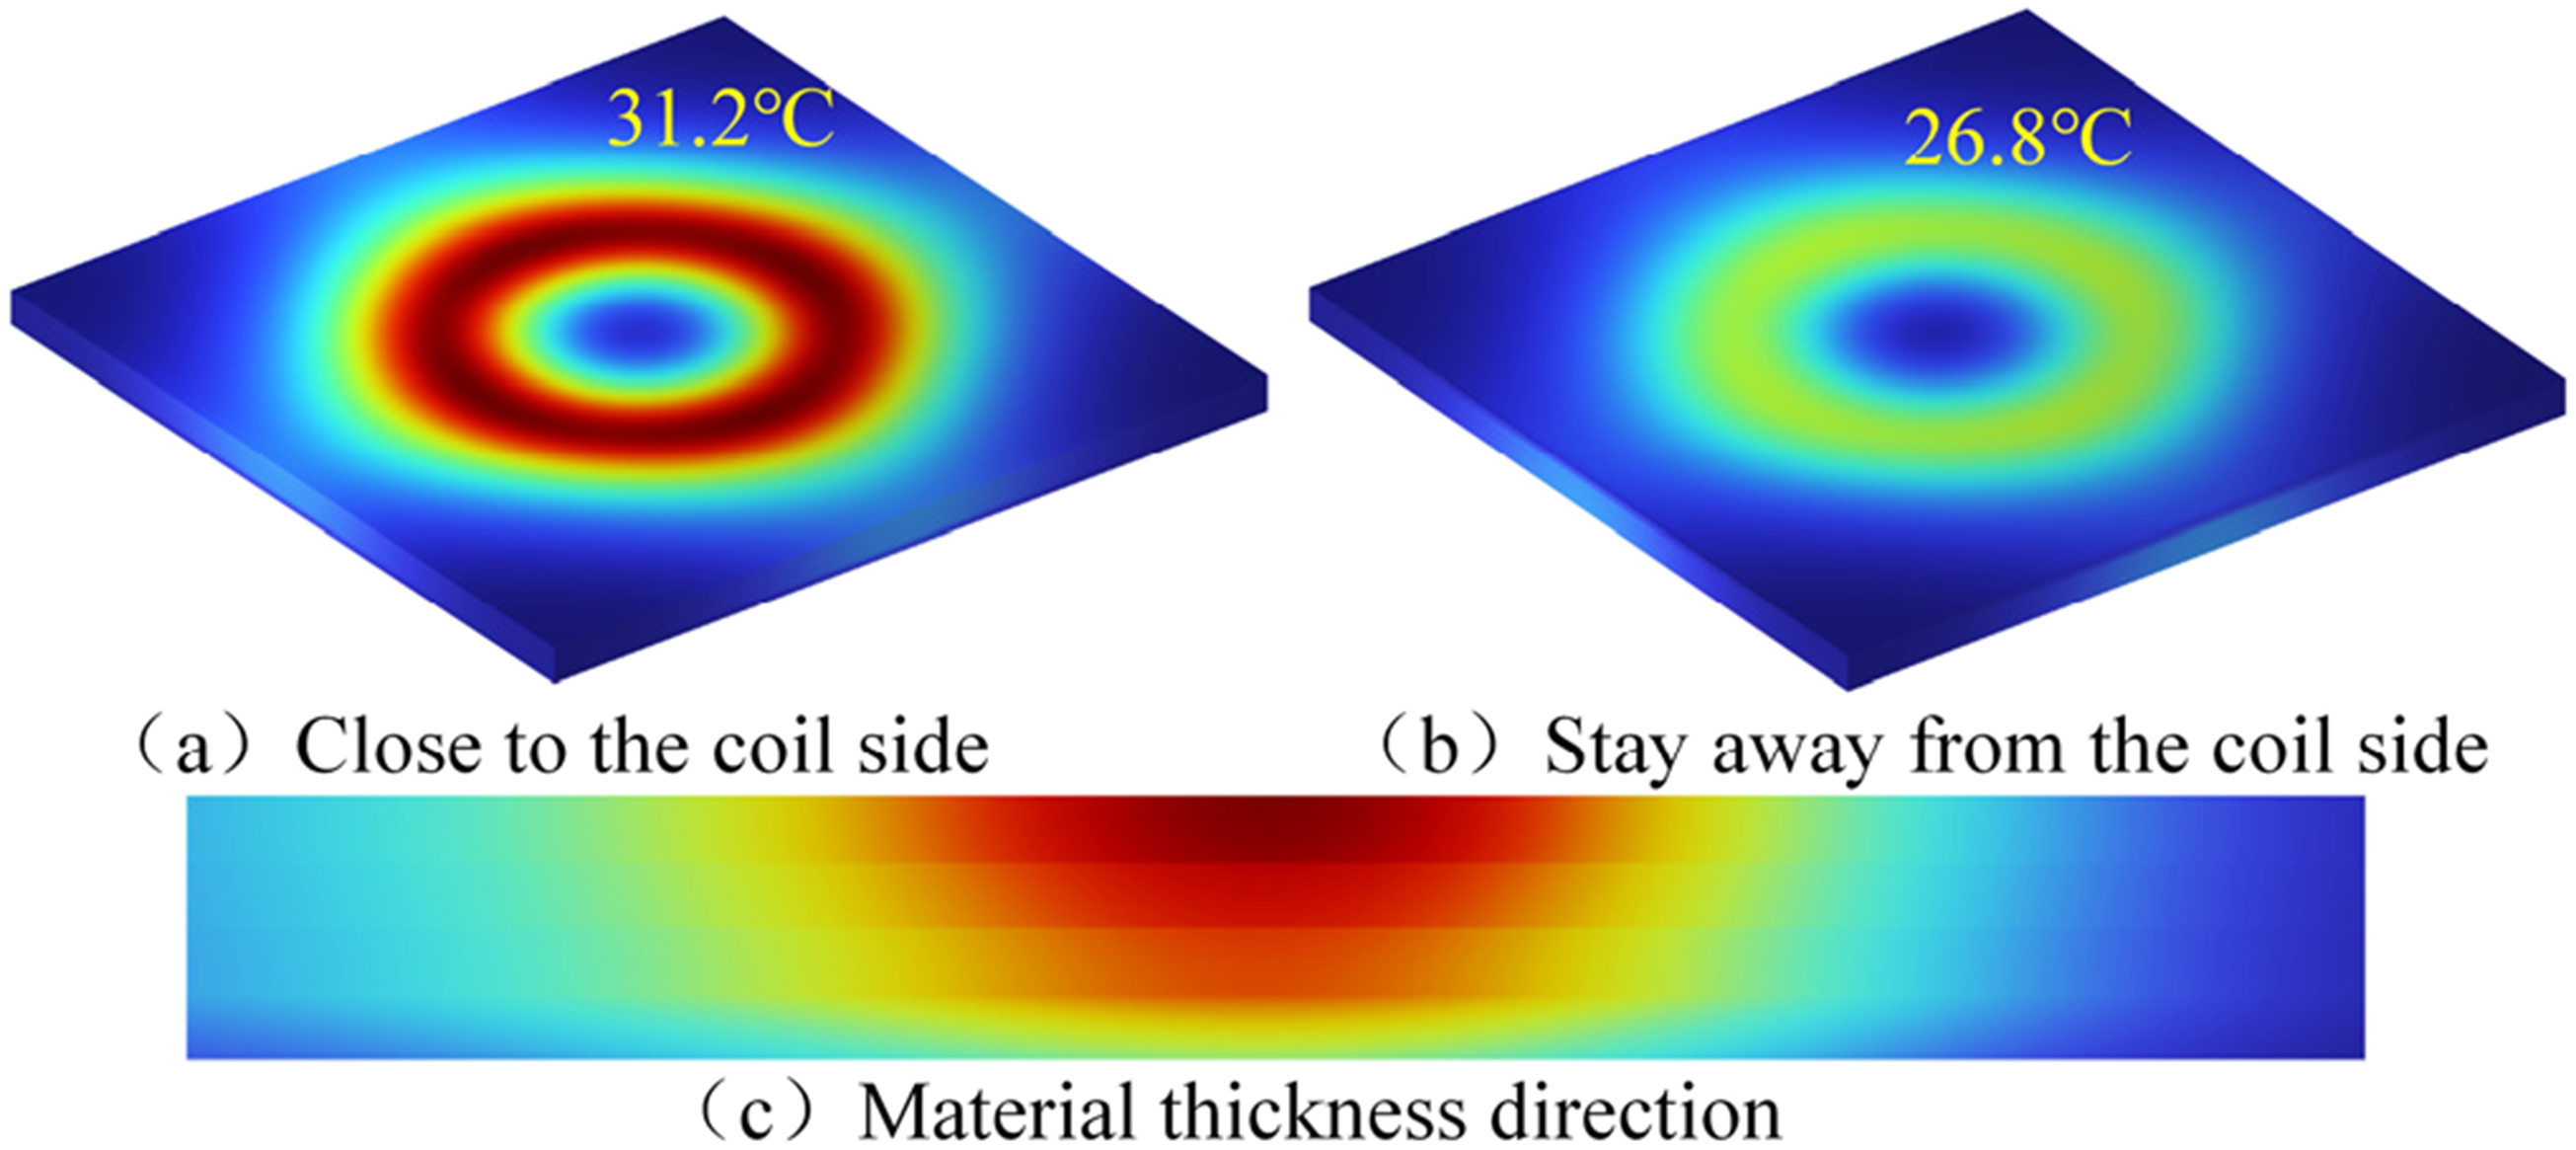
Figure 10 shows the temperature field distribution during the induction heating experiment of the plain woven CF-PP plate. The figure illustrates the temperature field changes on the material’s surface during the 7-s induction heating experiment, and it closely aligns with the simulated calculation results. However, there are slight differences in the timing of the temperature field changes between the experimental data and the simulation results. This discrepancy is because the simulation calculations intentionally introduced a delay in the material surface temperature to represent the lag in the CF-PP surface temperature during induction heating. This was achieved by using a thicker layer, which delayed the temperature conduction time. Despite this difference, the simulation results and the experimental surface temperature changes are in good agreement, indicating that the simulation in this study effectively captures the temperature field changes in carbon fiber composite materials during induction heating. Temperature field distribution image during induction heating experiment.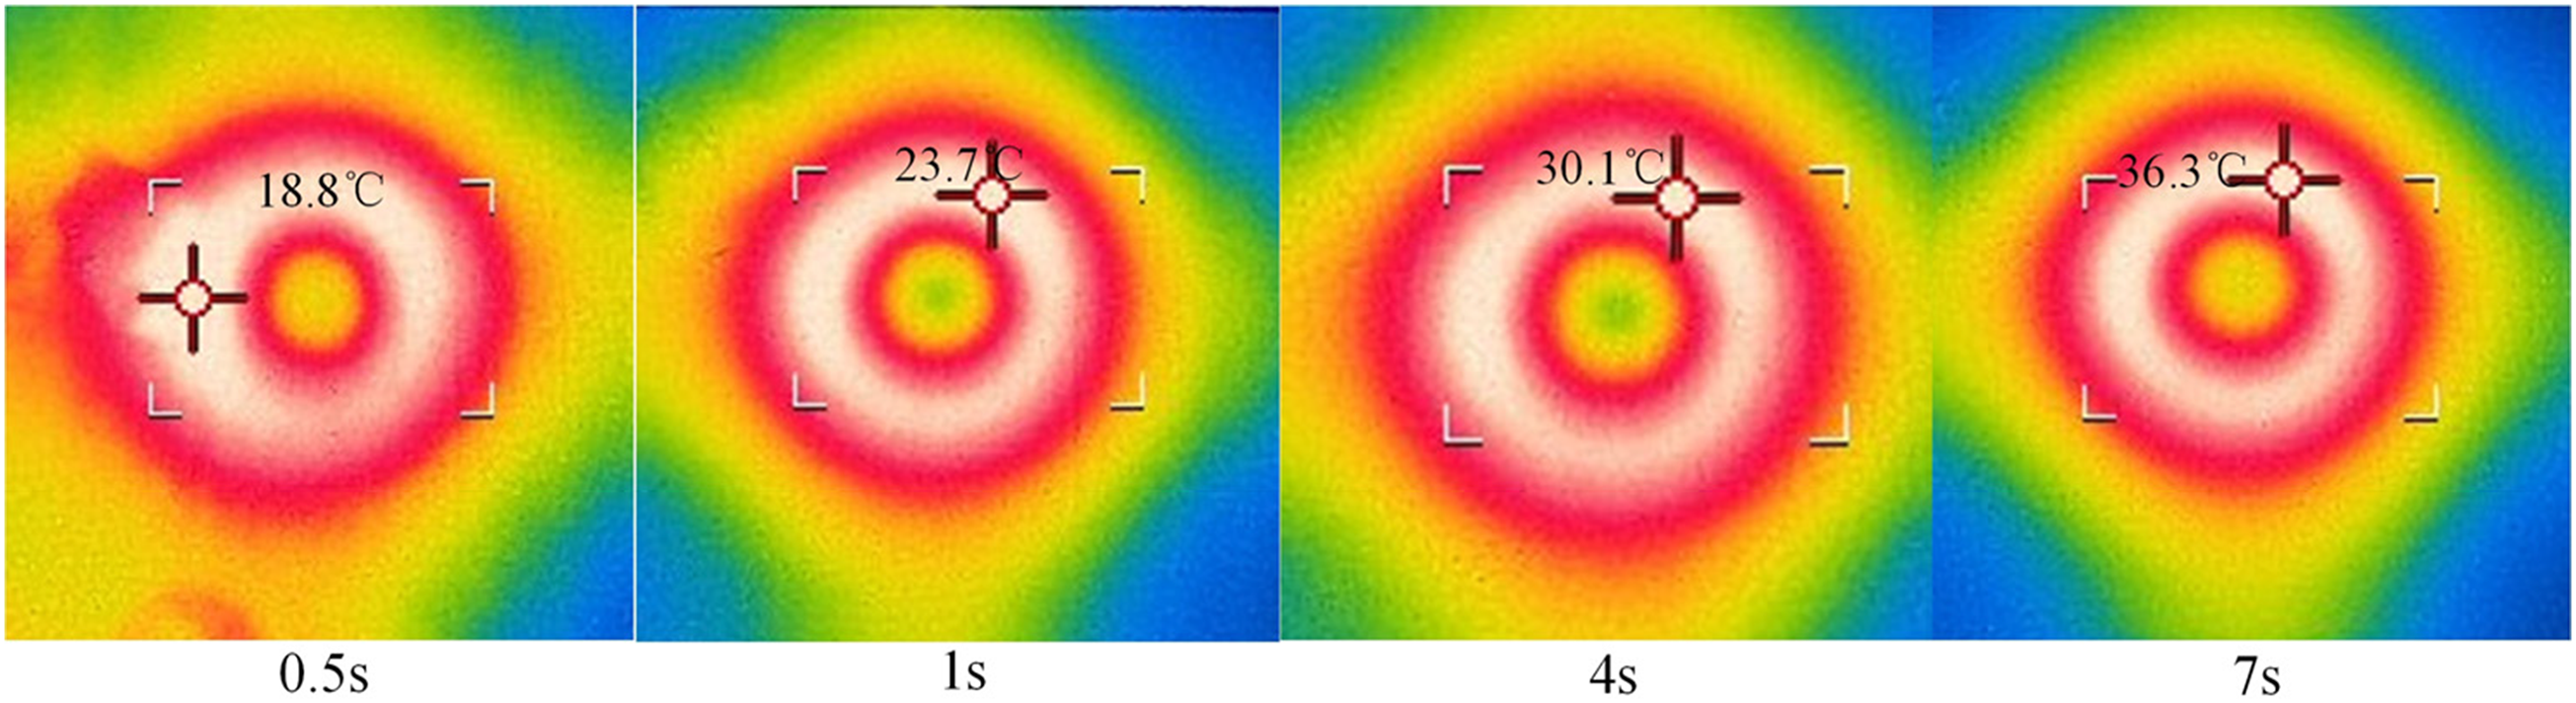
Figure 11 shows the experimental apparatus used to study the interlayer temperature variations. The carbon fiber composite material used in the experiment has a plain woven structure, with polypropylene as the matrix material, and a melting temperature of 160°C.Temperature sensors are placed on the surface and in the middle layer of the material, with the middle layer sensor embedded within the fiber texture. The induction heating coil is positioned below the CF-PP. To minimize the magnetic field’s impact on the temperature sensors, the distance between the coil and the CF-PP plate is reduced, and the sensors are placed 10 mm away from the outer edge of the coil. The two sensors are positioned on the upper and lower sides of the material and connected to a temperature acquisition device. Interlayer temperature measurement device.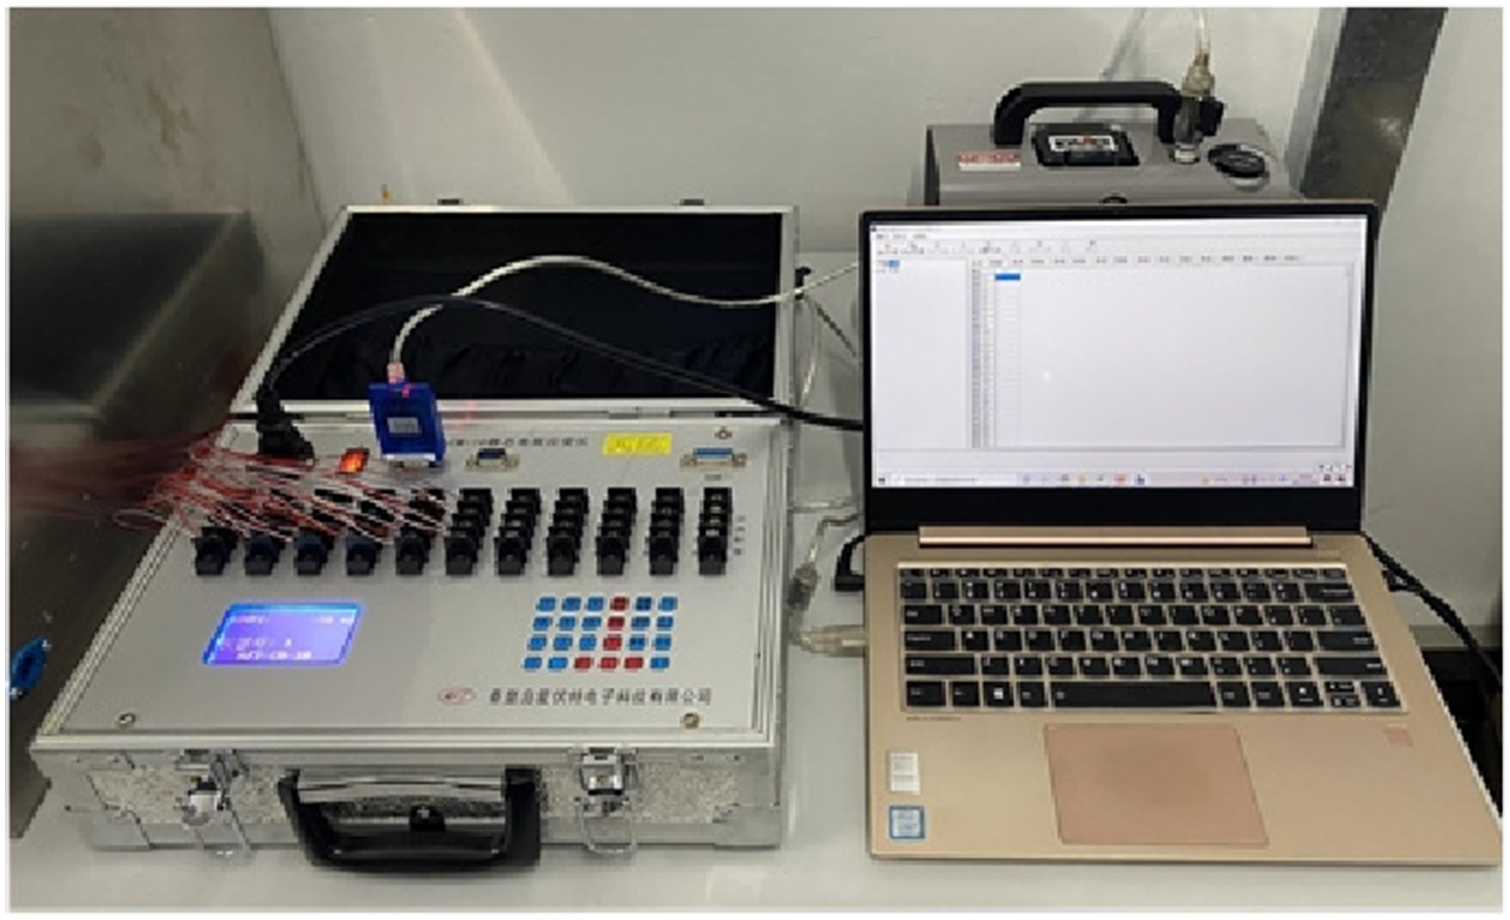
Figure 12 depicts the temperature curves recorded by temperature sensors during the induction heating process of CF-PP. It can be observed that there is a noticeable difference in the heating rate between the upper and lower surfaces of the CF-PP plate. When heated for 200 s, the temperature difference between the two surfaces is approximately 4.2°C. This data also reveals that once the material reaches a certain thickness, the heat conduction between layers has a significant impact on the material’s temperature field. This further validates the accuracy of the finite element model analysis mentioned earlier. Temperature curves of interlayer and surface materials collected by temperature sensors.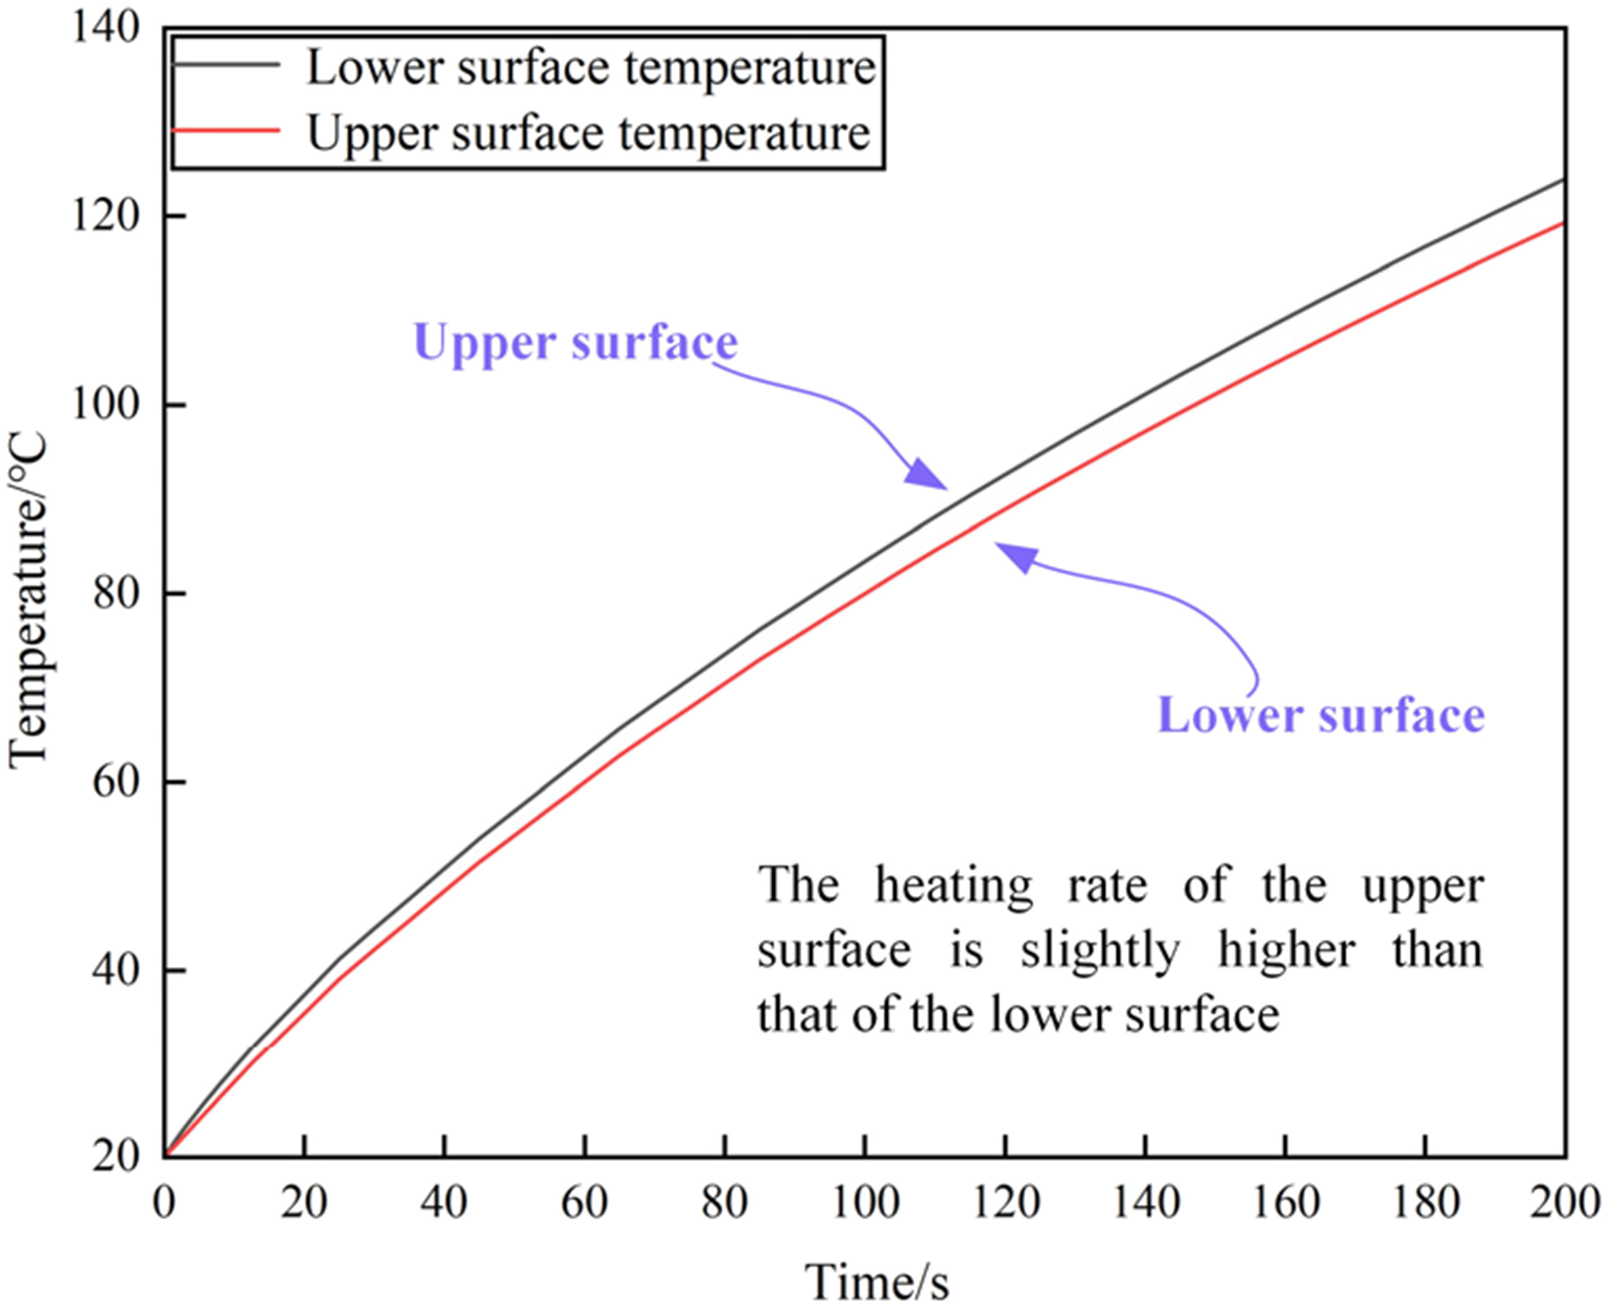
Analysis of temperature control theoretical model
Improving particle swarm PID Control
During the induction heating process, the way the matrix and fiber structure are mixed in carbon fiber composite materials, as well as the interlayer heat conduction process, can lead to differences between the temperature values recorded by the infrared sensor and the actual internal temperature values of the material. Additionally, the inherent lag in the temperature control system makes it more challenging to control the temperature of CF-PP during the heating process. This is especially crucial during the consolidation and forming of CF-PP, as excessively high temperature values can affect the quality of the material’s formation. Therefore, reducing overshoot during the material heating process is critical for improving the quality of material consolidation and forming. To achieve quantifiable optimization of control factors and enhance control accuracy, this study employs an improved Particle Swarm Optimization (PSO) algorithm to optimize the fuzzy PID control method. The control method’s schematic principle is depicted in Figure 13. Schematic diagram of particle swarm optimization algorithm for PID control.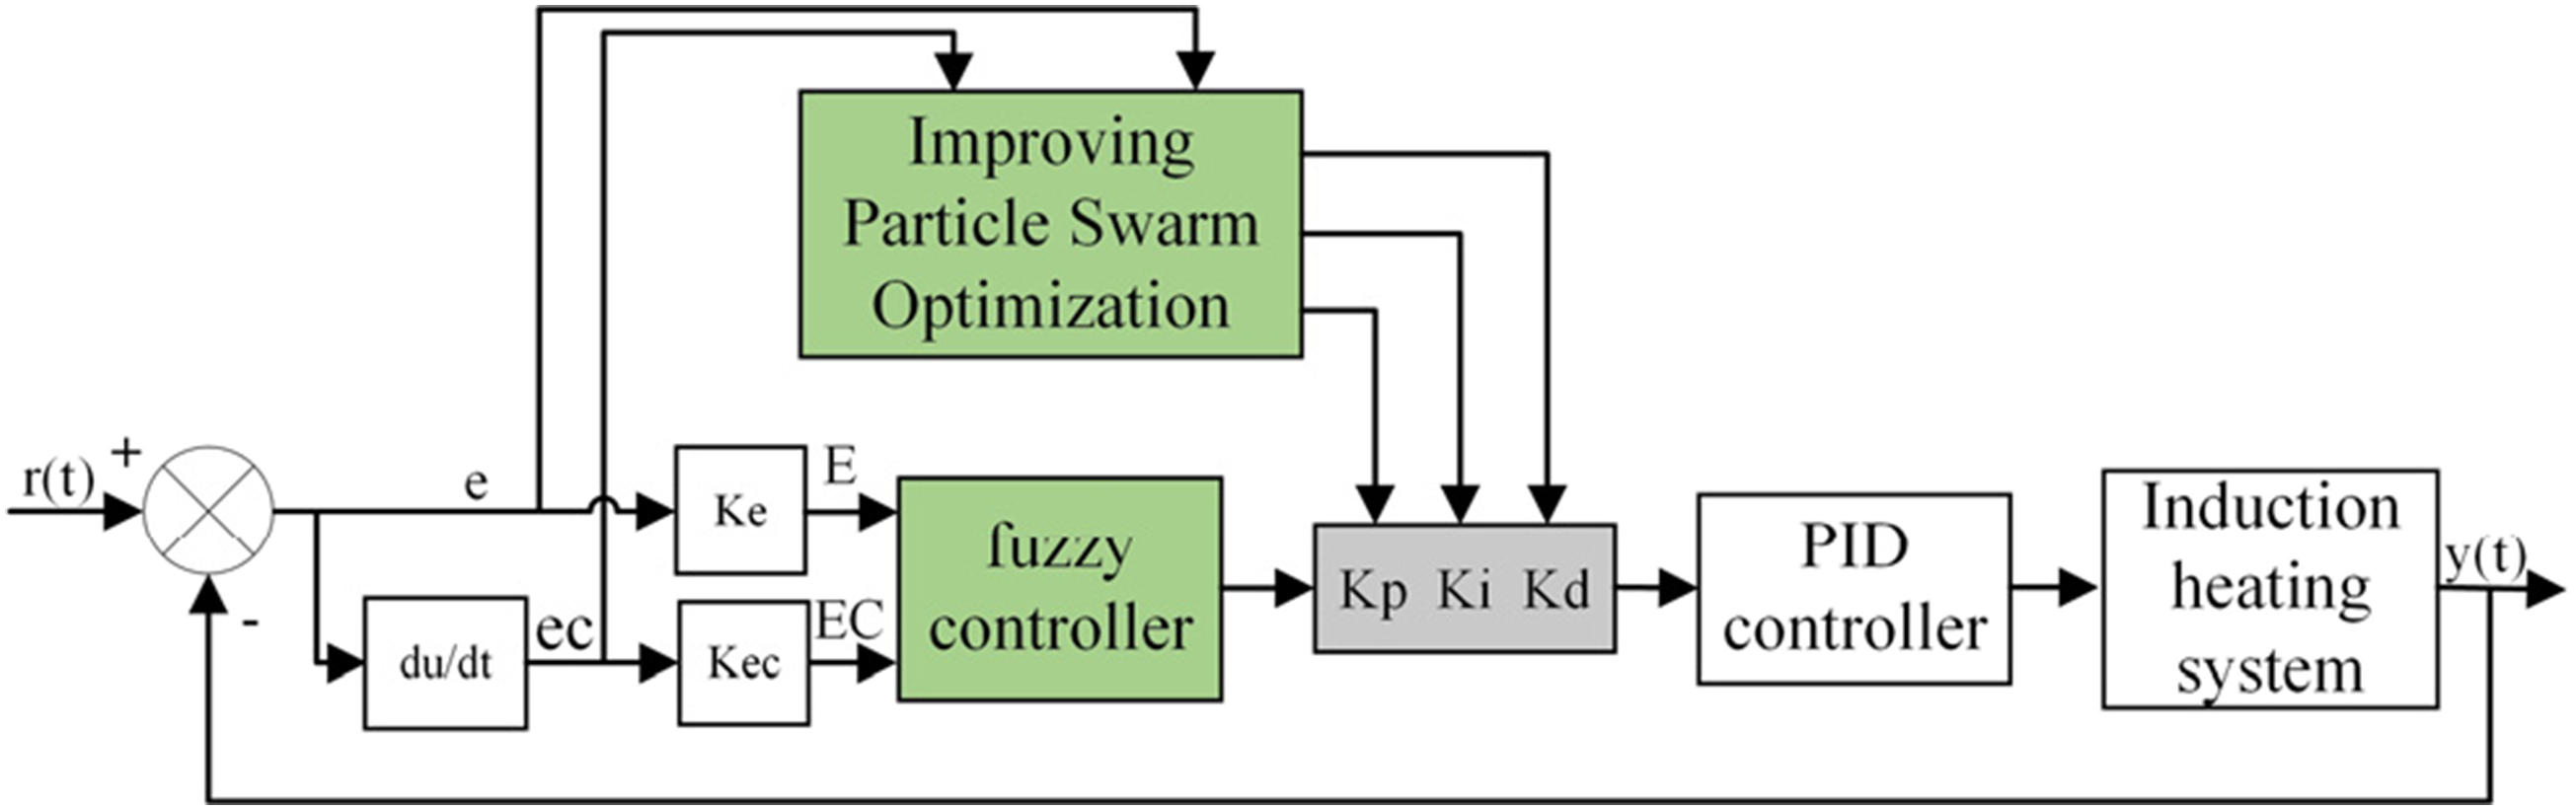
First, initialize the particle swarm with random positions denoted as Flow chart of improved particle swarm pid control algorithm.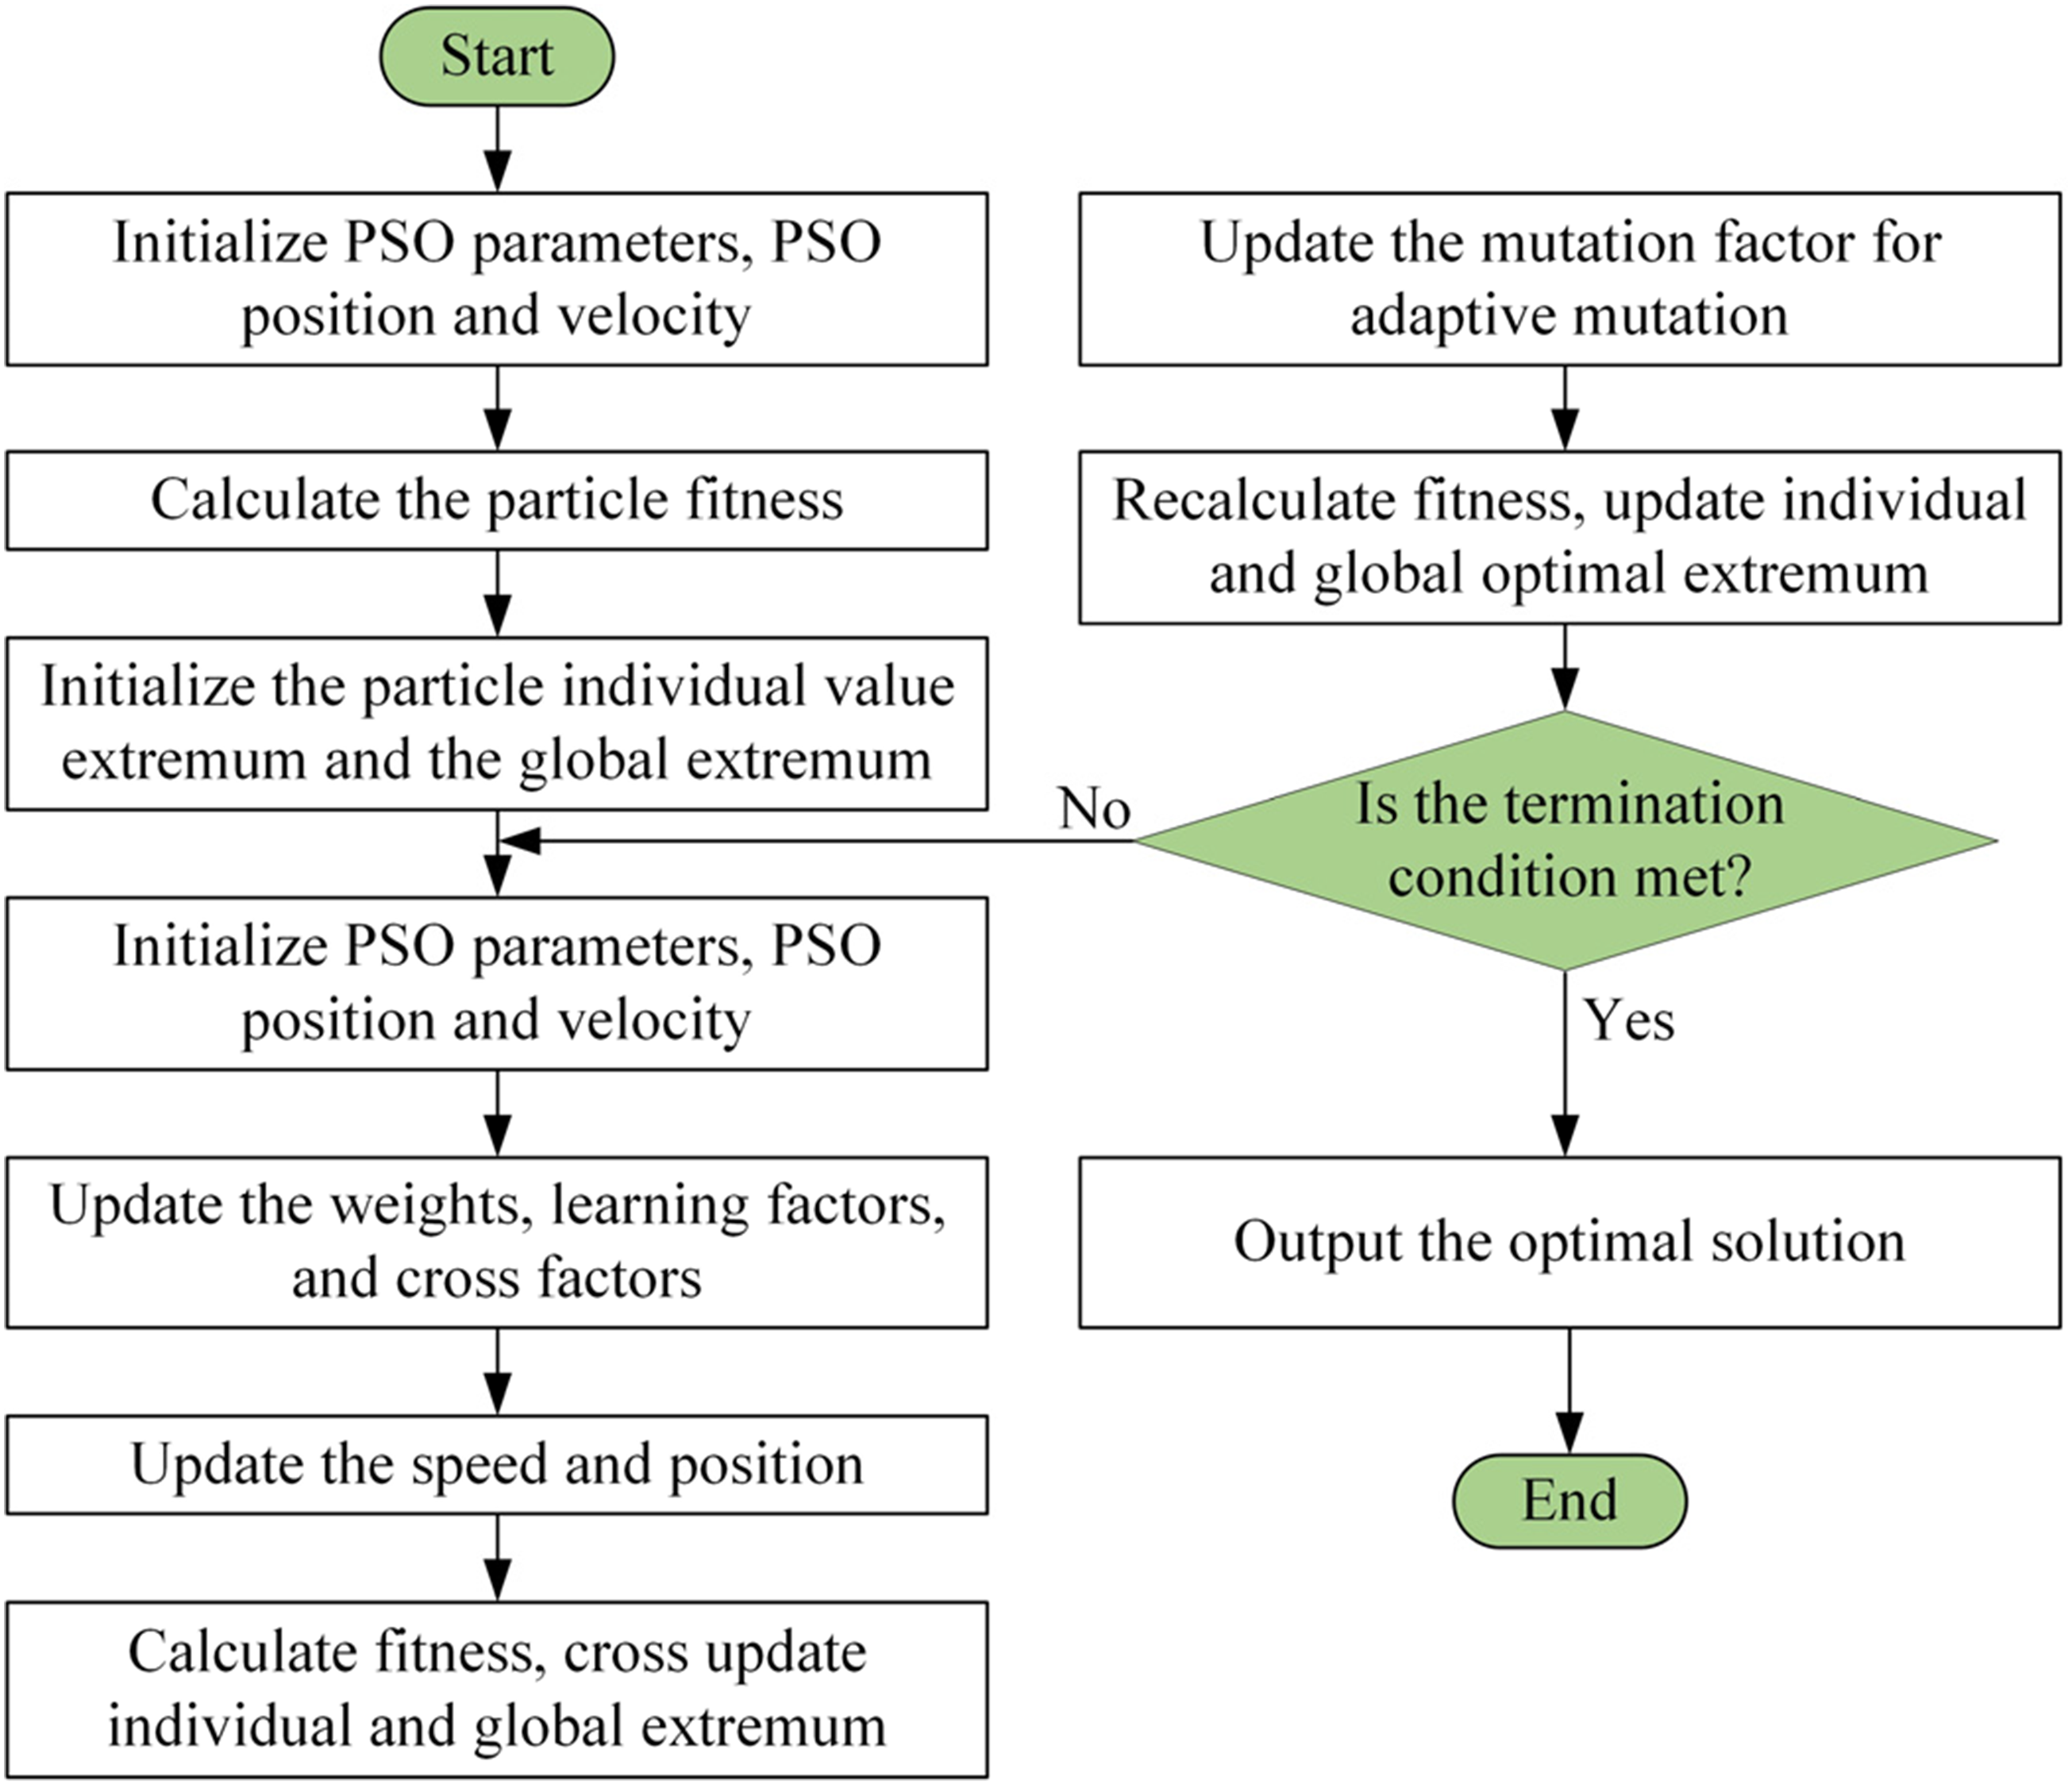
Translate and refine the following passage into English: “Calculate the current fitness value 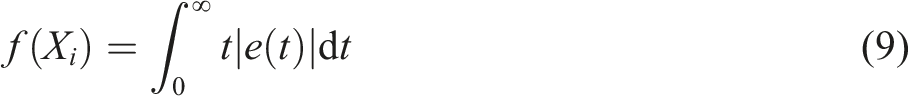
In the equation:
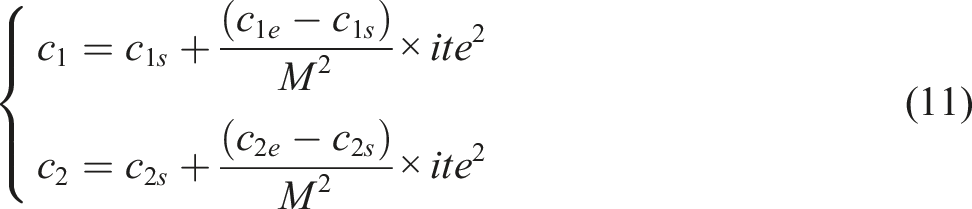
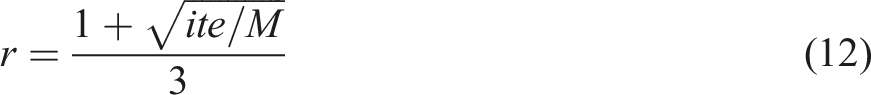
Update the weights and learning factors, and modify the critical value of the crossover probability. The crossover probability here is not a fixed value; it is adjusted to avoid falling into local optima in the late stages of evolution due to small population differences. By increasing the crossover probability in the later stages, it effectively allows us to escape local optima. Additionally, the formula for updating weights is given in equation (10), the formula for updating the learning factor is in equation (11), and the modification formula for the adaptive crossover probability is presented in equation (12).
In the equations:
The velocities 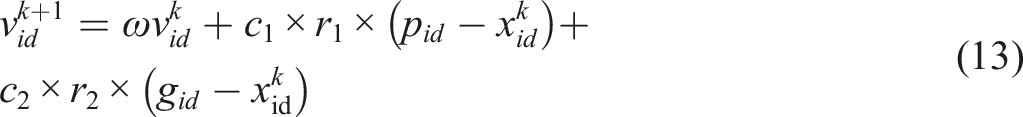

In the equations:
Induction heating temperature control simulation
Based on prior knowledge, the mathematical model of the CF-PP induction heating system is expressed as a first-order inertia system with a lag element, and it is represented by the following equation: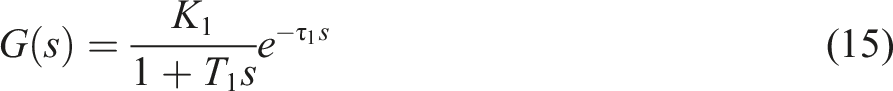
In the formula,
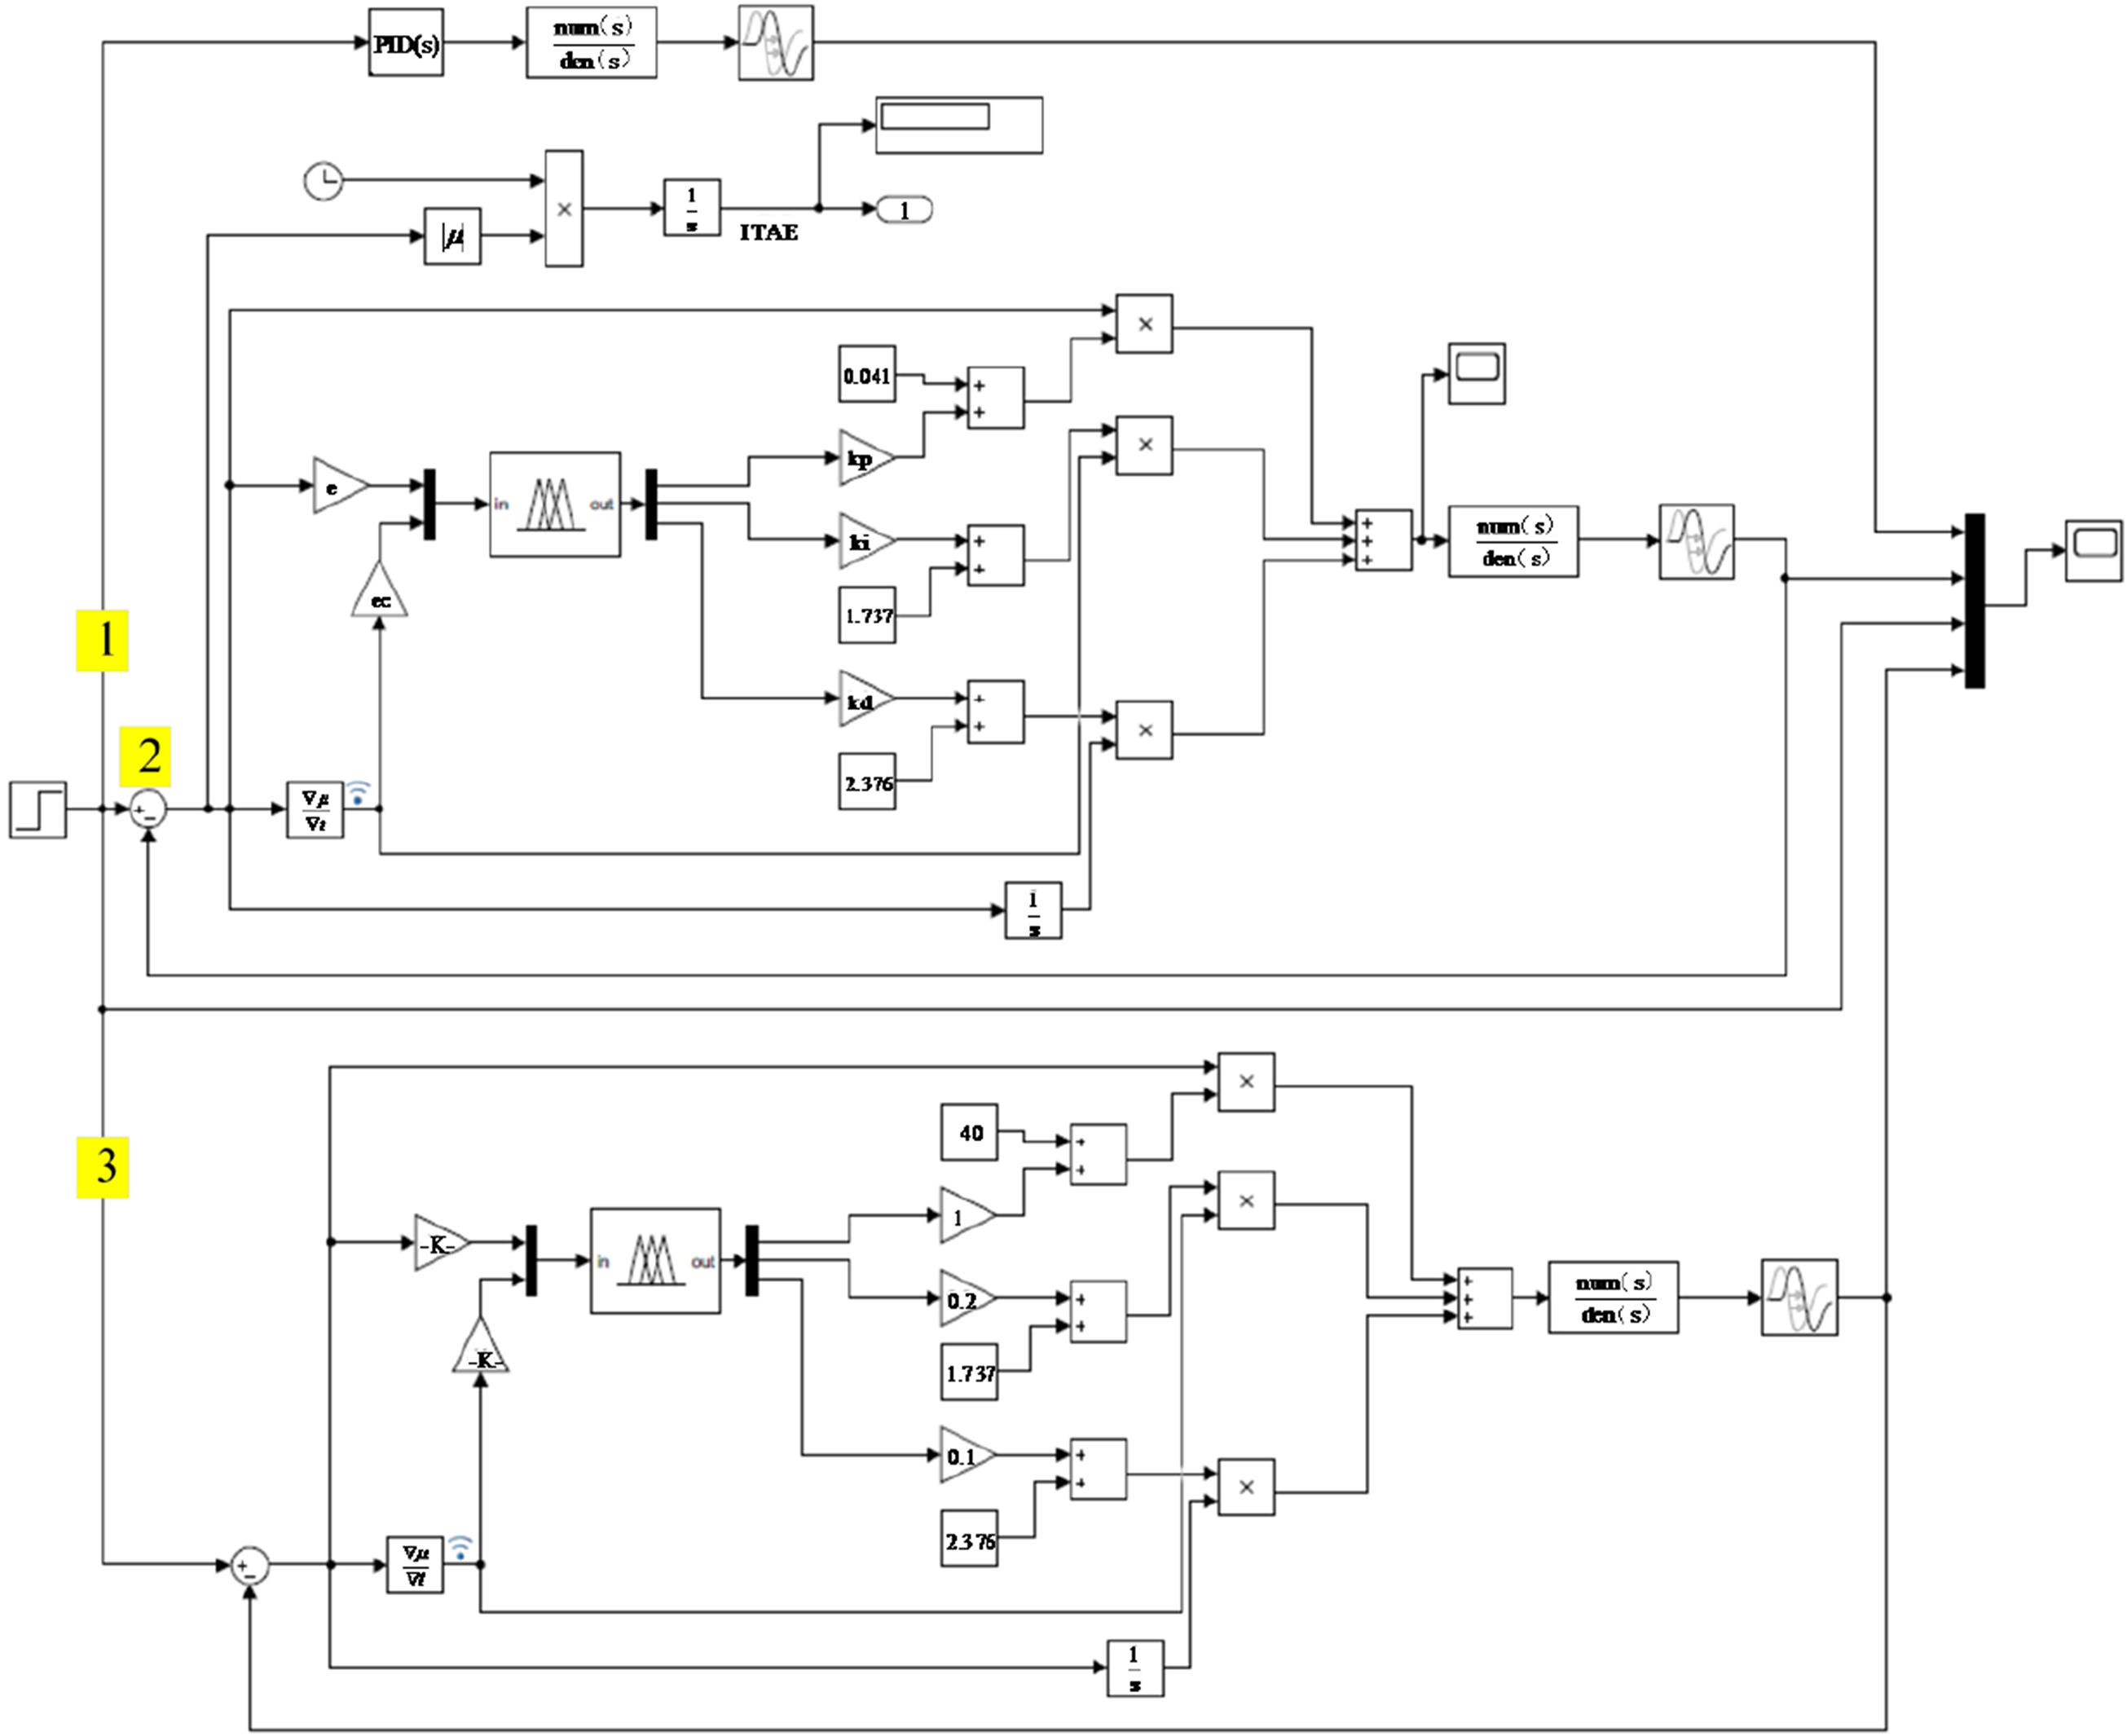
This experiment involves collecting data based on open-loop induction heating. Temperature values are collected every 0.5 s, with a total heating time of 2000 s. Genetic algorithm is employed to fit parameters for identification. Finally, the transfer function formula of the system is obtained. Simulation of induction heating temperature control simulink.
As shown in Figure 16, it illustrates the fitness values and parameter variation curves obtained from the simulation model that utilizes the PID temperature control method based on the Particle Swarm Optimization. In this figure, the proportional, integral, and derivative coefficients gradually decrease and stabilize with an increase in the number of iterations, indicating that the Particle Swarm algorithm exhibits good adaptability and disturbance rejection characteristics during the control process of CF-PP induction heating. Additionally, the PID parameters automatically adjust with the temperature operating state. Change curve of proportional, integral, and differential coefficients.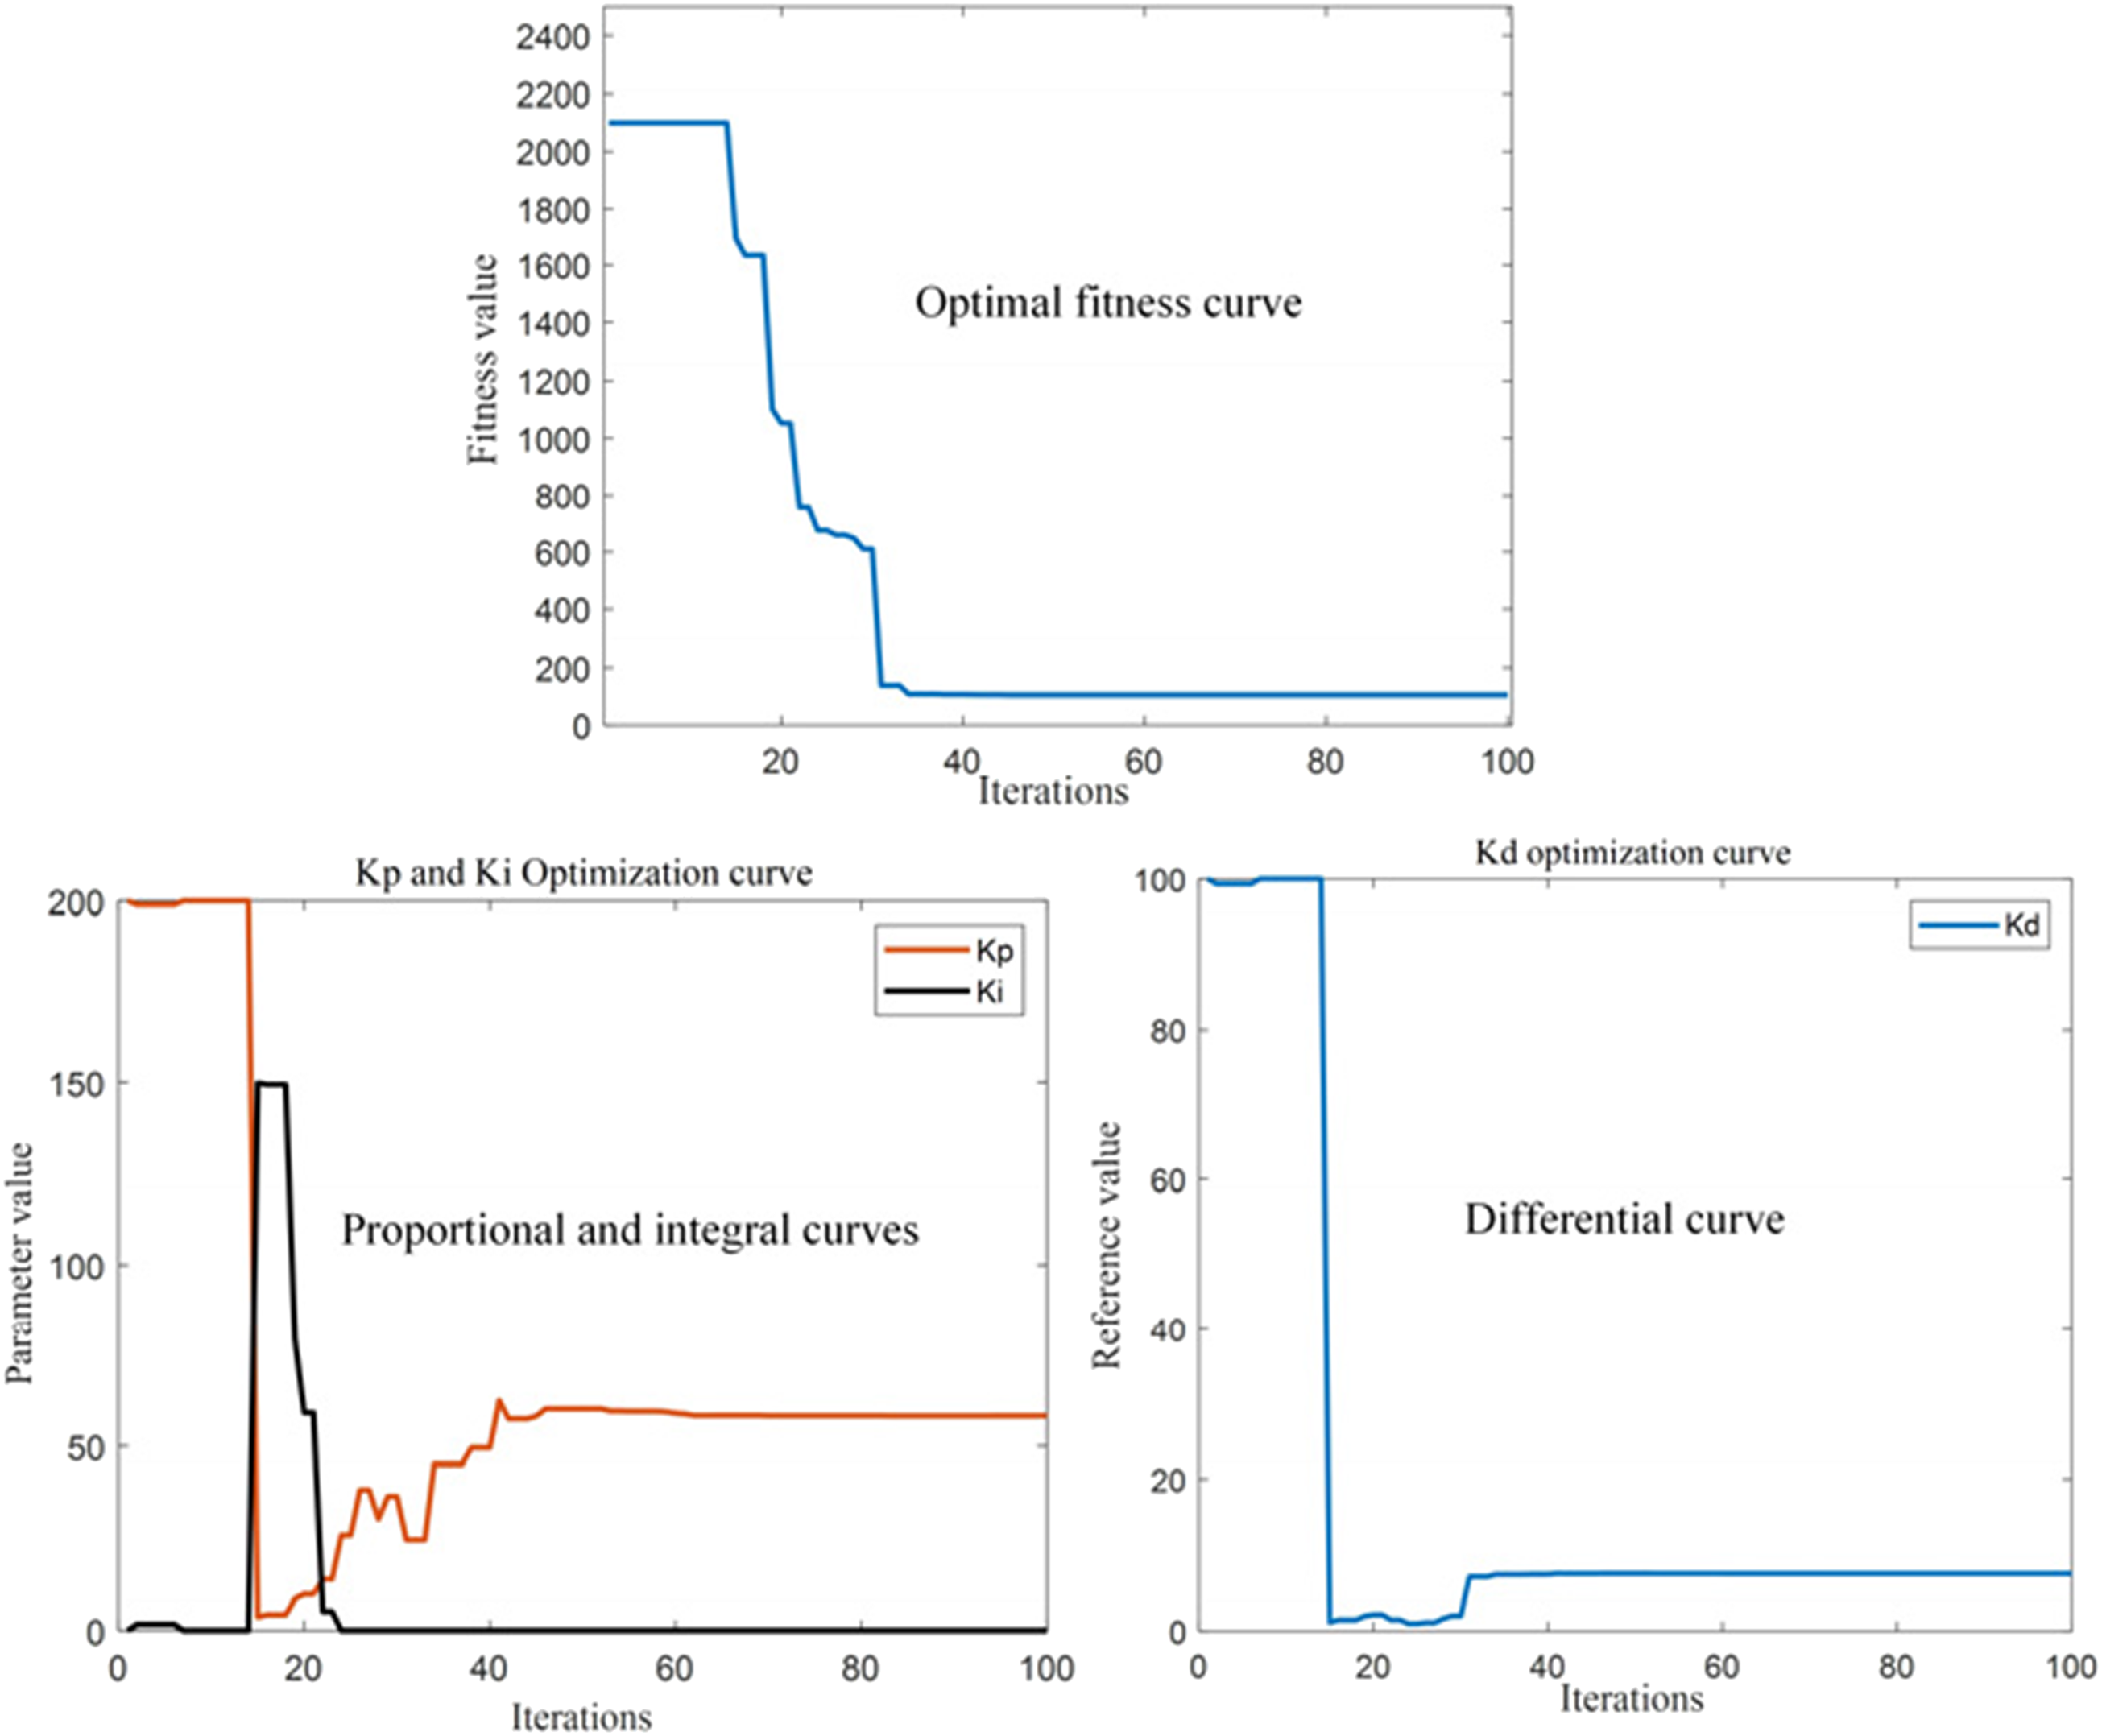
As shown in Figure 17, a comparison of three control algorithms for CF-PP induction heating systems reveals that all three control algorithms eventually achieve stable control. However, the PID control system and FUZZY-PID control system exhibit slower response, larger overshoot, and longer system adjustment transition time. FUZZY-PID control shows a reduction in overshoot and adjustment time compared to the PID controller, indicating that automatic adjustment of control parameters is beneficial for improving control process accuracy. From the graph, it can be observed that the IPF-PID control method has a more significant improvement compared to the FUZZY-PID control method. The overshoot and adjustment time are noticeably reduced, indicating that the optimization speed of parameters in this control method is faster, with higher optimization accuracy. Under the IPF-PID control method, the temperature rise time, overshoot, adjustment time, and steady-state error are all minimized. This suggests that this control method exhibits better dynamic performance than traditional control methods and effectively improves the quality of material forming. Adaptive response of three control methods.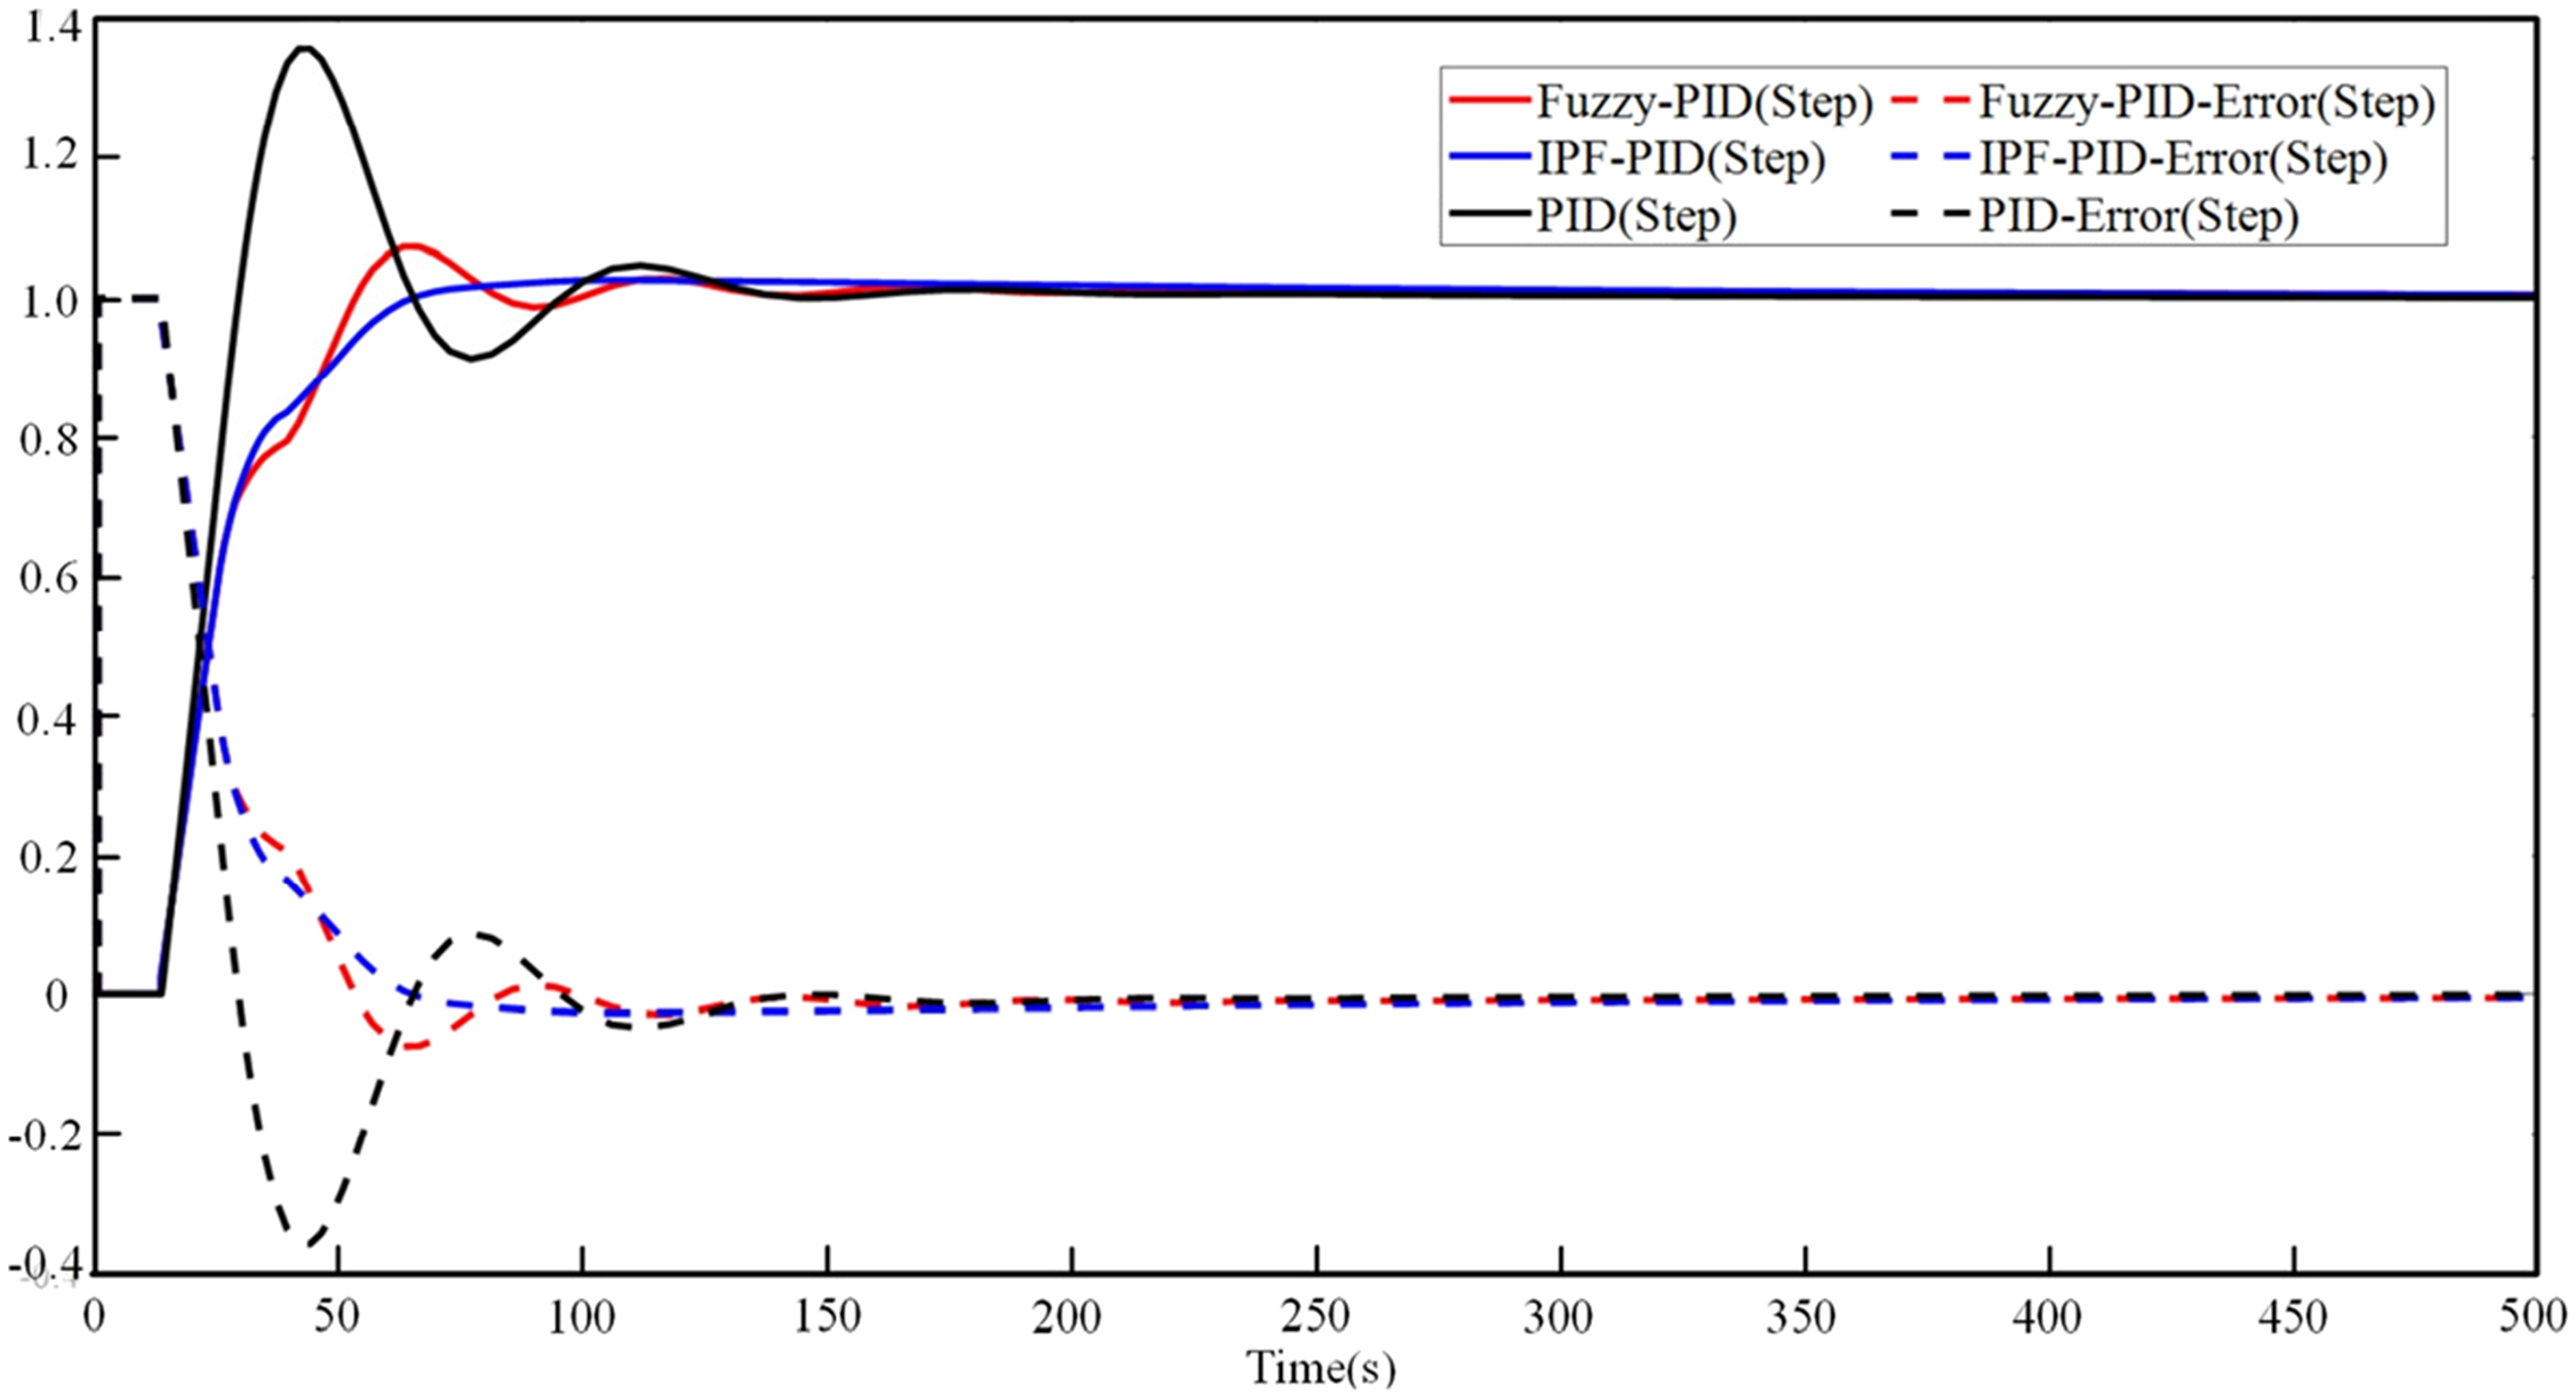
In order to assess the adaptability of three control algorithms in the inductive heating CF-PP shell system, a disturbance signal is inserted every 300 s during the heating process. This is done to observe the stability of temperature rise and the strength of anti-interference capability of each control algorithm under the influence of disturbances. As shown in Figure 18, the adaptive situations of the three heating methods under the disturbance signal are illustrated. From the graph, it can be observed that the IPF-PID model quickly returns to a stable state after receiving the system disturbance signal, with lower curve fluctuations and optimal anti-interference performance. The controller is able to maintain the stable operation of the system and quickly recover to a stable state in the case of small oscillations. This proves that IPF-PID has a good inhibitory effect on sudden disturbances in parameters, enhancing the stability of system operation. However, traditional PID and FUZZY-PID controllers exhibit larger fluctuations and longer recovery times to stability after each disturbance, indicating poorer stability performance. Adaptive performance of three heating methods under interference signals.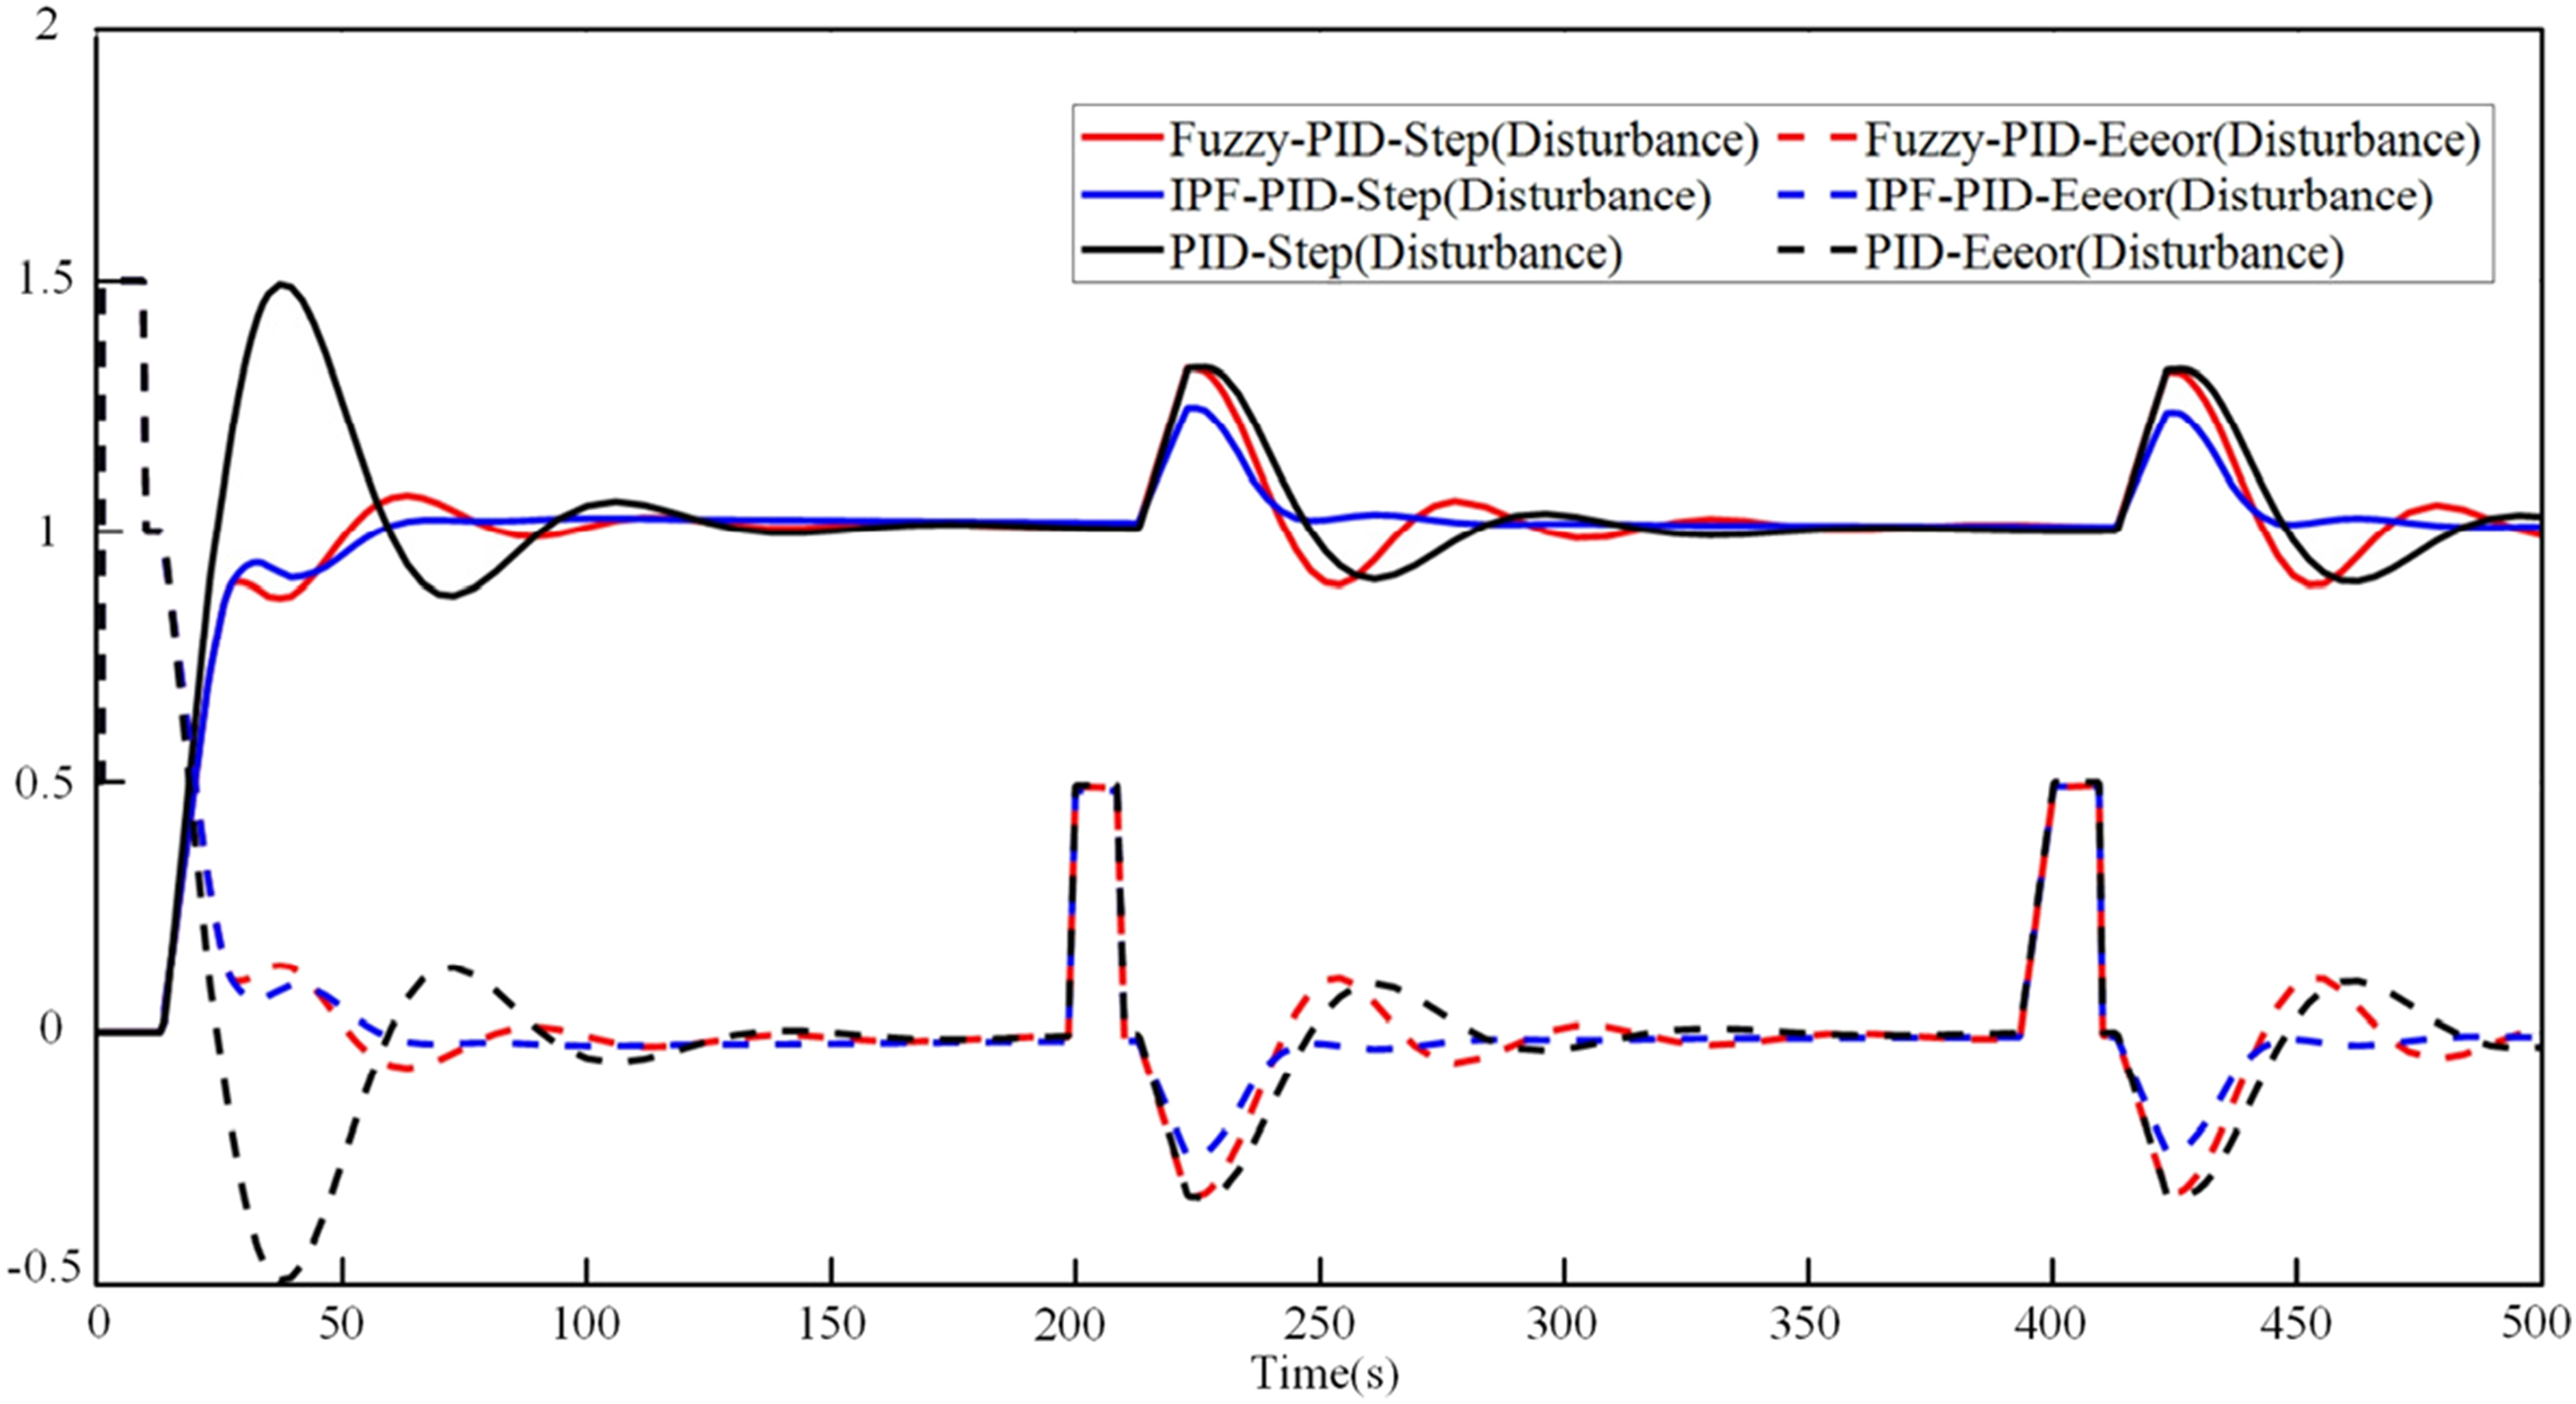
CF-PP induction heating temperature control experiment
Figure 19 shows the temperature field heating rate curves corresponding to the three control methods for the carbon fiber shell. It can be observed that the temperature variation in the traditional PID control method consistently exhibits significant fluctuations, making it challenging to achieve rapid temperature stabilization in the presence of external environmental changes. The temperature values fluctuate noticeably in the CF-PP inductive heating system. Under the FUZZY-PID control method, temperature fluctuations are significantly reduced, and the time required to reach steady state is decreased. However, the overshoot of temperature values remains relatively high, and the control effect is not ideal. When employing the IPF-PID control method, the temperature values show minimal fluctuations, with fluctuations around 1.5% after reaching a balance. This indicates good control performance and generally meets the precision requirements for temperature field control during the consolidation and molding process of composite materials. Additionally, the algorithm requires less time for temperature adjustment, effectively improving control sensitivity. Experimental curve of CF-PP induction heating rate.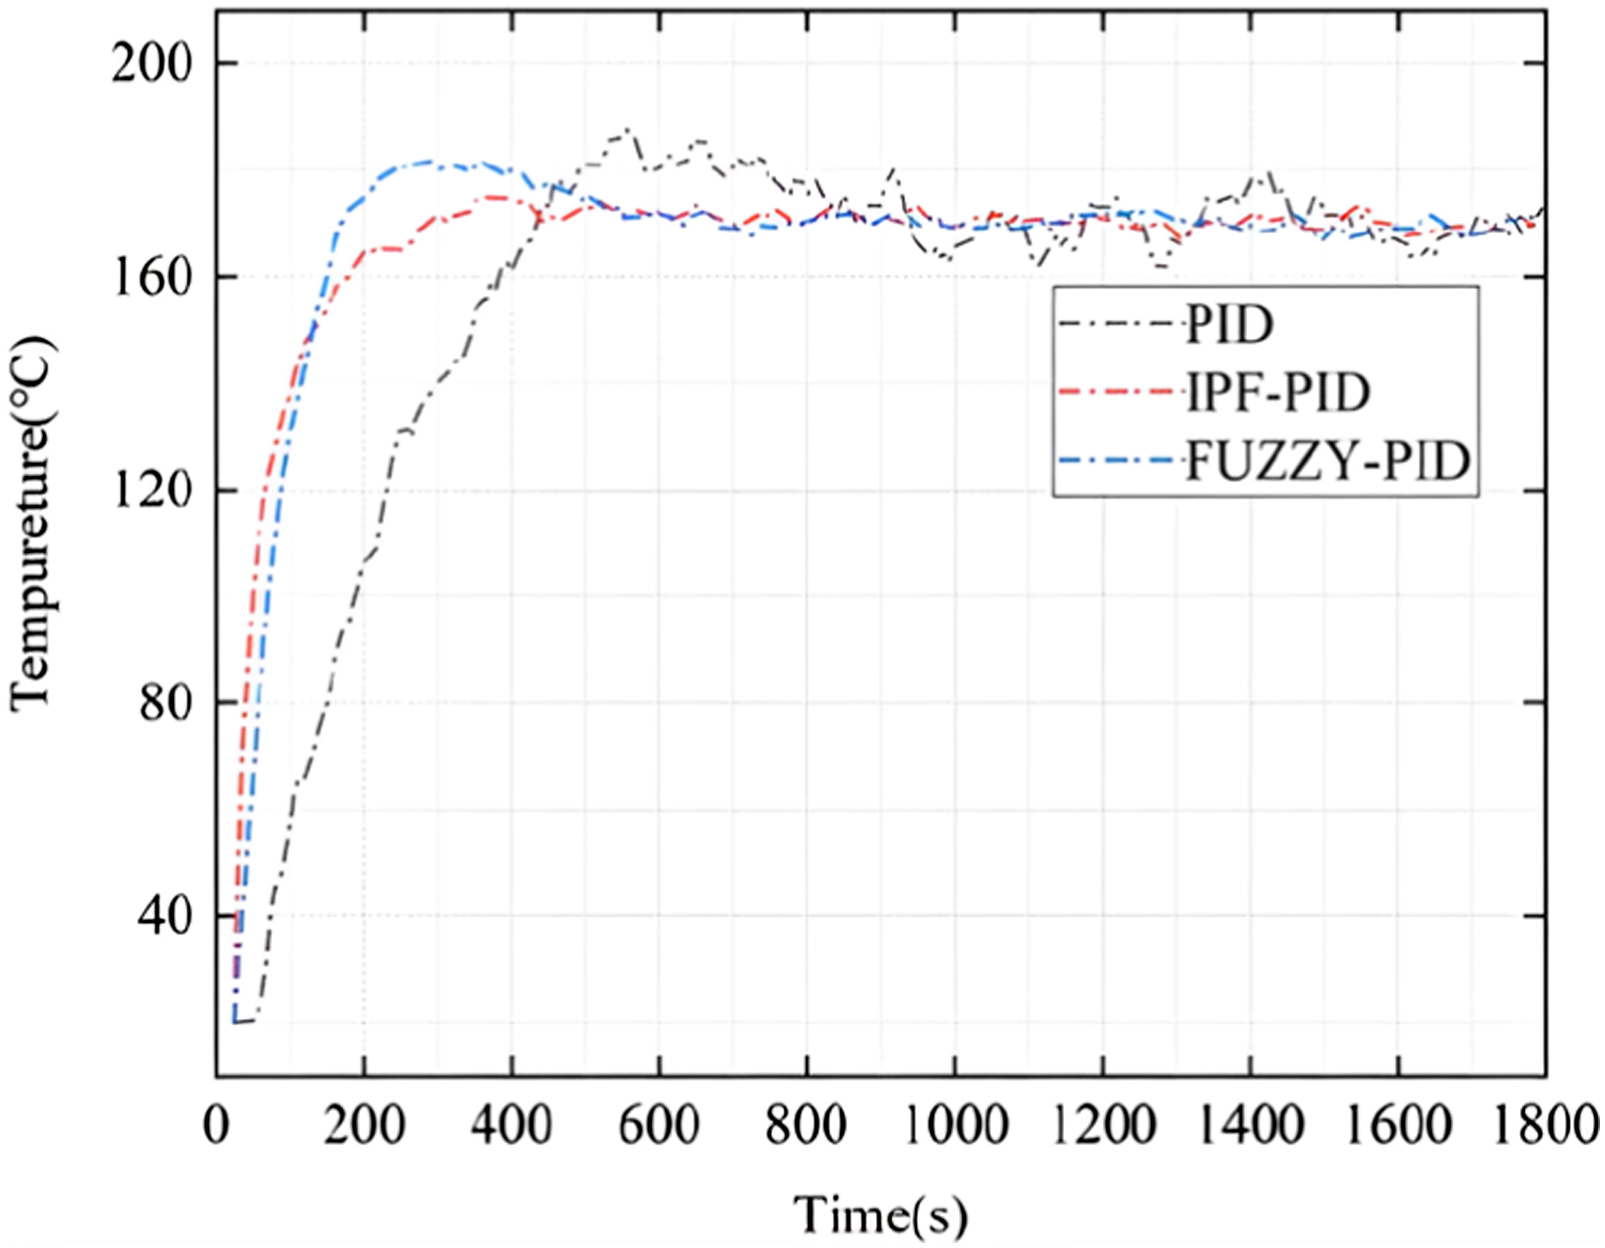
Figure 20 illustrates the temperature control experimental curves of the heating gradient for CF-PP using the IPF-PID algorithm. Curve a represents the heating process of the CF-PP plate, while curve b represents the target heating gradient. From the graph, it can be observed that during the heating process, the surface temperature of CF-PP generally exceeds the target heating gradient. The temperature error is around 2.5%, and the heating process of CF-PP essentially conforms to the target heating gradient. The overshoot and stability during the holding process at 100°C and 135°C are relatively high, meeting the temperature control precision requirements for CF-PP plates in the inductive heating process. Temperature control experimental curve of CF-PP induction heating temperature gradient.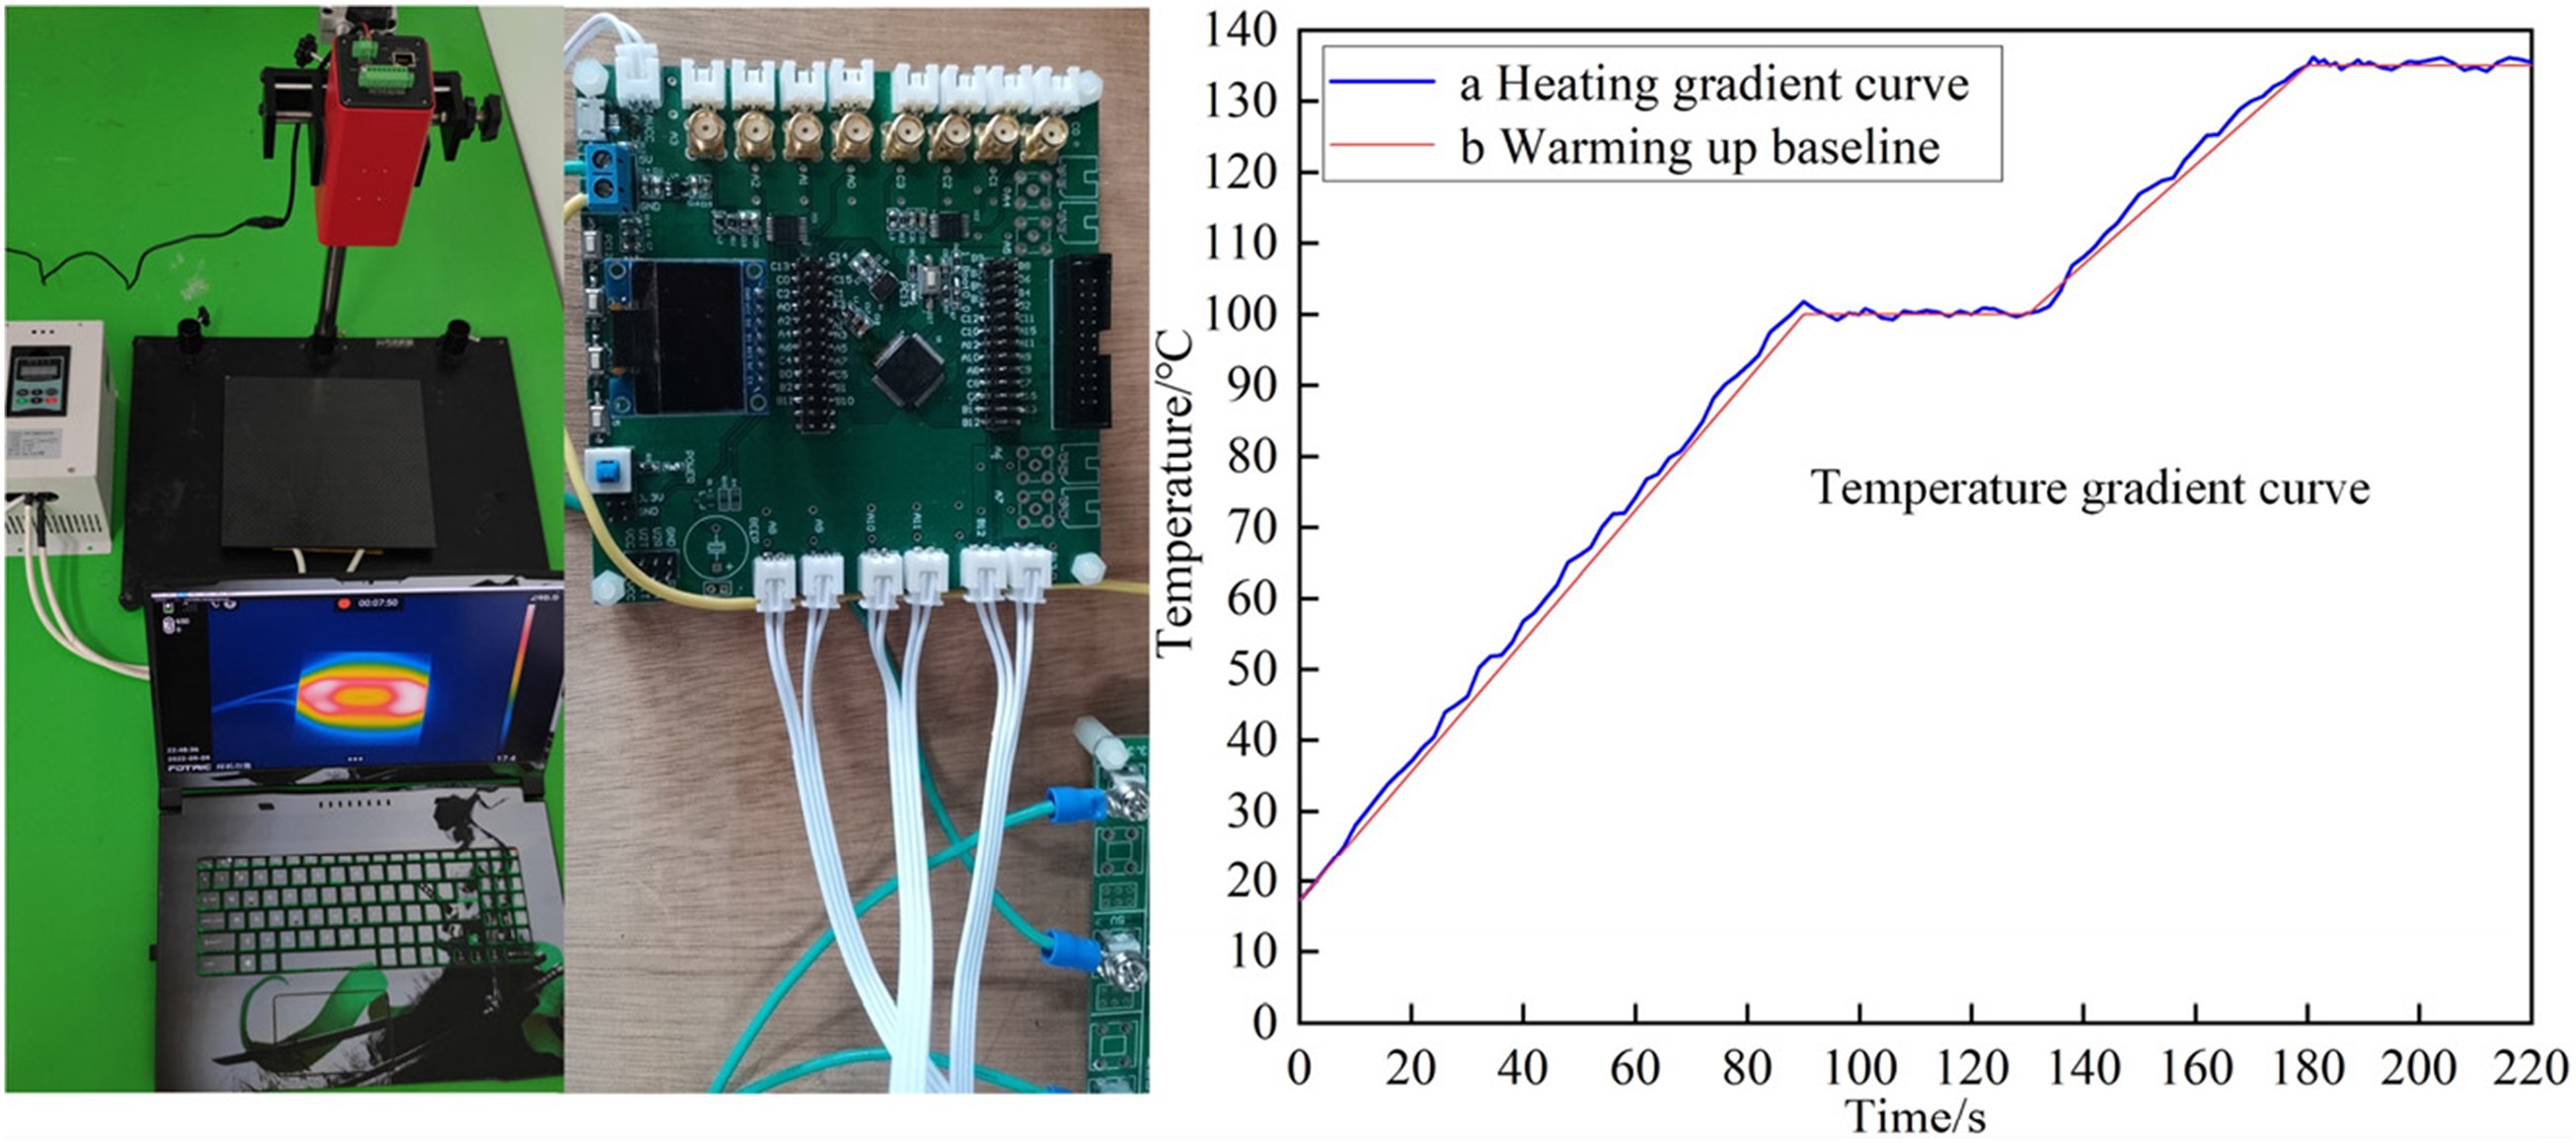
Conclusion
1. In this study, we first established a finite element microscale analysis model for the induction heating of a single-layer plain woven CF-PP panel based on the real internal structure of the CF-PP panel and its own equivalent electro-magnetic-thermal properties. We investigated the temperature field variations within the CF-PP panel during the induction heating process and explored the process by which heat generated within the fiber structure is conducted to the material’s surface. This study provides evidence of a certain degree of hysteresis in the temperature field changes on the material’s surface during the CF-PP heating process. 2. A macro model for CF-PP induction heating with a multi-layer plain weave pattern was established. This model calculated the temperature conduction process between material layers and analyzed the losses and lag in temperature conduction between the layers. Experimental data on the temperature distribution on the material surface and between layers of CF-PP flat panels during the induction heating process were obtained. These experiments confirmed the existence of a certain temperature lag in CF-PP during the induction heating process and also validated the accuracy of the finite element model established and analyzed in this study. This research provides a theoretical basis for the temperature control process. 3. To enhance temperature control accuracy and mitigate the errors caused by the lag in CF-PP heating and the inherent delays of the temperature control system, this study employed a temperature control approach using the Particle Swarm Optimization (PSO) algorithm. An improved IPF-PID controller based on inertial weight parameters was developed. Simulation results using a Matlab temperature control model showed that the improved IPF-PID control exhibited significantly enhanced stability, precision, and resistance to disturbances compared to traditional PID control methods. Furthermore, experiments were conducted on a CF-PP flat panel induction heating temperature control platform, where various target temperature values were tested. These experiments demonstrated that the temperature overshoot on the material surface during the heating process was minimal, and the stability of temperature control after reaching the target value was excellent. This confirms that the improved IPF-PID control approach established in this study effectively regulates the heating curve during the CF-PP heating process.
Footnotes
Author’s note
The statements, opinions and data contained in all publications are solely those of the individual author(s) and contributor(s).
Author contributions
Conceptualization, Shan Yan; methodology, Shan Yan and Tianyu Fu; investigation, Shan Yan; project administration, Tianyu Fu; data curation, Yunfei Gu; writing—original draft preparation, Shan Yan; writing—review and editing, Tianyu Fu.
Declaration of conflicting interests
The author(s) declared no potential conflicts of interest with respect to the research, authorship, and/or publication of this article.
Funding
The author(s) disclosed receipt of the following financial support for the research, authorship, and/or publication of this article: This work was supported by the National Natural Science Foundation of China, grant number 52303031 and Research Laboratory of Carbon Fiber Pressure Vessel Forming Technology, grant number KYPT202203Z.
IRB statement
“Not applicable” for studies not involving humans or animals.
Data availability statement
Data will be available on reasonable request.