
Abstract
This study addresses the experimental investigation of the influence of the thread count of carbon fiber (CF) twill textile-reinforced polyamide 66 laminates on their inductive heating behavior. By means of stationary heating experiments of laminates, different twill 2/2 fabrics have been investigated. The used twill 2/2 fabrics differ only in thread count and consequently in their area weight. Due to the different area weight, the manufactured laminates differ in the number of plies to guarantee an equal fiber volume content in each plate. In order to evaluate the heating behavior of the different specimens, the heating rates of both surfaces of the specimens were measured and compared. Thus, it was found that a lower thread count promotes a faster inductive heating of CF twill 2/2-reinforced polymer composites. Further investigations based on microsection analysis and measurements of rovings cross-section shape revealed that the increase of heating rates at lower thread counts relies more on the number of fabric layers. Through a higher number of fabric layers, the total contact area will be higher due to more interply and intraply contact interfaces which occur in the laminate.
Introduction
For lightweight design, carbon fiber (CF)-reinforced polymer composites (CFRPC) are particularly suitable since they provide outstanding strengths and stiffness in relation to their density. However, the application of CFRPC is still hindered by a lack of manufacturing processes, which are suitable for an industrial mass production. One approach to overcome this issue tends to exploit the advantages of thermoplastics polymers within the manufacturing of lightweight structures made of CFRPC. Thermoplastic polymers can be reversibly molten and solidified. This enables thermoplastics to be reshaped and welded. 1 For both kinds of processes, the thermoplastic matrix of the semifinished material has to be heated up above melting temperature. In order to increase the productivity as well as the efficiency of the whole production chain of thermoplastic CFRPC parts, appropriate heating technologies are necessary.
Especially, the induction heating technology provides a very fast and contactless intrinsic heating of CFRPC laminates. 2 –5 Therefore, this technology is used for welding thermoplastic CFRPC parts in aerospace and other industries. 6,7
Induction heating is based on an induction coil through which a high frequently alternating current runs. Consequently, an alternating magnetic field with the same frequency is emerged around the induction coil. If an electrical conductive or magnetic material is exposed to this magnetic field, the material is heated up. Since CFs have a sufficient electrical conductivity, eddy currents can be induced within the fibers by means of induction. However, it is essential that the fibers provide cross junctions so that electrical loops can be evolved. 8 –10 Miller et al. 11 showed that a single ply of unidirectional prepreg cannot be heated by means of induction in the common frequency range, since no complete current loop is formed. Therefore, the CF reinforcement of the laminate has to provide cross junctions. This requirement is easily met in the case of CF reinforcement textiles, for example, woven fabrics like twill, satin, plain, or noncrimped fabrics (NCF). By using woven textiles, the electrical loop is already provided through a single ply. In the case of a laminate consisting of several unidirectional plies (NCF) which were aligned in different orientations, the electrical loops are provided between the adjacent plies. Based on an experimental investigation, Rudolf et al. 9 stated that the frequency, the generator power, the distance between induction coil and laminate, the induction coil geometry, and the laminate layup have a significant influence on the induction heating behavior of thermoplastic CFRPC laminates.
Within this study, the influence of the thread count of CF twill textile-reinforced polymer laminates on the inductive heating behavior is investigated by means of static heating experiments. The thread count describes the number of rovings in warp and weft directions of a woven fabric (Figure 1). In the case of balanced fabrics, the thread count c and the linear mass density ρlin of the CF rovings in warp and weft directions are the same, respectively. Both parameters determine directly the area weight of the fabric, which can be calculated by equation (1). Hence, a reduction of the thread count c at constant linear density ρlin leads to a reduction of the area weight ma at the same rate.
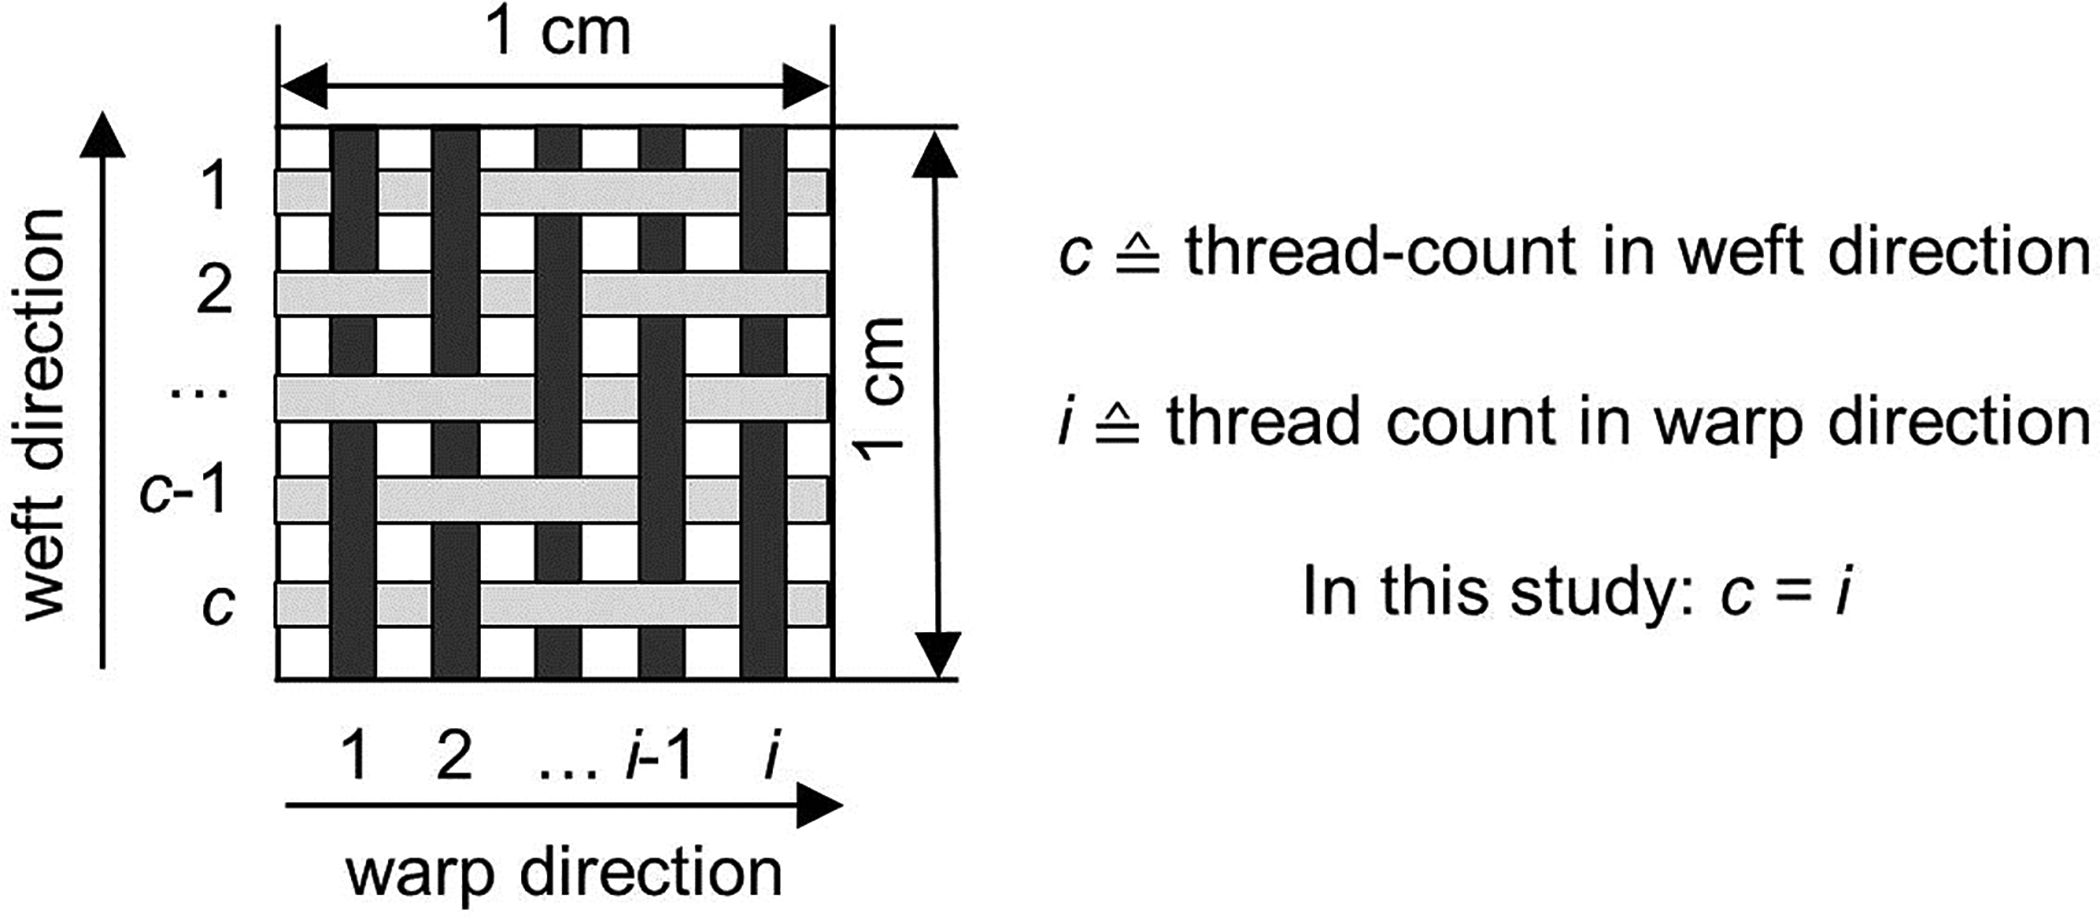
Schematic depiction of the thread count in weft and warp directions of a plain fabric. Since only balanced CF twill fabrics were used within this study, the thread count in weft and warp directions is the same.

This approach will provide additional information to understand the interaction of the three heating mechanisms in the case of CF reinforcement fabrics. Initially, the used materials and their manufacturing will be shown. Subsequently, the experimental setup and the implementation of the static heating experiments will be introduced. Finally, the calculation method of the heating rates of laminate surfaces based on the measured heating curves will be described in detail and the gained heating rates as well as a microsection analysis of the specimens’ cross section will be compared to explain the conclusions.
Fundamentals of induction heating
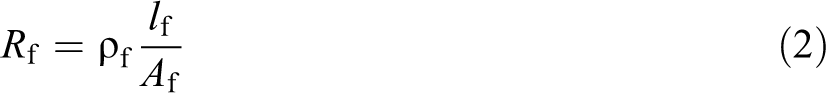
The generation of heat due to the eddy currents underlies three different mechanisms (Figure 2). 12 These three mechanisms can be separated into one fiber heating and two junction heating mechanisms. The fiber heating mechanism is also known as Joule losses. Due to the fiber’s electrical resistance Rf, heat is generated within the fiber if an eddy current runs through it. This heating mechanism is seen as the dominant heating mechanism in the literatures. 9,11,13 The electrical resistance of a fiber Rf is determined by its electrical resistivity ρf, length lf, and cross-sectional area Af and can be calculated by the following equation. 10
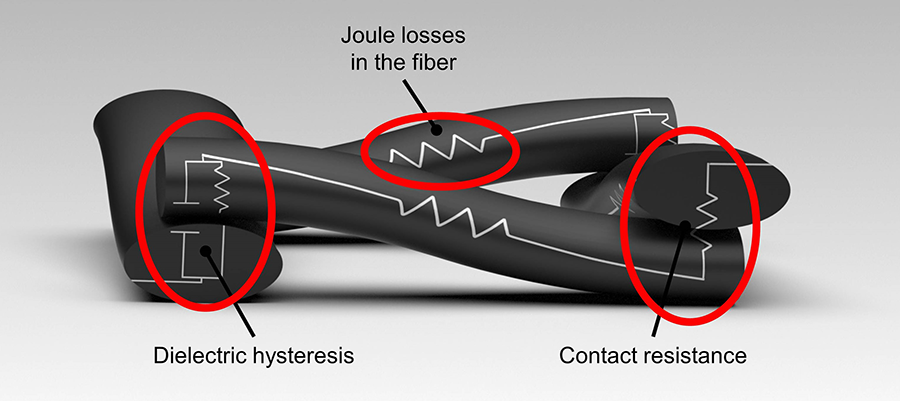
The three heating mechanisms which affect the heat generation during the induction heating of CFRPC.
By contrast, the junction heating mechanisms occur between fiber–fiber junctions. In the study by Fink et al., 10 it is showed that in cross-ply laminates, the maximum temperatures occur within the junction areas which are located under the induction coil. These are the junctions were the current have to change the layer (ply–ply orientation change) in order to obtain a closed electric circuit.
The first junction heating mechanism describes the heat generation due to contact resistance Rjc between two fibers which are in contact at the junction. 12 The contact resistance value Rjc can be measured by means of an experimental setup described in the study of Yarlagadda et al. 3 Since this value depends on the contact pressure of the fibers, 3,12 the fiber volume fraction ϕ, the kind of fabric reinforcement, and the area weight ma are significant important.
If two fibers are not in contact at a cross junction, since they are separated by a thin layer of matrix, the second junction heating mechanism occurs. This mechanism is based on dielectric hysteresis losses and was introduced for the first time by Fink et al. 10 It will appear if the matrix is dielectric. In this case, the crossing CF, which is separated by the matrix at the fiber–fiber junction, behaves like a capacitor and a resistor, which are connected in a parallel circuit. According to Yarlagadda et al., 3 the equivalent resistance Rjd can be described by the following equation.
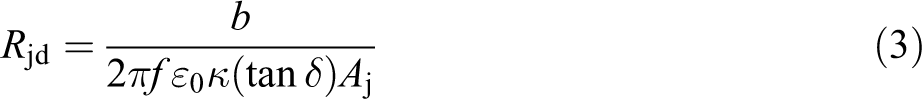
where b is the fiber-to-fiber separation distance at the junction, Aj is the projection area between two fibers at the interface, f is the frequency of the electromagnetic field, ε0 is the permittivity of the vacuum, κ is the dielectric constant of the matrix polymer, and tan δ is the electrical dissipation factor of the matrix.
By means of all three heating mechanisms, the total generated heat

where I is the induced current.
As described in the study by Hümbert et al.,
14
the temperature on the induction coil-faced surface and the opposite surface is not equal. This phenomenon is due to the law of Biot-Savart,
15
which is described by equation (5). It describes the magnetic field intensity
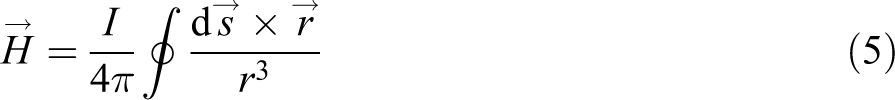
Often, the so-called skin effect is seen as a second phenomenon, which contributes to the temperature difference on both laminate surfaces. 11,13 The impact of the skin effect can be described by the penetration or skin depth δ which can be calculated by equation (6), where ρlam is the overall electrical resistivity of the laminate, μ is the electrical permeability, and f is the frequency of the magnetic field. 16 The skin depth δ is the depth under the induction coil-faced laminate surface at which the current density is equivalent to 1/e-times of the value at the surface.
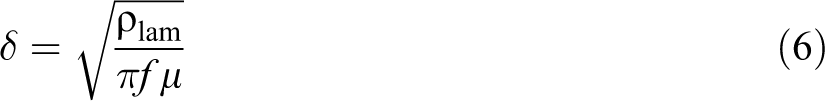
However, Wentworth et al. 17 proved, by considering the wave reflection at the backside of the conductor, that in the case of thin conductive sheets, the skin depth is larger than the thickness of the actually heated sheet. Duhovic et al. 18 calculated the skin depth for a CF-polyphenylene sulfide laminate which is inductive heated by means of a frequency of 540 kHz. In this case, the skin depth δ is higher than the thickness of the used laminate stack, which is 4 mm. Also, Hümbert et al. stated this conclusion by means of experiments. 14
To calculate the heat distribution within a laminate which is heated by induction, different approaches can be found in the literature. Lin et al. 13 used an approximated planar resistance of the laminate. This planar resistance is deduced from Fink et al. 10 Fink et al. 19 developed a theory which was mainly based on the dielectric hysteresis heating which considers the interaction between single fibers using an electric field concept. Fink et al.’s 8 theory was extended by multilayer interactions which occur through the thickness direction in a CFRPC laminate. For this approach, a simplified representation of a laminate’s cross section which consists of unidirectional CF layers was used. Within this capacitive layer model, the fiber volume fraction and the fiber packing geometry are considered. Based on this model, Fink et al. stated that the fiber volume fraction should be maximized and the fiber diameter should be minimized for a fast inductive heating. By merging the approaches from Fink et al. 19 and Fink et al., 8 Fink et al. 20,21 developed an advanced 3-D finite element model to calculate the heat distribution within a laminate based on dielectric losses. Yarlagadda et al. 3 showed that the junction heating mechanisms dominate compared to fiber heating. However, they stated that the ratio of the mechanism is dependent of the conductive fiber architecture. If both junction effects, contact resistance and dielectric hysteresis losses, are sufficiently provided by the fiber structure, contact resistance will be the dominant heating mechanism. Kim et al. 22 developed a numerical model to predict the in-plane heat generation patterns during induction heating of CFRPC prepreg stacks. The model was validated by means of specimens made of AS4/PEI prepreg stacks and is based on the three presented inductive heating mechanisms. Schieler et al. 23 investigated the through-thickness temperature distribution by means of a 1-D analytical model validated through inductive heating experiments. The model considers the inductive heating by applying the Maxwell equations, heat conduction, as well as the thermal convection. For the electrical conductivity of the laminate, only one value is used. Based on Kirchhoff’s circuit laws, Yarlagadda et al. optimized a metal mesh susceptor to achieve a uniform in-plane heating of the specimen without an adaption of the induction coil. 24 In this case, an ideal electrical connection between conductors in 0 and 90° directions is provided. The contact resistance at the junctions was not considered.
Most of the literature concerning the investigation of the inductive heating mechanisms in thermoplastic CFRPC consider only noncrimped laminates 12,22,25 –27 or single fibers which provide ideal contact conditions. 3,8,19 –21
Rudolf et al. 9,28 investigated the influence of different CF woven fabrics on the inductive heating behavior of CFRPC laminates. Rudolf stated that the bigger the contact area between the CFs, the higher is the heating rate. Since the contact area and the electrical contact conditions depend on textile parameters like thread count and linear density of the rovings, it is essential to investigate their influence on the heating behavior. Only if the influences of these textile parameters are known, precise calculation models can be developed which consider the CF architecture within the laminate.
Materials
The heating experiments were carried out with several specimens consisting of different balanced CF twill fabrics (Table 1). These twill fabrics differ in the thread count c and, therefore, in their area weight ma. Since all four twill textiles have a different area weight ma and all specimens should provide a fiber volume content (FVC) of ϕ = 50% as well as a target laminate thickness of hlam,tar = 2.2 mm, the number of CF twill fabric plies n of the laminates will differ. By means of equation (7), the necessary number of CF fabric plies is calculated. For density of a CF ρCF, a value of 1.78 g/cm3 was used.
Overview of the different CF-reinforcement fabrics.a
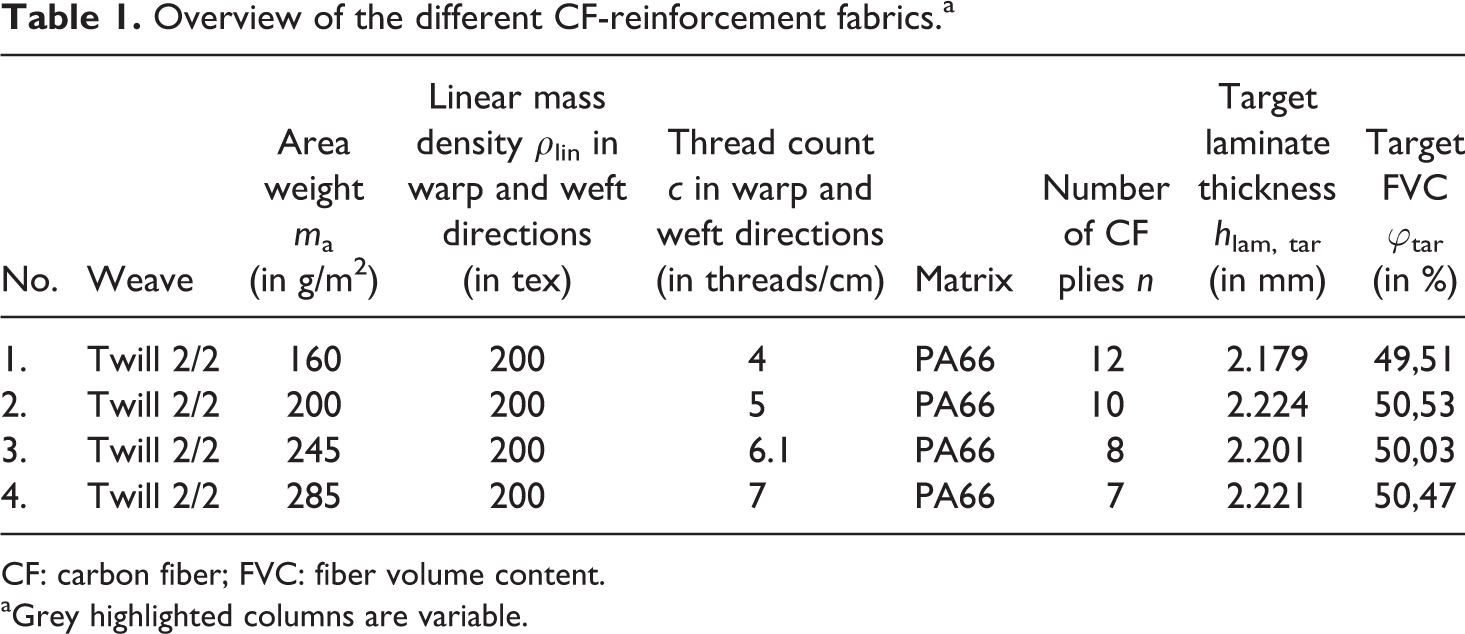
CF: carbon fiber; FVC: fiber volume content.
aGrey highlighted columns are variable.

There are two other strategies for the laminate structure, which could be used within this study. The first one intends to use the same number of fabric plies in order to achieve a constant FVC. In this case, the laminate thickness and consequently the volume of the laminate which has to be heated would vary. However, this strategy would not allow a comparison of the heating behavior. Since the heating power would be kept constant, the specific heating power density becomes lower if the volume of the laminate is increased.
The other strategy intends to keep the laminate thickness as well as the number of plies constant. However, the FVC would vary in this case. Due to the crucial and complex influence of the FVC on the induction heating behavior of CFRPC, 29 this strategy is also not adequate for this study. Since the influence of FVC and varying plate thickness are more significant than that of a varying number of plies, the strategy adopted first was followed up.
The linear mass density of the used roving was kept constant with ρlin = 200 tex. All specimens have the same polymer matrix, polyamide 66 (PA66) Ultramid A4 H from BASF, Ludwigshafen, Germany.
In order to ensure that the CF fabrics are also electrically comparable, only polyacrylonitrile-based CF fabrics consisting of high tensile CF were chosen for this study (Table 2). All CF rovings, despite the one from the twill with an area weight of 285 g/m2, provide the same electrical resistivity and the same specific heat capacity. Since the electrical resistivity and the same specific heat capacity of the CF fabric twill with an area weight of 285 g/m2 are negligible higher, this fabric was also used within this study.
Characterization of the CF types which were used in the four different CF fabrics.
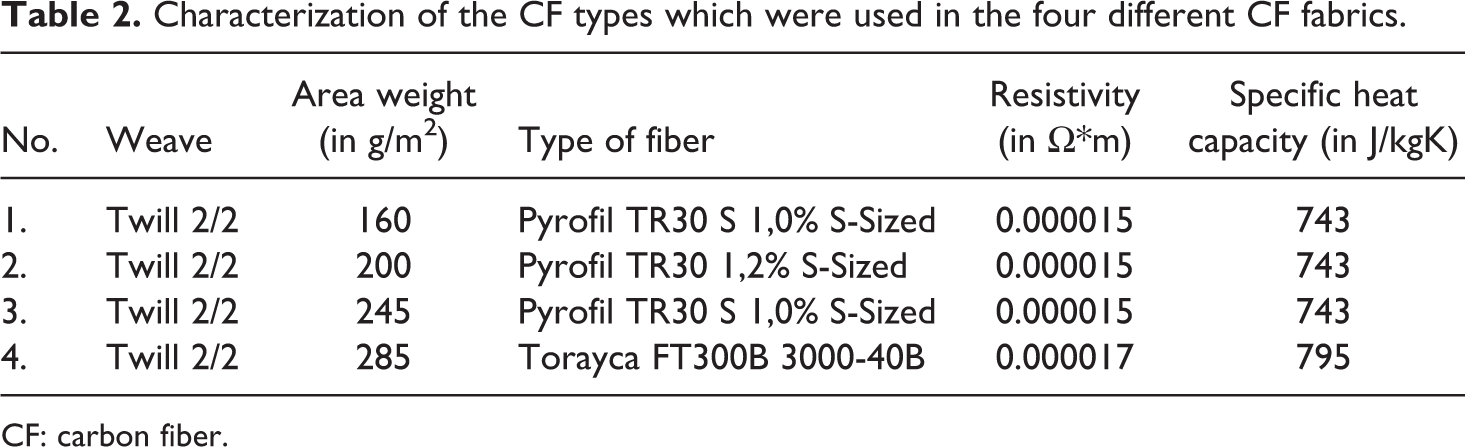
CF: carbon fiber.
The specimens were produced by means of a film-stacking in combination with an autoclave process. In order to ensure a homogeneous distribution of the CF plies over the laminate thickness, the film stack was built as symmetrically as possible. The used PA66 films provide a thickness of 100 µm. Therefore, always 11 layers of PA66 films were used for each specimen. The maximum temperature of the autoclave process was 280°C which was hold for 25 min. In order to ensure a proper impregnation of the CF rovings, a pressure of 24 bar was applied during the heating and cooling phase. This pressure value was chosen based on experiences. The edges of the film stack were sealed, so that the polymer cannot be squeezed out, but the trapped air can be evacuated. Polished metal plates were used to apply a homogeneous pressure at the bottom and at the top of the film stack and to ensure the same quality on both laminate surfaces.
Within one autoclave process, four organic sheets, each with a different kind of CF twill fabric, were produced with a size of 400 × 150 mm2. Subsequently, four specimens with the size of 150 × 100 mm2 were cut out of each sheet. In order to simplify the distinction of the specimens, they will be named “Twill” plus their area weight without an unit, for example, “Twill160” for the twill fabric with an area weight of 160 g/m2.
In order to ensure that the fiber volume fraction and the laminate thickness will have no influence, both values were measured after the specimens were manufactured. The fiber volume fraction of the specimens are between ϕ = 51% and ϕ = 53% (Figure 3). The fiber volume fractions were determined by means of a volumetric calculation in combination with weighing the cut specimens. The thickness of the specimens is between hlam = 2.10 mm and hlam = 2.15 mm. Every specimen’s thickness was measured once. Thus, an average value could be calculated, which is based on four measured thicknesses per sheet.
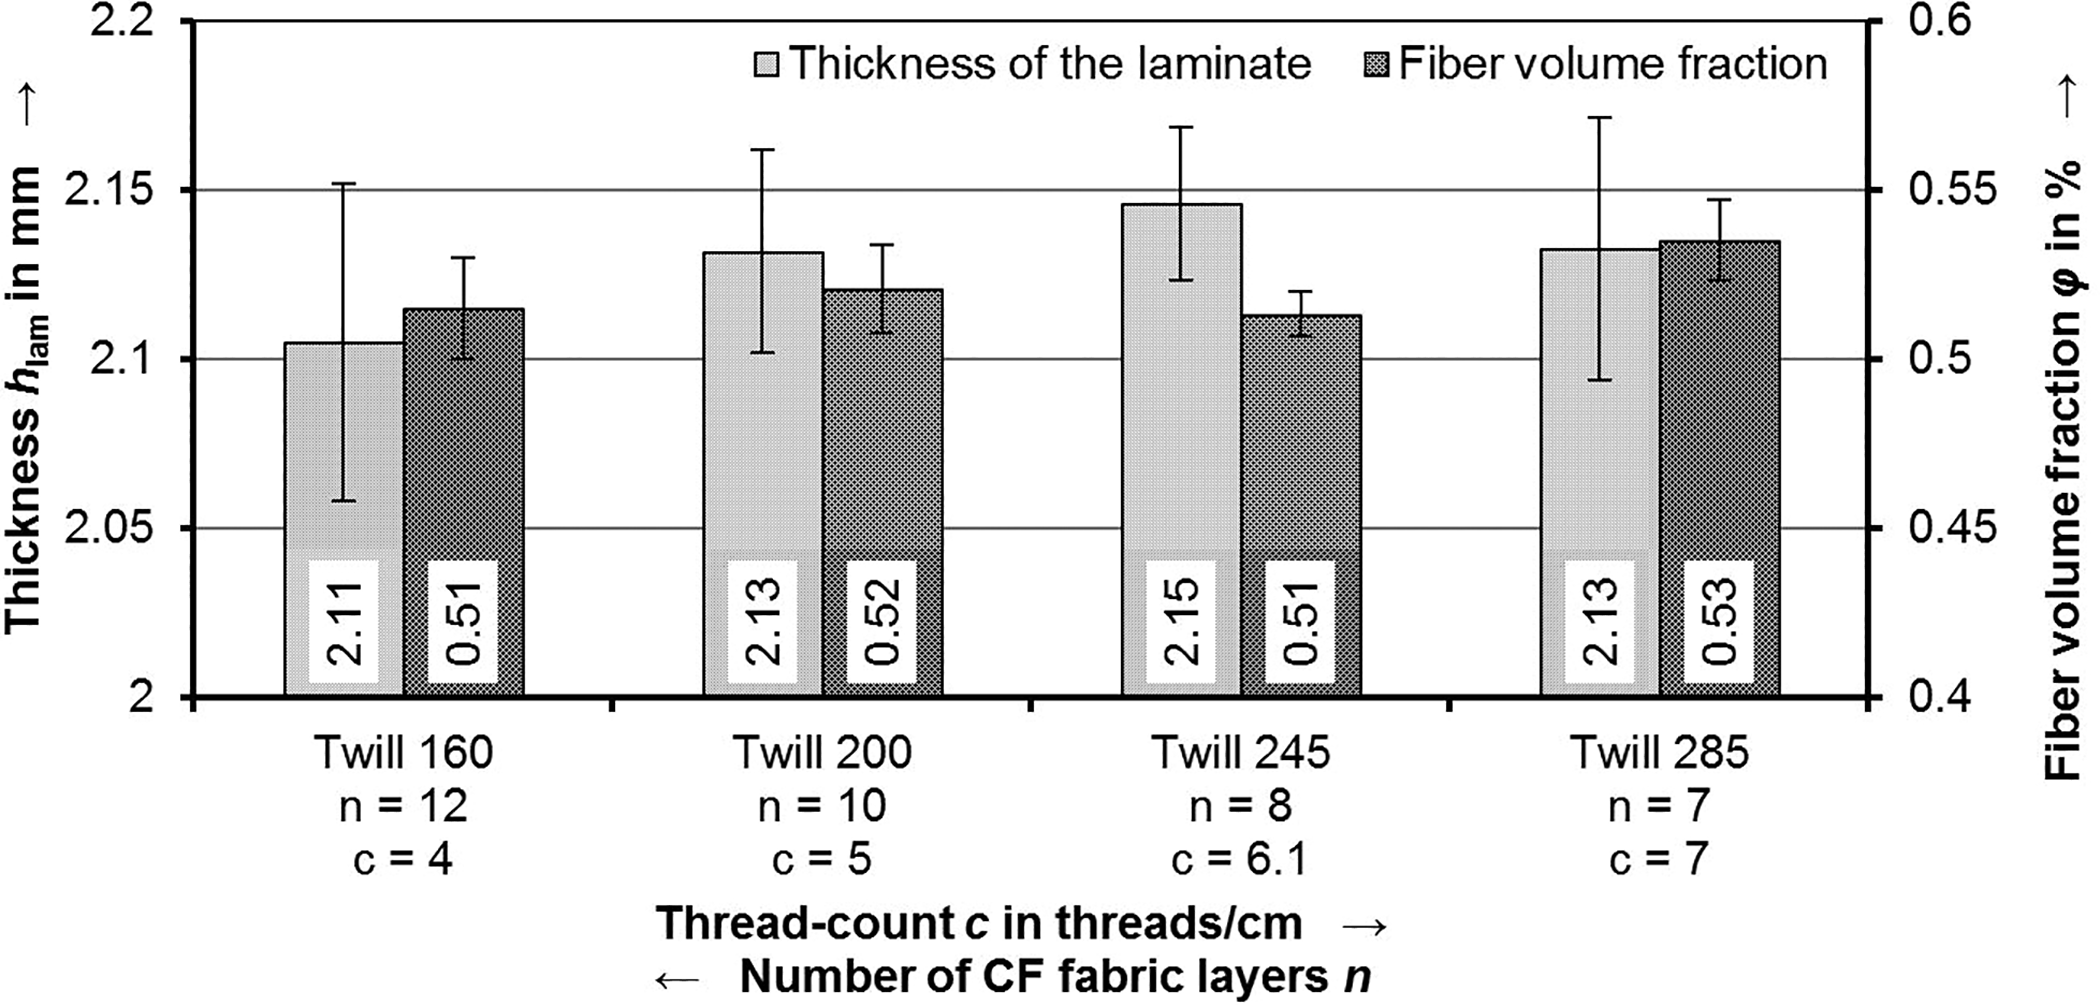
Laminate thickness hlam and fiber volume fraction ϕ of all specimens. Note: The zero point on the thickness as well as on the fiber volume fraction scale is suppressed. The FVC was calculated by means of the specimen’s size, weight, number of CF plies, and the specific area weights.
Before the experiments were carried out, all specimens were conditioned in an oven at 90°C for 12 h, to ensure the same initial conditions for every specimen.
Experimental setup
Since the heat transport due to convection is different between the top and the bottom surface in the case of a horizontal mounted plate, the specimens were mounted vertical for the heating experiments (Figure 4). The experiments were conducted by means of a circular pancake coil with a diameter of 25 mm and a constant coil-laminate distance of a = 5 mm. As induction generator, a Power Cube PW3-32/400 from CEIA, Arezzo, Italy, was used. It offers a maximum absorbed power of 2.800 W. Since the nominal operating frequency of this induction generator is around 400 kHz, the skin effect can be neglected according to Duhovic et al., 18 considering a laminate thickness of 2 mm. In order to exclude an influence of the generator power, all specimens were heated with a generator power of P = 15% as well as P = 40%. The maximum temperatures of the laminate surfaces of the specimens were measured by means of two TIM 160 infrared cameras from Micro-Epsilon, Ortenburg, Germany, with a field of view of 48°.
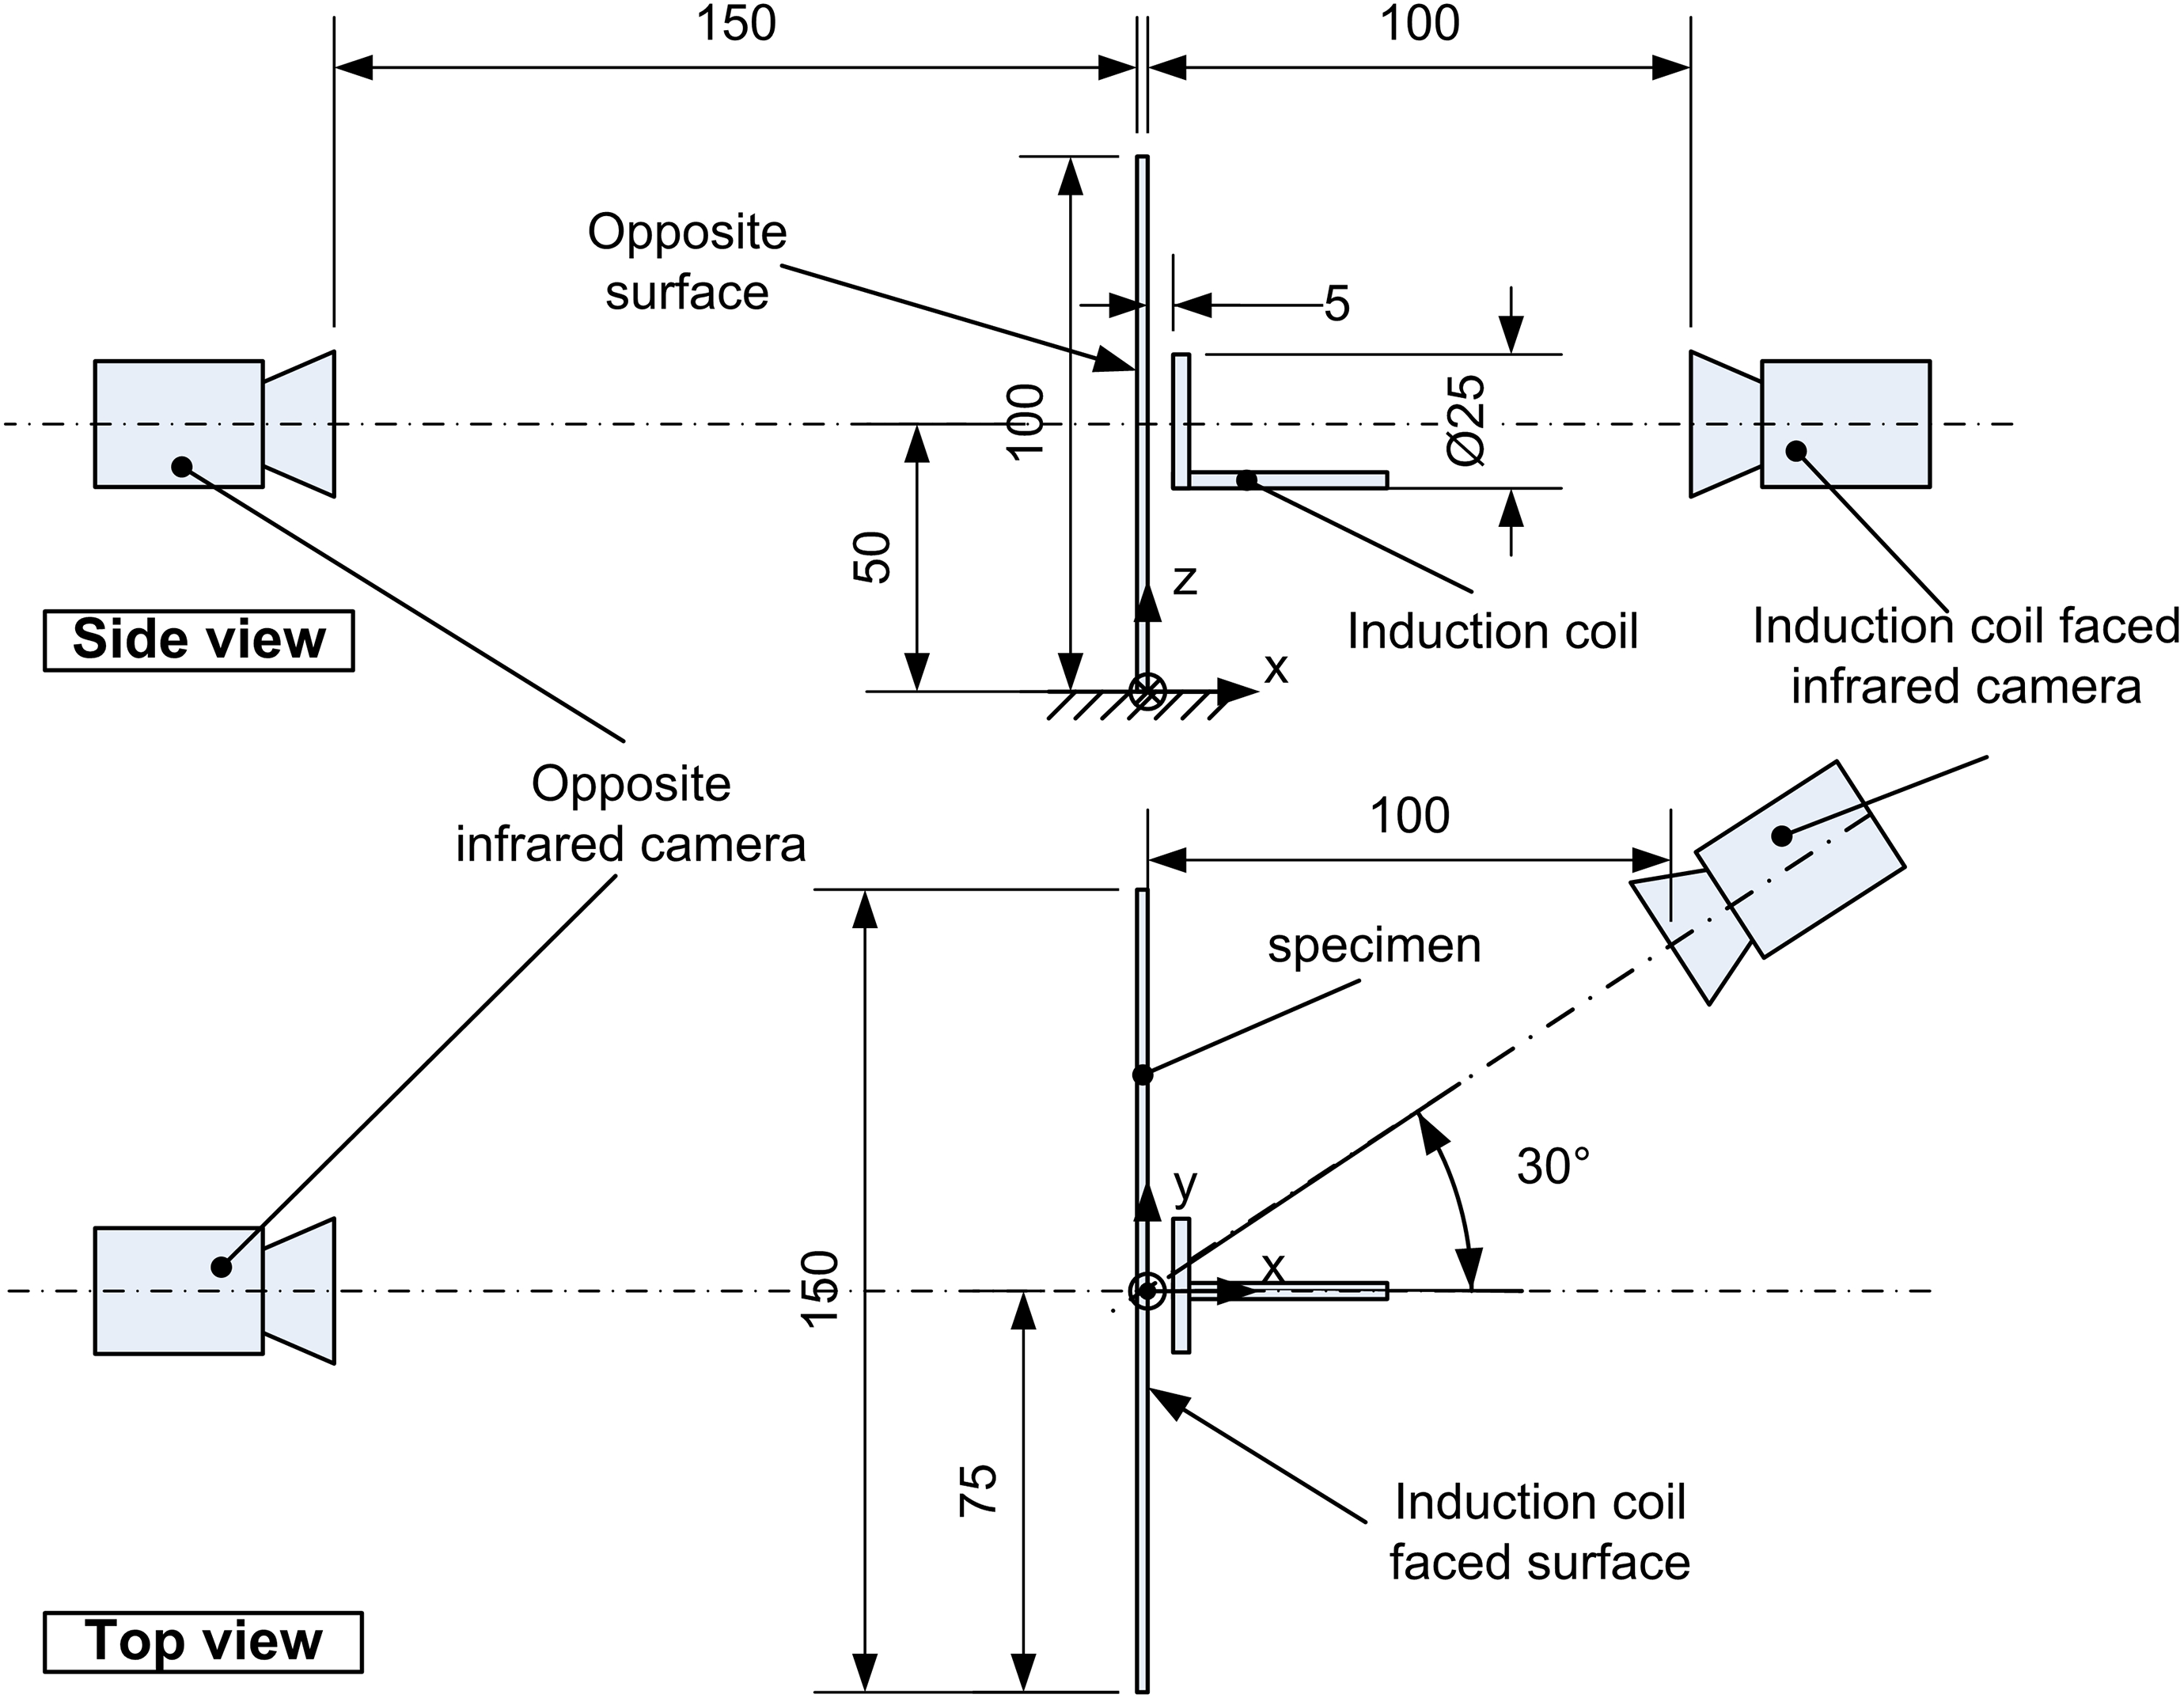
Schematic depiction of the experimental setup for the heating experiments.
Both infrared cameras were connected with a GP20 data recorder from Yokogawa, Japan, to enable the recording of the measurement. As soon as the induction generator starts operating, the maximum temperature on each laminate surface within the measurement field will be automatically recorded. The size of the measurement fields M1 and M2 is 25 × 50 pixels which correspond to a field of 20 × 40 mm2. These two measuring fields have been adjusted on both surfaces; in such a way, the same position of the specimens in relation to the position of the induction coils is measured in all heating experiments (Figure 5). In order to prevent deconsolidation and thermal damage of the specimens, a maximum temperature of Tmax = 180°C on the induction coil-faced surface was chosen as stop criterion. Preliminary studies showed that if the maximum temperature exceeds 200°C, the specimens will locally melt and cannot be used for microsection investigations anymore. Hence, as stop criterion, a maximum temperature of Tmax = 180°C was set, which considers a safety range of 20°C.
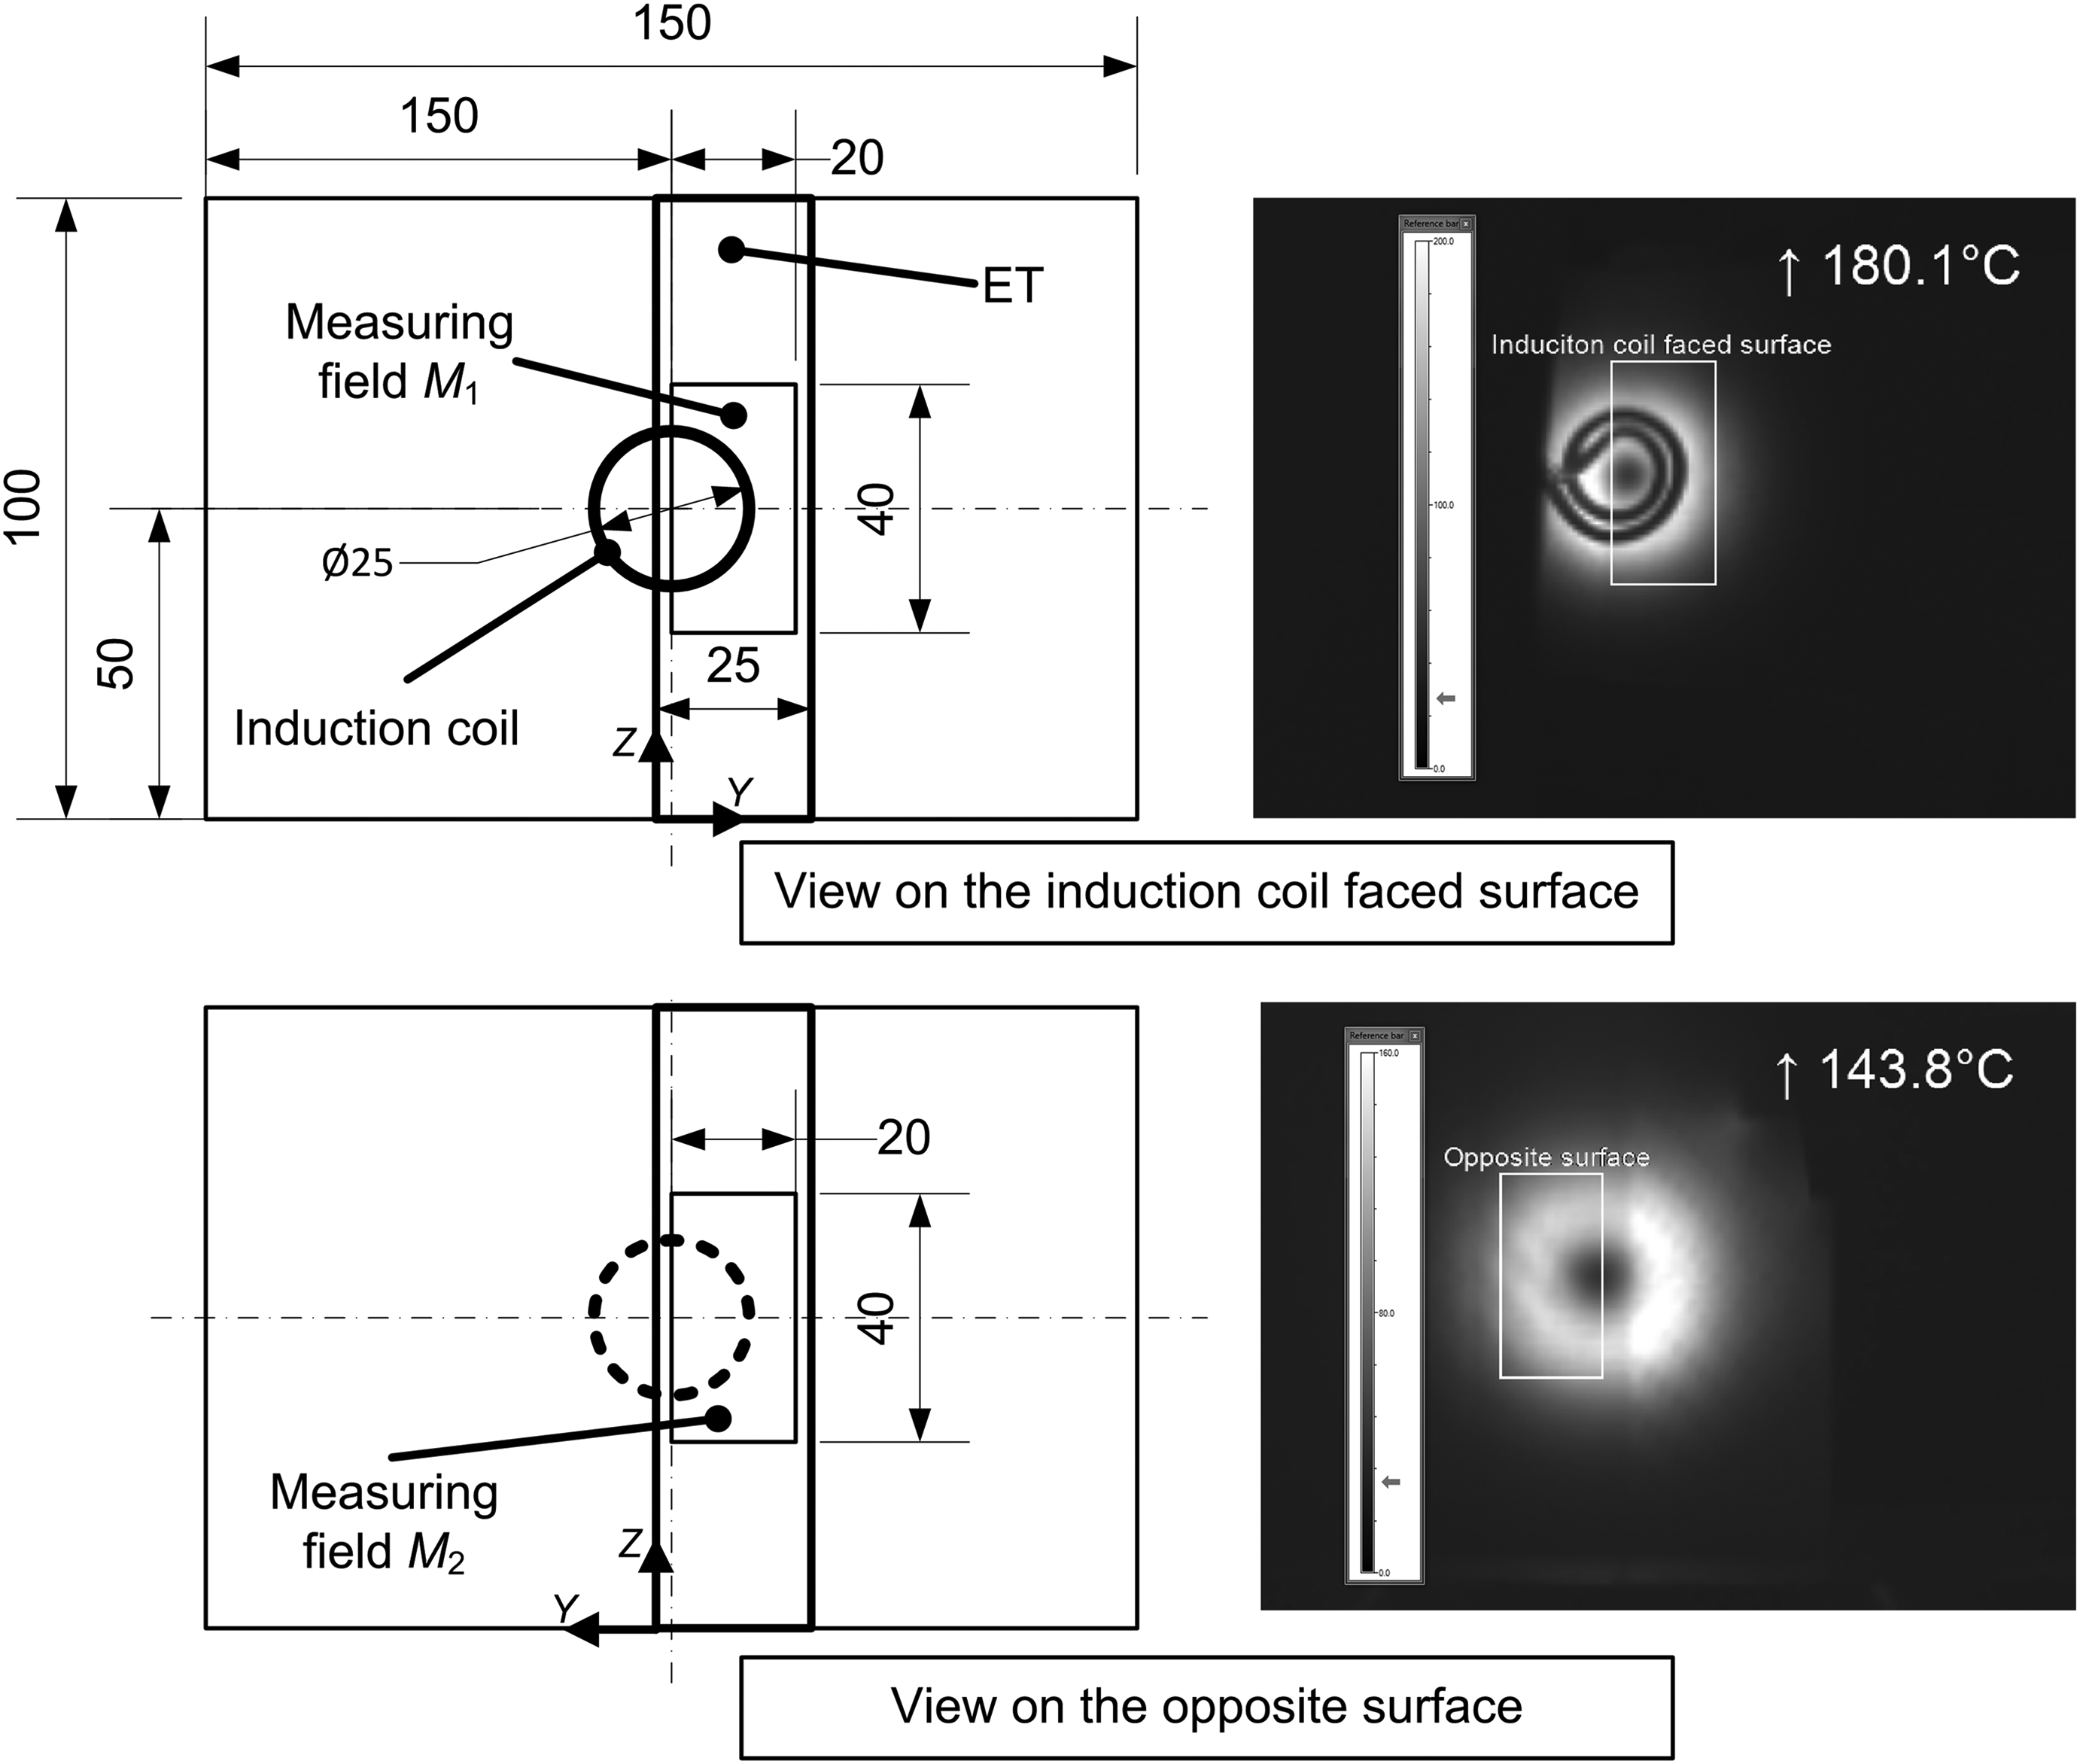
Adjustment of the measuring field M1 and M2 on both laminate surfaces to the position of the induction coil. Left: Schematic depiction of the position of ET, induction coil, and the measurement field. Right: Screenshots of a heating trial with Twill200.
The infrared camera measuring on the side of the induction coil provides a point of view 30° out of a perpendicular position on the surface, while the opposite camera is mounted perpendicular to the measured laminate surface. This compromise was necessary to allow the temperature measurement of hot spots under the induction coil. If the infrared camera would be positioned perpendicular to the specimen’s surface, these hot spots would be covered by the induction coil.
Since the surface conditions of the specimens were different, also the emissivity of each specimen differs. In order to exclude an observational error, additional tests with an emissivity tape (ET) from Testo
Analysis methodology
Evaluation of the heating experiments
Like every time–temperature curve of a heating process, the heating behavior of induction heating is not linear (Figure 6). In general, the temperature rises relatively strong at the beginning of a heating process. The increase in temperature, however, decreases as the heating time progresses, since the heat loss of the heated part increases due to an increase of the temperature difference between the surrounding atmosphere. This phenomenon can also been seen in the literatures. 10,14,18 Once the amount of energy input and output is equal, an equilibrium is reached which is characterized by a constant maximum temperature. The transition of the straight heating line into the constant temperature state is characterized by a descending slope. At equilibrium state, the slope is zero.
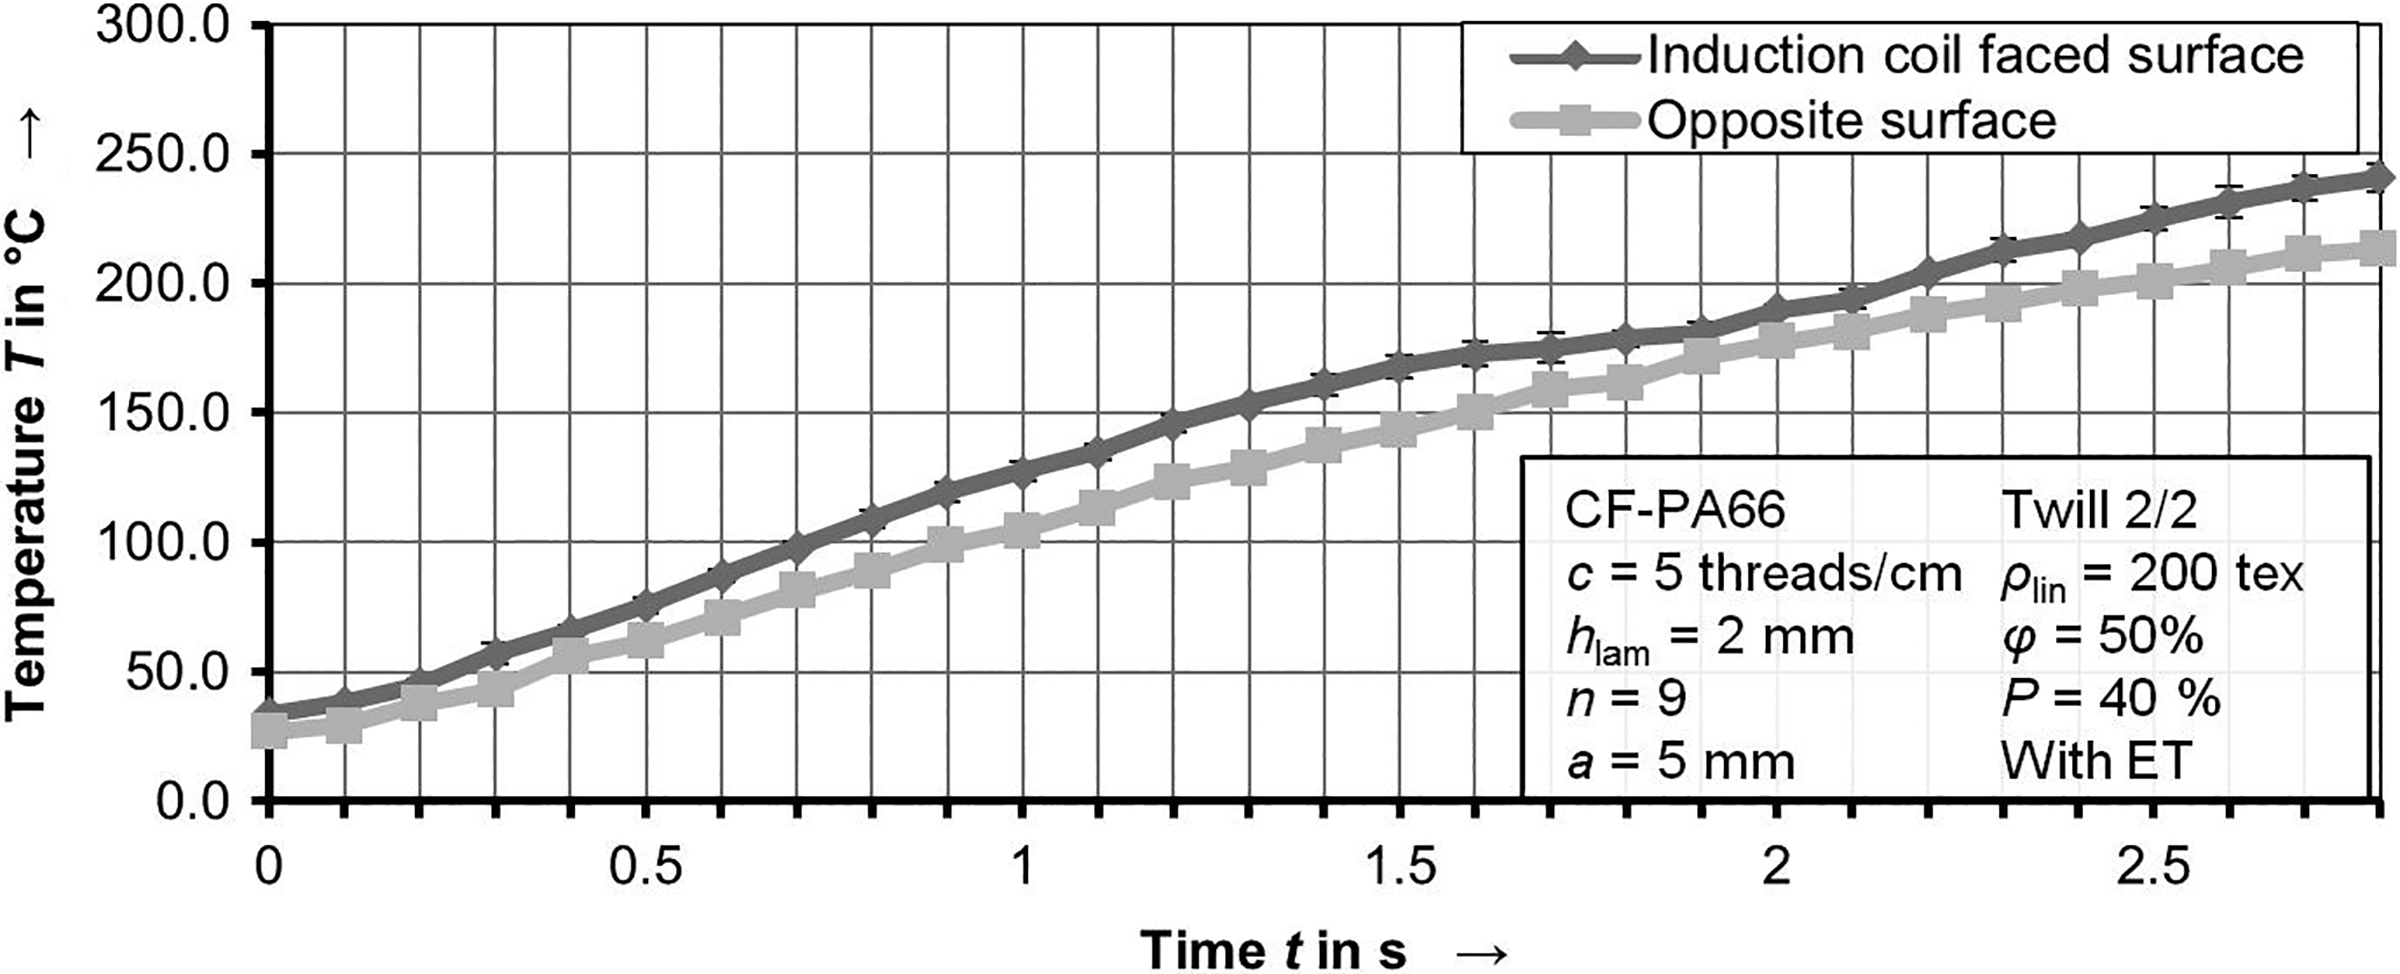
Exemplary heating curves of the induction coil-faced surface and opposite surface of a CF-PA66 laminate. Induction heating was limited to a maximum temperature of 240°C on the induction coil-faced surface. By means of four heating curves, the average temperature for each laminate surface was calculated within a time step of Δt = 0.1 s. The laminate is a Tepex® dynalite 201-C200(9)/50% from Bond Laminates, Germany. The difference between the induction coil-faced surface and the opposite laminate surface results from the law of Biot-Savart.
Indeed, in the case of induction heating, there is a segment in the temperature curves of both laminate surfaces at the beginning of the heating which can be described with a linear function.
The length of this linear segment depends on the generator power P, the heating behavior of the reinforcement material, the laminate parameters, and the polymer of the matrix. If the generator power or the ability of the material to the intrinsic heat generation through induction is too low, equilibrium of input heat and dissipated heat will be achieved very fast within the specimen. In this case, the temperature will keep at a constant level until the induction heating and thereby the energy input is switched off.
The matrix polymer fixes the CF within the laminate and thereby it defines the electrical contact conditions of the CF. If the matrix polymer begins to melt, a phase change takes place, and in addition, deconsolidation of the laminate will start due to internal stresses. Deconsolidation again leads to a change of the electrical contact conditions, and finally, the constant heating rate will change. Since the melting temperature of the PA66 is between Tm,PA66 = 258–260°C,within this study, a linear heating behavior of the specimens can be expected up to 200°C.
In order to compare and to evaluate the inductive heating behavior of different CF twill textile-reinforced polymer composites, the slope of the assumed straight line can be used. It describes the heating rate
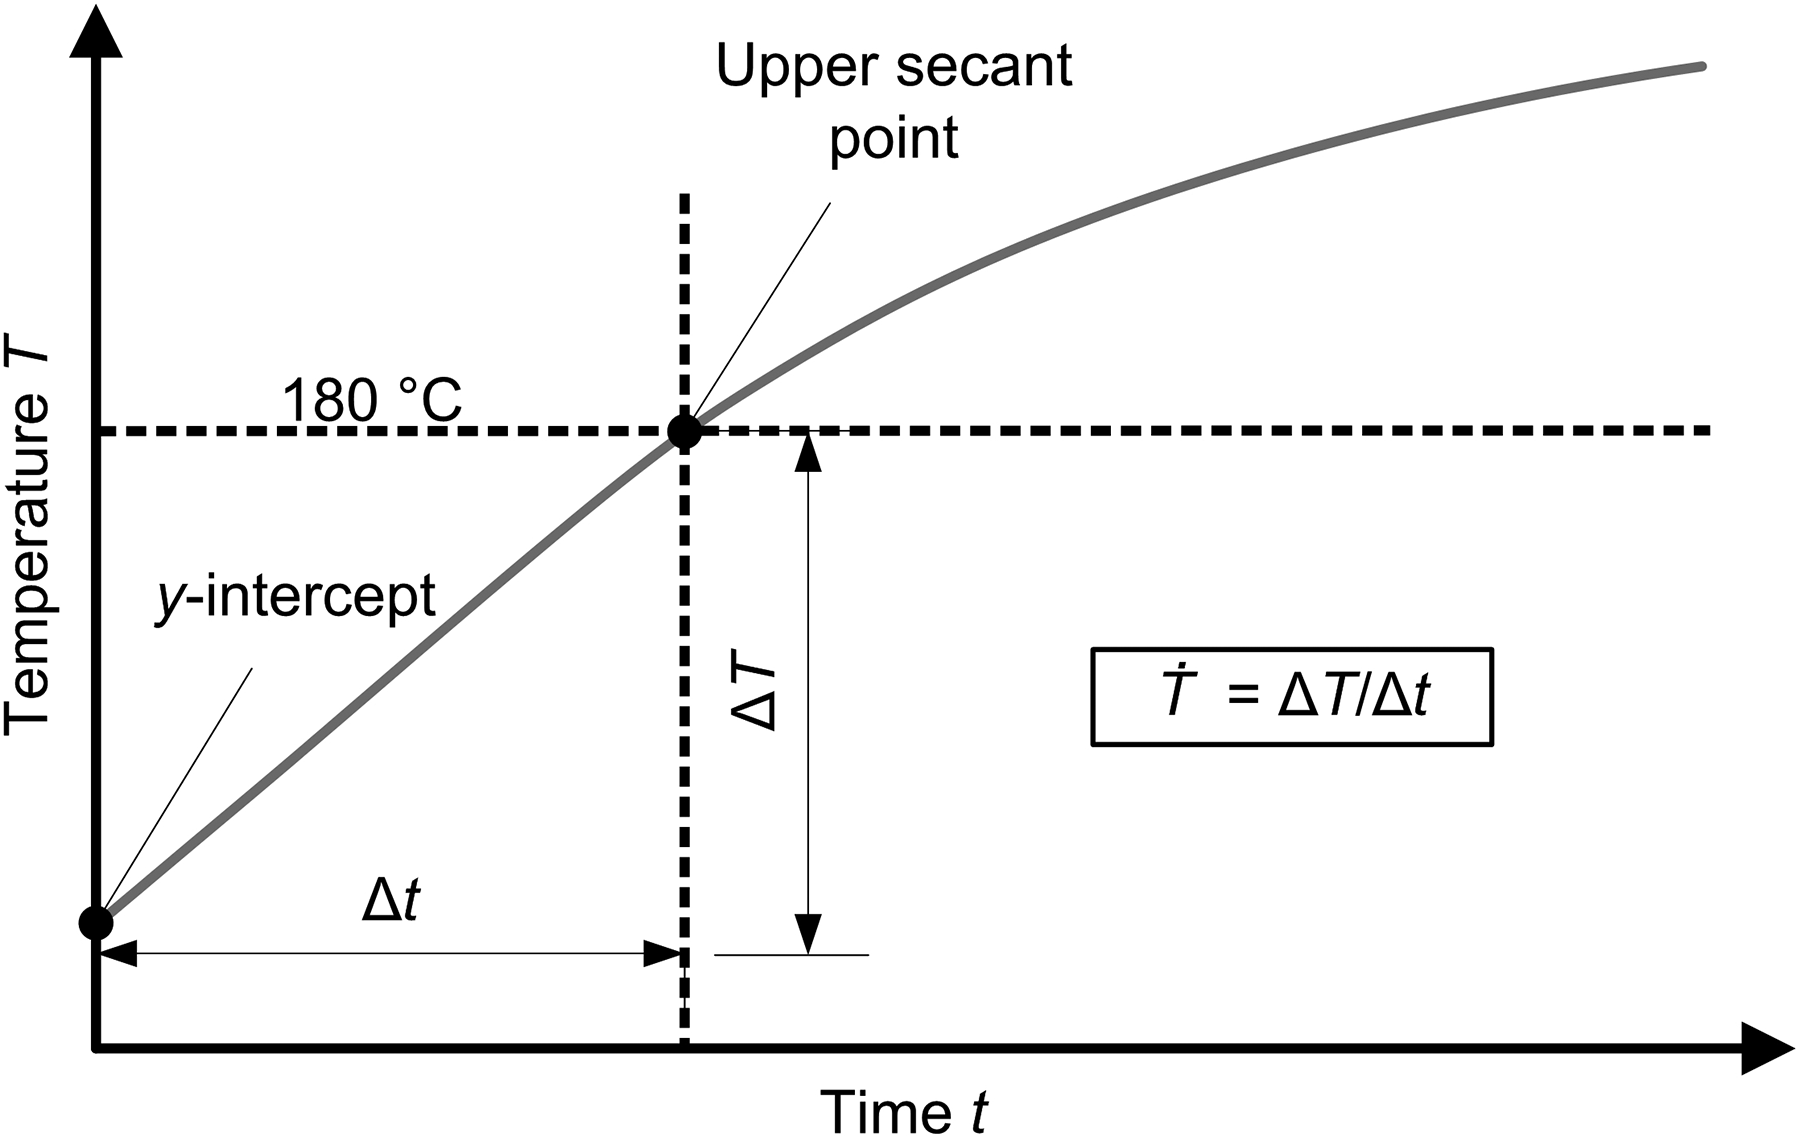
Schematic depiction of the linear behavior and the slope of the time–temperature curve of a surface.
Within this study, the secant slope between room temperature TRT and the end of the linear behavior is used. The necessary secant points have to be determined from the measured values. The recorder boundary conditions have to be taken into account.
y-Intercept
The first secant point, which is necessary to calculate the secant slope, is the y-intercept. It represents the room temperature TRT. At the beginning of the heating, the whole volume of the specimen as well as both surfaces have the same temperature. This common temperature corresponds with the room temperature TRT and is homogeneous distributed within the specimen.
There is an y-intercept for the induction coil-faced surface (Ti,1) and the opposite surface of the laminate (To,1) (Table 3). However, only the temperature value of the opposite surface of the laminate To,1 is equal to the room temperature TRT. The induction coil is cooled by a liquid which has a constant temperature of around 32°C. Hence, the initial temperature of the coil is also almost 32°C. Additionally, the induction coil itself heats up until 60°C during the heating due to electric losses within the coil itself. Since the data recorder records the maximum temperature and the induction coil is visible for the camera, the temperature of the induction coil is measured until the temperature of the laminate surface becomes higher than the temperature of the induction coil. Therefore, the initial temperature value of the opposite surface To,1 is used for the calculation of the heating rates of both surfaces.
The used Yokogawa recorder records for every time interval of Δt = 0.1 s.a
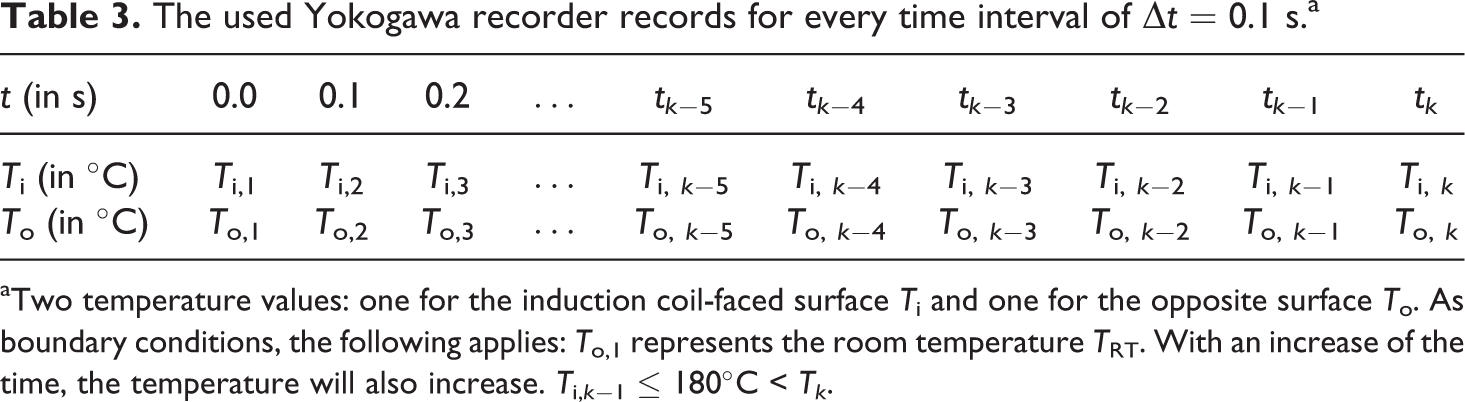
aTwo temperature values: one for the induction coil-faced surface Ti and one for the opposite surface To. As boundary conditions, the following applies: To,1 represents the room temperature TRT. With an increase of the time, the temperature will also increase. Ti,k−1 ≤ 180°C < Tk.
The upper secant points
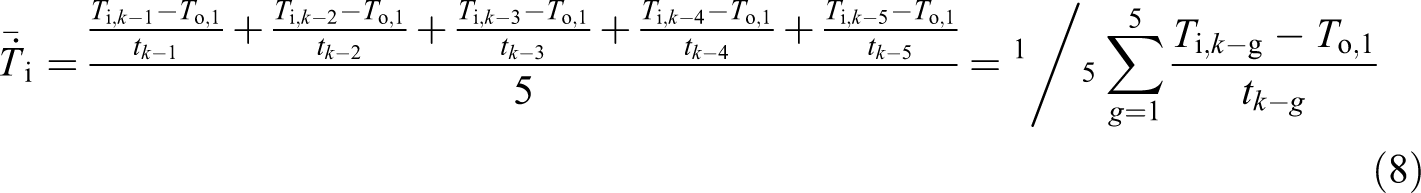
Since the inductive heating is limited to a maximum temperature of 180°C on the induction coil-faced surface, the validity of the measured values beyond this temperature is not given. Indeed, higher temperatures than 180°C were measured and recorded due to overshooting. Therefore, the calculation of the secant slope only uses temperature values which are lower than 180°C. In Table 3, the temperature value Ti, k indicates the first temperature value on the induction coil-faced surface which exceeds 180°C. Hence, the first upper secant point for the induction coil-faced surface is Ti,k−1. Since always the same time steps have to be considered, the first upper secant point for the opposite surface is To,k−1.By means of these two temperature values and the y-intercept, the slopes for both surfaces could be calculated. In order to diminish the influence of measuring errors, four additional secant slopes are calculated analogously for each laminate surface. For this purpose, the respective temperature values were used, which belong to the time values from tk−5 until tk−2.
By means of the y-intercept and the upper secant points, five secant slopes of each laminate surface are calculated and subsequently averaged. If the heating behavior is ideal linear within this range, each slope of a laminate surface will be equal to the respective average slope. The calculation process of the heating rate of both laminate surfaces of a specimen can be summarized by the following equations.

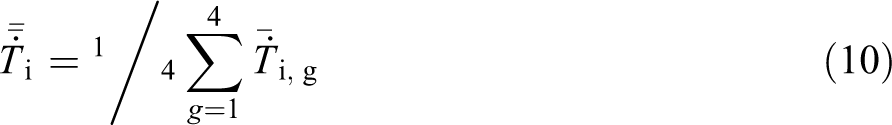
Since a specimen group comprises four specimens, the four averaged heating rates of a surface have also to be averaged. This is expressed by equations (10) and (11). For reasons of simplification in the following, only
For manufacturing (e.g. welding) purposes, a very interesting parameter is the time needed to reach the processing temperature, which is above the melting temperature of the matrix. The calculated heating rates can be used to give a roughly prediction of the necessary time. However, the calculated time will be shorter than the real time which is necessary to achieve a defined processing temperature, since the heating rates were calculated based on linear fitting. Additionally, the heating rate represents the ability of a material to convert the electromagnetic energy supplied by induction into heat. Therefore, based on the heating rate, a statement can be made to which material reaches the processing temperature most quickly under the same boundary conditions.
Evaluation of the microscopy investigation
Within a microscopy investigation, the cross sections of the laminates were inspected by means of a microscope DM6000 M and a camera DFC450, which are both from Leica, Germany. Here, the stacking sequence of the CF fabric plies and the resulting contact conditions of the CF were observed. By means of measuring the CF cross sections, the different shapes of CF rovings are compared. For the determination of the CF cross sections of a specimen, the longest width wr and the highest height hr within a roving were determined for three rovings in 0 and 90° directions, respectively (Figure 8). The measured width wr and the height hr are positioned perpendicular to each other. In order to statistically ensure the measurements, three values for the width and the height were measured. The distinction between rovings in 0 and 90° allows the validation of the fact that the fabrics provide balanced values. Furthermore, the areas of the cross sections Ar were measured by drawing a closed line along of the roving’s edge. By means of the software Leica Application Suite V4.5.0 from Leica, the confined area was calculated. The areas were also determined for three rovings in 0 and 90° directions.
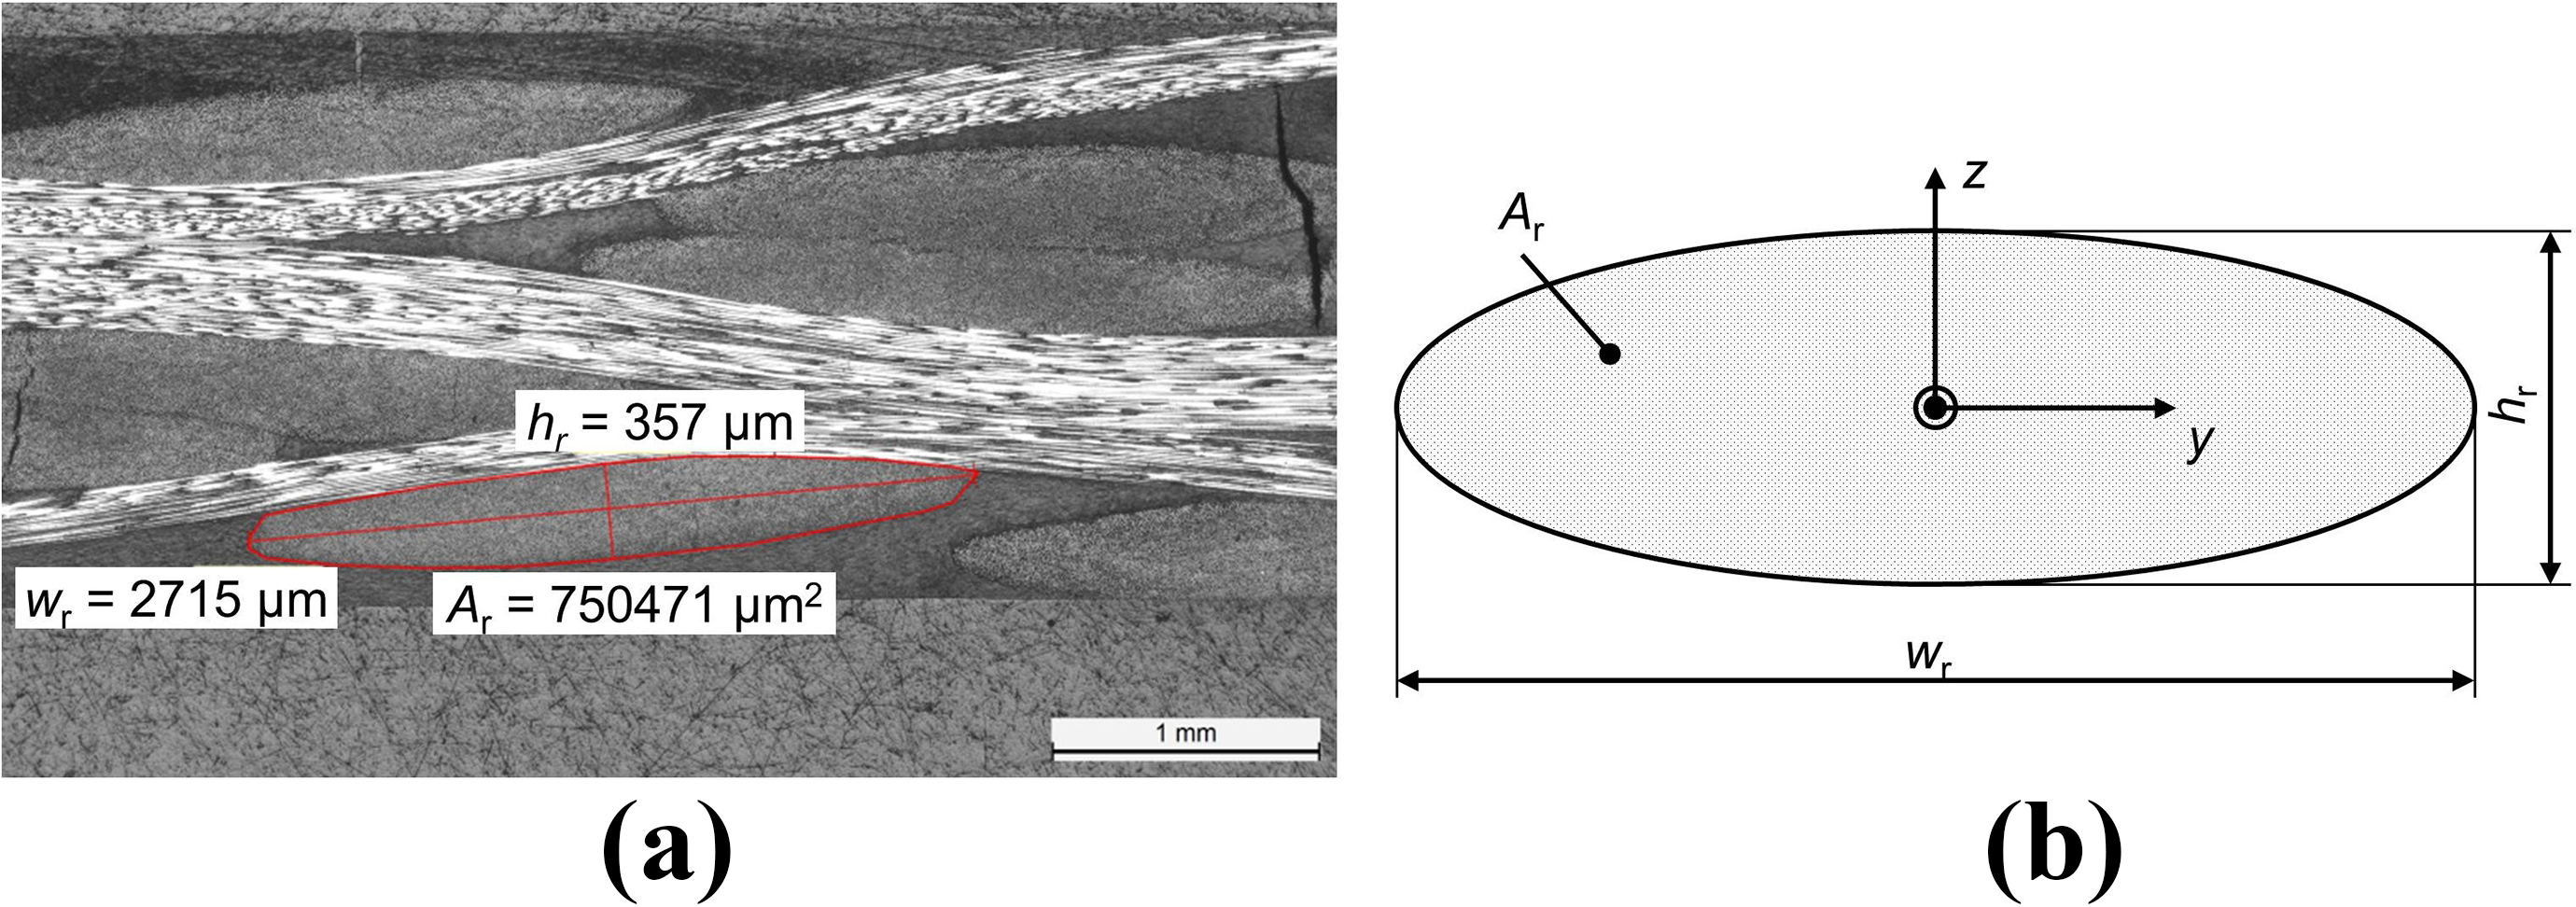
Measurements of the rovings within the laminates of the different specimens. (a) Example of the measurement of the longest width wr, the highest height hr, and the area Ar of the roving within a specimen. (b) Schematic depiction of the measuring of a roving.
Results and discussion
Heating experiments
Using ET, the heating rates are lower compared to uncovered laminates, because the heat has to transfer through the tape by the conduction (Figure 9). Thus, the ET behaves like a thermal isolation, which retards the heating due to the ET’s thickness. However, the standard deviations of the heating rates are smaller, since the emission coefficient is always constant and the heating rates between the two laminate surfaces show the same tendency. Hence, all the following results of heating experiments were presented with ET.
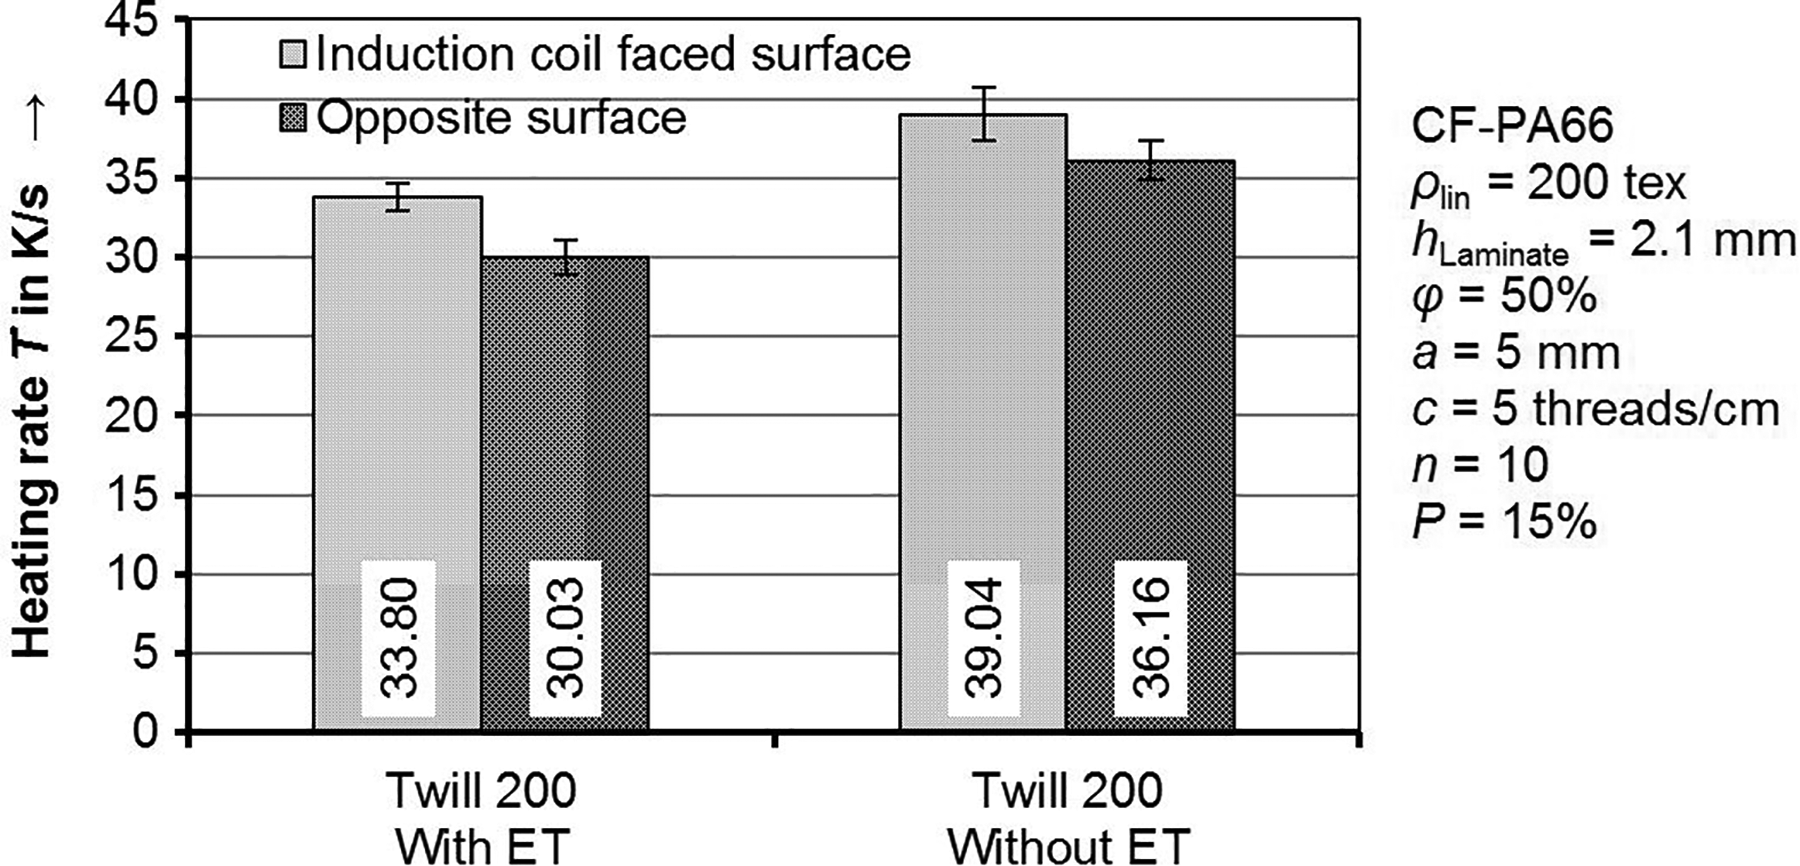
Exemplary results of heating rates of the Twill200 specimen with and without ET at a generator power of P = 15%.
A comparison of heating rates ascertained with a generator power of 15% and with a generator power of 40% shows that the difference of the heating rates between both surfaces is significantly increased (in relation to each other and in absolute values) with the generator power (Figure 10). These results conform to Rudolf et al. 9 It can also be generally stated that the heating rates are approximately 2.7 to 3 times higher with a generator power of 40% than with a generator power of 15%. This corresponds to the power increase to 40%, which is 2.7 times as much as 15%. Therefore, it can be stated that the tendential difference of the heating rates is not influenced by the generator power. The deviation of the induction coil-faced surface is attributed to the measurement uncertainty, which arises from the fast heating.
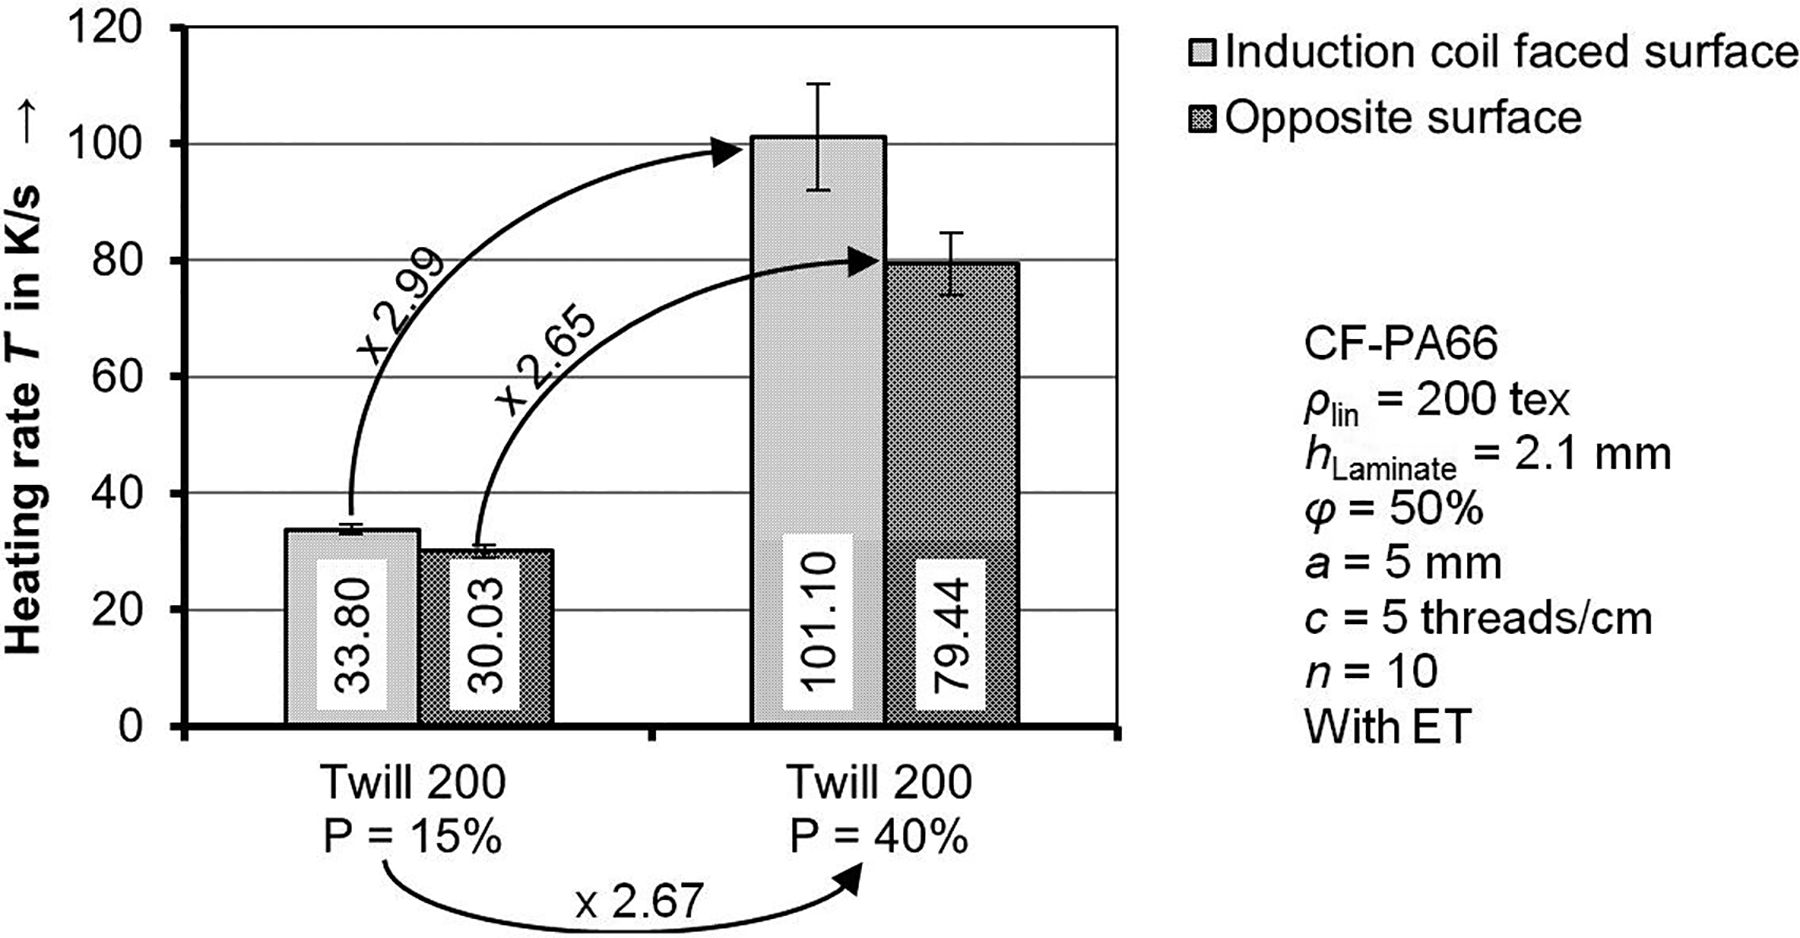
Exemplary results of heating rates of the Twill200 specimen with ET at a generator power of P = 15% and P = 40%.
In order to determine initially the general influence of the thread count c on the heating behavior, the heating rates of the different specimens are compared. Indeed, the differences between the heating rates at a generator power of 15% are quite small and the heating rates for Twill200 are higher than the one of Twill160. But there is a rough tendency which shows that the heating rates for a generator power of 15% tend to decrease with rising thread count c (Figure 11). The same result, but much more pronounced, can be seen at the heating rates for a generator power of 40% (Figure 12). Additionally, the influence of the number of CF fabric plies on the heating rate can be seen in Figures 11 and 12, respectively. A decreasing number of CF fabric plies lead to a lower heating rate. However, it is not possible to distinguish between the influence of the thread count and the number of CF fabric plies. Due to equation (7) and the fact that except the thread count, all other parameters of this equation (linear density, FVC, laminate thickness, and density of the CF) were kept constant within this study, and the area weight and consequently the number of CF fabrics plies are coupled with the thread count. Based on the heating behavior, a separate discussion of the influence of the thread count or of the number of fabric plies is not possible.
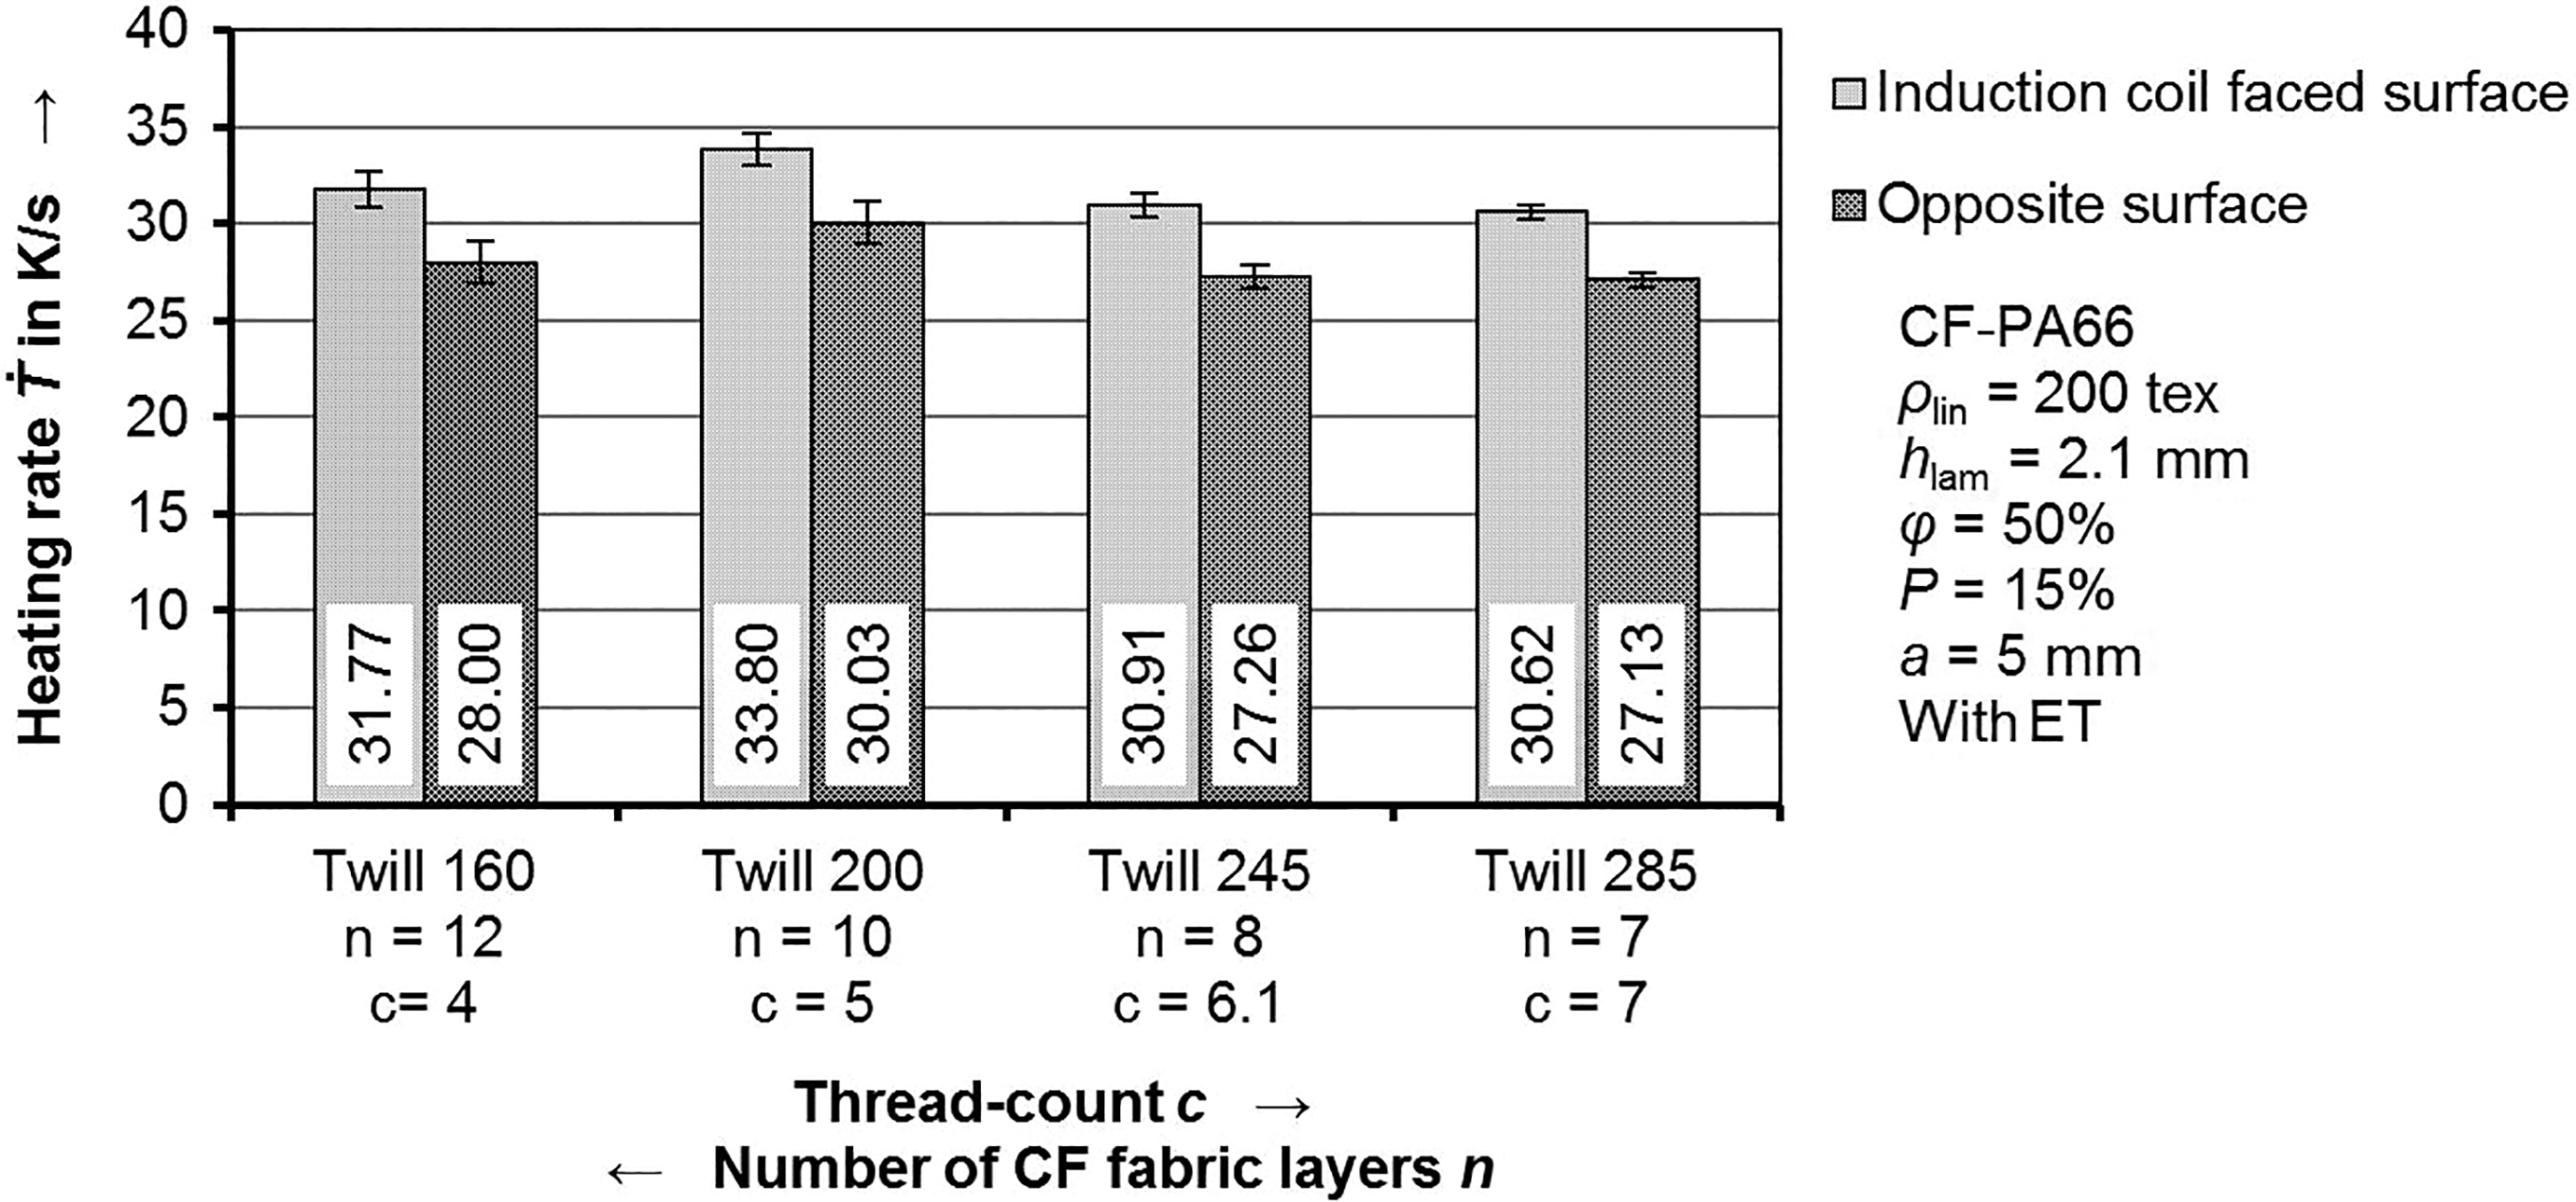
Heating rates dependent on the thread count c and consequently on the number of CF fabric plies n at a generator power of 15%.
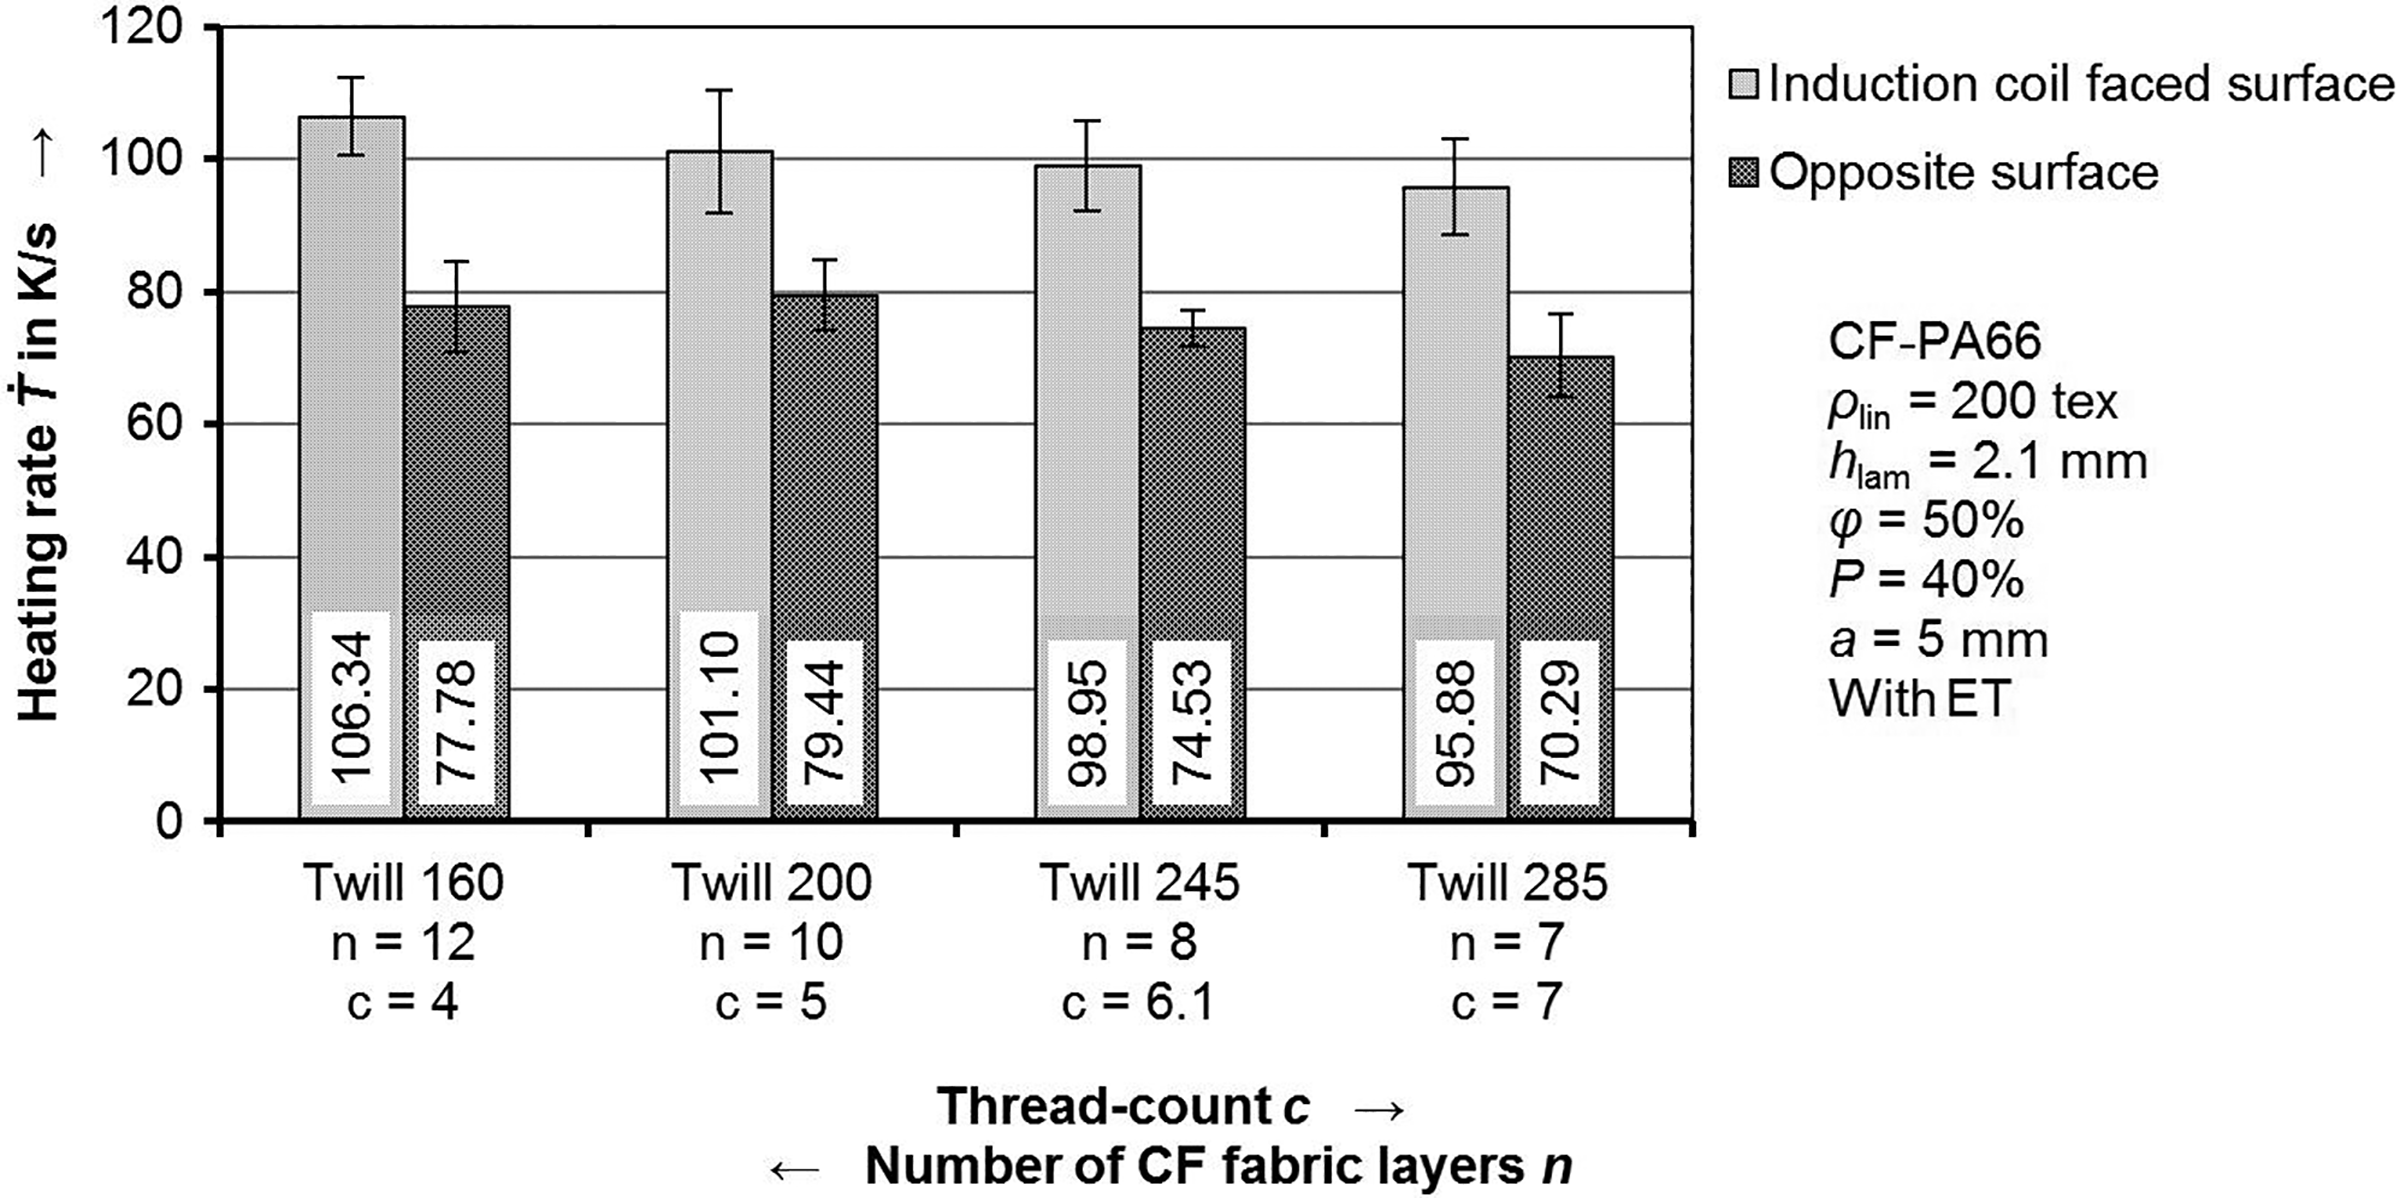
Heating rates dependent on the thread count c and consequently on the number of CF fabric plies n at a generator power of 40%.
Since the heating rate is lower with a generator power of 15% compared to 40%, the temperature distribution within the specimen is more homogeneous at 15%. Thus, the influence of the laminate parameters on the heating behavior is averaged by the relative long heating time. Another indicator for this fact is the difference between the heating rates of the induction coil-faced surface and the opposite surface, which is relatively small at 15% compared to 40%. Through a higher generator power, the difference will increase, because there is less time to equalize the different temperatures of both surfaces.
Primarily, it can be stated that the thread count has an influence on the inductive heating behavior of CF twill textile-reinforced composites. Nevertheless, it is not possible to ascertain whether the change of the numbers of CF in a fabric ply or the change of the number of CF fabric plies in the laminate setup is directly responsible for the influence on the heating behavior.
Microscopy investigation
The microsection analysis shows two phenomena (Figure 13).
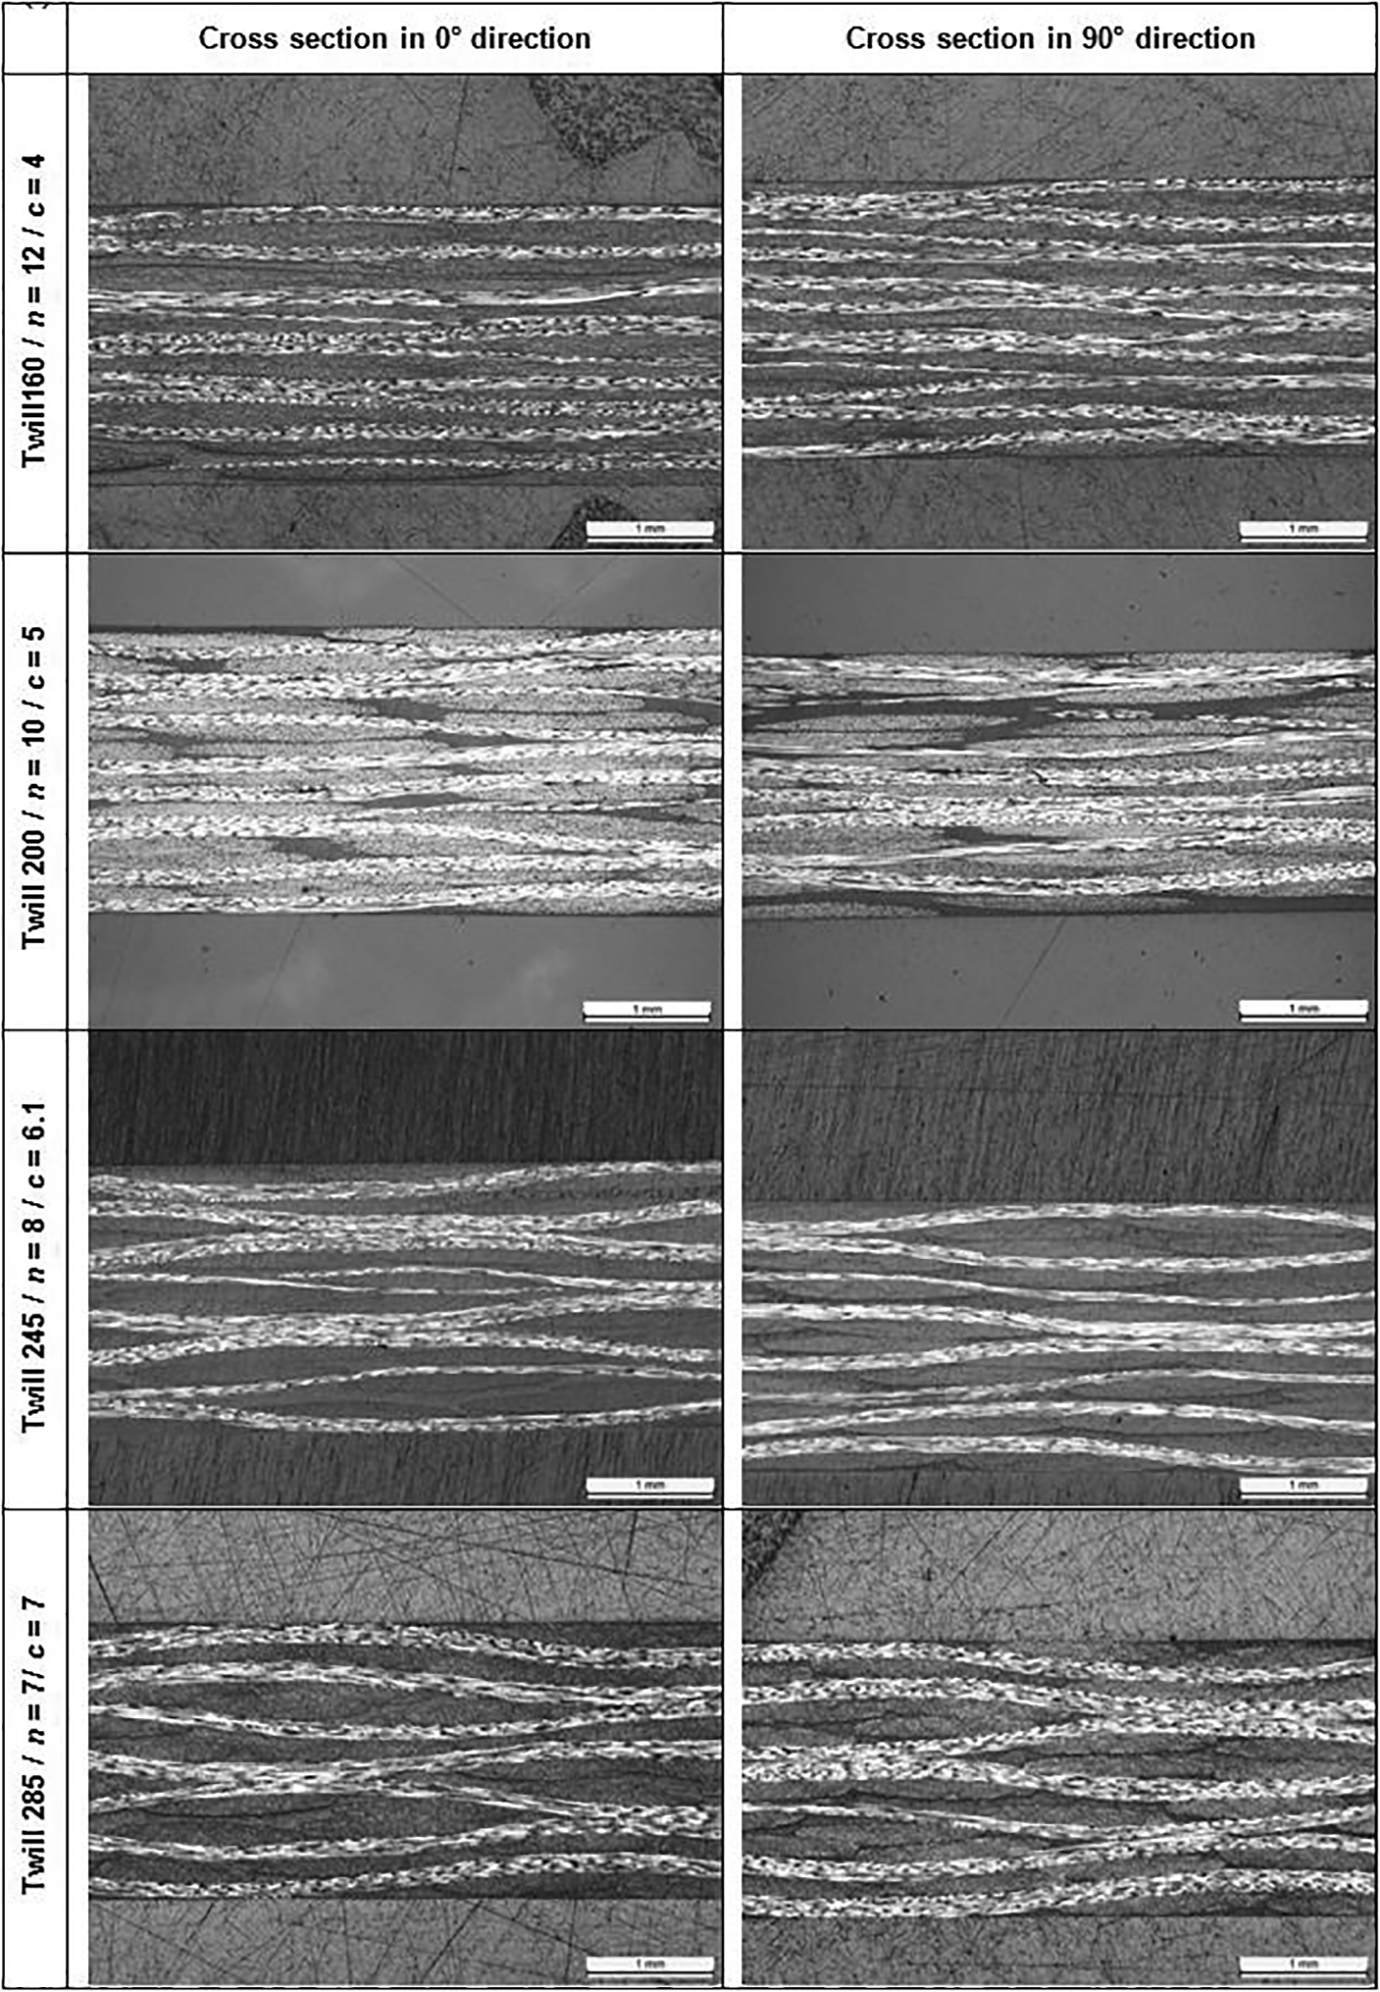
Microsections of cross sections in 0 and 90° directions.
There are interply and intraply contacts between the rovings in weft and warp directions. Since the number of CF fabric plies is increased due to a reduction of the thread count, the laminate structure becomes more fine layered and more homogeneous.
Based on the measurement of the roving dimensions, it is noticeable that the different measurement types hardly differ in terms of the alignment direction. That is because only balanced CF fabrics have been used in this study. Since all CF fabrics provide rovings with the same linear density ρlin, the amount of filaments within a roving and, therefore, the areas of the rovings’ cross sections Ar are almost the same size (Figure 14). The shape of the rovings can be described by an ellipse function. In order to conduct a plausibility check, the area of a theoretical ellipse was calculated by means of the measured widths wr and height hr according to equation (12). The measured widths wr and heights hr are shown in Figures 15 and 16.
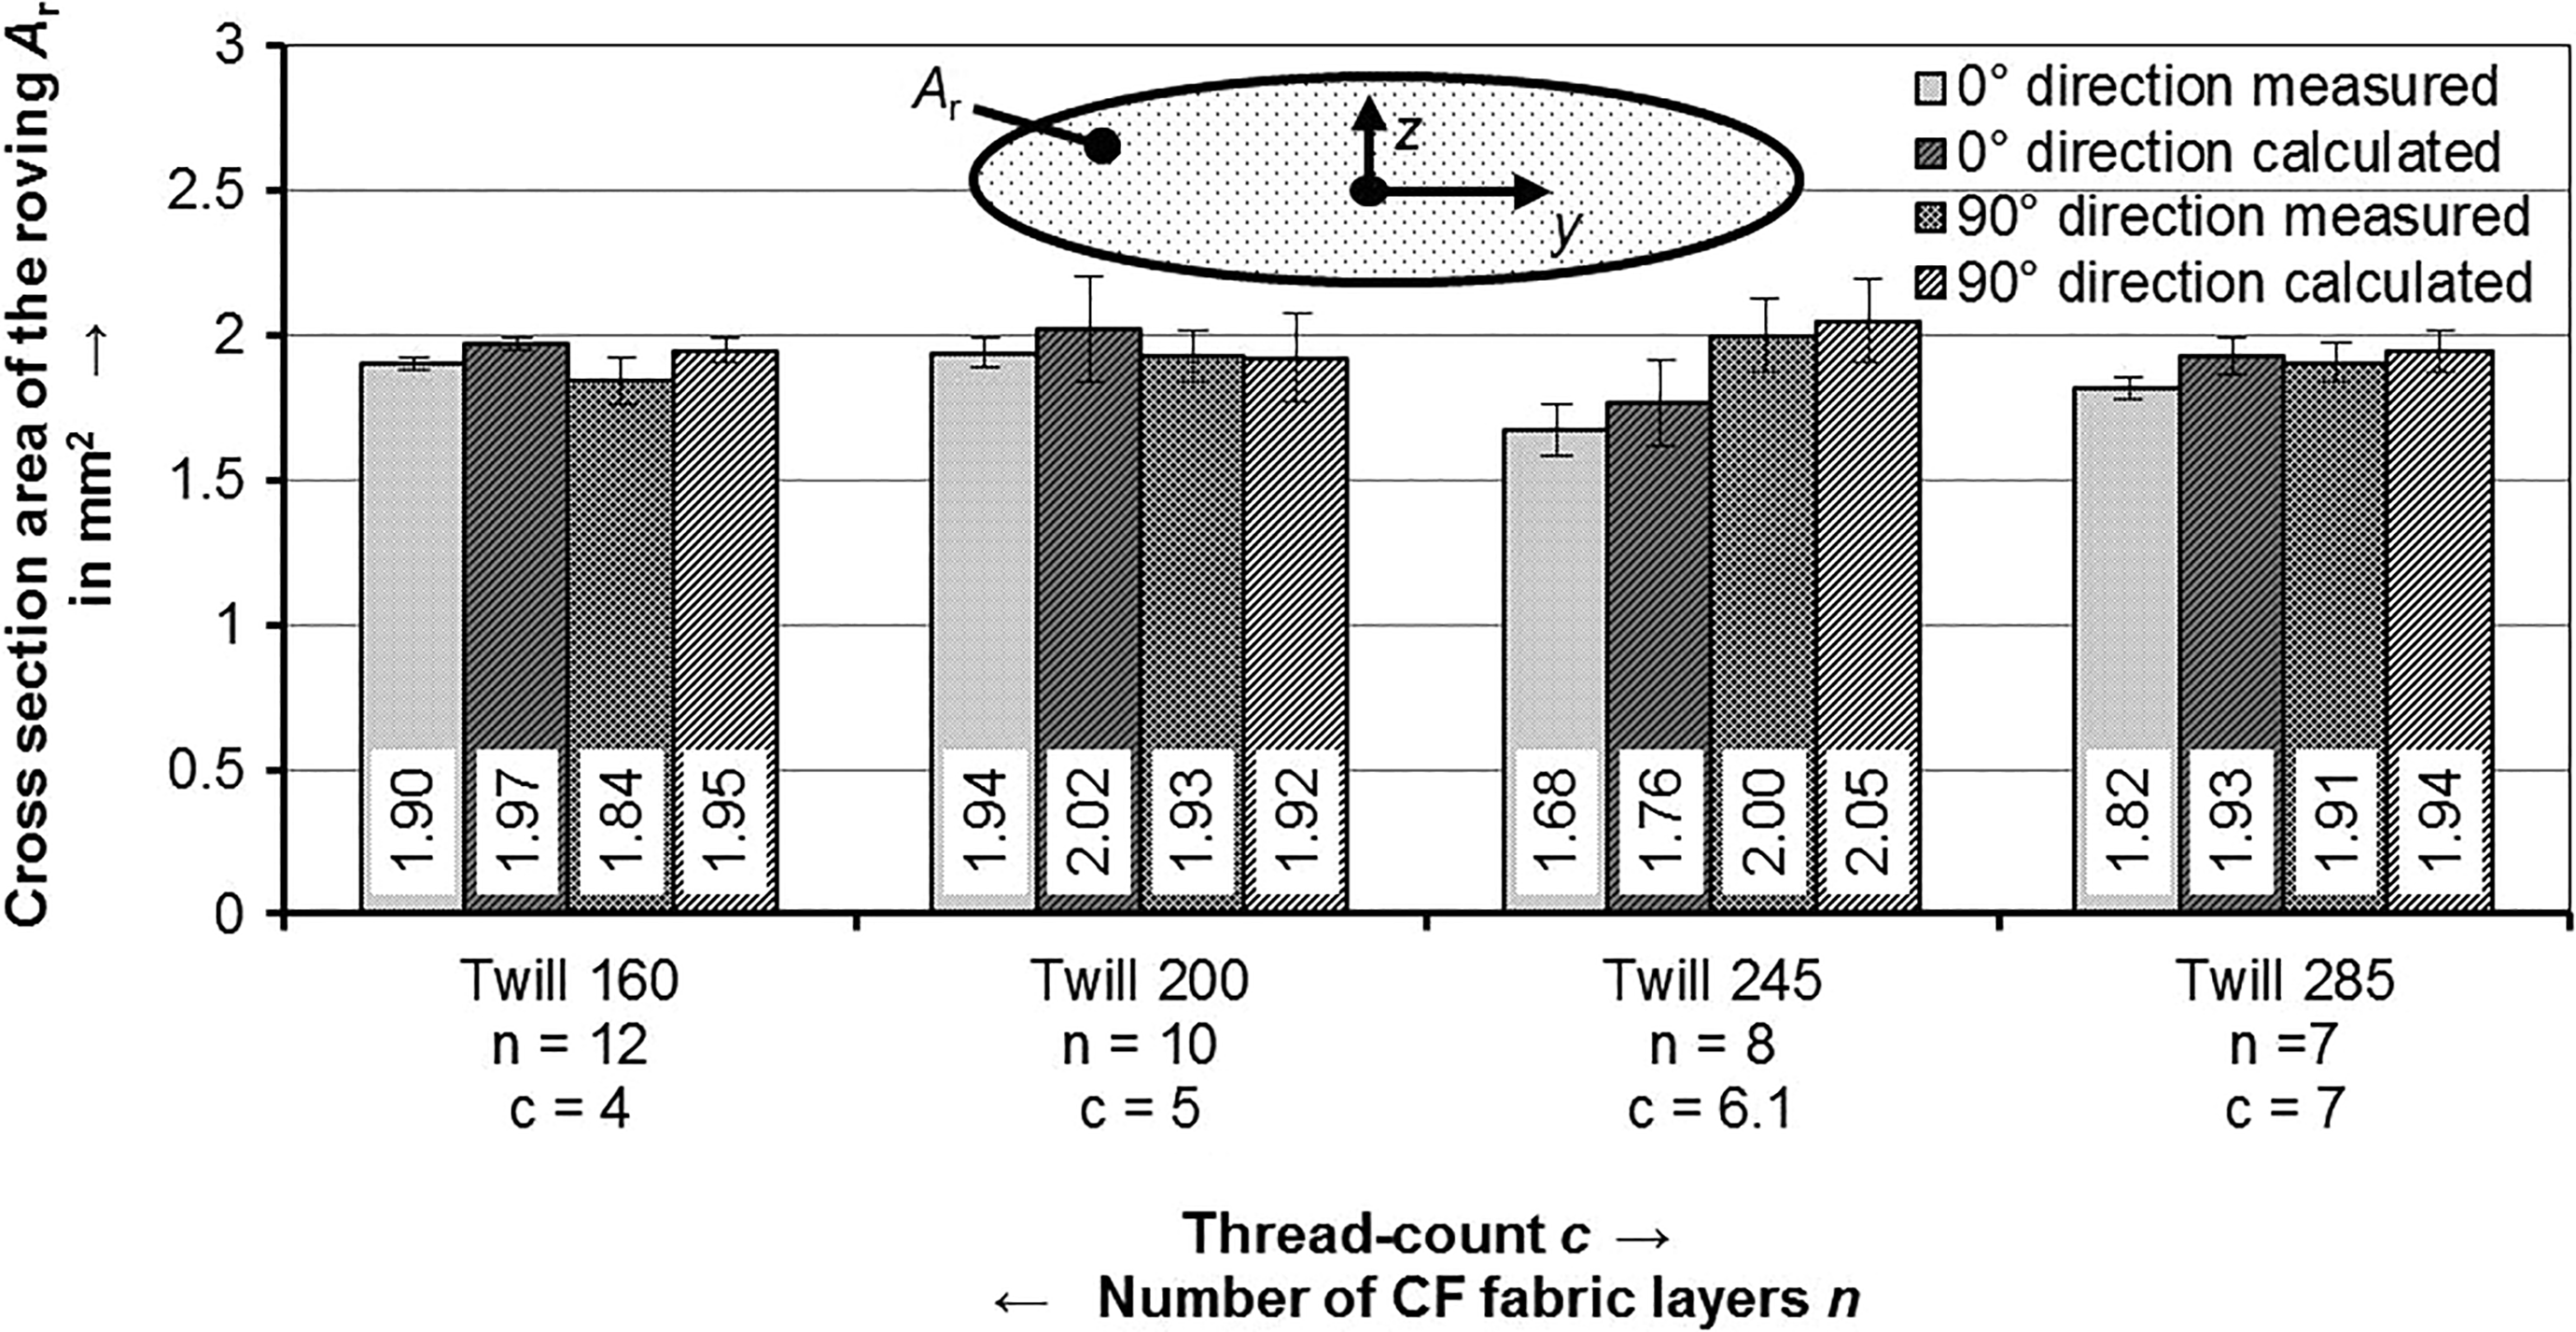
Cross-sectional area Ar of the rovings measured in the microsections and calculated by means of equation (12) of specimens with different CF fabric reinforcements.
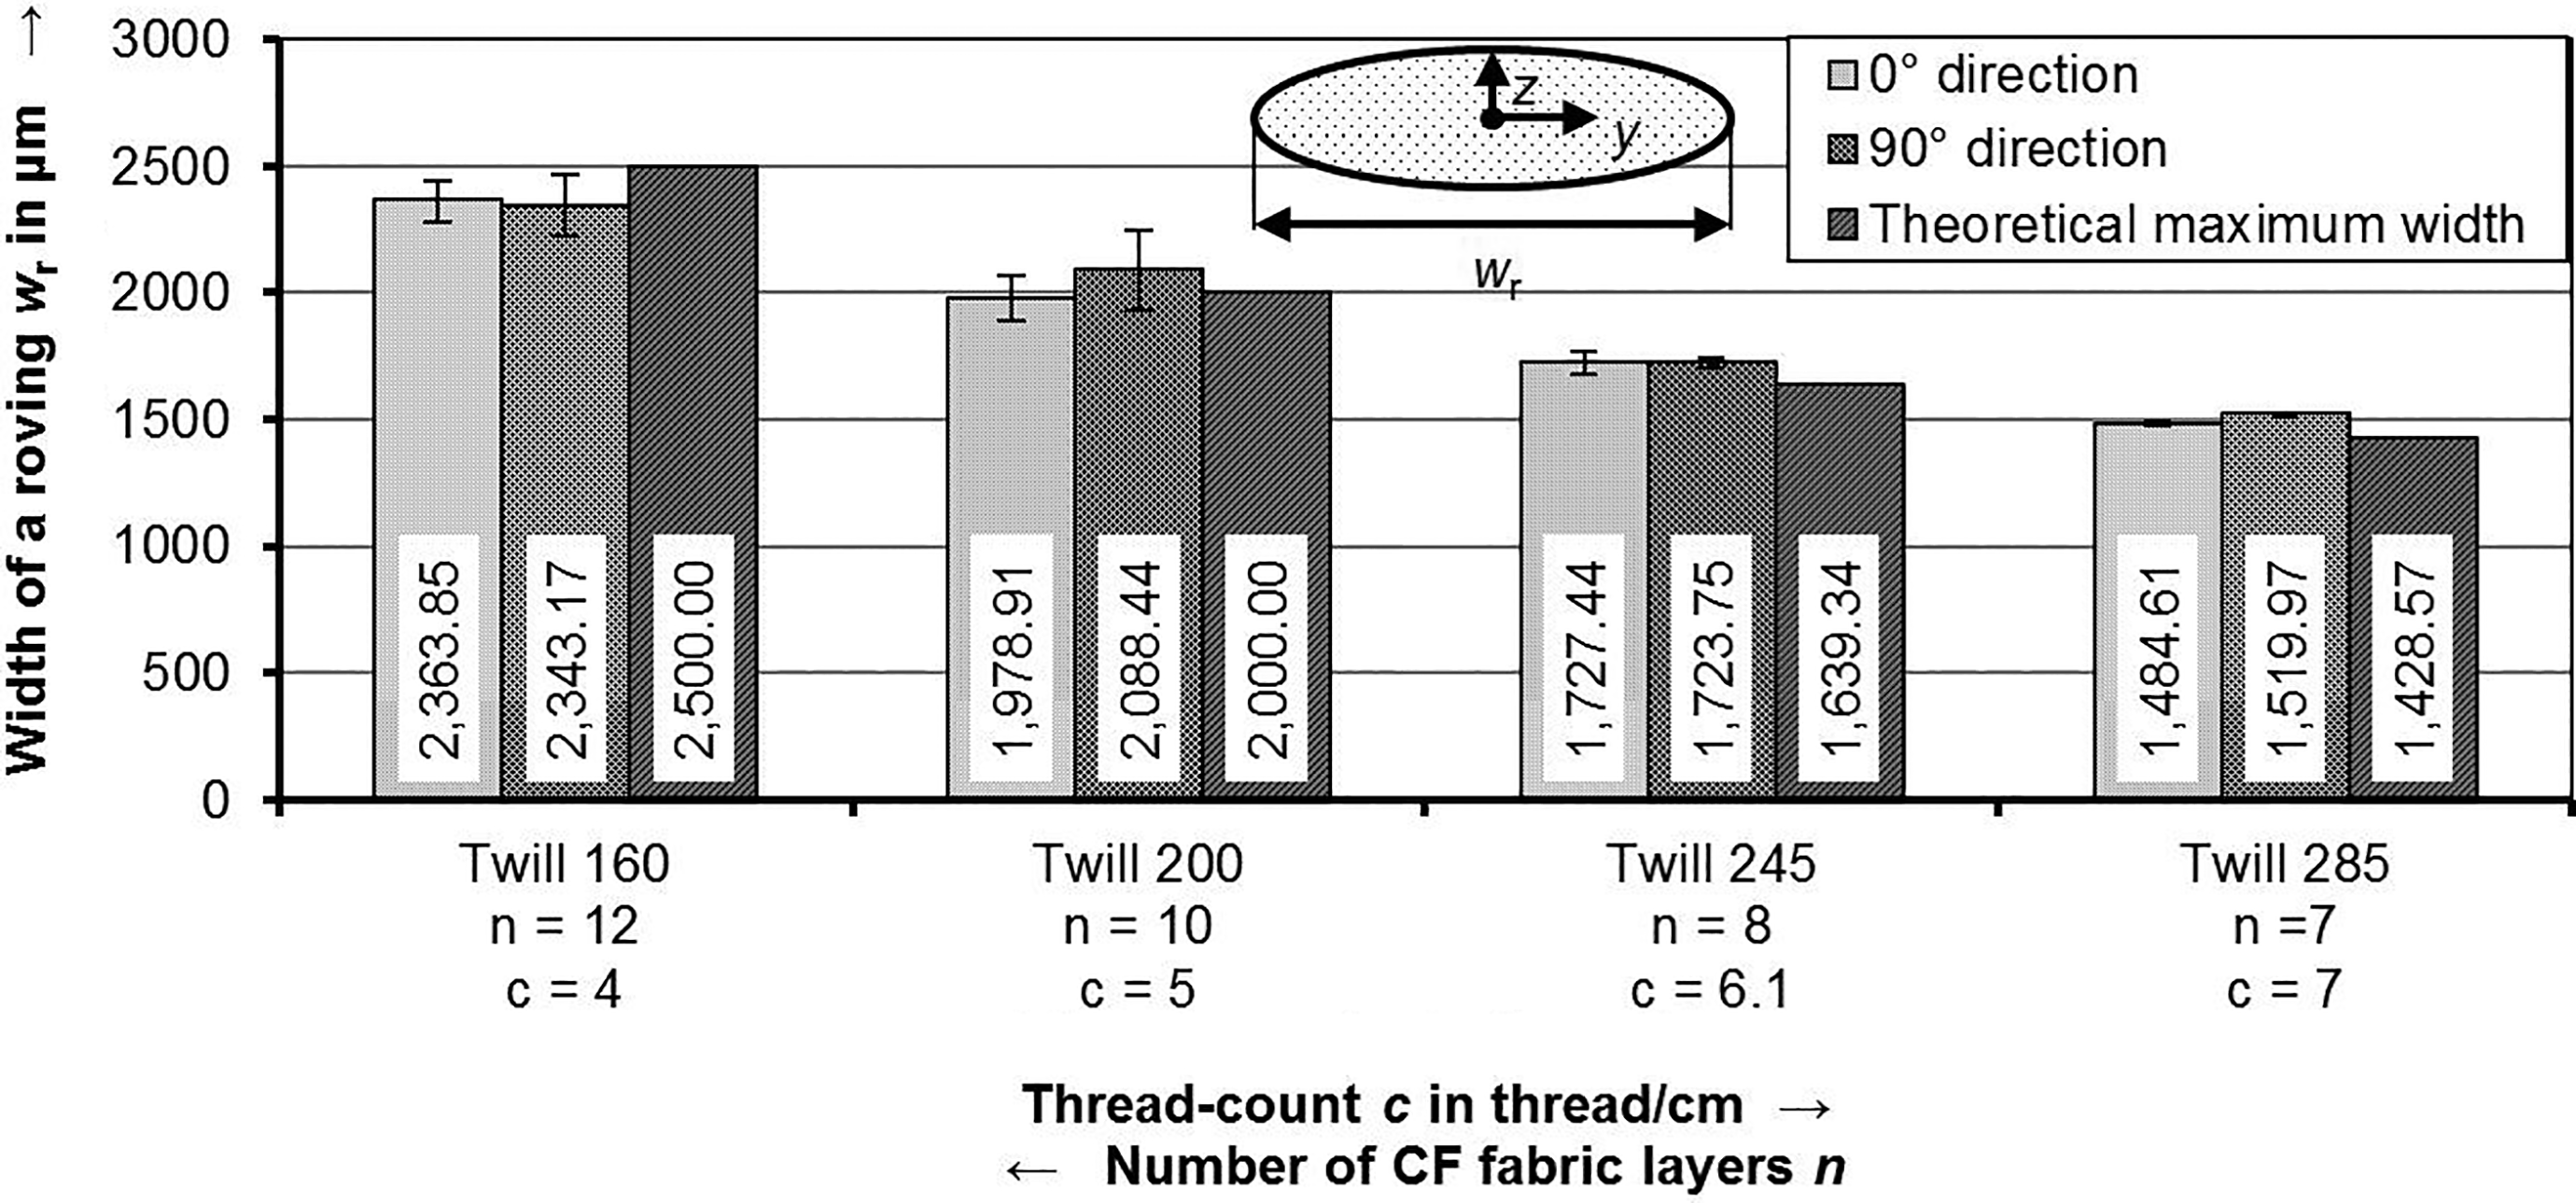
Width wr of the rovings measured in microsections of specimens with different CF reinforcement fabric.
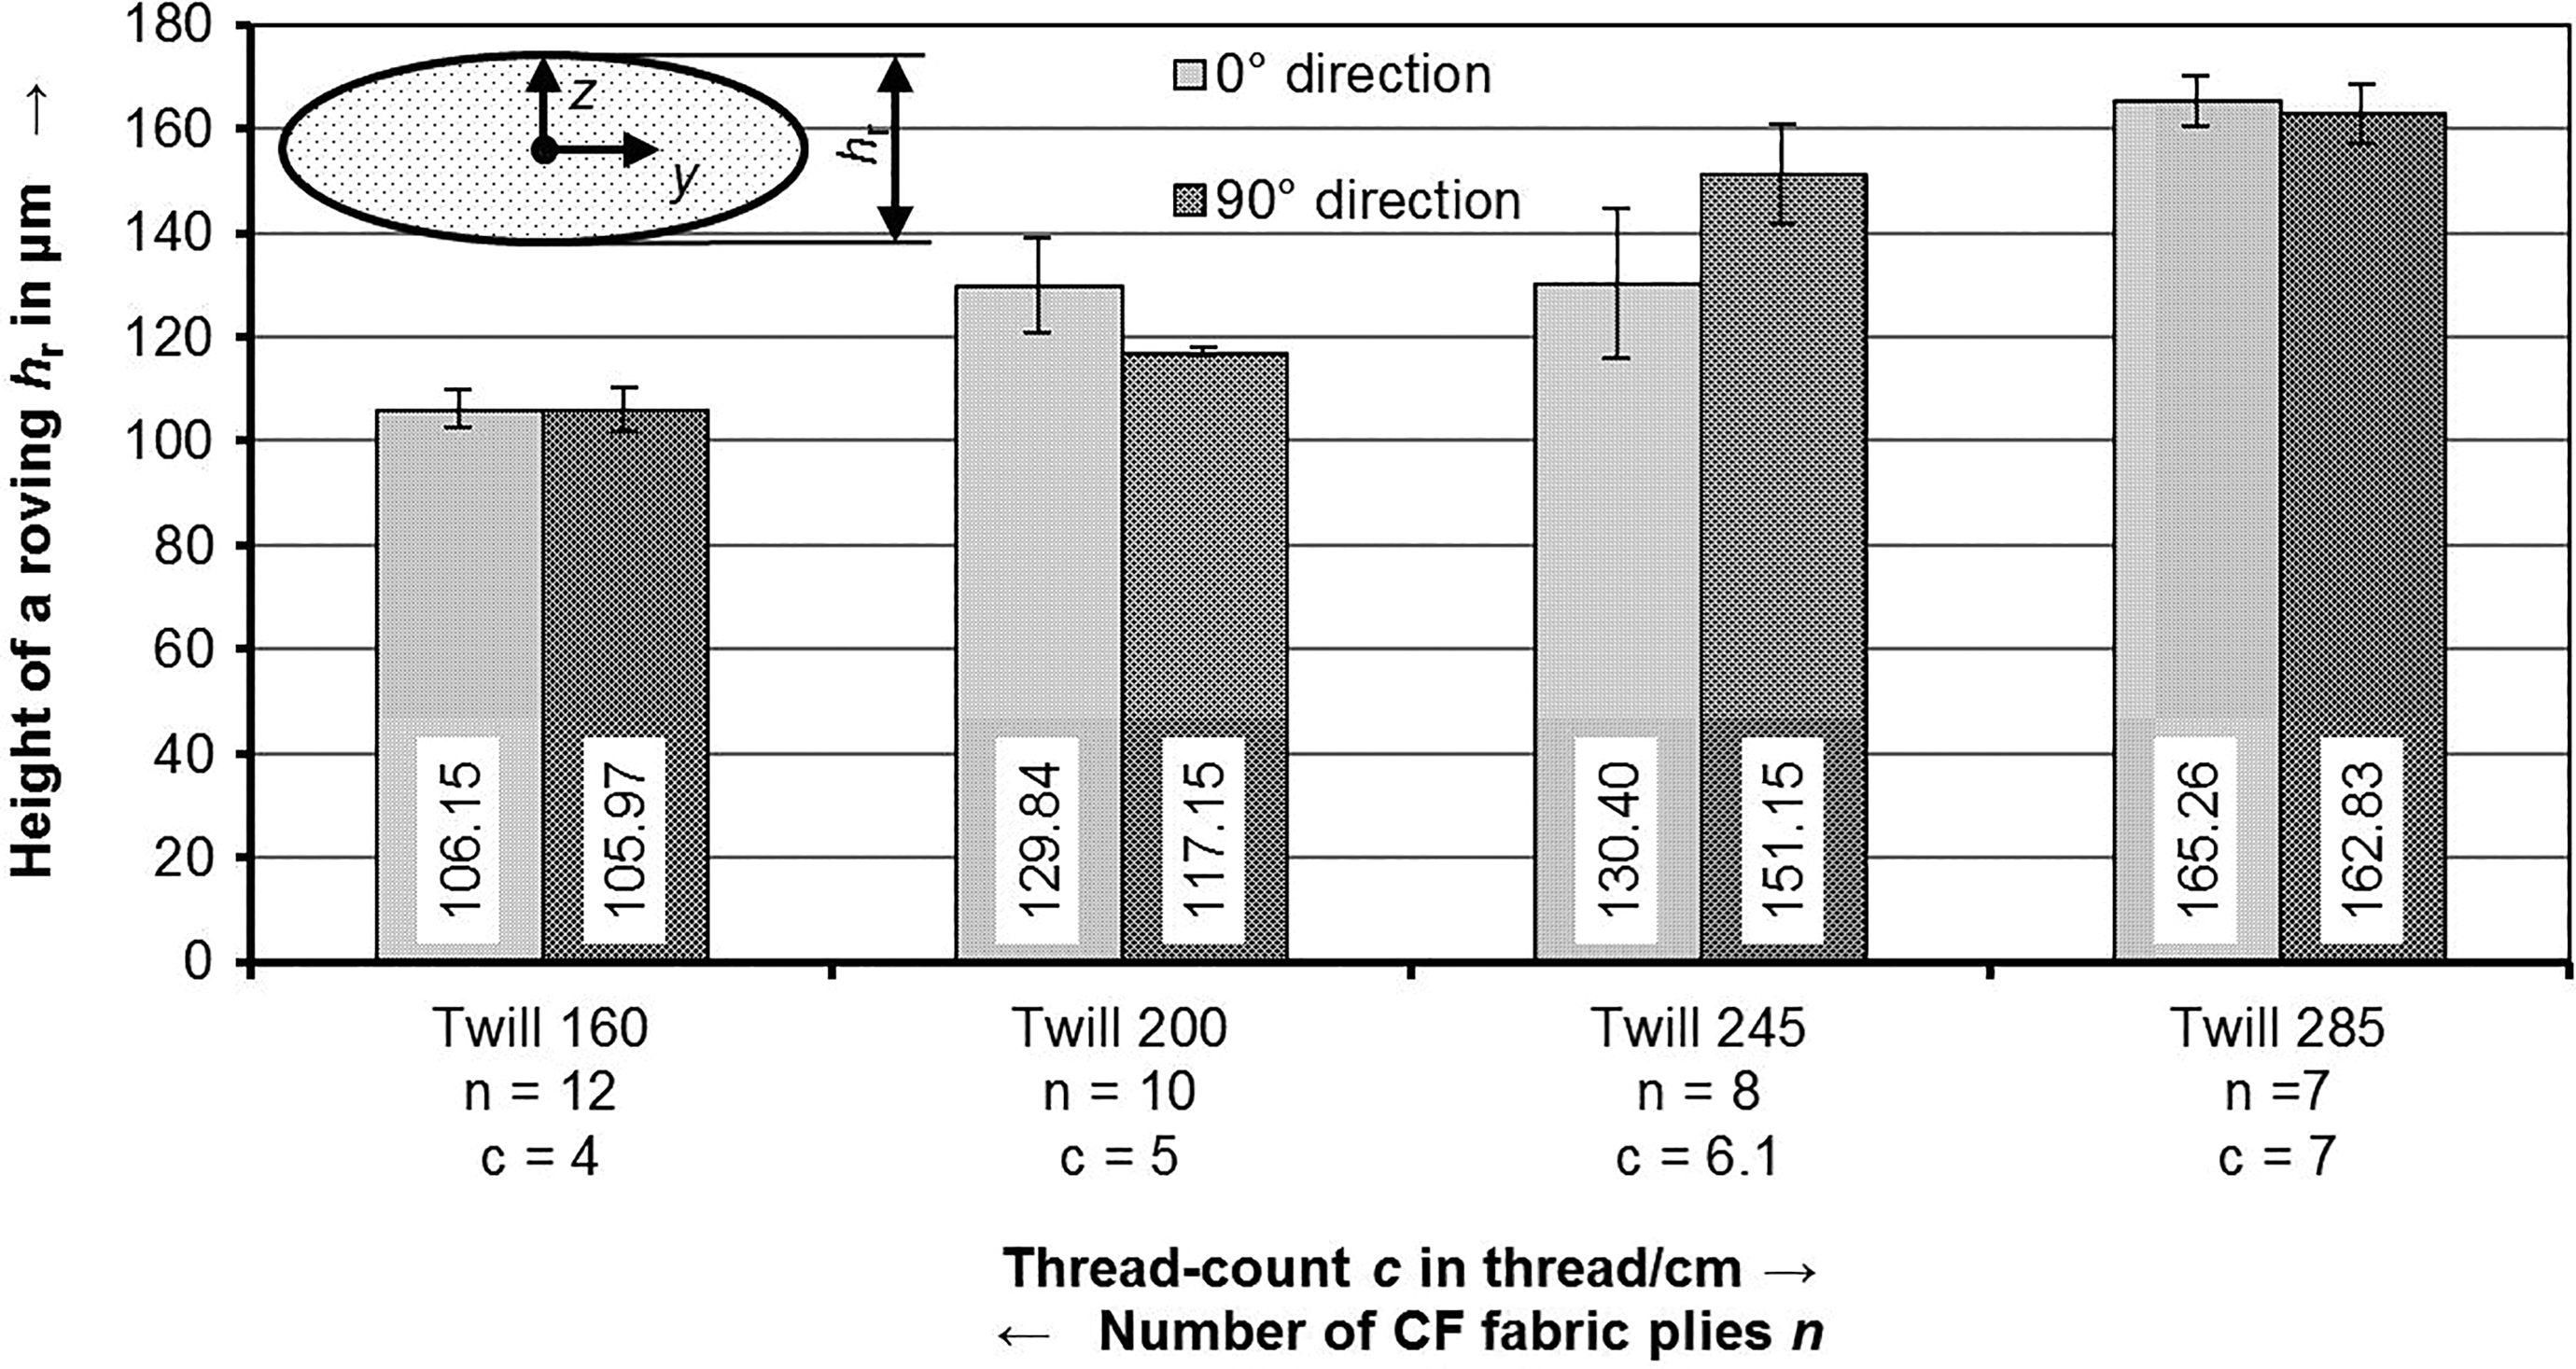
Height hr of the rovings measured in microsections of specimens with different CF reinforcement fabric.

Through comparing the calculated with the measured cross-section areas, one can see that the calculated areas are mostly higher than the measured ones, but the differences are less than 5%.
An individual comparison of the rovings’ widths and the heights shows a significant influence of the thread count c (Figures 15 and 16). The lower the thread count c, the higher the roving’s width wr and the lower the roving’s height hr. If the number of rovings is reduced within a ply, there is more space for the remaining rovings in lateral direction. Thus, these rovings will expand in this direction, if a force is applied perpendicular to the ply. Since the cross-section area Ar keeps constant, the height hr will be reduced. The perpendicular force results from the compaction of the CF fabric plies during the impregnation and consolidation process.
Aligned rovings are lying side by side without any distance, whereby the theoretical maximum width of a roving is limited to 1/c. This maximum width declines with increasing thread count. However, in some cases, the measured widths (see Figure 15) exceed this limit. This divergence is a result of the method used to measure the width of the rovings wr. The width of a roving was defined as the length of the longest axis of the elliptical cross section of a roving (compare Figure 8). This method does not take into account if adjacent CF rovings with same direction are overlapping each other (compare Figure 13).
If the measured roving width wr is smaller than the theoretical maximum width 1/c, for example, in the case of Twill160, this indicates gaps between adjacent rovings.
According to Rudolf et al., 9,28 a larger electrical contact area will improve the heating behavior and consequently leads to a higher heating rate of CF fabrics. In order to distinguish between the influence of the threat count c and the number of fabric plies n on the induction heating behavior, the projected contact area between two crossing rovings Ap, the projected contact area within a single ply Ap,ply, and the total projected contact area within a laminate Ap,total are compared (Figure 17).
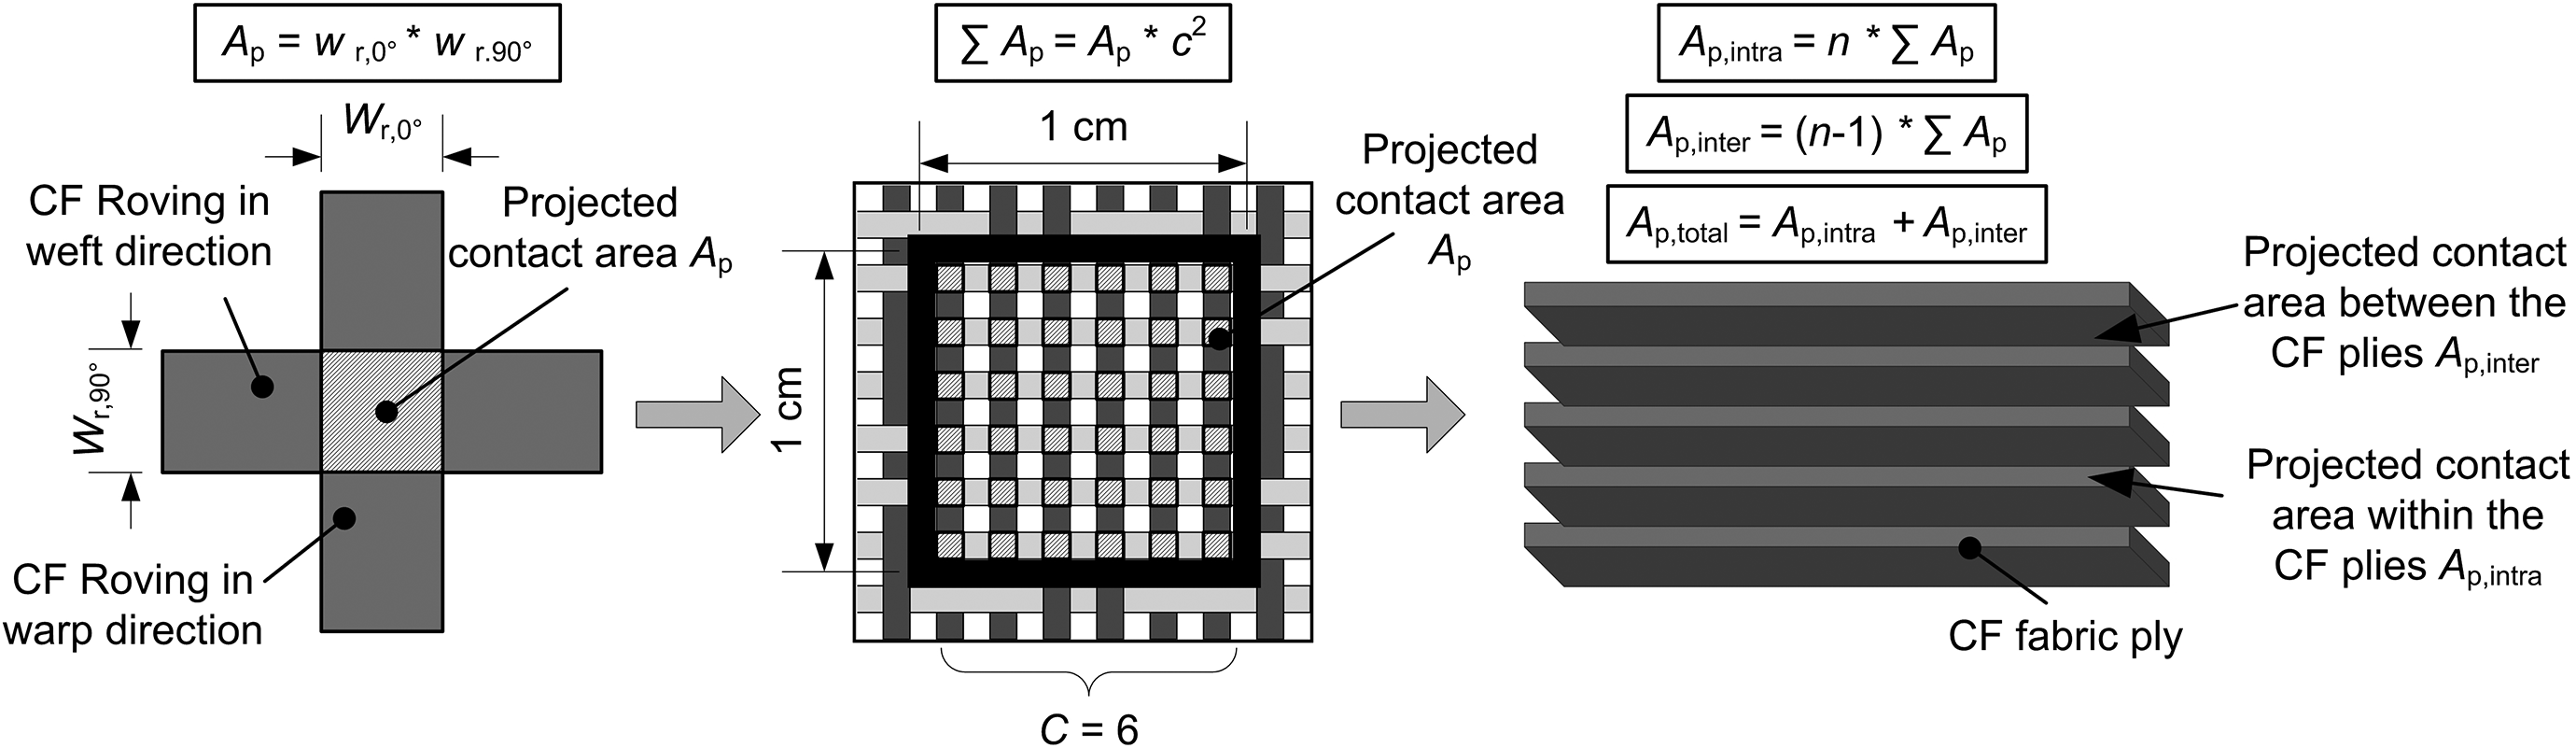
Schematic description of the calculation of the total projected contact area based on the width of the rovings.
The projected contact area between two crossing rovings Ap is the maximum area where a contact between two crossing rovings can be achieved. It is calculated by the arithmetic product of the width of each involved roving. The magnitude of the real contact area between two crossing rovings is a fraction of the projected area and depends on the FVC, the textile parameters, and the fabric style.
Based on the average width wr of the CF rovings in 0 and 90° directions, given in Figure 15, the projected contact area between two crossing rovings Ap is calculated (Figure 18). Additionally, the theoretical maximum projected contact area Ap,max of a balanced fabric is calculated by the square of 1/c. Both curves show that the projected contact area of single roving–roving junction is larger for small thread counts.
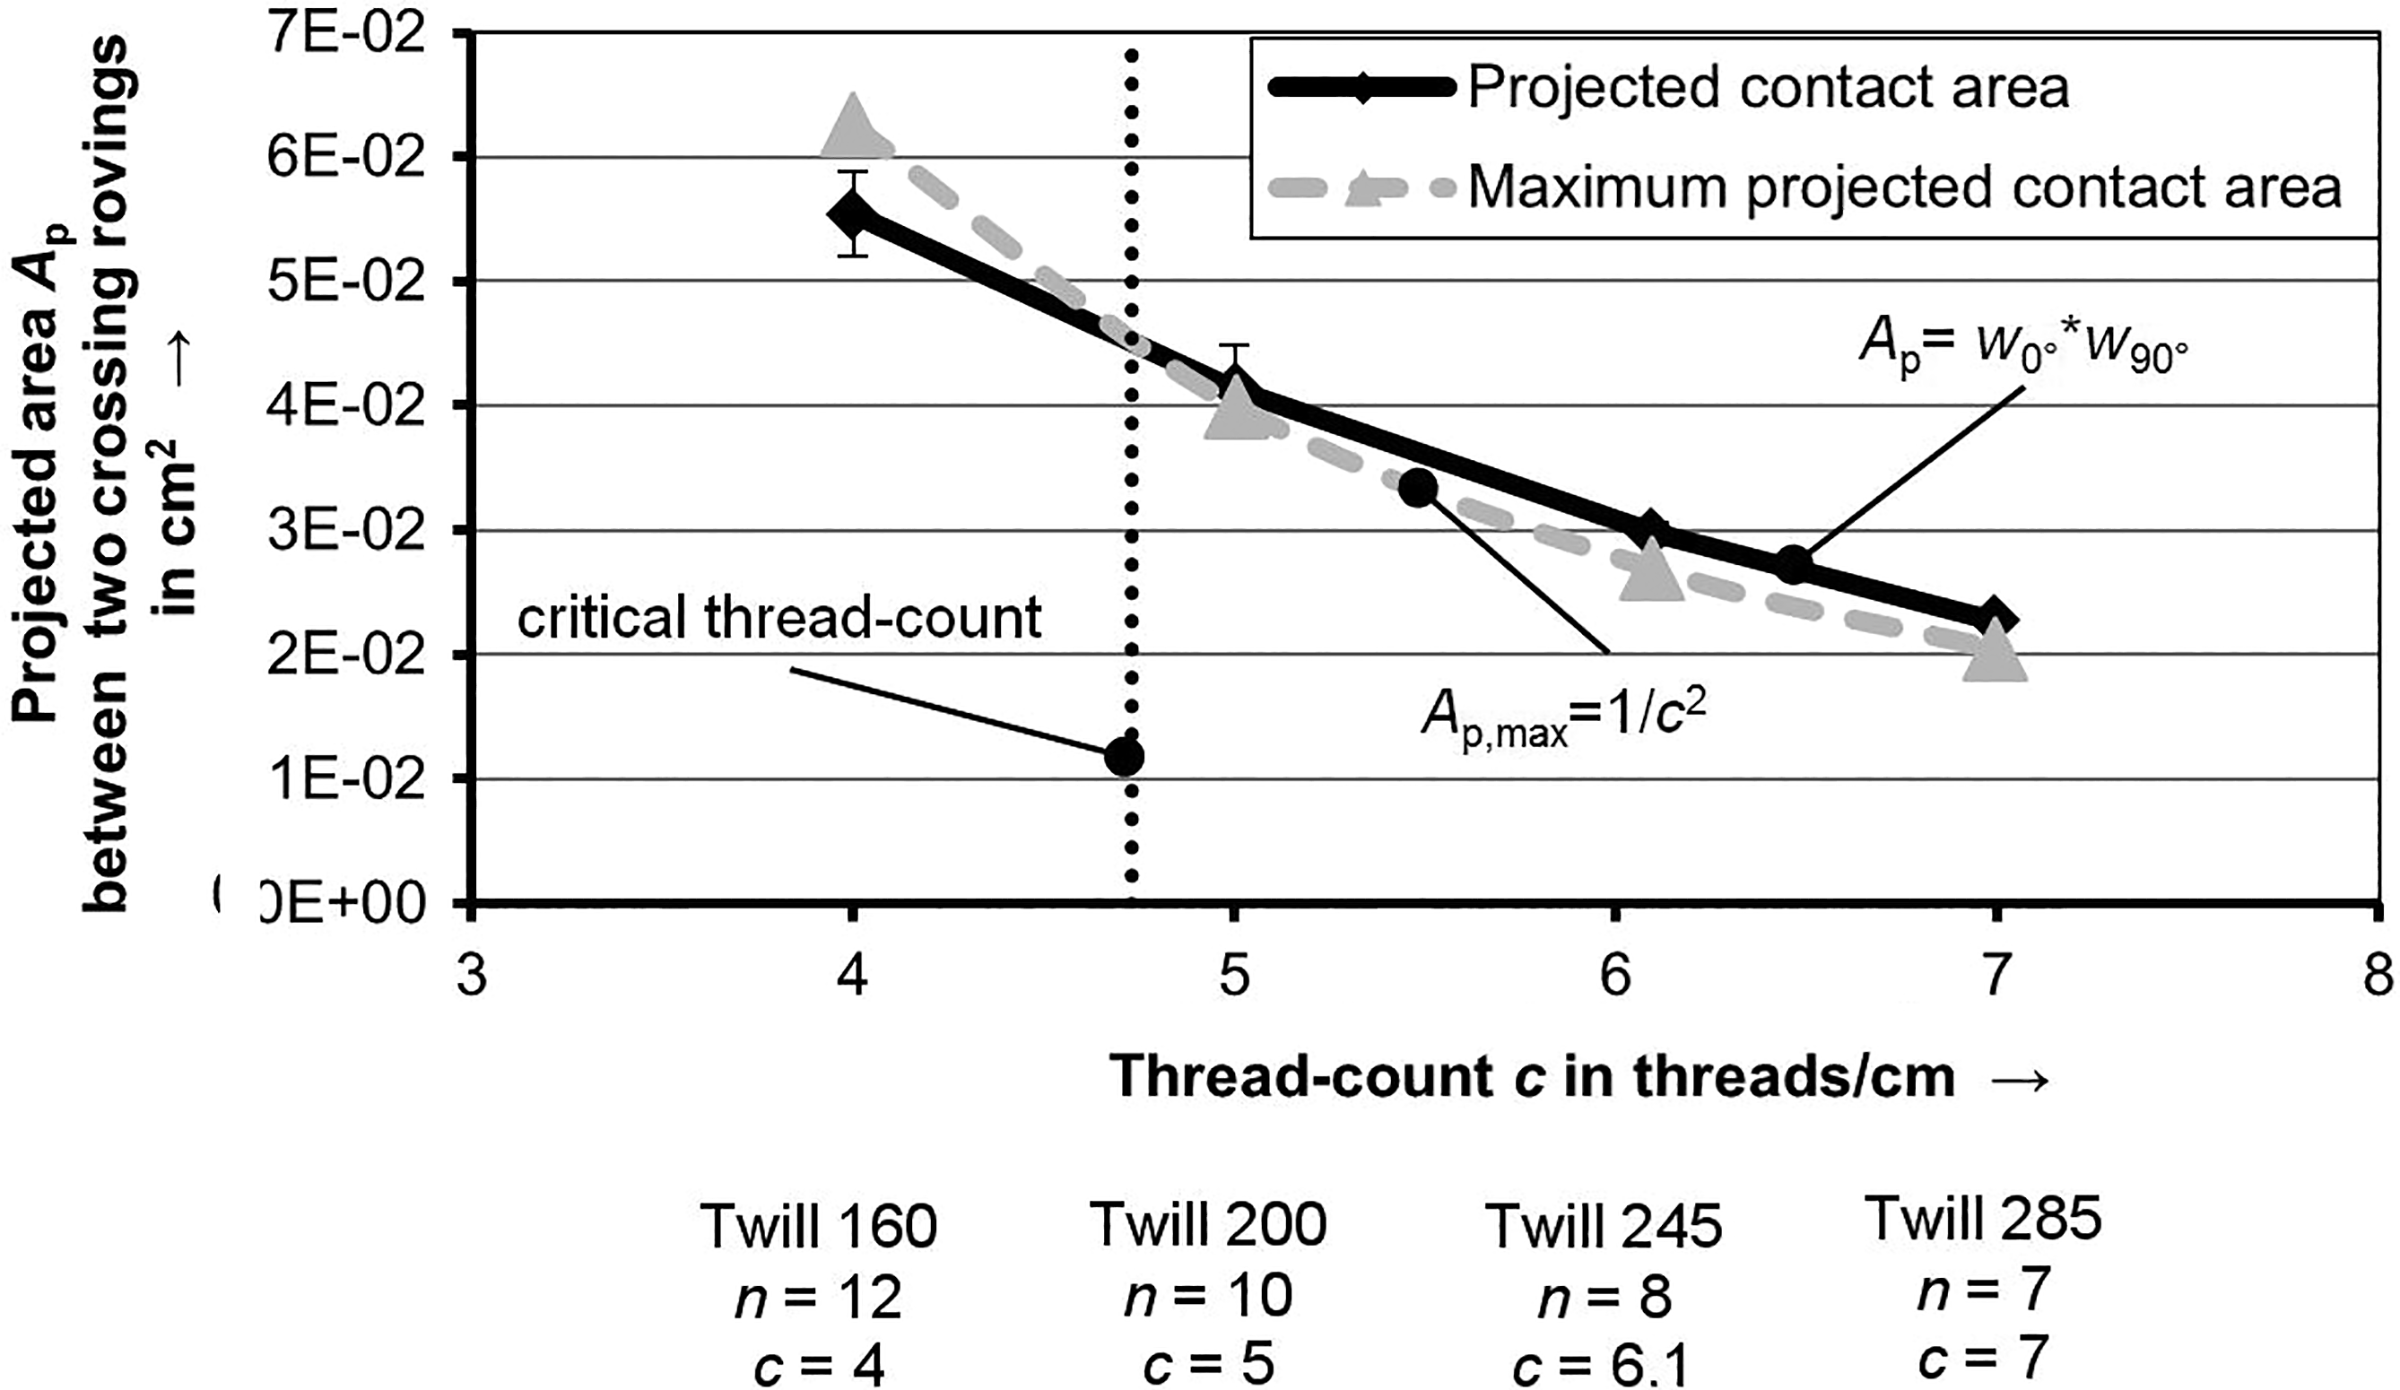
Projected area between two crossing rovings Ap with respect to the thread count. The zero point of the x-axis is suppressed.
There is a point of intersection between the curve of the projected contact area Ap and the theoretical maximum projected contact area Ap,max. The thread count at this point represents a critical thread count within this study. The critical thread count indicates the thread count where a lateral contact between adjacent rovings is achieved and consequently no gaps between the adjacent rovings occur.
To calculate the projected contact area of one ply Ap,ply, the number of roving–roving junctions provided by the fabric has to be determined. Since the indication of the thread count is related to a length of 1 cm, the following calculations are related to an area of 1 cm × 1 cm (1 cm2). For a balanced fabric, the number of the roving–roving junctions per 1 cm2 is the square of the thread count c (Figure 19).
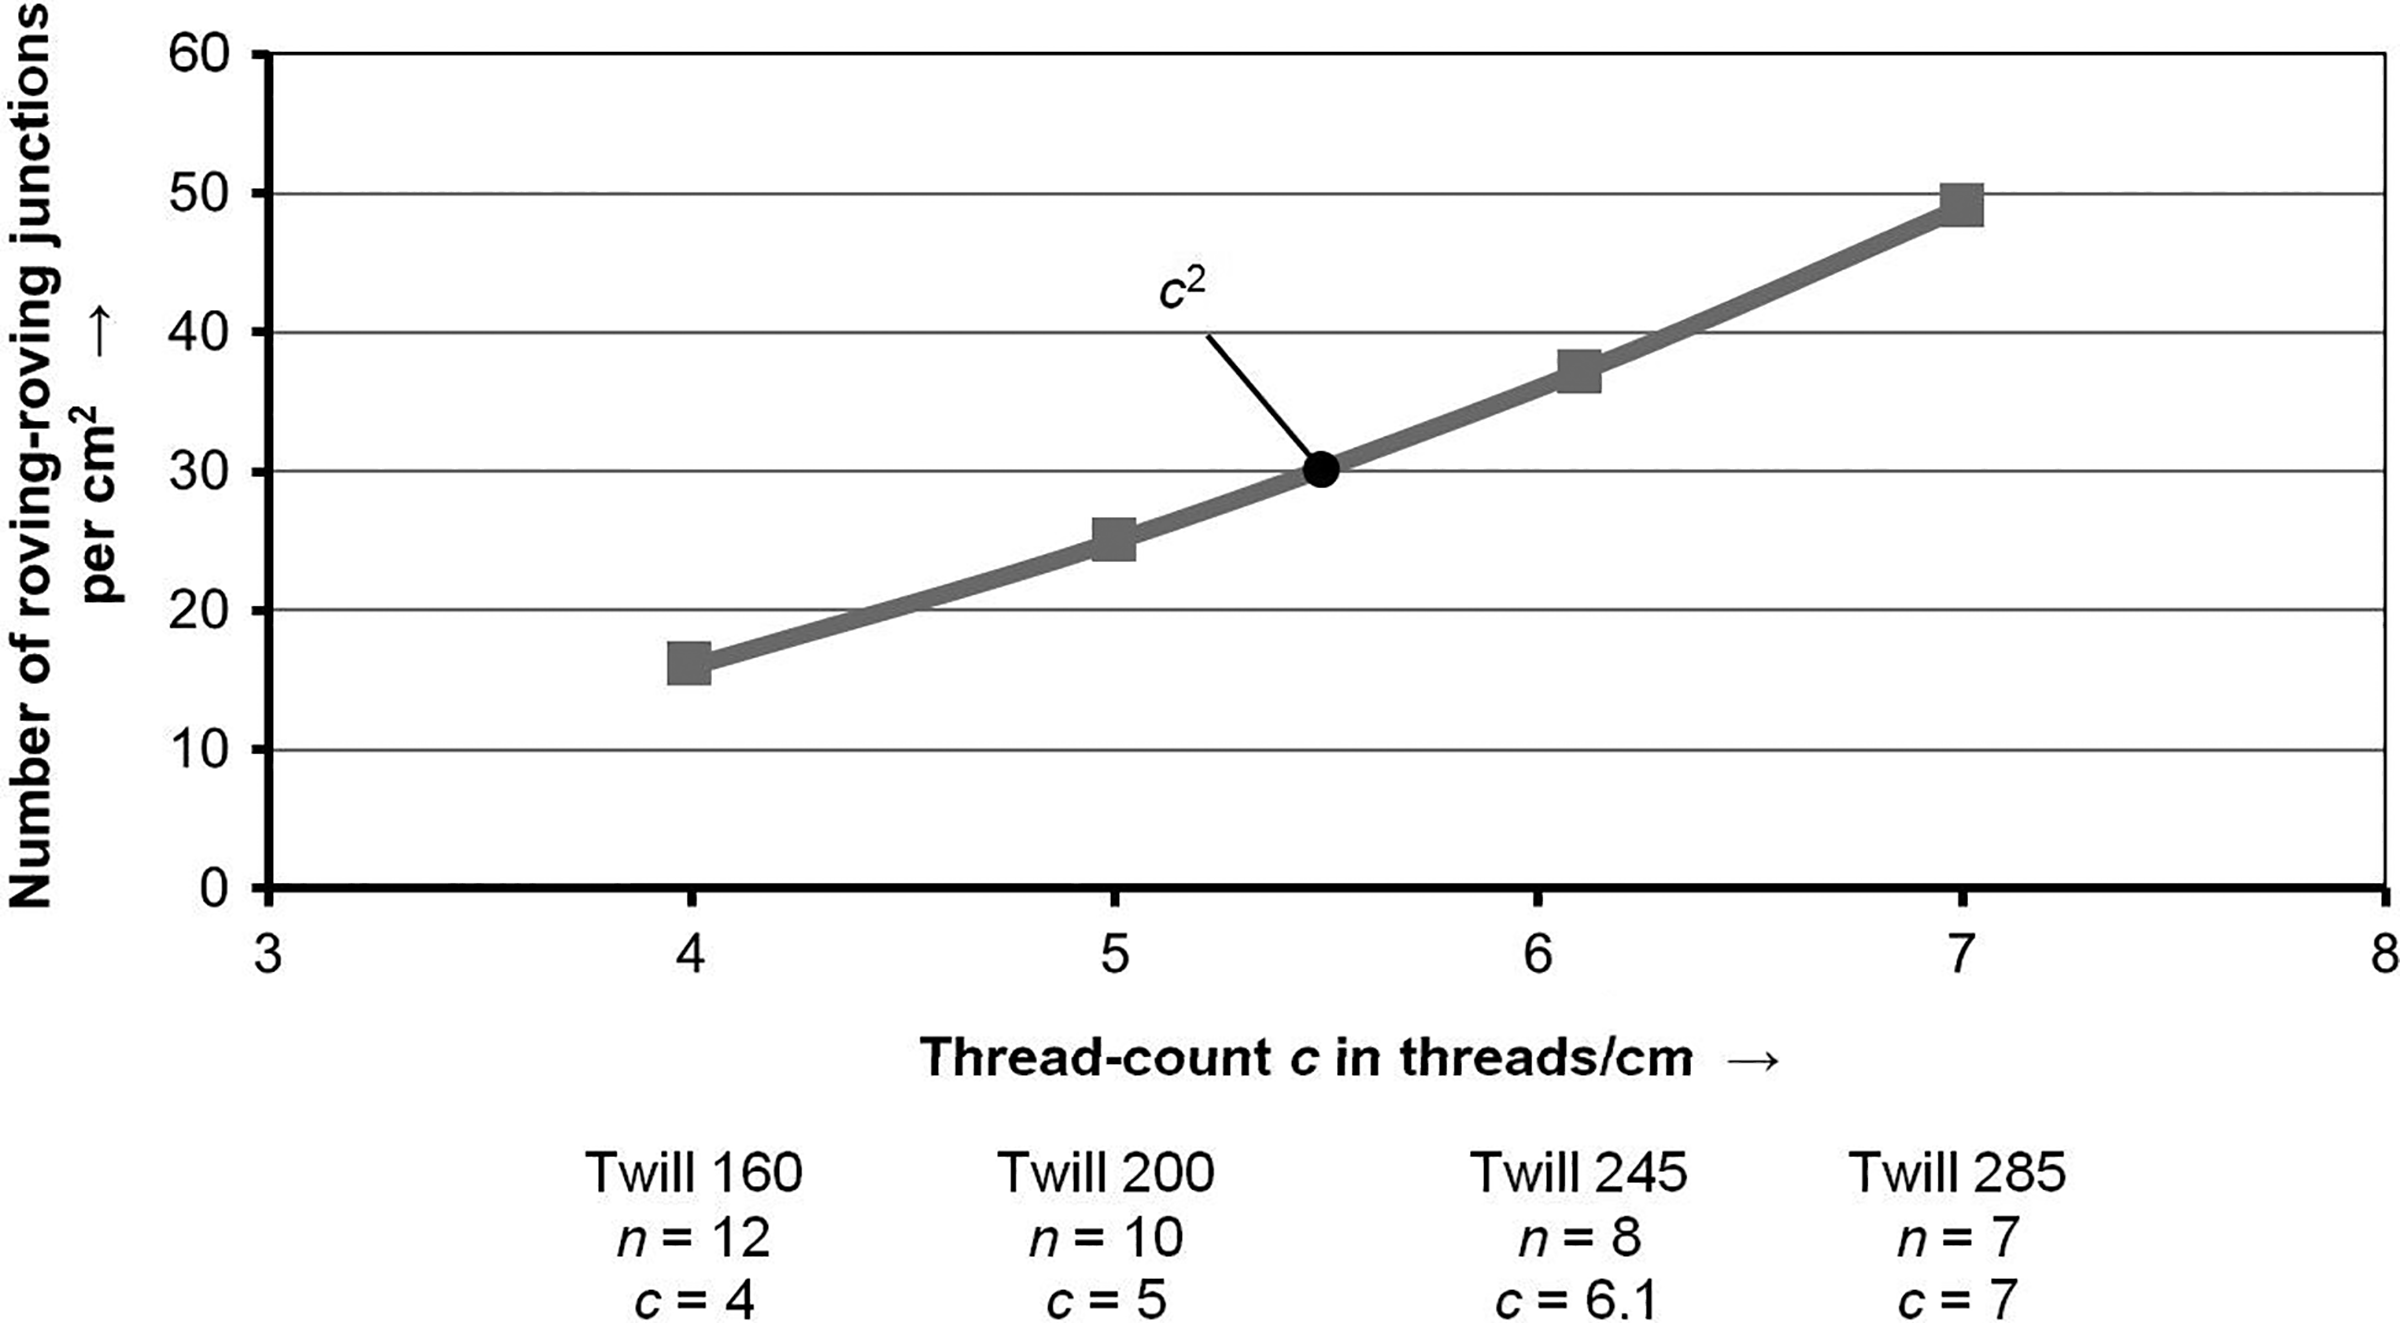
Number of roving–roving junctions in a single ply with respect to the thread count. The zero point of the x-axis is suppressed.
The projected contact area of one ply Ap,ply is the arithmetic product of the projected area between two crossing rovings Ap and the number of roving–roving junctions in one ply (Figure 17). It is feasible to plot the results as projected contact area of one ply Ap,ply per cm2 in cm2 or as projected contact area in relation to the reference area (1 cm2) in percent (Figure 20). The latter type indicates how much of the area of one ply serves as projected contact area.
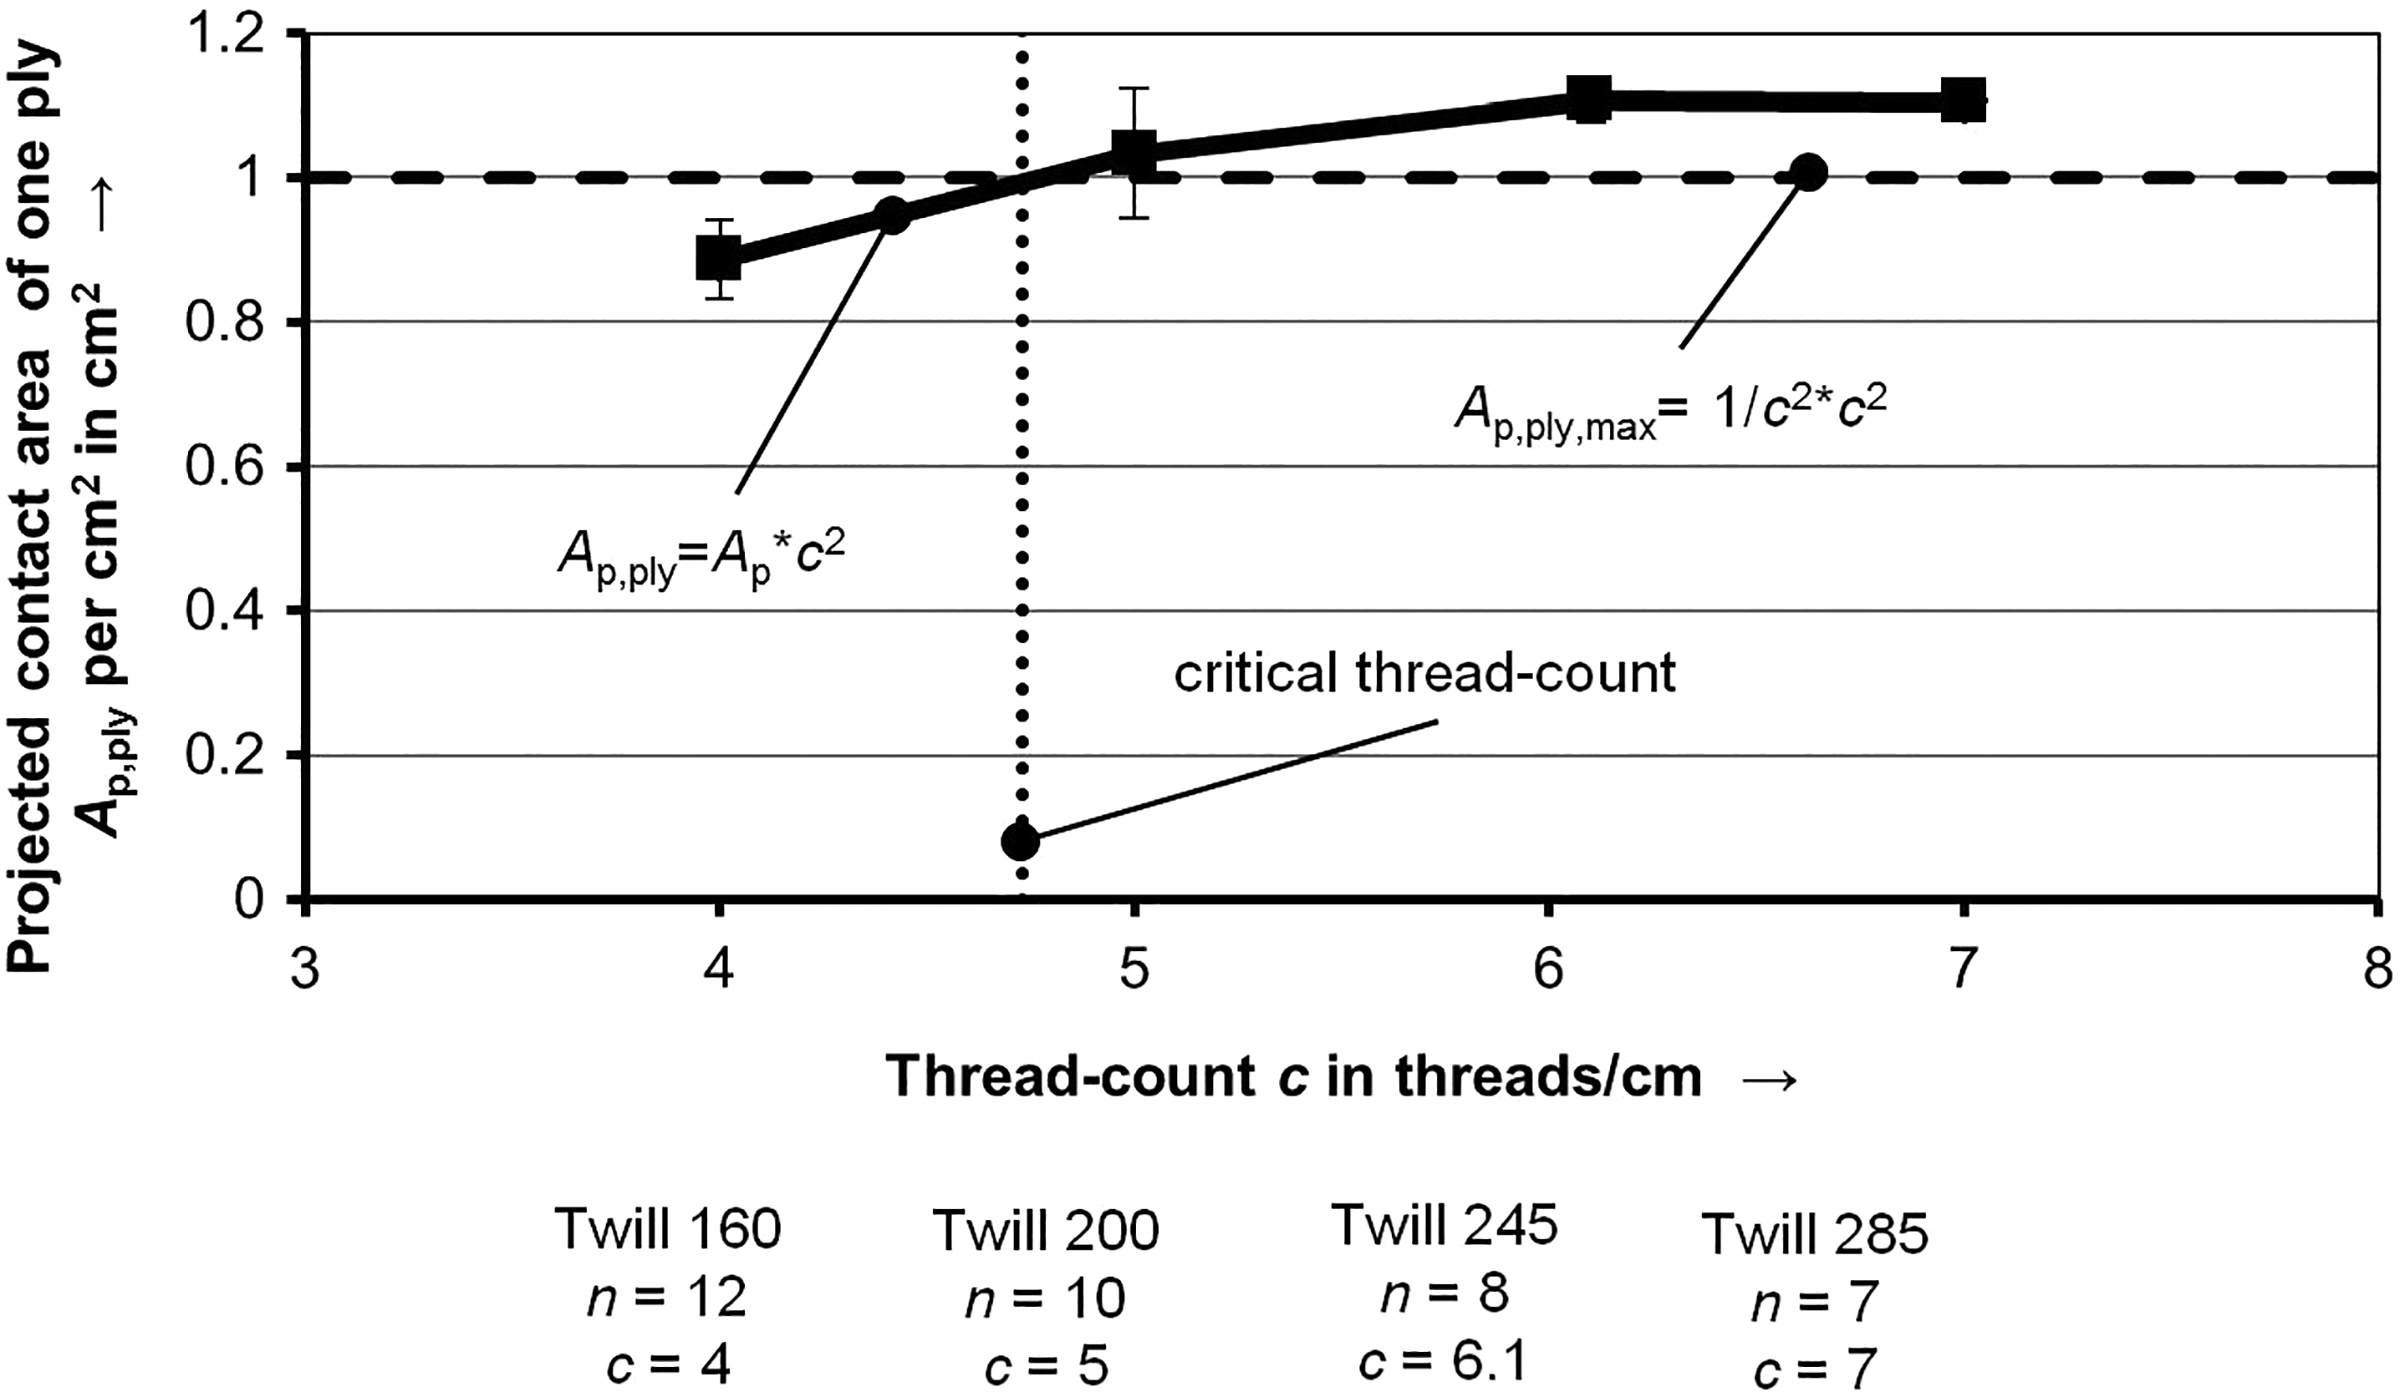
Projected contact area of one ply per cm2 and projected contact area in relation to the reference area with respect to the thread count. The zero point of the x-axis is suppressed.
Figure 20 shows that the projected contact area of one ply initially increases until it approaches a limit value. It is plausible that this limit value must be 100% of the reference area. However, the projected contact area of all fabrics except the Twill160 exceeds this limit. The reason is explained above. The width of a roving was measured individually for each single roving. Hence, the projected contact area which exceeds 100% represents a lateral overlapping of the rovings and does not contribute to the induction heating mechanisms. In order to consider this deviation, the following calculations do not consider values above 100%. Thus, the projected contact area of one ply Ap,ply is limited to 1 cm2.
Figure 20 also shows the critical thread count. In this depiction, it is indicated by the intersection point between the line of the maximum and the projected contact area per ply Ap,ply.
The last consideration is performed on laminate scope. Here, a distinction is made between the total projected contact area within a laminate Ap,total, the projected contact area within all plies of a laminate Ap,intra, and the projected contact area between all plies of a laminate Ap,inter (Figure 17). The projected contact area within all plies of a laminate Ap,intra is the arithmetic product of the projected contact area of one ply Ap,ply and the number of CF fabric plies n and represents all intraply roving–roving junctions in a laminate. The projected contact area resulting from all interply roving–roving junctions in a laminate is represented by the projected contact area between all plies of a laminate Ap,inter. It is the arithmetic product of the projected contact area of one ply Ap,ply and the number of ply–ply interfaces in the laminate (n-1). The total projected contact area within the laminate Ap,total can be calculated by adding the projected contact area within all plies of the laminate Ap,intra and the projected contact area between all plies of the laminate Ap,inter.
Figure 21 shows the projected contact area within all plies of a laminate Ap,intra, the one between all plies of a laminate Ap,inter, as well as the total projected contact area within a laminate Ap,total. All curves show the same behavior. The highest projected contact areas occur for Twill160, which provides the lowest thread count and consequently the highest number of CF fabric plies. Between a number of 10 and 12 CF fabric plies, the curves show a slight gradient. For numbers lower than 10 plies, the curves show a higher negative gradient. This effect is mainly due to the difference in the number of fabric plies n, which is necessary to achieve the same FVC. At the scope of a single ply, the projected contact area is dominated by the numbers of roving–roving junctions (c2) (Figure 20). Hence, a higher thread count leads to a higher projected contact area in a one ply. However, an increase in thread count results according to equation (7) in a decrease in the number of CF fabric plies, which are necessary to achieve a defined FVC in a laminate. The influence of the numbers of roving–roving junctions (c2) at the scope of a single ply is predominated at the scope of a laminate by the influence of the numbers of CF fabric plies n (Figure 21), which is according to equation (7) proportional to 1/c. Through adding a new ply to the laminate setup, the total projected contact area Ap,total is increased by the additionally contact area which occurs at the interply and intraply interfaces of this ply.
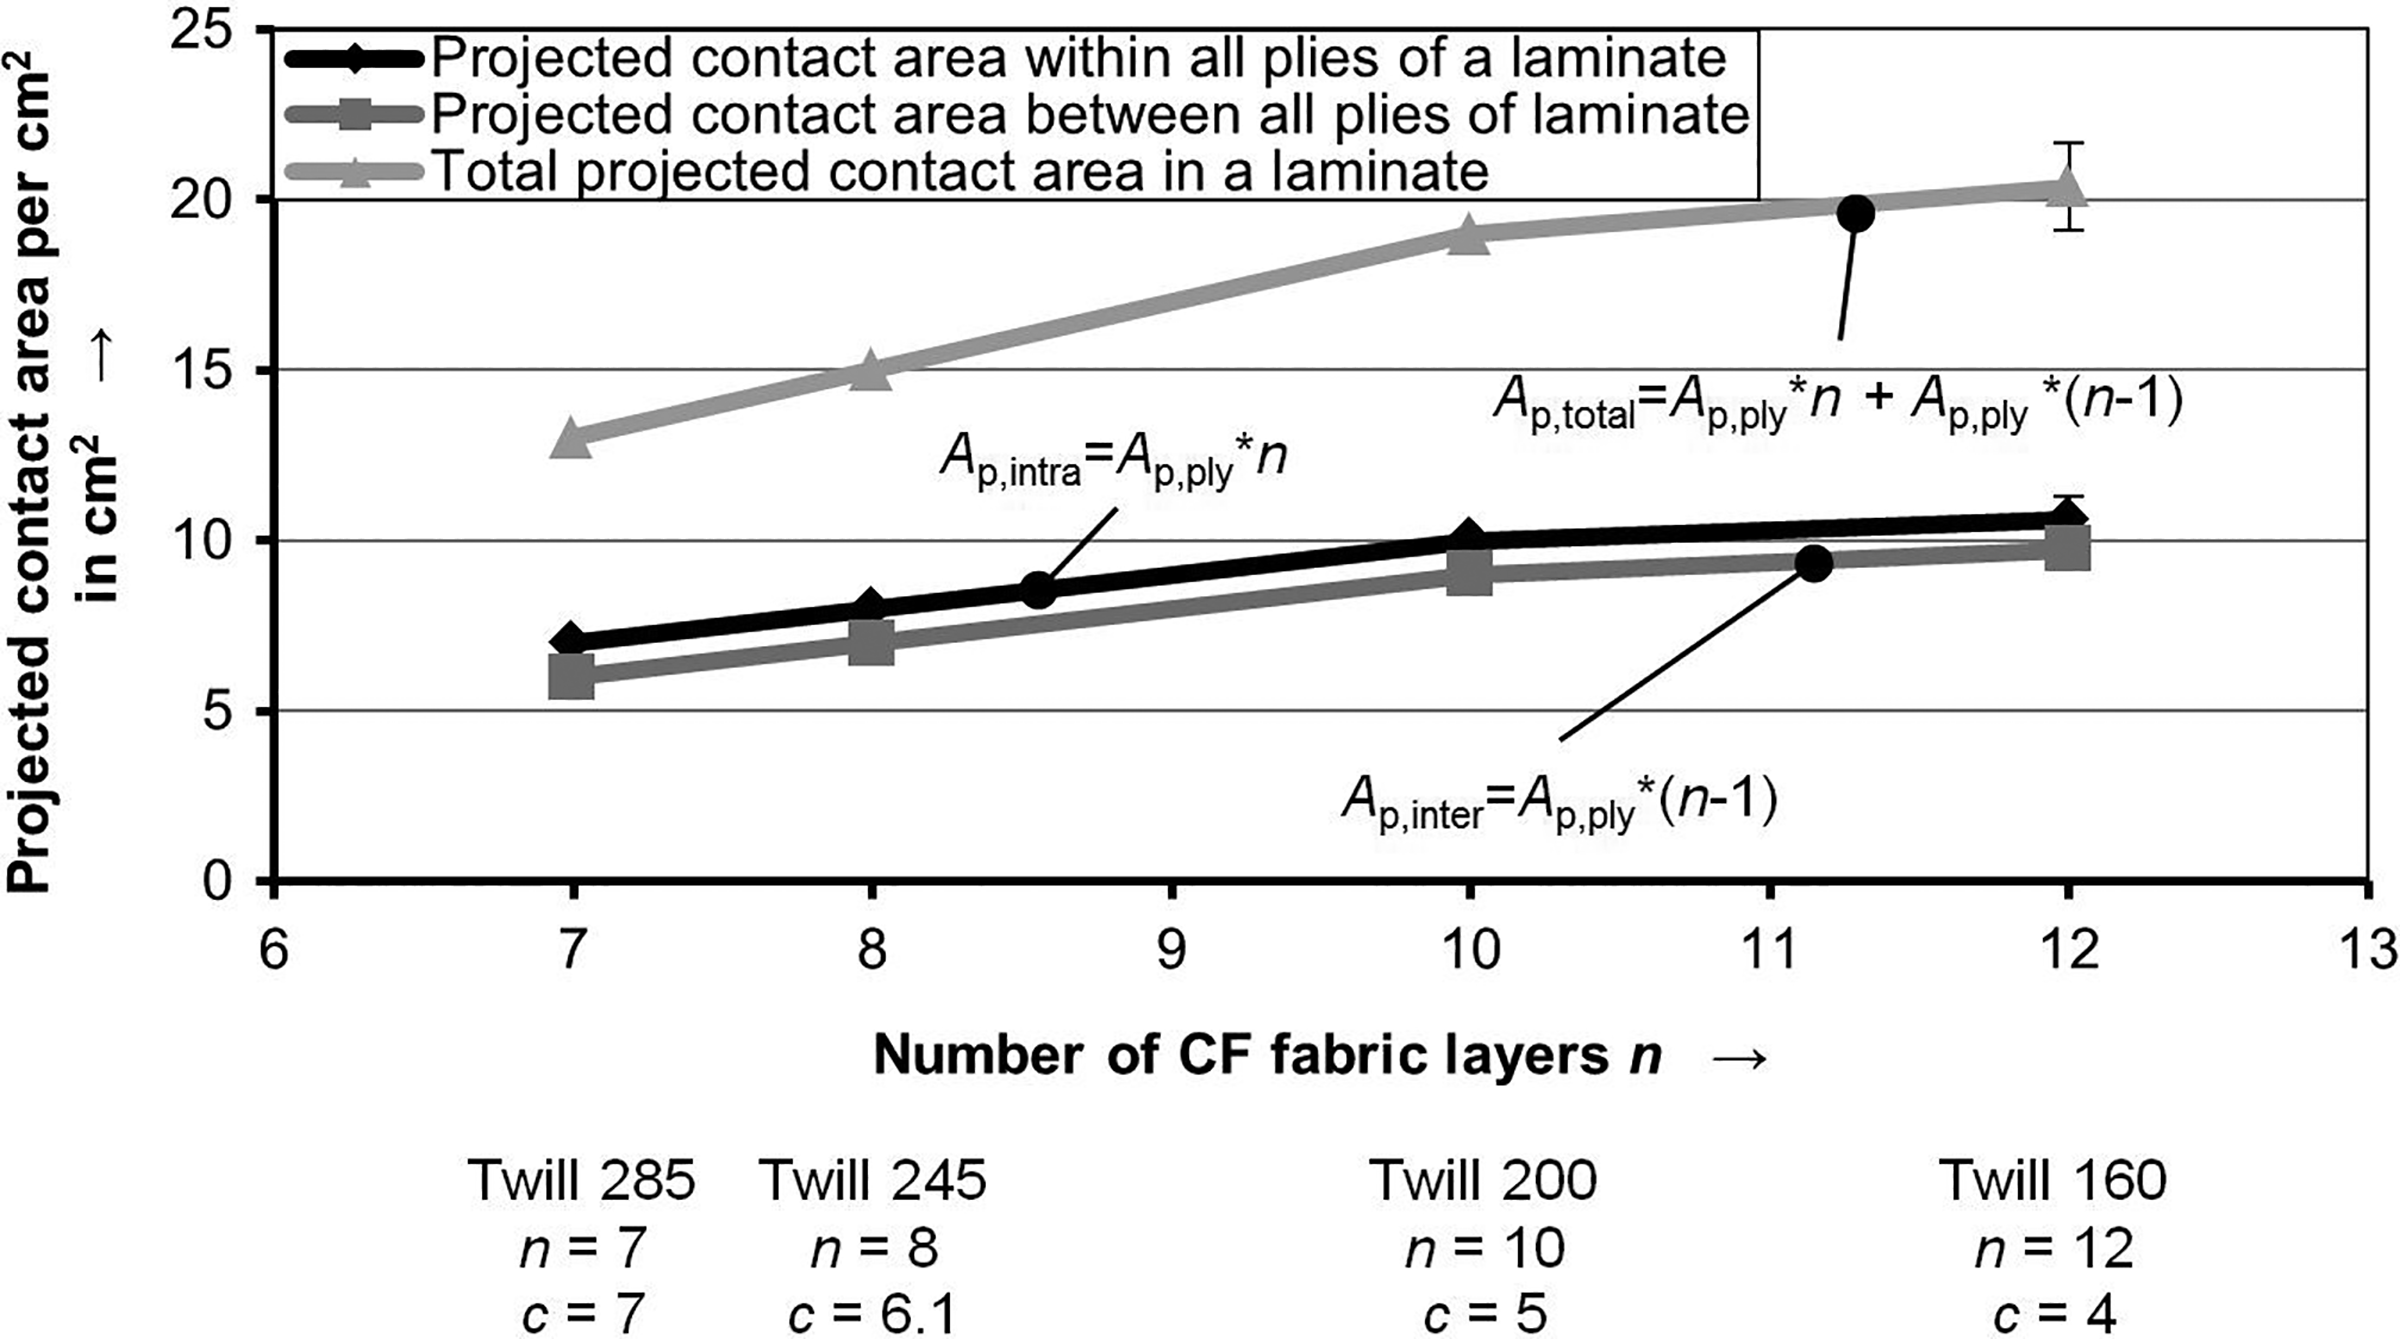
Projected contact area per cm2 within and between all plies of a laminate with respect to the number of CF fabric plies n. Additionally, the resulting total projected contact area per cm2 of a laminate is shown. The zero point of the x-axis is suppressed. In this calculation, the projected contact areas of Twill200, Twill245, and Twill285 were limited to a maximum value of 1 cm2 for the projected contact area in one ply Ap, ply.
Considering the interlply and the intraply roving–roving contacts, the fine-layered laminate structure, and consequently the increased projected contact area, it can be explained why a lower thread count results in a higher heating rate by means of induction heating. An increase of the number of CF fabric plies n in the laminate setup is accompanied by a higher contact area within the laminate.
Conclusion
In order to forward the efficiency of induction heating processes for thermoplastic CF fabric-reinforced composites, the influence of the thread count on the inductive heating behavior was investigated. This approach contributes to a better understanding of the relevant heating mechanisms. Based on static induction heating experiments, four different CF fabrics (twill 2/2), differing only in the thread count and consequently in the area weight, were investigated. For this purpose, an evaluation method of the heating experiments was developed. By means of this method, the heating rates of the induction coil-faced surface and opposite surface were calculated and compared. In general, a reduction of the thread count c and consequently an increase of the numbers of CF plies n lead to an increase of the heating rate.
In order to ascertain an explanation which parameter is more relevant for the heating rate, microsections of the specimens’ cross section were observed. This examination yields the following results: The lower the thread count c, the higher the roving’s width wr and the lower the roving’s height hr. Through a lower thread count c, the number of CF fabric plies in laminate is increased and the laminate becomes fine-layered as well as more homogeneous. Thus, the interply and intraply contact points between crossing rovings are also increased. The highest total projected contact area Ap,total of a laminate is provided by laminates made of CF fabrics with low thread count and a high number of CF fabric plies, respectively. Due to a higher contact area, the heating rate of laminates made of CF fabrics with low thread counts is higher, compared to fabrics with a higher thread count.
These results show the importance of the contact area between crossing rovings for the induction heating behavior.
Footnotes
Funding
The author(s) disclosed receipt of the following financial support for the research, authorship, and/or publication of this article: This work has been conducted in the frame of the project “Process Optimization of Induction Welding of Continuous Carbon-Fiber Reinforced Thermoplastics by Process Simulation” which is funded by the Deutsche Forschungsgemeinschaft (DFG, German Research Foundation)—MI 647/27 -1.