
Abstract
Achieving the maximum potential of parts manufactured with in-situ consolidation thermoplastic Automated Fiber Placement without a final bulk consolidation is a challenging task. This is due partially to the continual development of the technology itself and partially due to material defects which are not fully removed during part manufacturing. In this paper, a methodology is presented for the evaluation of prepreg tape and laminate quality relevant to the manufacturing process. A novel approach is presented to quantify tape quality and the fiber volume content distribution, porosity, all of which are identified as significant influences on laminate quality. A new approach to ultrasonic testing is applied for quantitative porosity analysis promising advantages over conventional methods. Laminate porosity was successfully measured using the proposed pulse-echo ultrasonic attenuation method. The fiber content distribution from the tape used in testing shows characteristics interpreted as unfavorable for high quality in-situ AFP.
Keywords
Introduction
In the last few decades, fiber-reinforced plastics have been established as high performance materials for aerospace applications. However, the potential of composite structures is not yet reached. Carbon full fiber-reinforced thermoplastics combined with advanced automated manufacturing techniques such as in-situ Automated Fiber Placement (AFP) promise a reduction in cost and process time.1,2
With in-situ AFP, the laminate quality depends not only on the process parameters but the prepreg material quality as well, particularly inter- and intralaminar (tape) porosity. Other relevant material properties include tape porosity, surface polymer richness and surface roughness. 3 If AFP process parameters are evaluated based on the laminate quality, the prepreg quality too needs to be taken into account. Therefore, a suitable methodolgy for the quantification of prepreg tape characteristics is of great relevance to the development of AFP.
The most common methodology used for the determination of CFRP quality is microscopy. From a meta analysis of 25 relevant studies, 76 % relied entirely or partially on micrographs, whereas CT-scans or SEM analysis were used in 26 %.3–27 In only one of these papers, ultrasonic testing was utilized as a qualitative analysis method. Oftentimes, cross-sectional micrographs are merely interpreted qualitatively in terms of acceptable or unacceptable laminate consolidation. Quantification is applied on a basic level, such as the determination of porosity or fiber content, leaving further potential yet to be exploited.
While micrographs are relatively easy to produce, the quality depends largely on the operator and is known to be prone to artefacts and scratches. Additionally, information from micrographs may be misleading due to their focus on one specific position within the sample, which may or may not be representative of the part as a whole. CT-scanning is not affected by those specific disavantages because it is a three-dimensional and non-destructive analysis. It is however limited in resolution to a minmal voxel-size and generally provides less depth of information. In contrast to micrographs, CT requires expensive equipment and well trained personnel. 28 Zhang et al. analyzed the volumetric void distribution in thermoplastic prepregs using CT and microscopy. The majority of voids were found to be ellipsoidal rather than spherical. Therefore, large scanning areas are required to achieve a representative elementary volume allowing accurate porosity estimation. 29 Ultrasonic scans are most commonly used as a mean of qualitative material analysis, identifying the location of pores or delaminations. Approaches to the quantification of ultrasonic scans have been proposed by Stone and Clarke 30 and subsequently applied successfully in research applications.31,32 Olson et al. have shown a general correlation between ultrasonic attenuation and porosity for thermoplastic composites using through-transmission scanning. 31 The desirable range of porosity values below 2% yielded insufficiently accurate results, though the application of extensive ultrasonic scanning proved an instrumental assistance in manufacturing underwater pressure vessels with a porosity of <1%. 33
In this paper, a methodology for the quantification of prepregs and laminates is presented through a novel combination of these well-established diagnostic techniques. Extensive tests on a 16 ply quasi-isotropic laminte were conducted as a proof of concept for the advanced unltrasonic quantification method presented here. This includes conventional microscopic analysis and CT-scans for the estimation of porosity.
The direct approach to the quantification of porosity with ultasonic attenuation using the pulse-echo method as presented here yields major advantages over previous approaches. A greater study of the influence of laminate layup design on ultrasonic attenuation was subsequently carried out. Examples of the results of the ultrasonic quantification are shown for the purpose of demonstrating the potential of the new methodology. For the first time, the basic research regarding the application on thermopalstic CFRP was carried out and validated using this set of AFP-manufactured laminates.
In order to further explore the connection between prepreg quality and laminate quality, the fiber volume content distribution is proposed as a new criterion for prepreg quality. This quantitative approach advances the commonly used qualitative description of material properties via micrographs. By measurnig the fiber volume fraction distribution, prepreg tapes can be assessed in a more differentiated way.
Methodology
Materials
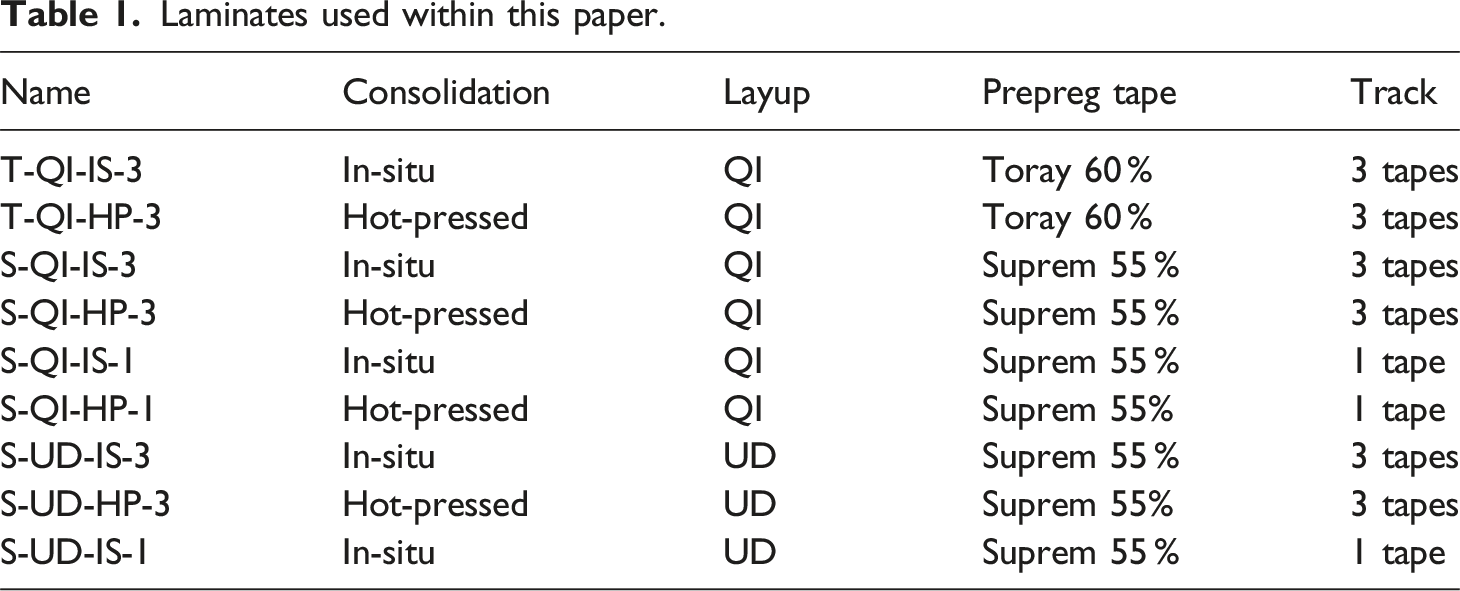
Laminates used within this paper.
Micrographic Analysis
Micrographs from polished specimens of both tapes and laminates were used for the determination of porosity. The samples were prepared by a two-step grinding process followed by a three-step polishing process using 9, 3 and 0.25 µm diamond suspensions, respectively. Grinding and polishing parameters must be varied between tapes and laminates to account for uneven rates of material removal between the sample and the mounting material. The higher fraction of mounting material in tape samples would otherwise lead to a relief-like surface with increased numbers of artefacts at the edges of a sample. Micrographs were recorded using a Keyence VHX-5000 digital microscope with a VH-ZST dual-objective zoom lens at 500x magnification. The images were processed in ImageJ, where they were converted into an 8-bit grayscale image. Then, a binary image was created by manually setting the threshold followed by a median-filter with a radius of 2 pixels. Automated thresholding often fails due to changes in lighting and quality of the micrograph. Good results were achieved by setting the threshold to the grayscale value of the mounting material. Because the tapes have a small thickness of around 0.2 mm, accurate positioning of the image section is important for the area fraction measurement. Uneven or crooked surfaces would otherwise lead to compromised results by the segmented mounting material, while only the inner porosity is of interest.
Based on the micrographs of tapes, the fiber volume fraction was calculated using a MATLAB script. The script requires two manually prepared binary images of the same section. One image segmenting the fibers, the other segmenting both fibers and matrix. This ensures that the result excludes the porosity and uneven surface geometry. The program breaks the images into slices of variable thickness and calculates the fiber volume for each slice. Good results were achieved with a slice width of 20 pixels or approximately one fiber diameter. While segmenting fibers is reliable, the similar grayscale values of mounting material and matrix is difficult. However, if the fibers threshold is set properly, partially thresholding the mounting material is possible. The respective result will be NaN and can therefore be identified easily.
CT
Computed tomography is a common method for the determination of porosity. Due to the high contrast between pores and composite material, grayscale analysis provides reliable results. The scans were performed with a voxel size of 3 µm, allowing the visiblitiy of individual carbon fibers. Samples of 5 × 20 mm were scanned and the resulting image stacks were processed using ImageJ.
Ultrasonic Scans
Costa et al. confirmed the proposed correlation for thermoset matrix systems using ultrasonic transmission and a calibration sample.
32
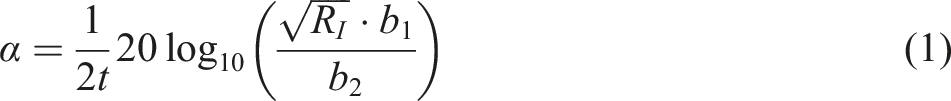
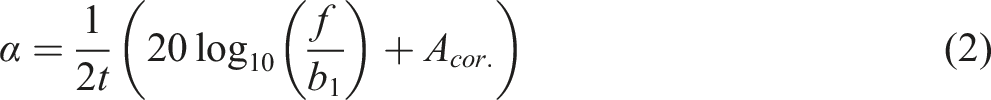
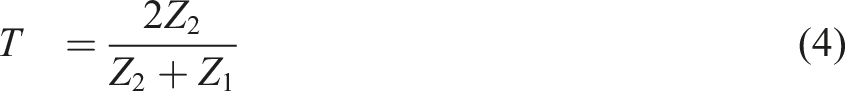
Reports of a similar correlation for thermoplasic composites could not be found. The proposed method aims to eliminate the need for a calibration sample by using pulse echo ultrasonic scans. This simplifies the application significantly compared to previous methods described in the literature. However, often no more than one back wall echo can be identified due to the high absorption on in-situ laminates. Therefore, the common method for determining the attenuation based on two back wall echos cannot be applied. It is necessary to determine the attenutaion from the front wall and first back wall echo. This requires a correction factor to account for additional surface losses, which is determined from the hot pressed laminate as the deviation between the conventional back wall attenuation and the front wall attenuation. The attenuation coefficient, α, may therefore be determined conventionally using the method from the Nondestructive Testing Handbook found in Kim et al.
34
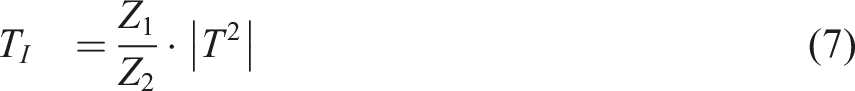
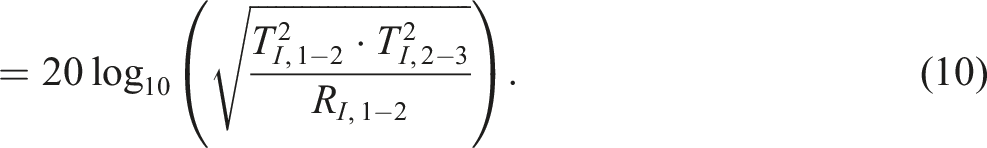
Theoretical approches to the attenuation correction based on transmission and reflection coefficients were compared to the experimental results. Since the calculation of attenuation is derived from the ratio of the ultrasound intensities of two echos, a theoretical correction factor should consider the change of intensity at each boundary layer. With
35
the change of acoustic pressure can be calculated from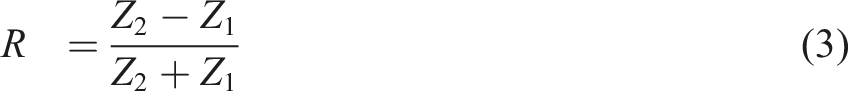


Using a MATLAB script, the mean attenuation coefficient can be calculated from the entire laminate. The overall mean porosity was chosen as the corresponding porosity value, because the correlation of both overall mean values eliminates the impcat local variations. A correlation of two locally determined values would likely be flawed, because accurate positioning of a microsection is virtually impossible.
By hot pressing the laminate, a different material state with reduced porosity is created. For both laminates, the mean attenuation is combined with the mean porosity determined by CT scans. At first, a simple linear correlation was assumed because no reports of a specific correlation for thermoplastic composites could be found. The assumed correlation was applied to the attenuation results from the in-situ laminate, providing a C-scan of the porosity distribution. Having achieved promising results, further test were conducted with different laminate layups containing quasi-isotropic and unidirectional, as well as single-tape and mulit-tape layup strategies in both in-situ and hot-pressed configuration. Using this data, a plot of the correlation was produced. From the calculated C-Scans, a histogram of the porosity distribution is calculated as well as the estimated mean value. The ultrasonic scans were performed with an Olympus OmniScan MX2 and a 5L64-NW1 phased-array probe at a frequency of 5 MHz.
Experimental Results
Fiber Volume Content
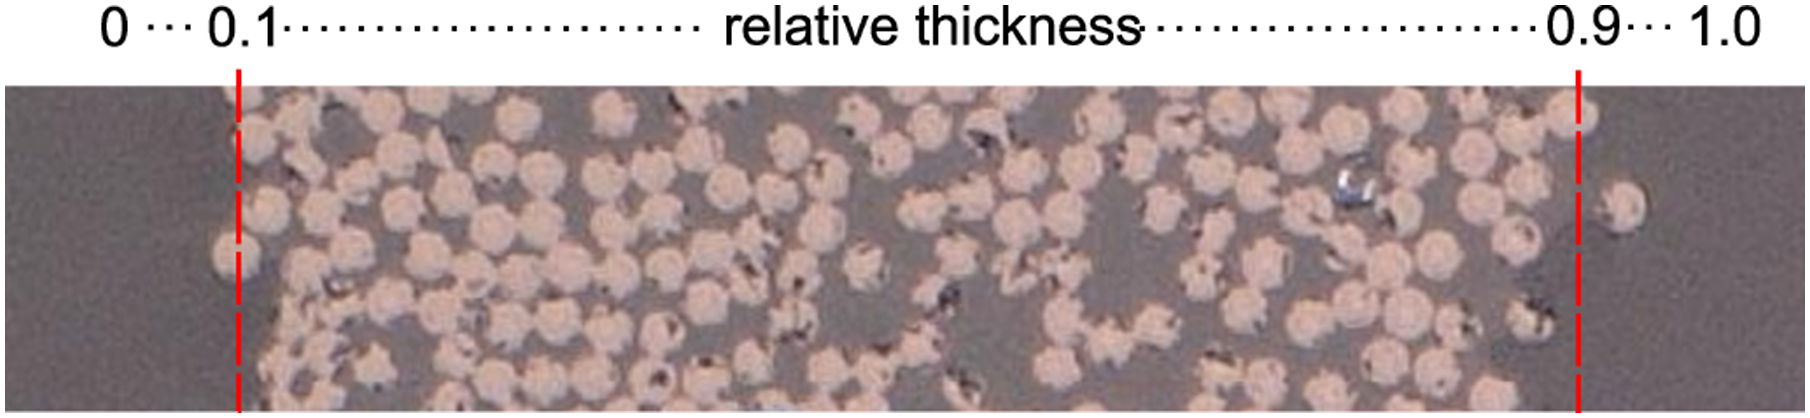
Figure 1 shows the calculated distribution of fiber volume content for the prepreg tapes. Because of the fluctuation in tape thickness, the resulting data was normalized to the relative thickness. This diagram provides useful information for the assessment of tape quality, most importantly the ratio of fiber to matrix at the tape surface. For both sides (surfaces) of the prepreg tape, the fiber content increases over the nominal content of 60 %, resulting in less resin at the tape surface. As previously discussed, such a distribution can be considered unfavorable for AFP applications. As Figure 2 suggests, the actual fiber content distribution is only valid in the range of 0.1 − 0.9 of the relative thickness, which is a side effect of the separation of the actual tape from the mounting material. The absolute values for this material are consistent with the expected nominal fiber volume fraction. It is therfore assumed, that the proposed methodology is applicable and not critically affected by the inherent flaws of polished specimens. The total mean value in the diagram is slightly below the nominal value. This is due to tape thickness variation and the associated difficult automated detection of the upper and lower tape surface. The bent mean distribution on the right side is due to uneven tape widths and crooked surfaces, leading to different lenghts of the graphs. Fiber volume content distribution for the prepreg tape as a function of thickness. Showcase crossectional image of the prepreg tape.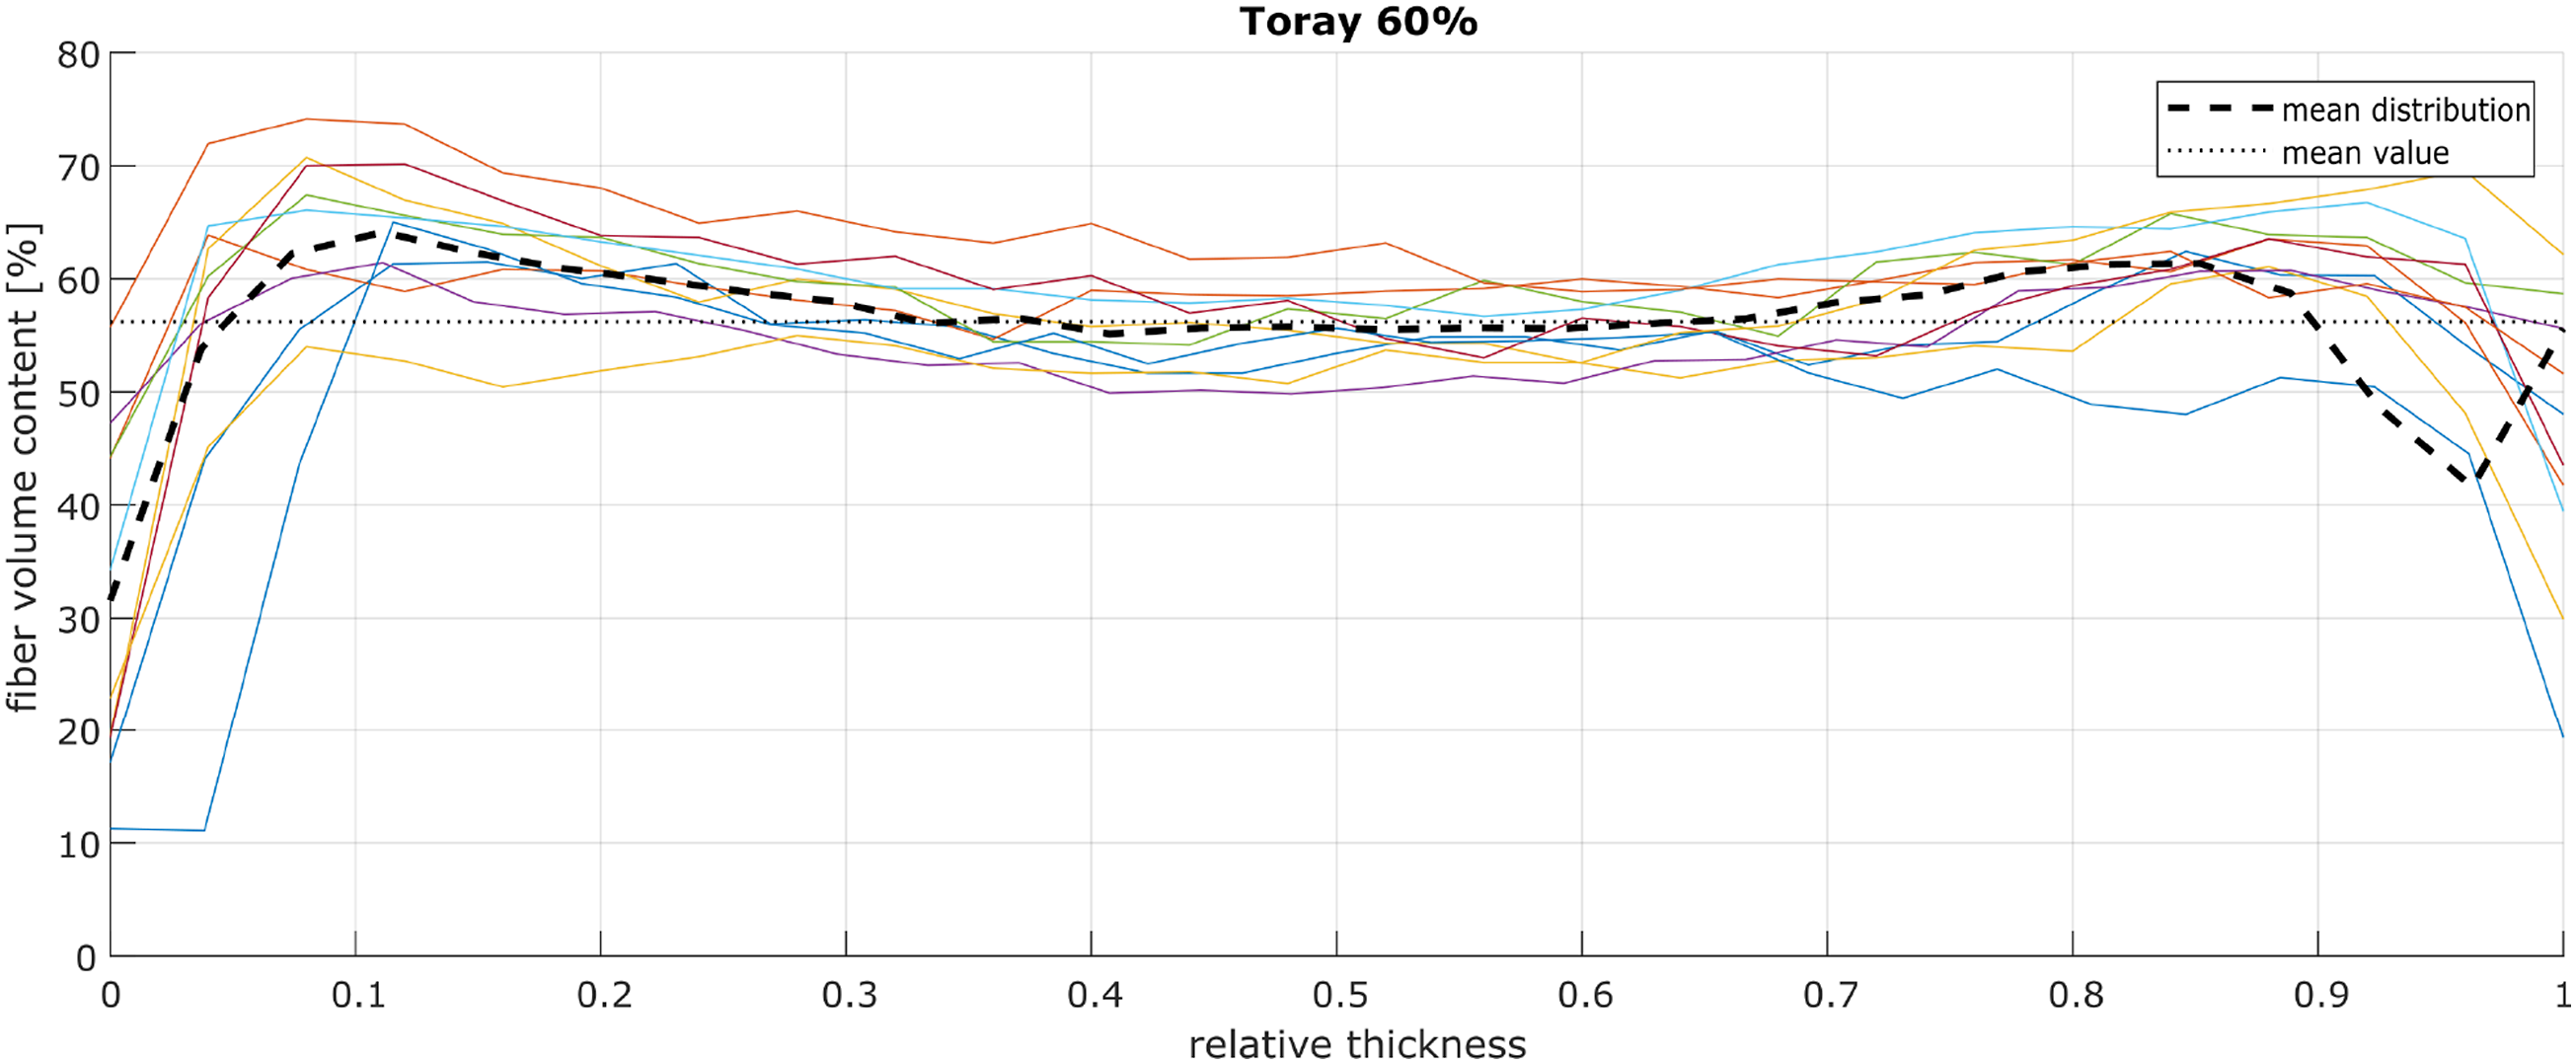
Porosity
The porosity and standard deviation for the Toray tape and laminates, as measured by CT and micrographs, are shown in Figure 3. The surface roughness of the tape was measured at Rz = 12.9 μm. Using the method described in this work, the prepreg material was observed to exhibit significant porosity in the order of 2 %. It should however be noted that the deviation of this value was also significant, reaching as high as 4 % and as low as 0.6 %. This deviation is due to a combination of artifacts in the micrographs. Fiber breakage is being assimilated into the porosity estimate, as well as local variations of porosity and fiber distribution in the tape itself. A micrograph exhibiting optimal tape quality was provided by the material supplier for this study and evaluated using the same analysis setup exhibiting a porosity of 0.5 %. However, given the good agreement between micrograph- and CT-determined porosity in Figure 3, the values presented within this work are considered valid for the purpose of verifying the chosen method. Using the same method, the Suprem 55 % prepreg tape porosity was estimated at 1.72 %. Porosity values for the investigated process steps for the Toray material.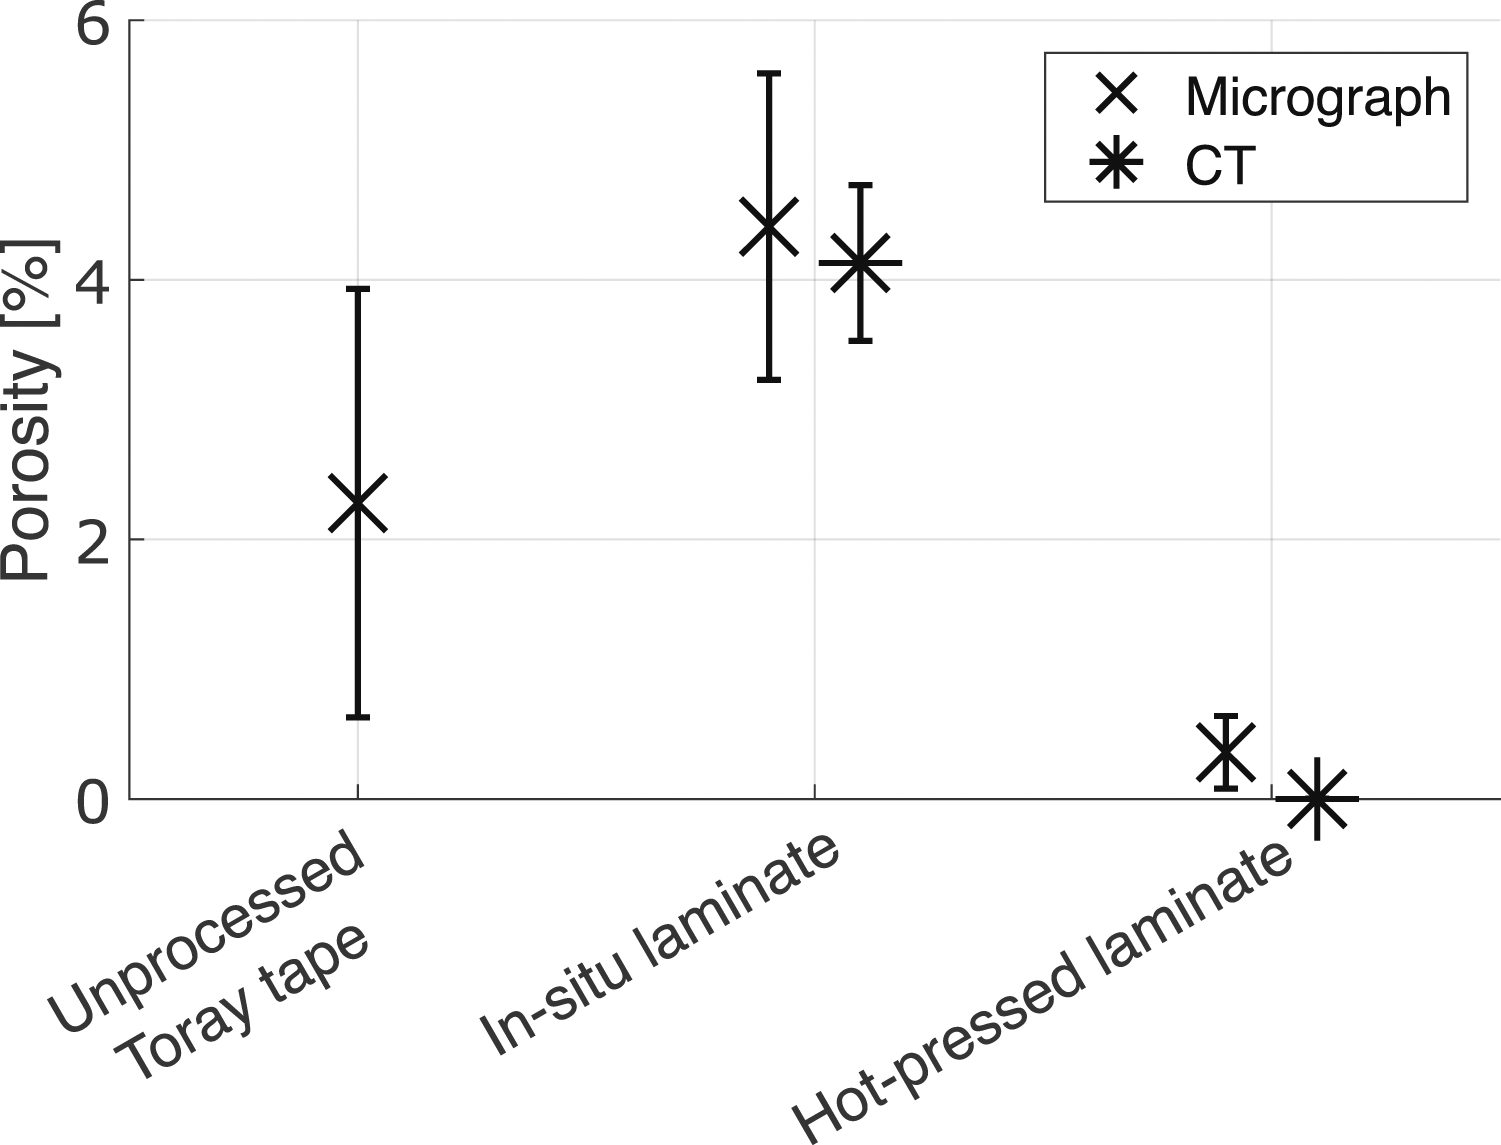
As the Toray material shows, the prepreg contains a significant initial void content, which is subsequently doubled in the in-situ laminate. As previous investigations have shown that AFP processing has a negligible influence on the inner porosity of the prepreg material, this increase in total porosity can be linked to interlaminar porosity due to suboptimal bonding in the in-situ AFP process. This correlates well with the previous observations of a high fiber volume content close to the tape surface. By hot pressing the laminate, porosity is reduced to almost zero. In general, micrographs produce slightly increased porosity values with significantly increased deviation. This is mostly due to artefacts and fiber breakouts, occuring during the grinding process of the specimens.
Ultrasound Quantification
For each sample the ultrasonic attenuation coefficient was, when possible, determined from the ratio of two backwall echos, and in all cases from the ratio of front-to backwall echo. The porosity was determined via micrographs. While CT-scans have proven to be more accurate in the estimation, micrographs were chosen for the simplicity in combination with the established sufficient accuracy. Figure 4 shows a linear fit for the correlation of attenuation coefficient and porosity. A significant deviation was observed between QI and UD laminates. Because of this limited data, the nominal fiber volume content appears to have a negligible impact on the correlation. Similarly, the number of tapes placed in parallel shows no significant effect on the correlation. The assumption of a linear correlation can however be confirmed with respect to the layup design. Correlation of ultrasonic attenuation coefficient and porosity.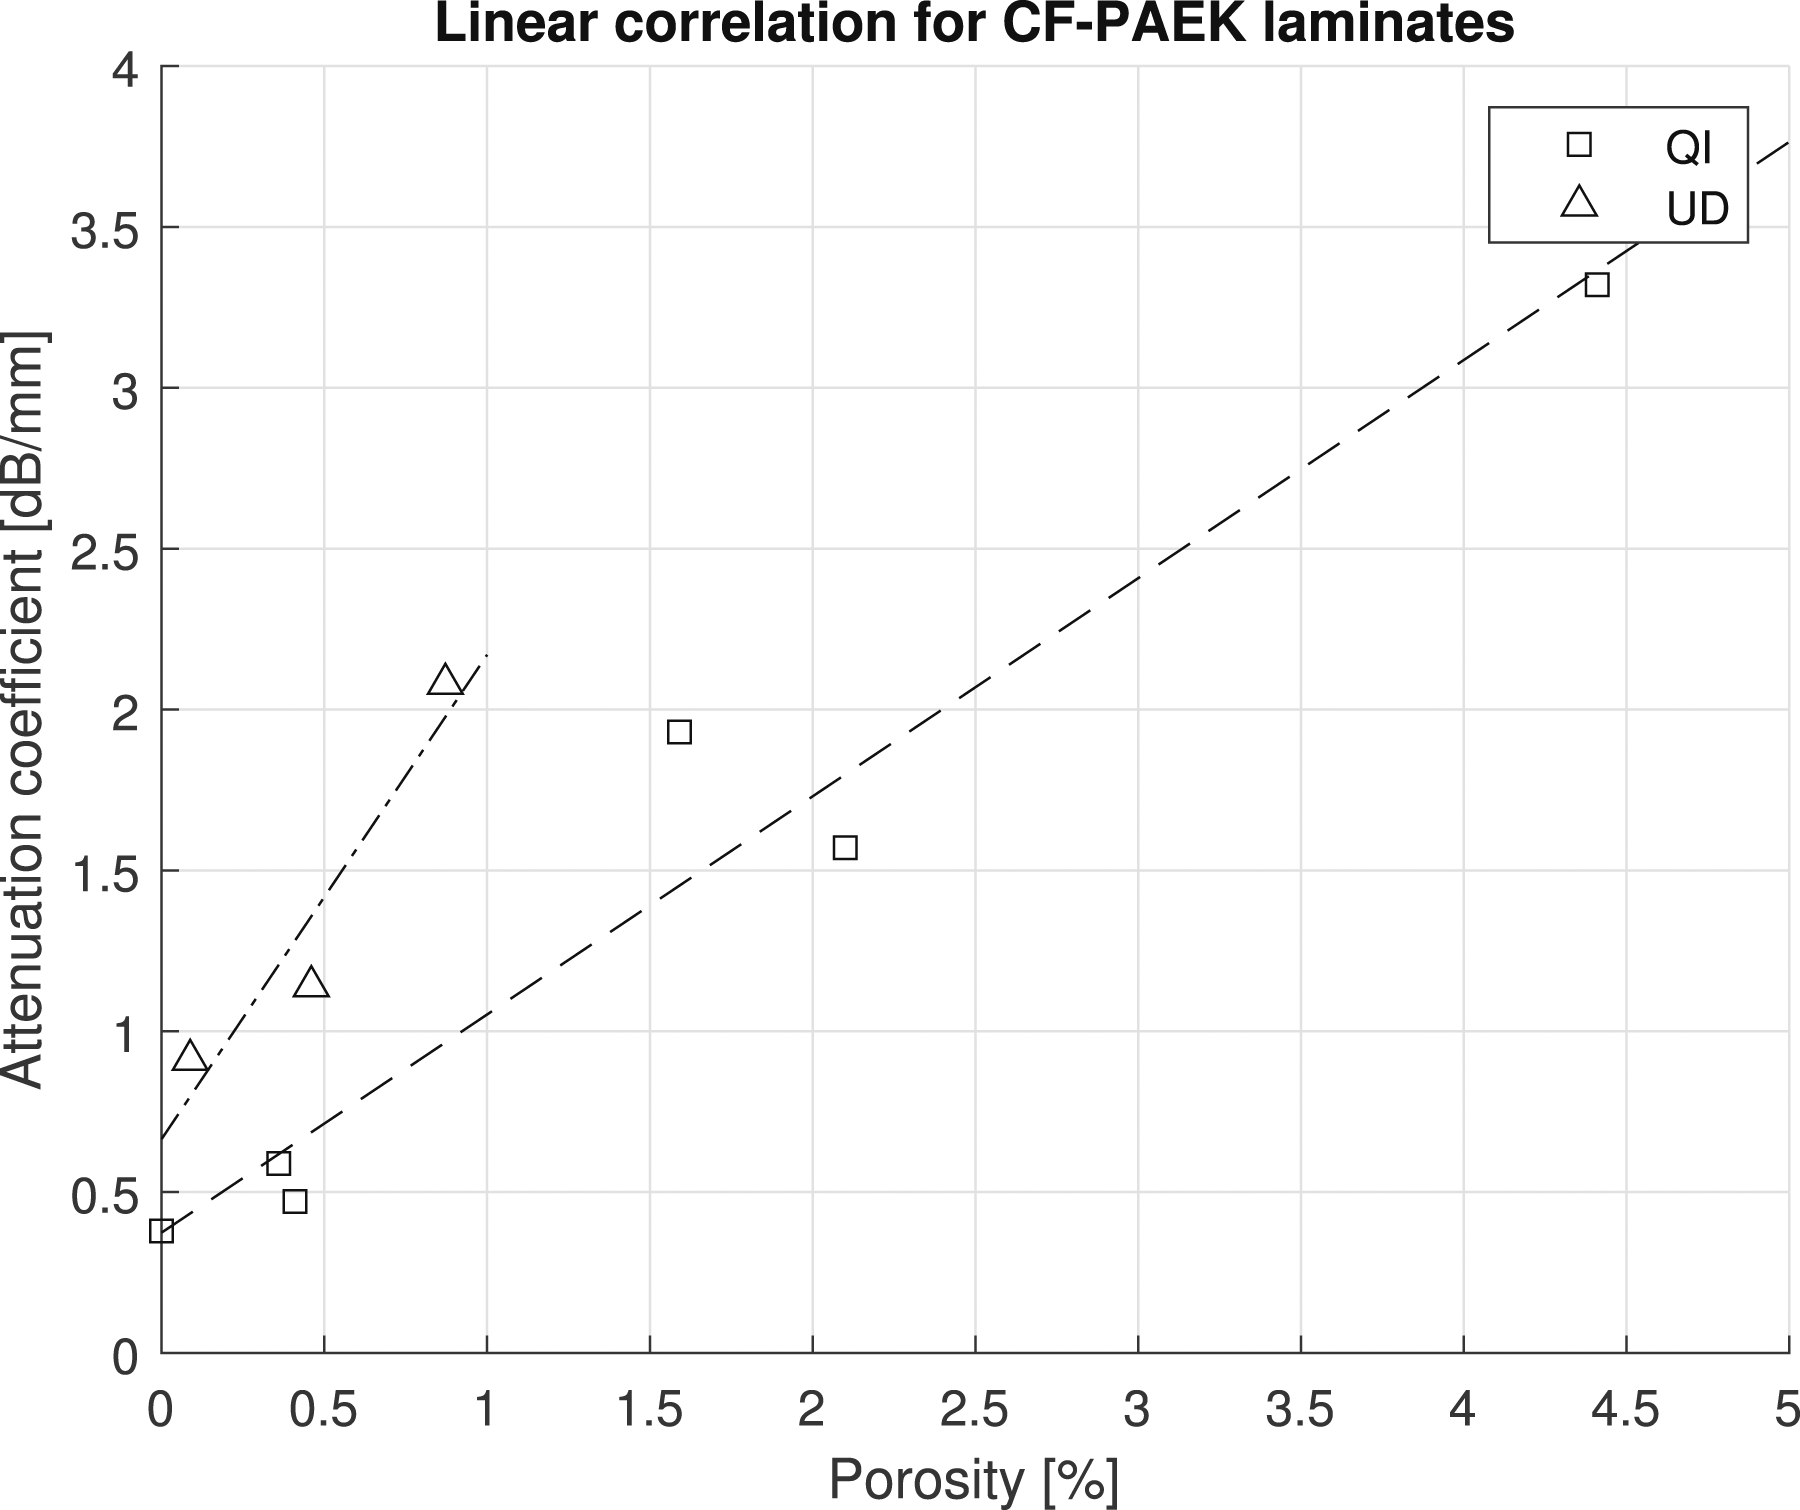
From the samples that showed two backwall echos, the experimental correction values were calculated and are shown in Figure 5. The theoretical correction value was calculated as proposed with acoustic impedances from
37
resulting in Acor. = 5.2 dB. Experimental and theoretical correction factors.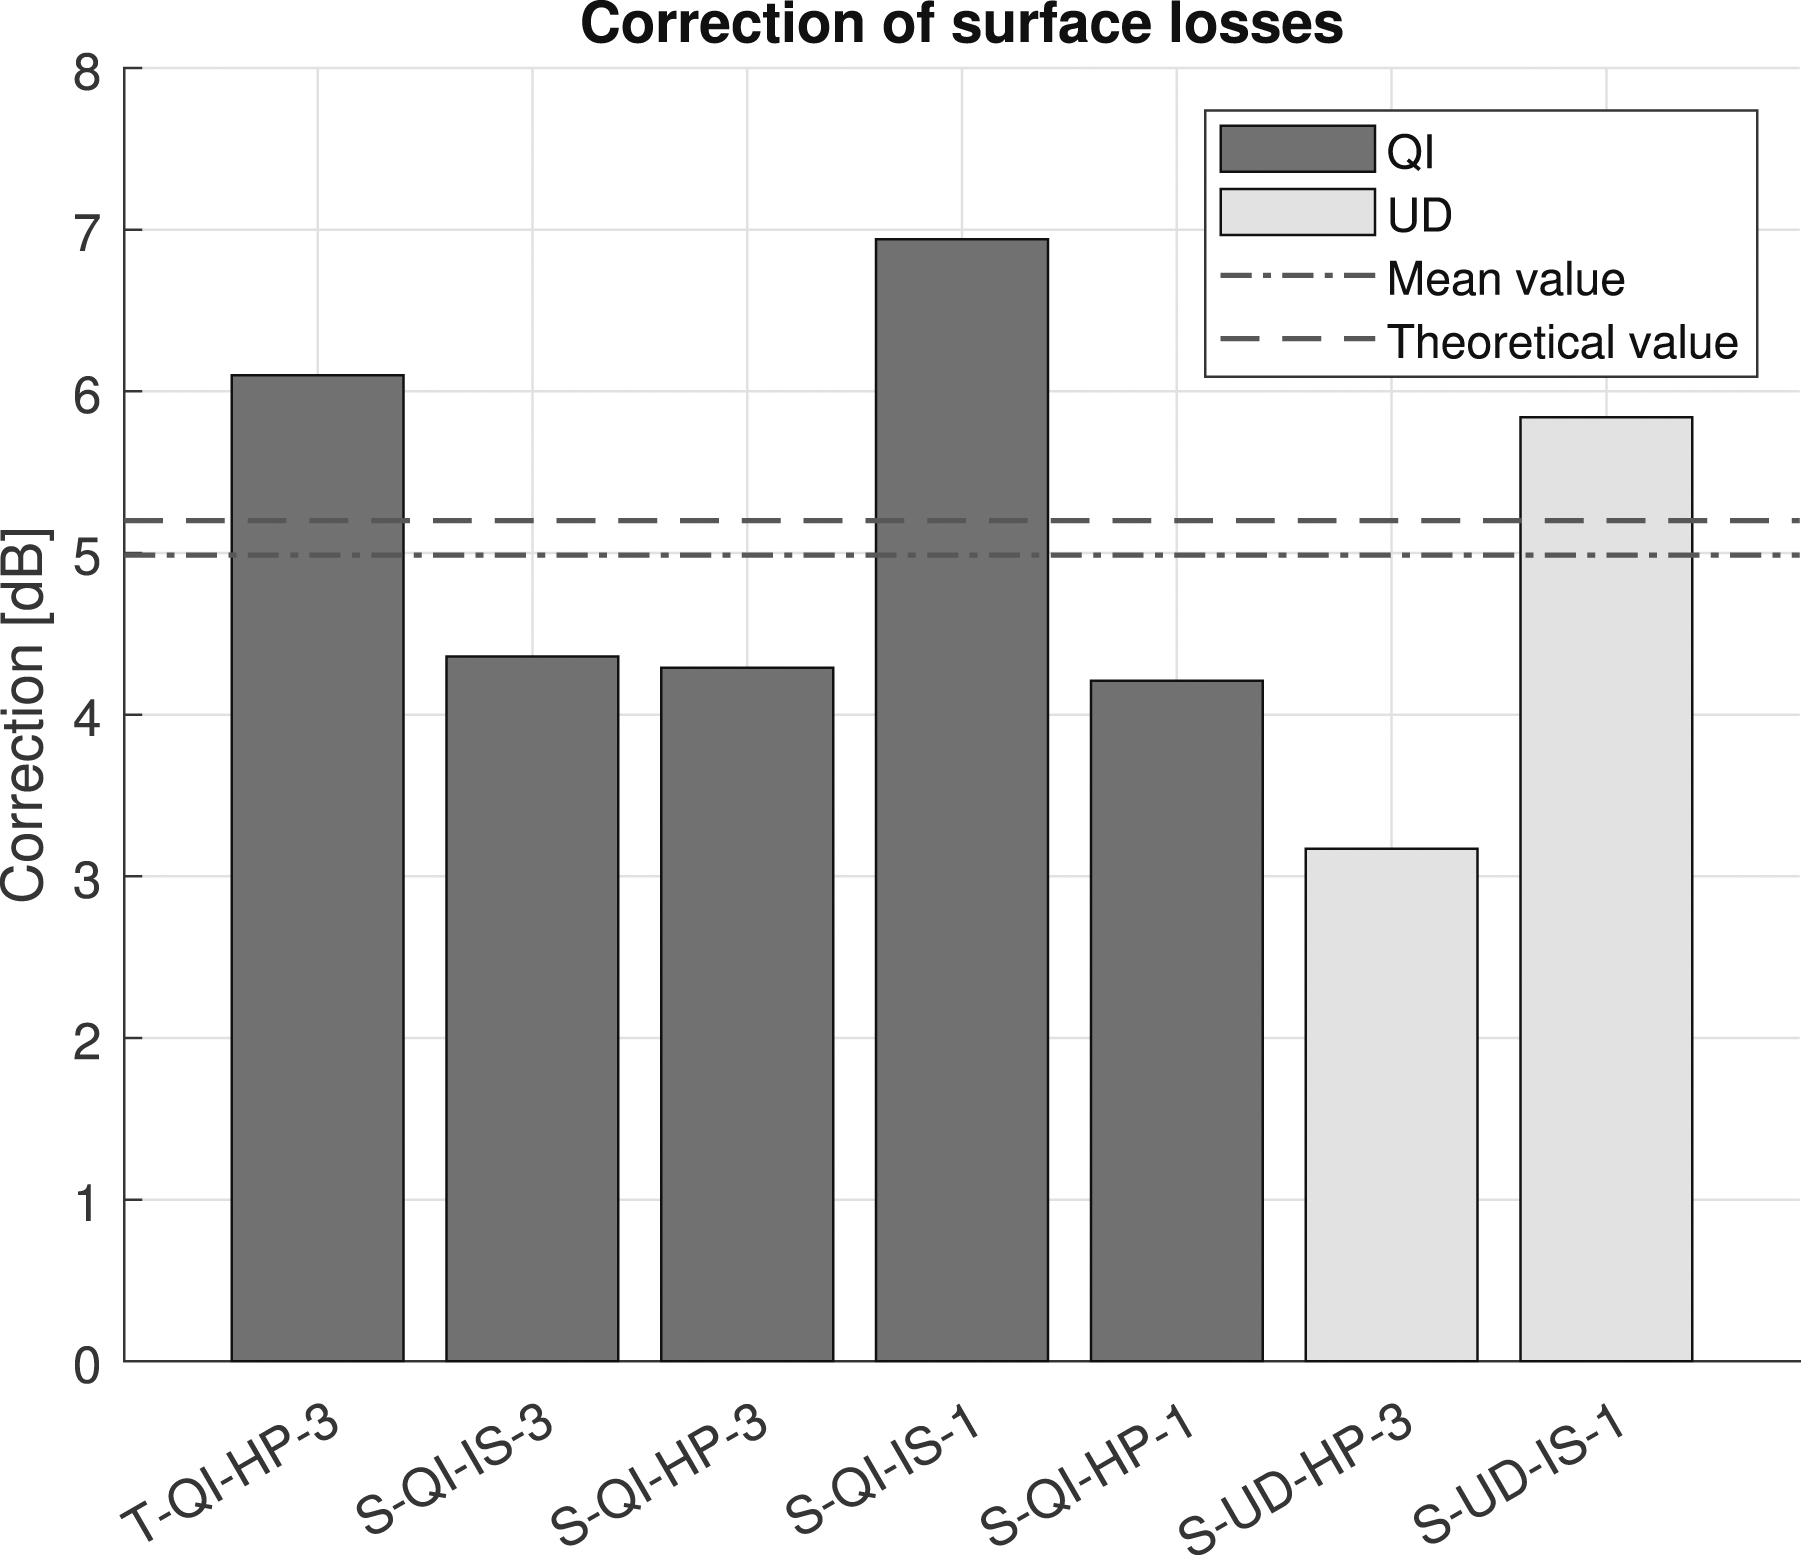
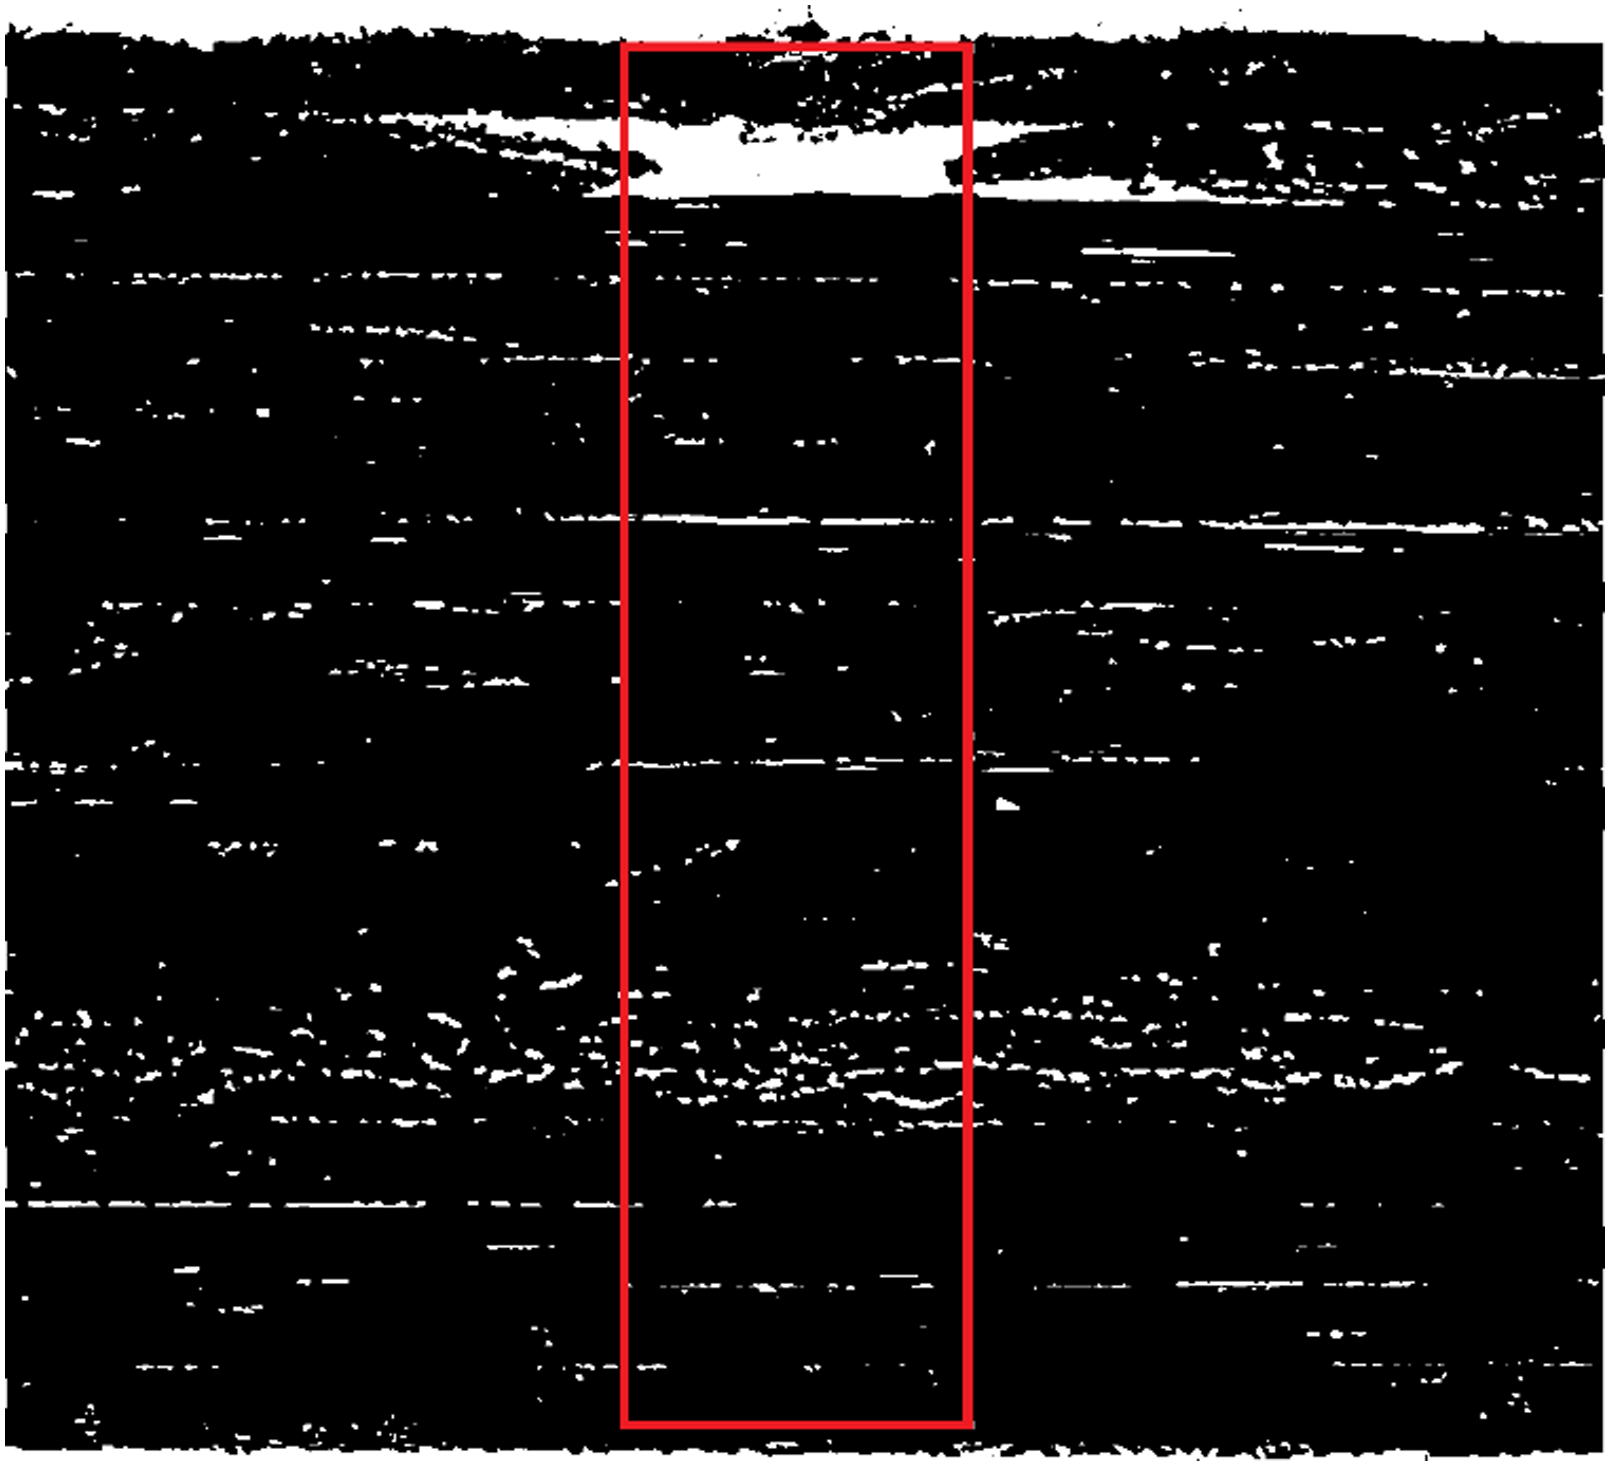
The assumed linear correlation between porosity and ultrasonic attenuation coefficient was applied to the ultrasonic scan of the in-situ laminate T-QI-IS-3, resulting in the C-scan image of the porosity in Figure 6. Line-type structures of high porosity values of 7-8 % are visible along the tape edges in all directions, originating from gaps and overlaps between adjacent tracks. The image portrays clear information about the position and local magnitude of pores throughout the laminate. The areas appearing as 0 % porosity in the image are undetermined due to missing or overamplified ultrasound signals. In order to estimate the error resulting from the assumed correlation, a representative gap in the laminate was recorded via CT-scan (Figure 7). The porosity at the isolated gap was measured at 7.5 %. It can thus be concluded that the correlation is in fact applicable. Porosity C-scan by ultrasound correlation for T-QI-IS-3. CT-scan of gap with isolated area in T-QI-IS-3. (a) T-QI-IS-3. (b) T-QI-HP-3. (c) S-QI-IS-3. (d) S-UD-IS-1.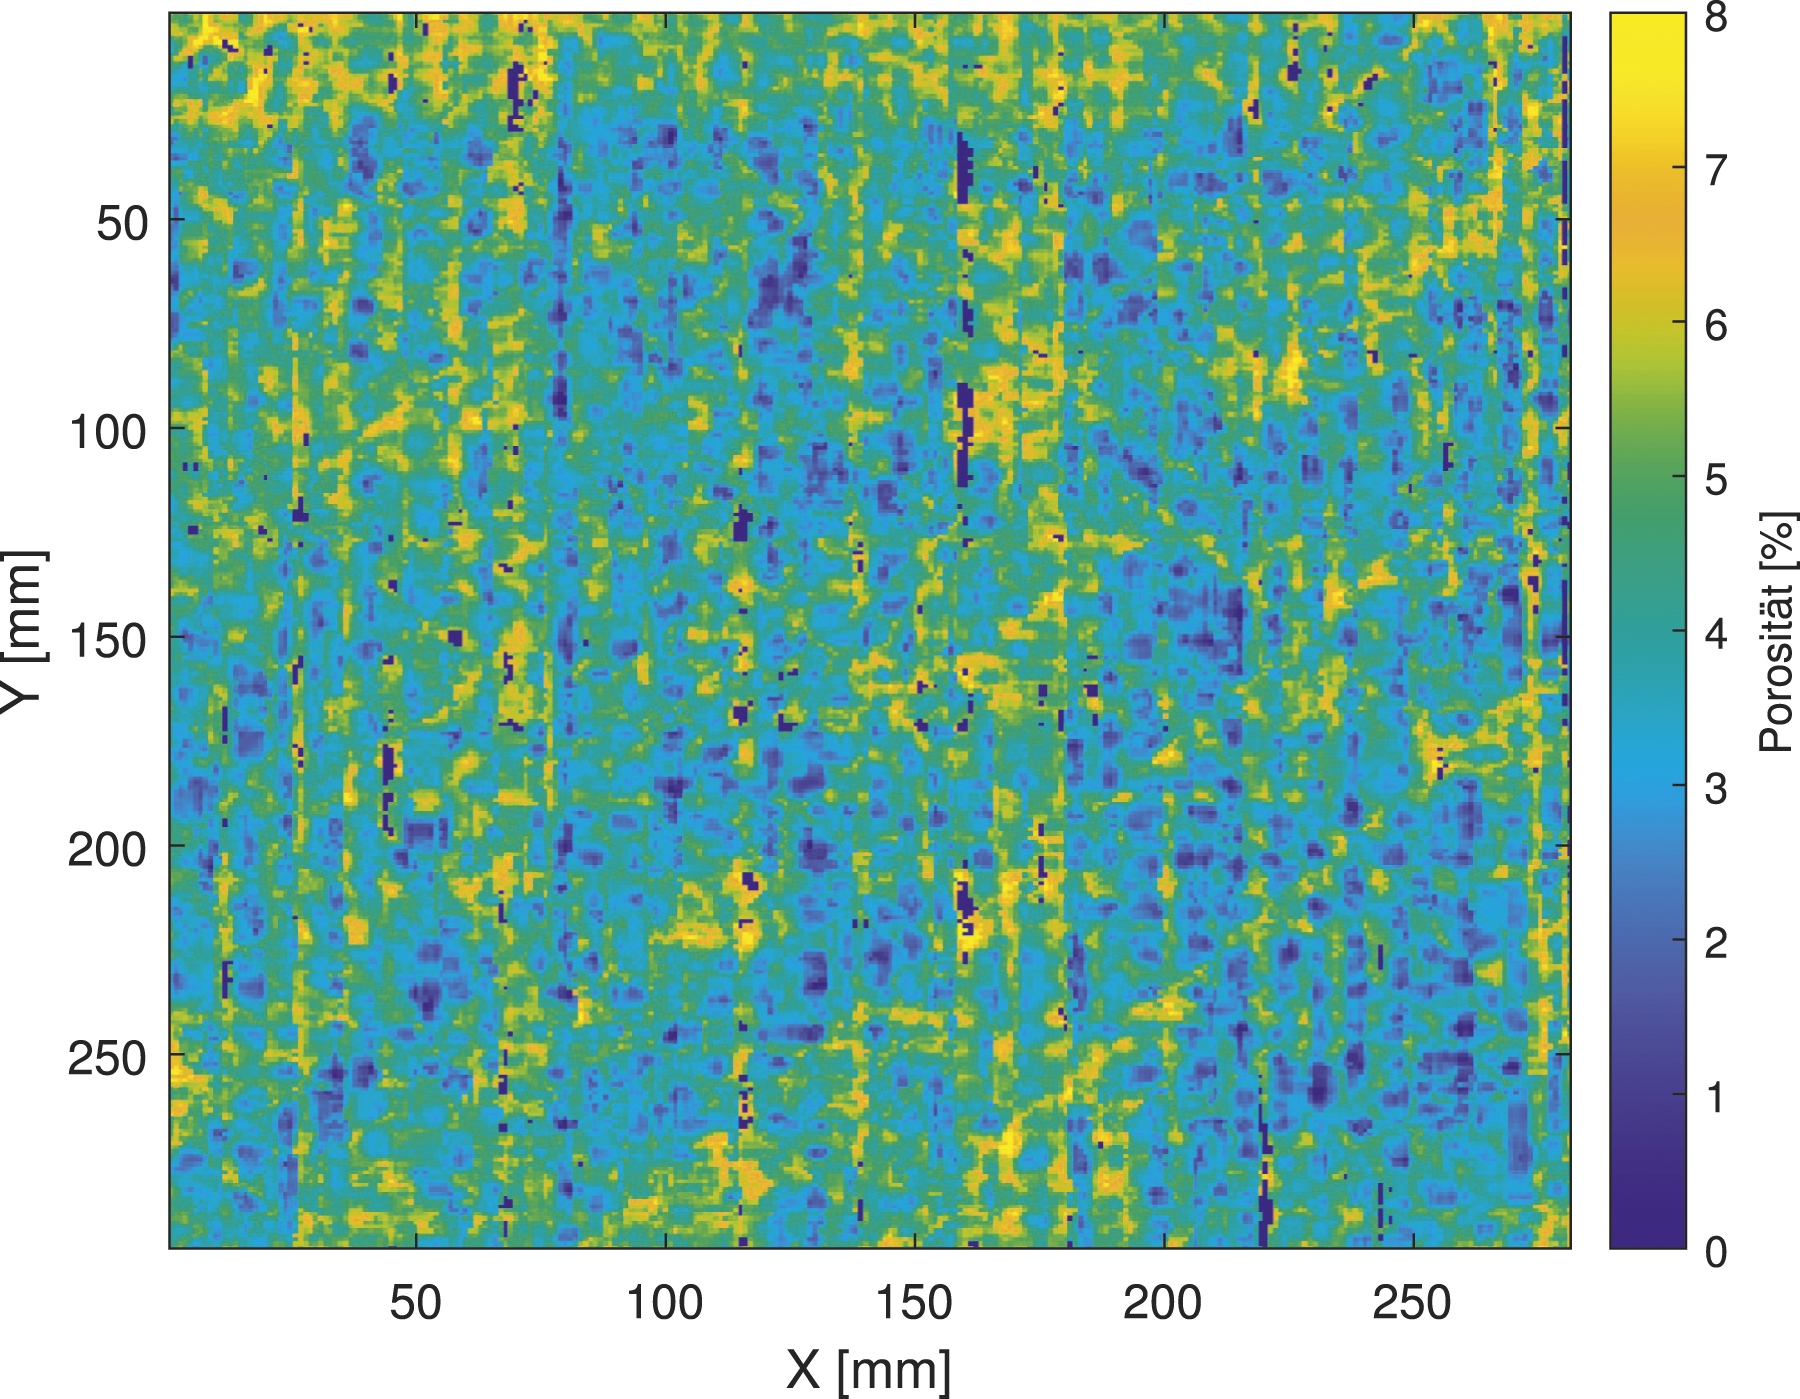
Following this promising outcome, testing was expanded to multiple laminate samples of different designs. Figure 8(b) shows the same laminate as Figure 8(a) but with hot-pressed post-consolidation (T-QI-HP-3). The image shows large areas with porosity values of zero. Locally, areas of approximately 1 % porosity exist along the scan axis (horizontal axis), indicating an uneven scan- or coupling quality. Inconsistent coupling or echo reflection quality show a significant influence on the quantitative results and need to be taken into consideration for the interpretation of the calculated values. Porosity C-scans by ultrasound correlation. (a) T-QI-IS-3. (b) T-QI-HP-3. (c) S-QI-IS-3. (d) S-UD-IS-1.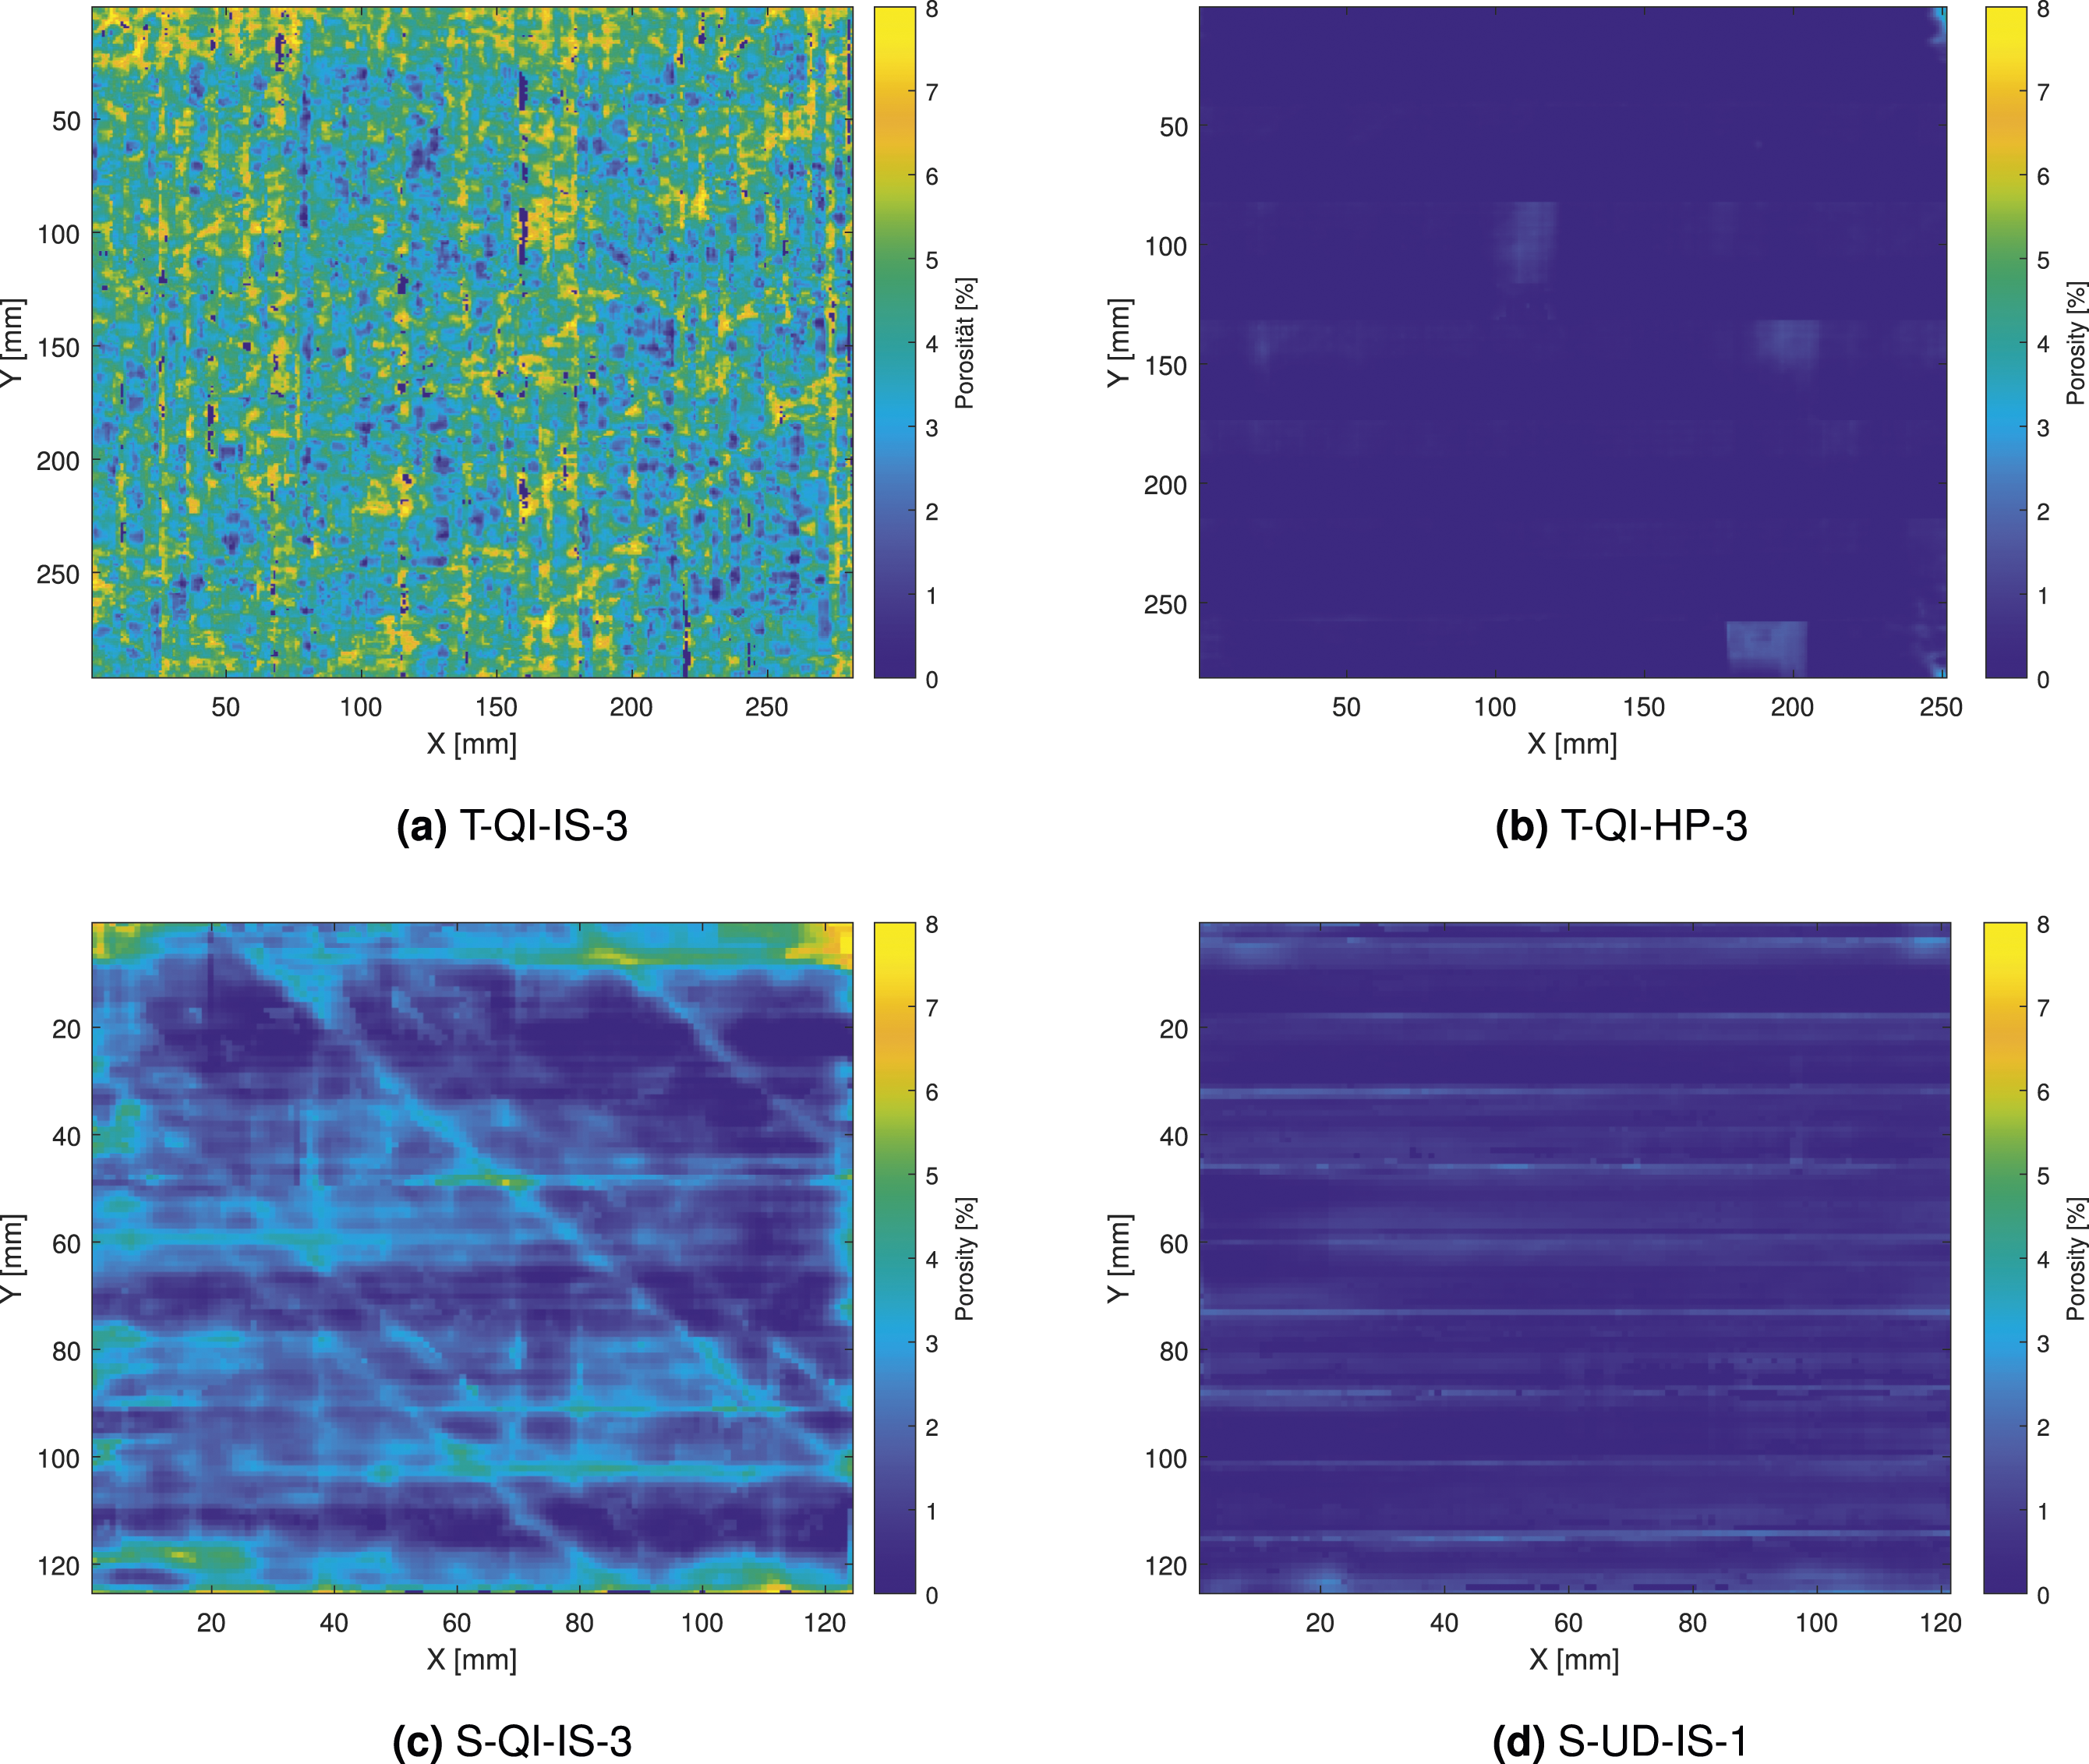
The Figure 8(c) and (d) show the in-situ laminate S-QI-IS-3 and S-UD-IS-1 manufactured from Suprem prepreg tape material with a QI and UD layup respectively. The QI laminate shows similar characteristics as the in-situ Toray laminate, however with a considerably lower overall porosity. This is partially due to the generally lower prepreg porosities and material properties suitable for in-situ manufacturing. The UD laminate however shows characteristics similar to the hot-pressed Toray laminate likely resulting from uneven scanning results. It is likely, that scanning-induced errors such as these are more prominent in laminates with overall low porosities such as hot-pressed or unidirectional laminates.
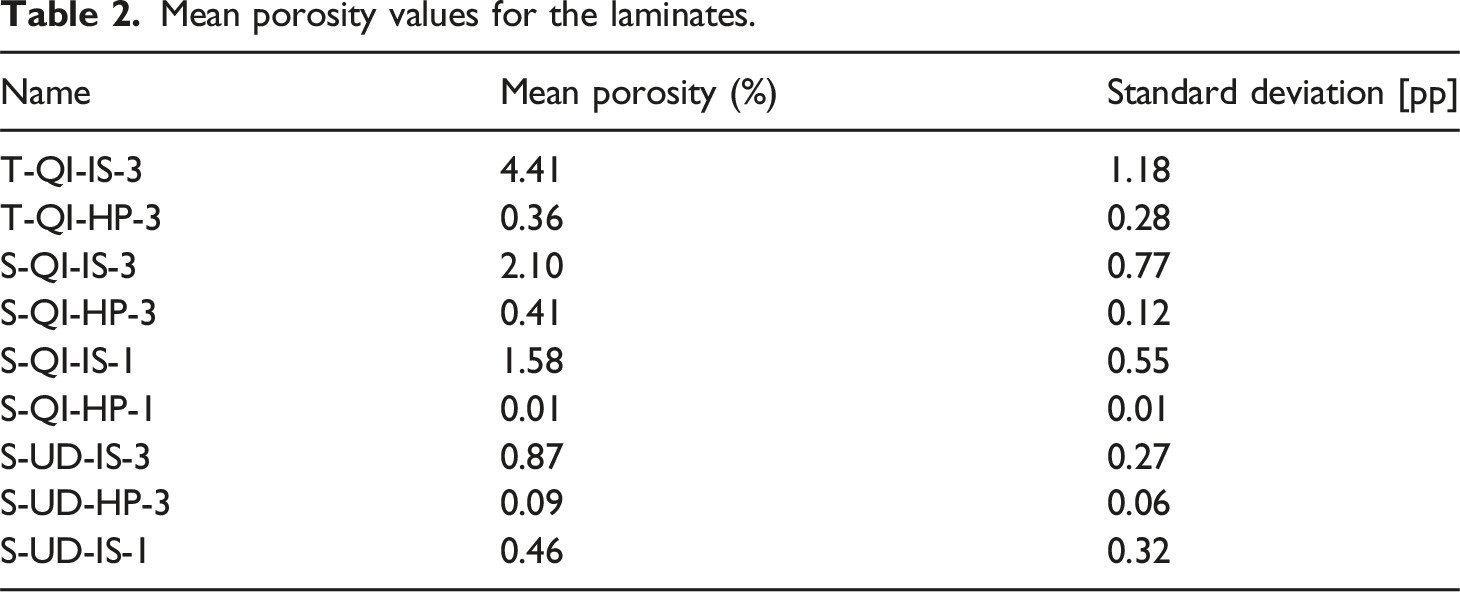
Figure 9 shows the histograms of the calculated porosity distributions and the mean porosity values for the previously shown C-Scans. In some areas, negative porosity values were calculated for the laminates T-QI-HP-3, S-QI-IS-3 and S-UD-IS-1. This is due to process-induces variations in the ultrasound signal strength in combination with the overall very low porosity values. Within the proposed method, results such as these are inevitable due to the nature of the mean value correlation approach. It is however deemed accetable for the estimation due to the low impact on the results. Histograms of the porosity C-scans by ultrasound correlation.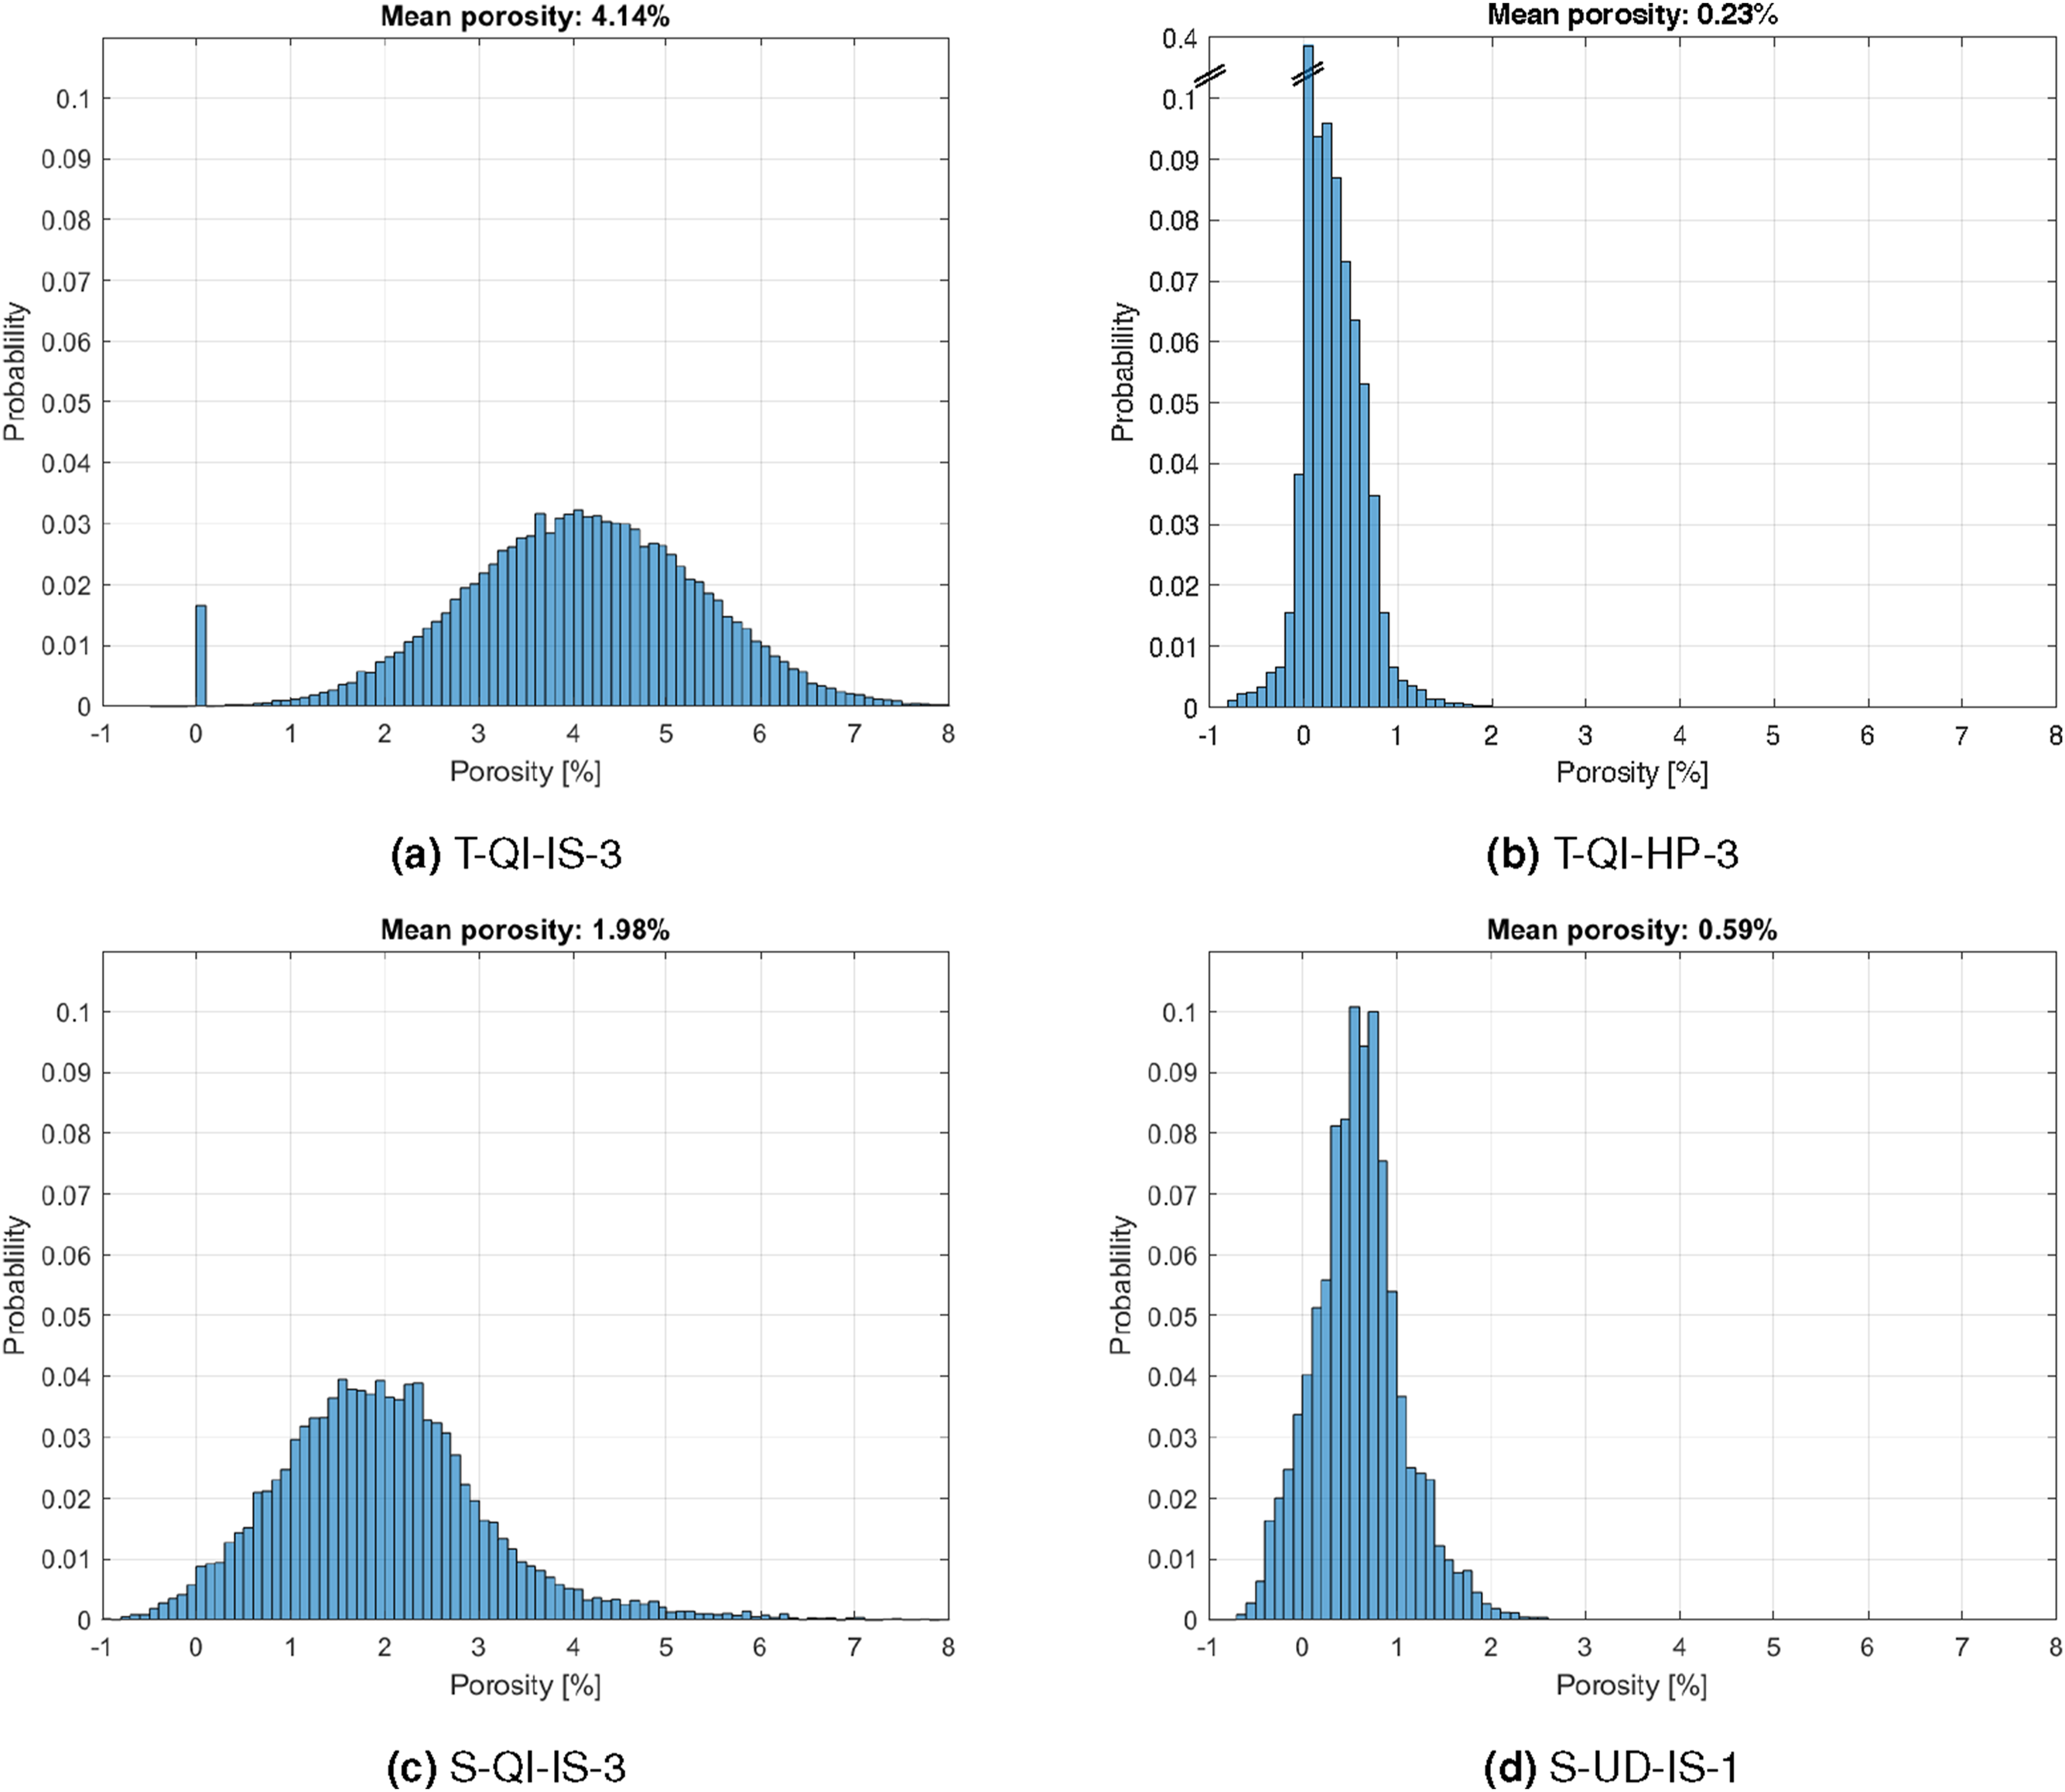
Mean porosity values for the laminates.
Evaluation
To be considered suitable for AFP processing with the objective of high quality in-situ consolidation, a prepreg tape must comply with specific quality criteria that may be partially determined using the proposed methodology. Firstly, a suitable prepreg tape should contain a void content that is as low as possible. The experimental results in this work suggest, that such pores remain as intralaminar porosity in the laminate, supporting similar conclusions in the literature. The fiber volume content should be evenly distributed over the cross section and slightly decrease towards a matrix-rich surface. The surface should show no dry fibers and low roughness.
The quantitative ultrasonic C-scan presented in this work shows great similarity to conventional qualitative C-scans, especially in terms of position and magnitude of defects and porosity. As a novel component, it allows a limited projection of pores into the laminate thickness by providing a local and global porosity value. It can thus be considered a 2.5-dimensional analysis method. Furthermore, this methodology promises porosity analysis via a single non-destructive test, and would therefore be in many ways benificial to both R&D and commercial applications. The major advantage of the proposed method is that no calibration sample is required. This entails significant simplifications for the process. In order to use the full potential, it will be necessary to obtain further information on the correlation between porosity and attenuation coefficient, as well as the origin and determination of ultrasonic front wall losses is required. The proposed approach delivers promising results, albeit at this point still with some deviations. Potential causes of errors may contain among others the surface quality, e.g. roughness, waviness, and therefore thickness of couplant layer, as well as the fiber volume fraction. A direct disadvantage of this technique is that foreign material in the laminate may be mistaken for porosity.
Conclusion
In this paper, a new method for the quantification of porosity via ultrasonic scans is applied to AFP laminates, promising good results. The correlation between porosity and ultrasonic attenuation coefficient was determined for thermoplastic CFRP laminates with quasi-isotropic and unidirectional layup resulting in significantly different linear characteristics. The authors suggest a novel quantitative method for the analysis of prepreg tapes with regards to their suitability for the in-situ AFP. By calculating a fiber content distribution from micrographs, providing quantifiable characteristics for high quality in-situ AFP. A general methodology is presented for the determination of material characteristics, relevant to the in-situ AFP process. Tape porosity is identified as a major influence on intralaminar porosity. The impact of post-AFP consolidation was analyzed in terms of porosity.
Further investigation will be necessary for more reliable results and eventual commercial applications. In the near future, analysis of different prepreg tapes will be published providing further insight into the relation of fiber volume content distributions and in-situ AFP consolidation quality.
Footnotes
Declaration of conflicting interests
The author(s) declared no potential conflicts of interest with respect to the research, authorship, and/or publication of this article.
Funding
The author(s) disclosed receipt of the following financial support for the research, authorship, and/or publication of this article: The results presented here were achieved within the TB-Rumpf research project (FKZ: 20W1721D) in the framework of the Federal Aviation Research Programme V-3, funded by the Federal Ministry for Economic Affairs and Climate Action, on the basis of a decision by the German Bundestag.