
Abstract
Out-of-plane mechanical properties play a significant role in the sizing of fibre-reinforced plastic (FRP) hydrogen tanks, where delaminations and crack propagation represent critical risks, particularly under cryogenic temperatures. A high delamination resistance is required to prevent spontaneous hydrogen permeation and leakage issues occurring in FRP hydrogen tanks. This paper presents an experimental investigation of the interlaminar properties of carbon fibre reinforced low-melt poly(aryletherketone) (CF/LM-PAEK) samples manufactured with the in-situ Automated Fibre Placement (AFP) technique. In manufacturing, the number of simultaneously deposited prepreg tapes is varied to determine its influence on the interlaminar shear properties. A five-point bending fixture (also known as double beam shear - DBS - test method) is integrated in a temperature chamber and tests are performed at temperatures between −40°C and 80°C. Using digital image correlation, the complete interlaminar shear stress versus shear strain curves and the strain at first delamination are measured. The results show a clear drop of the interlaminar shear modulus and shear strength at increasing temperature, while the strain at initiation of the delamination remains almost constant. The homogeneity and quality of the samples are also shown to be both influenced by the number of simultaneous tapes and strongly influence the measurements in DBS test.
Keywords
Introduction
Hydrogen, either as a combustible or as an electricity generator, is a popular candidate for the large-scale decarbonization of transportation industries. While the cost-effective production and the transportation infrastructure for large quantities of hydrogen remain logistical challenges, other technical challenges such as the need to increase storage efficiency for automotive and aviation applications are also of key importance. High-pressure hydrogen tanks are already widespread and commercially available. However, they are up to now almost exclusively manufactured with thermoset materials and using winding techniques. While this combination is widely available, it is still not optimal because wound composite vessels suffer from extensive local thickening that adds unnecessary weight and reduces the storage efficiency or gravimetric capacity of the tank. A modern alternative to winding, Automated Fibre Placement (AFP) can create load-optimized tanks with a non-geodesic path 1 and almost uniform wall thickness. 2 Using AFP, bending-reduced or bending-free pressure vessels have been manufactured in the recent years, significantly increasing the load bearing capability at the dome/cylinder interface.3,4 Thermoplastic materials are also of great interest for modern tank structures thanks to their highly desirable toughness properties and resulting cohesive joining options through thermoplastic welding. While thermoplastic AFP tanks have the potential to significantly improve the efficiency of modern hydrogen storage systems in transport applications, two significant changes to the status quo still require thorough and reliable data on how the new manufacturing approach and the new material perform. As hydrogen may be stored in a highly pressurised (high pressure at intermediate temperature) or cryogenic (low pressure at low temperature) form within composite vessels, the interaction between the material behaviour and the temperature above and below room temperature have to be investigated. Furthermore, as delamination is a common failure mechanism in composite structures, the interlaminar shear strength (ILSS) should be further studied to quantify the performance of new materials and manufacturing techniques.
Temperature effects in hydrogen tanks
The present study focuses on effects occurring in high pressure tanks for the storage of hydrogen in gaseous form. In this type of storage system, the filling and particularly the fast filling of the hydrogen at increased flow rates induces a temperature increase due to gas compaction and kinetic energy transfer. This effect increases in turn the temperature of the surrounding composite material. In fast filling processes, Li et al. predicted that the temperature rise in high pressure tanks was dependent on both the pressure difference (start and end pressure) and on the peak pressure during the fill cycle. 5 Temperatures up to 150°C have been predicted by the authors for 100 MPa tanks. To limit the impact of increased temperatures on the mechanical properties of the tank material and consequently on its leakage behaviour, regulations have set the temperature range during the tank lifecycle in a domain from −40°C to 85°C. 6 As temperature predominantly affects the polymer matrix rather than the fibres, understanding the relationship between the temperature and the mechanical properties, namely transverse properties and interlaminar properties, could help improving the structural sizing and lightweight design of pressure tanks.
ILSS measurement and temperature dependency of composite materials
Investigations have shown that ILSS strongly influences the energy absorption capability of composites under crushing or impact loadings, in turn changing the failure modes of the material.7,8 It is therefore a good quantifier of material performance and tank integrity. Several works in literature developed test methodologies for ILSS measurement and investigated the temperature-dependent delamination behaviour of composites materials. Hron et al. studied poly(p-phenylene sulfide) (PPS) composites with T300 5HS carbon layers and a quasi-isotropic layup on curved beam strength samples and using different test norms ASTM D6415 and AITM 1-0069.9,10 The choice of the norm and of the distance between the rollers had a non-neglectable impact of about 15% on the measured properties. In the range between −55°C and +80°C, a decrease of ILSS by 12% and an increase by 5% has been observed by the authors. 11 The use of poly(aryletherketone) (PAEK) resin led to higher ILSS values than for polyetheretherketone (PEEK) and PPS resins. 12 Similar observations were made on glass-fibre-reinforced polyester materials and on PPS resin based on short beam shear specimens.13,14 Franco et al. observed the beneficial effect of moisture saturation on the ILSS above the water freezing temperature due to a possible relaxation of residual stresses. The authors noted the presence of compression failure under the load introduction point in the Short Beam Shear (SBS) specimen. Barile et al. investigated plain weave carbon-fibre-reinforced epoxy systems close to their glass transition temperature of 140°C. In this temperature region, a variation of the temperature from 100°C to 120°C did not lead to any decrease of the ILSS but additional fibre failure was observed at higher temperature. 15 The influence of temperature on the mode I interlaminar properties was investigated by Cao et al. on T300/7901 unidirectional prepreg samples. 16 The material shown a strong temperature sensitivity in the investigated range of −20°C to 110°C, mainly explained by an increased ductility of the resin material and a shift of the failure from fibre/matrix debonding to matrix cleavage.
The SBS test was found not to be reliable by Fan et al. for the characterization of epoxy composites enhanced with nanotubes as several failure modes were involved in the specimen failure (compression, indentation, flexure and shear). 17 The authors used compression shear testing to minimize unwanted failure modes and create a uniform shear region in the sample. Independently of temperature effects, Cognar et al. and Guseinov et al. implemented the Arcan fixture on samples adapted from in-plane shear standards 18 to generate a uniform shear stress distribution between the notches of the specimen under mixed-mode loading.19,20 Increasing the loading angle and therefore the amount of compression loading were found to consequently increase the ILSS values from 60 MPa at an angle of 20° to 110 MPa under 45° loading. Murakami et al. developed and optimized the geometry of a double-notch specimen to measure the ILSS of TR50S carbon fibre laminate by use of Digital Image Correlation (DIC). 21 With this technique the elastic modulus and complete stress versus strain curves were measured and correlated to finite element simulations. The effort-demanding manufacturing of the specimen have been proven valuable by the authors to precisely measure interlaminar properties of mainly unidirectional and low-crimp laminates. Li et al. implemented similar test procedure for the measurement of ILSS and shear modulus of 3D orthogonal woven composites with epoxy resin systems. 22 Agreeing with Raps et al., Van-Tho et al. depicted the beneficial effect of consolidation with vacuum bag or with hot pressing on the ILSS compared to in situ AFP CF/PEEK plates. 23 An increase of respectively 260% and 360% were observed in three-point bending test based on ASTM D2344. 24
Novelty
This paper focuses on determining the temperature dependency of the interlayer behaviour of in-situ AFP thermoplastic plates in the range of −40°C to 85°C, which was defined as allowed temperature range by the Society of Automotive Engineers (SAE) standards for high pressure hydrogen tanks. To cope with limitations of the test standards investigated in the mentioned literature (high manufacturing effort, unwanted failure, high scatter), a new simplified approach is suggested to reduce undesired failure modes by loading double beam shear (DBS) samples under five-point bending. On a second level, this work aims at improving a measurement technique based on Digital Image Correlation to evaluate the initiation of delamination within the specimen and follow its propagation until complete failure. Based on previous works at DLR, the methodology is used to correlate the ILSS and the presence of defects induced by manufacturing. Additionally, extensive characterization techniques are documented for the quantification of fibre volume content, pores and gaps in the samples.
Material and method
The present section documents the material investigated in this work, the manufacturing and the processing techniques for the extraction of testing samples. In a second part, the methodology to quantify the fibre volume content, gap content and defect size with help of destructive and non-destructive techniques is described. Finally, this chapter develops on the mechanical characterization under five-point bending and on the full-field strain measurement with DIC.
Materials and manufacturing
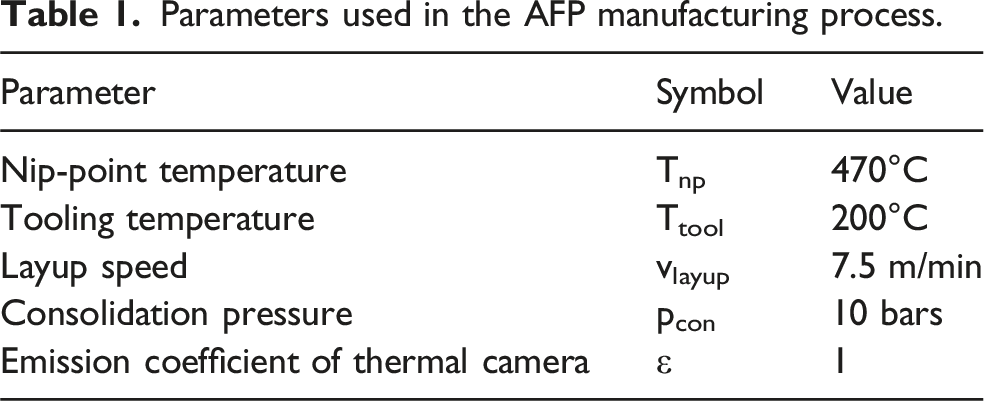
Parameters used in the AFP manufacturing process.
Micrography
Samples for micrography with a width of about 1.5 mm were cut from each plate far from the edges to avoid edge effects from manufacturing and guaranty the representativity of the measurement. The micrograph samples were first embedded in an epoxy resin using cold mounting and cured at room temperature. They were then grinded in steps of increasing fineness and finally polished with Oxide Polishing Suspensions (OPS). The samples were observed at a magnification of 2000x with a VH-ZST dual-objective zoom lens mounted on a Keyence VHX-5000 digital microscope. After image processing and thresholding with the software ImageJ, 25 the single fibres were automatically recognized by detecting the fibre edges, thresholding the image adequately and performing a Hough Cycle Transform on the resulting binary image. The detailed procedure has been documented by Vinot et al. in ref. 26. In a second step, the original image was subdivided in height and width into rectangular subdomains and a grey value analysis was performed to extract information about fibres, resin and voids. Followingly, the data was automatically post-treated using a Python subroutine to extract the local and global fibre volume content as well as the pore content. For fibre detection and pore detection respectively, the grey value between 133 and 255 and between 0 and 1 were filtered. Additionally, the thickness of the ply-to-ply interface in form of a thin matrix-rich band was measured for potential correlation with the ILSS values.
Ultrasonic and 3D scanning
Ultrasonic testing was conducted on the entire laminate plates to assess manufacturing defects such as macroscopic porosities and delaminations. The tests were conducted with an Olympus OmniScan MX2 system and a 5 MHz linear phased-array probe (5L64-NW1). Pulse-echo scanning method was used with manual spray-water coupling between the laminate and the acrylic delay line. During scanning, the laminate was placed on supports to maintain its back side dry. The raw data was analysed using the Omniscan Plotter software. The gates were set to isolate and export the backwall echo for subsequent correlation. The amount of defect in the DBS specimens was finally calculated by extracting the information from the ultrasonic scan at the precise position of each specimen individually. The area of the defect was measured by thresholding the colour images in ImageJ based on a colour threshold in the range of 0–120 for the hue value, 50–255 for the saturation and 199–255 for the brightness value. The calculated defect surface was then divided by the total surface of the sample (see equation (1)).
Equation (1): Calculation of the proportion of defect surface in the samples based on ultrasonic scans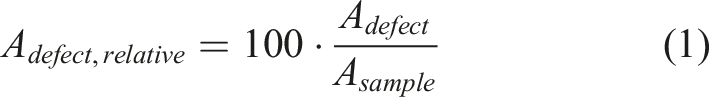
The presence of several defects in different layers stacked in thickness direction can create large thickness variations in AFP structures 27 and can complicate the estimation of ILSS values. In this work, some samples with severe thickness variation were additionaly scanned with a 3D scanning system ATOS 5 from Carl Zeiss Industrielle Messtechnik GmbH 28 to estimate the criticality of the surface waviness..
Five-point bending test on double-beam shear sample
The literature review highlighted the difficulties to obtain a clear shear failure in specimens without additional failure modes. In previous work, issues have been raised in three-point bending tests on thermoplastic materials to characterize their ILSS. In absence of a clear peak in the force versus displacement curve, the estimation of ILSS according to ASTM standards was deemed inaccurate and an alternative was suggested.29,30 However, these alternatives are not without their own limitations. The modified Arcan fixture or double-notched samples require significantly higher manufacturing and sample preparation efforts, making them viable but unattractive alternatives.
In this work a five-point testing procedure based on DIN EN ISO 19927 31 was suggested to characterize the interlaminar behaviour of thermoplastic materials. In the fixture, cylindrical supports of 6 mm in diameter were used to support the sample and introduce the loading. The samples were designed for a span-to-thickness ratio l/t of 5 that lead to a sample’s length of 40 mm. Prior to the tests a black and white pattern was sprayed on the samples with an acrylic paint using an airbrush system to guarantee reproducibility. The pattern was chosen so that each composite layer can be at least discretized with three facets in DIC.
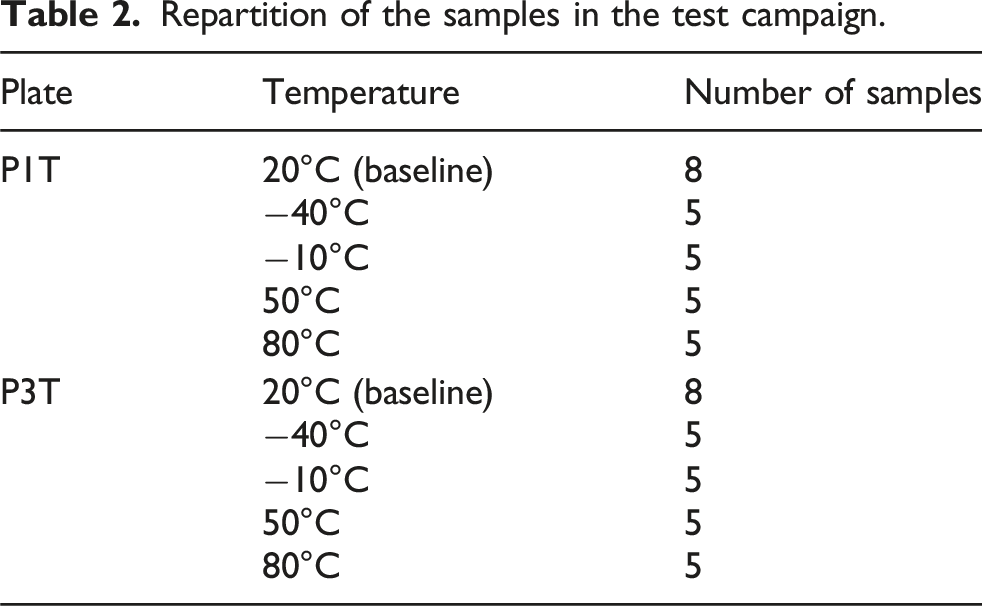
Repartition of the samples in the test campaign.
The five-point bending fixture was placed into an internally designed temperature-controlled chamber made out of acrylic glass (Figure 1). The temperature chamber was cooled down with a constant flow of nitrogen. For this, liquid nitrogen was allowed to evaporate in a separate container and subsequently heated to the desired temperature before being injected in the chamber. The temperature was controlled by a resistance temperature detector PT100 positioned in the vicinity of the specimen. Nitrogen was chosen to prevent the front window from fogging up and thus facilitates DIC measurement. The temperature was maintained until the complete test setup reached an equilibrium. It was brought to respectively −40°C, −10°C, 20°C (room temperature RT), 50°C and 80°C and the specimens were acclimated before testing. After introduction and centring in the fixture, the specimens were finally loaded in a universal Zwick 1494 testing machine at a crosshead speed of 0.5 mm/min up to complete failure. Test setup including the five-point bending fixture, the temperature chamber and the universal testing machine.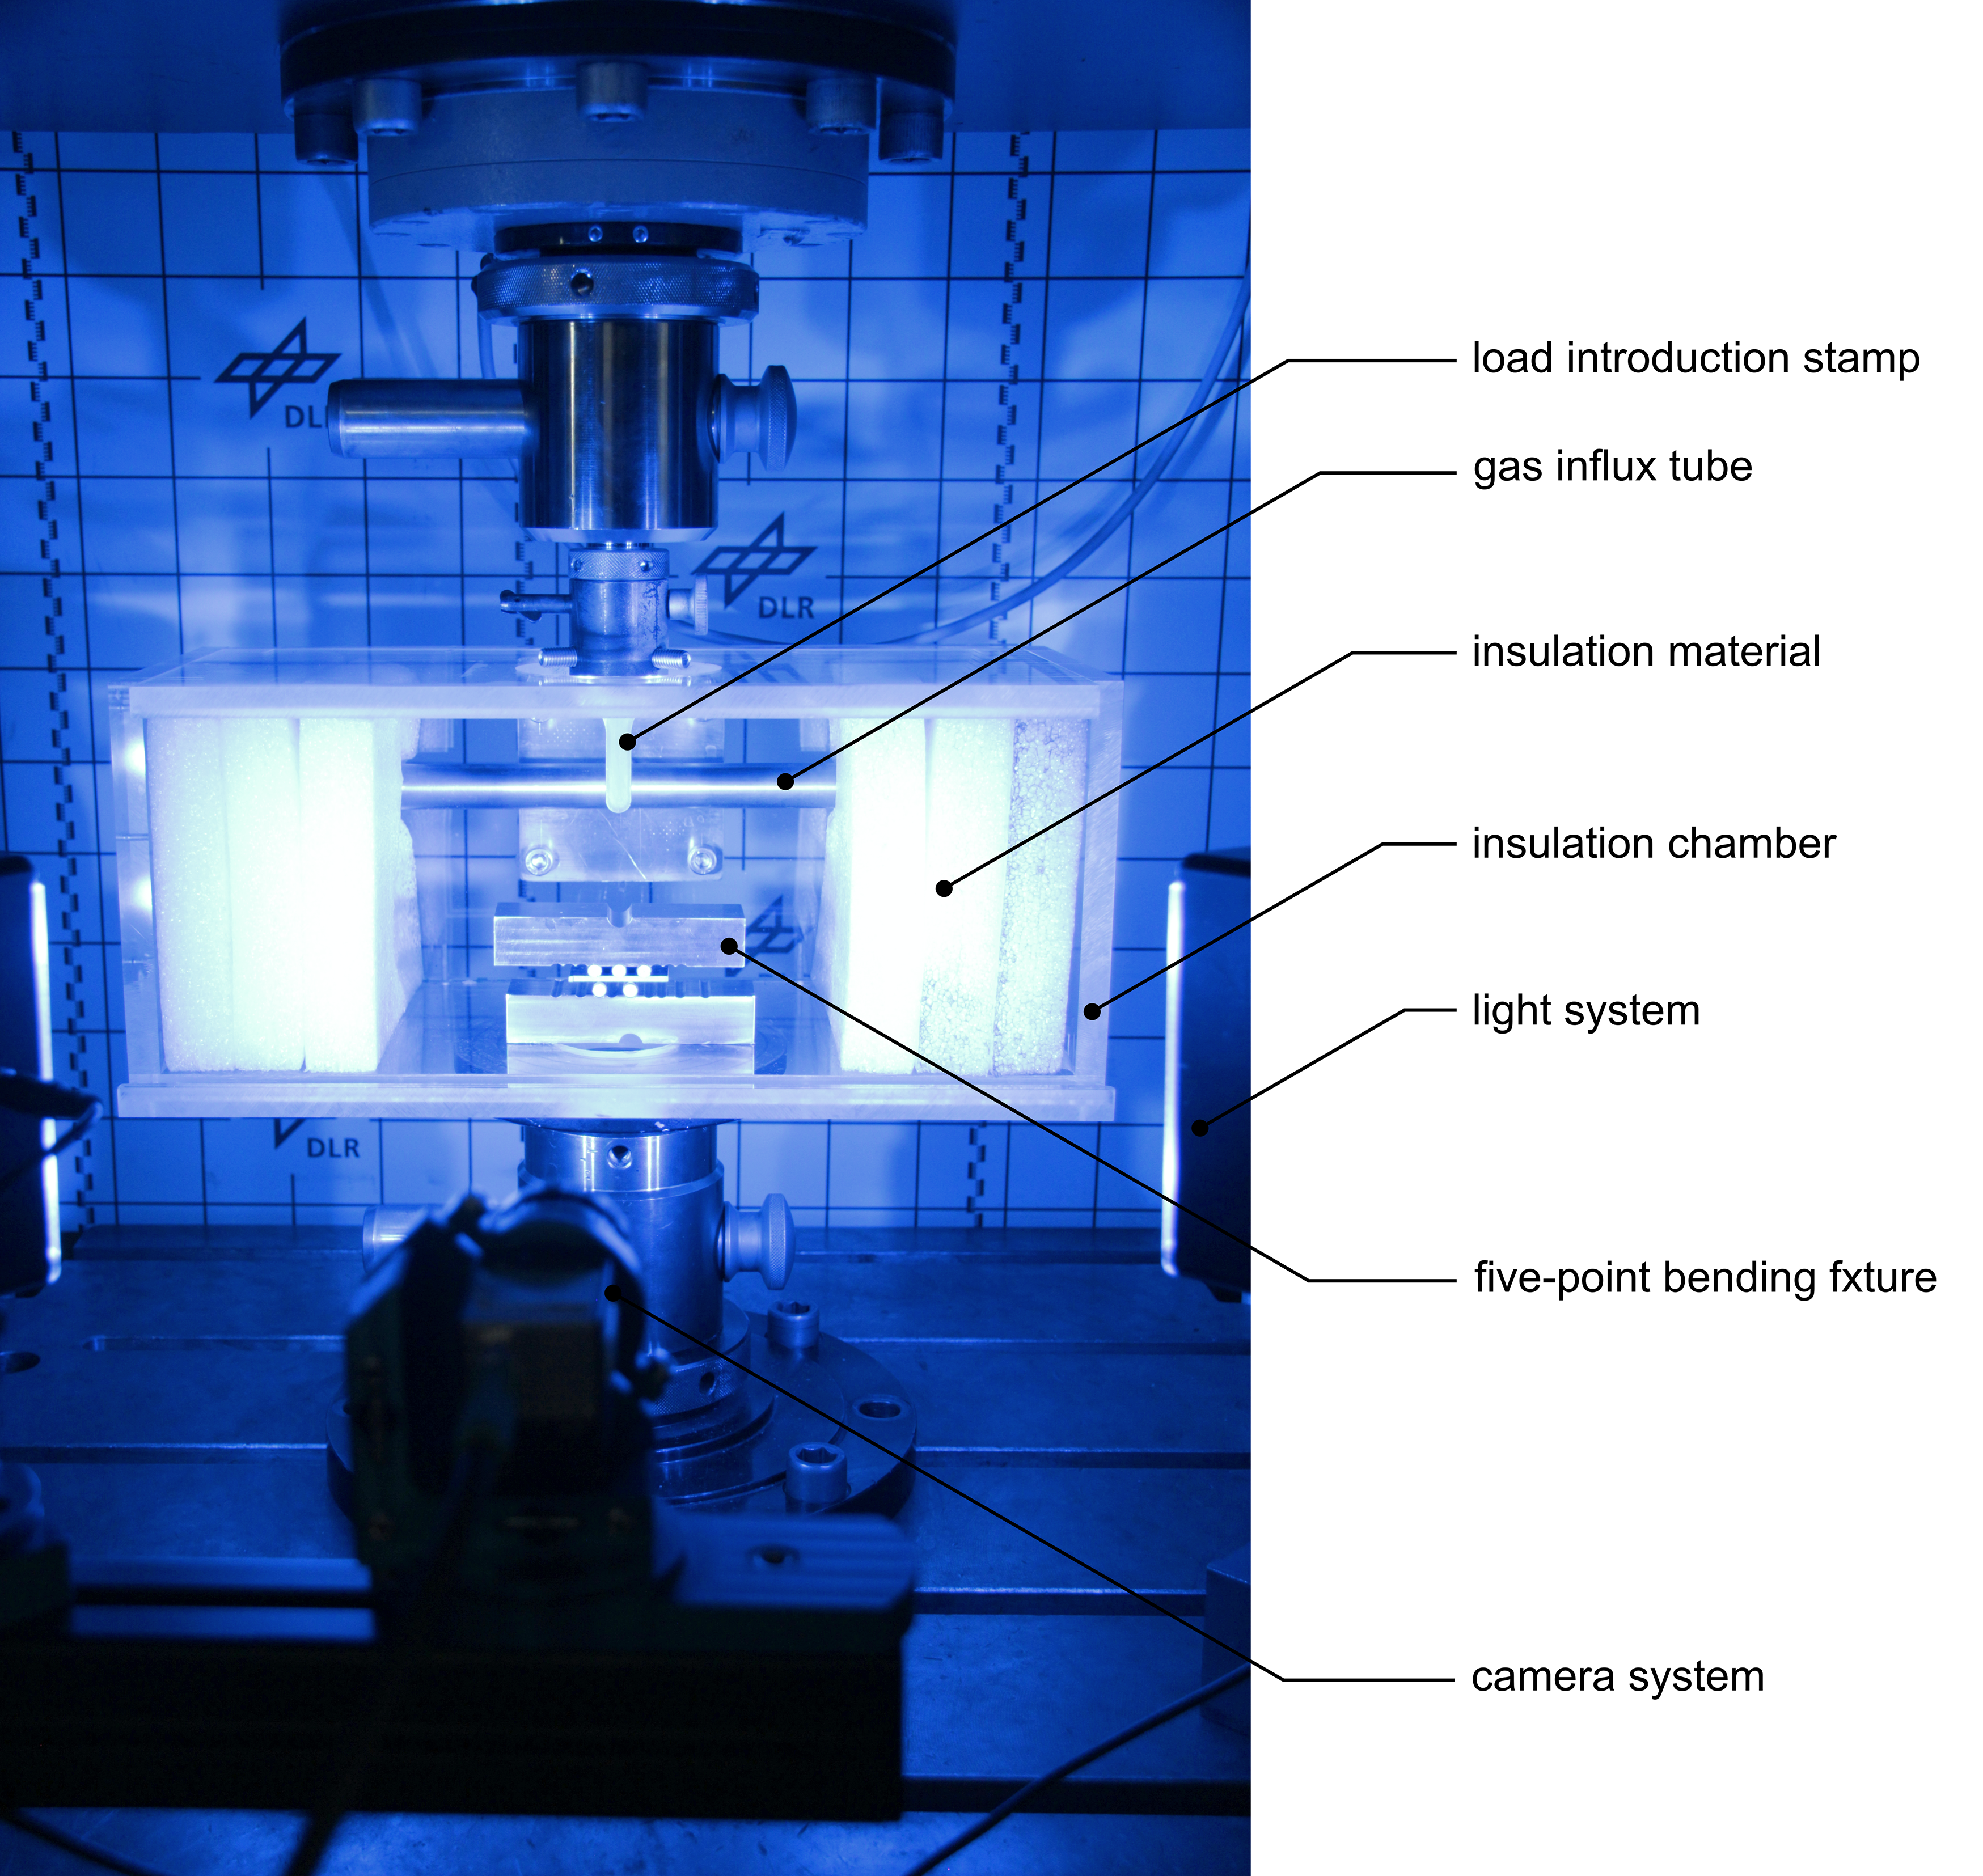
The shear stress in the sample was calculated based on the force measurement according to DIN EN ISO 19927 and to equation (2), where F, b and t represent the measured machine force, the sample width and thickness respectively. The shear modulus G13 was calculated based on the mean shear strain γm and the mean shear stress τ in the principal shear region according to equation (3) and based on the measurements documented in later section about experimental results.
Equation (2): Calculation of the shear stress τ in the DBS test according to DIN EN ISO 19927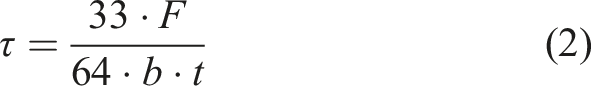
Equation (3): Calculation of the interlaminar shear modulus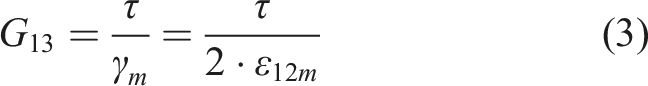
Strain evaluation with Digital Image Correlation (DIC)
Camera and software setup for measurement with DIC.
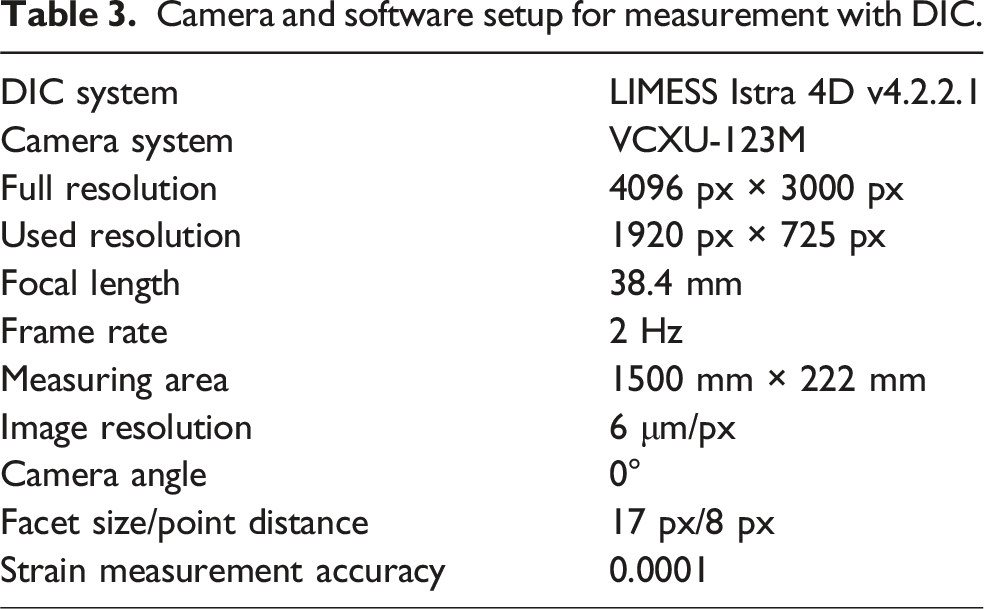
Force and crosshead displacement were recorded by the Zwick testing machine and synchronized with the DIC images. The average shear strain in the sample was calculated as the mean value of the shear strain in the regions of pure shear state (dotted boxes in Figure 2). The maximal shear strain was calculated as the maximum of the absolute values of the shear strain measured along two lines in the regions of pure shear (dotted blue lines in Figure 2). In absence of clear indicators of the initiation of delamination in the stress versus strain curve, a criterion using the shear strain rate suggested in ref. 33 was further used to estimate the strain at which delaminations start propagating in the specimen. In the first phase of elastic, slightly plastic deformation, the shear strain rate is assumed to increase linearly up to the first delamination. The second phase depicts the propagation of the delamination in the maximum shear regions and the apparition of additional delaminations in the secondary shear regions. In the third phase, almost every ply-to-ply interface is delaminated and the force increases through the further bending of the sample and through the plastic deformation of the thermoplastic resin. In most cases, the point of initiation is defined as the elbow point in the second phase and represents a sudden acceleration of the delamination rate. Knowing the shear stress from machine measurement and the shear strain from DIC, the elastic modulus G13 can be estimated. Strain measurement in the DBS samples.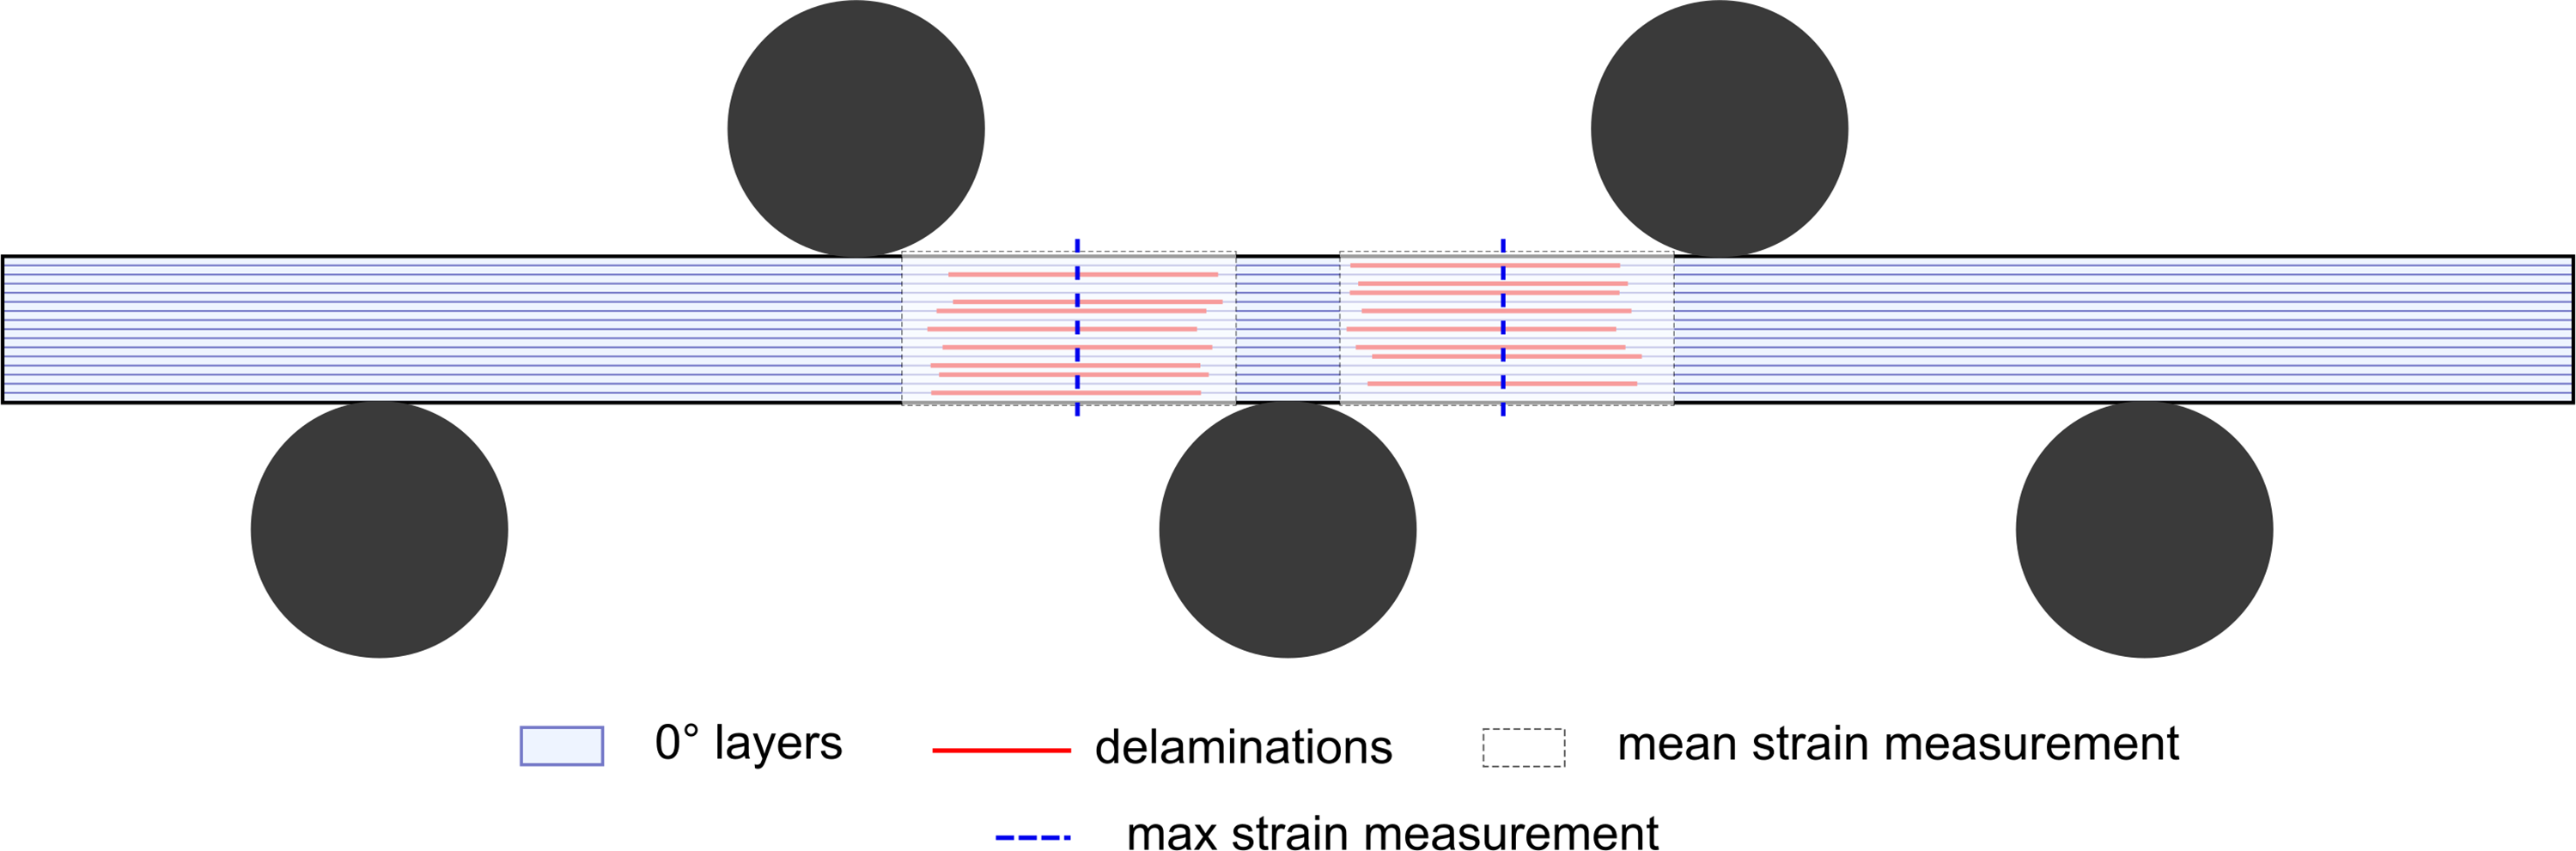
Statistical analysis
The statistical distribution of the measured mechanical properties (ILSS, shear strain at failure and shear modulus) was tested using the Shapiro-Wilk test and a significance level p of 0.05. Additionally, T-tests and ANOVA tests were performed to estimate the statistical significance of the different data sets for the two material plates and at different temperatures. For this, the mechanical properties of the two materials were compared for each temperature independently. In a second step, the statistical significance of the data sets within one material was estimated by performing the ANOVA test on all data at various temperatures. For this analysis, the python library SciPy was used.
Experimental results
In the present section, the different results from the optical observations and from the mechanical tests are presented. In particular, the correlation between the observed material geometrical characteristics and the extracted material properties is highlighted.
Microscopic structure
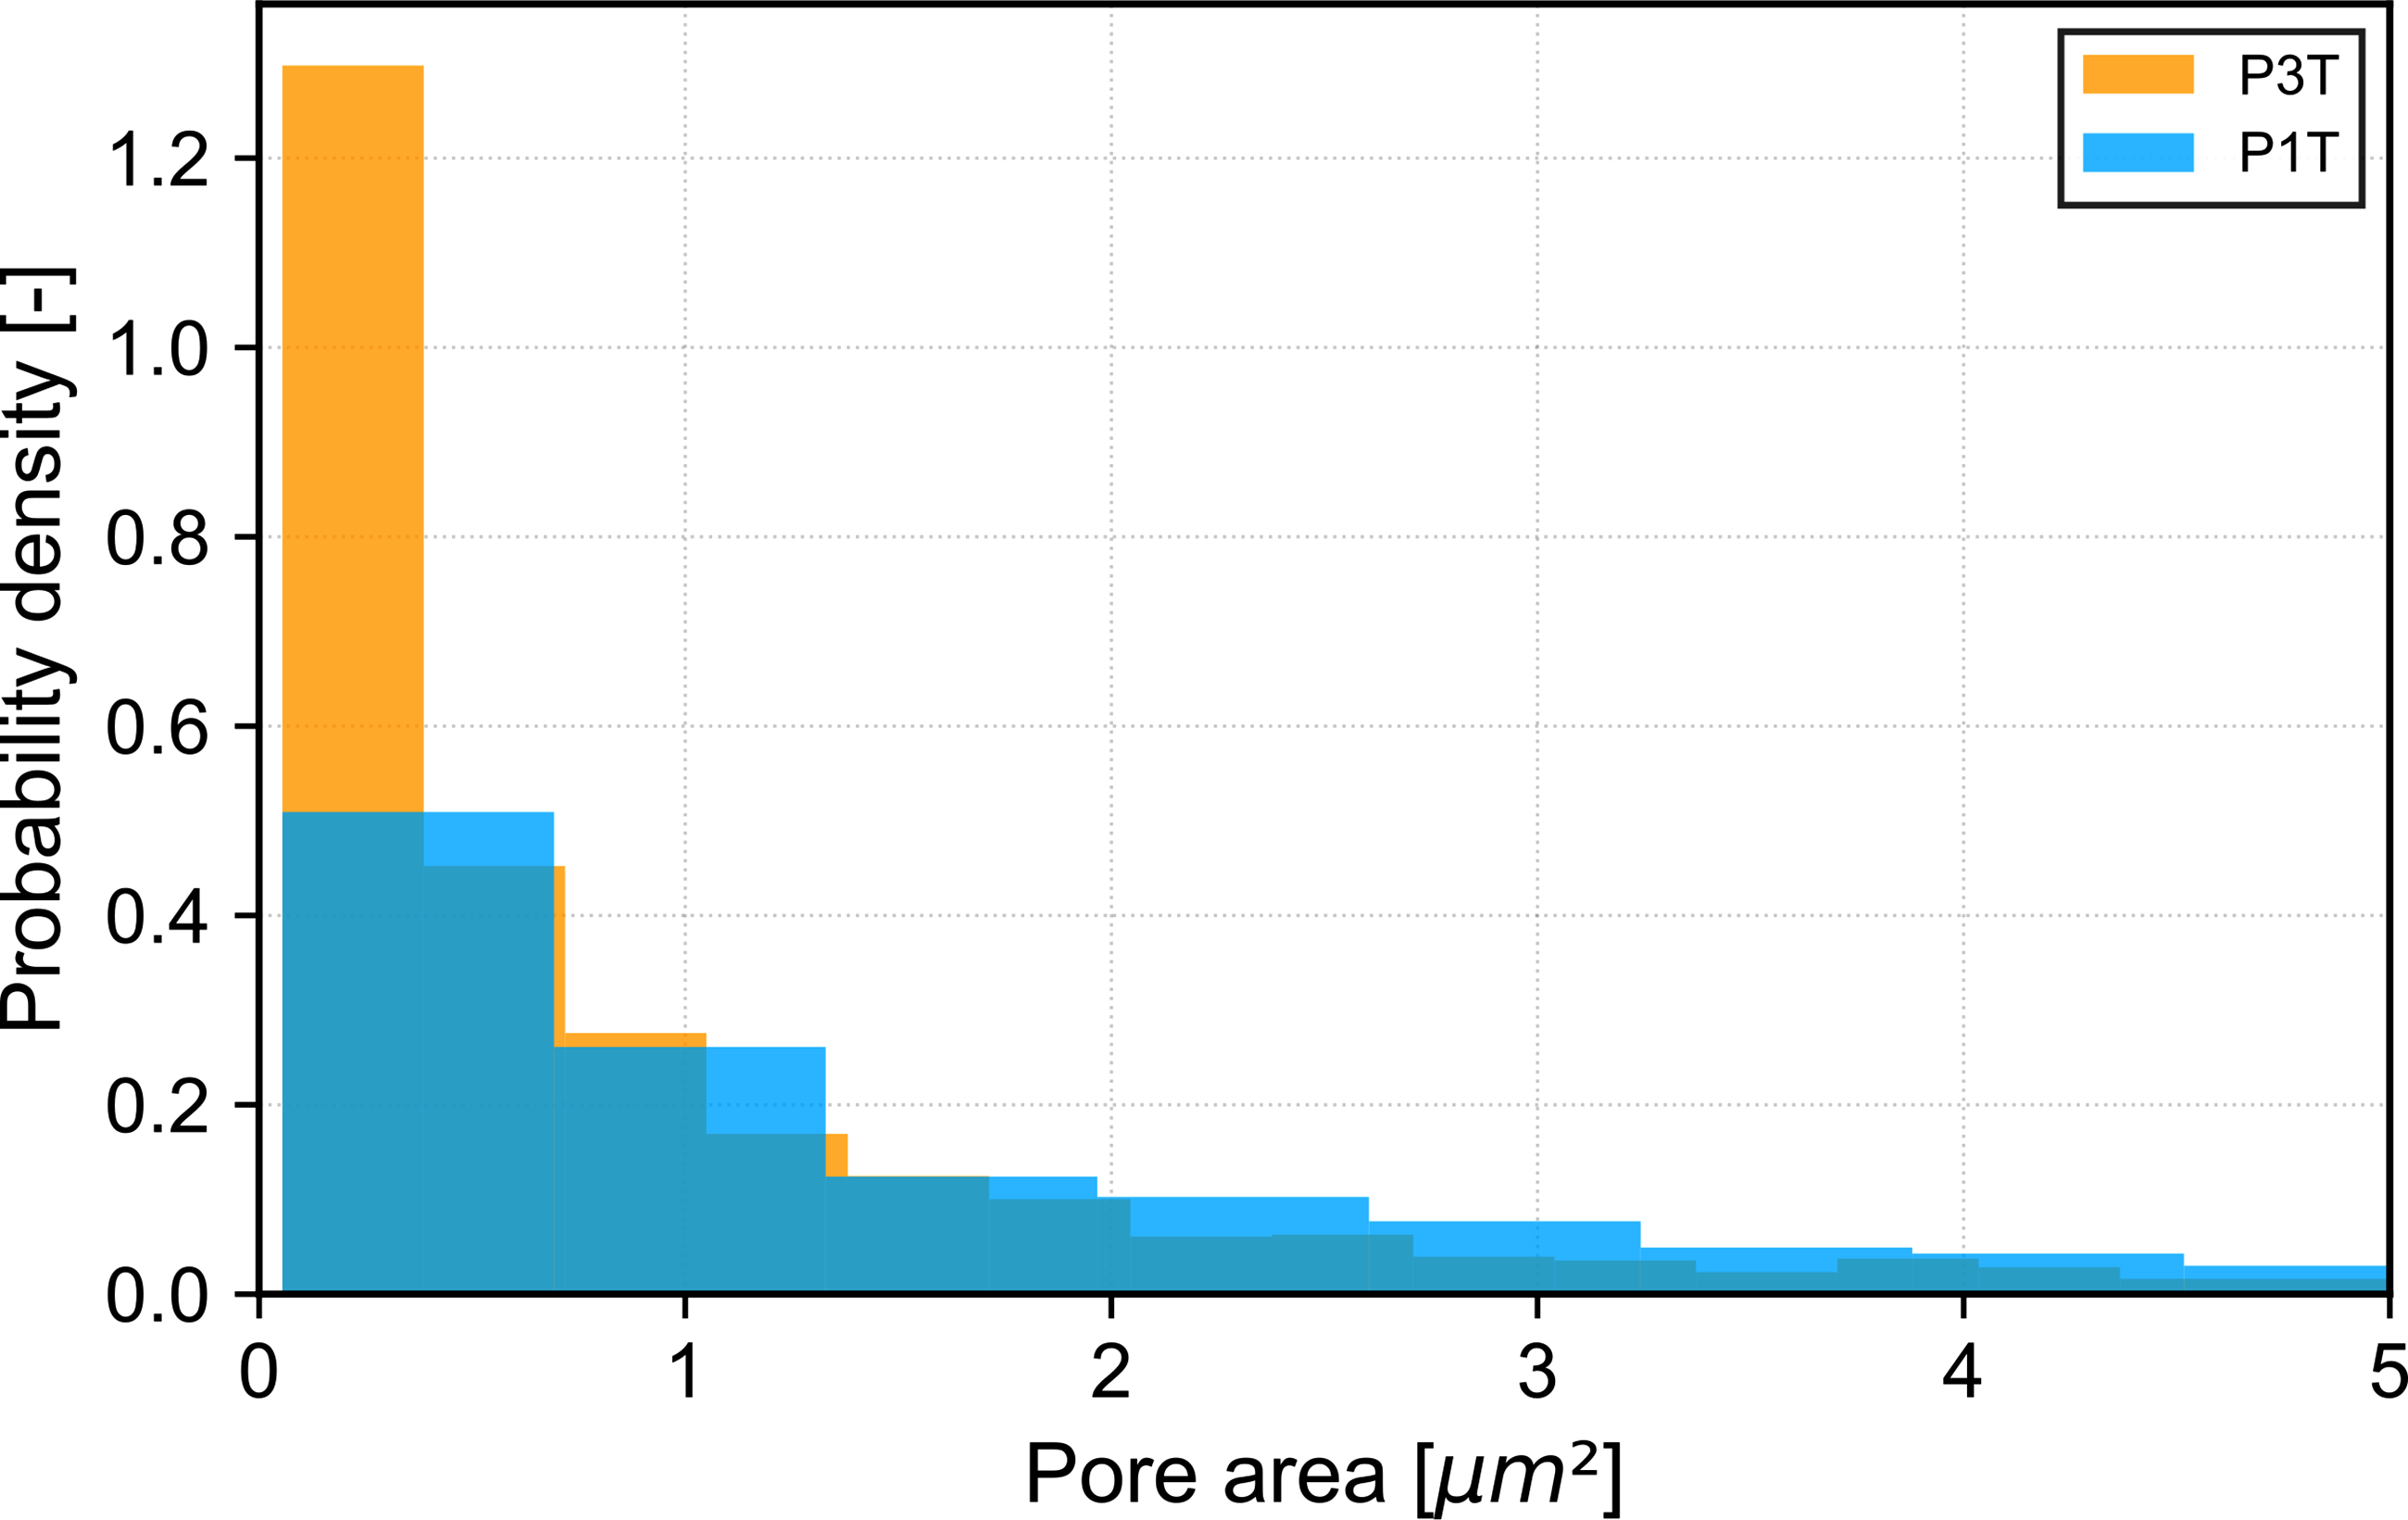
The micrography analysis estimated the evolution of the local fibre volume content through the thickness of the material on one representative specimens (Figure 3). As it could be expected, the tape laying with three tapes simultaneously (plate P3T) does not largely modify the local fibre volume content and fibre volume contents of 52% and 53% were measured for the P3T and P1T plates respectively. The fibre volume content of the tapes is 55% and should lead to a fibre volume content of the laminate of 55% after AFP manufacturing. The deviation from the measured values to the expected fibre volume content can be explained by the measurement uncertainty due to the maximal image resolution in the micrographs, which can introduce some systematic measurement error. Increasing the resolution could be reached by optimizing the polishing process further and increasing the magnification factor used in microscopy. Machine learning approaches could help increase the precision of the fibre recognition in the future as well. Alternative measurement of the fibre volume content through acid digestion will be considered in further work to validate the present approach with micrography. In Figure 3, the interlayer region-rich areas are clearly visible with a sudden drop of the local fibre content. An approximation of the interlayer thickness consisting in resin-rich regions can be obtained by defining a threshold fibre volume content of 40% and measuring the width of the peaks below this limit. The plate P3T shows larger interlayers with a mean value of 19 μm and a maximum of 70 μm, while those values reach 12 μm and 20 μm respectively for the plate P1T. The measured average porosity of the plate P3T is slightly higher than for the plate P1T with respectively 2.0% and 0.7%. The plate P3T presents a higher number of pores below 0.5 μm than the plate P1T (Figure 4) and a lower number of larger pores above 2 μm. As mentioned previously, these measurements are only local estimation of the material quality and can vary within the plate. The investigation of a higher number of samples with micrography could allow the estimation of the statistical distribution of pores in the plate. Micrographs of the tape material performed prior to the present work yielded porosity values between 0.11% and 2.97% with a median sample porosity of 0.8%. Therefore, while the porosity of the P3T sample is higher than that of the P1T sample, both are within the porosity range of the raw tape material. It is therefore difficult to assess whether the impact of the manufacturing approach with one or three tapes was significant using only this information. Evolution of the local fibre volume content in thickness for the plate P3T (left) and P1T (right). Distribution of the pore area for the investigated plate and resulting average porosities.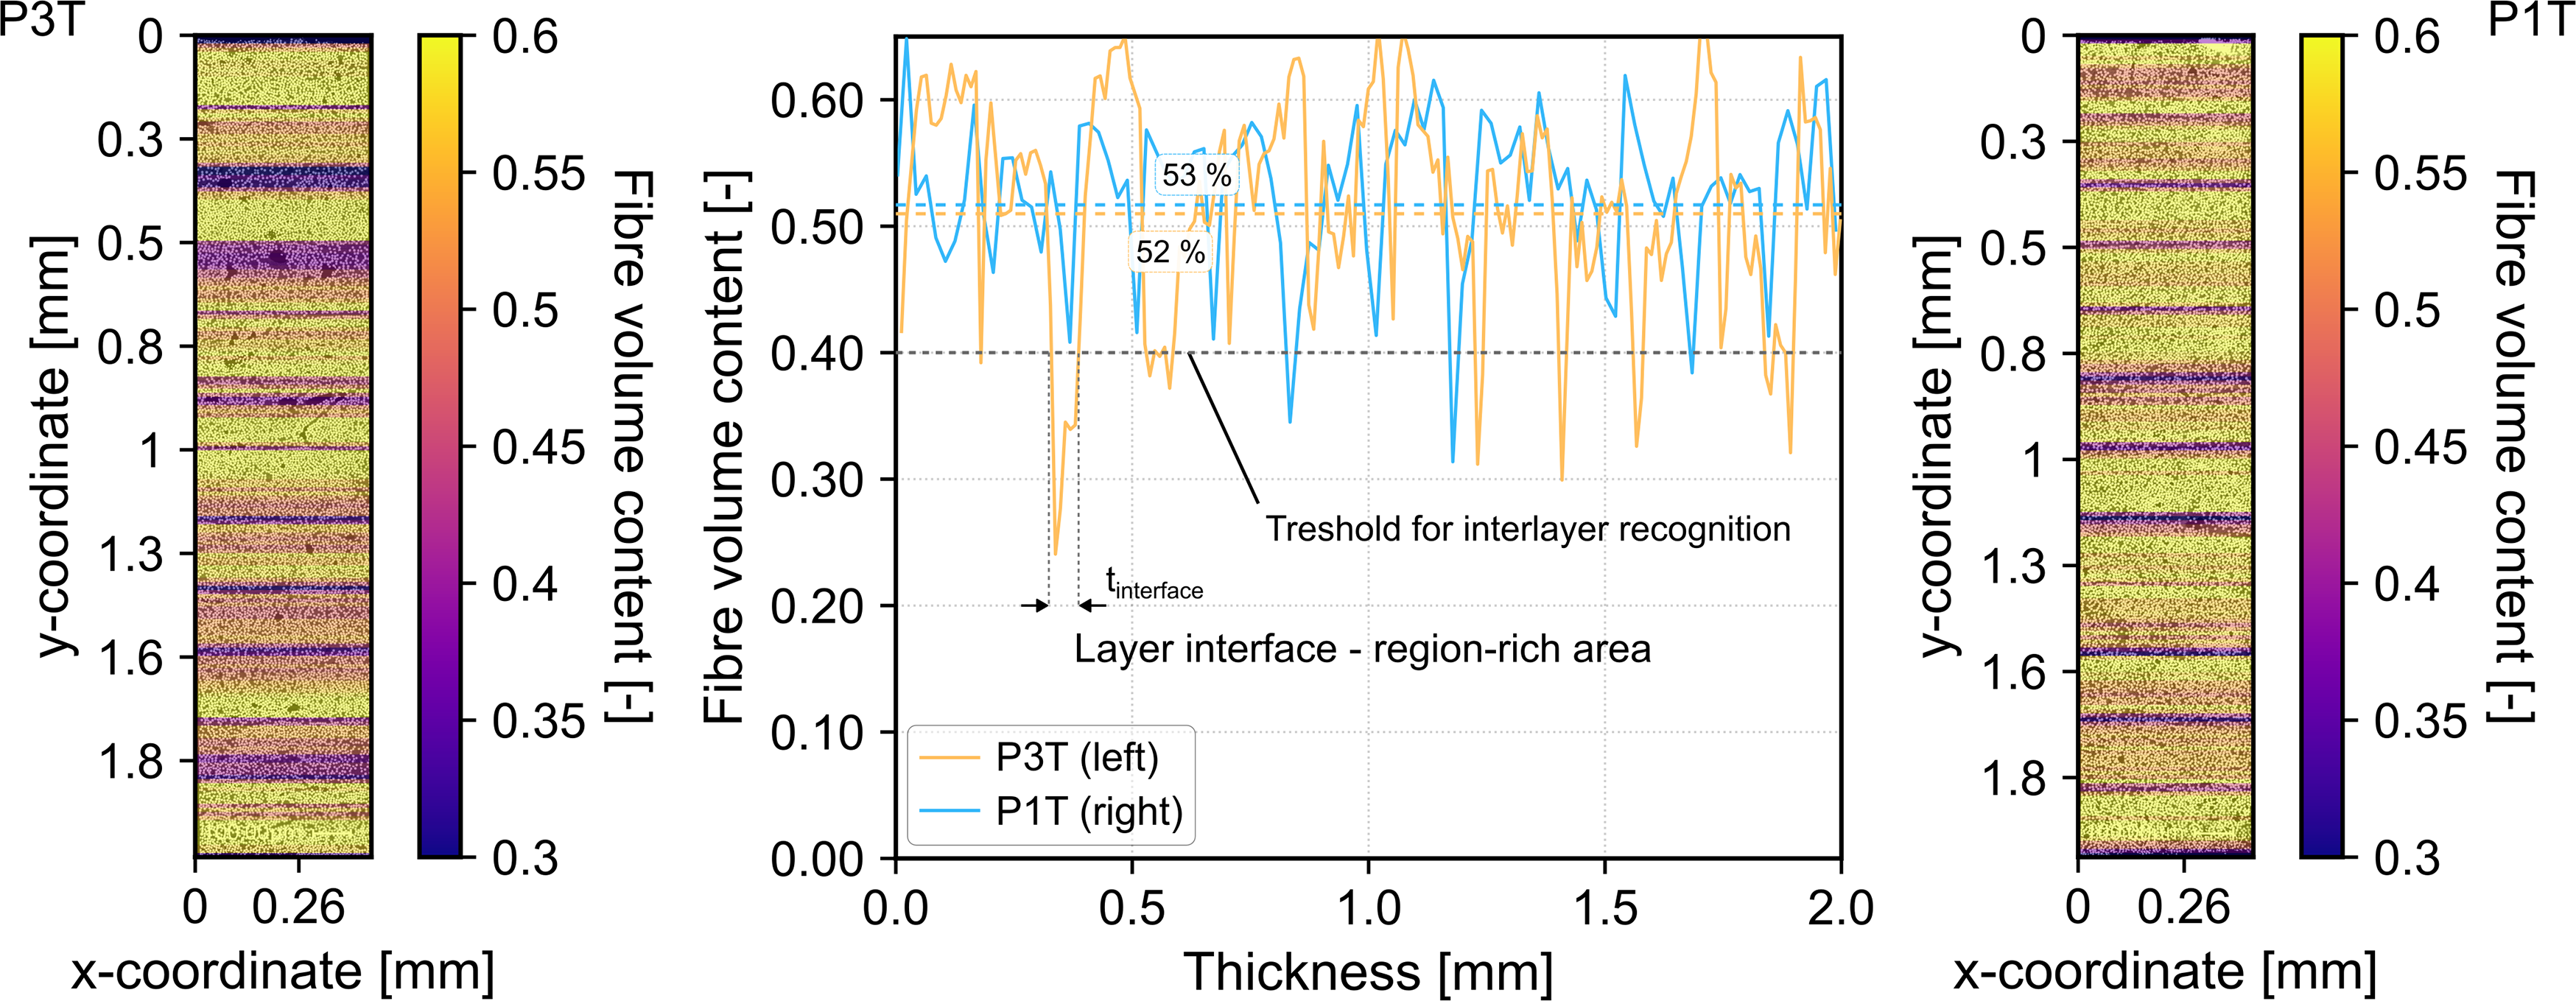
The Hough Cycle Transformation
34
allows for a precise estimation of the inter-fibre or nearest neighbour distance NND and of the fibre diameter D (Figure 5) and was performed on various subregions of the micrographs to estimate the homogeneity of the results in the sample. Similar distributions of the fibre diameter and of the inter-fibre distance were measured on the two plates. The fibre diameter follows a gaussian distribution described by equation (4) with a mean value of 7.2 μm and 6.9 μm and a standard deviation of 0.31 μm and 0.32 μm respectively for the P3T and P1T plates (Figure 5 left). The deviation could result from estimation errors in the grey value analysis which is strongly dependent on the image quality and sharpness. Distribution of the fibre diameter (left) and nearest neighbour distance (right) in the plates P1T and P3T for various subregions of the micrographs.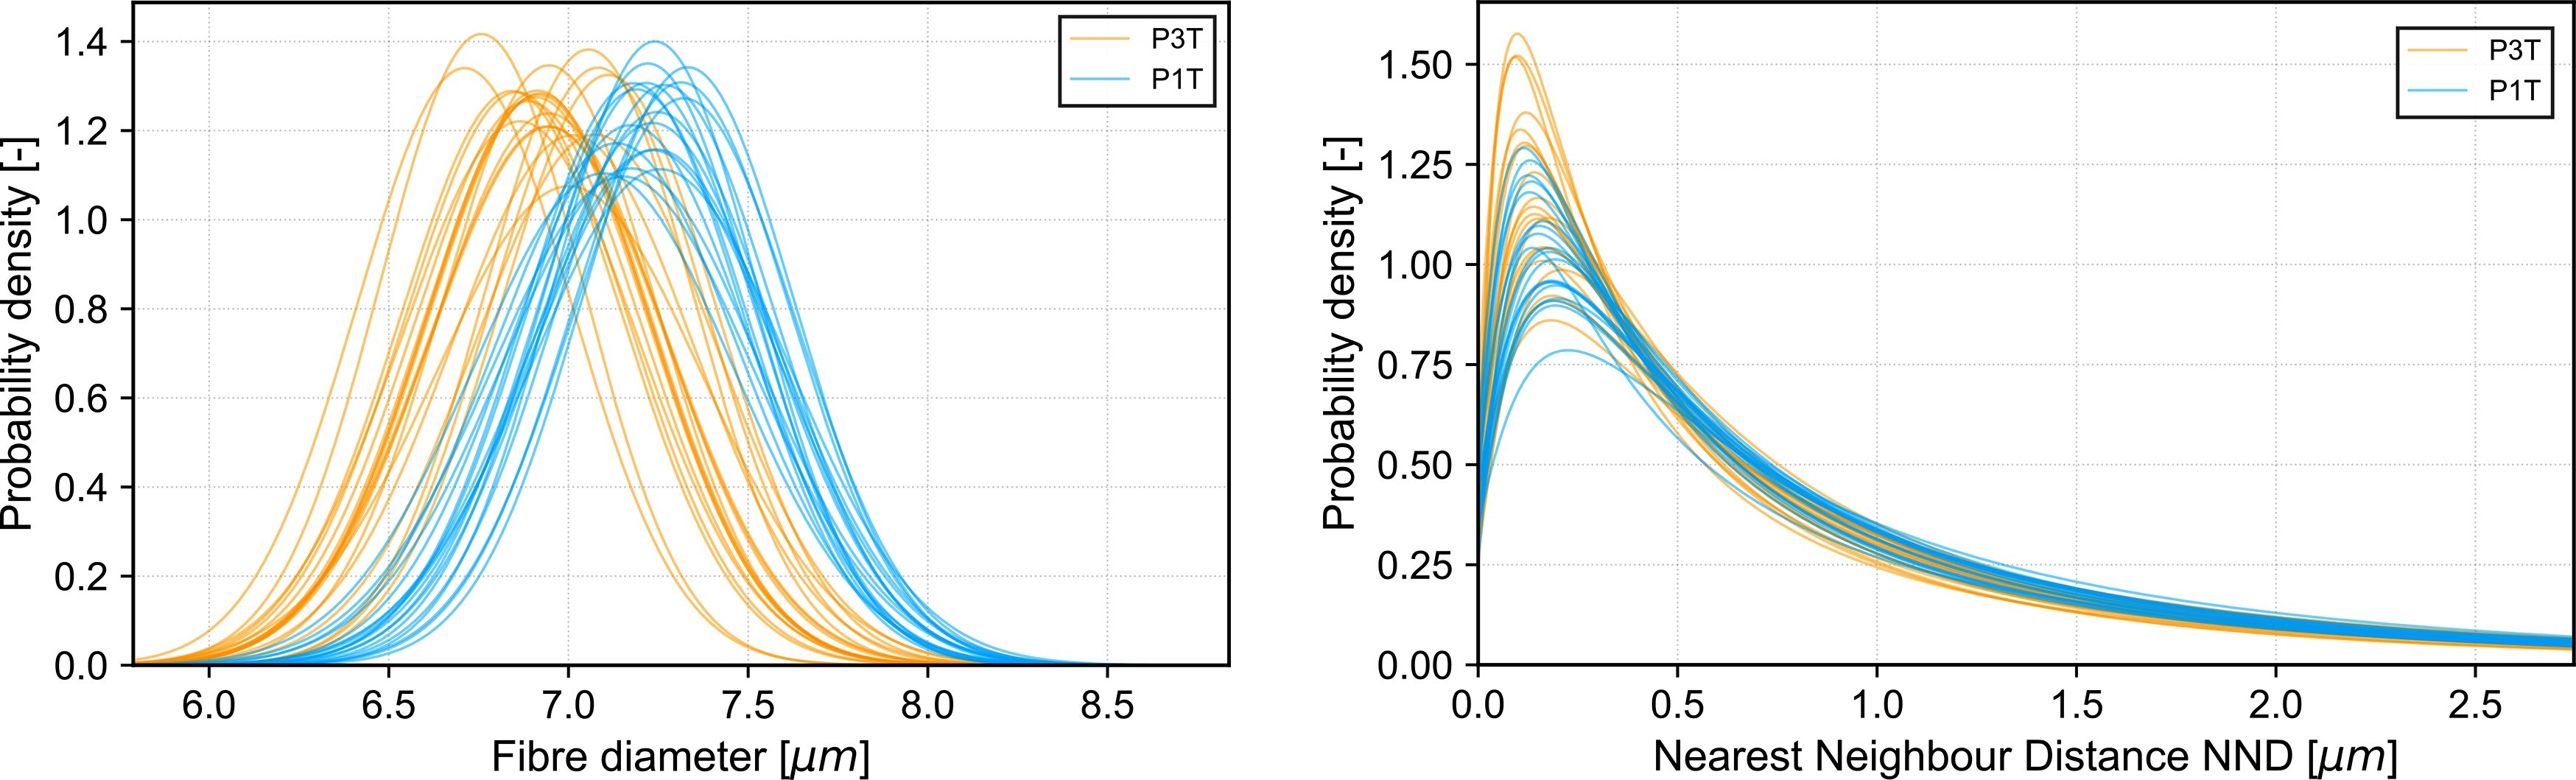
Equation (4): Gaussian distribution for the fibre diameter D with mean μ and standard deviation σ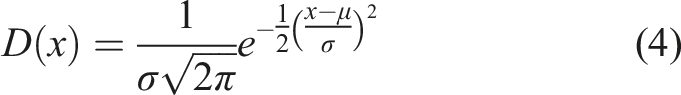
The inter-fibre distance was fitted by an inverse normal distribution describe by equation (5) with a location of 1.27 μm, a scale parameter of −0.12 and a mean of 0.85 μm for the plate P1T (Figure 5 right). The location, scale parameter and mean for the plate P3T are 1.25 μm, −0.11 and 0.89 μm. The maximal probability density for both plates is located at a nearest neighbour distance of about 0.10 μm, which is close to the maximal resolution of the micrograph.
Equation (5): Inverse normal distribution for the nearest neighbour distance NND with location θ, scale parameter λ and mean μ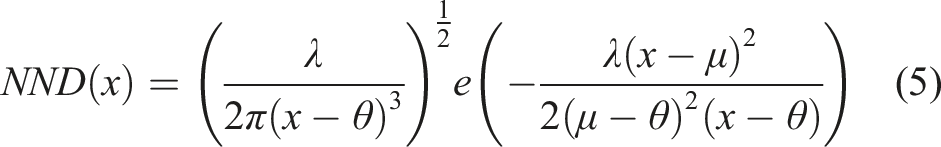
Macroscopic structure
Micrograph inspection of the interface between adjacent tows in the same ply for the two plates (Figure 6) corroborates earlier ultrasound and profilometer measurements. The plate P3T exhibits noticeable gaps between adjacent plies which, owing to the parallel orientation of fibres in the unidirectional layup, lead to material migration into the gap. This effect in turn causes the effective thickness of the ply to vary significantly and results in the observed waviness of the plate top surface. By comparison, the plate P1T shows almost perfect joining of the adjacent tapes, thus maintaining the tape tolerances and resulting in a flat top surface. Effects of manufacturing observed during the micrograph inspection on micrograph samples from the two different plate materials.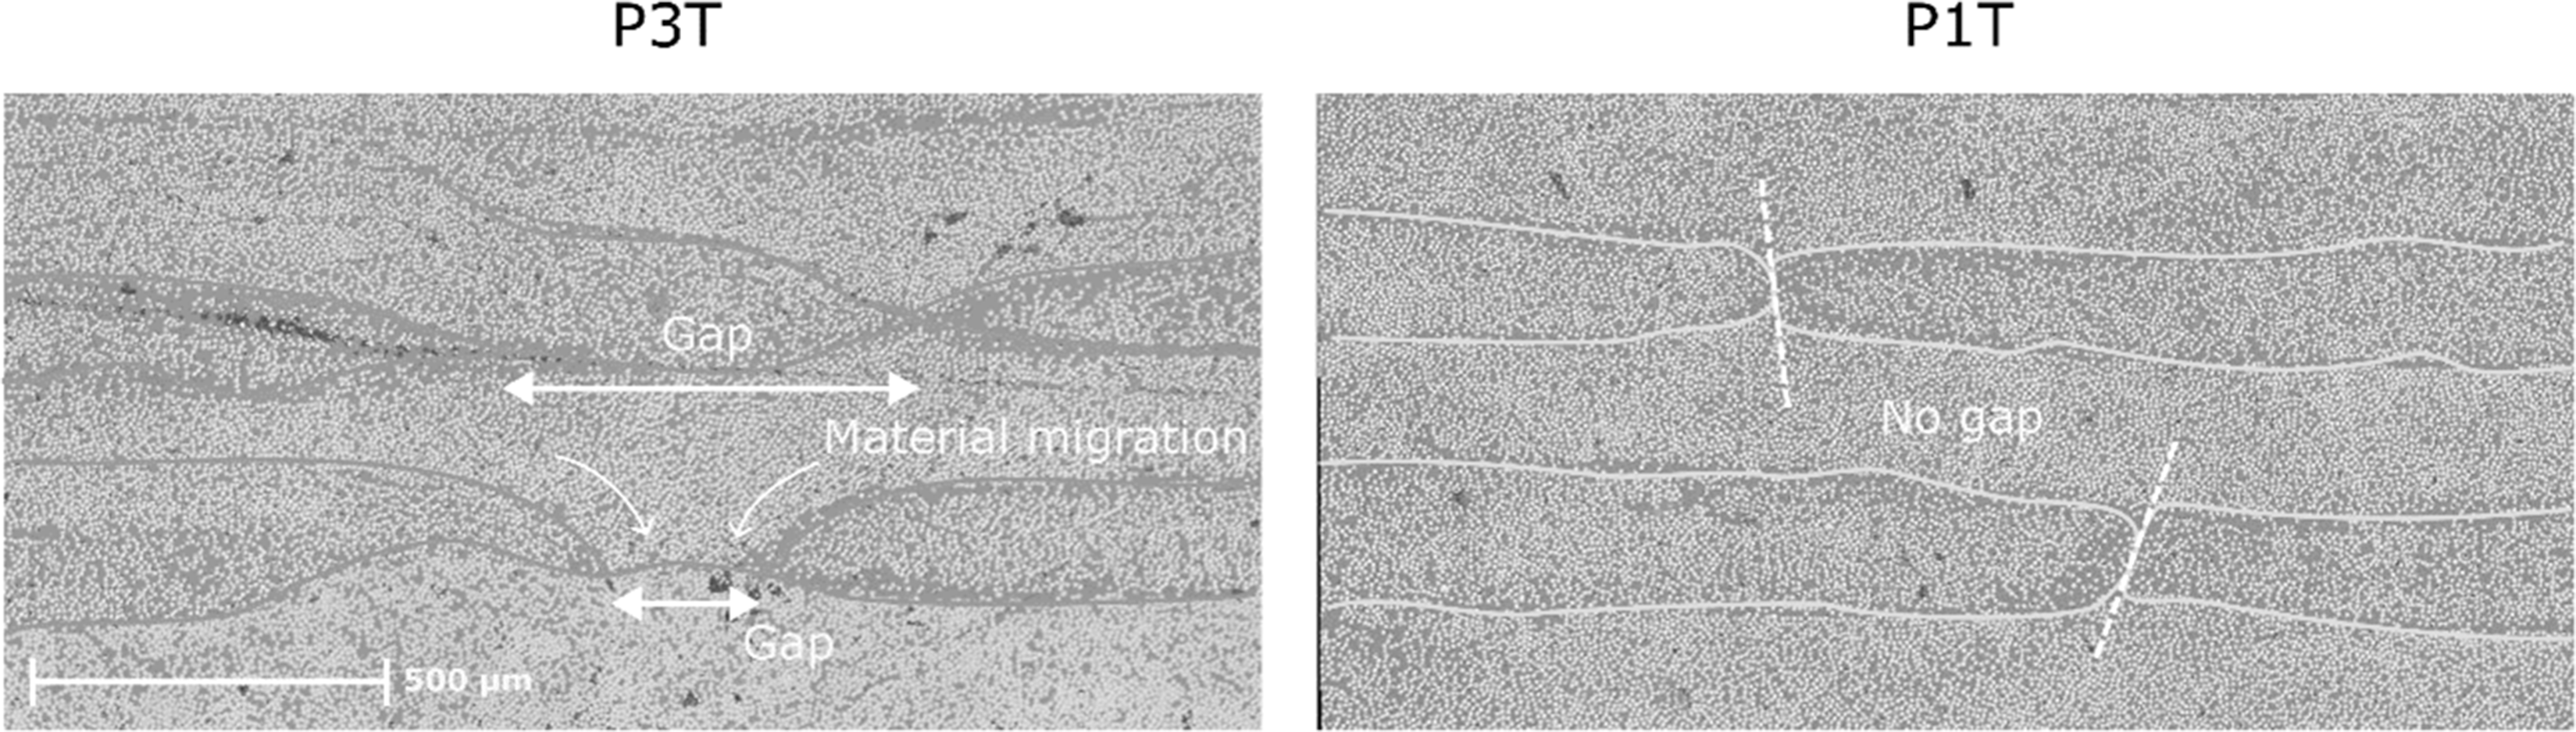
Figure 7 shows the information obtained from ultrasonic scans of the two plates. The back-wall echo of the plate P1T is consistently stronger than the plate P3T. Given that the mid-sections of the plates, where pore defects are represented as strong signals, are qualitatively similar and show few significant defects, the decreased back wall echo is taken to be a result of the difference in coupling quality between the two plates rather than of the presence of significant voids. However, the cause for the decreased coupling quality of the plate P3T can be linked to the greater degree of waviness of the plate surface, which for in-situ AFP unidirectional laminates is most likely an indicator of observable gaps/overlaps resulting from the layup. This observation of greater waviness is in correlation with the estimated surface of the defects from the 3D-scans in the investigated specimens illustrated in Figure 9. Ultrasonic scan information for the two plates: Signal strength at the coupling interface, mid-section and back-wall.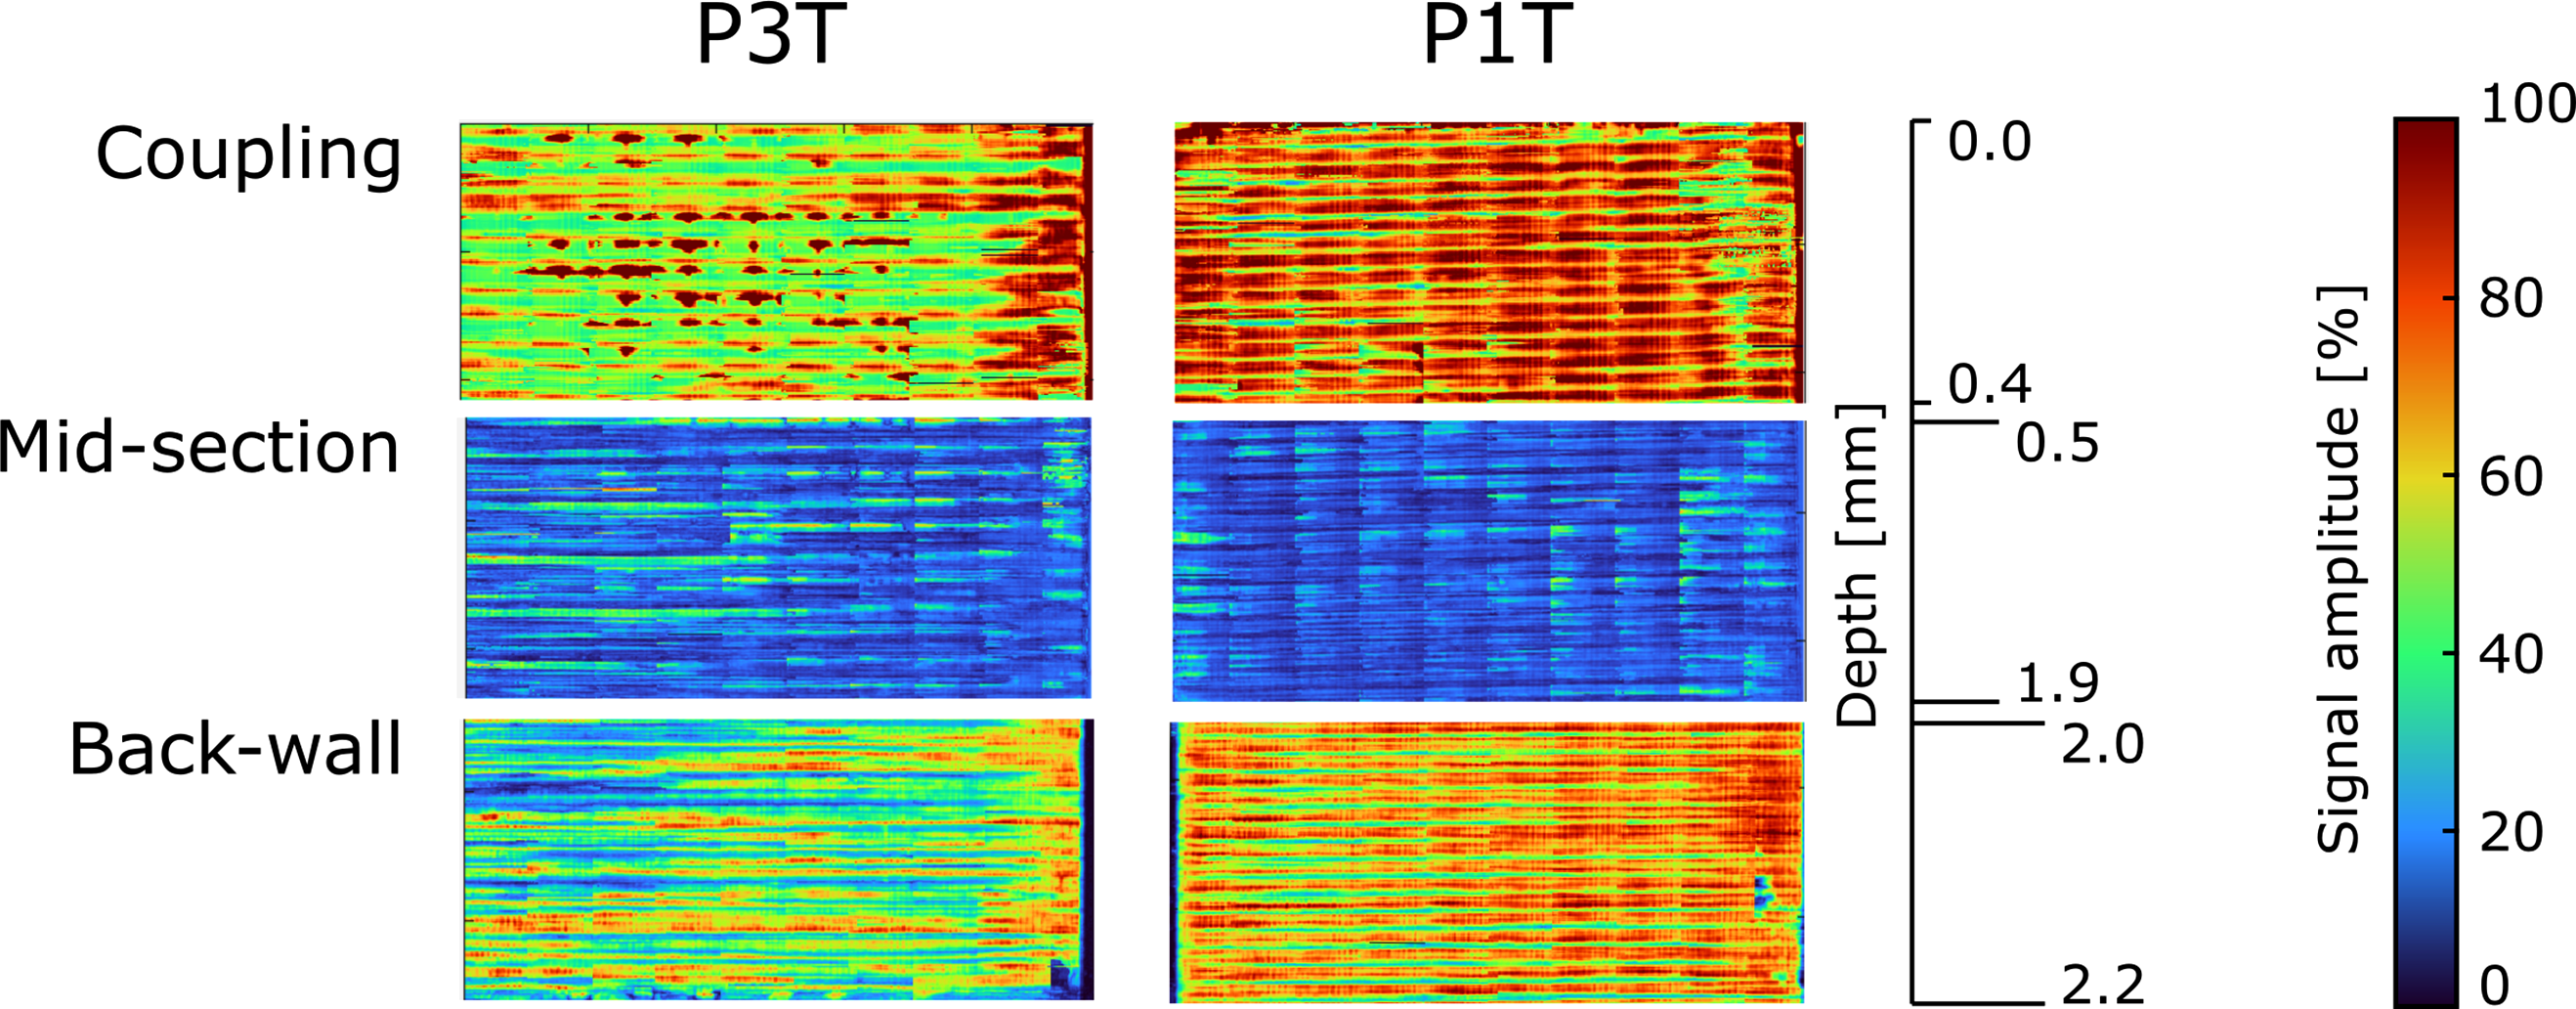
Figure 8 depicts the investigation of the defect area for samples of the plate P3T and P1T, where only the samples possessing a defect surface are shown. In accordance with the previous investigations, the specimens extracted from the P3T plate show a higher defect surface than specimens extracted from the P1T plate. In the P3T specimens, the defects are mostly oriented in the length of the specimen, which influences the load introduction in the five-point bending tests. The highest calculated surface of defects reaches almost 20% of the total specimen surface for the specimen 21. Only two specimens of the P1T plate presented a significant surface of defects. Estimated surface of defects in the DBS specimens (not indicated specimens had no detectable defects) with extracted ultrasonic images for each specimen are shown on top of the respective bars (left); processing in ImageJ of two exemplary specimens (right).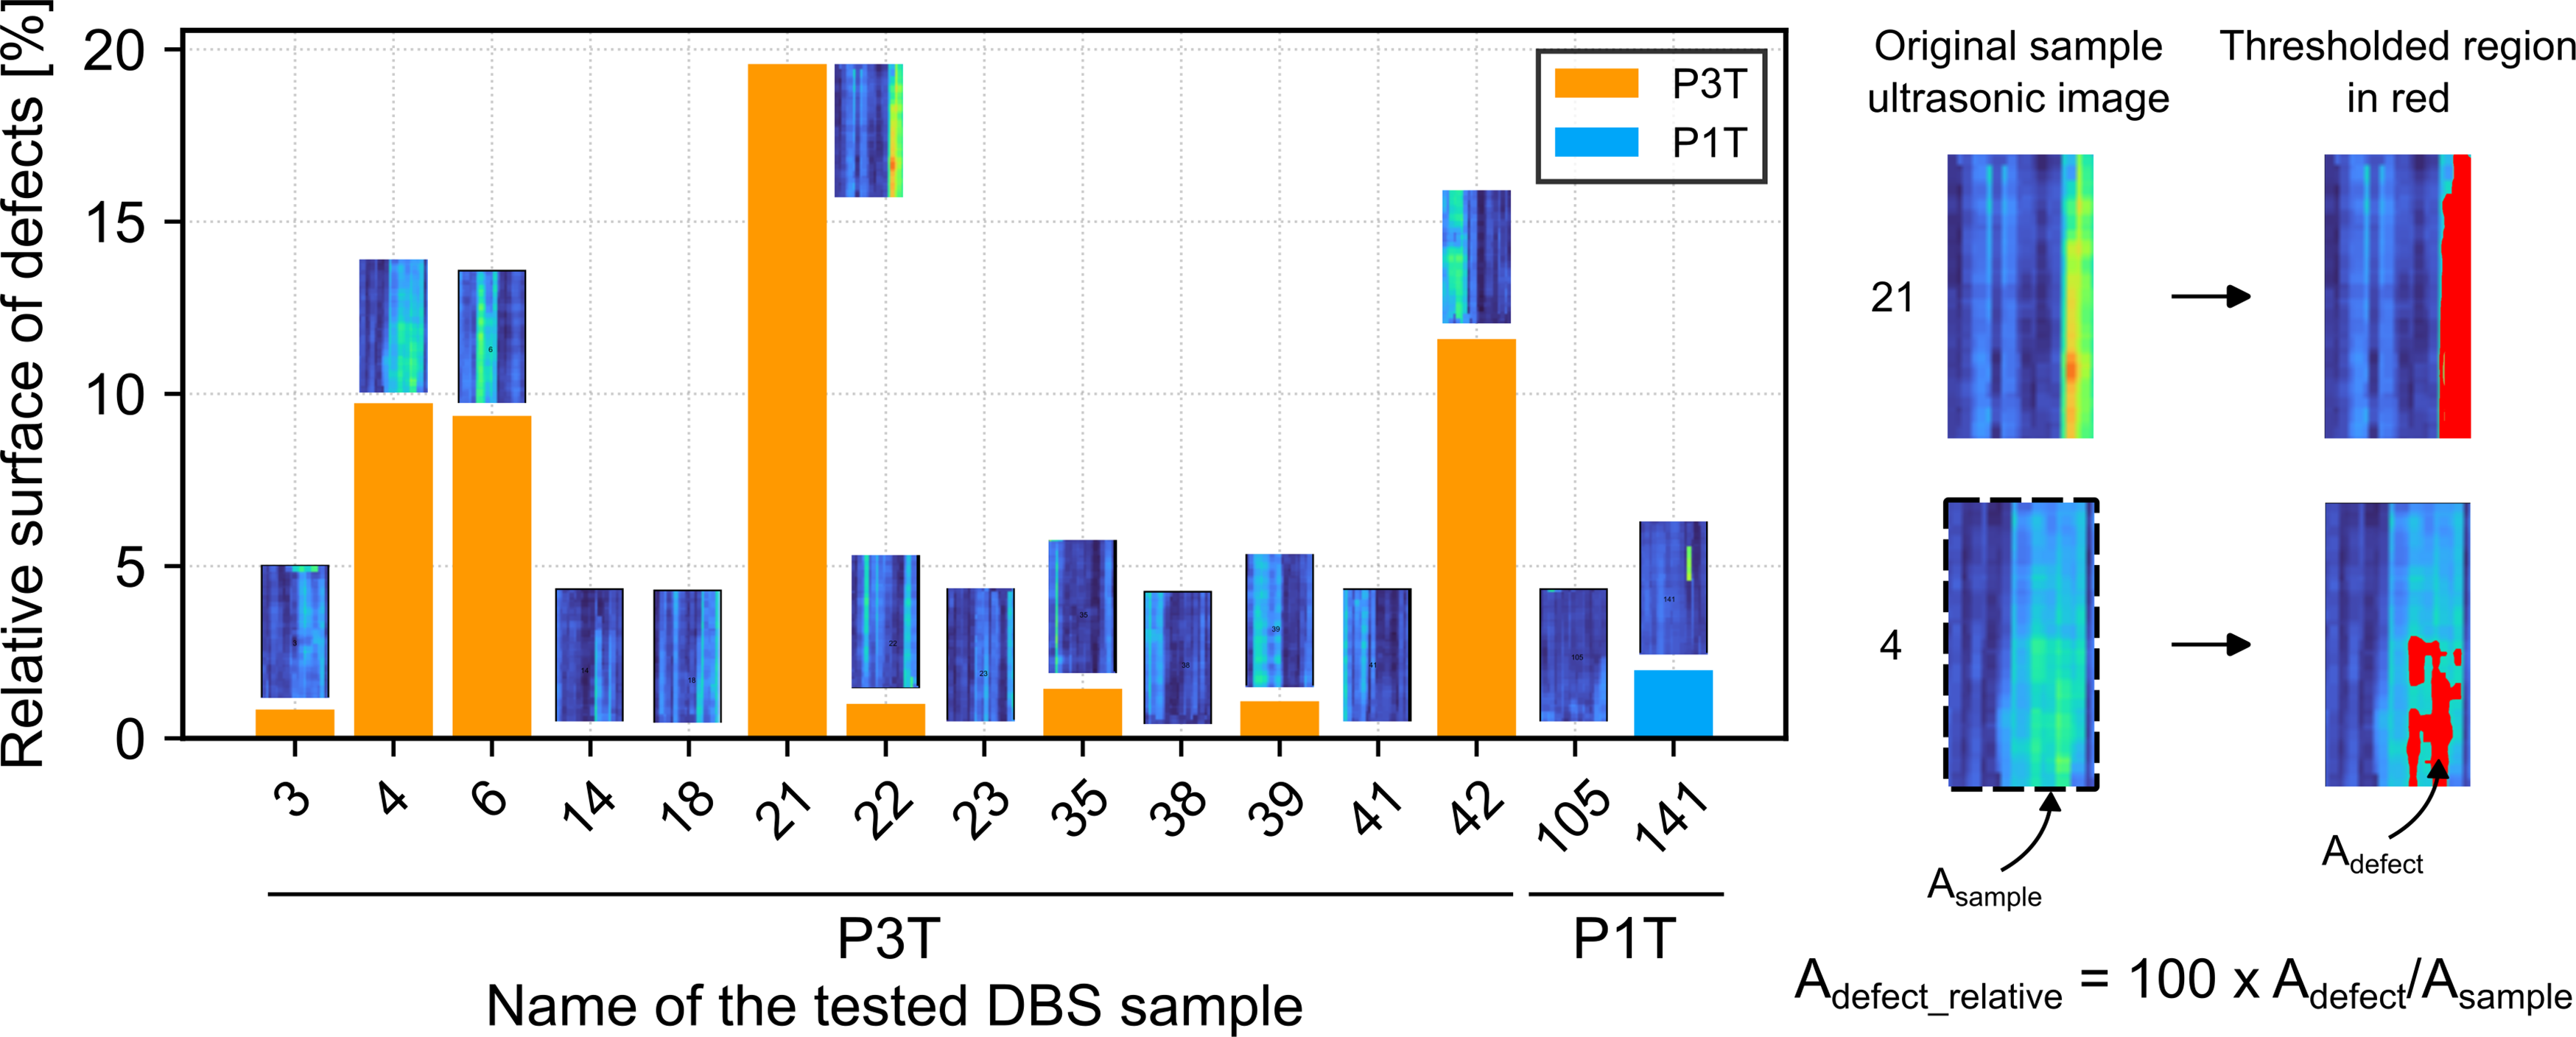
The 3D scans offer precious information about the geometric tolerances of the specimens. In this work, two specimens from the plate P3T with characteristic surface variations were scanned (specimen n°6 and n°21). The maximal thickness variation depicted in Figure 9 reaches 0.17 mm, about 7.5% of the total specimen thickness of 2.25 mm and results from the stacking of gaps in multiple layers at the same position in the plate. In absence of significant surface variation in samples from the plate P1T, no 3D scans was performed. Thickness variation in specimens n°6 and n°21 from the plate P3T with critical defects.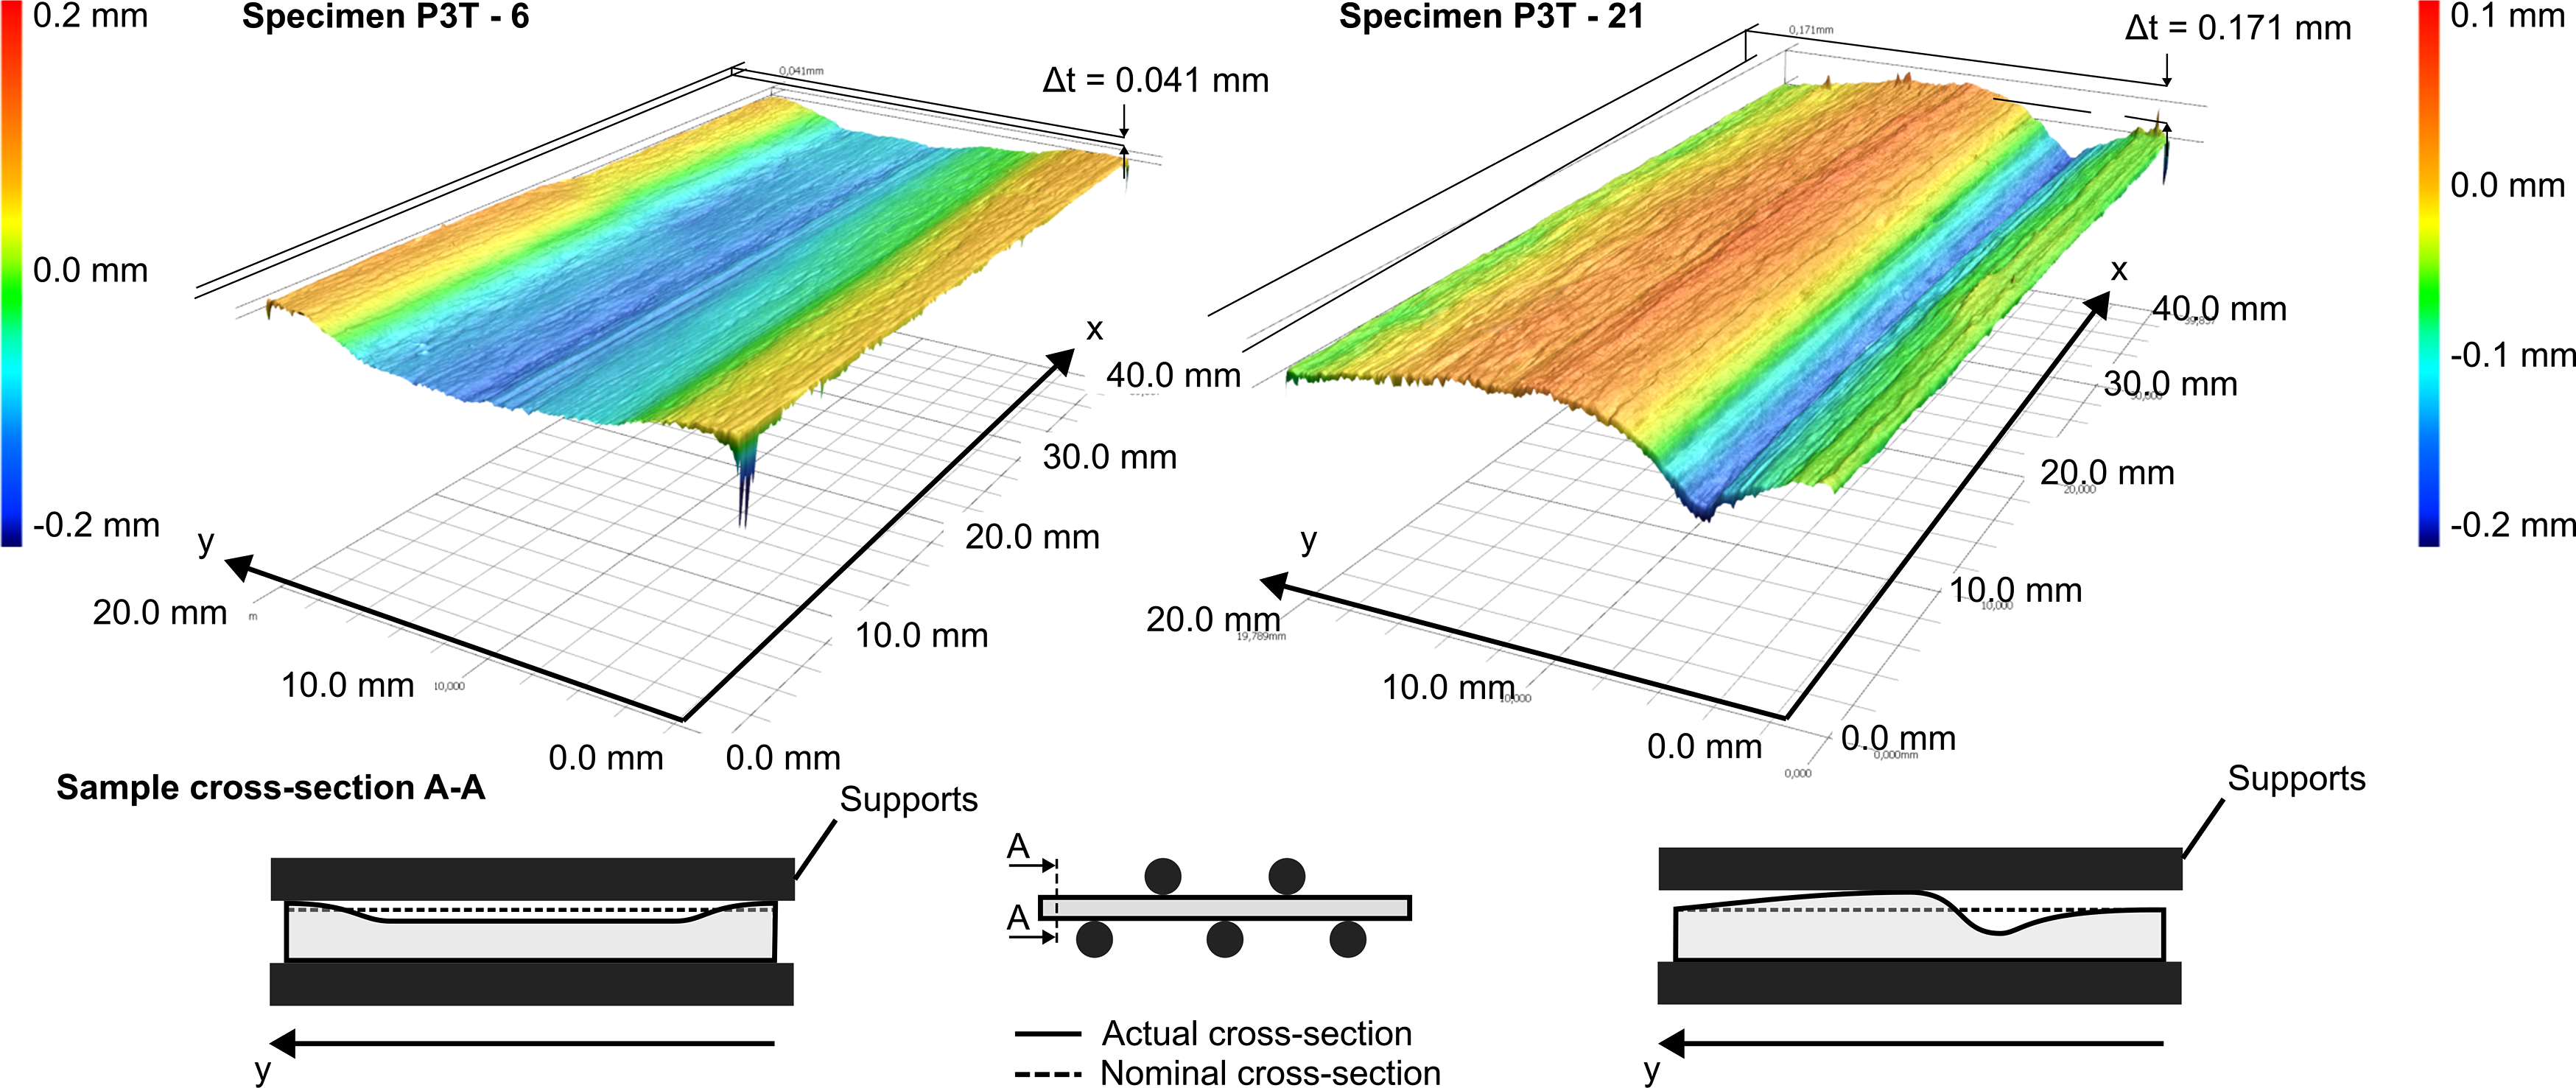
Double beam shear tests at temperatures between −40°C and 80°C
In the double beam shear test, the regions of interest close to the middle support are loaded under pure shear and are not influenced by undesired effects of tangential stresses. Figure 10 depicts the evolution of the average strain components εx, εy and εxy in the regions of interest during the test up to the peak stress. It can be seen that the condition of almost pure shear in the measurement region is respected in exception the first phase up to 0.01 GPa where deformations of the material near the supports bring additional strains in the region of interest. Due to the higher ductility of thermoplastics compared to thermosets, high compression strains and local shear strains are measured near the load introduction as depicted in Figure 10. This strain localization might lead to some damaging of the material and influence test results and will be investigated in further work. Evolution of average strains in the region of interest during the double beam shear test and view of strain localization near the load introduction (left); failure modes in the DBS sample (right).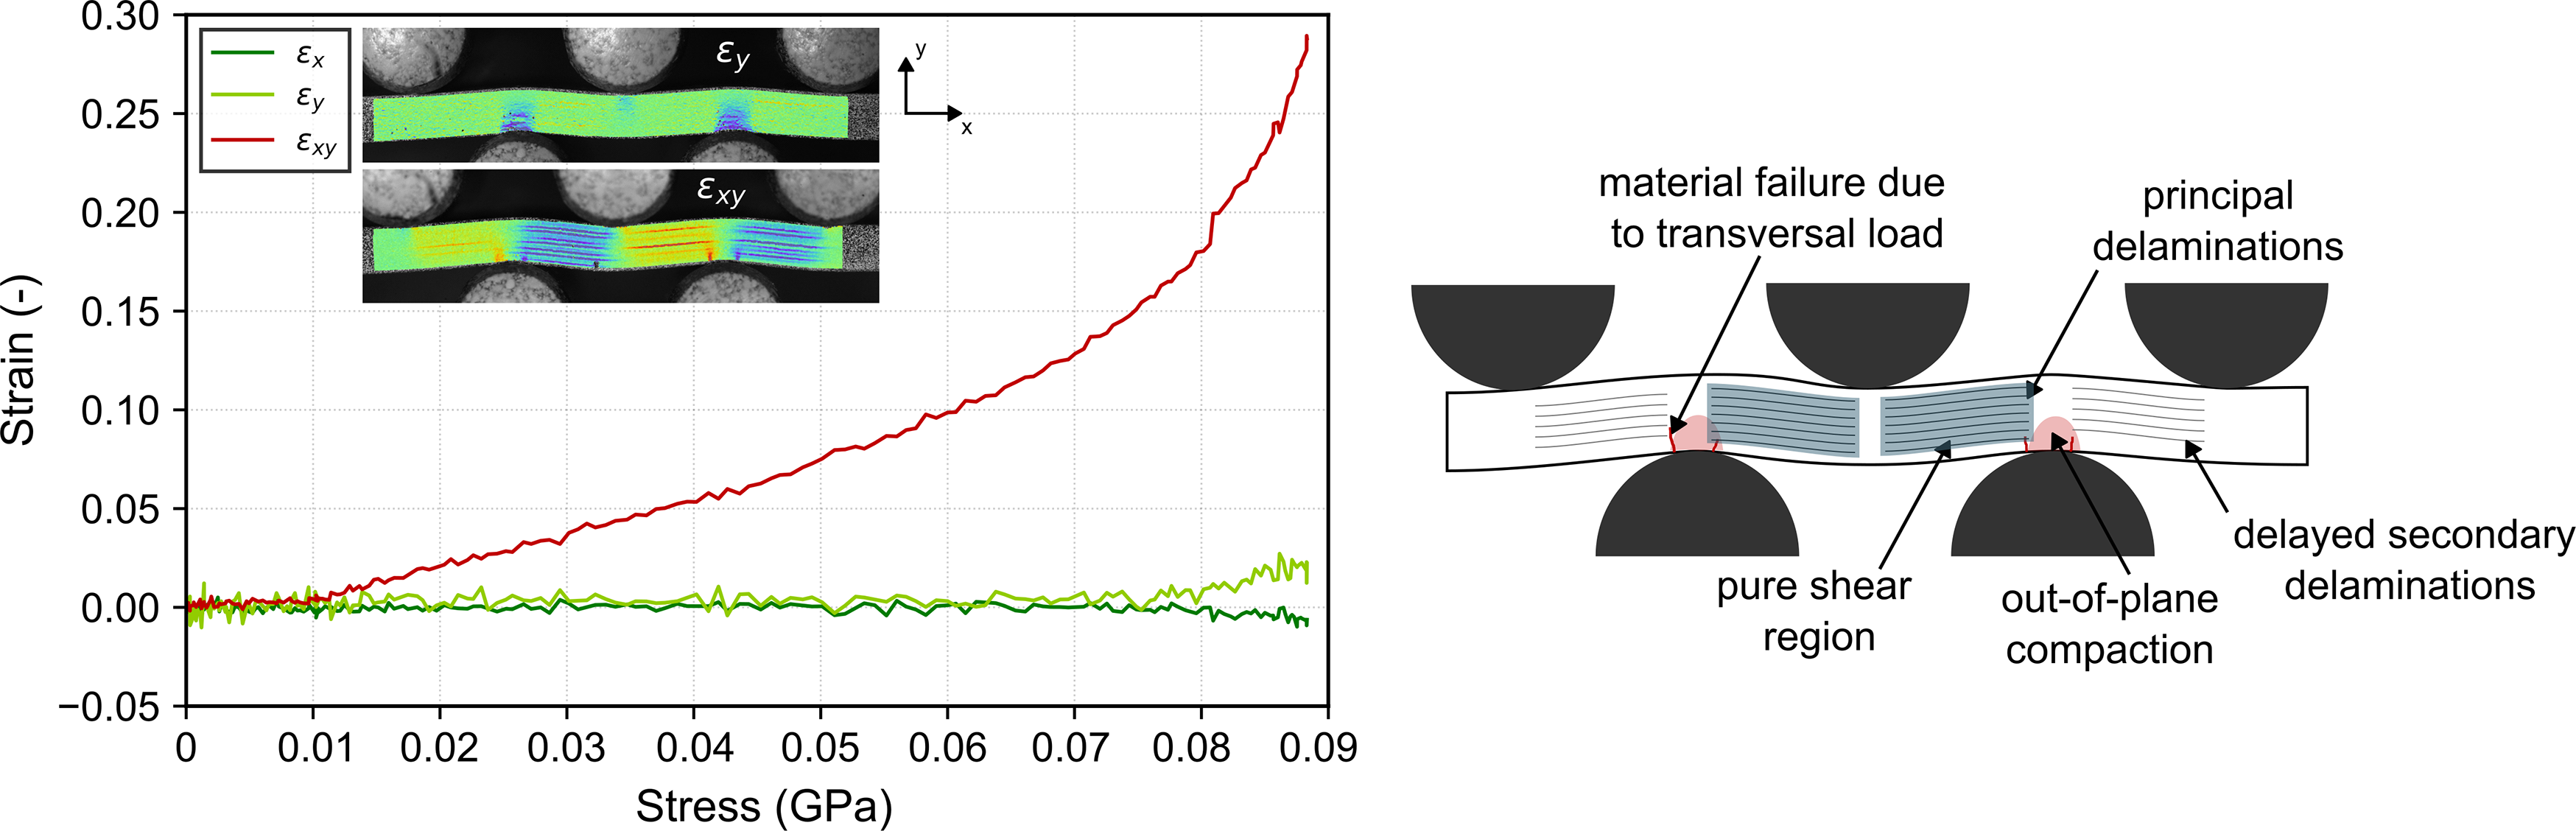
Figure 11 (left) shows the interlaminar shear stress versus interlaminar shear strain curves for samples from both plates tested at room temperature. The curves were cut at the point of total delamination of all layers in the sample. In the plate P1T, the material behaviour is mostly linear up to a shear strain of 0.5% to 1%, followed by a non-linear part up to complete failure. A strong scatter is visible in the linear part, particularly in the case of the plate P3T. This scatter is mostly explained by the presence of defects in the samples, that create an inhomogeneous load introduction in the specimens. The material shows a similar behaviour at all temperatures (Figure 11 right) and the material reaches higher stresses at lower temperatures. Evolution of the average shear stress as a function of the average shear strain in the specimens tested at room temperature for both plates (left) and at various temperatures for the plate P3T (right); for purpose of clarity, only the mean curves are plotted at each temperature.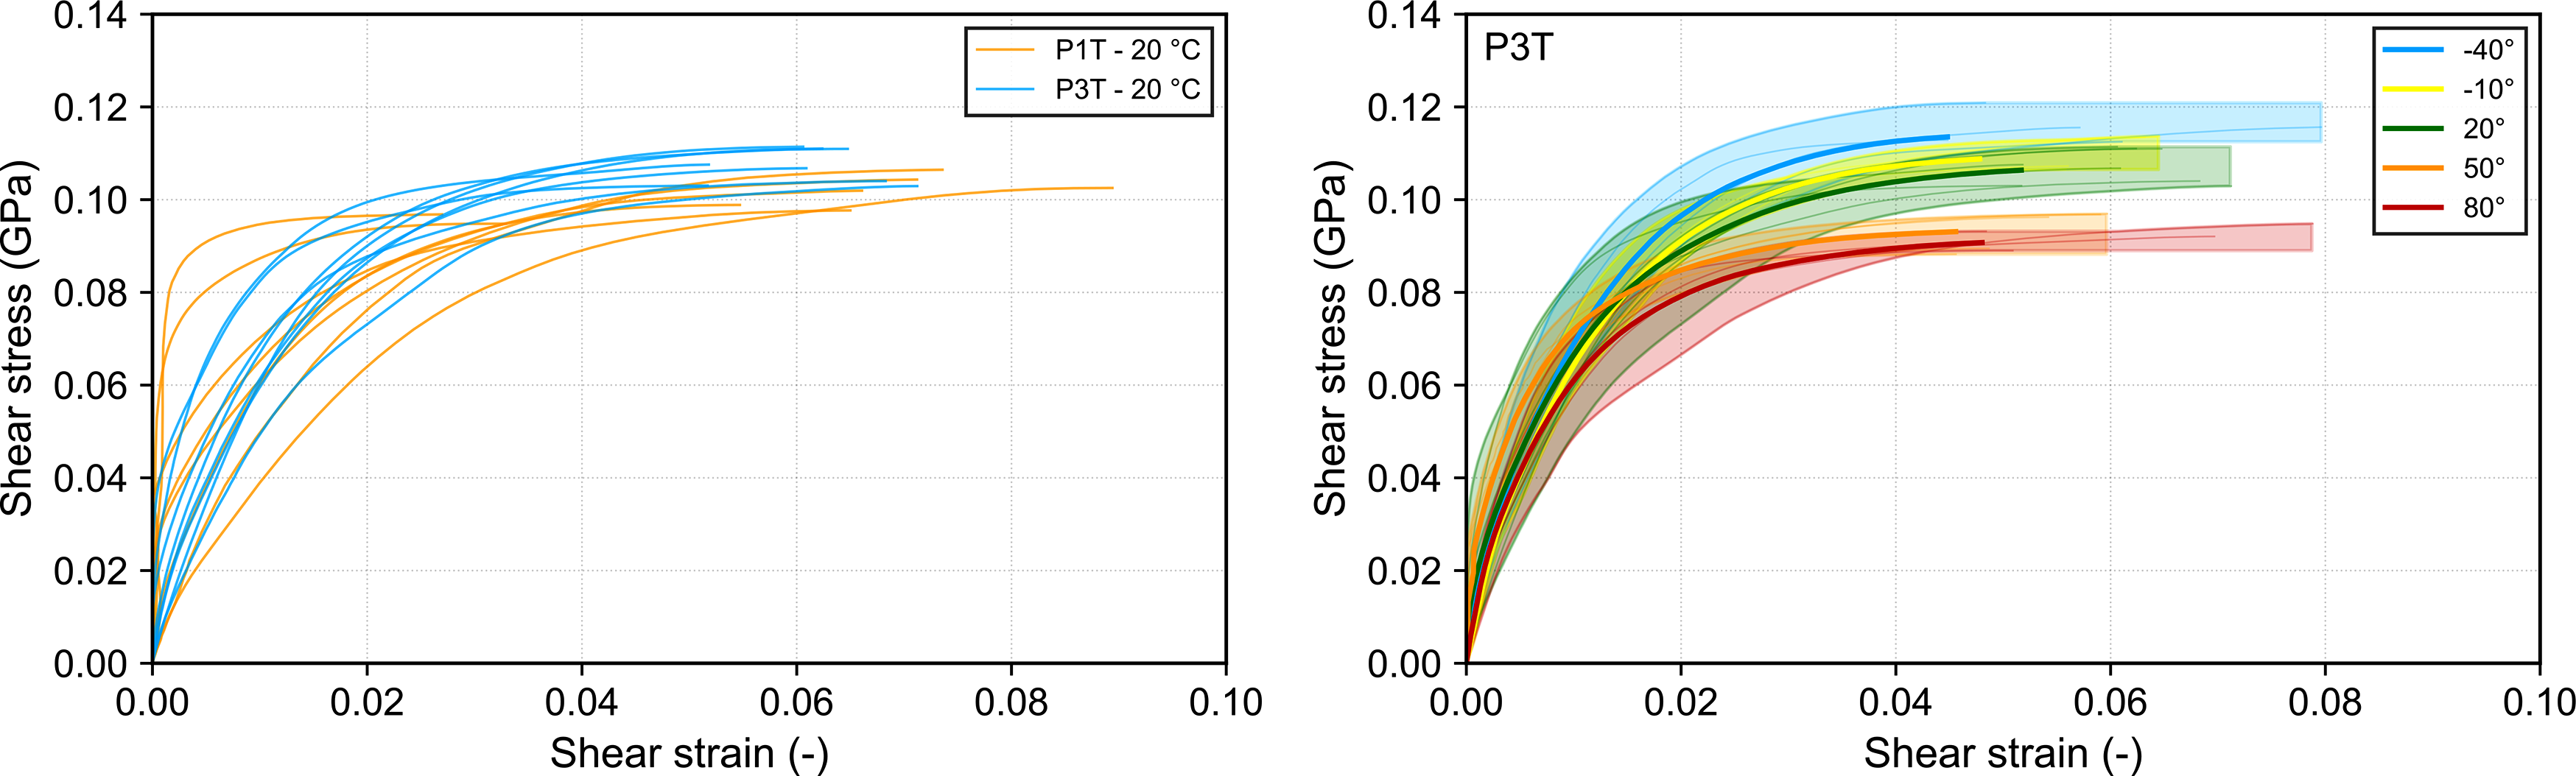
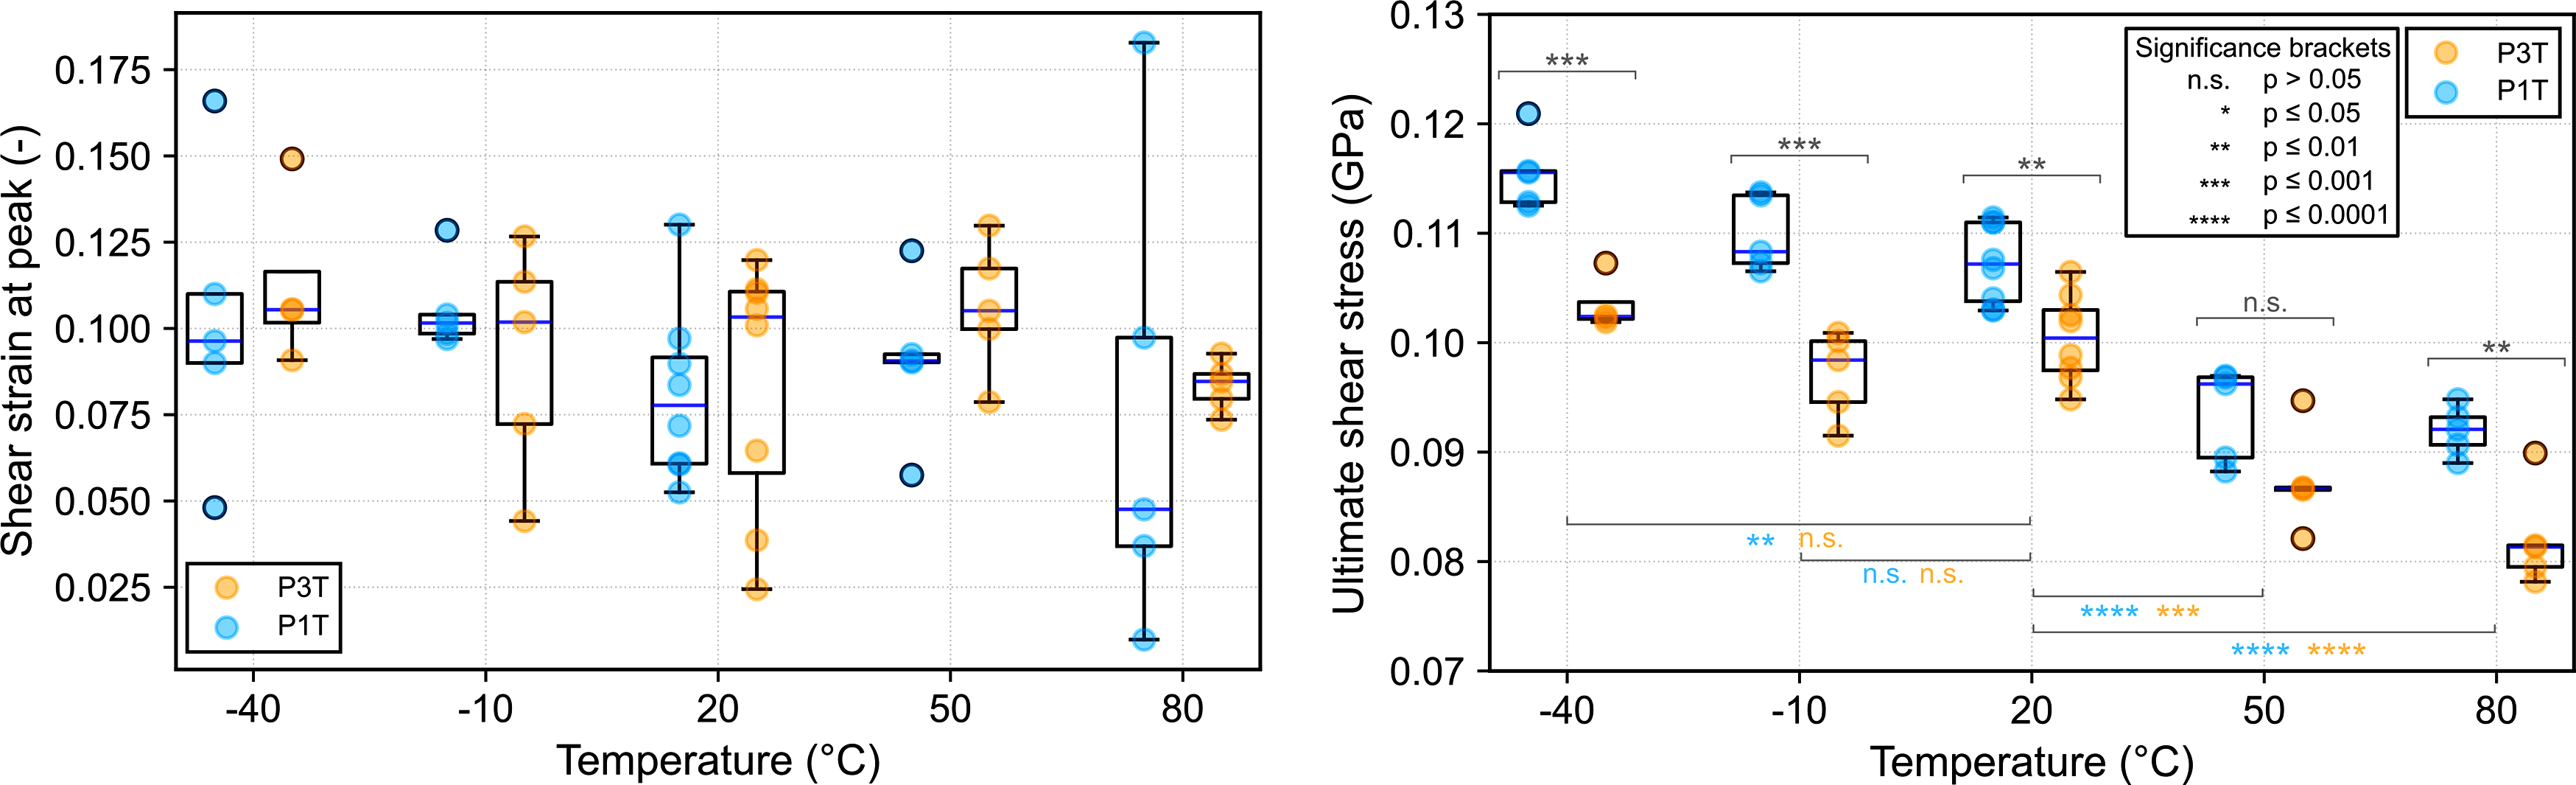
The evolution of the shear strain and stresses at initiation of delamination and at total failure are presented in Figures 12 and 13 respectively. The statistical significance is represented additionally on the graphics to give an insight into the significance of a comparison between the results. Overall, the estimation of ILSS at failure has a lower variance than for the ILSS at first delamination. This effect is observed on the significance levels, which are lower for the ultimate values. The significance levels for the strain values are all above the limit of 0.05 and for purpose of clarity, their significance brackets are not represented in the graphics. The CF/LM-PAEK composite shows a strong temperature dependency in both domains of positive and negative temperatures, consolidating observations from literature. Between −40°C and 80°C, the stress at first delamination is reduced by 36% for the plate P1T. The same tendency is observed for the stress at complete failure, albeit with a less severe drop of 20%. The plate P3T follows a slightly different pattern and the effect of temperature on the point of first delamination is not clear at lower temperatures. The ILSS values drop by 22% between the two extreme temperatures. Regarding the strains at initiation and failure, no clear correlation can be determined and the concerned strain values appear to be independent of the temperature in the investigated temperature range. Furthermore, the estimation of the shear strain with the developed method results in a high scatter for some test series, for instance at 20°C for the plate P3T. Potential causes for this effect will be discussed in the discussion part. Temperature dependency of the shear strain (left) and shear stress (right) at initiation of delamination for the two plates. Temperature dependency of the shear strain (left) and shear stress (right) at complete failure for the two plates.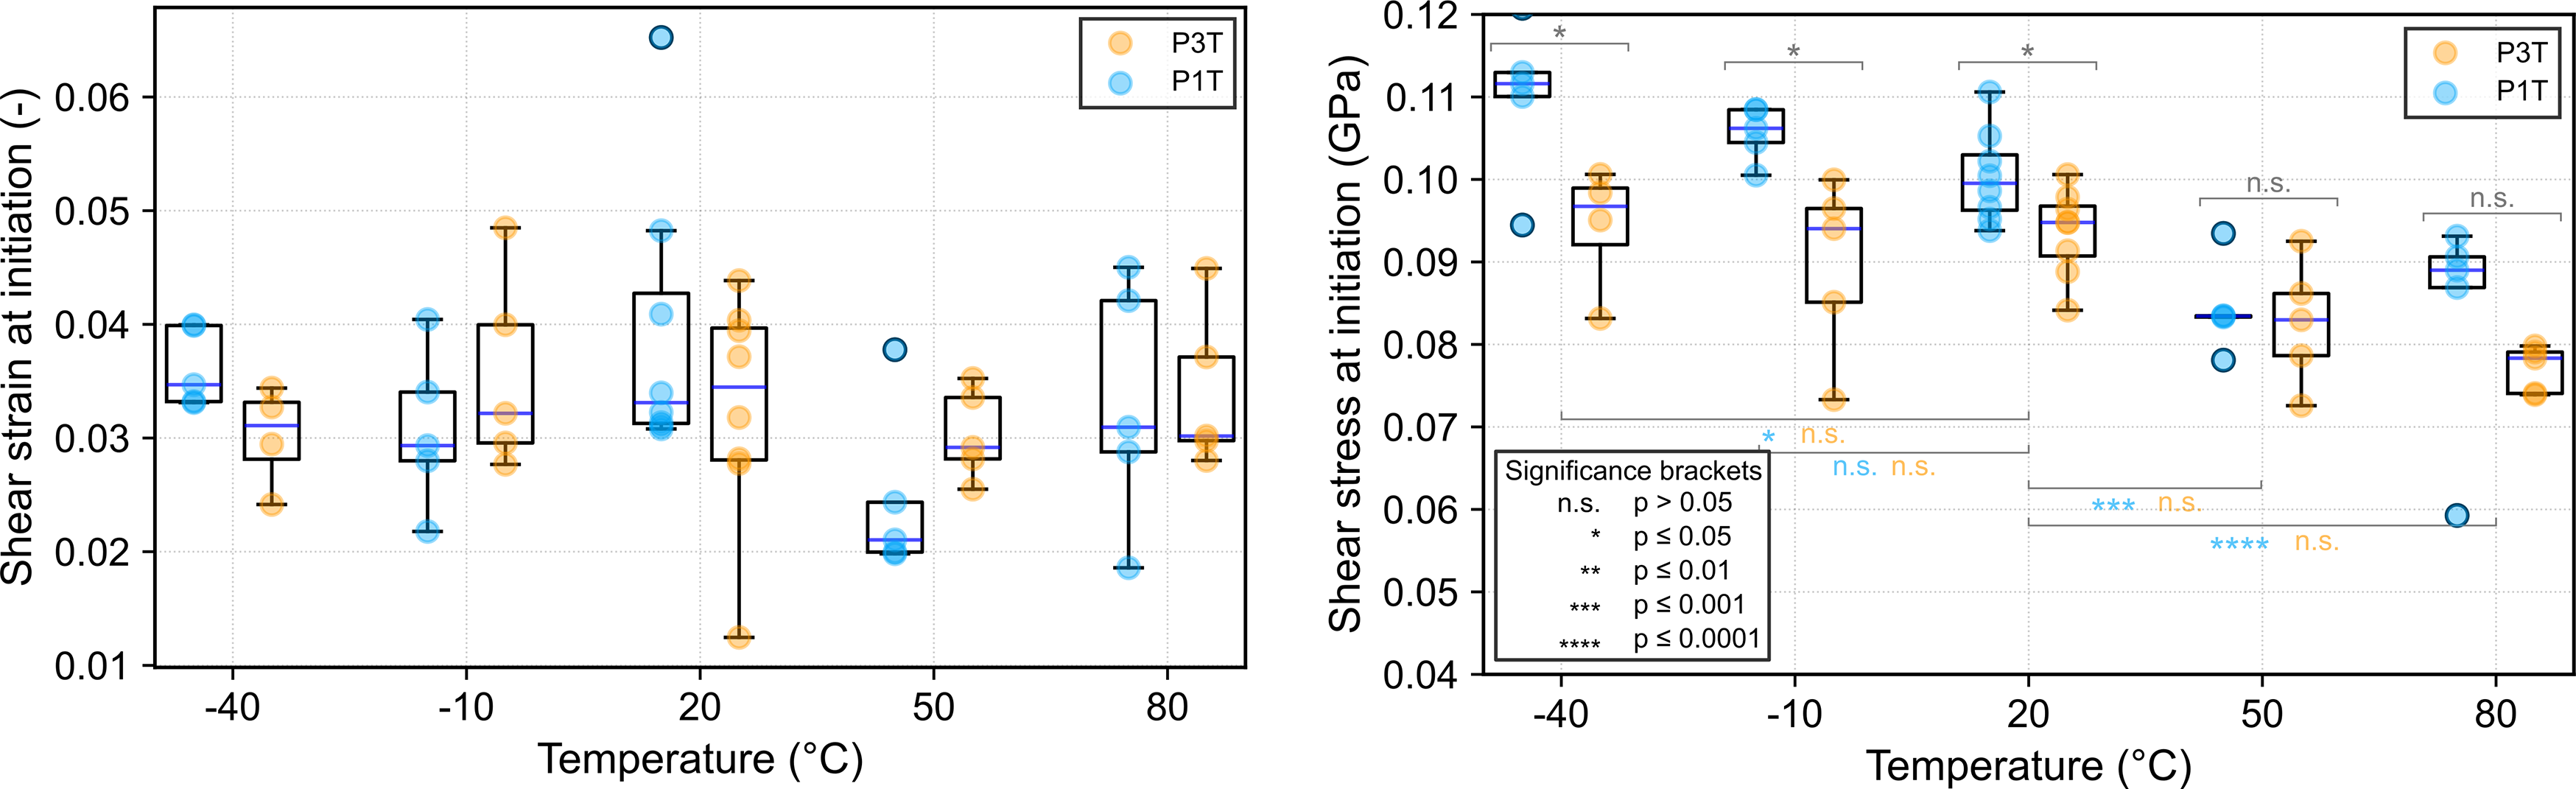
The interlaminar shear modulus is calculated based on the least square method between shear strains of 0.25% and 0.50%. Strong scatters up to more than 25% and 50% is observed for the plate P1T and P3T respectively (Figure 14). The average shear modulus decreases with the temperature by about 20% and 27% for the plates P1T and P3T. It should be noted that the significance level of the plate P3T is not reached and therefore no clearly interpretable tendency can be extracted from the data. Temperature dependency of the shear modulus for the plates P1T and P3T.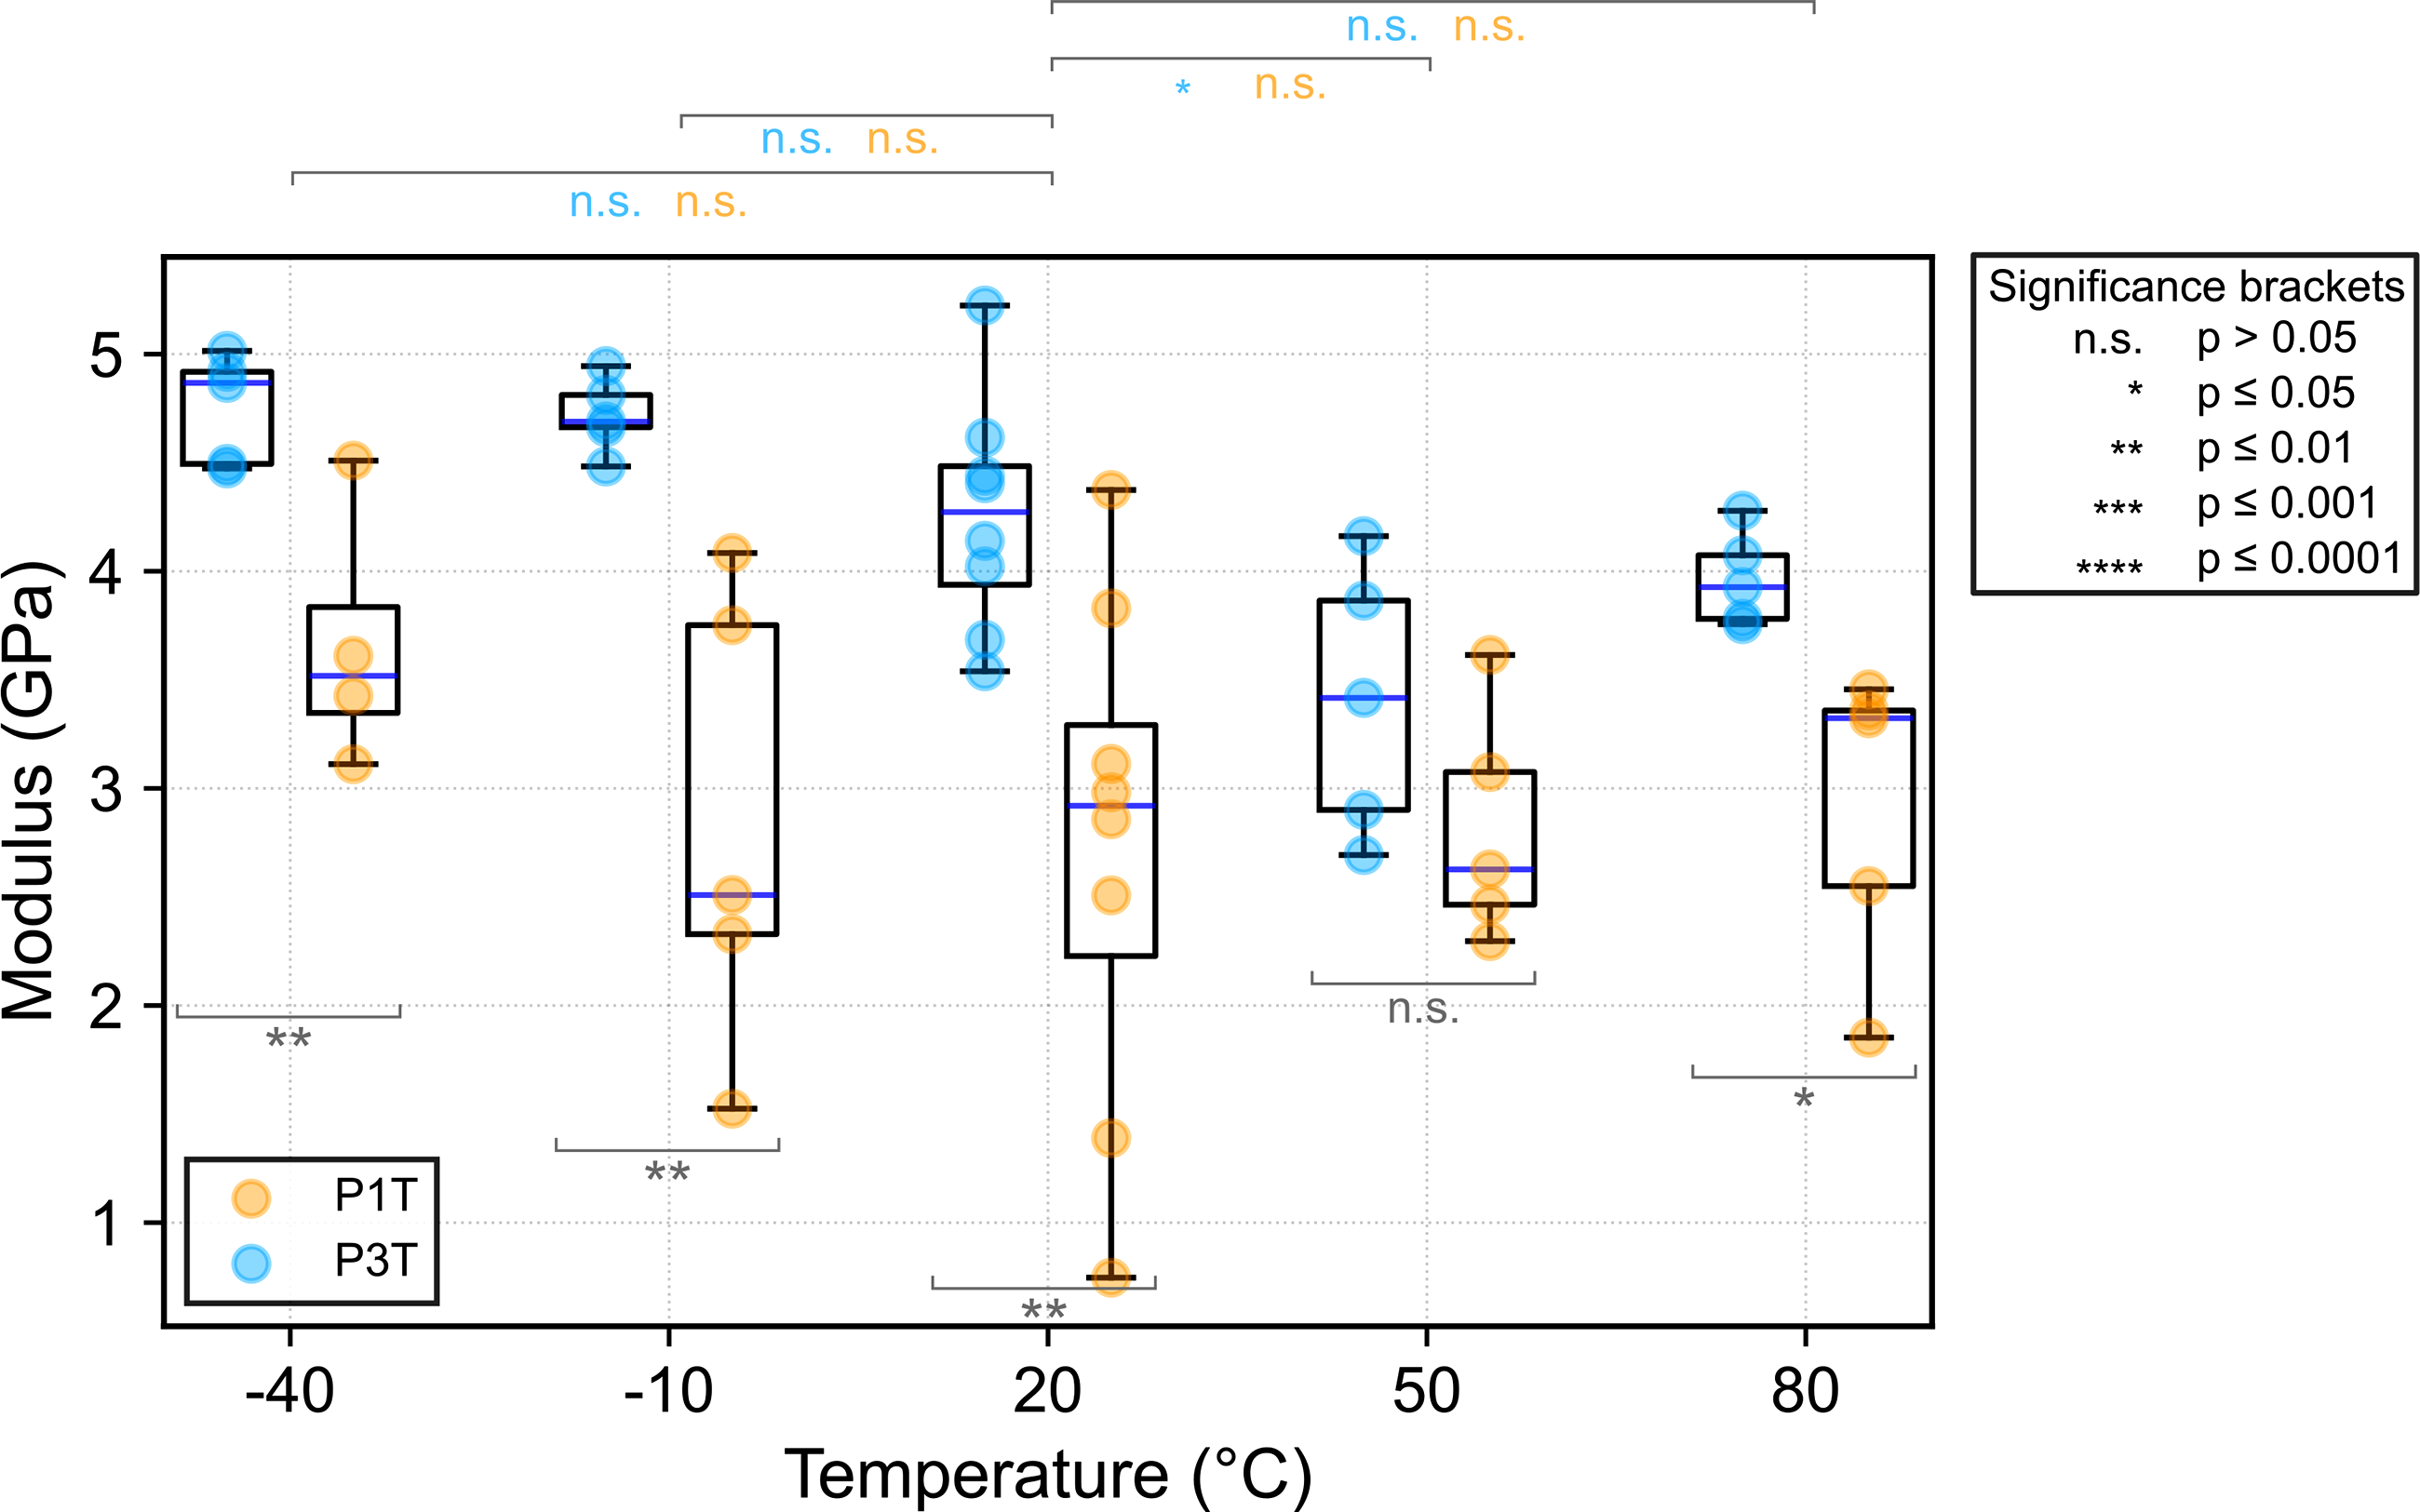
Strain measurement using DIC is prone to uncertainty owing to a potentially inaccurate calibration, to the incorrect recognition of the facets between two images or to perturbation in the image quality. To estimate the systematic error in the calculation of the average strain, the range of uncertainty in strain measurement is plotted in Figure 15 at each temperature separately on the example of the plate P1T. The uncertainty is overall in a tolerable range below 0.01% strain for all temperatures, thus highlighting the reliability of strain measurement through DIC. In absence of a second approach to validate the strain measurement, the DIC results are considered viable for the present investigation. It should be noted that at temperatures of −10°C and even more of 80°C, the range of uncertainty is particularly high. This larger scatter results from temperature-induced phenomena which lowered the image quality and sharpness, such as slight condensation on the acrylic glass or heat perturbations during the image recording. The further reduction of the measurement uncertainty will require the improvement of the temperature chamber and in particular a better isolation of the observation window with vacuum. Evolution of the uncertainty in the strain measurement with DIC as a function of the average shear strain at different temperatures.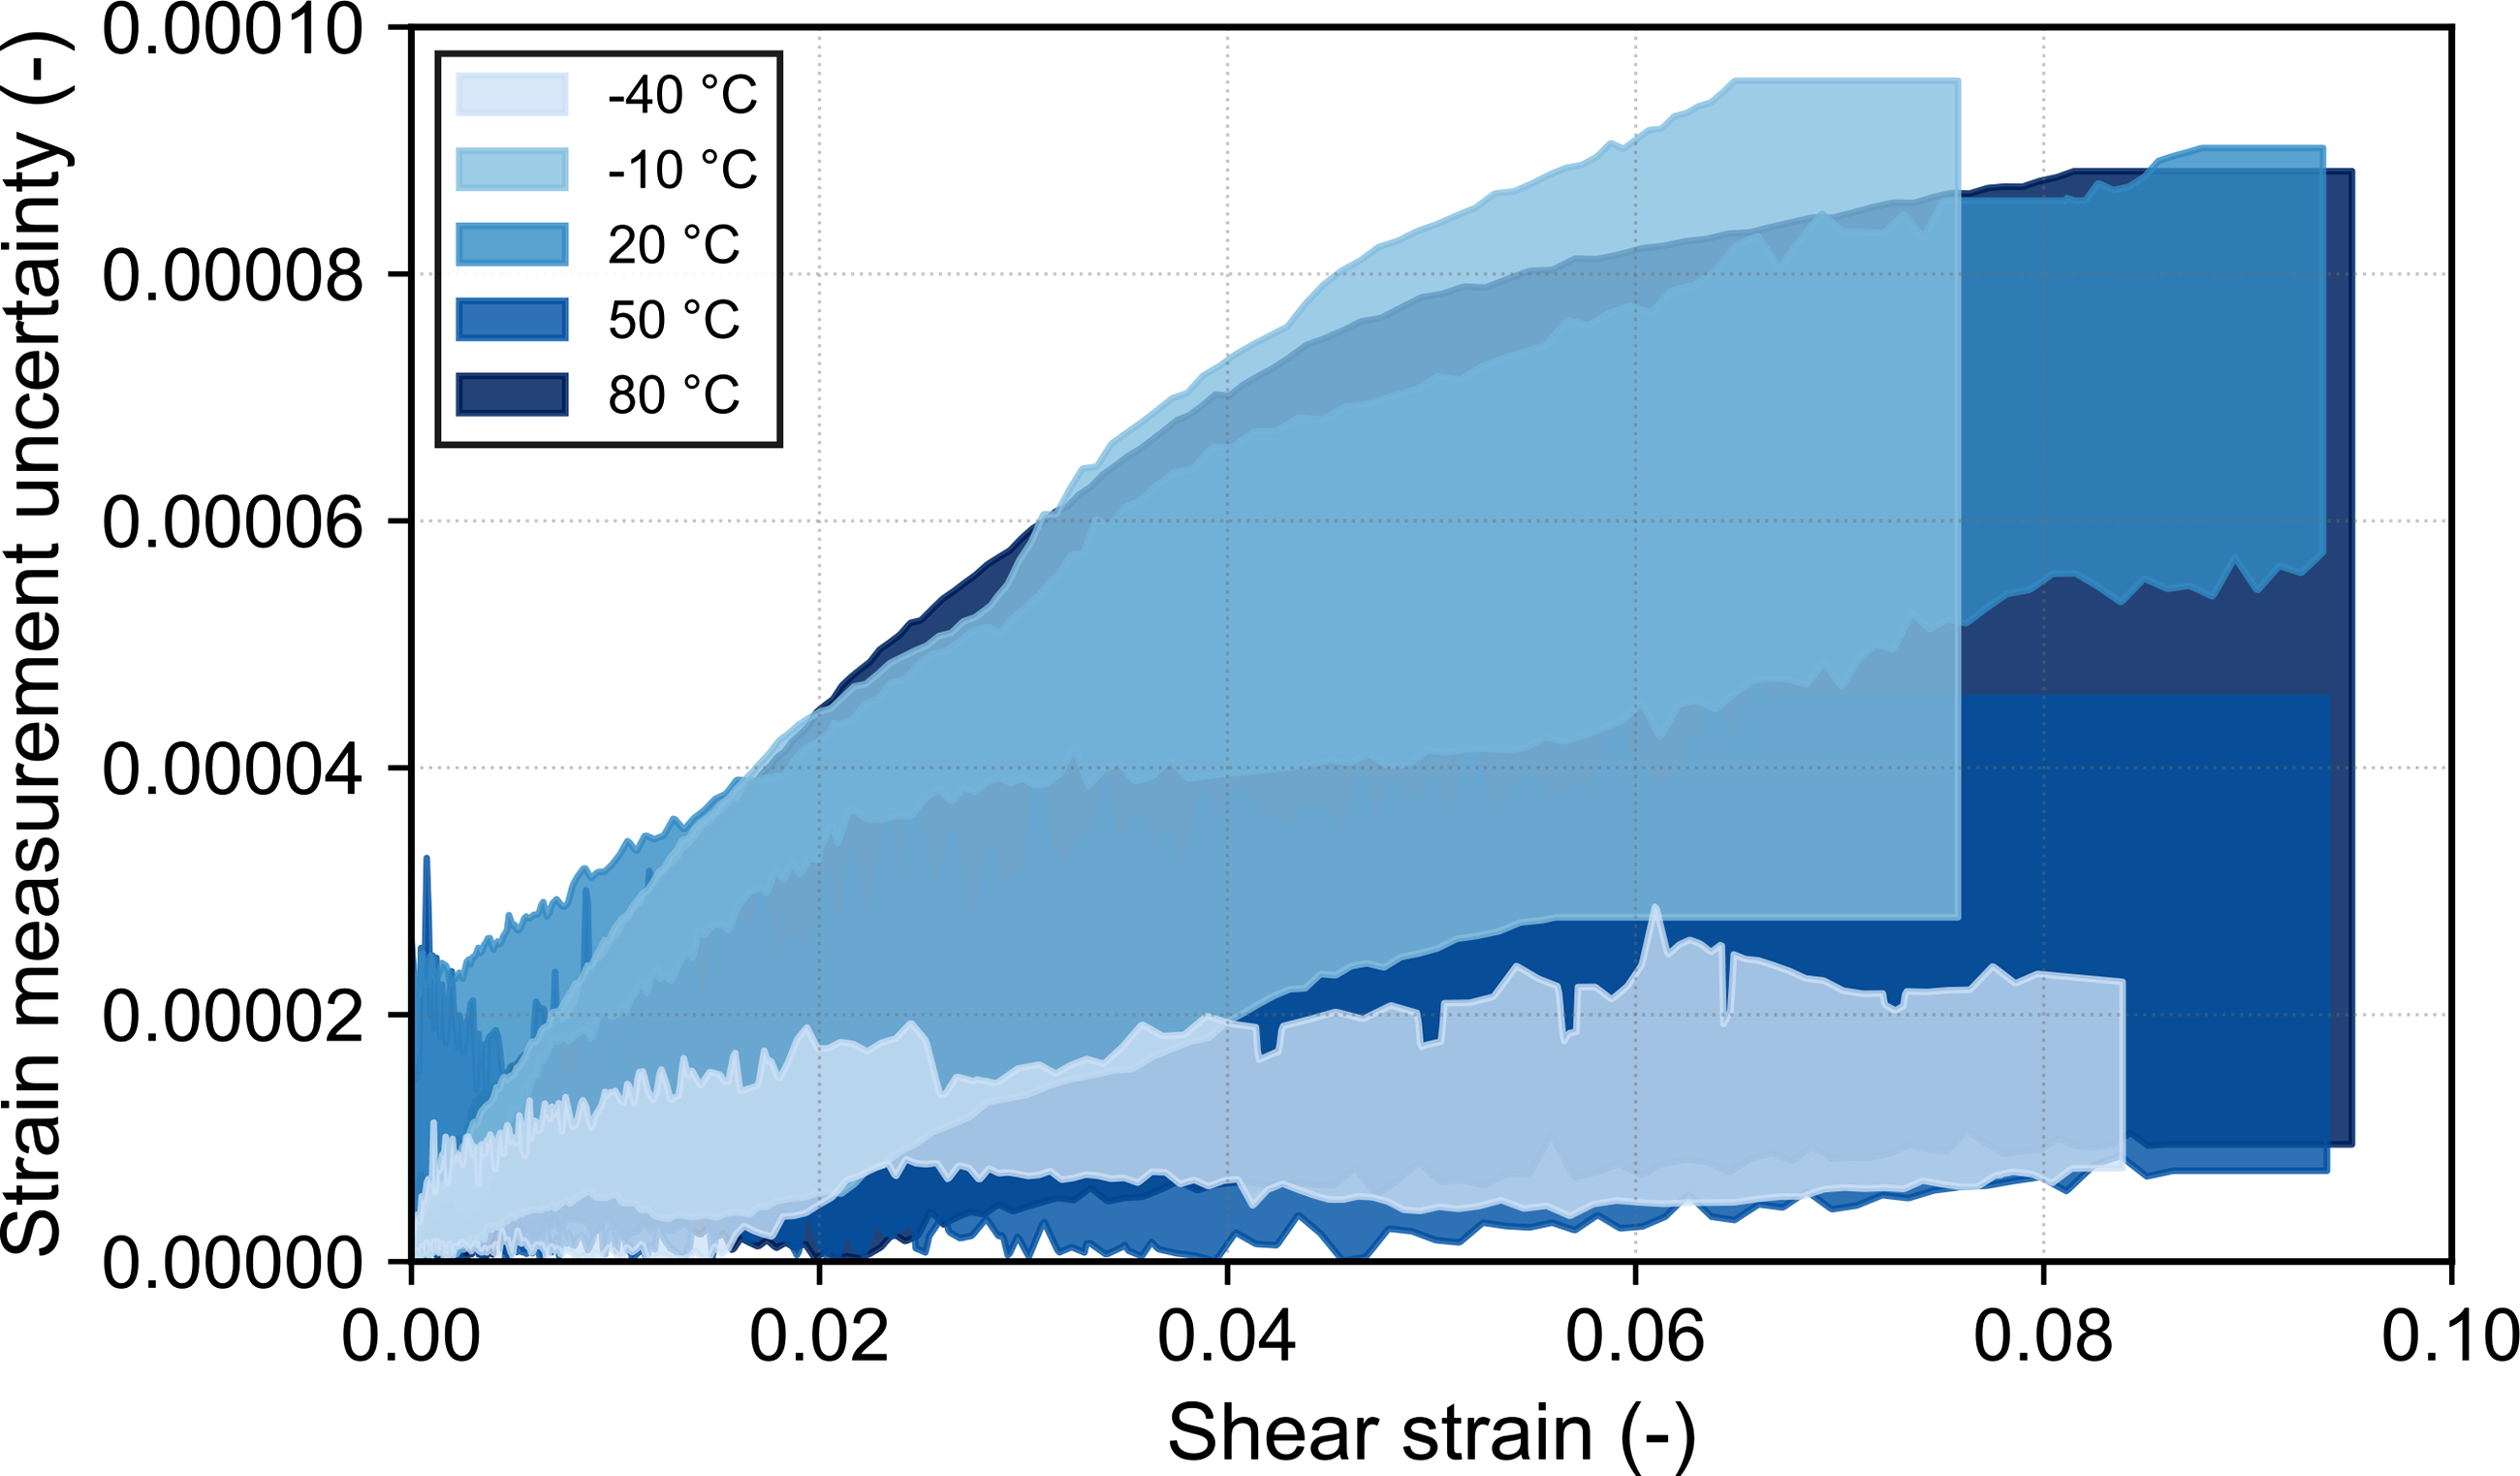
Discussion
This section presents the main outcomes of the test campaign and discusses the relationship between manufacturing, temperature and interlaminar shear properties.
Influence of manufacturing conditions on specimen state
The placement with one tape exhibited considerably fewer gap defects as interpreted by the combination of microscopy (Figure 6), ultrasonic scanning (Figure 7) and profilometry (Figure 8). However, the precise cause for increased gap defects when applying multiple tapes simultaneously is difficult to ascertain. For the two plates, the AFP facility used an assumed consolidated tape widths to plan and execute the layup of tows within a given ply. For the P1T and P3T plates, these values were set to 13.8 mm and 41.7 mm respectively. While these values appear proportional at first glance, the assumed width for the P3T plate is in fact 0.3 mm larger than for the P1T plate. Given the relatively tight tolerances of the prepreg width and robot positioning of 0.1 mm to 0.2 mm, it is highly likely that the increased presence of gaps in the P3T results from an overestimated consolidated width. With the information at hand, it is however not possible to account for all other potential error sources. For the purpose of this investigation, the statement can simply be made that multi-tape AFP resulted in an increased occurrence of parallel gaps compared to single-tape AFP.
The micrography analysis did not show strong dissimilarities between the two plates and the average fibre volume content was in the range of 52% to 53%. This result could be expected since the thickness of the plates P3T and P1T has a mean value of 2.29 mm and 2.20 mm respectively. By looking more closely to local variations of the fibre volume content, it can be noted that the plate P3T presented higher fluctuations with local values of 25% up to more than 60%. The attenuation of these fluctuation in the plate P1T could result from a more homogenous and gap-free layer compaction as indicated by the reduced size of the ply-to-ply region-rich interfaces. The strong reduction of the mean porosity by half (Figure 4) contributes to the uniformization of the local fibre volume content as well.
The measured distributions of the fibre diameter and inter-fibre distance presented no strong deviation between the two plates and the observed shift might have resulted from limitations in the measurement technique and accuracy. Finally, samples from the plate P3T present strong waviness of their top surface with variation up to one tenth of the total thickness.
Influence of manufacturing conditions on the ILSS
As previously discussed, the P1T and P3T plates differed in their number of parallel gaps and in their surface waviness. The higher density of gaps and the higher surface waviness in the P3T plate resulted in non-uniform cross-sections of the P3T samples, which can lead to local stress concentrations under five-point bending. Furthermore, gaps in unidirectional samples can result in lower local fibre volume contents as the fibre into the gaps during the material deposition. This combined variation of the sample cross-section and of the local fibre volume content may have been responsible for the increased deviation in ILSS values observed in Figures 12 and 13.
Influence of the testing temperature on the ILSS
The temperature dependency of neat thermoplastic materials or thermoplastic composites based on PAEK or PEEK has already been documented in literature on the specific case of compression loading35,36 and tension loading. 37 In each study, a decrease of both material stiffness and strength with increasing temperature has been observed. Tang et al. performed quasi-static tensile tests on PEEK neat resin and measured a drop of the yield strength by about 40% from −30°C to 100°C, while the failure strain was maximal at room temperature and dropped by increasing and decreasing the test temperature.
The decrease of the neat resin strength with increasing temperature correlates well with the measurements in Figure 12 right and Figure 13 right. The corresponding drop of the ILSS results from the reduction of the shear strength of the PAEK resin present at the layer’s interface. The difference of the ILSS between the samples from the plate P3T and P1T results partially from the difficulty in introducing a uniform shear loading in the sample. For samples with high surface waviness, the loading is only applied on a portion of the sample, thus resulting to a potential drop of the reaction force and as a consequence to the measured ILSS values.
Potential and limitations of the double beam shear test coupled to DIC measurement
The DBS test is a practical way of measuring the ILSS of composite materials with low manufacturing and test effort. Indeed, the sample geometry allows for material savings and the DBS test does not require extensive sample preparation in contrast to notched specimens. It was shown in this study that the DBS approach resulted to a pure shear stress state in the measurement regions between the cylindrical supports. This stress state represents an improvement compared to the three-point bending test. However, the DBS approach still shows some limitations for relatively ductile thermoplastic materials and unwanted compressive or crushing stresses occur in the load introduction regions and lead to the formation of a shear band. The material damaging resulting from this loading is situated outside the delamination area and should not disturb the measurement of the ILSS. According to the DIN EN ISO 19927, these two local effects named “case 2” and “case 3” in the standard are acceptable. Overall, the results of the DBS tests on samples with a high production quality show a good reproducibility and the standard deviation for the ILSS is limited to a maximum of 10 % for the plate P1T all temperatures considered. The calculation of the interlaminar shear modulus with the developed technique using DIC measurement presents a standard deviation of 13% for the tests at 20°C, which depicts the potential of this approach.
However, the simplicity of the DBS test increases the sensitivity of the results to the sample quality and to manufacturing effects. In the present study, a direct correlation has been observed between test results with a strong standard deviation (shear modulus or delayed initiation of delamination) and the surface unevenness. Increased thickness variations (see Figure 9) lead to the asymmetric introduction of the loading via the supports. This effect correlates with the curves from Figure 11 possessing a high slope in the first linear part of the stress versus strain curves.
The strain measurement with virtual strain gauges in DIC was strongly influenced by the surface quality of the samples as depicted in Figure 16. For samples with significant surface waviness, the shear strain in one of the investigated main regions only started to increase at high machine displacement relatively to the specimen thickness. As the total displacement during the DBS test is limited to about 0.5 mm up to failure, the sample planarity takes a major role in the quality of measurement. Finally, the higher ductility of thermoplastic composites leads to secondary compression failure within the DBS samples at the load introduction. While this perturbation remains outside the area of the virtual strain gages, its influence on the load path cannot be discarded. Asymmetric load introduction in a DBS sample from the plate P3T at room temperature.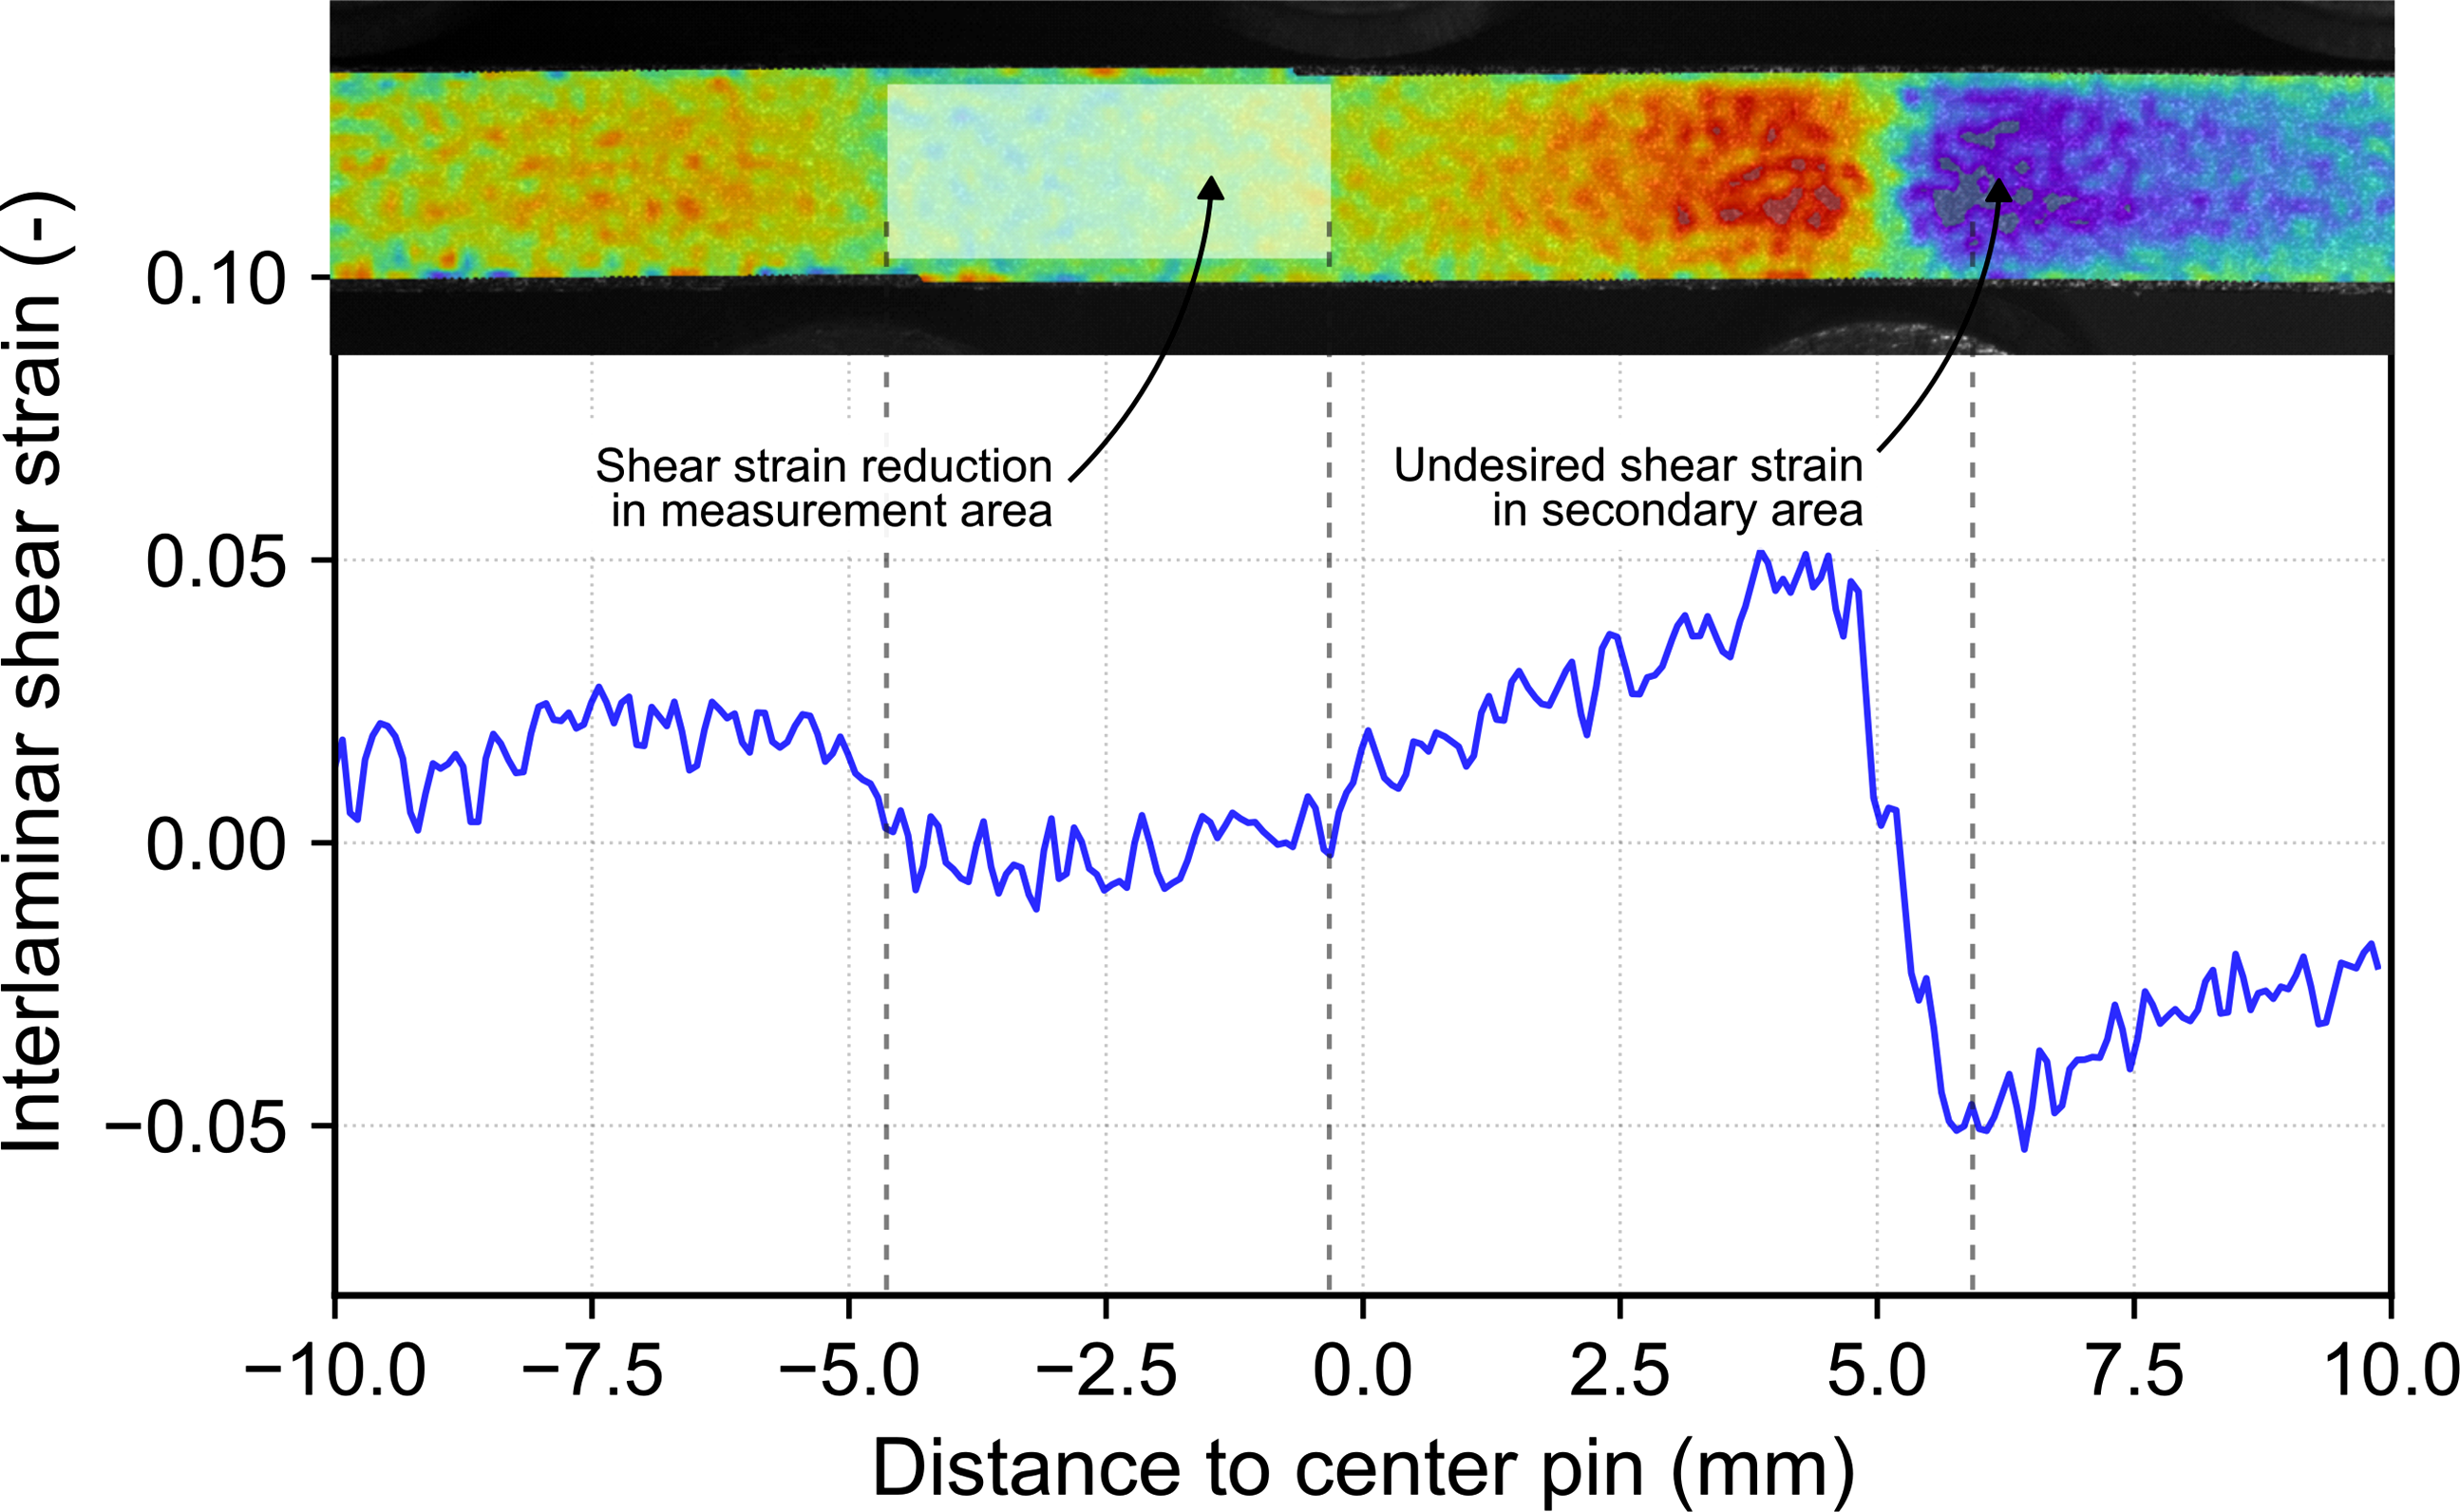
Conclusion and outlook
In this work, the interlaminar shear properties of thermoplastic unidirectional composite specimens manufactured from CF/LM-PAEK and using the Automated Fibre Placement technique were measured using double-beam shear tests under various environment temperatures of −40°C, −10°C, 20°C, 50°C and 80°C. The developed measurement chain was based on digital image correlation to measure the strain field in the specimen and estimate the strain at the initiation of delamination and at peak stress. The measured mechanical properties were further correlated with extensive investigations of the material plates based on micrography, 3D scans and ultrasonic-scans.
The investigation showed a clear drop of the ILSS and of the interlaminar shear modulus at increasing temperature. On the contrary, the strain at the first delamination and at total failure remained constant over this temperature range, although this conclusion still has to be validated due to the scatter higher than 10% in the test results. Additionally, a significant improvement of the interlaminar mechanical properties up to 10% was achieved through the investigated temperature range by reducing the number of tapes placed at once in the AFP process. Within the investigated test samples, the placement of several tapes simultaneously, while accelerating the manufacturing, increased the number of defects in the produced plates significantly and impacted negatively the interlaminar mechanical properties. Future work will further analyse the effects of multi-tape layup on in-situ AFP-manufactured specimens.
While the developed test methodology provided reproducible results on defect-free specimens, the quality of the DBS test procedure dropped strongly in presence of internal defects or of a wavy top surface of the specimens. Future work will be undertaken to improve the test accuracy and compensate geometrical defects.
Footnotes
Funding
The authors disclosed receipt of the following financial support for the research, authorship, and/or publication of this article: This work was funded by the German Aerospace Center within the project Proco “Propulsion and Coupling”.
Declaration of conflicting interests
The authors declared no potential conflicts of interest with respect to the research, authorship, and/or publication of this article.
Data Availability Statement
Data sharing not applicable to this article as no datasets were generated or analyzed during the current study.