
Abstract
This study investigates the potential of incorporating CuO and Al nanoplates into a polyvinyl chloride (PVC) matrix to enhance the performance of medium voltage cables. The incorporation of nanoparticles into the PVC insulation material aims to improve the electrical, dielectric, and optical properties of the cable. The nanocomposite films were synthesized by dissolving PVC in tetrahydrofuran (THF) solvent and adding a mixture of 5 wt% CuO and Al nanoparticles. Fourier-transform infrared spectroscopy (FTIR) analysis confirmed the successful incorporation of the nanoparticles into the PVC matrix. The optical properties of the PVC/AlNPs and PVC/CuONPs + AlNPs nanocomposite films were characterized, revealing a decrease in band gap energy (4.35 eV) and Urbach tail energy (0.3702 eV) for the PVC/CuONPs + AlNPs film compared to the PVC/AlNPs film (4.5 eV and 0.41816 eV, respectively). Additionally, the PVC/CuONPs + AlNPs film exhibited higher absorption coefficients and increased electron delocalization and conjugation (carbon cluster value of 62.53). The dielectric properties of the CuONPs + AlNPs nanocomposites were investigated, with the sample containing 1.5% AlNPs demonstrating the highest AC conductivity (2.029 × 10⁻³ S/m), dielectric constant, and dielectric loss across the frequency range. Simulations of electric field distribution revealed that the PVC/CuONPs+1.5% AlNPs nanocomposite cable exhibited a more uniform electric field distribution compared to the PVC market cable, contributing to a reduction in electrostatic tension and a relative permittivity increase from 2.25 to 2.35. The electric potential distribution along the cable radius remained similar for both cable samples. These findings demonstrate the potential of nanocomposite insulation materials in enhancing the performance of medium voltage cables, paving the way for improved reliability, longevity, and efficiency.
Keywords
Introduction
Medium voltage cables play a crucial role in transmitting electrical energy over long distances, serving as the backbone of power distribution systems. 1 These cables typically operate at voltages ranging from 1 kV to 35 kV and are widely used in various applications,2–4 such as underground power transmission, 5 industrial facilities, 6 and commercial buildings. 7 The insulation material used in these cables is a critical component that determines their performance, 8 reliability, 9 and longevity.10–13 Polyvinyl chloride (PVC) has been a widely used14–16 insulation material for medium voltage cables due to its excellent electrical insulation properties,17–20 mechanical strength,21–23 and cost-effectiveness.24–26 It has been successfully employed in power distribution systems for many years, providing reliable insulation and protection for electrical conductors.27–31 However, with the increasing demand for higher performance and more efficient power distribution systems, there is a need to enhance the properties of PVC insulation to meet the evolving requirements.32–36 One promising approach to improving the performance of PVC insulation is the incorporation of nanoparticles into the polymer matrix,37–39 forming nanocomposite materials.40–42 Nanocomposites are composite materials where nanoparticles (particles with dimensions in the nanometer range) are dispersed within a polymer matrix.43–48 The addition of nanoparticles can significantly alter the properties of the polymer, 49 leading to enhanced mechanical, 50 electrical,51,52 thermal, 53 and barrier properties. 54 In recent years, there has been growing interest in developing nanocomposite materials for various applications,55,56 including insulation materials for medium voltage cables.2,57 The unique properties exhibited by nanoparticles, such as high aspect ratios, 58 large surface areas, 59 and quantum confinement effects, 60 make them attractive candidates for enhancing the performance of insulation materials. 61 By incorporating nanoparticles into PVC insulation, it is possible to achieve improvements in key properties such as electrical breakdown strength, 62 thermal conductivity, 63 flame resistance, 64 and mechanical strength. 65 One of the commonly used nanoparticles in nanocomposite materials is copper oxide (CuO).66–69 CuO nanoparticles possess excellent electrical properties, such as high electrical conductivity and low dielectric loss, which can contribute to improving the electrical insulation performance of medium voltage cables.70–72 Additionally, CuO nanoparticles have been reported to exhibit antimicrobial properties, which can help mitigate the growth of microorganisms on the cable surface, reducing the risk of cable degradation and failure. 73 Another nanoparticle that shows promise for enhancing PVC insulation is aluminum (Al) nanoparticles. 74 Al nanoparticles have been recognized for their high thermal conductivity, which can aid in dissipating heat generated during cable operation, thereby reducing temperature rise and improving the cable’s thermal stability. 75 Furthermore, Al nanoparticles can offer mechanical reinforcement to the polymer matrix, enhancing the overall mechanical strength and durability of the insulation material. 76 The synthesis and incorporation of CuO and Al nanoparticles into PVC insulation require careful attention to the preparation methods, dispersion techniques, and nanoparticle-polymer interactions.77–79 Various synthesis methods, such as chemical precipitation, 80 sol-gel, 81 and thermal decomposition, 82 can be employed to produce well-dispersed nanoparticles with controlled sizes and properties. Additionally, surface modification techniques can be utilized to improve the compatibility between the nanoparticles and the PVC matrix, 83 ensuring uniform dispersion and strong interfacial adhesion. 84 The introduction of nanocomposite materials for medium voltage cable insulation holds great potential for enhancing the performance and reliability of power distribution systems. 85 By tailoring the properties of PVC insulation through the incorporation of nanoparticles, it is possible to develop insulation materials with improved electrical, thermal, mechanical, and flame resistance properties. 86 These advancements can lead to more efficient power transmission, 87 reduced energy losses, 88 increased system reliability, 89 and extended cable service life . 90 In this study, we aim to investigate the synthesis and characterization of PVC nanocomposite materials incorporating CuO and Al nanoparticles for medium voltage cable insulation. We will explore the effects of nanoparticle loading, dispersion techniques, and surface modification on the electrical, thermal, and mechanical properties of the nanocomposites. The obtained results will provide valuable insights into the potential of nanocomposite materials for enhancing the performance of medium voltage cable insulation and contribute to the development of more advanced and efficient power distribution systems.
Experimental
Materials
Poly (vinyl chloride) (PVC) was acquired from the local market. It’s noteworthy that all reagents were utilized in their as-received state without undergoing any additional purification processes. The number-average molecular weight (Mwt) of polyvinyl chloride (PVC) is 21,150 g/mol. Copper (II) nitrate (Cu(NO3)2), Ammonium hydroxide (NH4OH) with concentration of 30 wt%, Aluminum chloride (AlCl3), Sodium borohydride (NaBH4) and Ethanol with purity of 99 % were supplied from Sigma Aldrich Co. All reagents were used as received without further purification.
Synthesis of CuO Nanoparticles
CuO nanoparticles can be synthesized using various methods, such as chemical precipitation, sol-gel, hydrothermal, or thermal decomposition. A commonly used method is the chemical precipitation technique, which involves the following steps. Prepare a solution of a copper precursor of 0.5 M copper (II) nitrate (Cu(NO3)2) in deionized water. Prepare a 20wt% solution of ammonium hydroxide (NH4OH) in deionized water. Slowly add the (NH4OH) solution to the copper precursor solution while stirring vigorously. At pH8 the formation of a copper hydroxide precipitate is formed. Heat the reaction mixture to a specific temperature (typically around 60°C–80°C) and maintain it for a certain duration (usually several hours) to facilitate the conversion of copper hydroxide to CuO nanoparticles. Centrifuge or filter the mixture to collect the CuO nanoparticles. Wash the collected nanoparticles with deionized water or a suitable solvent to remove any impurities or unreacted precursors. Dry the CuO nanoparticles in an oven or under a vacuum to obtain the final product.
Synthesis of Al Nanoparticles
Aluminum (Al) nanoparticles can be synthesized using various physical and chemical methods, such as inert gas condensation, laser ablation, or solution-based reduction techniques. One common method is the reduction of aluminum salts using a reducing agent, which can be carried out as follows. Prepare a solution of an aluminum precursor of 0.5 M aluminum chloride (AlCl3) in deionized water. A reducing agent, such as sodium borohydride (NaBH4) dissolved in a deionized water/ethanol mixture. Slowly add the reducing agent solution to the aluminum precursor solution while stirring vigorously and keep the mixture in stand for 48 h while adding the reducing agent for some time. This will cause the reduction of the aluminum ions and the formation of aluminum nanoparticles. Maintain the reaction mixture at a specific temperature of 70°C for a certain duration to ensure complete reduction and nanoparticle formation. Centrifuge or filter the mixture to collect the Al nanoparticles. Wash the collected nanoparticles with deionized water and ethanol several times to remove any impurities or unreacted precursors. Dry the Al nanoparticles in an inert atmosphere (e.g., nitrogen) and kept under a vacuum to prevent oxidation and obtain the final product.
Preparation of PVC/CuO/Al Nanocomposite Film
Dissolve 5 gm of PVC (polyvinyl chloride) in THF (tetrahydrofuran) solvent to form a homogeneous solution. Prepare a mixture of CuO (copper oxide) nanoparticles and Al (aluminum) nanoparticles in a specific ratio (e.g., 5 wt% of the total PVC weight) with different concentrations of AlNPs (0%, 0.5%, 1.0%, and 1.5%). Then, the mixture of CuO and Al nanoparticles in the PVC solution was stirred thoroughly to ensure uniform dispersion. Cast the PVC solution containing the dispersed CuO and Al nanoparticles onto a suitable substrate (Petri dish). Allow the solvent (THF) to evaporate, leaving behind a thin film of the PVC/CuO/Al nanocomposite on the substrate. Ensure complete drying of the film to remove any residual solvent. The resulting PVC/CuO/Al nanocomposite film should contain a uniform dispersion of CuO and Al nanoparticles embedded within the PVC polymer matrix. The nanoparticles are expected to influence the structural, optical, electrical, and dielectric properties of the nanocomposite, as discussed in the document.
Material Characterization
The X-ray diffraction (XRD) patterns and Fourier transform infrared (FT-IR) spectra of the samples were acquired using a LabX XRD-6000 instrument (Shimadzu, Japan) with Cu–Kα radiation (λ = 0.154 nm) in the scattering range (2𝜃) of 4–90°. The XRD analysis provided insights into the crystalline structure of the samples. Additionally, Fourier transform infrared spectroscopy (FT-IR) was performed using a Nicolet 380 spectrometer (Thermo Scientific, USA) within the spectral range of 400–4000 cm−1. This FT-IR analysis allowed for the identification of functional groups and molecular vibrations in the samples. Furthermore, the morphology and structures of the samples were investigated using transmission electron microscopy (TEM) with a JEOL-2010 instrument from Japan, providing detailed information about the nanoscale features and arrangement of the materials. The combination of these analytical techniques offers a comprehensive understanding of the structural and chemical properties of the synthesized materials. The surface morphology of Cu nanoplate has been characterized by utilizing the FE-SEM (Hitachi S-4300, Hitachi, Tokyo, Japan). Before scanning, the samples were sputtered with gold for 5 min In a vacuum evaporator. The Perkin Elmer DSC 4000 was likely used to analyze the thermal behavior of the polyvinyl chloride (PVC), and their blends. The obtained data from the DSC analysis can offer valuable insights into the material’s thermal transitions, aiding in the understanding of its stability and behavior. The UV–visible spectrum of the polymer nanocomposites was obtained using a Shimadzu UV-2401PC UV–visible spectrophotometer in the range of 200–1200 nm. The optical absorbance of the prepared (PVC/PE) Cu nanocomposite was recorded and the direct/indirect energy band gap was evaluated from the UV spectrum. The electrical parameters were examined using a PSM-1735 impedance analyzer under varying temperatures (30°C) and a broad range of frequencies (10 Hz to 35 MHz). All the samples were tested thrice, and the average was calculated. The electric field distribution was studied starting from the copper core to the outer semiconductor layer of the cable. The cable layers were subjected to a constant 2Uo = 15 kV, 50 Hz AC power supply (where Uo is the cable’s rated line to neutral voltage). The electric fields effects were then investigated using COMSOL Multiphysics. As a compression sample in this study, the PVC-marked cable used was a single-core 15 kV shielded underground cable. The copper conductor with a 4.75 mm radius, inner semiconductor of 5.75 mm, insulation of 10.5 mm and outer semiconductor of 11.25 mm are useful layers used in the analysis. All radii have been estimated from the middle of the copper conductor. All the experimental studies in this article are conducted in the Faculty of Science and Humanities - Jubail, Imam Abdulrahman Bin Faisal University, Jubail, Saudi Arabia and the Department of Chemistry, College of Science, Northern Border University (NBU), Arar, Saudi Arabia.
Results and Discussion
XRD Analysis of Al Nanoparticles and CuO/Al Nanocomposite
Figure 1(a) illustrates the powder X-ray Diffraction (XRD) pattern of the samples. The characteristic peaks of Al nanoparticles (AlNPs) at 2θ = 38.19°, 44.44°, 64.80°, and 77.92°, corresponding to Miller indices (1 1 1), (2 0 0), (2 2 0) and (3 1 1) which with agreement of JCPDS data (04–0787).
91
The signal at 2θ = 38.19° relates to the (111) plane with an inter-layer d-spacing of 2.35434 Å. The signal at 2θ = 44.44° relates to the (200) plane with an inter-layer d-spacing of 2.03693 Å.The peak at 2θ = 64.80° corresponds to the (220) crystal plane of Al. The d-spacing for this peak is approximately 1.43747 Å. The peak at 2θ = 77.92° corresponds to the (311) crystal plane of Al. The d-spacing for this peak is approximately 1.22498 Å.
92
The diffractogram of the CuO/Al nanocomposite in Figure 1(b) shows several distinct diffraction peaks at various 2θ values that can be ascribed to different crystal planes of monoclinic CuO and structure of Al nanoparticles. The peaks observed at at 2θ = 38.14°, 43.00°, and 77.07°, correspond to Al nanoparticles.
93
Specifically, The peak at 2θ = 36.11° corresponds to the (002) crystal plane of CuO.
94
The d-spacing for this peak is approximately 2.48539 Å. The signal at 2θ = 38.14° relates to the (111) plane of AlNPs with an inter-layer d-spacing of 2.35711 Å. The peak at 2θ = 41.99° corresponds to the (111) crystal plane of CuO. The d-spacing for this peak is approximately 2.14977 Å. The peak at 2θ = 43.00° corresponds to the (202) crystal plane of AlNPs. The d-spacing for this peak is approximately 2.10141 Å. The peak at 2θ = 50.14° This peak corresponds to the (020) crystal plane of CuO.
95
The d-spacing for this peak is approximately 1.81786 Å. The peak at 2θ = 61.05° corresponds to the (113) crystal plane of CuO. The d-spacing for this peak is approximately 1.51641 Å. The peak at 2θ = 73.20° corresponds to the (222) crystal plane of CuO.
96
The d-spacing for this peak is approximately 1.29195 Å. The peak at 2θ = 77.07° corresponds to the (311) crystal plane of AlNPs. The d-spacing for this peak is approximately 1.23634 Å. The peak at 2θ = 89.64° corresponds to the (040) crystal plane of CuO. The d-spacing for this peak is approximately 1.09277 Å. Using the provided XRD data for both the Al nanoparticles (AlNPs) and the CuO/Al nanocomposite, structural parameters were calculated for each peak of interest. For instance, considering the (111) plane of AlNPs at 2θ = 38.19°, the d-spacing was calculated as approximately 2.35434 Å, and with a Full Width at Half Maximum (FWHM) of, the crystallite size was estimated to be around 17.59 Å, and the average lattice strain, determined using the Williamson-Hall equation, was approximately 22.35. These calculations provide insights into the structural characteristics of the materials, aiding in the understanding of their crystallinity, grain size, and lattice strain. Similar calculations can be performed for other peaks of interest in both the AlNPs and CuO/Al nanocomposite XRD patterns to comprehensively analyze their structural properties. The XRD of (a) AlNPs nanoparticles and (b) CuONPs + AlNPs nanocomposite.
The SEM, EDX and TEM Analysis of CuONPs + AlNPs Nanocomposite
Figure 2(a) show the SEM images of CuONPs + AlNPs, which exhibit the nanoparticles-like nanoplates morphology in almost every region of an image. The surface of as-synthesized CuONPs + AlNPs nanoparticles is very smooth, which facilitates better contact with the polymer chains and hence increases the new physiochemical properties of the PVC blend. (a) SEM image, (b) and (b1) EDX/mapping of the as-prepared CuONPs + AlNPs nanocomposite. (c-e) The TEM image analysis of CuO/Al nanocomposite.
Figure 2(b) and (b1) present the Energy Dispersive Spectrum (EDX) and elemental mapping of a representative CuONPs + AlNPs sample characterized by its distinctive needle-like structure. The EDX spectrum reveals prominent peaks solely attributable to Copper (Cu), Aluminum (Al), and Oxygen (O) elements, attesting to the high purity of the CuONPs + AlNPs nanocomposite. Notably, the absence of other peaks underscores the homogeneity of the sample composition. Intriguingly, the Cu:O atomic ratio, determined from the EDX analysis, is identified as 5:1. This ratio suggests the coexistence of both Cupric Oxide (CuO) and Cuprous Oxide (Cu2O) phases within the nanocomposite. The observed atomic ratio provides crucial information about the oxidation states of copper in the CuONPs + AlNPs structure, indicating the presence of multiple oxidation states, which can significantly influence the material’s properties and functionality. The provided image in Figure 2(d) show the Transmission Electron Microscopy (TEM) micrograph of a CuO/Al nanocomposite material in nanoplate shape. The image shows numerous nanoparticles dispersed throughout the material. These nanoparticles appear to have different sizes and shapes, ranging from spherical to more elongated or irregular morphologies. The nanoparticles are shown to be embedded in a mix of two nanoparticles, which is likely the aluminum (Al) component of the nanocomposite. The matrix appears to have a relatively uniform contrast in the TEM image. There is a clear contrast between the two nanoparticles of CuO and Al NPs. The nanoparticles appear darker in the image, which suggests that they have a higher atomic number and/or a higher density compared to the another nanoparticles. This contrast difference is consistent with the nanoparticles being copper oxide (CuO), which has a higher atomic number than aluminum. TEM analysis of nanocomposite materials like CuO/Al can provide valuable information about the size, shape, distribution, and composition of the nanoparticles, as well as their interactions with the matrix material. The planner lattice observed in Figure 2(c) of the TEM analysis corresponds to the (111) crystal plane of CuO, with a reported d-spacing of 214 pm (picometers). Conversely, the XRD analysis detects the same peak associated with the (111) crystal plane of CuO, revealing a d-spacing of 2.14977 Å (angstroms). There exists an agreement between the two measurements, both analyses confirm the presence of the (111) crystal plane in the CuO sample.
The XRD analysis reveals that the peak observed at 2θ = 77.07° corresponds to the (311) crystal plane of Al nanoparticles, with a calculated d-spacing of approximately 1.23634 Å (angstroms). However, the TEM image presents a different perspective, indicating a d-spacing of 134 pm (picometers). While there appears to be a disparity between the two measurements, possibly attributed to variations in experimental conditions or sample preparation techniques, both analyses affirm the presence of the (311) crystal plane in the Al nanoparticle sample. This information is crucial for understanding and optimizing the properties and performance of these materials for various applications, such as catalysis, energy storage, and advanced functional materials.
FTIR Analysis of (PVC/CuO/Al) Films
Figure 3 presents the FTIR spectra of various samples, providing valuable information about the chemical composition and molecular structure of the PVC/CuO/Al nanocomposite materials. Figure 3(a) PVC: The FTIR spectrum of pure PVC shows characteristic peaks corresponding to the functional groups present in the polymer. The broad peak around 3368 cm−1 is attributed to the stretching vibration of the O-H bond, indicating the presence of hydroxyl groups could due to moisture in the sample. The peaks at 2924 cm−1 and 2855 cm−1 are associated with the stretching vibrations of C-H bonds in the alkyl groups. The peak at 1655 cm−1 is due to the C = O stretching vibration, indicating the presence of carbonyl groups. The peaks at 1428 cm−1 and 1328 cm−1 correspond to the C-H bending vibrations in the methylene groups. The peak at 859 cm−1 is due to the C-Cl stretching vibration, confirming the presence of chlorine atoms in the PVC structure. The peaks at 686 cm−1 and 629 cm−1 are related to the C-Cl bending vibrations. Figure 3(b) CuONPs + AlNPs: The FTIR spectrum of the mixture of copper oxide (CuO) and aluminum (Al) nanoparticles shows peaks corresponding to the vibrations of these materials. The broad peak around 3573 cm−1 and the peak at 3490 cm−1 are associated with the stretching vibrations of O-H groups, indicating the presence of hydroxyl groups on the surface of the nanoparticles. The peaks at 755 cm−1, 584 cm−1, and 487 cm−1 are attributed to the vibrational modes of Cu-O and Al-O bonds in the nanoparticles. Figure 3(c) PVC/CuONPs: The FTIR spectrum of the PVC/CuONPs nanocomposite shows a combination of peaks from both PVC and CuONPs. The broad peak around 3357 cm−1 is due to the O-H stretching vibration. The peak at 2940 cm−1 corresponds to the C-H stretching vibrations of the alkyl groups. The peak at 592 cm−1 is associated with the vibrational modes of Cu-O bonds in the CuONPs. Figure 3(d) PVC/AlNPs: The FTIR spectrum of the PVC/AlNPs nanocomposite shows peaks similar to those observed in the PVC and AlNPs spectra. The broad peak around 3319 cm−1 is due to the O-H stretching vibration. The peak at 2923 cm−1 corresponds to the C-H stretching vibrations of the alkyl groups. The peak at 1649 cm−1 is attributed to the C = O stretching vibration of the carbonyl groups. The peaks at 1424 cm−1 and 1240 cm−1 are related to the C-H bending vibrations and C-O stretching vibrations, respectively. The peaks at 924 cm−1 and 860 cm−1 are associated with the C-H bending vibrations of the vinyl groups and the C-Cl stretching vibration, respectively. The peaks at 633 cm−1 and 584 cm−1 are attributed to the vibrational modes of Al-O bonds in the AlNPs. Figure 1(e) PVC/CuONPs + AlNPs: The FTIR spectrum of the PVC/CuONPs + AlNPs nanocomposite shows a combination of peaks from all the components. The broad peak around 3356 cm−1 is due to the O-H stretching vibration. The peak at 2941 cm−1 corresponds to the C-H stretching vibrations of the alkyl groups. The peak at 1654 cm−1 is attributed to the C = O stretching vibration. The peaks at 1425 cm−1 and 1239 cm−1 are associated with the C-H bending vibrations and C-O stretching vibrations, respectively. The peaks at 859 cm−1 is related to the C-Cl stretching vibration, respectively. The peak at 687 cm−1 is attributed to the C-Cl bending vibration, while the peak at 610 cm−1 is associated with the vibrational modes of Cu-O and Al-O bonds in the nanoparticles. The FTIR spectra of (a)PVC, (b) CuONPs + AlNPs nanoparticles, (c) PVC/CuONPs nanocomposite, (d) PVC/AlNPs nanocomposite (e)PVC/CuONPs + AlNPs nanocomposite.
The FTIR peak shifts suggest potential chemical interactions between PVC and CuONPs. For example, the peak at 3357 cm−1 in the PVC/CuONPs spectrum is shifted compared to the peak at 3368 cm−1 in pure PVC. This shift indicates a change in the vibrational mode associated with the functional group involved, suggesting an interaction between PVC and CuONPs. Similar peak shifts are observed at 2940 cm−1, 1973 cm−1, 1046 cm−1, and 592 cm−1, indicating potential changes in the chemical environment and bonding interactions within the nanocomposite. Similarly, in Figure 1(d), the FTIR spectrum of the PVC/AlNPs nanocomposite displays peak shifts compared to the spectrum of pure PVC. These shifts indicate potential chemical interactions and changes in the molecular structure of PVC upon the incorporation of AlNPs. The peak at 3319 cm−1 in the PVC/AlNPs spectrum is shifted compared to the peak at 3368 cm−1 in pure PVC, suggesting alterations in the vibrational mode and potential interactions between PVC and AlNPs.
Optical Analysis for (PVC/AlNPs) and PVC/CuONPs + AlNPs) Nanocomposite
Figure 4 presents the optical properties of PVC/AlNPs and PVC/CuONPs + AlNPs nanocomposite films, providing valuable insights into their behavior in the ultraviolet-visible (UV-Vis) region of the electromagnetic spectrum. Figure 4(a) shows the absorbance versus wavelength of the nanocomposite films. From the spectra, we can observe that the PVC/CuONPs + AlNPs film exhibits higher absorbance than the PVC/AlNPs film across most of the wavelength range. This suggests that the addition of CuONPs enhances the light absorption capabilities of the nanocomposite film. Figure 4(b) is derived from the absorbance spectra and relates the absorption coefficient (α) to the incident photon energy (hν). The absorption coefficient is a measure of how strongly a material absorbs light at a particular wavelength. A higher absorption coefficient indicates stronger light absorption. From the plot, we can see that the PVC/CuONPs + AlNPs film has a higher absorption coefficient compared to the PVC/AlNPs film, especially at lower photon energies. This further confirms the enhanced light absorption capabilities of the PVC/CuONPs + AlNPs nanocomposite. Figure 4(c) is used to determine the optical band gap energy (Eg) of the nanocomposite films. The band gap energy is obtained by extrapolating the linear portion of the curve to the x-axis, where the absorption coefficient (α) is zero. According to Table 1, the PVC/AlNPs film has a higher band gap energy (4.5 eV) compared to the PVC/CuONPs + AlNPs film (4.35 eV). This suggests that incorporating CuONPs into the PVC matrix has decreased the band gap energy; potentially enhancing the electrical and optical properties of the nanocomposite. Figure 4(d) is used to determine the Urbach tail energy (Eu), which is a measure of the degree of disorder or structural defects in the material. The Urbach tail energy is obtained by fitting a straight line to the linear portion of the plot and calculating the inverse of its slope. According to Table 1, the PVC/CuONPs + AlNPs film has a lower Urbach tail energy (0.3702 eV) compared to the PVC/AlNPs film (0.41816 eV), indicating a higher degree of structural order in the nanocomposite with CuONPs. Shows the absorbance spectra versus wavelength (λ) (a) Depicts the absorption coefficient (α) versus the incident photon energy (hν) (b) Band gap energy versus incident photon energy (c) and Logarithm of absorption coefficient α versus incident photon energy hν (d) of PVC/AlNPs and PVC/CuONPs + AlNPs film. The optical properties of PVC/CuNPs and PVC/CuNPs + CNT film.
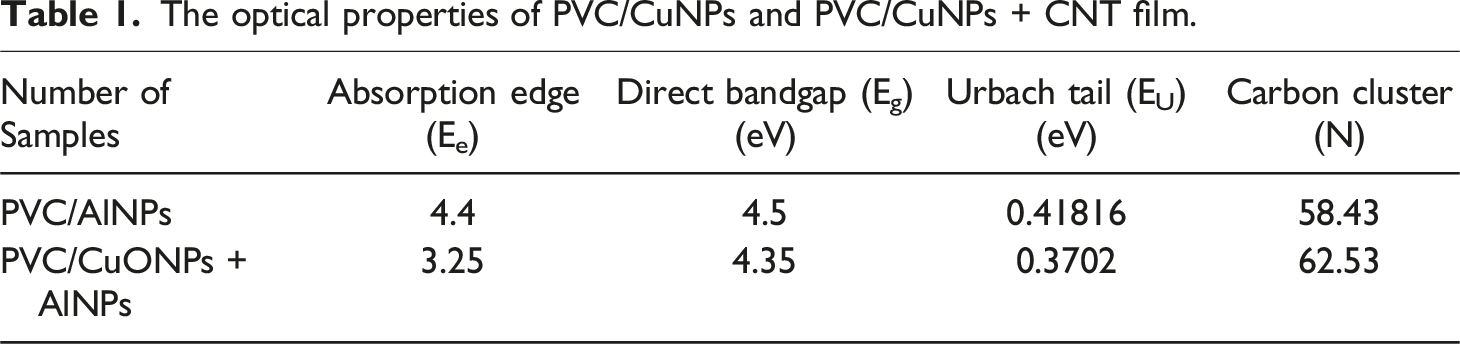
Additionally, the carbon cluster (N) values provided in Table 1 give an estimation of the degree of conjugation or delocalization of electrons in the material. The PVC/CuONPs + AlNPs film has a higher carbon cluster value (62.53) compared to the PVC/AlNPs film (58.43), suggesting a higher degree of electron delocalization and conjugation in the nanocomposite with CuONPs. The analysis of Figure 4 reveals that the incorporation of CuONPs into the PVC matrix has significantly influenced the optical properties of the nanocomposite films. The addition of CuONPs has led to enhanced light absorption, decreased band gap energy, a higher degree of structural order, and increased electron delocalization and conjugation.
Electrical Properties of CuONPs + AlNPs at Different Concentration from AlNPs
Figure 5 presents the frequency dependence of various dielectric properties for CuONPs + AlNPs nanocomposites with different concentrations of AlNPs (0, 0.5%, 1.0%, and 1.5%). The analysis of these plots provides insights into the dielectric behavior of the nanocomposites across a range of frequencies. Figure 5(a) shows the AC conductivity (σ) as a function of frequency for the CuONPs + AlNPs nanocomposites with different concentrations of AlNPs. AC conductivity is a measure of the ability of a material to conduct an alternating electric current. At lower frequencies, the AC conductivity is relatively low, indicating that the nanocomposites exhibit insulating behavior. As the frequency increases, the AC conductivity gradually increases for all samples. This behavior is typical of disordered materials, where the AC conductivity follows a power-law dependence on frequency. Notably, the nanocomposite with 1.5% AlNPs exhibits the highest AC conductivity across the frequency range, followed by the samples with 1.0% and 0.5% AlNPs. The pure CuONPs sample (0% AlNPs) shows the lowest AC conductivity. This suggests that the incorporation of AlNPs in the CuONPs matrix enhances the AC conductivity, with higher concentrations of AlNPs leading to greater improvements. The enhanced AC conductivity can be attributed to the formation of conductive pathways within the nanocomposite due to the presence of AlNPs. The AlNPs may act as charge carriers, facilitating the transport of electrons and resulting in increased conductivity. Figure 5(b) Frequency dependence of dielectric constant (ε′): This plot shows the dielectric constant (ε′) as a function of frequency for the CuONPs + AlNPs nanocomposites with different concentrations of AlNPs. The dielectric constant is a measure of the ability of a material to store electrical energy in the form of an electrical field. At lower frequencies, the dielectric constant is relatively high for all samples. As the frequency increases, the dielectric constant decreases, following a typical dispersion behavior. This behavior is often observed in nanocomposite materials due to the presence of interfacial polarization effects. The nanocomposite with 1.5% AlNPs exhibits the highest dielectric constant across the frequency range, while the pure CuONPs sample (0% AlNPs) shows the lowest dielectric constant. This suggests that the incorporation of AlNPs into the CuONPs matrix enhances the dielectric properties of the nanocomposite. The higher dielectric constant in the nanocomposites with AlNPs can be attributed to the formation of interfacial polarization regions, where charges accumulate at the interfaces between the AlNPs and the CuONPs matrix. These interfacial regions contribute to the overall dielectric response, leading to an increase in the dielectric constant. Figure 5(c) Frequency dependence of dielectric loss (ε′′): This plot shows the dielectric loss (ε′′) as a function of frequency for the CuONPs + AlNPs nanocomposites with different concentrations of AlNPs. Dielectric loss is a measure of the energy dissipation within a material when subjected to an alternating electric field. At lower frequencies, the dielectric loss is relatively high for all samples. As the frequency increases, the dielectric loss decreases, following a similar trend as the dielectric constant. This behavior is consistent with the presence of interfacial polarization effects in the nanocomposites. The nanocomposite with 1.5% AlNPs exhibits the highest dielectric loss across the frequency range, while the pure CuONPs sample (0% AlNPs) shows the lowest dielectric loss. This further supports the notion that the incorporation of AlNPs enhances the dielectric properties of the nanocomposite. The higher dielectric loss in the nanocomposites with AlNPs can be attributed to the increased charge carrier mobility and the presence of interfacial polarization regions, which contribute to energy dissipation within the material. The analysis of Figure 3 reveals that the incorporation of AlNPs into the CuONPs matrix significantly influences the dielectric properties of the nanocomposites. The presence of AlNPs leads to enhanced AC conductivity, higher dielectric constant, and increased dielectric loss across the frequency range. These improvements can be attributed to the formation of conductive pathways and interfacial polarization regions within the nanocomposites, facilitated by the presence of AlNPs. The nanocomposite with 1.5% AlNPs exhibits the most favorable dielectric properties, suggesting an optimal concentration for achieving the desired improvements. The frequency-dependent behavior of these dielectric properties provides valuable insights into the underlying mechanisms governing the electrical performance of the nanocomposites. This information can be used to optimize the material composition and design for potential applications in areas such as energy storage, electronics, and electromagnetic shielding. Frequency dependence of AC conductivity (a), Frequency dependence of dielectric constant ε′(b), and dielectric loss ε′′(c) for CuONPs + AlNPs nanocomposite at (0, 0.5%, 1.0%, and 1.5%) AlNPs.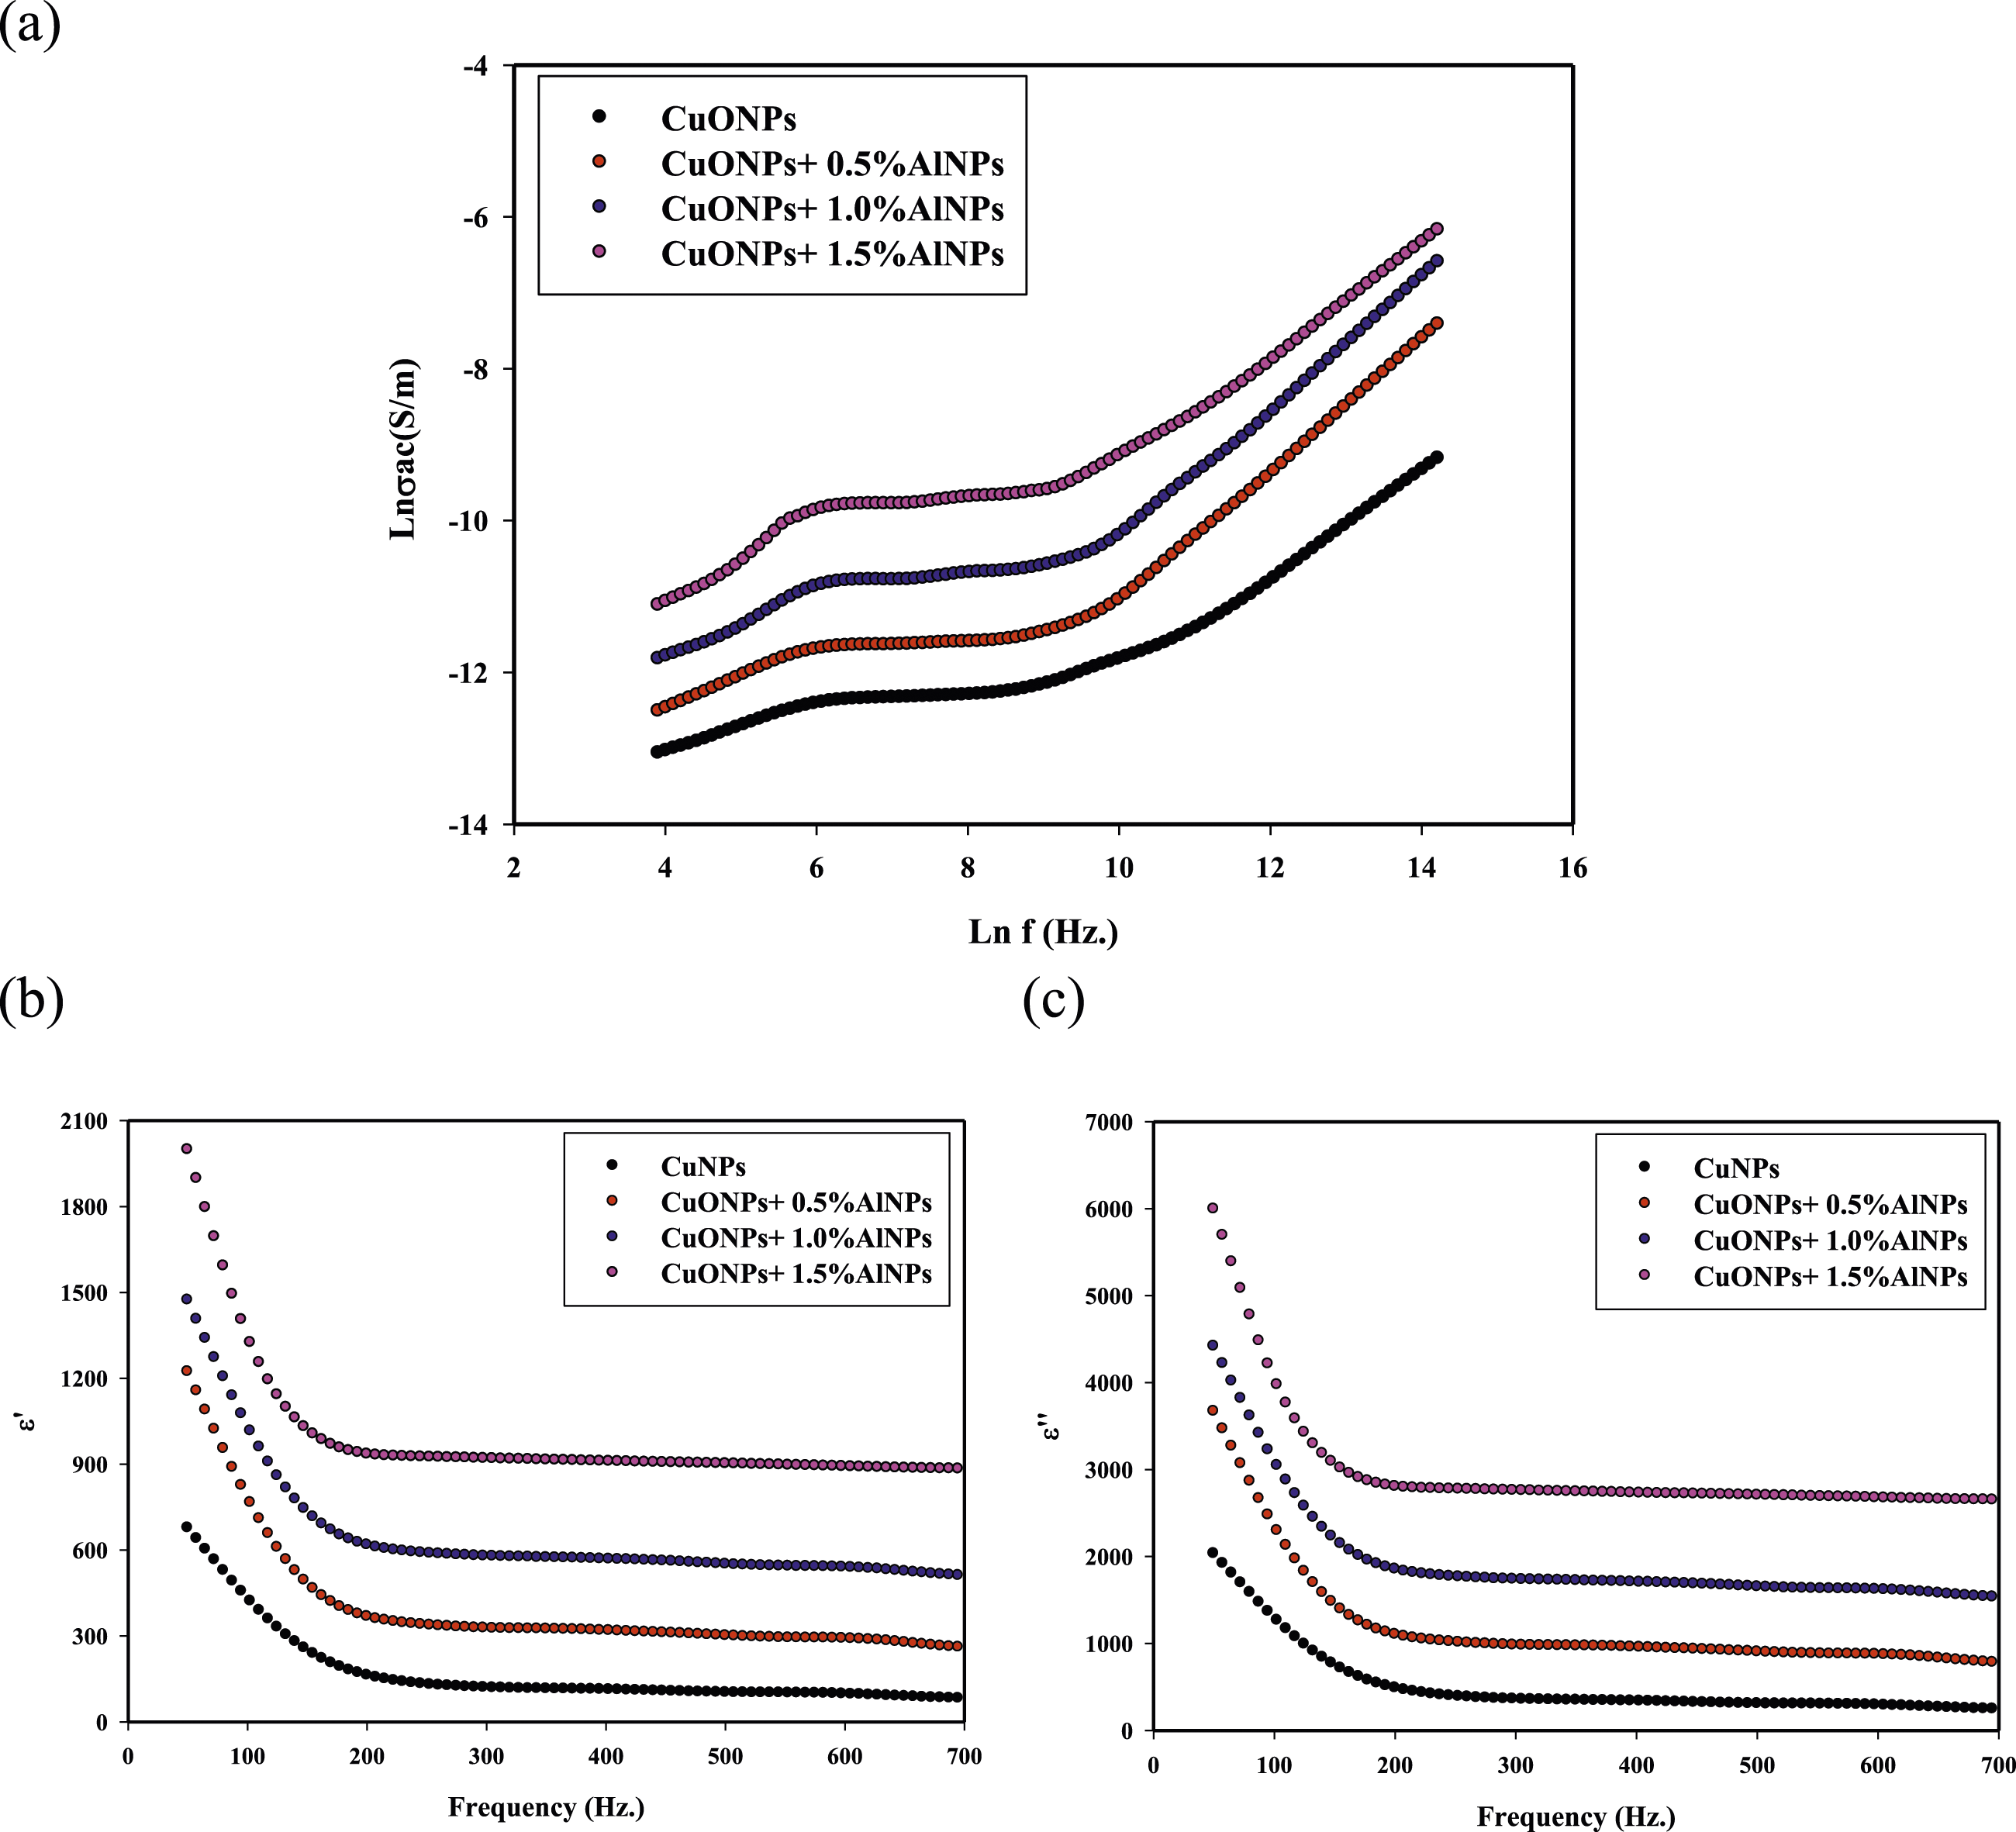
Electrical Properties of PVC/AlNPs, PVC/CuONPs and PVC/CuONPs+1.5%AlNPs Nanocomposite
Figure 6 presents the frequency dependence of AC conductivity for three different samples: PVC/AlNPs, PVC/CuONPs, and PVC/CuONPs+1.5%AlNPs nanocomposites. The analysis of this plot provides insights into the influence of the nanoparticle composition on the AC conductivity behavior of the nanocomposites. Frequency dependence of AC conductivity: Figure 6 shows the variation of AC conductivity (σ) as a function of frequency for the three nanocomposite samples. AC conductivity is a measure of the ability of a material to conduct an alternating electric current. At lower frequencies, all three samples exhibit relatively low AC conductivity, indicating insulating behavior. As the frequency increases, the AC conductivity gradually increases for each sample, following a power-law dependence on frequency. This behavior is typical of disordered materials, where the AC conductivity is governed by the hopping of charge carriers between localized states. Frequency dependence of AC conductivity for PVC/ALNPs, PVC/CuONPs and PVC/CuONPs+1.5%AlNPs nanocomposite.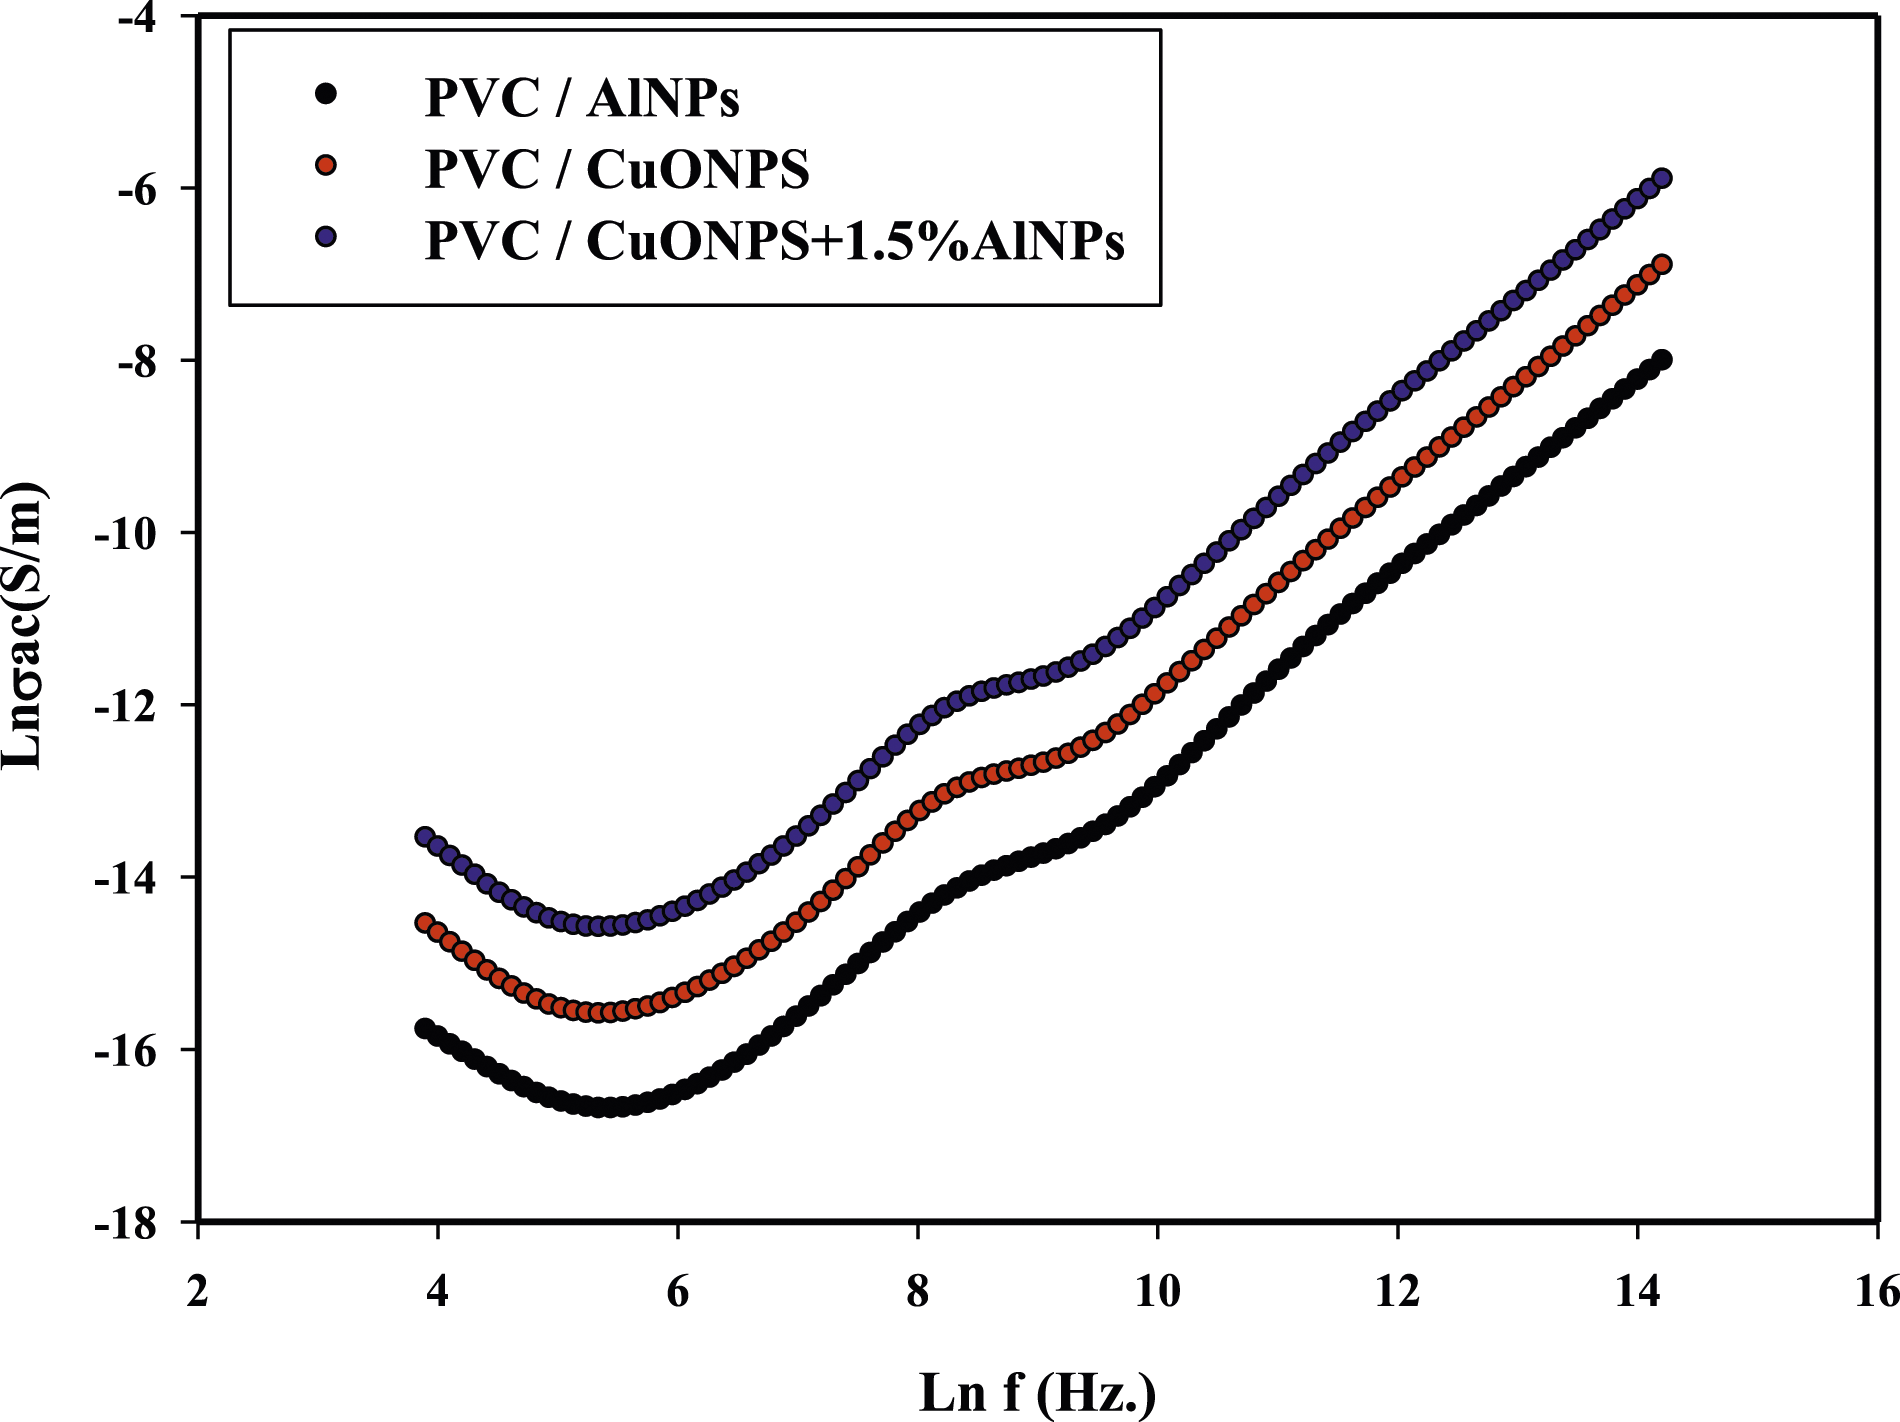
Notably, the PVC/CuONPs+1.5%AlNPs nanocomposite exhibits the highest AC conductivity across the entire frequency range compared to the PVC/AlNPs and PVC/CuONPs samples. This suggests that the incorporation of both CuONPs and AlNPs into the PVC matrix leads to a significant enhancement in AC conductivity. The enhanced AC conductivity in the PVC/CuONPs+1.5%AlNPs nanocomposite can be attributed to the synergistic effect of the CuONPs and AlNPs. The CuONPs may contribute to the formation of conductive pathways, facilitating the transport of electrons, while the AlNPs may act as charge carriers, further enhancing the conductivity. The PVC/CuONPs sample exhibits higher AC conductivity compared to the PVC/AlNPs sample, indicating that the CuONPs have a more significant impact on the AC conductivity than the AlNPs alone. The analysis of Figure 6 reveals that the incorporation of both CuONPs and AlNPs into the PVC matrix has a synergistic effect on the AC conductivity of the nanocomposites. The PVC/CuONPs+1.5%AlNPs nanocomposite exhibits the highest AC conductivity across the frequency range, outperforming the nanocomposites with either CuONPs or AlNPs alone. This enhanced AC conductivity can be attributed to the formation of conductive pathways facilitated by the CuONPs and the presence of charge carriers provided by the AlNPs. The combination of these two effects leads to improved charge transport and increased AC conductivity in the nanocomposite. The frequency-dependent behavior of AC conductivity provides valuable insights into the mechanisms governing the electrical performance of the nanocomposites. This information can be used to optimize the material composition and design for potential applications in areas such as electronics, electromagnetic shielding, and energy storage devices.
Simulation of Electric Field Distribution for PVC/CuONPs+1.5%ALNPs Nanocomposites
Figure 7 presents the simulation results of the electric field distribution in medium-voltage cables for two different cases: (a) PVC market and (b) PVC/CuONPs+1.5% AlNPs nanocomposite. The analysis of these figures provides insights into the influence of nanoparticle incorporation on the electric field distribution within the cable. Figure 7(a) Electric field distribution in PVC market cable: This figure shows the electric field distribution within the PVC market cable, starting from the copper core to the outer semiconductor layer. The color scale represents the magnitude of the electric field, with darker shades indicating higher electric field intensities. At 1 mm of arc length, as shown in Figure 7 (a1), the electric field distribution within the PVC sample is non-uniform. There are localized regions where the electric field intensity is higher, particularly near the copper core. This non-uniform distribution can lead to uneven stress on the insulating material and potential electrical breakdown. Figure 7 (b) Electric field distribution in PVC/CuONPs+1.5% AlNPs nanocomposite cable: This figure shows the electric field distribution within the PVC/CuONPs+1.5% AlNPs nanocomposite cable, starting from the copper core to the outer semiconductor layer. At 1 mm of arc length, as shown in Figure 7 (b1), the electric field distribution within the PVC/CuONPs+1.5% AlNPs nanocomposite is more uniform compared to the PVC market cable. The electric field intensity gradually decreases from the inside to the outside, with fewer localized regions of high electric field intensity. The improved uniformity of the electric field distribution in the PVC/CuONPs+1.5% AlNPs nanocomposite can be attributed to the presence of CuONPs and AlNPs within the PVC matrix. These nanoparticles can modify the electrical properties of the insulating material, leading to a more uniform distribution of the electric field. According to the discussion in the document, the incorporation of CuONPs and AlNPs into the PVC matrix increases the relative permittivity values for the inner and outer semiconductors from 2.25 to 2.35. This increase in relative permittivity can contribute to the preservation of a more uniform electrical field and the reduction of electrostatic tension within the cable. The analysis of Figure 7 reveals that the incorporation of CuONPs and AlNPs into the PVC matrix has a significant impact on the electric field distribution within the medium-voltage cables. The PVC/CuONPs+1.5% AlNPs nanocomposite cable exhibits a more uniform electric field distribution compared to the PVC market cable. The improved uniformity of the electric field distribution can be attributed to the increased relative permittivity of the nanocomposite material, which helps to better distribute the electric field and reduce localized regions of high electric field intensity. This uniform distribution of the electric field is crucial for the reliable operation and longevity of the cable insulation, as it minimizes the risk of electrical breakdown and ensures even stress distribution. Electric field distribution in medium-voltage cables of PVC market (a), Line graph of Electric field (a1), of (PVC/CuONPs+ 1.5% AlNPs) nanocomposites (b), and Line graph of Electric field (b1).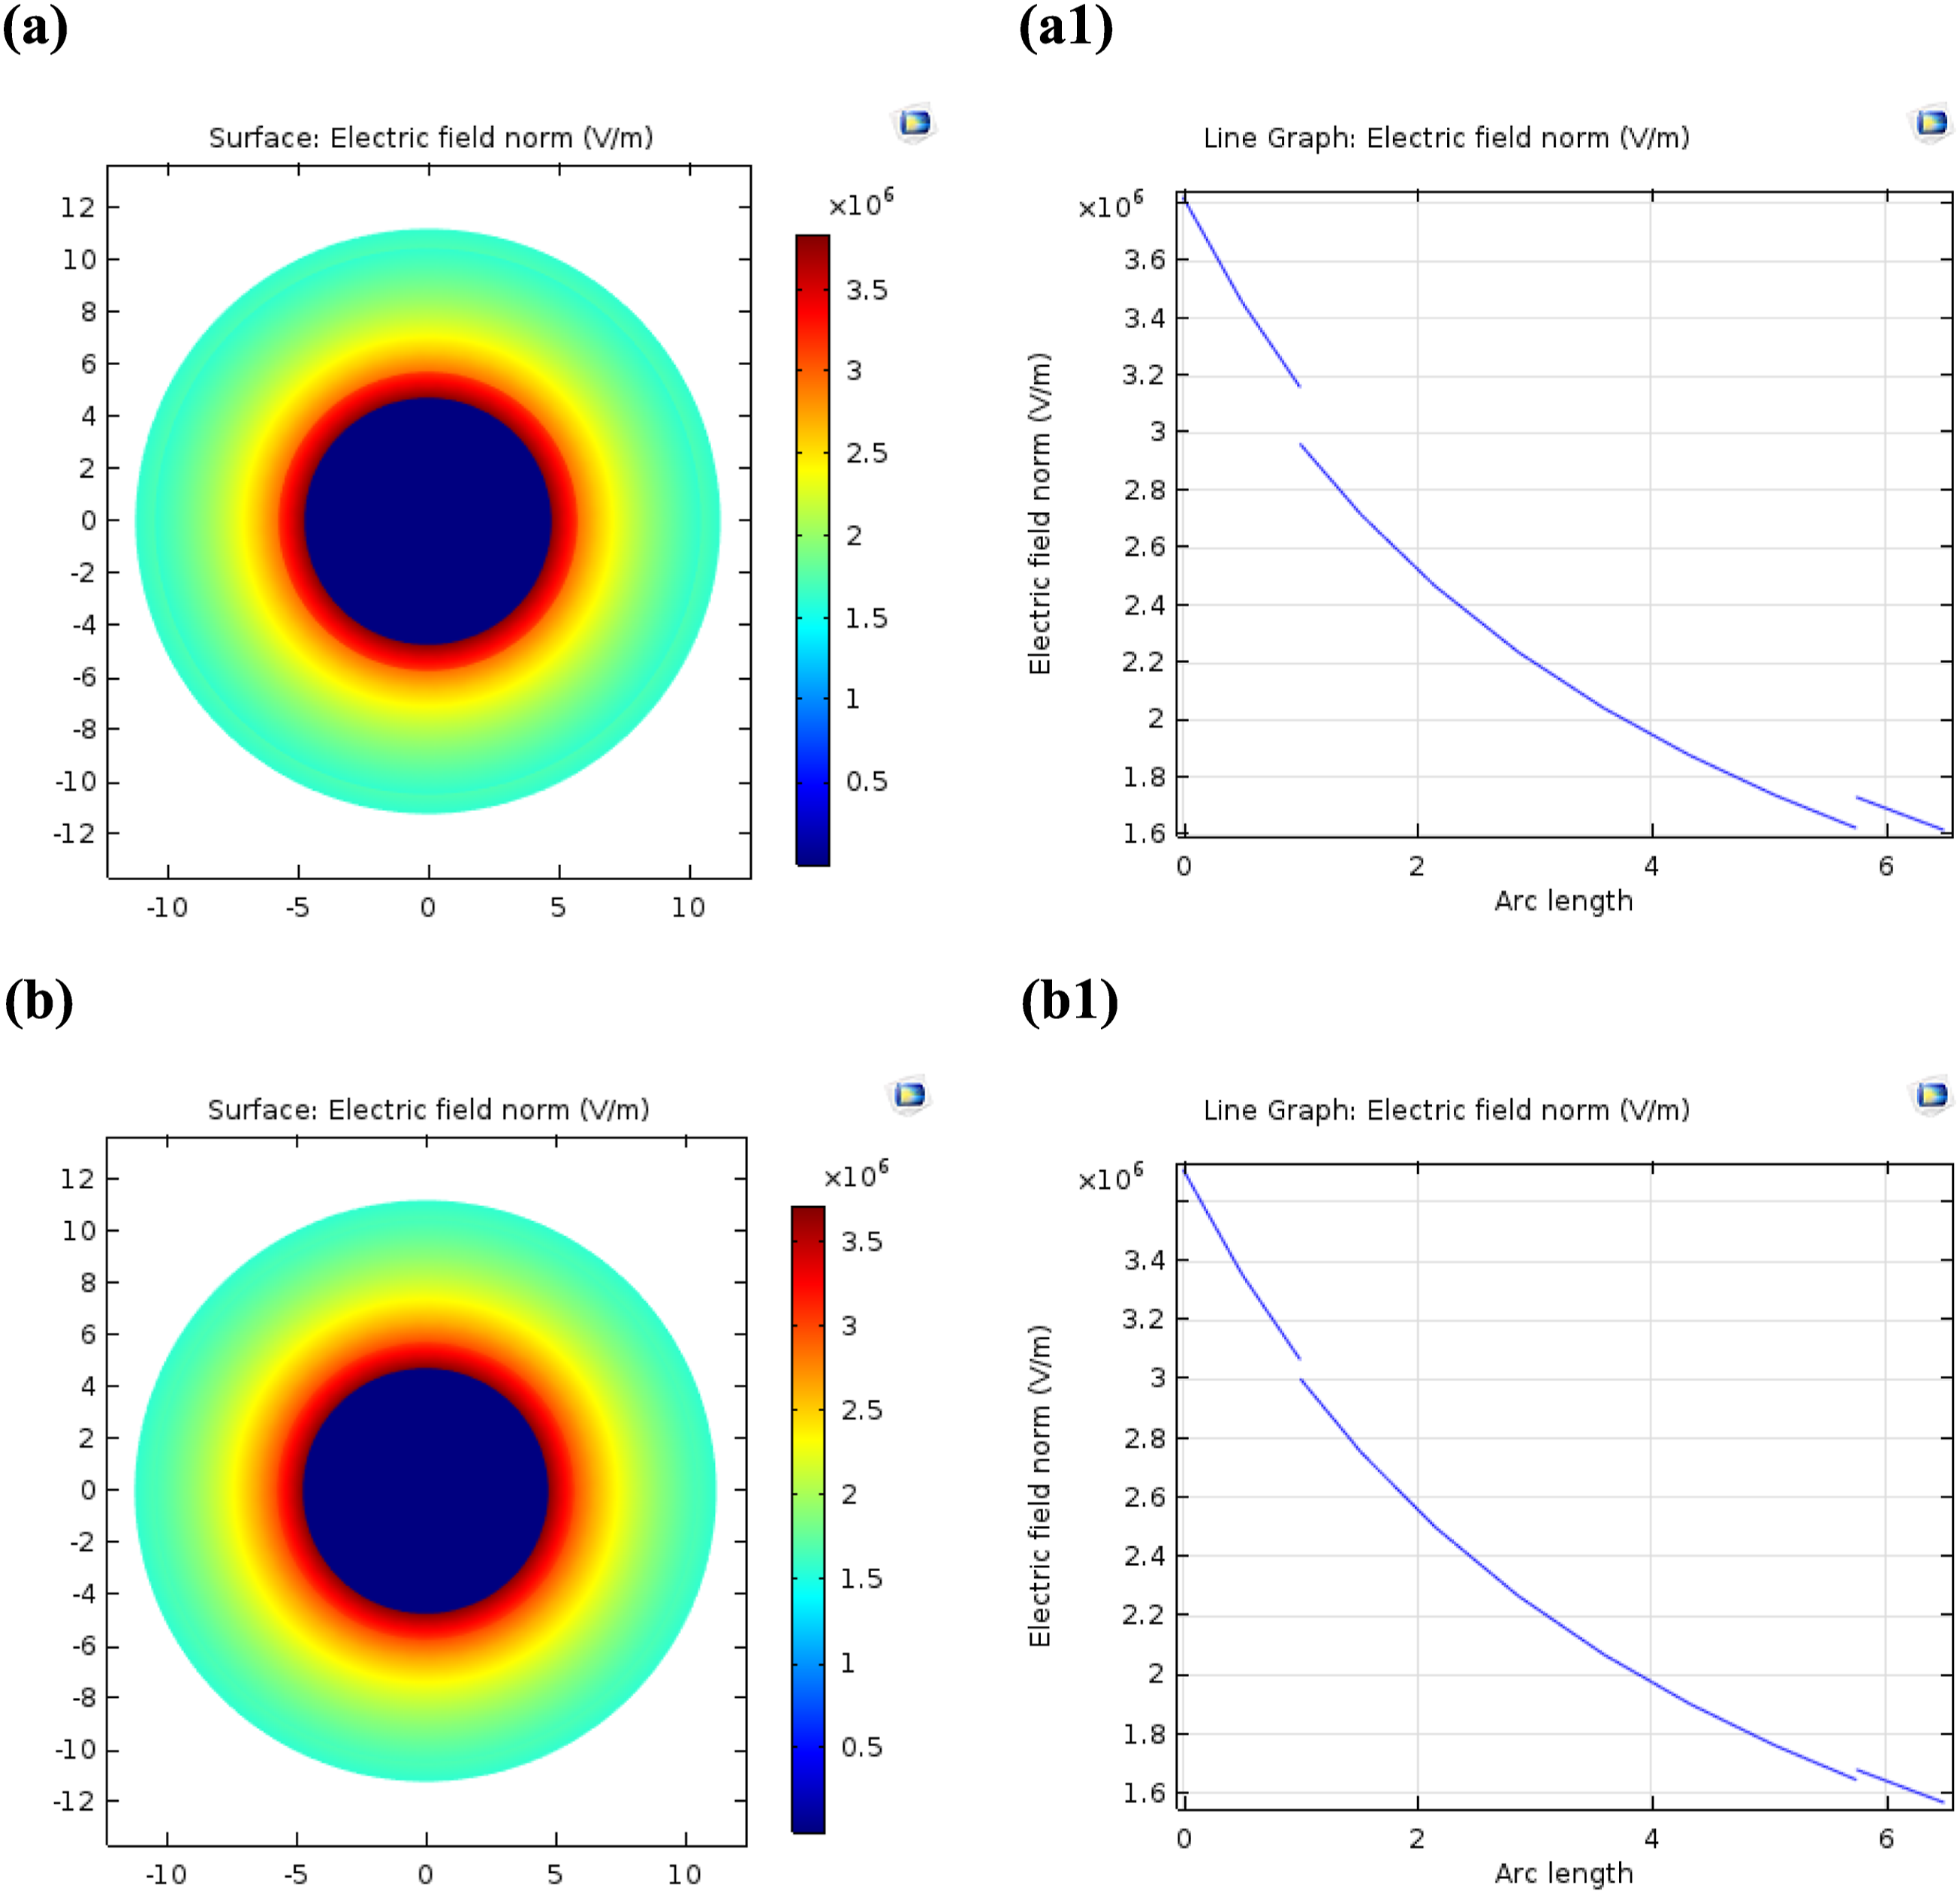
The simulation results provide valuable insights into the impact of nanoparticle incorporation on the electric field distribution within the cable, highlighting the potential benefits of using nanocomposite materials for cable insulation applications.
Figure 8(a1) and (b1), at 1 mm of arc length, the electric potential distribution also gradually decreases from approximately 15,000 V at the copper core to 0 V at the outer semiconductor layer. The behavior curve is similar to that observed for the PVC market cable, indicating no significant change in the electric potential distribution due to the incorporation of CuONPs and AlNPs. The analysis of Figure 8 reveals that the incorporation of CuONPs and AlNPs into the PVC matrix does not significantly impact the electric potential distribution along the cable radius. Both the PVC market cable and the PVC/CuONPs+1.5% AlNPs nanocomposite cable exhibit similar behavior, with the electric potential gradually decreasing from the copper core to the outer semiconductor layer, as shown in Figure 8(a) and (b). This observation suggests that the presence of CuONPs and AlNPs in the PVC matrix primarily affects the electric field distribution within the cable, as discussed in Figure 7. The electric potential distribution, which is governed by the applied voltage and the overall resistance of the cable, remains relatively unaffected. The consistent behavior of the electric potential distribution across both cable samples indicates that the incorporation of CuONPs and AlNPs does not significantly alter the overall resistance or voltage drop along the cable radius. This finding is important for ensuring that the nanocomposite material maintains the necessary insulating properties and does not adversely affect the cable’s ability to transmit electrical energy. While the electric potential distribution remains similar, the improved uniformity of the electric field distribution in the PVC/CuONPs+1.5% AlNPs nanocomposite cable, as observed in Figure 7, can lead to enhanced insulation performance and reduced risk of electrical breakdown. Electric potential distribution in medium-voltage cables of PVC market (a), Line graph of Electric field (a1), of (PVC/CuONPs+ 1.5% AlNPs) nanocomposites (b), and Line graph of Electric field (b1).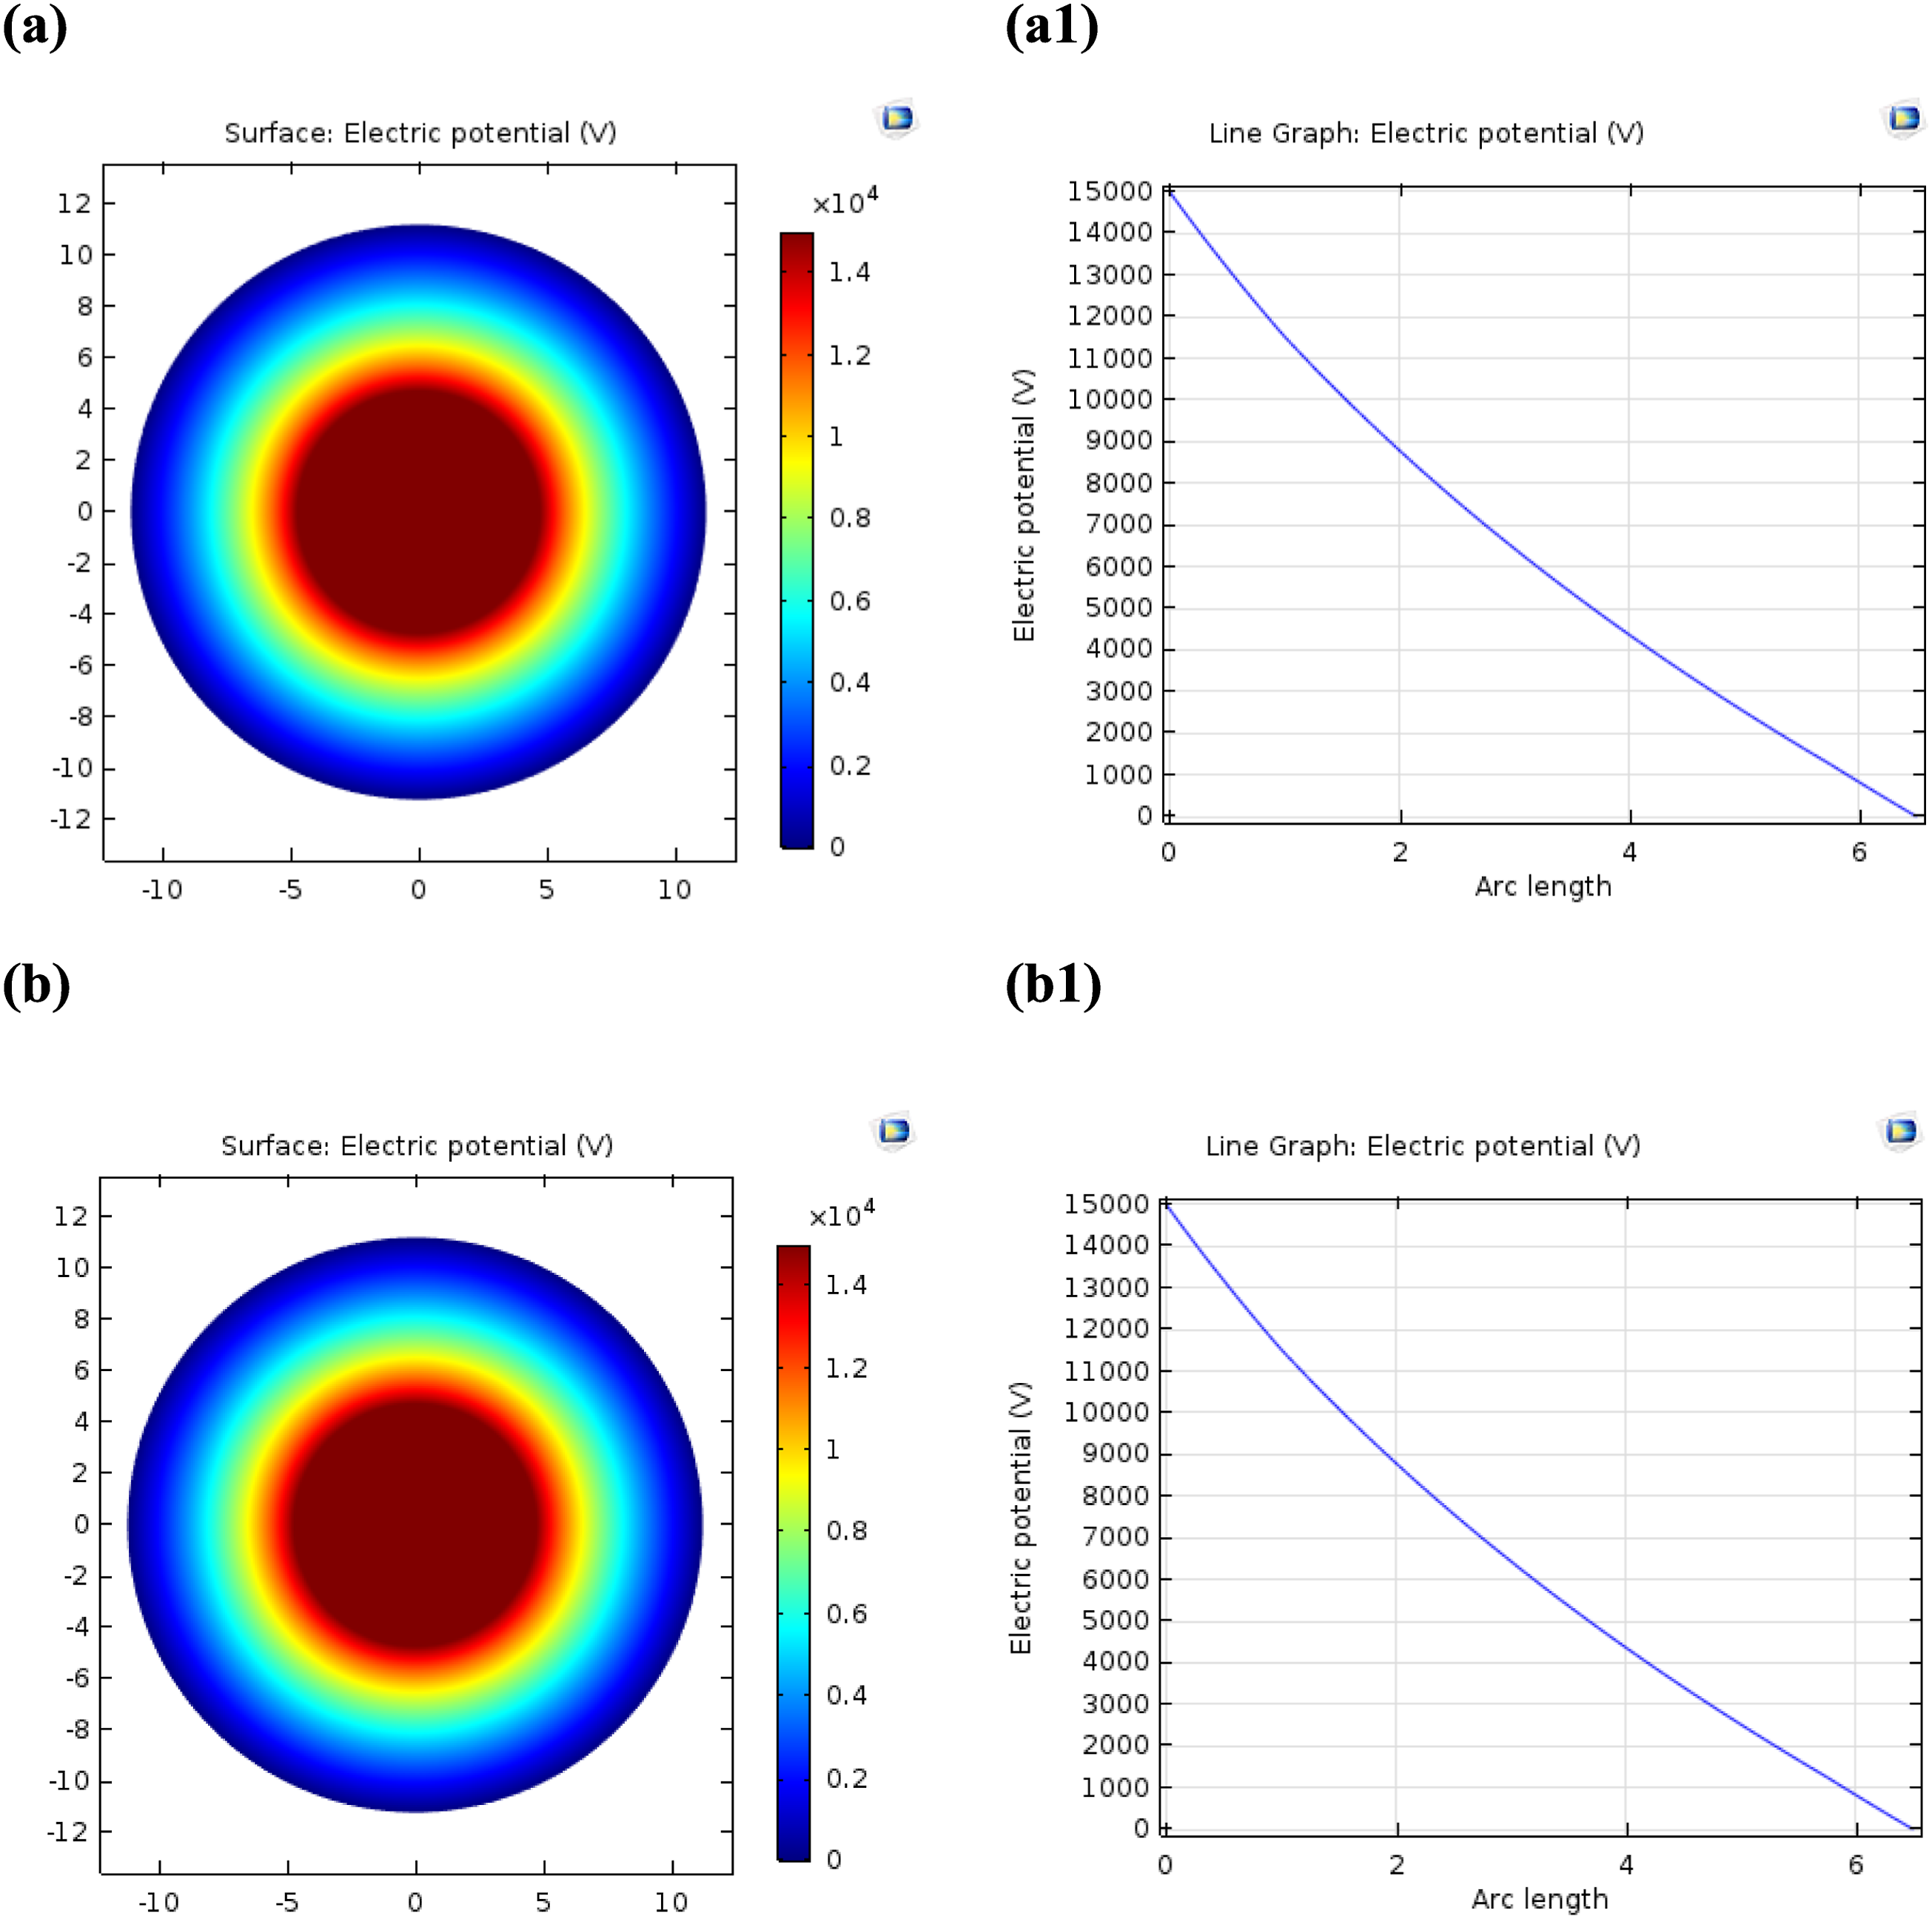
Conclusion
The present study has demonstrated the potential of incorporating CuO and Al nanoparticles into a PVC matrix to enhance the performance of medium voltage cables. The synthesis of PVC/CuO/Al nanocomposite films was achieved by dissolving PVC in THF solvent and adding a mixture of 5 wt% CuO and Al nanoparticles. The FTIR analysis confirmed the successful incorporation of the nanoparticles into the PVC matrix, indicating the formation of the desired nanocomposite structure. The optical characterization of the PVC/AlNPs and PVC/CuONPs + AlNPs nanocomposite films revealed significant improvements in the optical properties. The PVC/CuONPs + AlNPs film exhibited a lower band gap energy of 4.35 eV compared to 4.5 eV for the PVC/AlNPs film, suggesting enhanced electrical and optical behavior. Additionally, the PVC/CuONPs + AlNPs film demonstrated a lower Urbach tail energy of 0.3702 eV compared to 0.41816 eV for the PVC/AlNPs film, indicating a higher degree of structural order. The absorption coefficient and carbon cluster value were also higher for the PVC/CuONPs + AlNPs film, signifying increased light absorption capabilities, electron delocalization, and conjugation. The dielectric properties of the CuONPs + AlNPs nanocomposites were investigated, revealing that the sample containing 1.5% AlNPs exhibited the optimal performance. This nanocomposite demonstrated the highest AC conductivity (2.029 × 10^-3 S/m), dielectric constant, and dielectric loss across the frequency range, indicating improved charge transport and energy storage capabilities. Simulations of electric field distribution showed that the PVC/CuONPs+1.5% AlNPs nanocomposite cable exhibited a more uniform electric field distribution compared to the PVC market cable. This uniform distribution contributed to a reduction in electrostatic tension and an increase in relative permittivity from 2.25 to 2.35, enhancing the insulation performance and reliability of the cable. The electric potential distribution along the cable radius remained similar for both the PVC market cable and the PVC/CuONPs+1.5% AlNPs nanocomposite cable, indicating that the incorporation of nanoparticles did not adversely affect the overall resistance or voltage drop along the cable. In conclusion, the incorporation of CuO and Al nanoparticles into the PVC matrix has demonstrated promising results in enhancing the performance of medium voltage cables. The optimal composition, as identified in this study, is the PVC/CuONPs+1.5% AlNPs nanocomposite, which exhibited improved optical properties, dielectric response, AC conductivity, and electric field distribution. These findings pave the way for the development of advanced nanocomposite insulation materials for medium voltage cables, potentially leading to increased reliability, longevity, and efficiency in power distribution systems.
Footnotes
Acknowledgements
The authors extend their appreciation to the Deanship of Scientific Research at Northern Border University, Arar, KSA for funding this research work through the project number NBU-FFR-2024-3049-02.
Author contributions
Contributors All authors contributed substantially to the conception and design of the work and to the analysis and interpretation of the data. Specific individual contributions in addition to the above:
Declaration of conflicting interests
The author(s) declared no potential conflicts of interest with respect to the research, authorship, and/or publication of this article.
Funding
The author(s) received no financial support for the research, authorship, and/or publication of this article.
Data Availability Statement
The authors stated and declare that all data is exist and available. All data generated or analyzed during this study are included in this manuscript.