
Abstract
This work aims to introduce bio-based nanocomposite as high voltage electrical insulation material by using cellulose nanocrystal (CNC) isolated from filter paper as a filler of polymer matrix, in this case, polyvinyl chloride (PVC). CNC is obtained via acid hydrolysis treatment and incorporated into PVC by using the casting method at different concentrations. The structural and thermal characterization have been investigated using Fourier transform infrared spectroscopy (FTIR), scanning electron microscopy (SEM) and differential scanning calorimetry (DSC). The dielectric properties as a function of the alternating current (AC) sinusoidal frequency of PVC/CNC were examined by the electrical impedance spectroscopy (EIS) test method. Breakdown voltage tests according to the ASTM D149 standard were conducted to determine the dielectric strength of nanocomposites. Hence, the results indicate that the addition of CNC by 1 wt% is the best formulation to improve the base polymer structure, in this case PVC, as well as its dielectric insulation properties.
Keywords
Introduction
The use of nanoparticles or nanofillers in the research and development of high performance and/or functional polymer materials has become an important part of both academic and business research. In the last few decades, there has been a growing concern about the environment and human health when choosing nanofillers for nanocomposites. Most of the materials used are nanoparticles made from petroleum products (like carbon black and carbon nanotubes) or minerals (like silicates and clays). However, these types of fillers have drawbacks, including being non-renewable and non-biodegradable, which can have negative impacts on humans and the environment.1,2 Sustainable and biodegradable nanofillers are needed. In this regard, researchers have focused on cellulosic nanomaterials due to their natural abundance and biodegradability, as well as many other essential intrinsic features that lead to functionality expression and improved performance of base materials. 3
Nanocellulose has garnered a lot of interest not only due to the fact that it possesses desirable mechanical and optical properties but also due to the reality that it is naturally renewable, readily available, biodegradable, recyclable, and has a low coefficient of thermal expansion. Additionally, they have been widely used in the electrical application field as separators in lithium-ion batteries, 4 electrolyte additives, 5 and humidity sensors. 6 This nanomaterial has been described as a fascinating, sustainable, and tunable platform for the production of a wide range of high-value products. 7 Nanocellulose is a type of natural fiber extracted from cellulose. It is a strong, lightweight, and biodegradable nanofiber with a size that is typically less than 100 nm in diameter and several micrometers in length. 8 There are three distinct types of nanocellulose: mainly nanocrystalline cellulose (NCC), nanofibrillated cellulose (NFC), and bacterial nanocellulose (BNC). All varieties share a similar chemical composition, but their morphology, particle size, crystallinity, and other characteristics vary according to their source and extraction methods.8–10
Cellulose nanocrystals, also known as nanocrystalline cellulose or cellulose nanowhiskers, are short-rod-like or whisker-shaped nanocelluloses with 100-500 nm in length and 2-20 nm in diameter. 11 It can be extracted from cellulose fibrils by the acid hydrolysis method. CNC is composed entirely of cellulose, primarily in crystalline regions (high crystallinity ranging from 54 to 88%).9,10 Previous research has shown that cellulose nanocrystals have an excellent charge and have been frequently used as nanofillers on polymer-based nanocomposites.12–14 In fact, adding small amounts of cellulose nanofillers to the matrix alters its thermal stability, tensile strength, Young’s modulus, and electrical properties.
The key outputs of industrial engineering, such as thermoplastic polymers, which also include polypropylene (PP), polyethylene (PE), polyvinyl chloride (PVC), and polystyrene (PS), find prevalent use in a wide variety of electrical applications. For instance, polymers are extensively employed in the insulation systems of high-voltage equipment because of their remarkable mechanical, electrical, chemical, and thermal properties, as well as their low production costs. In high-voltage insulation materials, which are formed by mixing different polymers at varied weight ratios, polymers are used to modify the physical and electrical properties of the final products while maintaining a lower production cost. 15
Numerous polymers have been validated as viable matrices for the development of composite structures due to their simplicity of production and processing, good adhesion with reinforcing elements, resilience to corrosive environments, and, in certain cases, showing ductile electrical performance.16,17 Polyvinyl chloride (PVC) is a type of polymer utilized as an electrically insulating material in both power industrial and communication applications. PVC has been widely used for many years as a power cable insulation material in distribution lines due to its superior dielectric strength, low dielectric permittivity, low loss factor, and dynamic thermomechanical behaviour. 18 Furthermore, its mechanical and electrical properties can be altered by modifying its miscibility and compatibility with other organic and inorganic materials, which results in flexible composites that can be utilized in a wide variety of applications requiring special conditions. 19
Insulating materials play a vital role in the design and performance of high voltage power systems. They can be employed for insulation purposes and charge storage (as in capacitive devices), as well as heat conduction (as in liquids in oil transformers) and mechanical support (as in solids). Due to the growing demand for high-performance materials, polymer nanocomposite has been selected as a leading candidate, and the number of related reports is increasing rapidly. 20 In the meantime, the use of nanocellulose in modifying a polymeric material for electrical insulation has attracted considerable interest. For instance, Bras et al. have found that the hygroscopic properties of nanocellulose are dependent on the level of their crystallinity and subsequently provide a significant effect on its dielectric properties. 21 In addition, in conditions of high humidity, the surface of nanocellulose particles attracts water molecules due to their hydrophilic properties. In industrial applications, such as high-voltage cables, polymeric materials used for insulation are always exposed to high humidity environments, especially for underground cables. Therefore, it is very important to study and evaluate the performance of nanocellulose as a nanosized filler material.
Hence, to elucidate the effect of the structural and dielectric properties of nanocellulose reinforced with a polymeric material and to determine a satisfactory nanocomposite as an electrical insulating material, polyvinyl chloride (PVC) was modified by cellulose nanocrystals (CNCs) at different loadings of 0.5, 1, and 3 wt%, as well as neat PVC without nanocellulose. For structural studies, Fourier transform infrared spectroscopy (FTIR), scanning electron microscopy (SEM), and differential scanning calorimetry (DSC) were used to determine the functional groups, shape, and thermal behavior of the samples. Meanwhile, for electrical insulation performance investigations, the dielectric response and breakdown voltage tests have been performed under the influence of AC sinusoidal voltages.
Experimental
Materials
Polyvinyl chloride was purchased from Nacalai Tesque. Tetrahydrofuran (THF) was used for solvent casting, supplied by Sigma Aldrich. The source of cellulose nanocrystal was obtained from filter paper (Whatman qualitative filter paper grade 1 with basis weight 87 g/m2, thickness 180 µm and diameter 90 mm) purchased from Sigma Aldrich. CNC was extracted via acid hydrolysis, using sulfuric acid (64 wt%). Sodium hydroxide (NaOH) and other chemicals were acquired from Sigma Aldrich.
Synthesis of cellulose nanocrystal (CNC)
The extraction of cellulose nanocrystal (CNC) was carried out according to the treatment developed in the previous works,
22
with some modifications. Briefly, the filter paper was washed with distilled water and treated three times with NaOH 6% solution at 70°C for 4 h under mechanical stirring. Then, the alkali-treated filter paper was bleached three times at 70°C for 2 h using sodium hypochlorite 6% solution, resulting in pure CNC. The delignified and hemicellulose-free cellulose, as obtained earlier, was introduced to a sulfuric acid hydrolysis to isolate CNC. The acid hydrolysis was conducted on the filter paper at 45°C for 60 min, using sulfuric acid solution (64 wt%) under continuous stirring. The mixture was diluted with cold distillate water. The hydrolysed material was washed by centrifugation at 4750 r/min at 10°C for 10 min. This centrifugation method was repeated multiple times before the suspension was dialyzed for a few days until a constant pH was achieved. After that, the resultant CNC aqueous suspension was ultrasonically treated using an ultrasonicator for 30 min. The CNC suspension was freeze-dried to obtain the CNC in a solid form for further use. The process of producing CNC is depicted in Figure 1. Process of producing CNC from filter paper.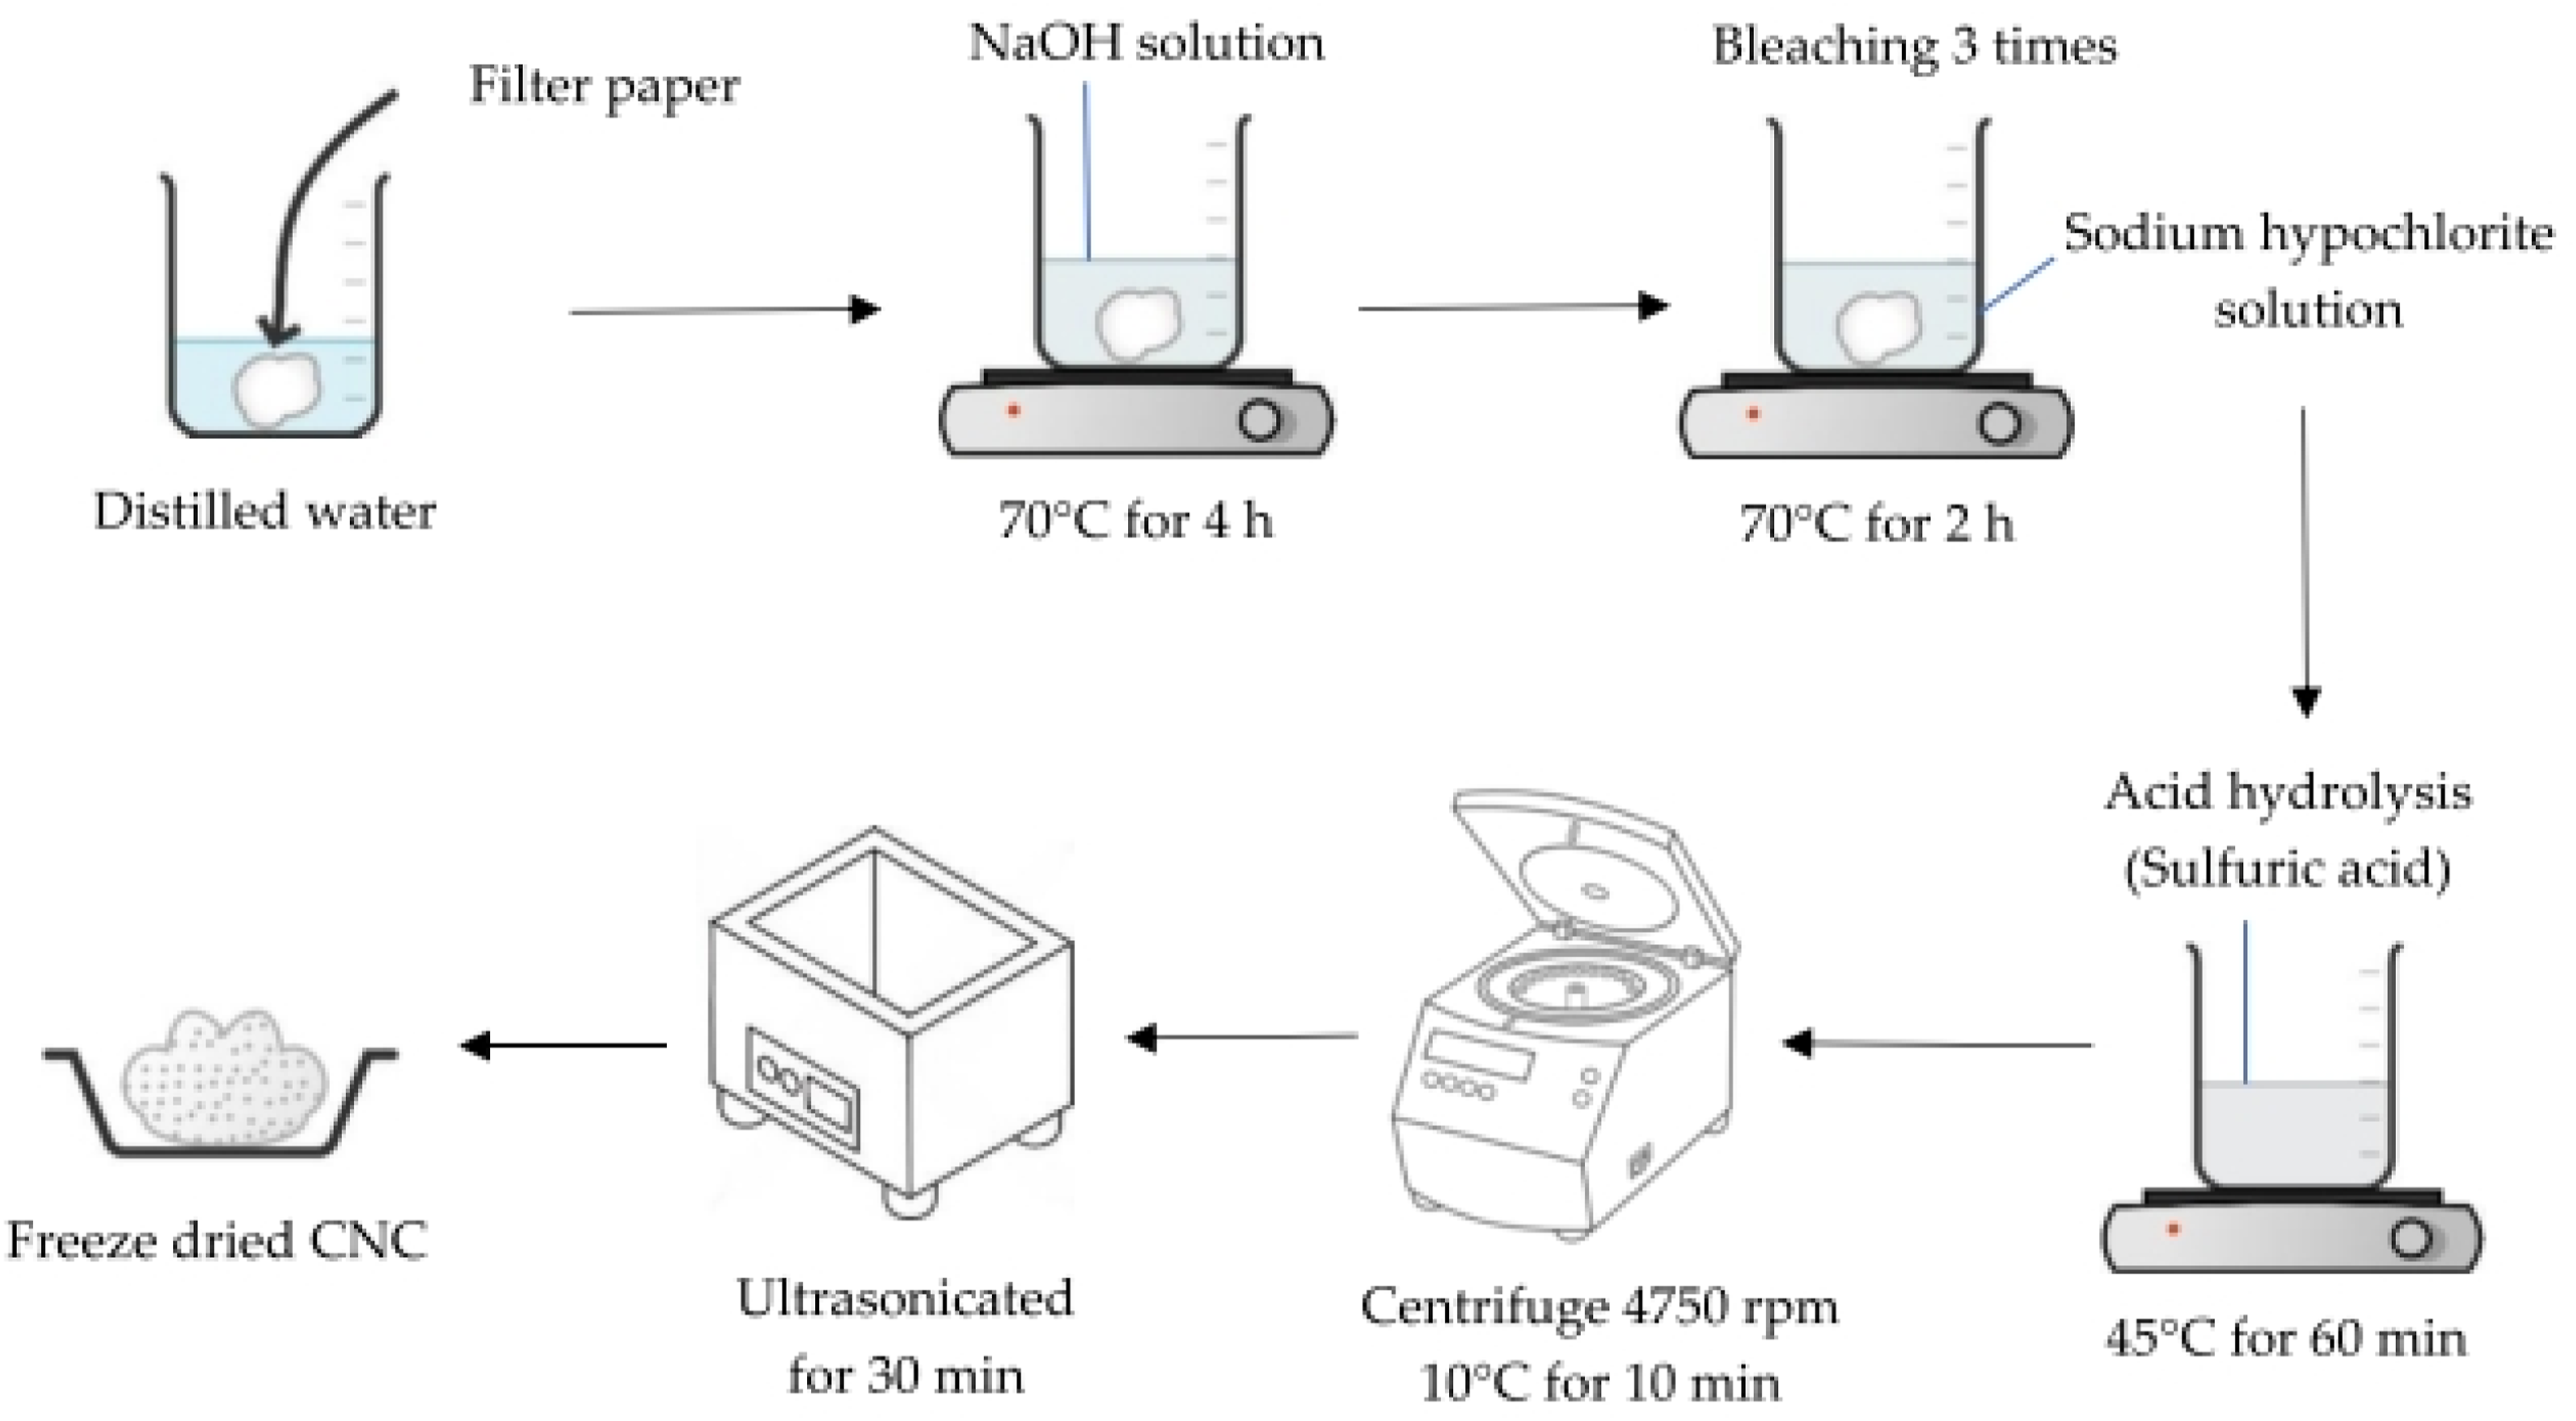
Preparation of nanocomposites PVC/CNC samples
Sample abbreviations and composition.


Preparation of nanocomposite films by solution casting technique.
Characterization
Fourier Transform Infrared Spectroscopy (FTIR)
The chemical structure of CNC samples and composite films was evaluated using Fourier transform infrared spectroscopy (FTIR, Bruker) in the range 4000-400 cm−1 with a resolution of 4 cm−1. The samples were simply placed onto the ATR crystal, and the samples spectra were measured.
Scanning Electron Microscopy (SEM)
The surface morphological characterization of nanocellulose and nanocomposite materials was determined using scanning electron microscopy (SEM) (model CARL ZEISS MA 10). The sample was gold-sputtered using a sputter coater.
Differential Scanning Calorimetry (DSC)
The melting and crystallization behavior of the nanocellulose samples was investigated with the aid of a differential scanning calorimeter (Model Q1000) from TA Instruments. All samples were heated to 175°C at a rate of 5°C/min and then cooled to 20°C at a rate of 5°C/min under a nitrogen atmosphere with a flow rate of 40 mL/min.
Electrochemical Impedance Spectroscopy (EIS)
Electrochemical impedance spectroscopy (EIS) measurements were made on the test object by applying a 1 V peak-to-peak voltage between 100 Hz and 100 kHz. Two stainless steel electrodes of equal size were used, with 10 mm thickness and 30 mm diameter. The test sample was sandwiched between the top and bottom electrodes, where the top and bottom electrodes were set as working and ground electrodes, respectively. The permittivity values were derived from the measured Z impedances, as shown in the reference. 15
Electrical Breakdown Voltage (BDV)
The breakdown voltage (BDV) test was conducted according to ASTM D149 standards. An equal diameter of stainless-steel ball electrodes (d = 25 mm) was used. A test sample was placed between two opposing electrodes immersed in silicone oil to prevent surface flashover. AC breakdown tests with a step voltage of 1 kV every 20 s were applied until the sample experienced breakdown. Ten breakdown tests were performed on each type of sample. All the samples are of a circular shape with an equal thickness (0.1 mm). The dielectric strength was calculated by dividing the voltage from each measurement by the sample thickness at the breakdown point. 23 The results are analyzed by using Weibull statistical analysis.
Results
Effect of CNC on the functional group of PVC/CNC nanocomposites
The functional groups of nanocellulose and PVC/CNC nanocomposites were determined using the FT-IR method. The structural changes in the samples were observed and resulted from the various treatment by CNC. Figure 3 shows the FTIR spectra of the cellulose nanocrystals, neat PVC and nanocomposite films at different weight fraction. The CNC spectrum presents bands characteristic of the structure of cellulose fibrils in which the band between 3500 – 3200 cm−1 referring to the O-H stretching. Peak 2902 cm−1 corresponding to the asymmetric C-H stretching band.
24
The bands at 1638 cm−1 and 1160 cm−1 referring to the O-H bending vibration of H-bonded cellulose and the symmetrical stretching of cellulose group C-O-C, respectively.
25
Peak at 1064 cm−1 was due to the elongation of the C-O group, while 897 cm−1 attributed to the cellulose vibration band of the C-H group.
26
It was observed from the CNC spectrum that the characteristics bands of hemicellulose and lignin which usually present at 1514 cm−1 and 1736 cm−1 was not displayed in the CNC, indicated that most of the hemicelluloses and lignin from CNC sample were removed and the successful treatment with acid hydrolysis have been achieved, resulting in pure CNC. FTIR spectra of cellulose nanocrystals, neat PVC and PVC/CNC nanocomposite films at different weight fraction.
In the FTIR spectrum of neat PVC, there are some characteristic peaks: CH2 stretching vibrations at 2980 cm−1, C-H stretching at 2912 cm−1, CH-Cl out-of-plane angular deformation at 1257 cm−1, C-H out-of-plane trans deformation at 960 cm−1 and C-Cl bond stretching at 831, 691 and 615 cm−1. These absorption bands are in accordance with the data found in the literature.27,28 Similar peaks were observed for blending of PVC/CNC nanocomposites, with a gradual amplification in the peak intensity with the increased of CNC content compared to the neat PVC. The characteristic absorption bands corresponding to PVC and CNC were both observed in the FTIR spectra of PVC/CNC films 0.5%, 1% and 3%, which could imply that an interaction between PVC and CNC occurs. As an example, there is no visible -OH peak observed in neat PVC, but the addition of CNC into the PVC matrix generates a stretching peak of hydroxyl group, in the region 3500 - 3200 cm−1 which is presumably due to the contribution of OH groups from the CNCs. However, the intensity of the hydroxyl peak was observed to be weaker in the PVC/CNC nanocomposites as compared to pure CNC. 29 The participation of the hydroxyl group of nanocellulose in the cross-linking reaction with PVC could explain the weaker peak intensity in nanocomposite. In addition, there is a visible smaller peak observed in the PVC/CNC that was not present in the PVC spectrum at 1160 cm−1 band, attributed to the stretching vibration of cellulose group C-O-C from the CNC. This explains the molecular interaction between CNC and PVC and confirmed the successful loaded of PVC onto the CNC nanofiller for the formation of nanocomposites.
Effect of CNC on the morphology of PVC/CNC nanocomposites
Figure 4(a) shows the SEM micrographs of the pure crystalline nanocellulose (CNC) after treatment. In fact, various treatments applied to the fibre change its morphology, exposing the fibre surface as a result of the removal of non-cellulosic, macromolecular components including hemicelluloses, lignin, pectin and other impurities that lead to fibrillation of fibres. Thus, it is clear from the SEM micrographs in Figure 4(a) that the treatment of CNC with acid hydrolysis display a rod-like shape, little aggregation, and smooth surface morphology. As a result of the acid hydrolysis process, the CNCs tend to agglomerate, most likely due to the surface ionic charge that had the crystallites packed together.
30
SEM images of (a) CNC, (b) Neat PVC, (c) PVC/CNC 0.5, (d) PVC/CNC 1, and (e) PVC/CNC 3.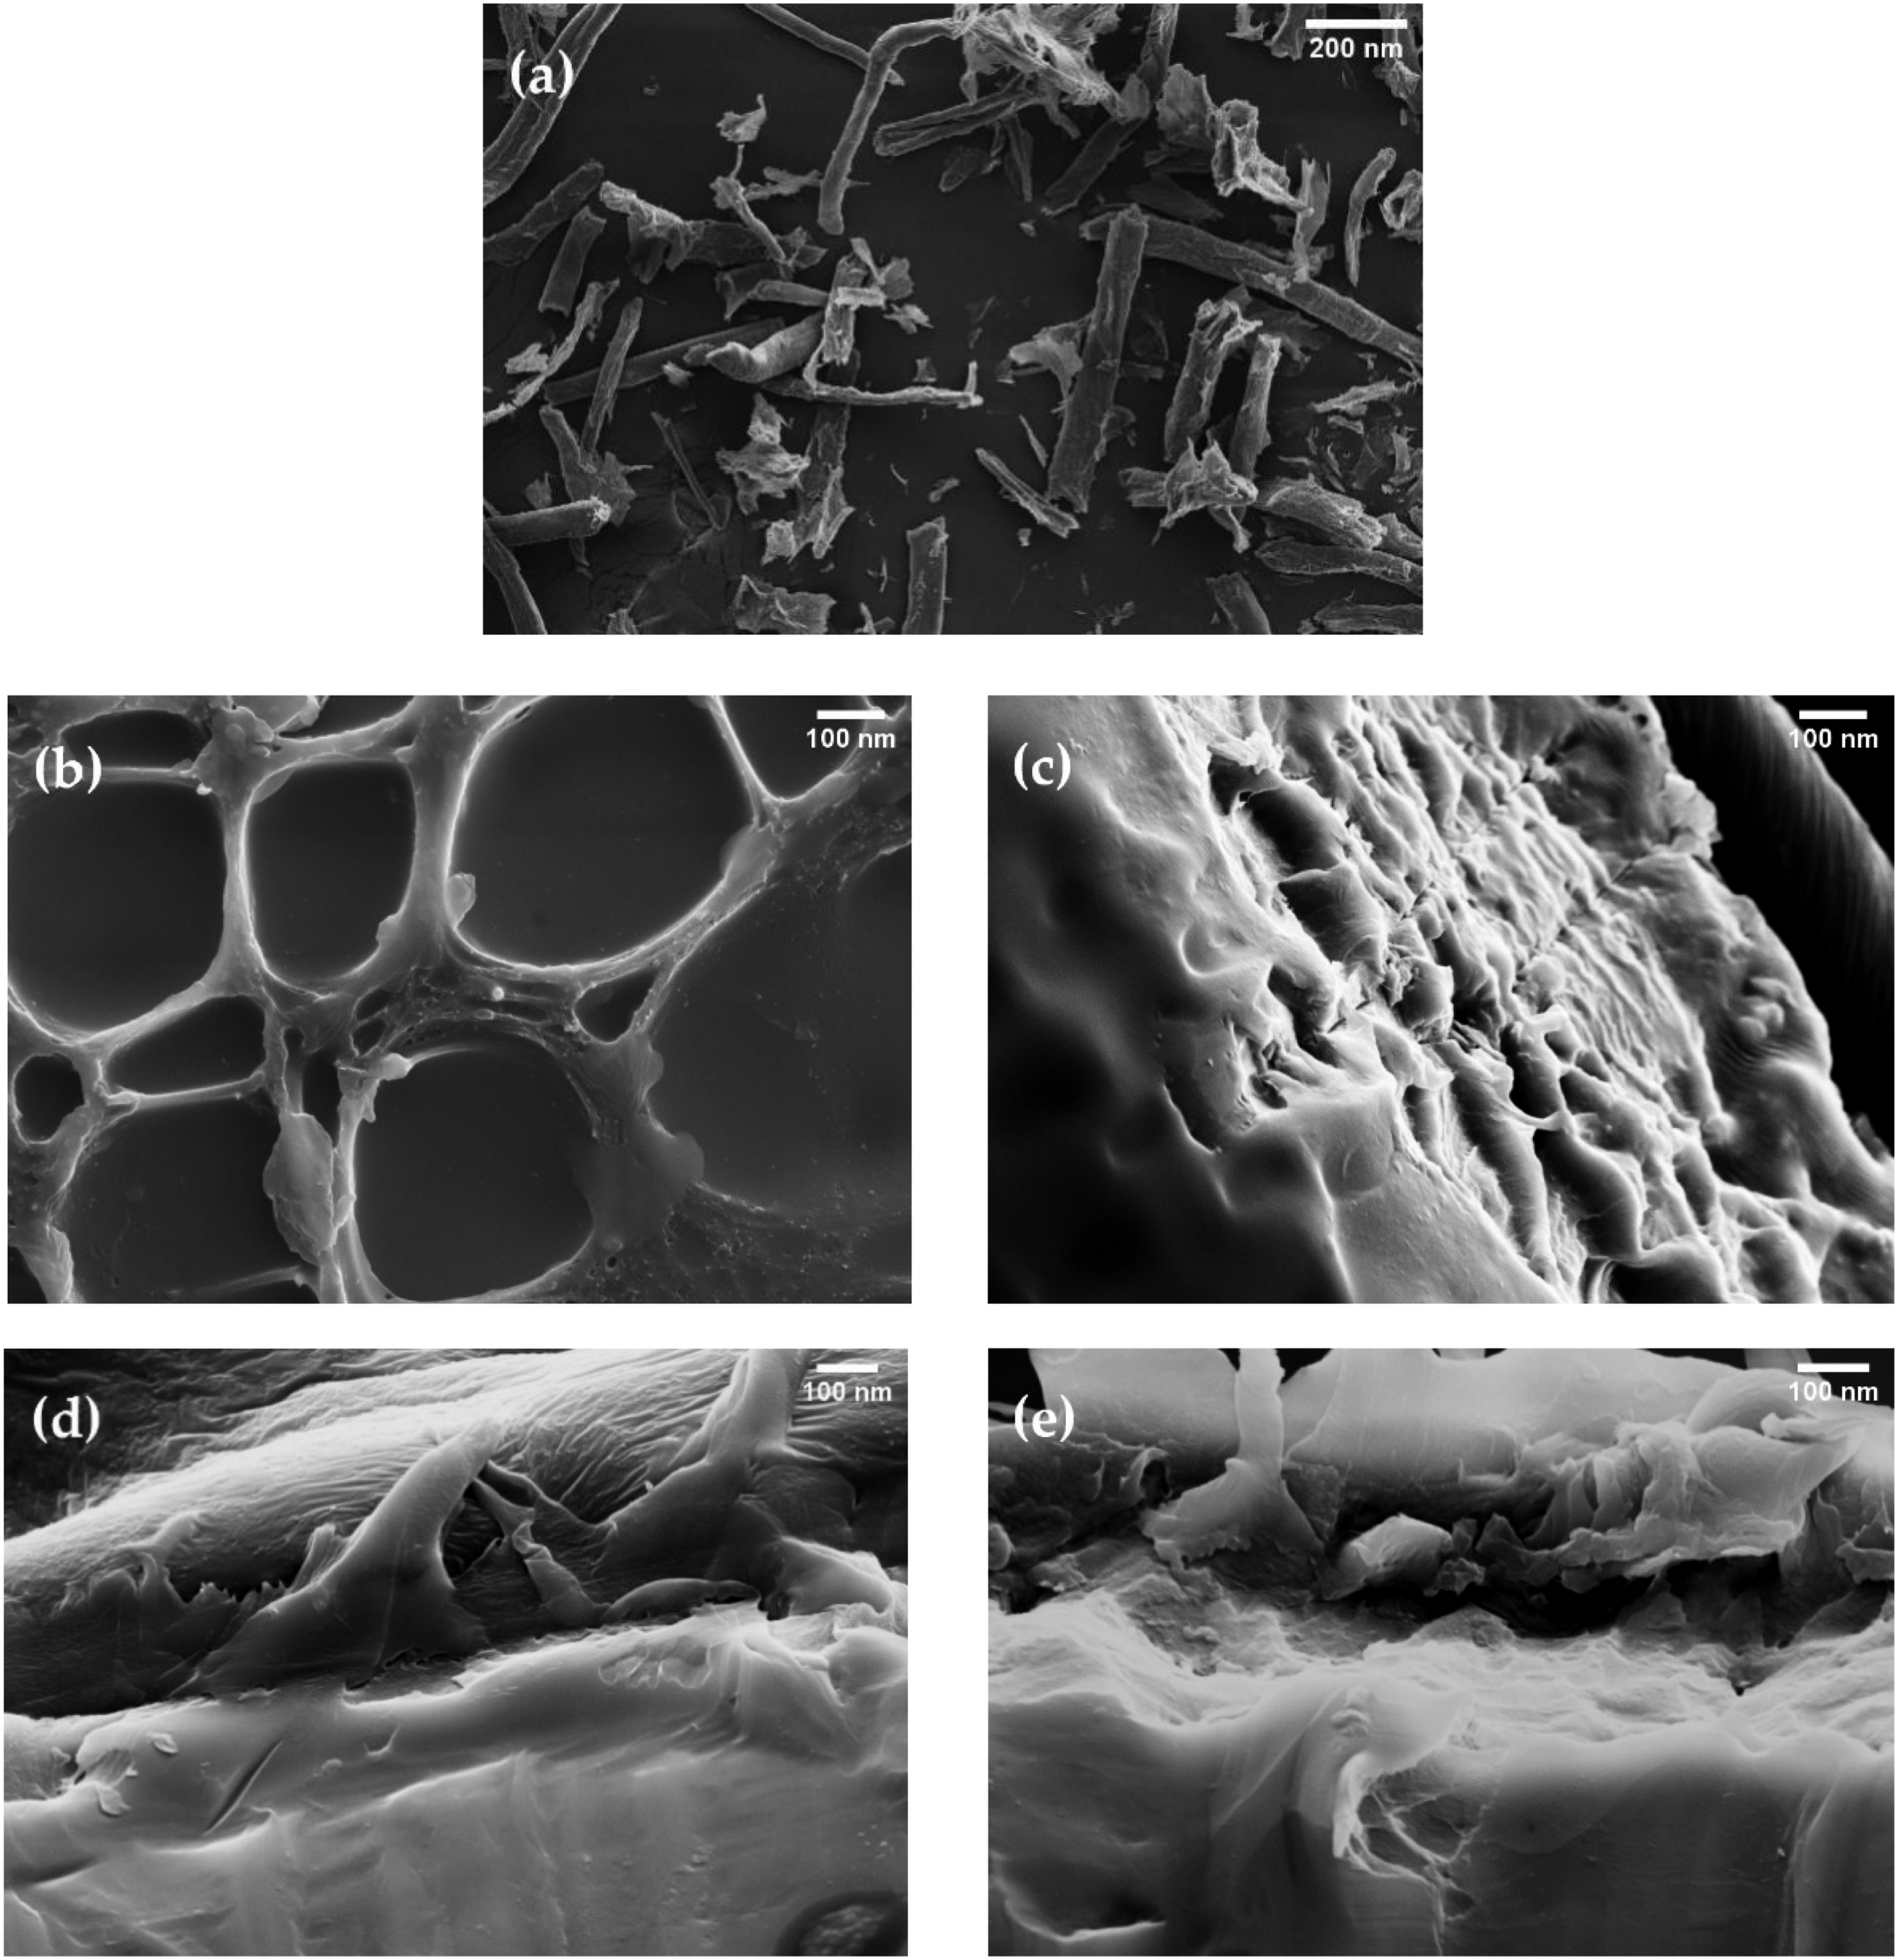
Figure 4(b), the micrograph of neat PVC, shows a regular porous structure and a honeycomb-like morphology. A large number of pores and fewer holes appeared that are regularly distributed on the PVC surface. The numbers of round pores were noticed on the surface probably as a consequence of the accelerated evaporation of tetrahydrofuran which has been introduced to the process of film production as a solvent. 31 The homogenous dispersion of reinforcements in a polymer matrix is a crucial requirement for effective improvement of the matrix properties. Meanwhile, Figure 4(c)–(e) shows the SEM micrographs of the fractured surface of nanocomposites with 0.5, 1 and 3 wt% CNCs accordingly. PVC/CNC presented a fracture surface that was relatively rougher when compared to neat PVC, at the same time the pore areas disappeared due to the incorporations of the CNC filler. In the nanocomposite film, several tiny dots appeared on the fracture surface, and these tiny white dots were effectively embedded into the matrix. This shows a good dispersion of CNC nanofiller within the PVC matrix, and that there is a better interfacial interaction between the two components, specifically at lower concentration of CNC. 32 More bumps that resembling ridges were observed with increasing content of CNC, suggesting that CNCs oriented in different directions were buried in the polymer matrix.
Effect of CNC on the crystallinity and thermal behavior of PVC/CNC nanocomposites
Differential scanning calorimetry (DSC) measurements were used to study the thermal phase transitions of polymeric nanocomposites based on PVC and CNC, allowing for the determination of crystallinity, glass transition temperature, melting, and crystallinity temperatures. In order to gain additional understanding of how the CNC filler affects the structure of PVC, the degree of crystallinity for all PVC/CNC nanocomposites was calculated using the following equation: DSC thermogram curve of PVC and PVC/CNC nanocomposites for different compositions.

DSC data of PVC and PVC/CNC nanocomposites.

Effect of CNC on the dielectric properties of PVC/CNC nanocomposites
The dielectric permittivity of a real part and imaginary part of neat PVC and PVC/CNC at 0.5, 1 and 3 wt% nanocomposites have been depicted in Figure 6(a) and (b). The results of real permittivity (ε′) as a function of frequency and CNC concentration are shown in Figure 6(a). It has been observed from Figure 6(a) that the real permittivity increased with an increased CNC content and this increase is more noticeable at lower frequencies. This results from the influence of space charge and electronic polarization.
36
The pure matrix material (PVC) had the lowest real permittivity at about 1.15, decreasing at high frequencies. This was due to the matrix consisting mainly of carbon and hydrogen atoms, which lacked permanent dipoles. As for PVC/CNC 1%, this nanocomposite has an almost stable real permittivity at 1.68, with an increase about 46.1% from the pure PVC. The contributions made by the material’s interface, orientation, atomic, and electronic polarisations were taken into account in the calculation of the dielectric constant of the nanocomposites.37–40 Frequency dependence of real part (a), and imaginary permittivity (b) of PVC and PVC/CNC at 0.5, 1 and 3 wt% nanocomposites.
The imaginary permittivity (ε’’) as a function of the frequency of pure PVC and PVC/CNC nanocomposites can be observed in Figure 6(b). Contrary to the result obtained in the study of real permittivity (ε′), PVC/CNC 1 wt% has been found to possess lower imaginary permittivity than other samples. The results showed that in the lower frequency region, the dielectric loss was high and was highest for the nanocomposites having a CNC content of 3 wt% at a given frequency, due to the interfacial polarization where at high CNC content, the interface between the CNC and the PVC matrix becomes more pronounced. However, the exact explanation for the above behaviour is somewhat difficult as dielectric loss depends on the fibre orientation. 41 Since the cellulose fibres were inserted in the composite materials in a statistically random orientation manner, there may be significant variations in the dielectric properties from region to region of the materials under investigation. 37 In addition, the water absorbance factor may also be responsible for the increase in conductivity as well as dielectric loss due to the hydrophilic nature of nanocellulose. As the mass fraction of nanocellulose filler increased, the water absorption capacity of composite material also increased, allowing water molecules to form monomolecular layer on the filler’s surface and further leads to increasing value of dielectric loss. As the frequency increased, the values of ε’’ started to decrease and reached a constant value after 105 kHz, which was explained by the absence of relaxation peaks due to the charge distribution and space charge polarisation. 36
In fact, one of the main drawbacks of synthetic polymers is their low dielectric constant values. In advanced electrical applications, high values of ε′ and low values of ε’’ are strongly required for their usage as dielectrics. For instance, it can be seen from the result that the addition of CNC demonstrated an improved dielectric constant in comparison to the synthetic polymers alone (pure PVC). Tanaka et al. 38 also stated that fillers have higher permittivity by nature than unfilled polymers, which leads to interfacial polarization. Regarding the obtained ε′ values of composites, they increased with the addition of CNC up to 1 wt% but for CNC 3 wt%, the ε′ values started to drop to 1.58. This reduction in permittivity is attributed to the restriction of polymer chain movement by nanoparticles. 39 In a study by Fothergill et al., 40 permittivity is found to decrease when the polymers are filled with fillers of nanometer size by several wt% which appears to indicate that the interaction zone surrounding the nanoparticles has a profound circumspection effect on the dielectric behaviour of the nanocomposite.
Effect of CNC on the dielectric strength on the PVC/CNC nanocomposites
Figure 7 shows the Weibull distribution of the dielectric strength of PVC and PVC/CNC nanocomposites. The scale parameter α is defined as the electric field strength corresponding to the breakdown probability of 63.2% and the shape parameter β represents the dispersion of the testing data, which are shown in Table 3. As the shape parameter, β becomes larger, the breakdown strength range will get smaller, resulting in a smaller dispersion of the breakdown strength.
42
Referring to the figure, it can be seen that the breakdown strength spreads over a wide range of values for all polymer and nanocomposites material. From Table 3, the breakdown strength of neat PVC is about 371.4 kV/mm and that of PVC/CNC 1 wt% is about 461.3 kV/mm indicating an increase of 24.2%. The breakdown resistance performance of PVC/CNC nanocomposites is superior as compared to neat PVC. In other words, nanofillers play a positive role in the enhancement of the AC breakdown of PVC material in the whole investigation of mass range. The addition of CNC reduced the chance of electrical breakdown by providing additional barrier to charge movement within the material and reduced localized electric field concentration. However, the breakdown strength of PVC/CNC 3 wt% decreased slightly, which is 411 kV/mm, compared to PVC/CNC 1 wt%. This reduction is associated with the agglomeration phenomenon that will cause poor uniformity of the film, leading to unstable dielectric strength. According to Ran et al.,
43
excessive CNC content may cause the breakdown performance of samples to worsen since the agglomerated particles can form electrical point weaknesses and are easy to induce property deterioration. Weibull distribution of the breakdown strength. Breakdown scale and shape parameters of PVC/CNC nanocomposites.

Discussions
The incorporation of CNC has improved the properties of polymer nanocomposites. This is due to the excellent characteristics of CNC which makes this nano dimensional material an ideal for the reinforcing phase in the polymer matrix. The presence of enormous hydroxyl groups on the surface of the cellulosic nanofiller could form hydrogen bonding and participate in the chemical reaction with matrix for the better reinforcement in the matrix
44
Schematic diagram of possible chemical interaction between PVC and CNC.
In an effort to combine the dielectric properties and the dielectric strength results, the idea of conditional probability is applied based on a sample event.
47
This is done by proposing each sample’s normalized dielectric index (NDI). The value of dielectric properties and dielectric strength are normalized with respect to critical values, and the equation for determining NDI is defined as follows: Normalized dielectric index of PVC/CNC nanocomposites.

Conclusions
In this work, CNCs were isolated from filter paper using various processes, including alkaline and bleaching treatments, and further treated with acid hydrolysis. The influence of CNC on the structures and dielectric properties of PVC/CNC nanocomposites was evaluated. The following conclusions can be drawn: (1) There are structural changes observed after the incorporation of CNC into the PVC matrix. The FTIR spectrum revealed an increase in peak intensity with increasing CNC content, specifically the O-H peak in the region 3500 - 3200 cm−1. The surface morphology of nanocellulose was determined, and the introduction of nano sized CNCs filled the micro-voids on the surface of the PVC/CNC nanocomposite, which revealed the good dispersion of CNC nanofiller within the PVC matrix. Based on the DSC results, addition of nanocellulose CNC moves the composites peak to the higher temperature and the PVC/CNC nanocomposite film with optimal CNC content has high crystallinity at 2.53%, which indicates that CNC improved thermal characteristics of composites. (2) Moreover, dielectric properties spectra showed increments in real permittivity and decrements in imaginary permittivity, especially for the PVC/CNC 1 wt% sample, which has a stable real permittivity at 1.68 and an icrement about 46.1% from the pristine PVC. This proves that the presence of nano sized CNCs at the interface of the PVC matrix increases the polarization ability of the pristine material to become a charge absorber and at the same time become a barrier to the movement of free electrons. The dielectric strength also showed an increment of 24.2% after the addition of 1% CNC when compared to the pristine PVC. (3) Based on overall performance, it can be concluded that the improvement of the PVC/CNC nanocomposite structure at 1 wt% filler content has a very significant impact on the enhancement of the dielectric properties of the nanocomposite, as demonstrated by the NDI index. This is substantially useful in the development of bio-based materials for applications in the field of high voltage electrical insulation.
Footnotes
Acknowledgments
The authors thank the Ministry of Higher Education Malaysia, Universiti Malaysia Sabah, University of Malaya, and Universiti Malaysia Pahang for supporting this work through research funds or laboratory facilities.
Author Contributions
N. S. A. Badi, M. Z. H. Makmud, and Z. Jamain conceived and designed the research methodologies; N. S. A. Badi and M. Z. H. Makmud performed the experiments and analysed the data; N. S. A. Badi and M. Z. H. Makmud wrote the paper; Z. Jamain, K. N. M. Amin and H. A. Illias gave the feedback.
Declaration of conflicting interests
The author(s) declared no potential conflicts of interest with respect to the research, authorship, and/or publication of this article.
Funding
The author(s) disclosed receipt of the following financial support for the research, authorship, and/or publication of this article: This research was funded by the Ministry of Higher Education (MOHE) Malaysia through FRGS Grant Scheme FRGS/1/2023/STG05/UMS/02/2.