
Abstract
This research investigated the optimization of CNC milling parameters on hardness and surface roughness properties resulting from variations in speed (220, 470, and 720 rpm), feed rate (200, 300, and 400 mm/min), and depth of cut (3, 5, and 7 mm) based on experimental design. This study aimed to evaluate the effects and relation of milling parameters using different end mill diameters (8 and 12 mm) for machining wood-plastic composites (WPCs). All of the experimental runs were determined by the Box-Behnken design and optimized using the response surface methodology. The findings from this study revealed that the main milling parameters significantly affected the hardness, average roughness (Ra), and mean peak-to-valley height (Rz) of the WPCs. Increasing the speed in a range from 220 to 720 rpm resulted in higher hardness values. On the other hand, the Ra and Rz was decreased. Additionally, this experimental result is different from the morphological structure and surface observation. It was seen that the CNC milling conditions using high speed at 720 rpm displayed smooth surfaces, which resulted in visible evenness on the WPC surfaces. Finally, numerical optimization is a good technique for the experimental results and the predicted values. The predicted conditions for the CNC milling process using end mill diameters of 8 and 12 mm included a speed of 720 rpm, a feed rate of 300 mm/min, and a depth of cut of 3 mm with the best desirability of 0.973 (97.30%). These conditions were verified in the response models and confirmed the optimal values from observed values for the variables included in the models. Also, these optimal conditions for the CNC milling parameters can be used on other types of WPCs with melting points of plastic higher than 180°C.
Keywords
Introduction
Wood-plastic composites (WPCs) are one of the important products that are increasingly employed as interior and exterior building materials.1,2 These WPC products exhibit multifunctional characteristics, such as a combination of exceptional mechanical properties and flame retardancy, which can be achieved with the addition of specific additives during composite processing.3,4 WPCs are manufactured by thoroughly mixing ground wood fiber as reinforcement and heated thermoplastic as the matrix.5–7 Commonly used thermoplastics include polyethylene (PE), polystyrene (PS), polypropylene (PP), polylactic acid (PLA), and others.8,9 Among all plastic types, the use of PP has increased significantly for economic and environmental reasons in society similar to plastic recycling.7,10,11 The use of such plastics as the matrix in WPCs is one of the growing areas of interest because of the expanding WPC market. 12 Also, cost competitiveness is achieved by taking advantage of cheap, abundant, and biodegradable wood fibers as structural fillers.13,14 The compounding and forming processes vary based on the product types and manufacturing facility.2,15 Generally, WPC products such as lumber or panel are produced with three main processes including injection molding, extrusion, and compression molding.1,4,16 Additionally, the machining process is an important part of the manufacturing of WPC materials. This process is considered to give the WPC products the desired shape. The requirements for higher machining quality and manufacturing efficiency of materials have led to the application of WPC products that have a variety of uses.3,17
The milling process is one of the most significant manufacturing processes in WPCs-cutting operations. This manufacturing process is planned and improved to obtain either high quality or low cost.18,19 In the manufacturing industry, new techniques have been developed for the manufacturing performance through better process productivity, improved part quality, and advanced tool performance. 20 To keep increasing the mill machining performance, the computer numerical control (CNC) technique has been recently developed to replace the conventional machining process.21,22 The CNC method is a manufacturing machine technology that is widely used in many industries. The CNC machine is used to manufacture high-precision mass products. This technique employs a production process that automates the movement, control, and precision of the machine and cutting tools through the use of preprogrammed computer software.18,23 CNC is widely used in manufacturing for machining metal, plastic parts, and composites. Milling is a common cutting process and the operation can also be automated with CNC.24,25 Additionally, it has been found that the tool geometries and certain cutting parameters also influence these effects. The effects of cutting speed, feed rate, and depth of cut including surface quality on the machinability of WPCs were assessed.19,21,23 Guo et al. 26 reported that the changes in cutting forces resulted in surface roughness quality during orthogonal machining of WPCs, and they were positively related to cutting depth. Their results also confirmed that the process resulted in smooth roughness quality when the cutting depth was low. Pei et al. 27 affirmed that the cutting depth contributed the most to cutting temperature, followed by spindle speed and feed rate. This behavior shows that a series of carefully designed milling experiments and surface defects on WPCs are strongly linked to milling factors and material properties.18,22
The Box-Behnken design (BBD) was used to determine the experimental runs of the CNC milling process for the WPCs. However, the BBD is still considered to be more proficient and powerful than other designs such as the three-level full factorial design, central composite design (CCD), and Doehlert design.20,24 In general, the factors are set at one of three equally spaced values, usually coded as low (−1), medium (0), and high (+1).24,28 Also, this process is the experimental design for response surface methodology (RSM). The RSM, using a proper design of experiment, has been used extensively.1,3,21,29 The RSM is a collection of statistical analyses useful for the development, improvement, and optimization processes applicable in almost every field.1,23,25 It is worth applying the conditions when numerous variables (independent variables) potentially influence the quality characteristics (response variables) of the product process. 30 The basic idea of RSM is to use a sequence of designed experiments to obtain an optimal response.
In this study, the requirements for higher machining quality and manufacturing efficiency led to a significant amount of research aimed at control and monitoring. It is not surprising that many researchers have focused on understanding these aspects of WPC machining. Thus, the objective of the present work was to investigate the effects of the CNC milling parameters on hardness and surface roughness responses during the machining of WPC materials and to optimize these milling parameters using the RSM. Furthermore, the surface changes and interfacial morphologies of the WPCs after the milling process were also observed using optical microscopy and Field Emission Scanning Electron Microscopy (FE-SEM).
Materials and methods
Materials
The plastic matrix used in this study was acquired from Southern Plastic Co., Ltd (Songkhla, Thailand) and comprised recycled polypropylene (rPP) with a density of 0.93 g/cm3 and a melt flow index of 11 g/10 min at 230°C. The rubberwood flour (RWF) used as a reinforcing material was supplied by a local furniture company (Trang, Thailand). Before compounding, the RWF was screened on a sieve to classify the particle size of 80 mesh (less than 177 microns) and then dried in an oven at a temperature of 110°C for 8 h to remove the moisture content (less than 1%). The calcium carbonate (CC) modified surface, used as a filler in the WPCs, was purchased from Sand and Soy Industry Company Ltd, (Lopburi, Thailand). The coupling agent in this study was maleic-anhydride-grafted polypropylene (MAPP) with a grafting ratio of 8–10% maleic anhydride, which was provided by Sigma-Aldrich (Missouri, USA). It was used as the interfacial bonding between matrix and reinforcement. The ultraviolet stabilizer (UV stabilizer) with MEUV008 coding was purchased from TH Color Company Ltd (Samut Prakan, Thailand). The paraffin wax as a lubricant (Lub) was also supplied by Nippon Seiro Company Ltd (Yamaguchi, Japan).
Preparation of the wood-plastic composite samples
The optimal formulation for construction material used in this research was 51.8 wt% rPP, 35.9 wt% RWF, 7.2 wt% CC, 3.9 wt% MAPP, 0.2 wt% UV stabilizer, and 1.0 wt% Lub. 31 Initially, these components were mixed and melt-blended into WPC materials using a twin-screw extruder (Model CTE-D25L40 from Chareon Tut Co., Ltd, Samut Prakan, Thailand). The seven temperature zones from the hopper to the die were 170, 175, 180, 185, 185, 190, and 200°C, to reduce the degradation of the WPC compositions. 32 The screw rotation speed was set to 40°rpm and a pressure of 6.89 MPa. The extruder strand passed through a cutting pellet machine with WPC pellet sizes of 2-3 mm. Prior to compression, the WPC pellets were dried in an oven at a temperature of 50°C for 8 h to remove moisture content (less than 1%). Subsequently, the WPC pellets were weighed at 200 g and then molded using a compression molding machine from a rectangular mold with dimensions of 50 mm (width) × 50 mm (length) × 30 mm (thickness). The best conditions for the compressing process were set at a temperature of 190°C under a pressure of 10.34 MPa for 20 min with processes of pre-heating (5 min), compressing (10 min), and cooling (5 min), respectively. Experiment was carried out using 90 samples.
Experimental design and optimization of CNC milling conditions
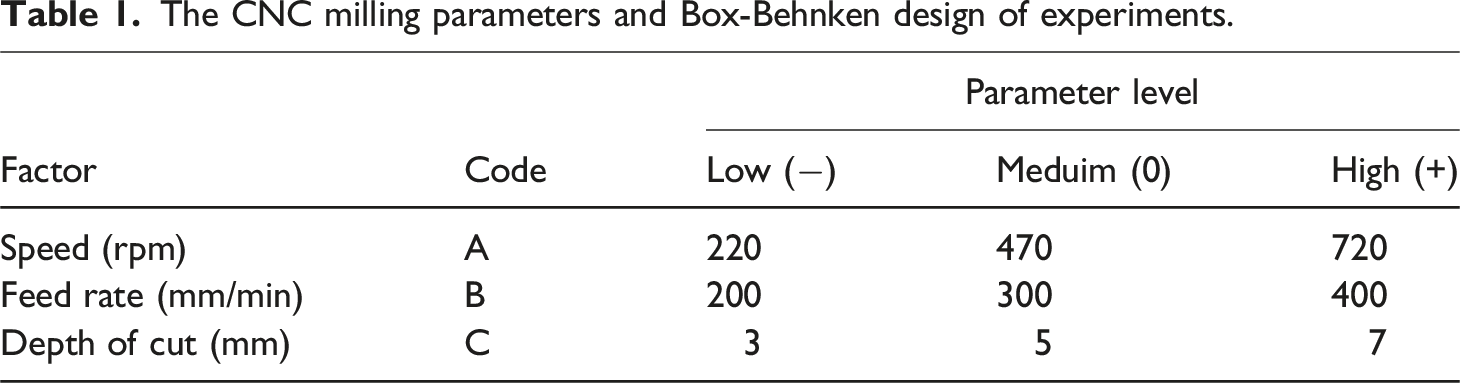
The CNC milling parameters and Box-Behnken design of experiments.
Experimental runs using Box-Behnken design and responses.
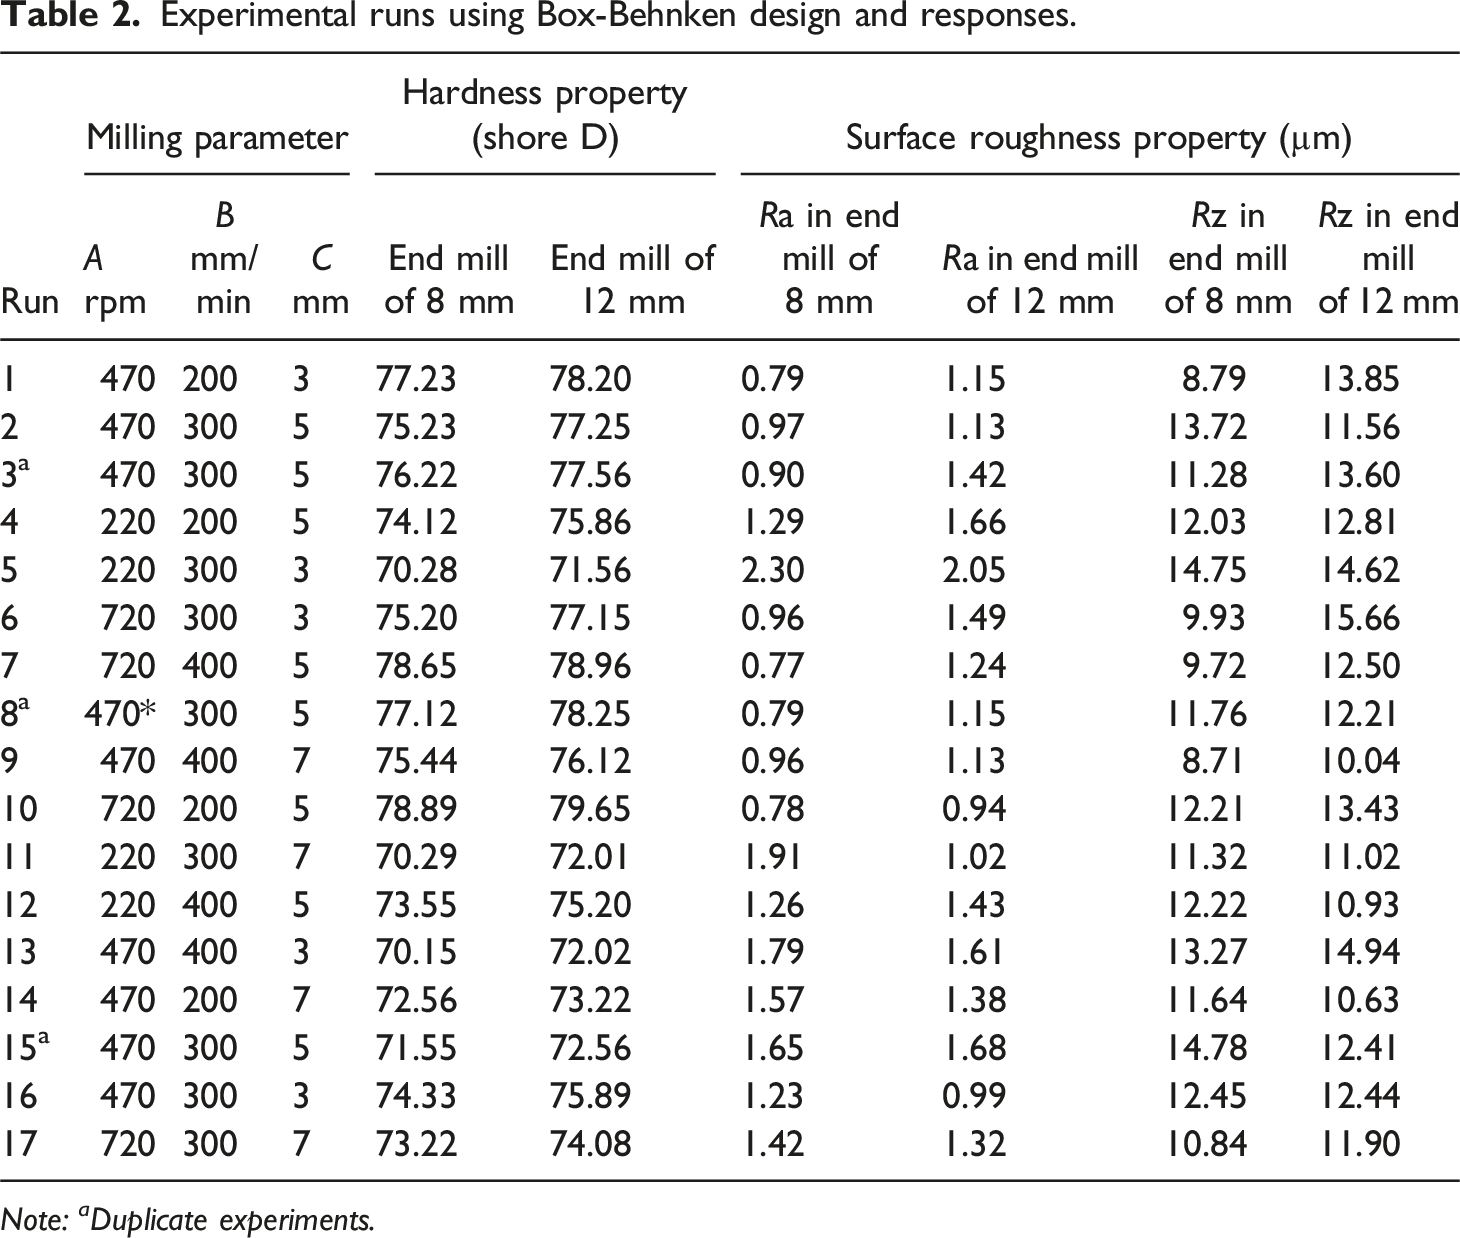
Note: a Duplicate experiments.
The data for each CNC milling condition following the experimental design were analyzed using ANOVA with a 5% significance level (α = 0.05) to identify the significant effects of each factor. Multiple regression coefficients were used to analyze the relationships of several variables exhibited in linear, quadratic, and interaction terms of independent variables in response surface models. The general regression models were assumed to relate to these responses, as exhibited in equation (1). Also, the response surface methodology (RSM) was used to optimize the quality parameters of CNC mill machining. The optimal condition was presented under the scope of determined factors, which were generated in the form of response contour plots.
Where Y predicted is the response parameter, k is the number of factors, β0 is the constant coefficient, x i, and x j are the factors (independent variables), β i is the linear coefficient, β ii is the quadratic coefficient, β ij is the interaction coefficients between the input factors x i and x j , and ε i is the residual associated with the experiment (Petdee et al., 2023).
Machine setup and methodology
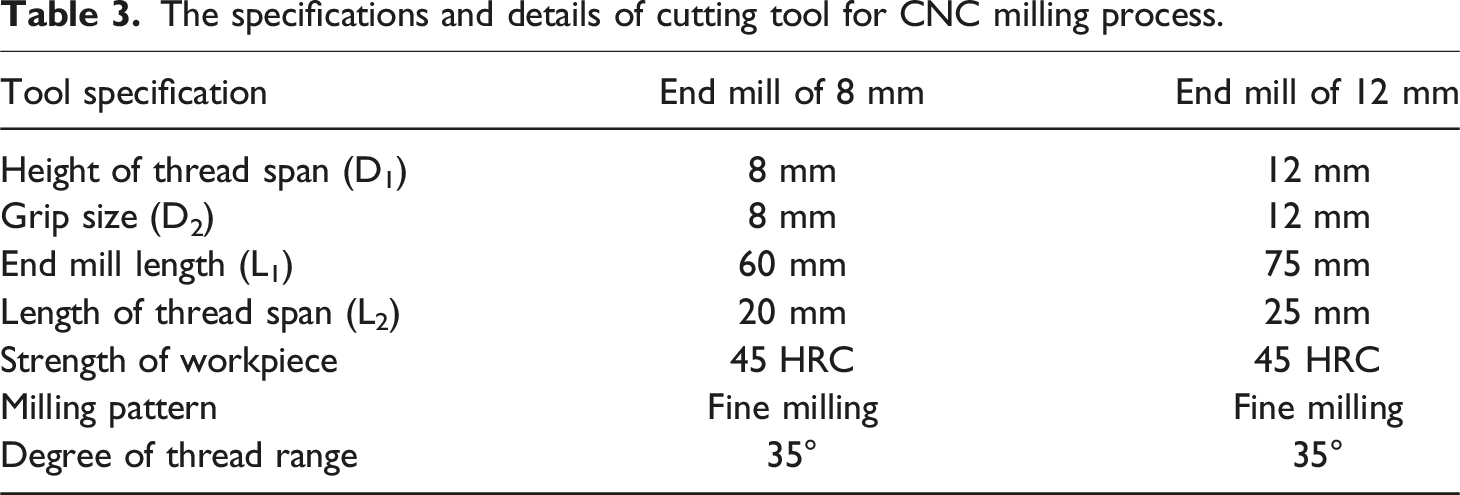
The specifications and details of cutting tool for CNC milling process.
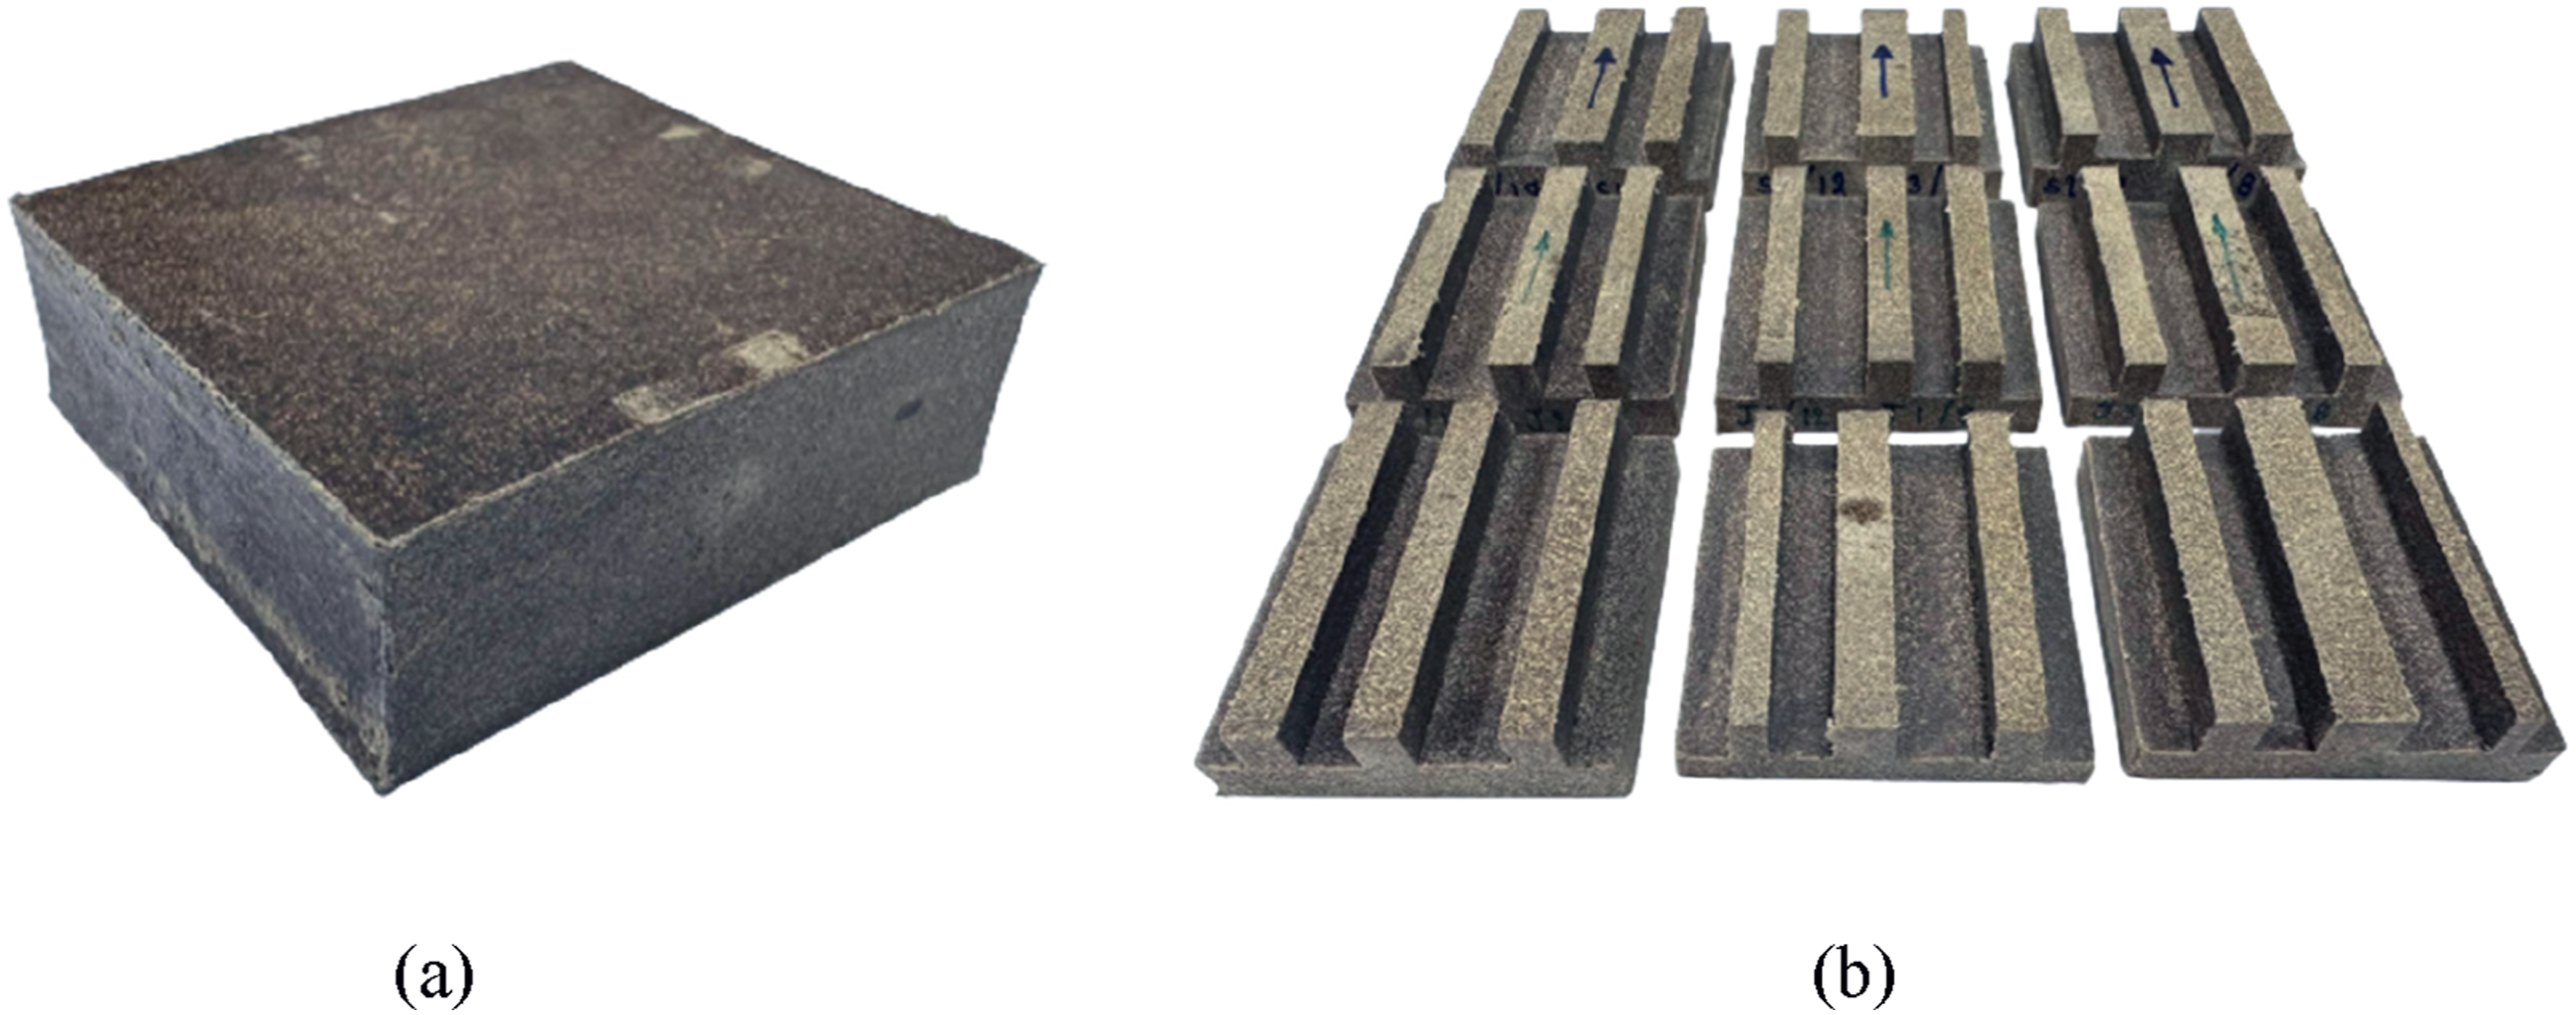
WPC sample used in the experiment (a) before the CNC milling process and (b) after the CNC milling process.
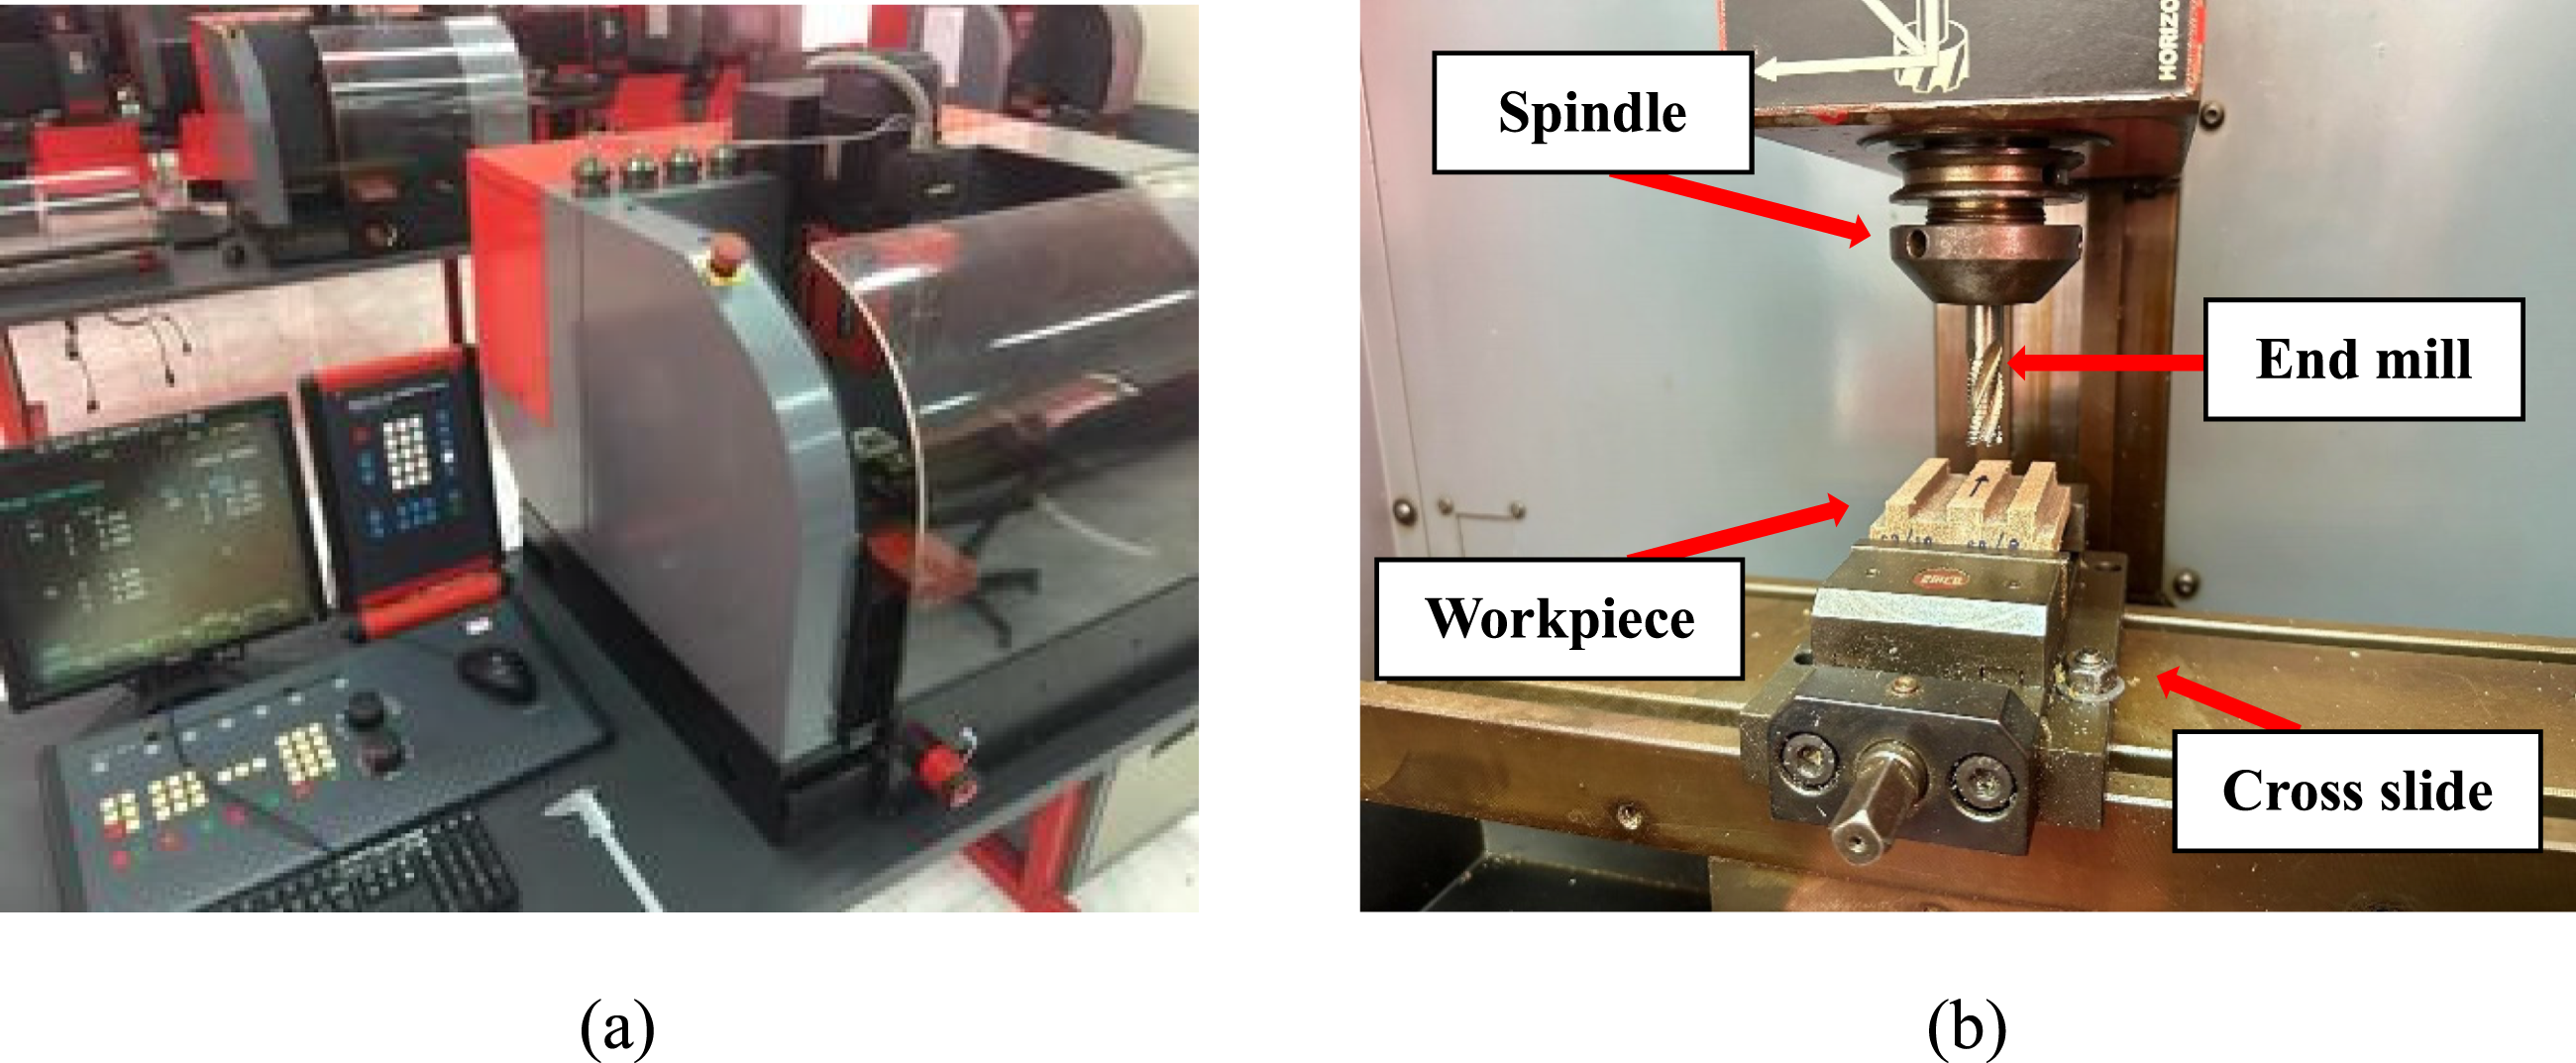
Machine setup and equipment for the milling process showing (a) the CNC milling machine and (b) equipment setup for the milling process.
Characterizations of WPC samples
Hardness measurement
The hardness test after CNC mill machining evaluated the hardness on the surface of WPC samples. The specimens were prepared in accordance with the ASTM D2240 specification. All of the samples had approximate dimensions of 50 mm (length) × 50 mm (width) × 40 mm (thickness) and were tested employing a mechanical Shore D Durometer (Model GS-702G from Teclock Corporation, Nagano, Japan). The hardness response values were tested at room temperature (25°C) and reported the average value of five replications.
Surface roughness measurement
The surface roughness characteristics of WPCs after the CNC milling process were used to evaluate the smooth machined surface using a surface profilometer on a Portable Surface Roughness Tester (Model SJ-210 from Mitutoyo Co., Ltd. Bangkok, Thailand) with a cut-off length of 0.8 mm for the surface roughness measurements. The surface roughness parameters, namely average roughness (Ra) and mean peak-to-valley height (Rz), were considered to evaluate the quality of the surface of WPC materials. The Ra is the arithmetic mean of the absolute values for the profile deviations from the mean line and is commonly used as a parameter in finished surface measurement. Similarly, the Rz is the average of the successive values of maximum heights within a sampling length calculated over the evaluation length. The surface roughness response was presented from the digital information. The experimental data obtained from the roughness tests was processed using Design-Expert software (version 8.0.6, Stat Inc.) to calculate the Ra and Rz variables. Rectangular specimens with dimensions of 50 mm (width) × 50 mm (length) × 40 mm (thickness) were used for measuring roughness. The test was characterized at room temperature (25°C) with five replications.
Visual surface and morphological observation
The changes in the WPC surfaces with different milling parameter conditions were measured using optical microscopy (Model Zeiss Axioskop, Oberkochen, Germany). The interfacial morphology of WPCs after CNC mill machining was observed. Additionally, composite sample surfaces including voids, cracks, interfacial bonding, and the dispersion of the wood flour in the recycled plastic matrix were investigated from a cross-section area using an FE-SEM Model: FEI Apreo microscope from FEI Company (Oregon, USA). Before the FE-SEM observation, the WPC surfaces were gold-coated using a sputter coater to prevent electron charging during the imaging analysis with an accelerating voltage of 20 kV. Micrograph images were taken at a magnification level of 100x.
Results and discussion
Model adequacy checking
The model adequacy checking of hardness properties is used as an example to analyze the data normality of the CNC milling process with an end mill of 8 mm. The estimation of milling parameters testing from the hypothesis of the estimator is based on major assumptions of the experimental design.1,23 In this study, the adequacy of the response models was investigated with various diagnostic plots, such as normal probability plots of the residuals, plots of residuals versus predicted response, and plots of predicted response versus actual values. The model adequacy of hardness properties machined using an end mill of 8 mm is presented as an example in Figure 3. According to Figure 3(a), this plot displays the normal probability plot of residuals. These data follow a normal distribution with mean and variance in which the data plots should be approximately linear. It is reasonable to assume that the error terms are normally distributed; the fitted model is the linear regression model that is normally distributed. In addition, Figure 3(b) illustrates the relationship between internally studentized residuals and the predicted response obtained from the fitted model. This stage is a visual check of the assumption of constant variance.28,30 It is observed that the plot is randomly scattered with a consistent top-to-bottom range of residuals across the predictions on the horizontal axis. On the other hand, the response model based on the multiple regression model is used instead if the predictor on the horizontal axis is a new and different predictor. Moreover, the plot collections around the diagonal line for predicted response and actual values are shown in Figure 3(c). The continuous response values on the vertical axis are predicted and observed from a random model against the actual value.3,31 This might explain the displayed plot collections around the diagonal line for predicted response and actual values, which suggests that the predicted responses were relatively close to the actual results. Also, the data are distributed near the straight line at an acceptable level. It can be concluded that the predicted response illustrated adequate agreement with the actual value. Model adequacy check for hardness response (end mill of 8 mm) showing (a) normal probability plot of the residuals, (b) plots of residuals versus predicted response, and (c) plots of predicted response versus actual values.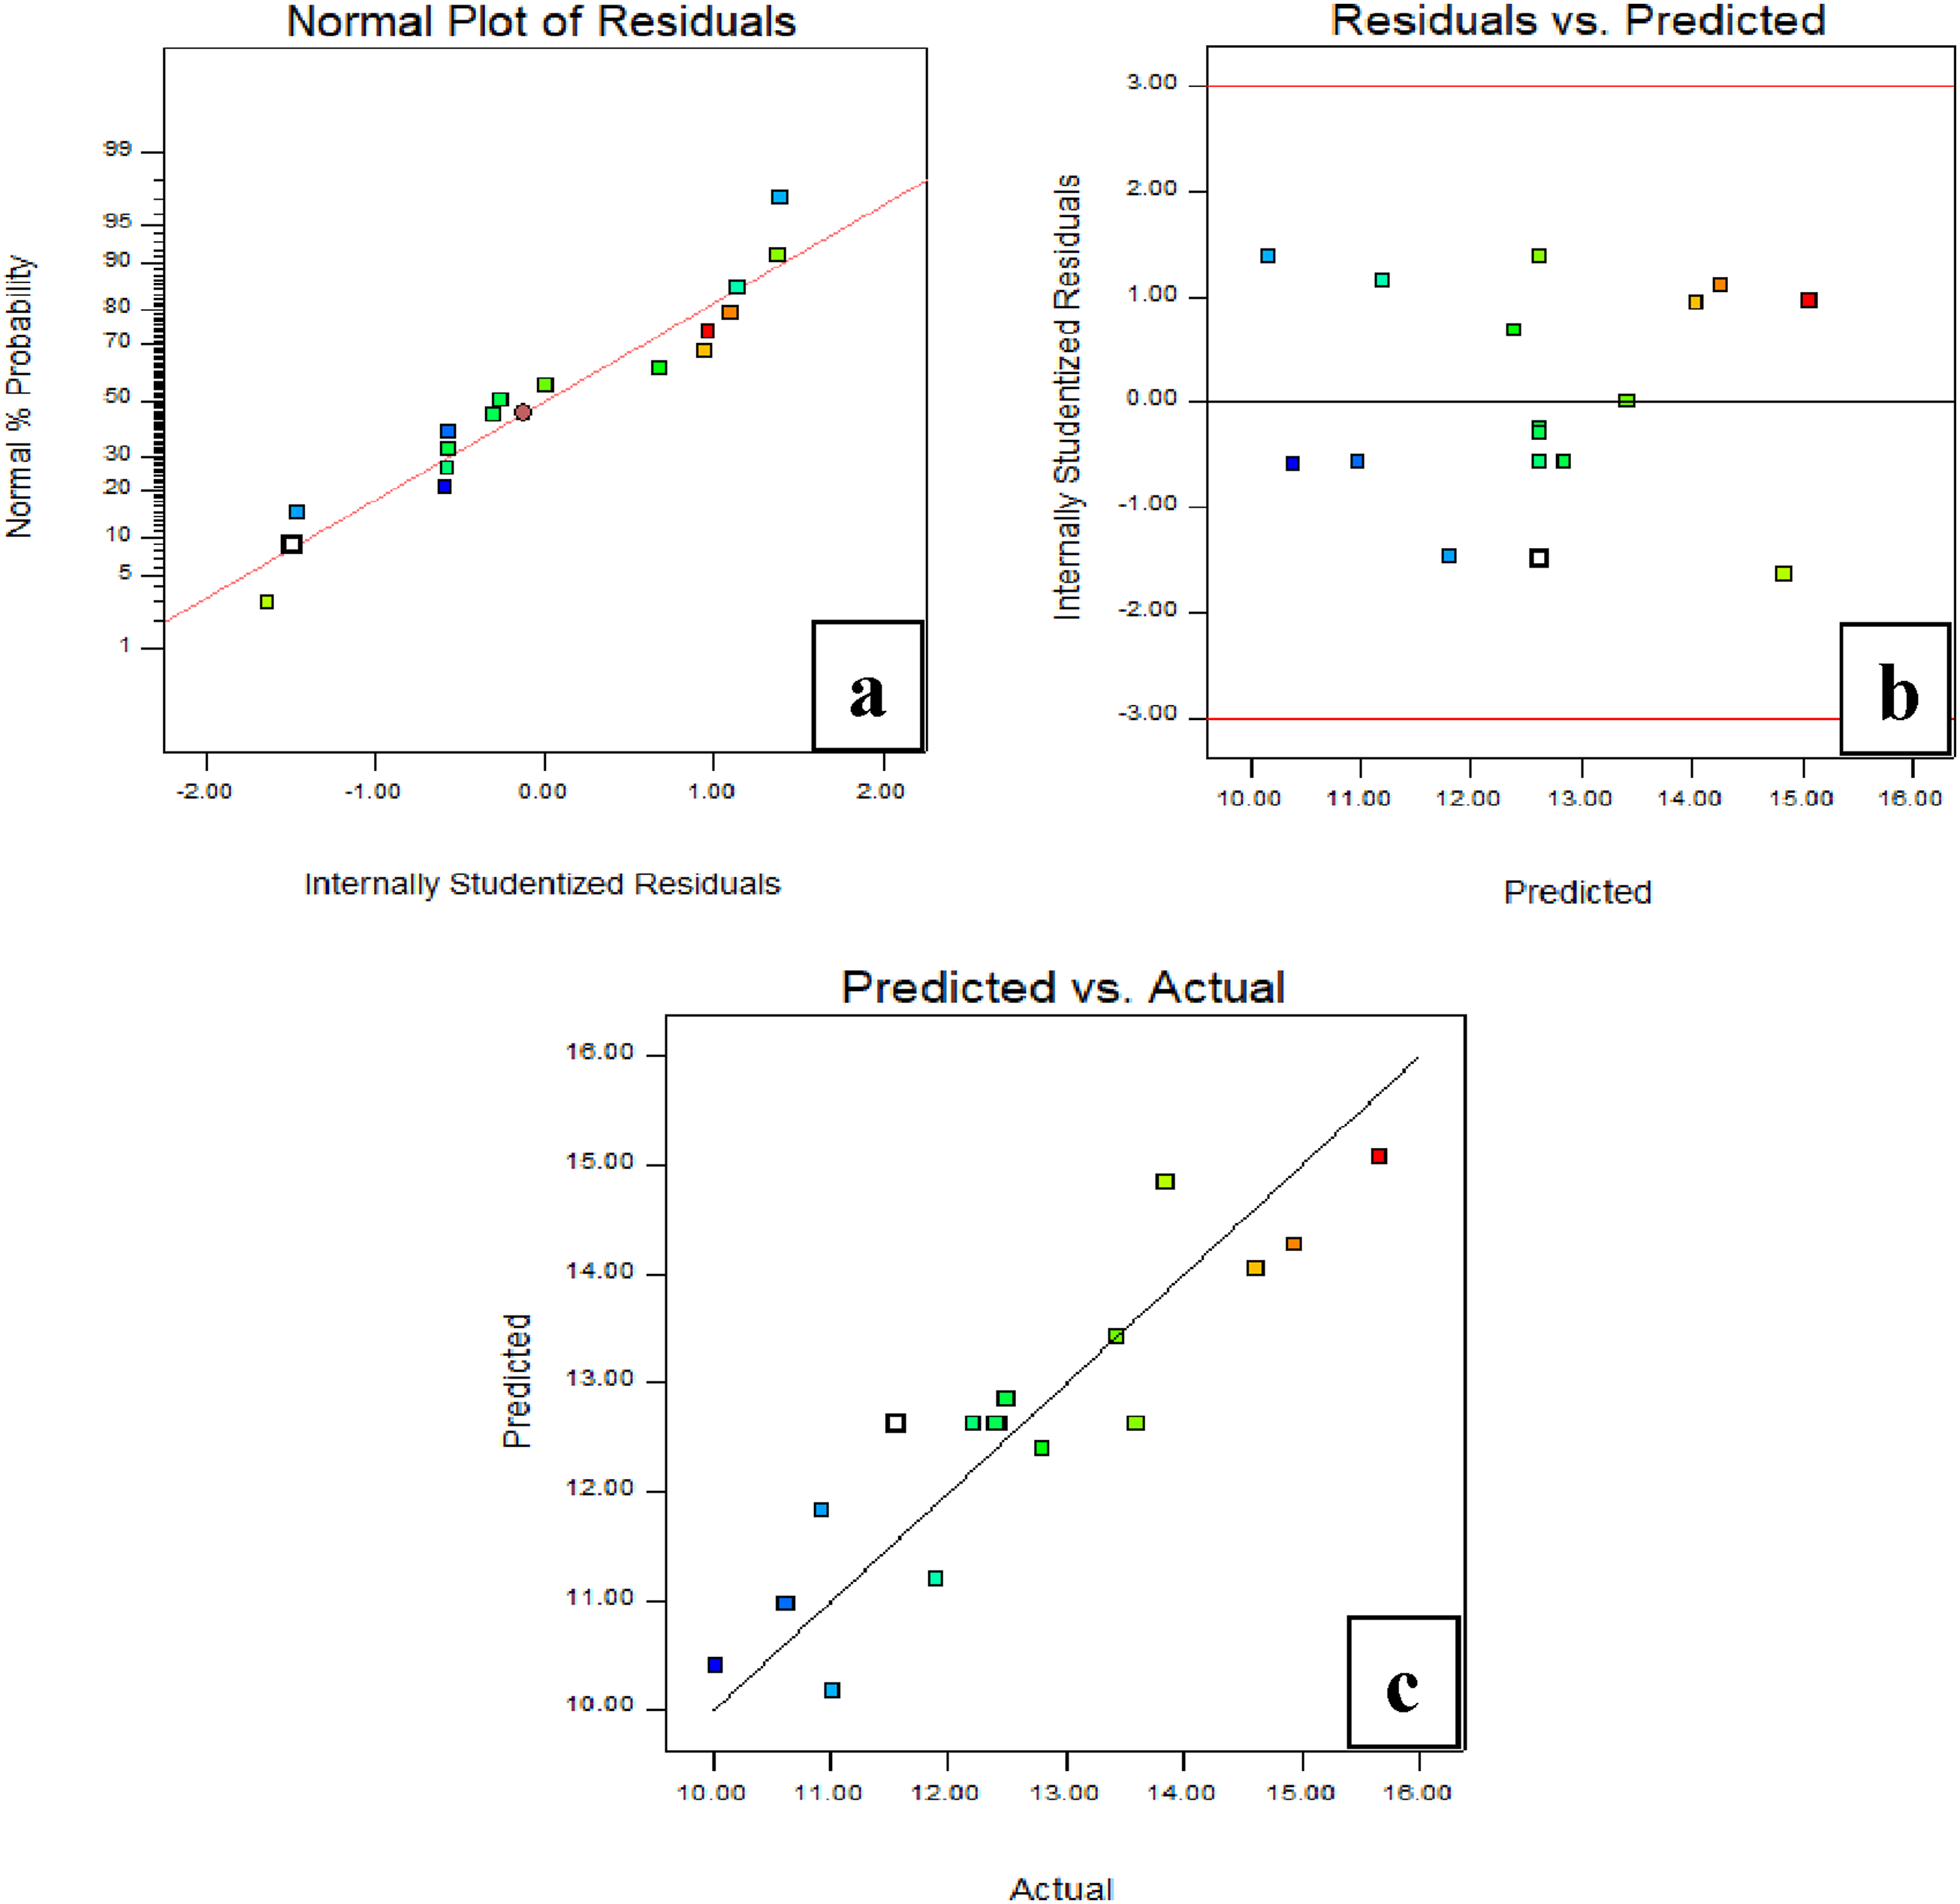
Fitting model and statistical analysis
Fitted model summary for hardness response of WPCs machined with end mill of 8 mm.
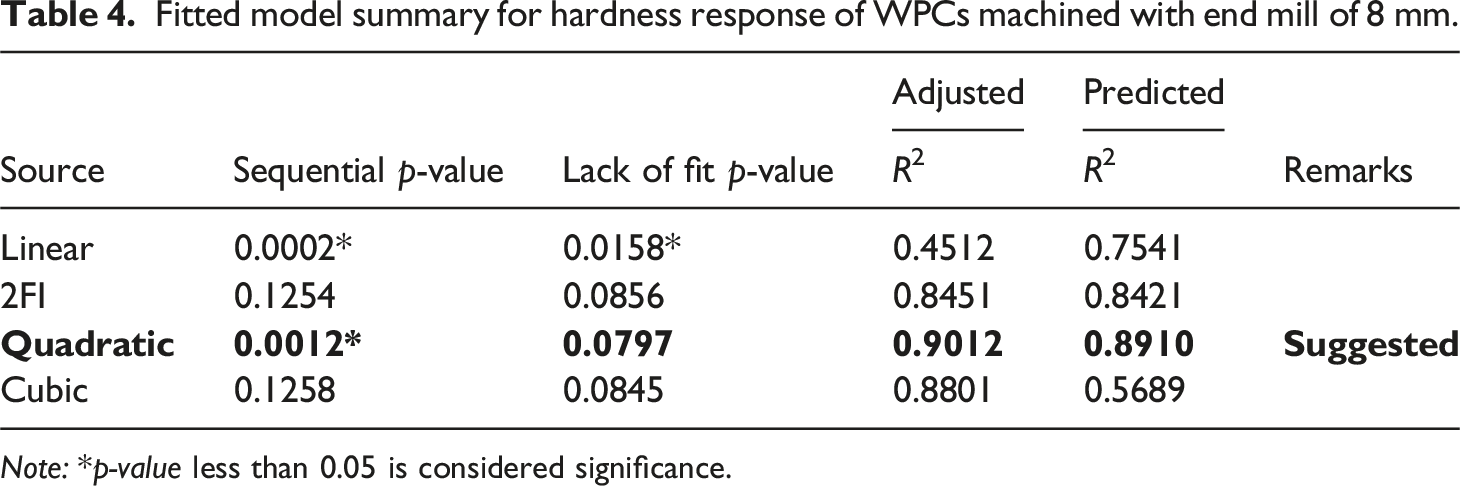
Note: *p-value less than 0.05 is considered significance.
Analysis of variance based on the fitted linear and quadratic response models for hardness, Ra, and Rz properties.
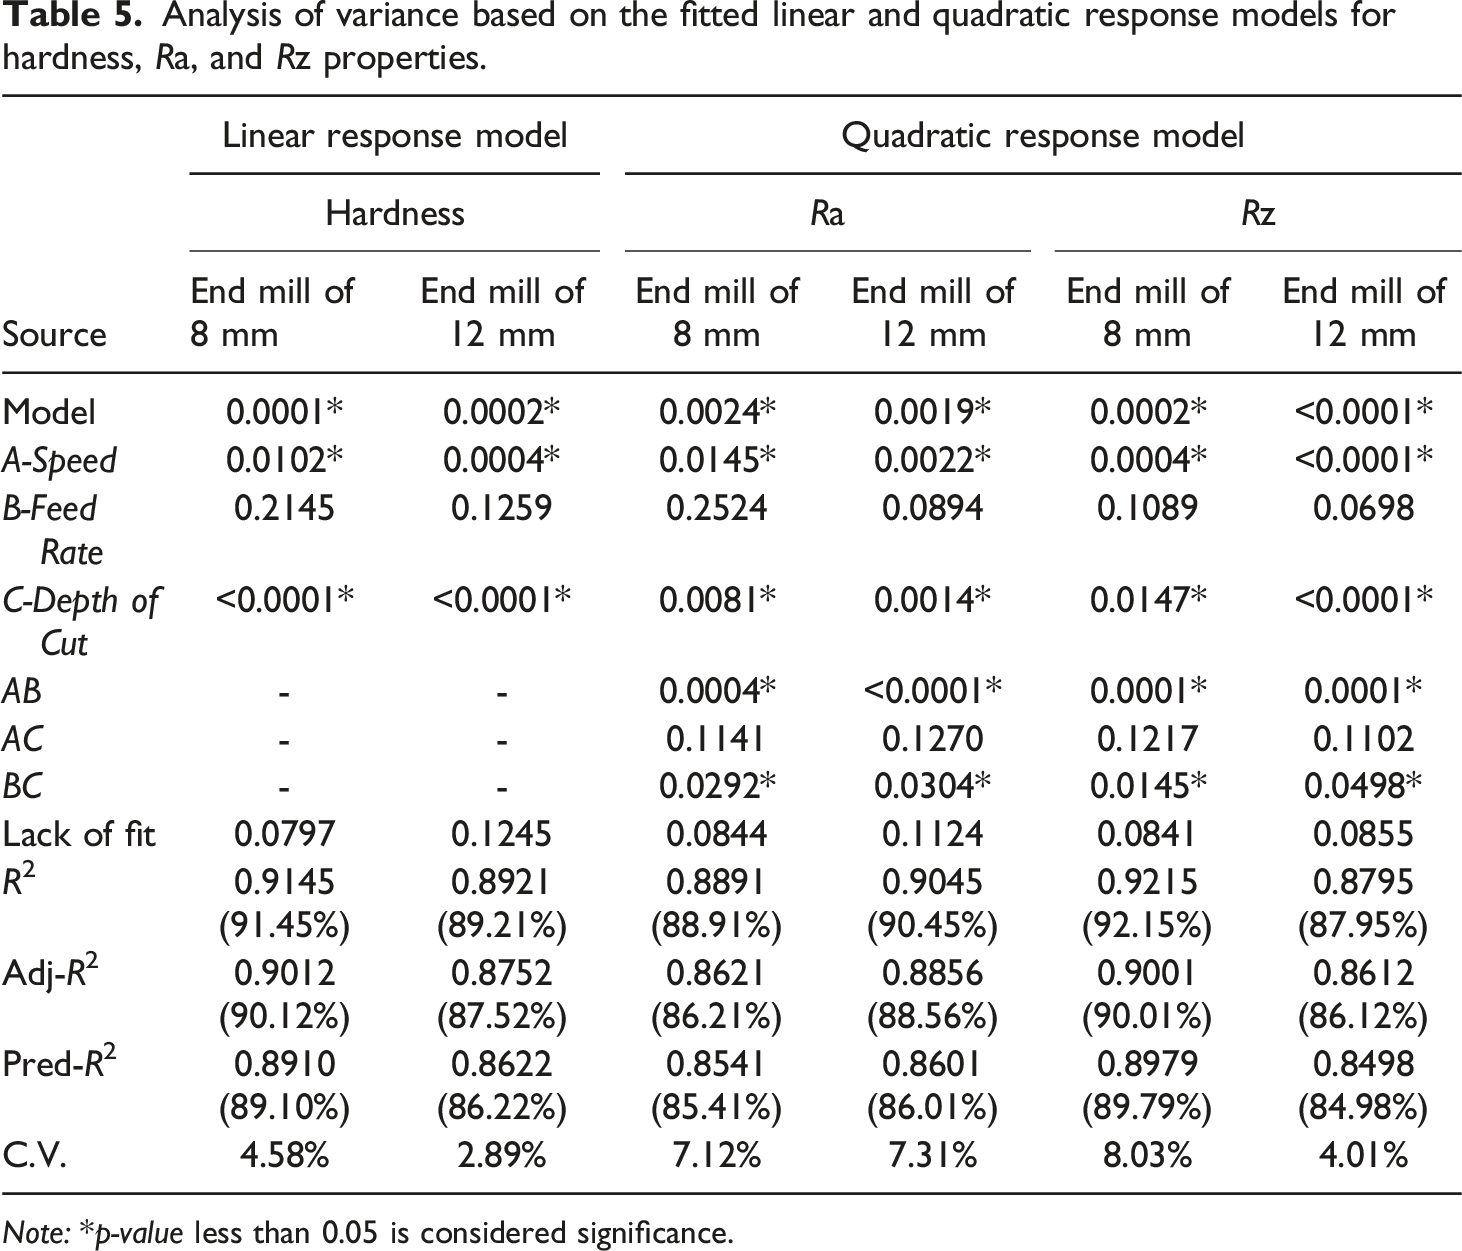
Note: *p-value less than 0.05 is considered significance.
The ANOVA analysis for both linear and quadratic models from the experimental results was also studied. It can be seen that all of the response models, namely hardness, Ra, and Rz properties, exhibited the acceptable values and statistical significance (p < .05) of these models. The multiple interactions of the main factors affected Rz of the WPCs after the CNC milling process with an end mill of 8 mm, namely speed (A), feed rate (B), and depth of cut (C), are shown in Figure 4. Additionally, the interaction terms of response models are also displayed in Table 5. The response models show significant interactions between speed (A) and feed rate (B), and between feed rate (B) and depth of cut (C) for Ra and Rz responses. This is in agreement with the change rule of the model responses with the input parameters examined in previous studies.18,24 Main parameters affecting Rz of the CNC milling process with an end mill of 8 mm on (a) speed, (b) feed rate, and (c) depth of cut.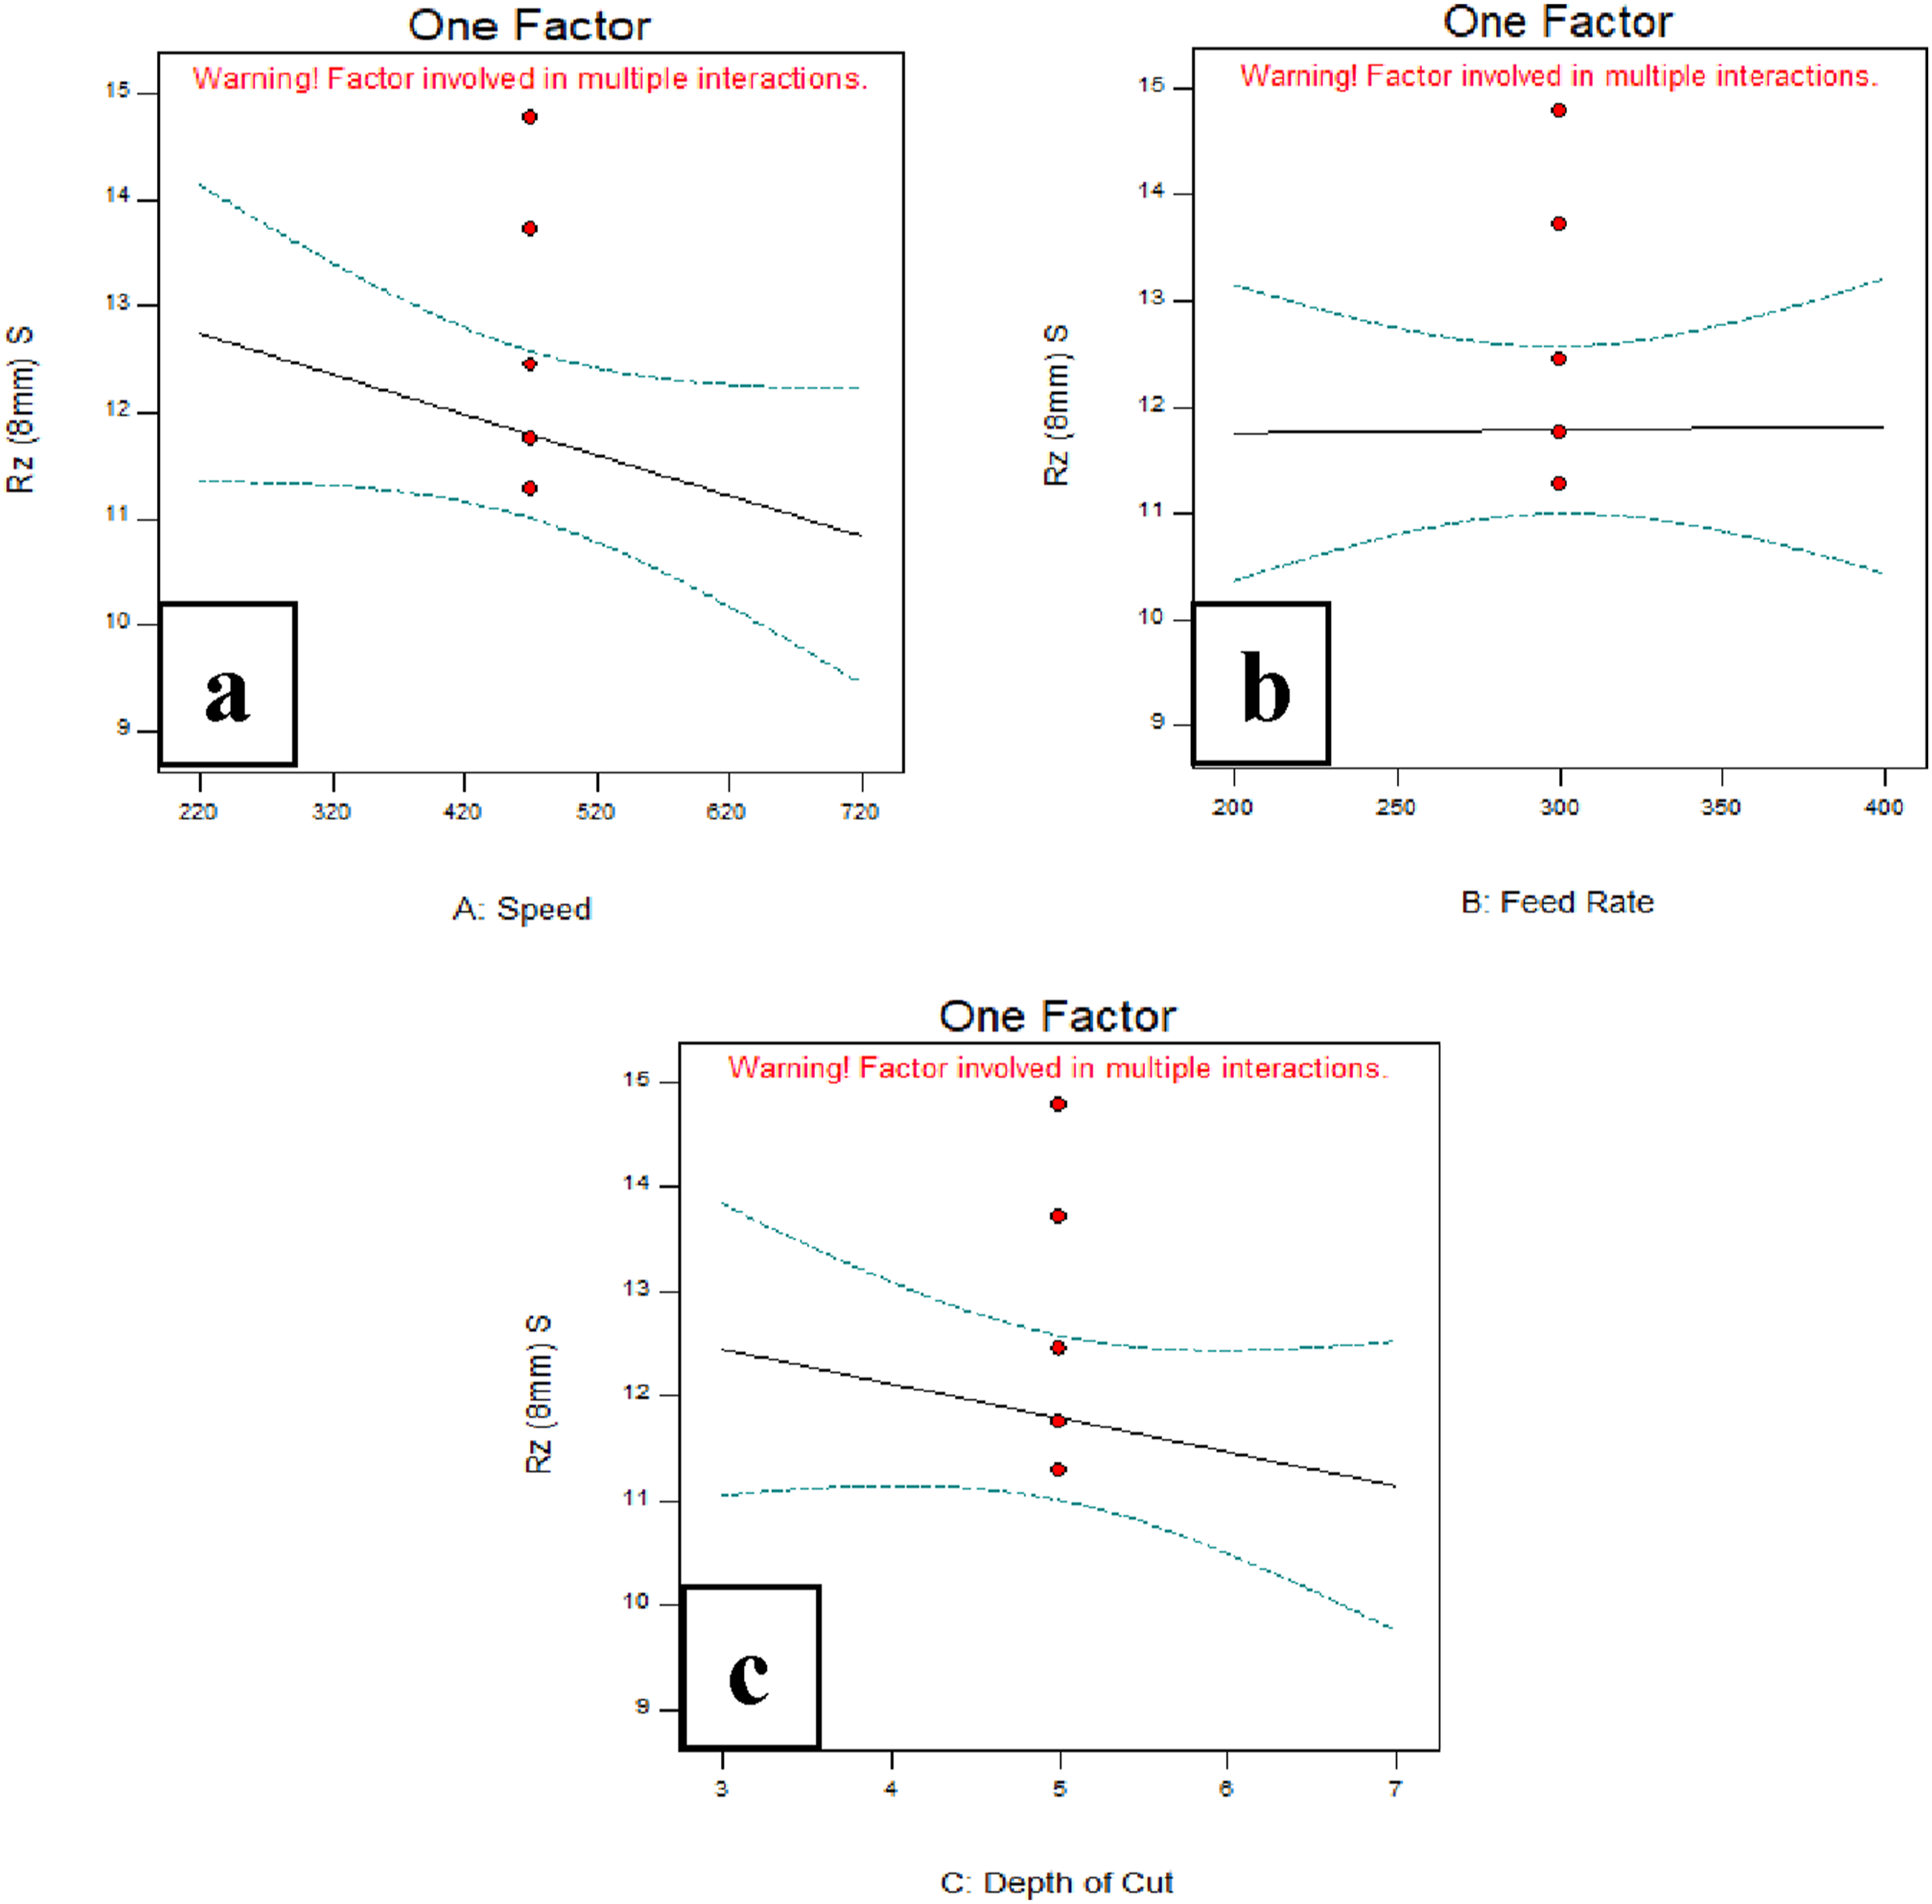
Finally, the ANOVA analysis also displayed statistical values such as lack-of-fit, coefficients of determination (R2), Adj-R2, Pred-R2, and coefficients of variation (C.V.). All of the p-values and data analysis are summarized in Table 5. It was observed that R2 values ranging from 0.8795 (87.95%) to 0.9215 (92.15%) were found in the response models for the milling process. The analyzed data suggested both the good fit and reliability of the experimental values.12,31 The response of Rz was used as an example to analyze the model of the CNC milling process with an end mill of 8 mm. The Adj-R2 value was 0.9001 (90.01%), which displayed the adequacy of WPC samples in the experimental design. The Pred-R2 value of the Rz was 0.8979, indicating the model accounts for 89.79 % of the variability in the new terms. These results could be explained with the regression model analysis to indicate the predicted responses for new observations.9,23 Also, the percentage of C.V. was used to analyze the relative dispersion of the residual variation from the predicted response model.3,14 The C.V. value of Rz was 8.03%, which indicates the best precision and fit for the parametric models. The C.V. value should not be greater than 10 %, in which high C.V. shows high data variation in the mean value and does not lead to the satisfactory development of adequate response models.1,3,23 Therefore, the low C.V. value displays the best precision and fit for parametric models.
Effect of CNC milling parameters on hardness property and optimization
This research presents the optimization of CNC milling parameters on hardness properties resulting from variations in speed, feed rate, and depth of cut based on experimental design. The response values in Table 2 display the hardness values after machining with different end mill diameters of 8 and 12 mm. Also, the hardness values were changed with different parameters in the CNC milling process.23,25 The results showed that the hardness values after mill machining were found in ranges from 70.15 to 78.89 for an end mill of 8 mm and from 71.56 to 79.65 for an end mill of 12 mm. The highest hardness values of 78.89 and 79.65 were found at a speed of 720 rpm, a feed rate of 200 mm/min, and a depth of cut of 5 mm. In addition, the fitted regression equations in terms of parameters to predict the effects of conditions on hardness values are expressed by the linear models, as in equations (2) and (3) below:

As seen in both equations, the speed (A) of CNC milling parameters has the largest negative coefficients in the fitted models at 26.08 and 32.18 for end mills of 8 mm and 12 mm, respectively. It means that the hardness values were improved after the change of speed parameter for the milling condition. The increase of speed value at 720 rpm resulted in high heat and density values on the WPC surface after the milling process. This leads to the increased strength of the surface material compared to those at speed values of 220 and 470 rpm. 33 Similarly, it can be observed that the depth of cut (C) showed a high negative coefficient in the model at end mills of 8 mm and 12 mm for hardness values of 17.34 and 14.85, respectively. The above results confirm that an increase in the depth-of-cut of the CNC milling process provided poor surface strength as evaluated from the hardness property.
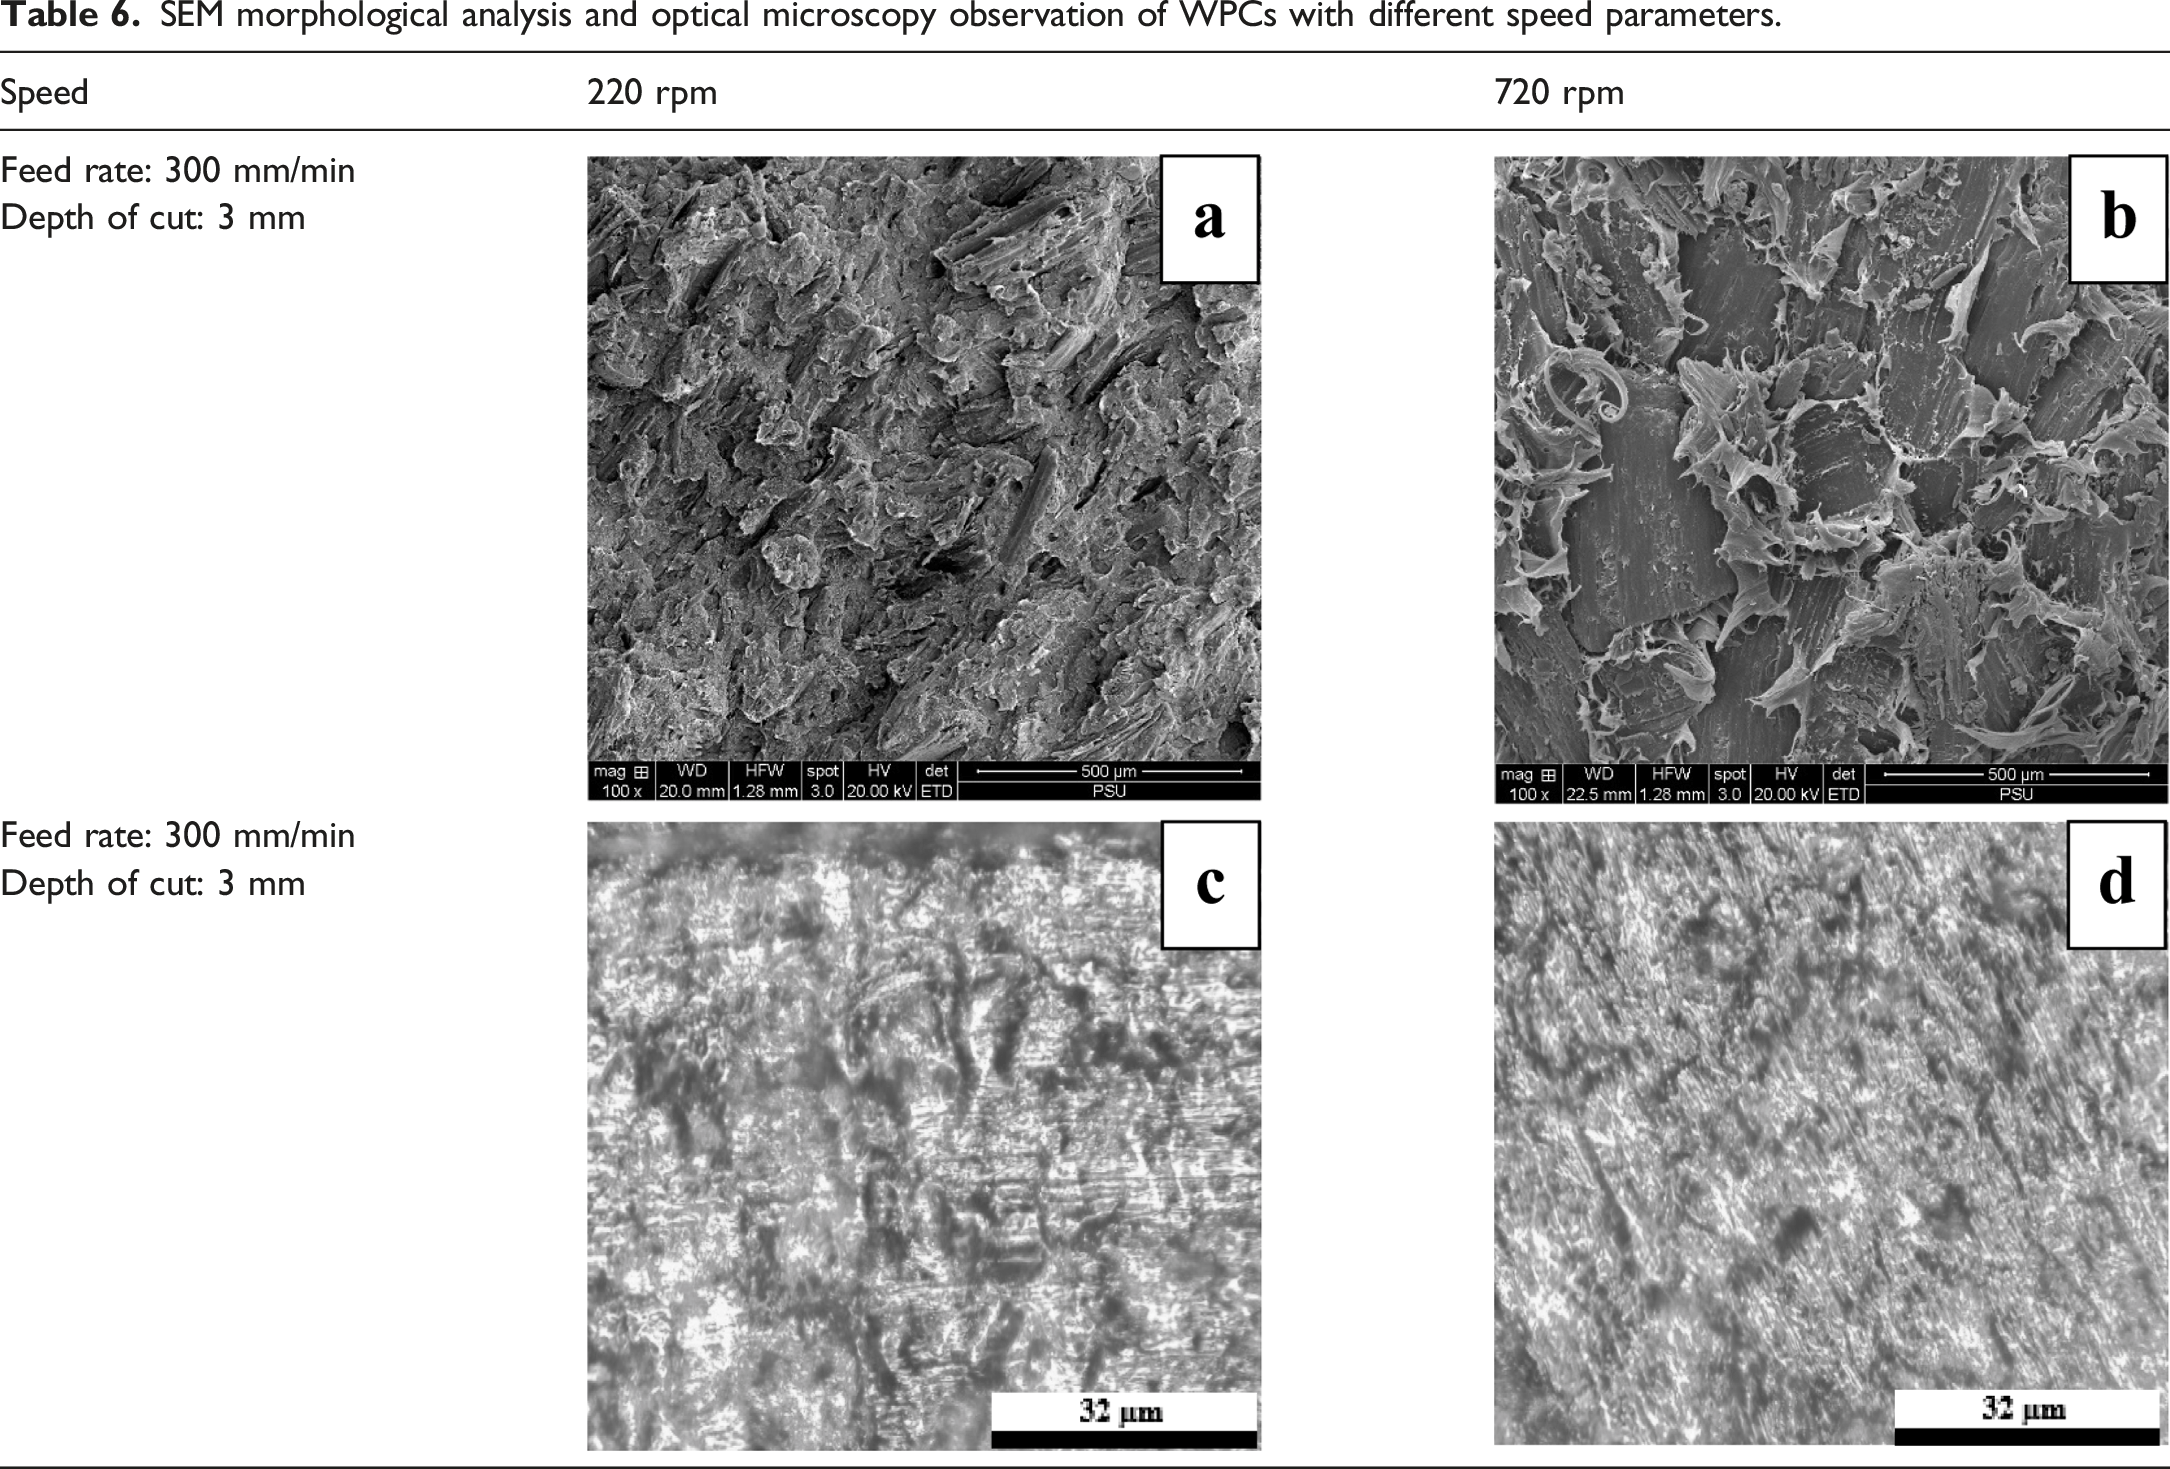
SEM morphological analysis and optical microscopy observation of WPCs with different speed parameters.
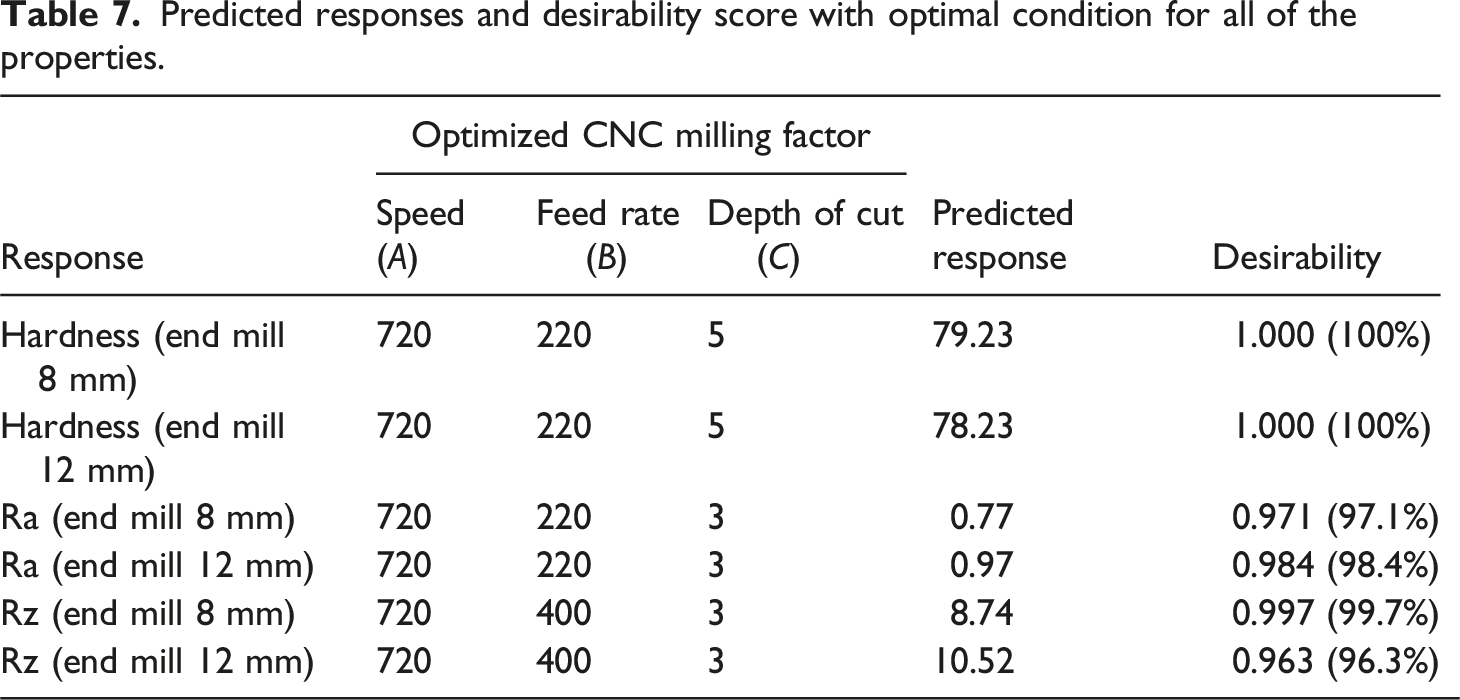
Predicted responses and desirability score with optimal condition for all of the properties.
Effects of CNC milling parameters on Ra properties and optimization
The average surface roughness (Ra) of the composite samples after the CNC milling process is summarized in Table 2. The effect of the examined milling parameters showed the interactions and second-order on the Ra as a three-dimensional (3D) image based on the response surface. The Ra values of the WPC samples were affected significantly by different CNC milling conditions. The significant differences for milling parameters were determined individually for these tests by ANOVA and optimized conditions using RSM.1,3,29,31 Additionally, the fitted quadratic regression models with the observed values of the Ra response are shown in equations (4) and (5).


The relation between average Ra values and three examined parameters was analyzed using quadratic models. The Ra equations at both cutting tool diameters display the positive coefficients for all the main parameters, whereas the interaction terms suggest negative coefficients. It is observed that the speed (A) gave the highest positive coefficient values of 3.47 and 5.82 in the quadratic models for Ra values at both end mills of 8 mm and 12 mm, respectively. The Ra value of the WPCs constantly improved with an increase of the speed parameters in a range from 220 to 720 rpm. This result of the experiment agrees with Slamani et al., 35 who reported that increasing the high spindle speed parameter in a range from 200 to 700 rpm achieved better quality composite surfaces.
The 3D response surface and contour plots of Ra after machining with an end mill of 8 mm are exhibited in Figure 5. The RSM analysis showed some significant differences among the CNC milling conditions for the Ra values.24,25,36 Figure 5(a) shows the effects of interaction between speed and feed rate parameters after the milling process using an end mill diameter of 8 mm. The outcome of this study indicated that a CNC milling speed ranging from 220 to 720 rpm affected the Ra response of WPC samples. The Ra values of the WPC surfaces curvedly decreased from 15.0 to 10.0 µm with the increase in the speed parameter. On the other hand, the increasing feed rate ranged from 200 to 300 mm/min and slowly increased the Ra value, after that, it decreased gradually. The interaction parameters between speed and depth of cut are displayed in Figure 5(b). The findings from this study revealed that the Ra values of the WPCs enhanced to the maximum values with an increment of the depth of cut ranging from 3 to 7 mm. This result of the experiment is in line with Doluk et al.,
37
who reported that an increment in the depth of cut for the mill machining of the WPCs slightly affected the Ra values, which increased from 2.5 to 2.9 µm. Figure 5(c) indicates the 3D response and interaction contour plots between feed rate and depth of cut. However, the Ra values of the WPCs rose with an increasing feed rate in a range from 200 to 400 mm/min. The reason for this phenomenon is the high temperature in the cutting zone due to higher friction between the cutting edge tip and WPC samples. In addition, an increase in the depth of cut in a range from 3 to 7 mm slowly enhanced the Ra values of the WPCs. This condition leads to poor surface performance. Effects of CNC milling parameters with an end mill of 8 mm and response surface contour plots on Ra showing (a) speed and feed rate (b) speed and depth of cut, and (c) feed rate and depth of cut.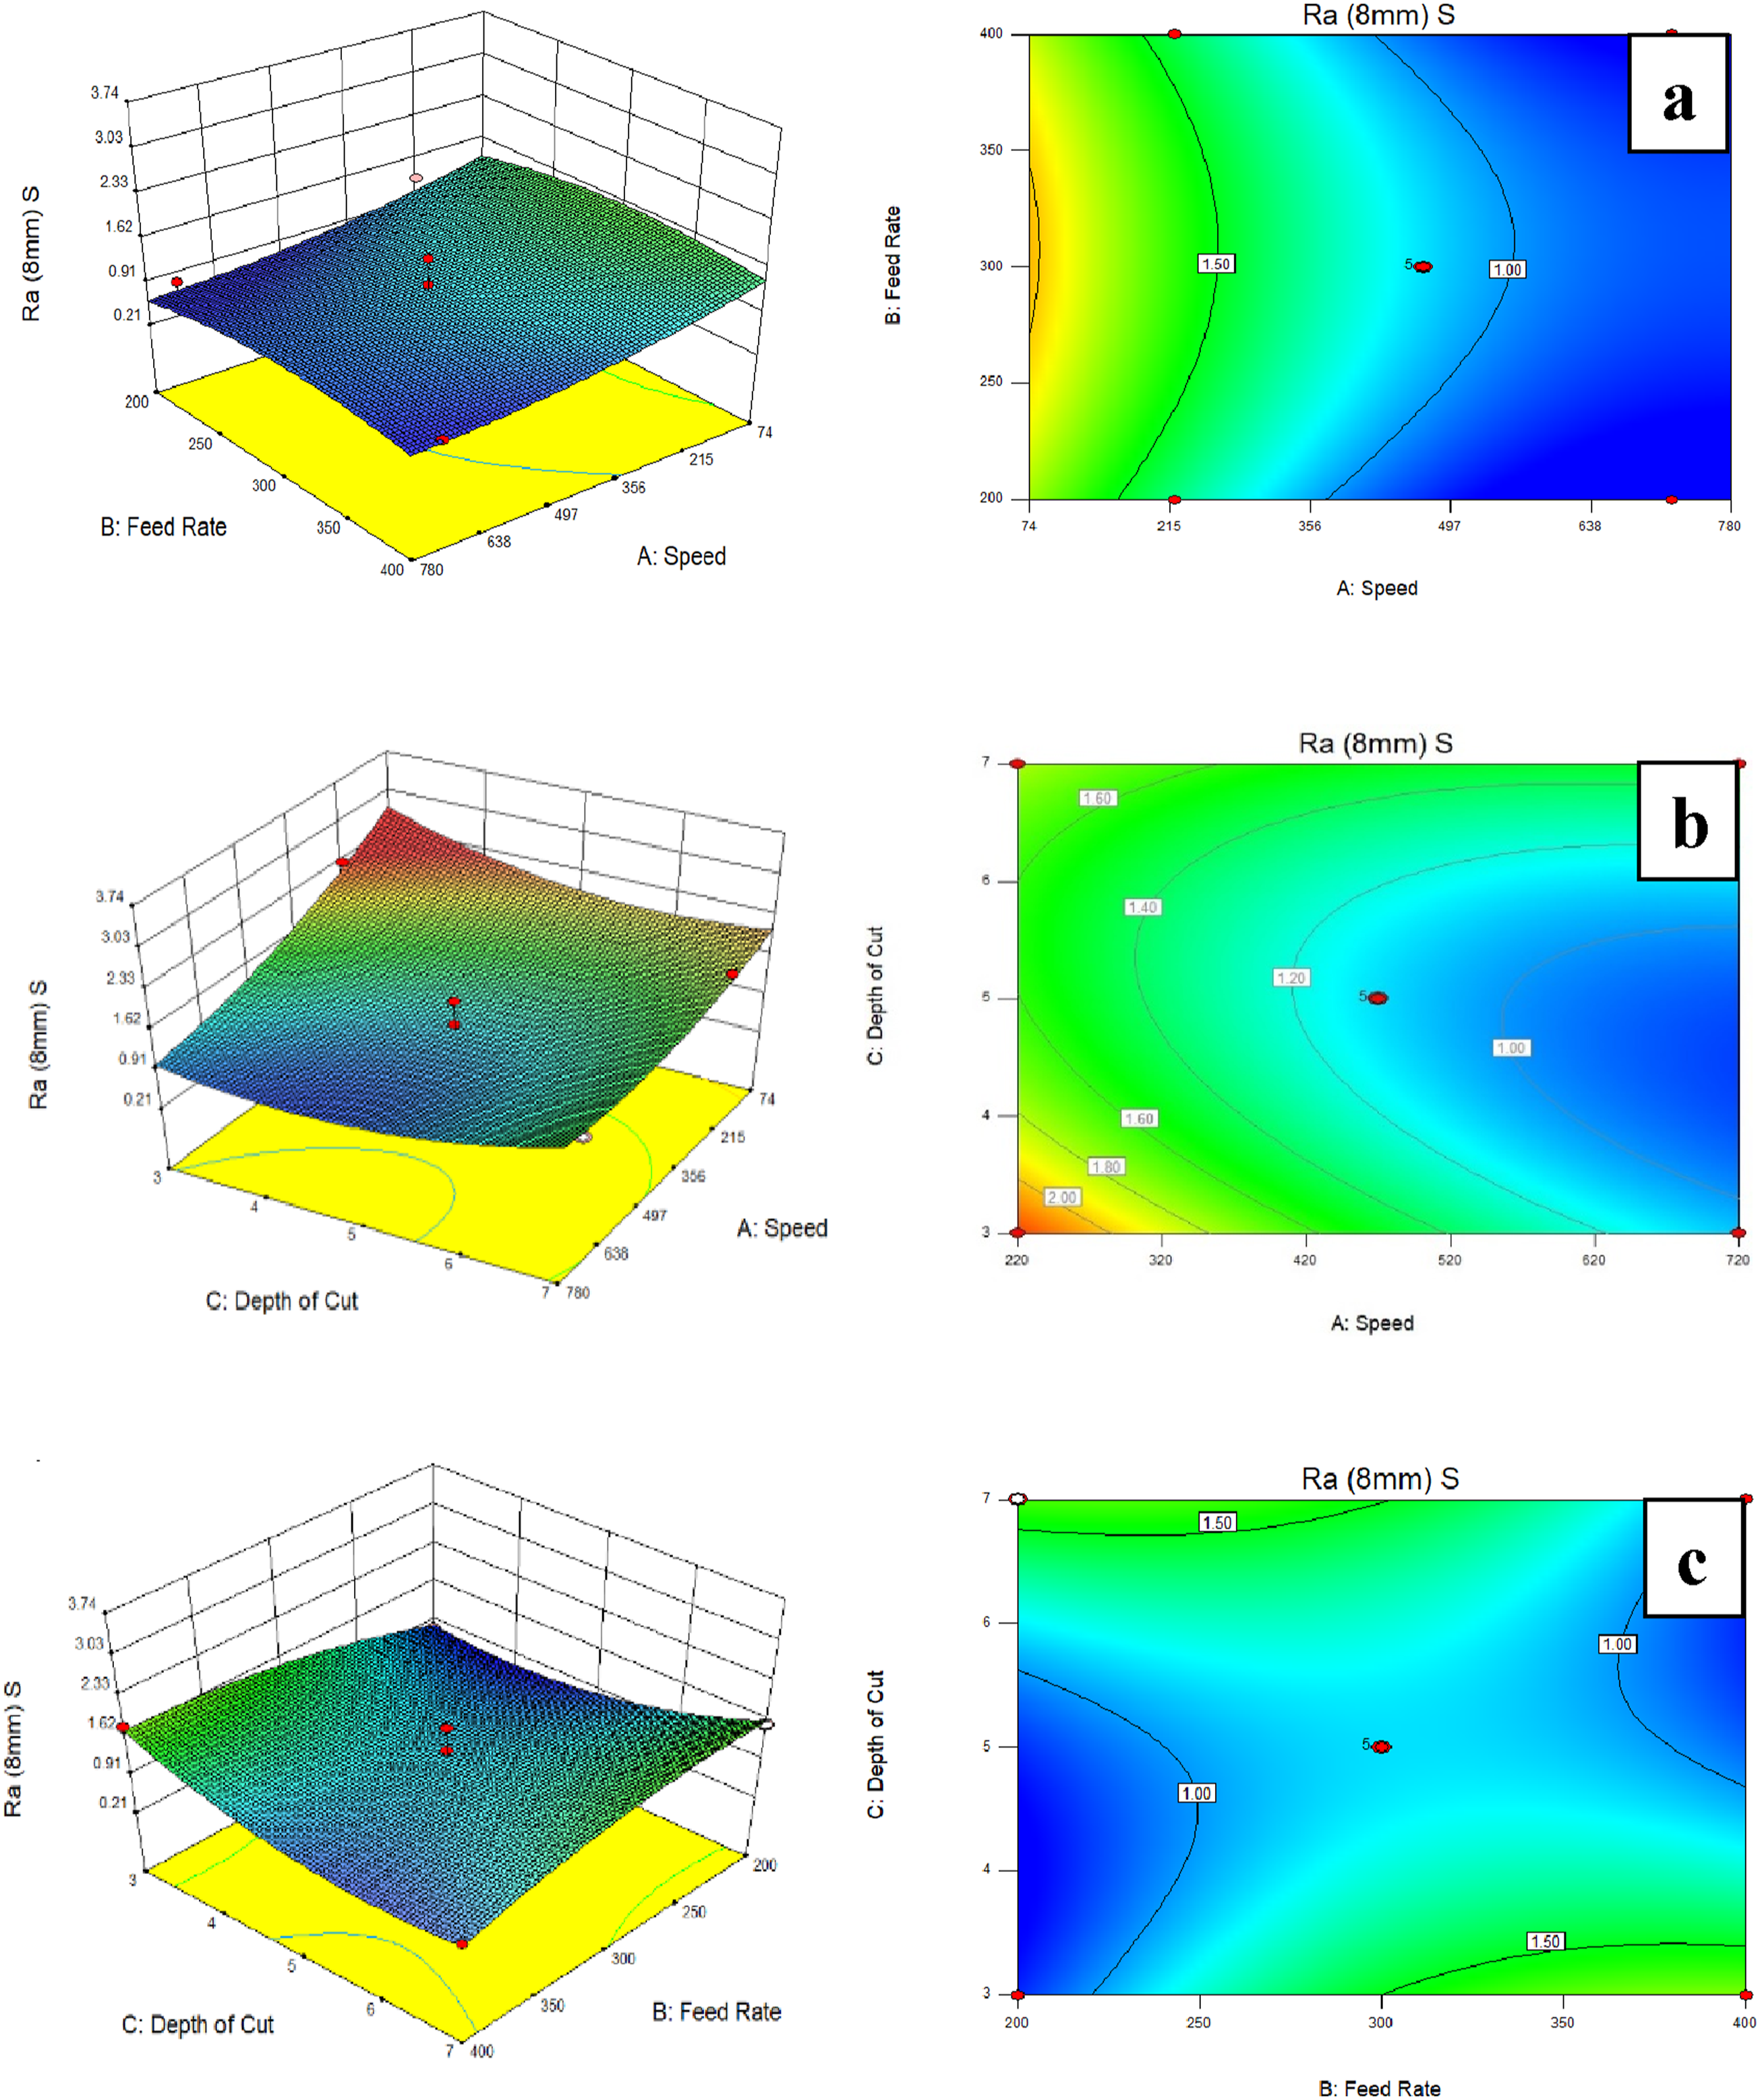
Similarly, the response surface optimization and contour plots of Ra after machining with an end mill of 12 mm are also displayed in Figure 6. The experimental results are similar to those of the milling process using an end mill diameter of 8 mm. The minimum Ra value of 1.10 µm was found in the speed parameter at 720 rpm, as presented in Figure 6(a). In addition, the WPC surface performance with a feed rate of 200 mm/min had lower Ra values than those of 300 and 400 mm/min. This may be a result of the slower axial movement of the end mill, resulting less material deformation and the complete removal of chips from the required WPC surfaces.23,38 Furthermore, the relation between speed and depth of cut based on response surface plots is illustrated in Figure 6(b). It can be seen that an increment of the speed in a range of 620 to 720 rpm decreased the Ra response of the composite samples from 1.3 to 1.2 µm. This is due to the cutting amount per unit time being reduced with the increasing speed parameter, and the cutting resistance force decreased.18,26,35 Moreover, the effects of both feed rate and depth of cut for the CNC milling process on Ra properties are exhibited in Figure 6(c). Machining with a feed rate ranging from 200 to 300 mm/min and a depth of cut ranging from 3 to 4 mm exhibited less roughness surface, more smoothness, and great interfacial adhesion. Effects of CNC milling parameters with an end mill of 12 mm and response surface contour plots on Ra showing (a) speed and feed rate (b) speed and depth of cut, and (c) feed rate and depth of cut.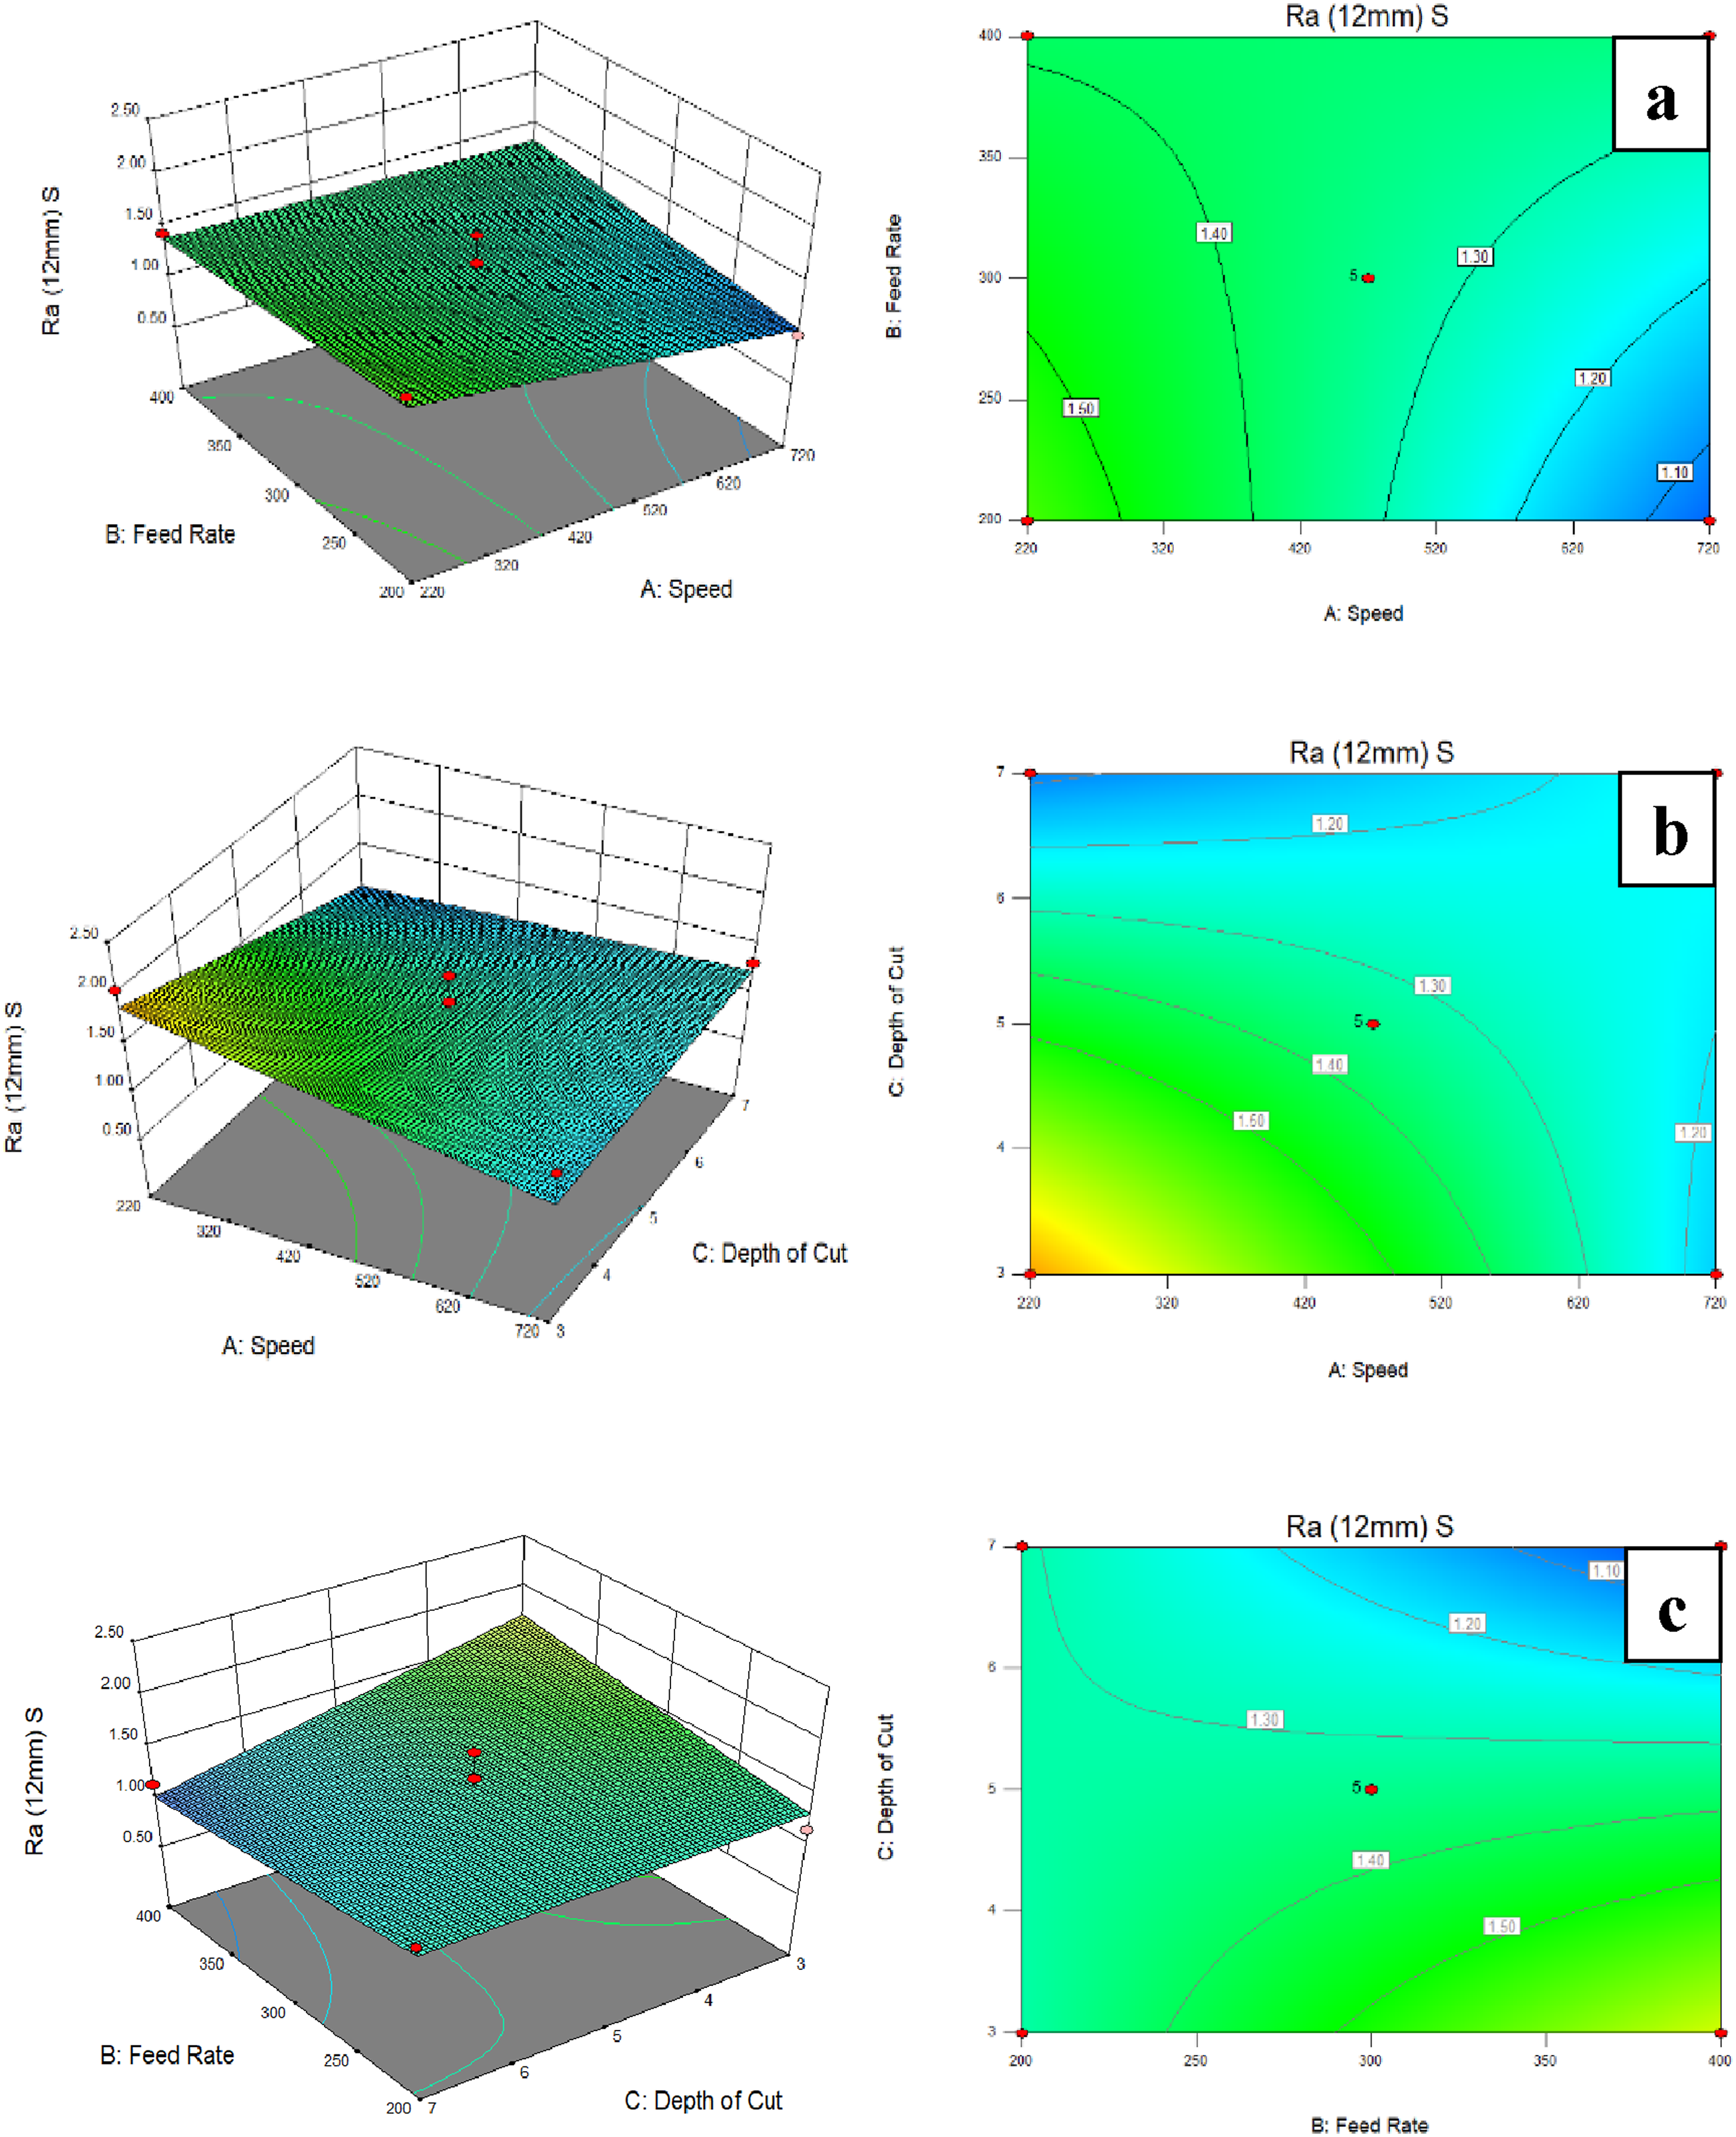
Tables 6(c) and (d) show morphological images of WPC surface observation obtained from the optical microscopy. The WPC material deformation occurs in the area around mill machining when a part of the chip is melted and added to the WPC surface. Also, the chips of WPC samples sticking to the adjacent back part of the cutting tools occurred during the process of machining. Comparing the optical microscopy images with speeds of 220 and 720 rpm on Ra properties, the composites machined with a speed of 720 rpm had smoother surfaces than those of 220 rpm. As mentioned above, this condition enabled better mill machining quality.
The optimal conditions of the CNC milling process from main parameters, namely speed, feed rate, and depth of cut, using end mill diameters of 8 and 12 mm based on Ra properties are depicted in Table 6. The optimal conditions for the Ra value with end mills of both 8 mm and 12 mm included a speed (A) of 720 rpm, a feed rate (B) of 220 mm/min, and a depth of cut (C) of 3 mm. The high-desirability scores based on predicted Ra response were 0.971 (97.10%) and 0.984 (98.40%) for end mills of 8 mm and 12 mm, respectively. As expected, these optimal conditions of the WPC samples can be used for the most suitable applications in the CNC milling process based on the Ra properties.
Effects of CNC milling parameters on Rz property and optimization
The mean peak-to-valley height (Rz) was considered to evaluate the efficiency on the surface of WPC samples. The speed (A), feed rate (B), and depth of cut (C) are major parameters that play significant roles in the Rz values of WPC materials.18,35 The CNC milling process of the different conditions on the surface of WPCs establishes the smooth surface quality of the product. The experimental results of Rz response after the milling process using end mills of both 8 mm and 12 mm are shown in Table 2. The effect of the WPC surfaces at the minimum Rz is statistically significant. These results were evaluated by ANOVA and optimized conditions using the RSM.1,9,23,24 Consequently, the fitted regression equations in terms of actual factors of the Rz responses are displayed in equations (6) and (7).


It should be noted that the response models for Rz at all of the main parameters (speed (A), feed rate (B), and depth of cut (C)) only display positive coefficients. The parameters were constructed using values calculated as the arithmetic average of Rz values measured on the WPC surfaces. It is observed that the highest positive coefficient values of 3.47 and 5.82 were found in the speed parameter at both end mills of 8 mm and 12 mm, which is similar to the Ra response. In addition, the interaction terms of quadratic models for Rz responses show negative coefficients. The highest negative coefficient values of 0.75 and 0.82 were found in interaction terms between the speed (A) and feed rate (B) of Rz equations.
The response surface plots of Rz after the CNC milling process with an end mill of 8 mm are exhibited in Figure 7. The average values present the effects of multi-relation between the speed and feed rate parameters on the Rz property. Figure 7(a) exhibits a visible change in the course of Rz depending on the increase in feed rate. The Rz values rise with increasing revolution at feed rates of 200 and 400 mm/min, whereas revolution from 220 to 720 rpm displays values ranging in a narrow interval from less than 11.0 up to 13.0 ?m. As reported by Rabiei et al.,
25
there is a relationship between the cutting speed and feed rate of the surface quality for WPC materials of three samples with different CNC milling conditions. In addition, Figure 7(b) shows that the milling parameters, namely speed between 620 and 720 rpm and depth of cut between 3 and 4 mm, presented the lowest values in Rz, which decreased in a range from 14.0 to 11.0 ?m compared to the other conditions. Also, the interaction parameters based on feed rate and depth of cut for Rz response are shown in Figure 7(c). It can be seen from the contour plots that the feed rate in a range from 200 to 300 mm/min had the minimum Rz for the milling process using an end mill diameter of 8 mm, whereas a depth of cut at 3 mm showed better milling surface quality when compared to those of 5 and 7 mm for WPCs machining. This result agrees with Geier and Pereszlai,
39
who reported that decreasing the depth of cut in the mill machining of the WPCs decreased the Rz values. This is because the deformation resistance and turning force of the total area of the milling decreased. Effects of CNC milling parameters with an end mill of 8 mm and response surface contour plots on Rz showing (a) speed and feed rate (b) speed and depth of cut, and (c) feed rate and depth of cut.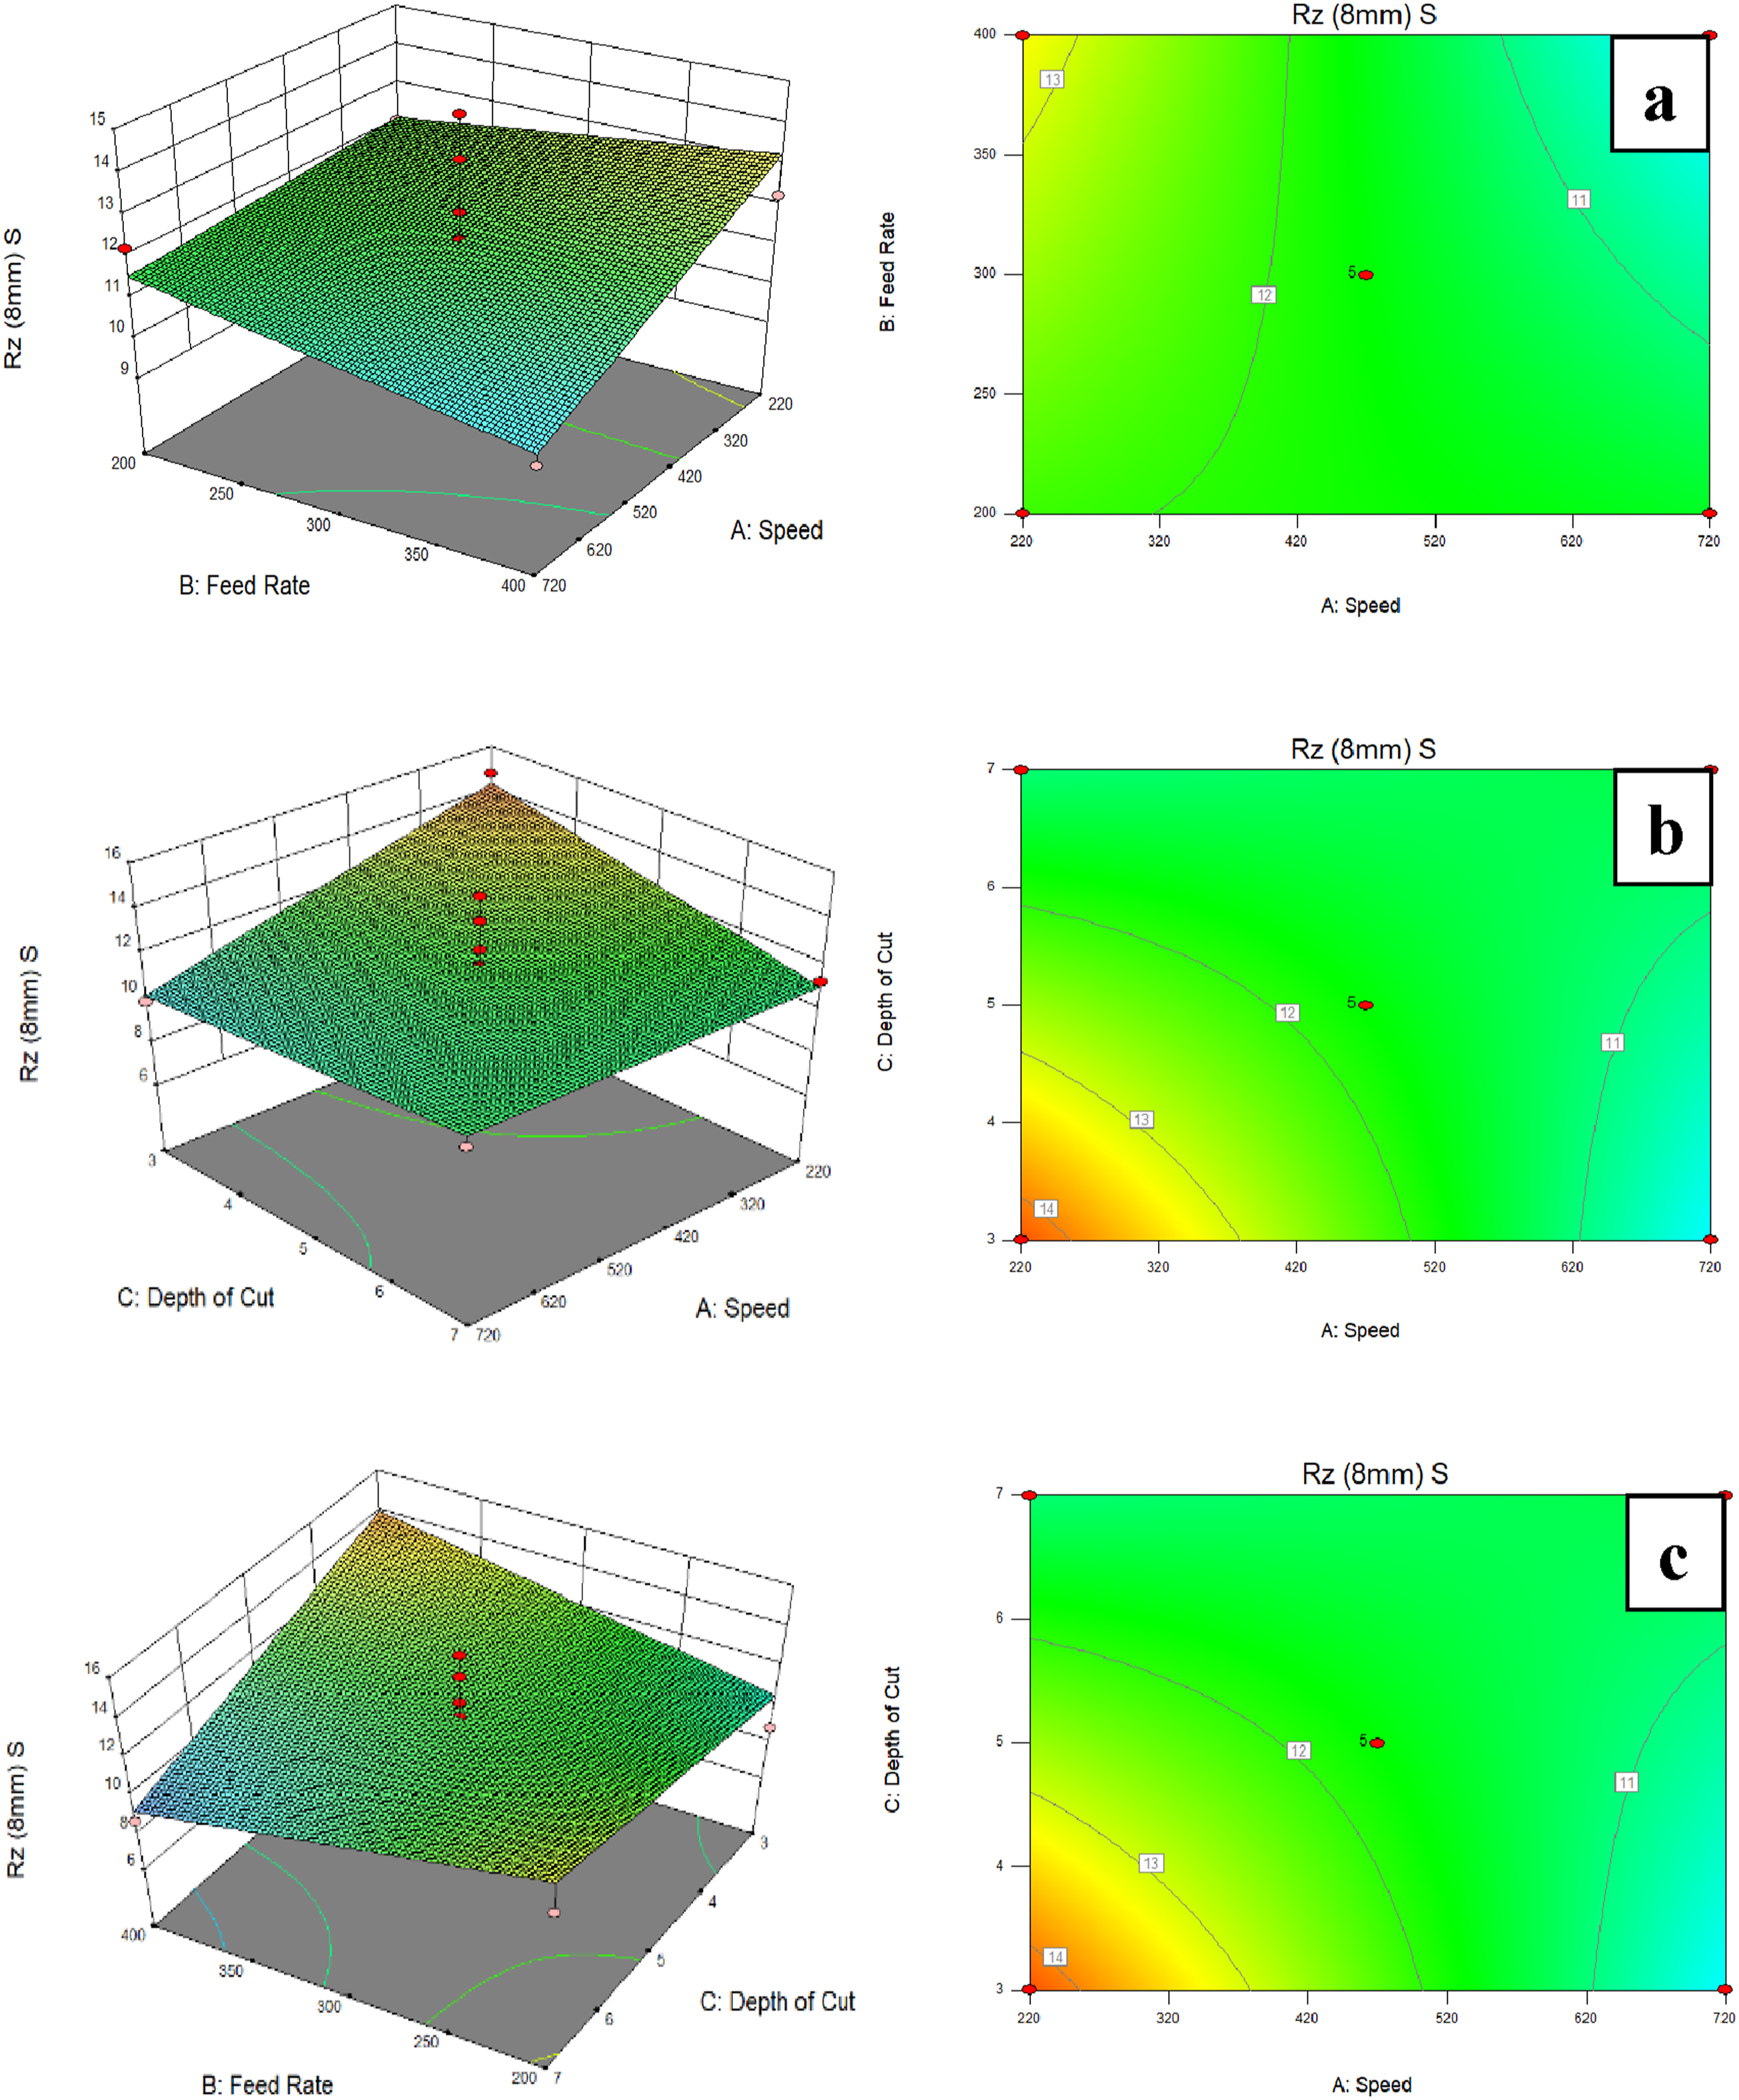
The response contour plots of Rz after CNC mill machining with an end mill of 12 mm are presented in Figure 8. Figure 8(a) indicates that an increment of the speed from 220 to 720 rpm in the milling process slightly increased the Rz from 12.0 to 13.0 µm. Additionally, Rz values increased with an increase in the depth of cut in a range from 3 to 7 mm, as displayed in Figure 8(b). This can be explained by the fact that the total area of the milling enhances as the milling depth rises and the machining force increases.35,40 Likewise, increasing the feed rate in a range from 200 to 400 mm/min increased the Rz of the WPCs from 11.0 to 14.0 µm, as shown in Figure 8(c). This may be a result of an increase in distance between the successive grooves due to faster axial movement of the cutting tool on the WPCs workpiece, and the chips are partially removed from the surface. Effects of CNC milling parameters with an end mill of 12 mm and response surface contour plots on Rz showing (a) speed and feed rate (b) speed and depth of cut, and (c) feed rate and depth of cut.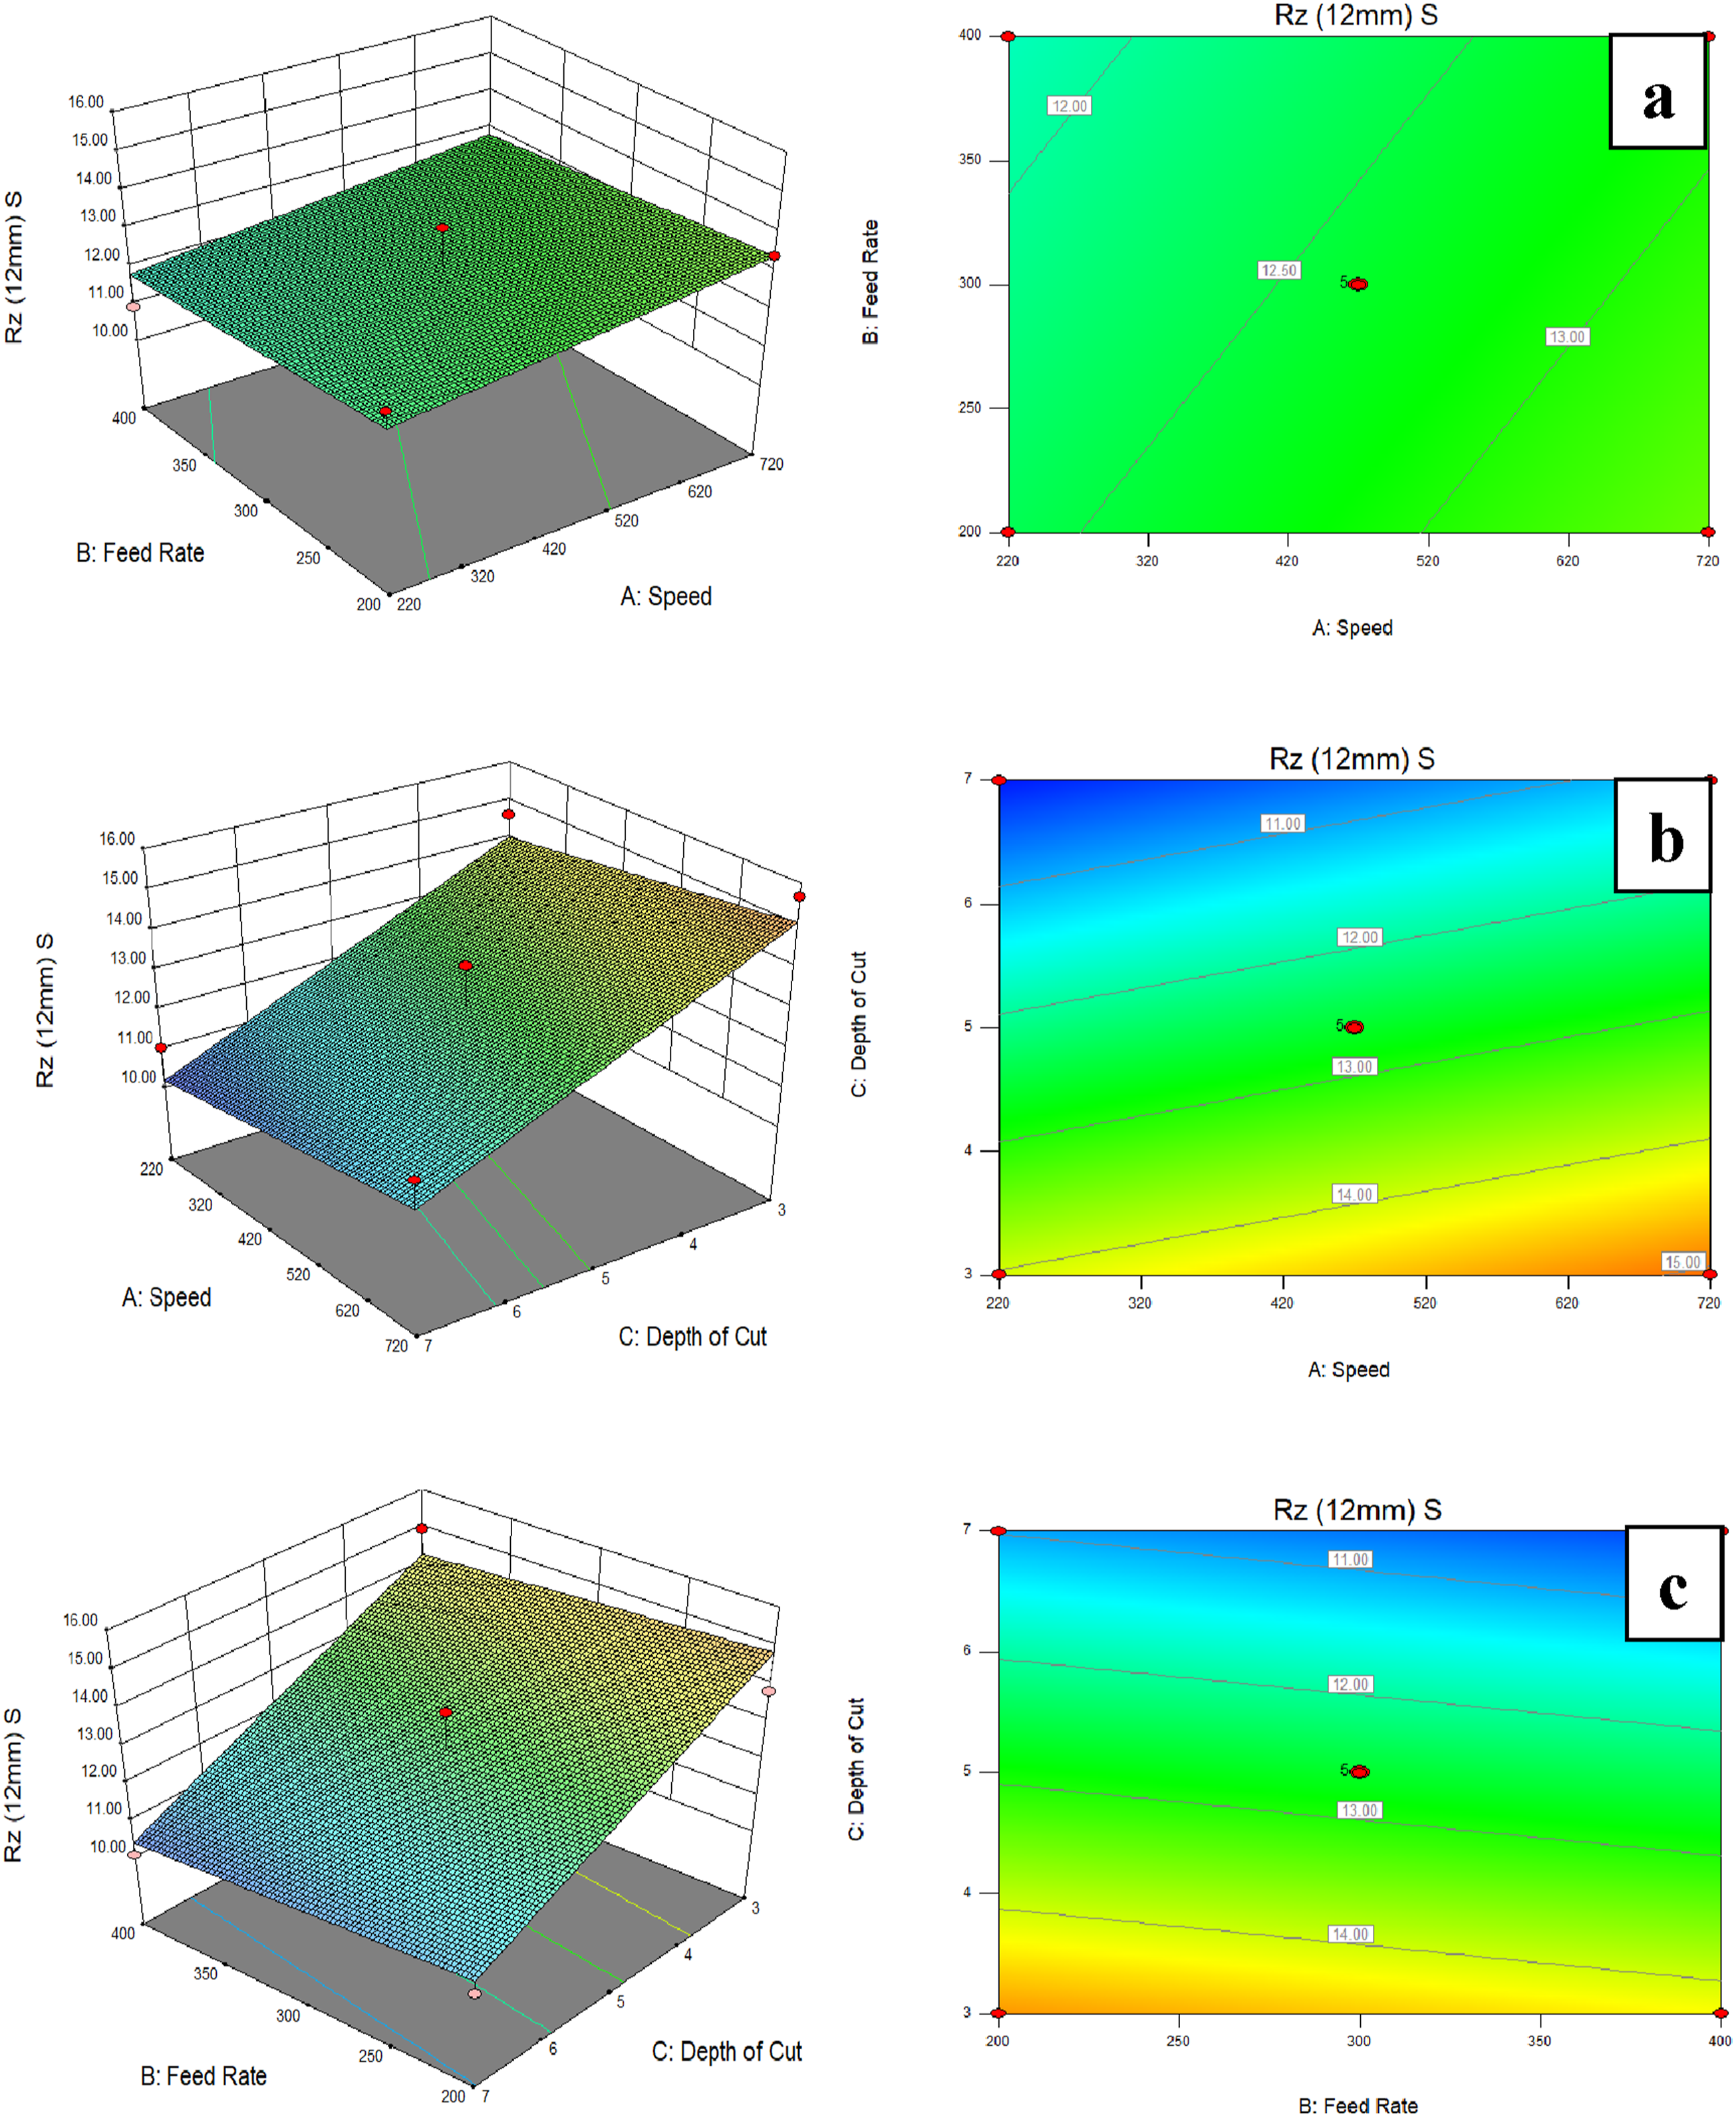
The optical microscopy observation of the WPC material surfaces displayed the heterogeneity of the composites and also the presence of microcracks located on contacts between wood fiber and the plastic matrix. As seen in Table 6, the WPC surface observation is in agreement with Ra properties. It was found that the results of speed comparison (220 and 720 rpm) in this study showed that the speed parameter of 720 rpm had a lower Rz value than the 220 rpm. The results of the comparison in this study implied that this speed parameter condition was the optimal condition for the CNC milling process based on the Rz property.
The result is consistent with the predicted value. This makes it possible to predict the course of roughness parameters for variable parameters (depending on the conditions of the milling process). The predicted conditions of Rz response after the CNC milling process with end mills of 8 and 12 mm are displayed in Table 7. The optimal conditions for Rz response with end mills of 8 and 12 mm include a speed (A) of 720 rpm, a feed rate (B) of 400 mm/min, and a depth of cut (C) of 3 mm. The high-desirability scores for Rz were in agreement with the values of 0.997 (99.70%) and 0.963 (96.30%). These optimal conditions of the WPCs represent the most suitable parameters for the CNC milling process based on the Rz response.
Optimization of CNC milling parameters for the WPCs
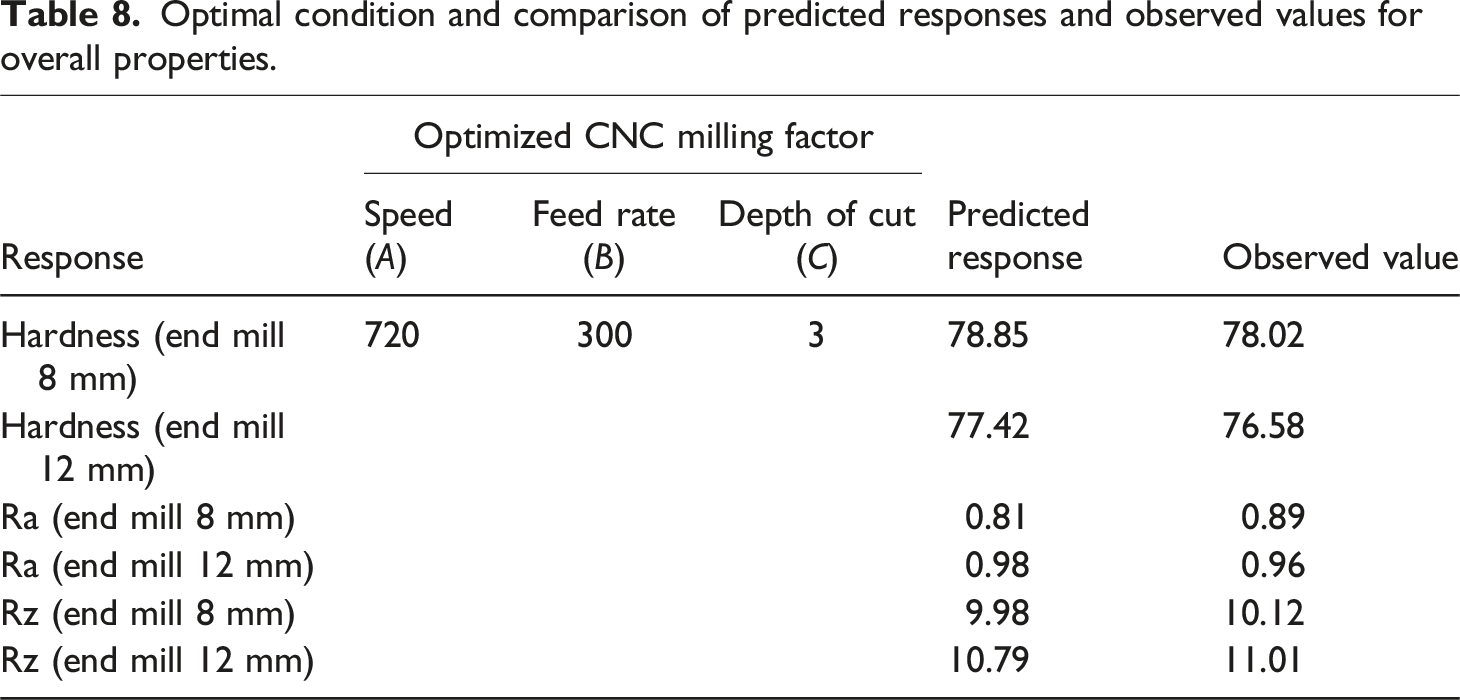
Optimal condition and comparison of predicted responses and observed values for overall properties.
It is necessary to note that the experimental results in this work are valid only for the presented technological conditions, parameters, and cutting tools. Thus, it is recommended to study other factors in the future, such as temperature, chips, and tool wear of mill machining to determine the most suitable conditions to achieve a WPC surface with the highest quality.34,41
Conclusions
The goal of the optimization for CNC milling parameters is to determine the minimum surface roughness and high hardness required to produce WPC products for building applications. The milling parameters, namely speed (A), feed rate (B), and depth of cut (C), are the main variables that play significant roles in the properties of WPCs. The numerical conditions were considered using the Box-Behnken design to determine the experimental runs for the CNC milling process. All of the experimental results, including the fitted regression models, were analyzed by ANOVA and optimized using the response surface methodology. These results could be explained with the following conclusions: • All of the parameters (speed, feed rate, and depth of cut) for the CNC milling process, using end mill diameters of 8 mm and 12 mm, had significant effects on the hardness, Ra, and Rz properties of the WPC materials. • The highest hardness value of 79.65 was found in the milling process using an end mill diameter of 12 mm, whereas the minimum Ra and Rz values of 0.78 and 8.71 µm were found in WPC samples using an end mill of 8 mm. • Increasing the speed parameter ranging from 220 to 720 rpm resulted in an evident increase in hardness values. On the other hand, a feed rate at 200 mm/min and a depth of cut at 3 mm slowly decreased the Ra and Rz values, resulting in necessary WPC surfaces with smooth appearances. • This experimental result is different from the morphological structure and surface observation. It can be seen that the CNC milling condition using a high speed of 720 rpm displayed a smooth surface, which resulted in visible evenness on the WPC surfaces. • The optimal condition of the CNC milling process using end mill diameters of 8 mm and 12 mm had a speed (A) of 720 rpm, a feed rate (B) of 220 mm/min, and a depth of cut (C) of 3 mm. The high-desirability score for overall properties was in agreement with the values of 0.973 (97.30%). • This optimal condition of CNC milling parameters can also be used on other types of WPCs with different fibers and grades of PP or other plastics based on a melting point of more than 180°C.
The findings of the study also emphasized the fact that the manufacturing industry has advanced at a rapid pace. Consequently, high-performance manufacturing techniques become critical in attaining sustainable development.
Footnotes
Acknowledgements
The authors gratefully acknowledge Department of Industrial Engineering, Faculty of Engineering, Rajamangala University of Technology Srivijaya (Thailand) for the laboratory testing equipment for evaluating properties of the WPC materials. They would like to thank Mr Ponpawit Chairee and Mr Rungsiman Jantrasiri for supporting this work. Additionally, they would also like to thank Dr Somporn Maneechote and Dr Kittima Tantihachai for editing this article.
Declaration of conflicting interests
The author(s) declared no potential conflicts of interest with respect to the research, authorship, and/or publication of this article.
Funding
The author(s) received no financial support for the research, authorship, and/or publication of this article.
Data availability statement
The datasets used and/or analyzed during the current study available from the corresponding author on reasonable request.