
Abstract
Fiber reinforced thermoplastic composite pipe (FRTP) has advantages over traditional metallic counterparts for oil and gas transportation. During in-service the pipe is subjected to different mechanical loads including internal pressure, torsion, and bending. In this work, a special type of continuous glass fiber reinforced thermoplastic composite pipe (DN150-6.4 MPa) is analyzed by finite element method (FEM) under various complex service-in conditions. Stress and strain are investigated for different layers of FRTP to determine the extreme load capacity. Experimental analysis is conducted to validate proposed method. Combining the results from FEM and test, it is concluded that the ultimate internal pressure (burst pressure) of FRTP is 61.7 MPa, the ultimate axial tensile displacement is 66.4 mm, the maximum torsion angle is 71.5°, and the minimum bending radius 978.9 mm. Under different working conditions, the mechanical properties of the FRTP are still surplus under the given load. For the good agreement with experimental data, the FEM modeling can be guide for practical application of FRTP.
Keywords
Introduction
Pipeline transportation is the main way to transport oil and gas resources because of its high efficiency, low operating cost, safety, and low environmental damage, which makes it suitable for long-distance transportation. 1 Oil and gas transportation pipelines can be categorized into metallic pipelines, non-metallic pipelines, and composite pipelines. Metallic pipelines are made of metal materials, such as cast-iron pipelines, steel pipelines, and stainless-steel pipelines. 2 Metallic pipelines have high strength, but their manufacturing costs are high, and they are susceptible to chemical or electrochemical corrosion failure due to the external environment, resulting in leakage, contamination, and explosions. 3 Non-metallic pipes are made of materials such as plastic or resin. Non-metallic pipe is usually produced by the thermosetting process, which provides a wide range of benefits such as excellent heat resistance at high temperatures, high strength-to-weight ratio, corrosion resistance, and convenient laying and transportation. However, there are defects such as poor rigidity, poor capabilities of reshaping and recycling, and creep resistance for plastic pipes. To obtain the high flexibility and strength, composite pipe is made by wrapping cured thermosetting with fiber reinforcements. 4 Combining the special performance of different materials, the composite pipe has high strength of the metal pipeline and non-metallic pipeline corrosion resistance and other characteristics.
Currently, the composite pipes used in oil and gas transportation systems mainly include anti-corrosion plastic alloy composite pipe, steel skeleton-reinforced polyethylene composite pipe, and spoolable fiber reinforced thermoplastic pipe (FRTP). Among them, FRTP has the advantages of good flexibility, strong impact resistance, fewer joints, is lightweight, and is more widely used. 5
Fiber reinforced thermoplastic composite pipe is mainly composed of a multi-layer structure: thermoplastic liner, fiber reinforced layer, and outer protective layer,
6
as shown in Figure 1. The liner is mainly made of various grades of high-density polyethylene (HDPE). The reinforcement layer is usually made of continuous fiber and steel wire. Fiber materials can be glass fiber, carbon fiber, and aramid fiber. The outer protective layer is usually still HDPE. Typical structure of RTP.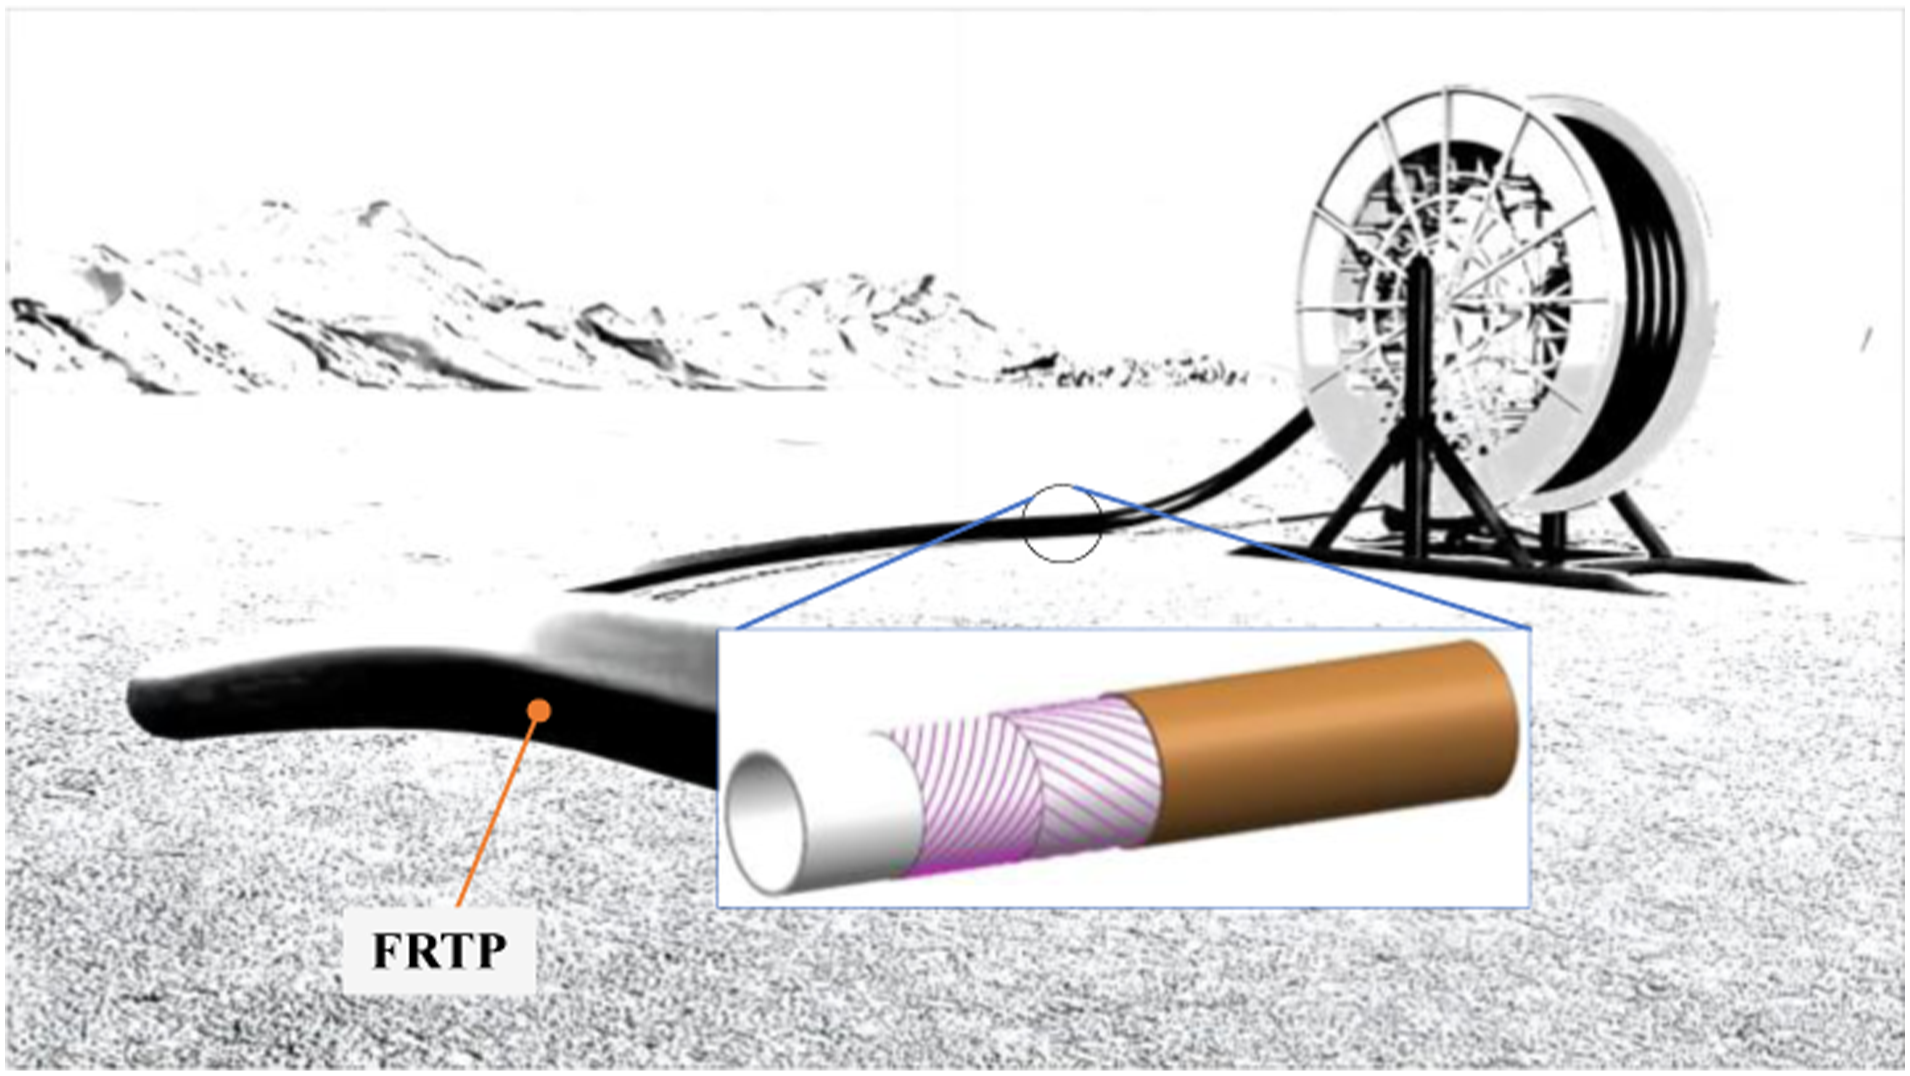
In the operating process, pipelines are subject to damage from internal and external influences, resulting in possible failures and accidents. Oil and gas pipeline failures are usually manifested in the form of leakage, rupture, explosion, combustion, destabilization, folding, deformation, and overall fracture damage.7,8 Figure 2 shows three typical failure forms of FRTP. These failures are divided into brittle fracture, ductile fracture, and destabilizing deformation damage, which are essentially due to the too-large load resulting in greater actual stress than the permissible stress of the material and final damage. Three typical failure modes of RTP: (a) tensile failure; (b) buckling failure; (c) torsional failure.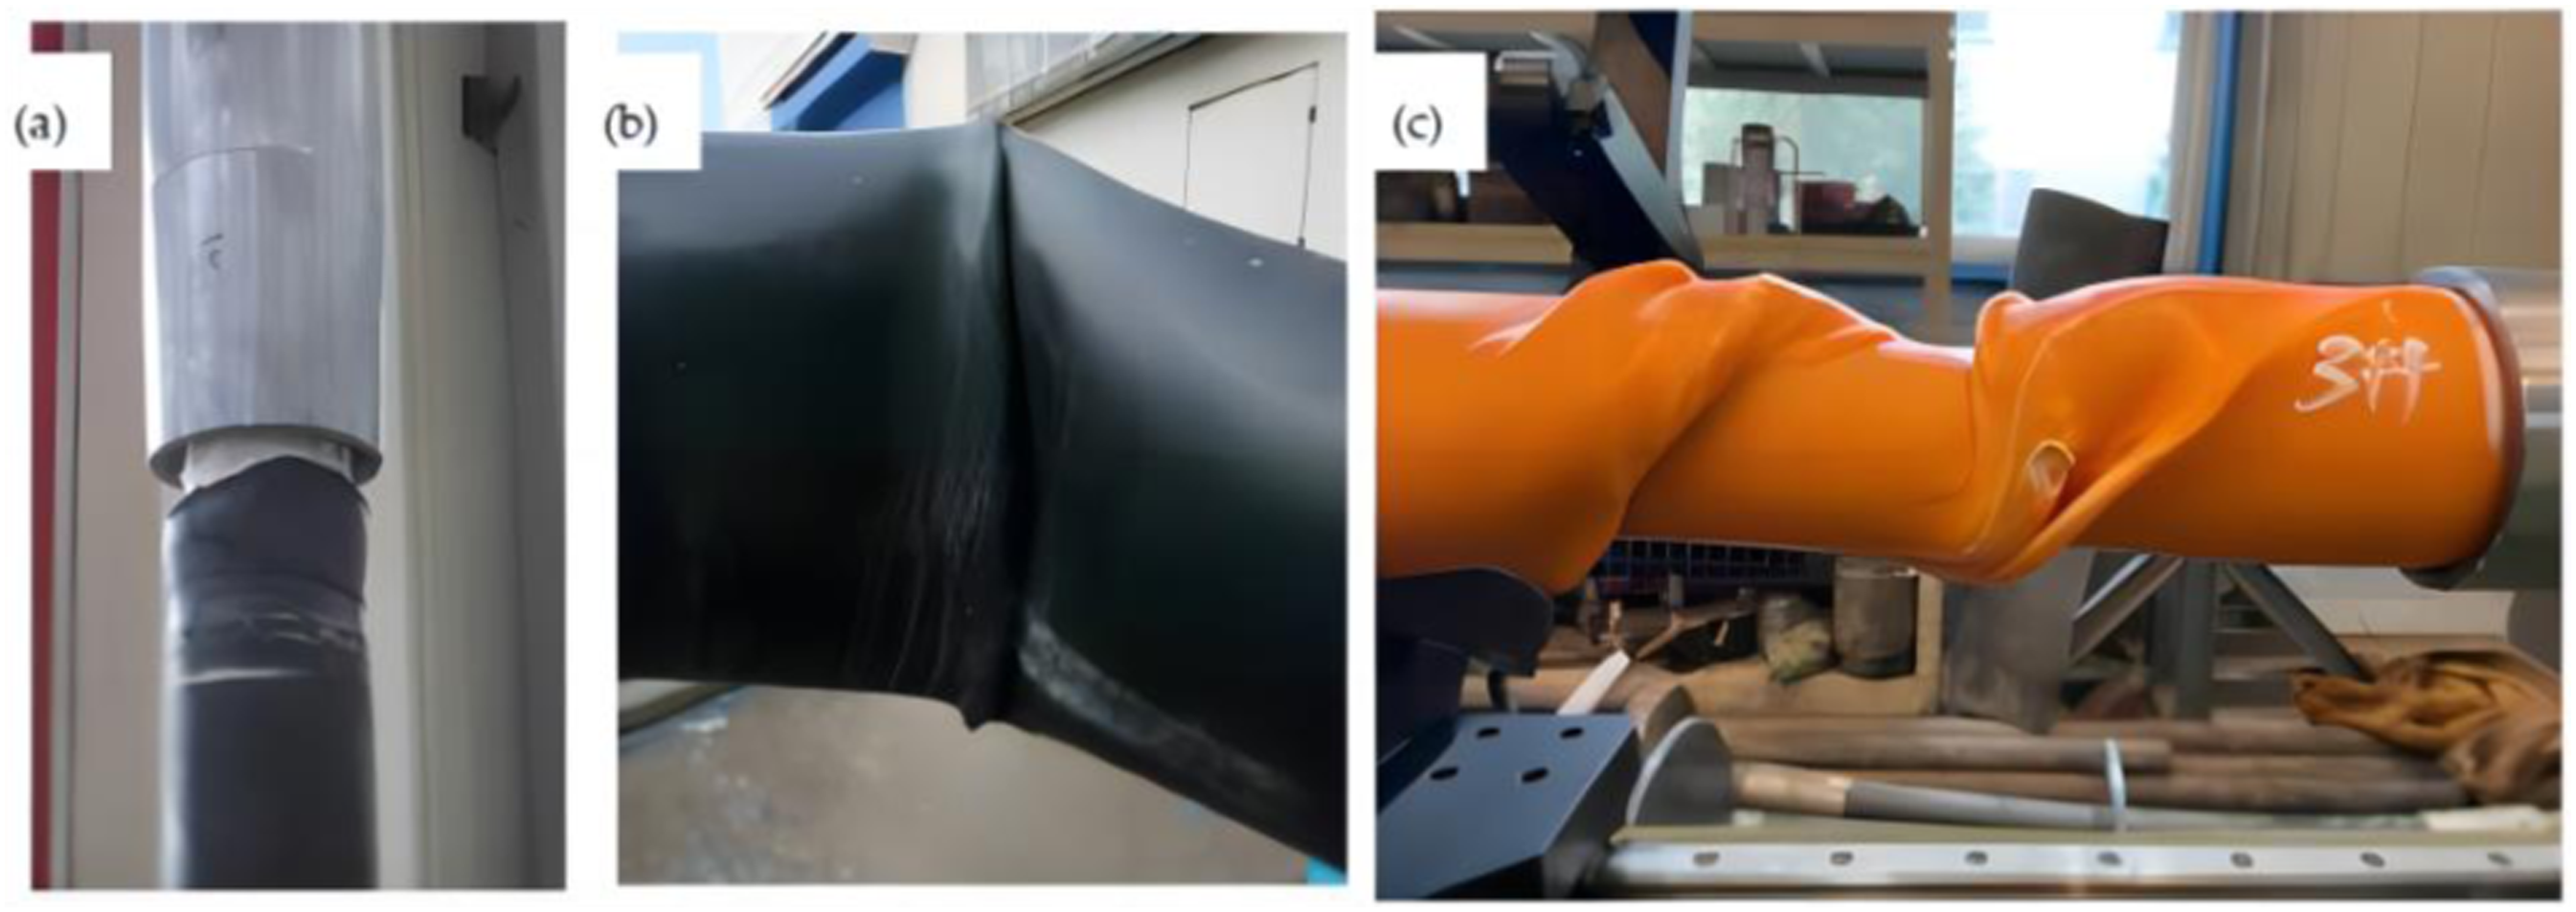
Concerning the failure risk of composite pipes, a few clear criteria can be used as a guide to effectively control and prevent the above failure risks for the ultimate working performance of FRTP in tension, bending, and torsion. An effective way to determine the ultimate working performance of FRTP is to conduct a large number of full-size tests under different working conditions. However, there are many types of these pipes according to size and manufacturing process such as the wide range of FRTP specifications (diameter range of 50∼150 mm, pressure range of 1.6∼32 MPa), the variety of material types (a variety of thermoplastics and reinforcing material types), as well as the number of layers of winding angle in different manufacturing processes. Evaluating the mechanical performance of FRTP by test is time-consuming, costly, and difficult to give specific results quickly and accurately.9,10
Theoretical analysis and numerical simulation can be used to calculate the structure and strength of the composite pipe to assess the risk of failure. By classical lamination theory and Roham 11 built a sequential failure modelling to obtain the results of the ring stiffness for GRP, which are in good agreement with experimental values. To consider the influence of nonlinear factors, Roham 12 estimated the stiffness using finite element method and continuous shell elements (SC8R). It conclude that the effects of large deformation play a greater role than the material nonlinearity. Creep analysis of GFRP is important for evaluate service performance in the long term. The analysis by Roham and Reza 12 investigates the creep behavior of GFRP under compressive transverse loading form the view of theoretical modeling and test.13–15 In these research, a computational model is developed to estimate radial deformation of pipe, and conducted that changing the angle of the fibers in the helix layer and increasing the thickness of the liner could significantly affect the creep performance of the pipe. Combining the simulation analysis and software development techniques, an integrated design-optimization platform was developed to improve the design efficiency.16,17 In this optimization process, the minimizes price was set as the primary objective while considering design requirements and manufacturing constraints as constraints, and ply sequence, fiber volume fraction, winding angle, and total number of plies as design variables. The proposed optimization method provides the guide for lowest cost optimal structural design for FRP pipelines used in the oil and gas market.
Gu and Huang 18 proposed a three-dimensional finite element approach to calculate the stress field of an angle-plied laminate under a uniaxial tension, which is used to predict the initiation of a laminate delamination through analyzing the matrix failure. Chen et al. 19 investigated the mechanical behaviors of steel strip-reinforced flexible pipe under combined axial extension and internal pressure load to analyzed typical failure characteristics based on finite element method. With verification by experiments, the method can be guide for the design and application of the kind of pipe. Assuming that the multilayer fiber reinforced composite pipe is three-dimensional and anisotropy, Ansar et al. 20 established a mechanical model of composite pipe under the coupling of internal pressure, bending, and internal pressure and temperature change, and then derived the mechanical response characteristics of the pipe under different working conditions. Bai et al. 21 established a two-dimensional mathematical model of the composite pipe and analyzed the bending behavior of the RTP pipe under the coupling of pure external pressure, pure bending moment, external pressure, and bending moment, and discussed the effects of parameters such as diameter-thickness ratio, initial ellipticity, and initial stress. Yu et al. 22 built a two-dimensional mathematical model to analyze the buckling behavior of RTP pipe under pure external pressure, pure bending moment, external pressure, and bending moment coupling and discussed the influence of parameters such as diameter-thickness ratio, initial ellipticity, and initial stress. Heggab et al. 23 numerically simulated the bending behaviors of glass fiber reinforced pipelines and found that the pipe failure starts with the damage in the composite layer and progresses gradually, which led to the conclusion that the pipe failure is not a linear bending behavior. Ashrafetal et al. 24 simulated the coiling of AS4-carbon fiber reinforced polyether ether ketone (PEEK) composite pipe and evaluated the transverse damage and failure at a large bending radius, resulting in the limitation of coiling ability.
The main objective of this work is to systematically analyze the stress and deformation of FRTP subjected to different in-service loads by FEM. The extreme load capacity of FRTP is determined under internal pressure, axial tensile, coiled bending, and torsion loads based on the yield strength of thermoplastic liner and reinforcing fiber materials. And the corresponding tests were done to validate the FEM results.
Methodology
Finite element model
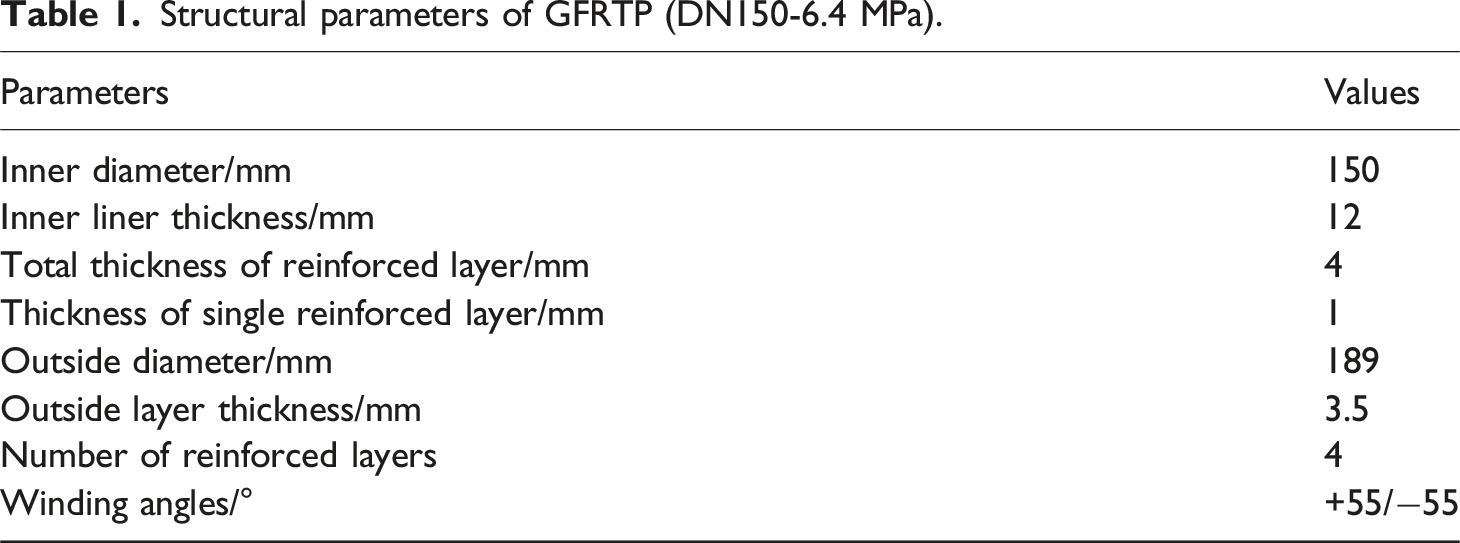
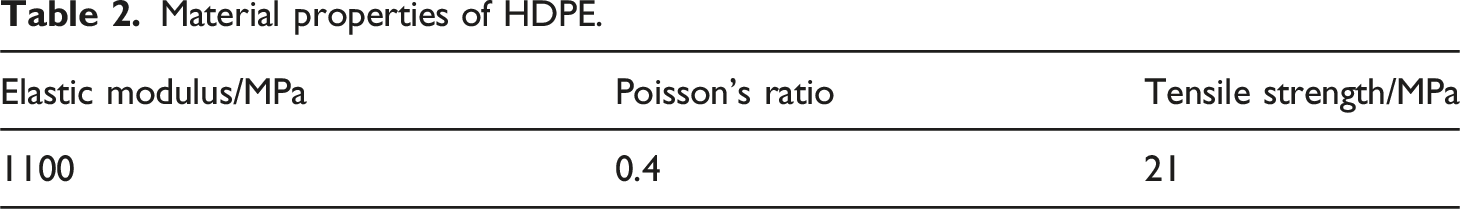
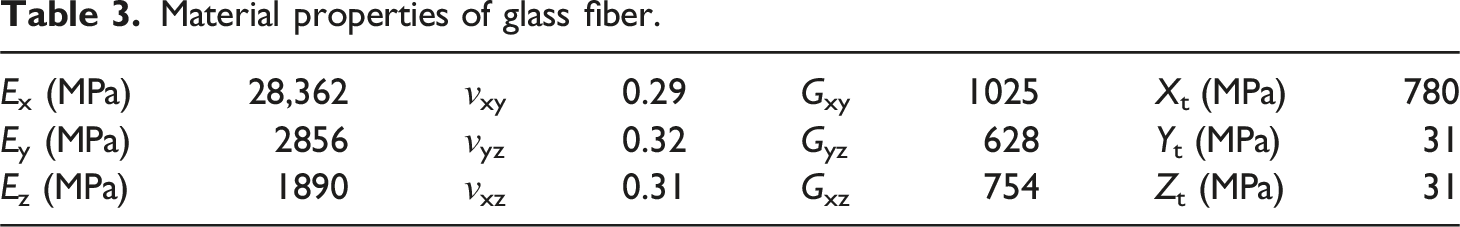
Three-dimensional (3D) FE models were built by ANSYS/WORKBENCH 2022R1 based on the structural characteristics and material parameters of glass fiber reinforced thermoplastic pipe (GFRTP). The FE model is shown in Figure 3, where the internal pressure P is applied directly on the pipe surfaces. Reference points located at the center of pipe ends are set as kinematic boundary conditions. To eliminate the end effect generated by the fixed constraints or connections at the end of the pipe, this paper adopts a pipe length of 2000 mm, that is, 10 to 20 times the GFRTP outer diameter. The structural parameters of GFRTP are listed in Table 1. The inner liner pipe and outer protection layer pipe are HDPE materials, and the material parameters of HDPE and the glass fiber reinforced tape are shown in Tables 2 and 3.
25
FE model of GFRTP. Structural parameters of GFRTP (DN150-6.4 MPa). Material properties of HDPE. Material properties of glass fiber.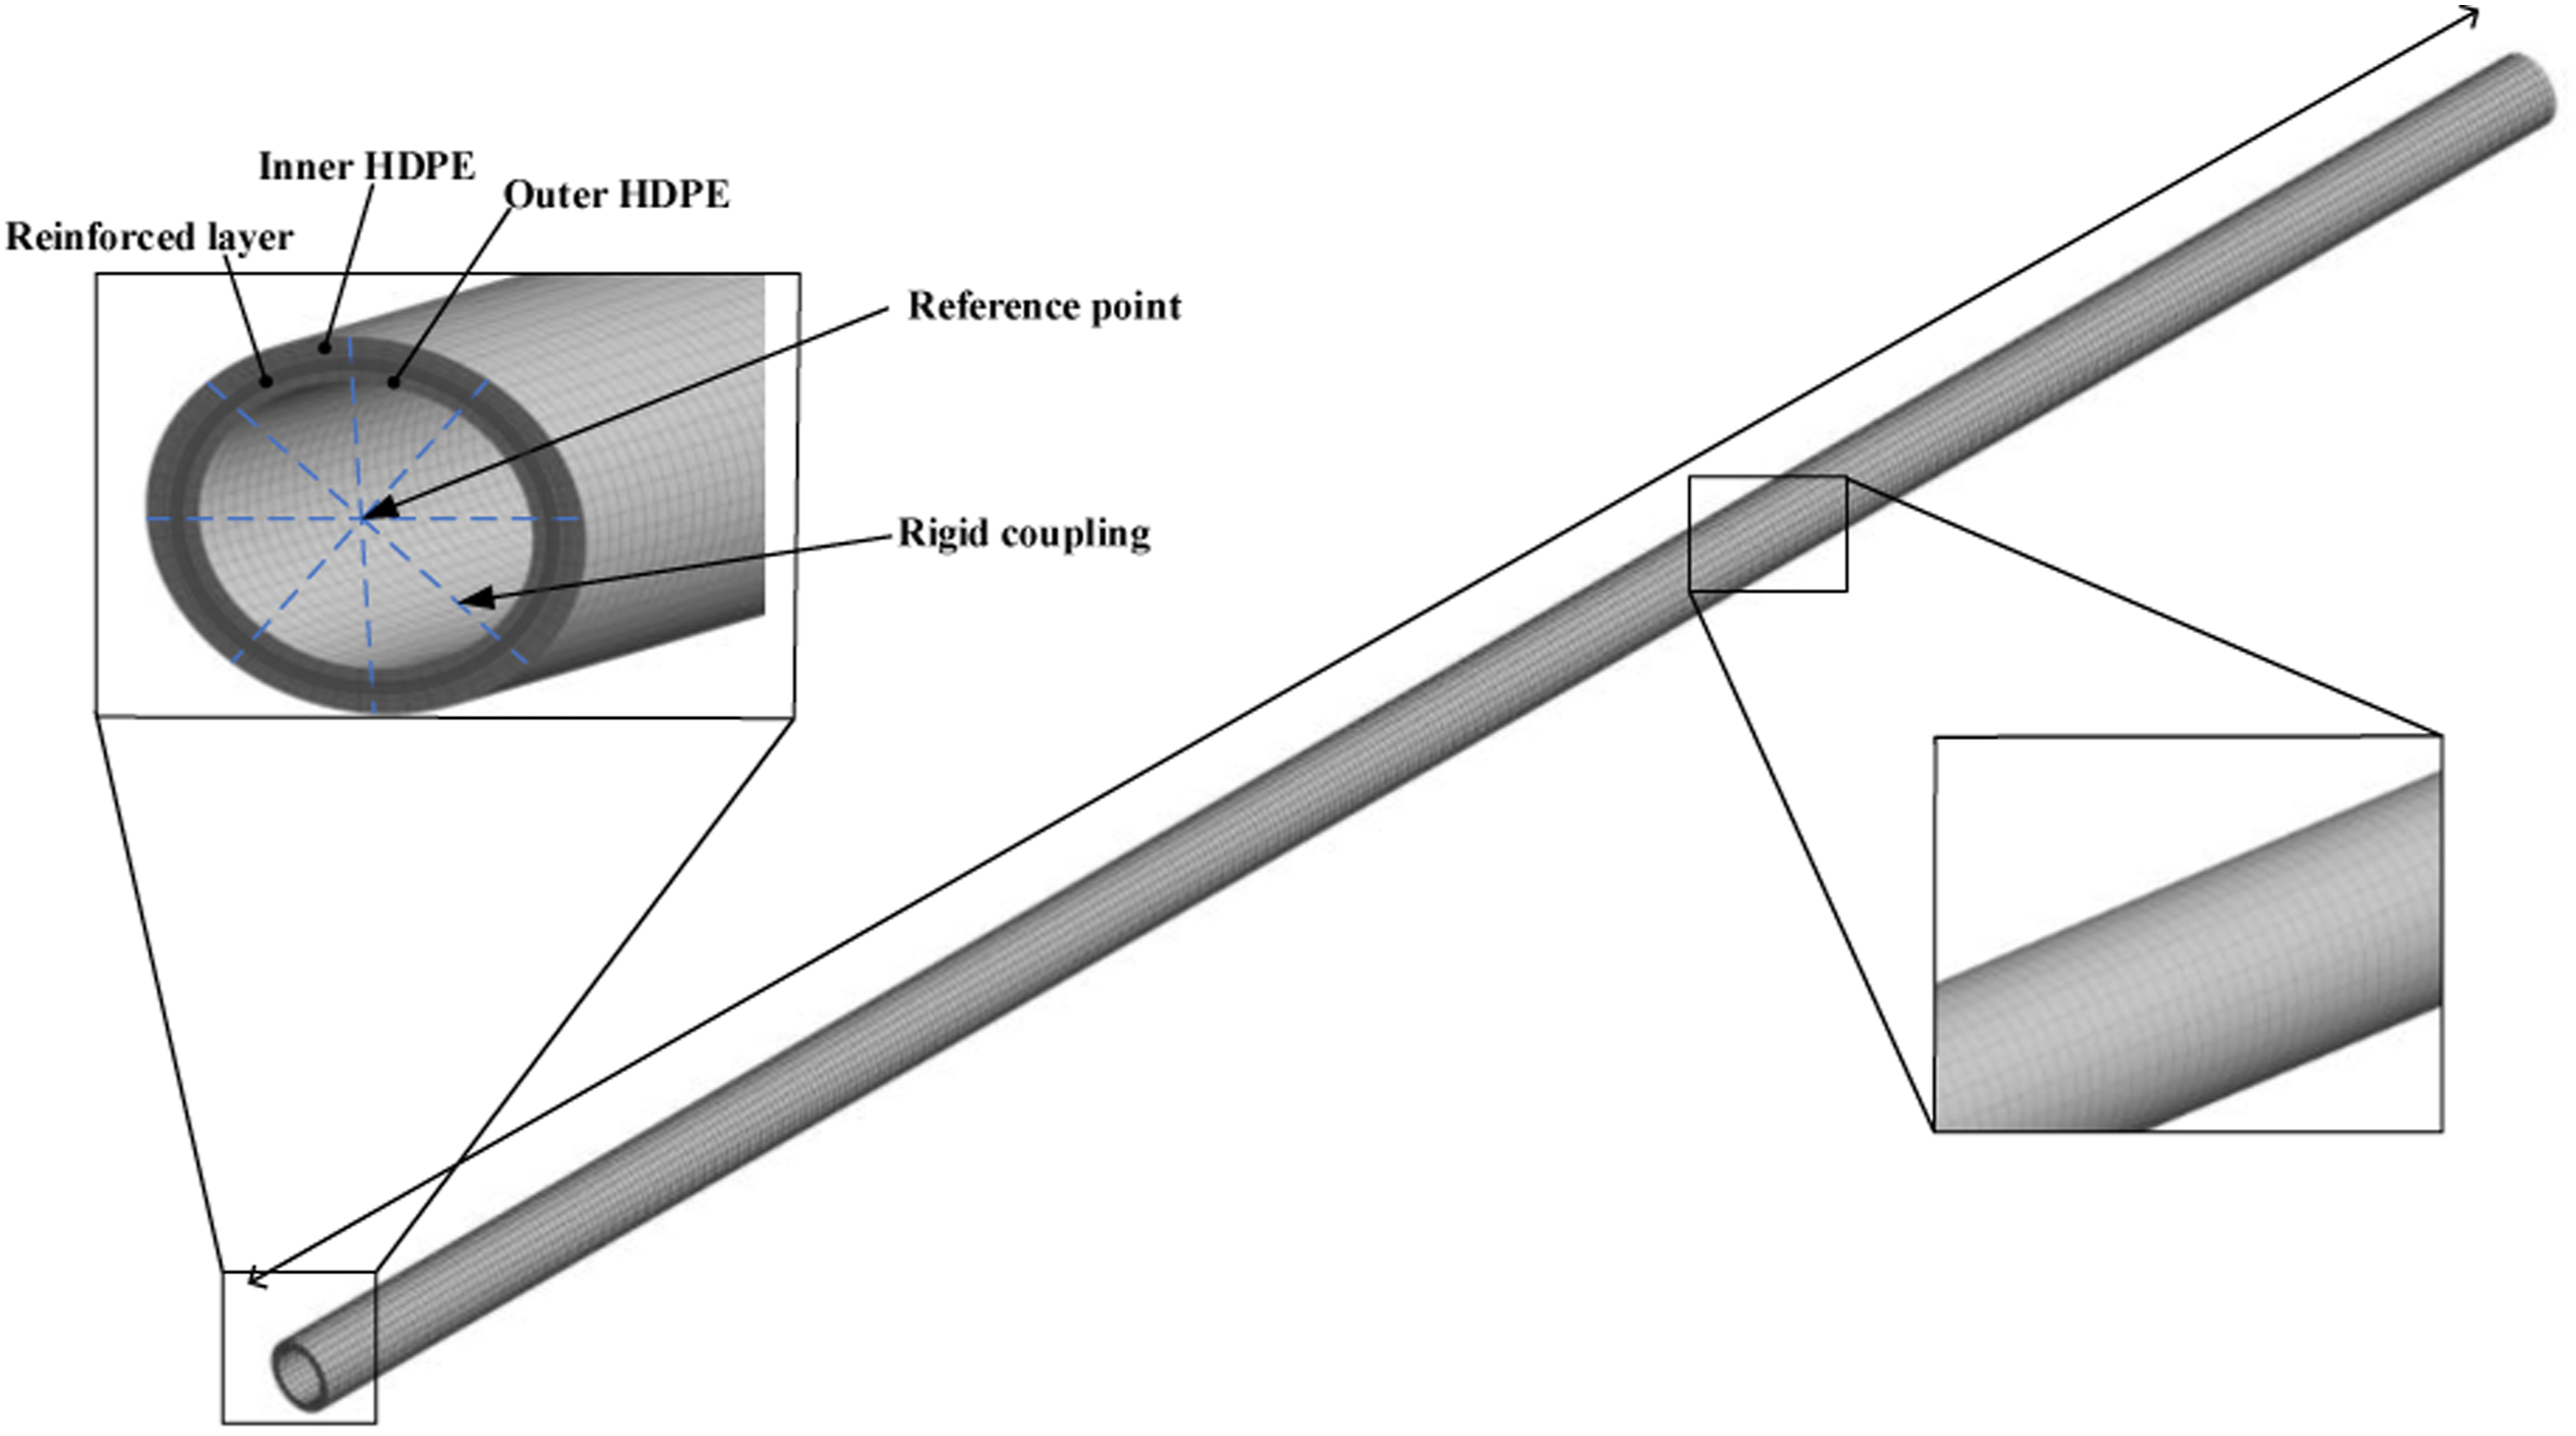
Reinforced layer model
The simulation model of the reinforcement layer is the key to the success of composite pipe design. In this paper, the reinforcing layer adopts the homogenization model, that is, the matrix and fiber composition of the fiberglass tape are macroscopically viewed as a kind of orthogonal anisotropic homogeneous material. Continuous fiberglass tapes are helically staggered with a winding angle of ±55°. Since the Halpin-Tsai model 26 is the most suitable for simulating the working condition of GFRTP under internal pressure load with minimum error, which is also adopted in this paper. The elastic constants and volume ratios of the glass fibers and matrix materials in the fiberglass tapes are known, and the elastic constants of the continuous glass fiber composite tapes are solved by the Halpin-Tsai combined modeling method. 27 Moreover, the maximum stress criterion is used as the failure criterion of fiber layer. Starting with a shell 2D model by ANSYS/ACP module, the next step is to create the solid model with the prescribed material plies thickness and orientation using a 3D solid element. The whole FE model contains a total of 225,600 elements.
Interlayer interaction
The interaction between the HDPE pipe and the reinforcement layer is set with surface-surface contact. The surface stiffness of the HDPE pipe is lower compared to glass fiber, therefore the surface of the HDPE pipe is designated as a sub-surface. The normal mechanical behavior was defined as “hard contact” and “separation allowed after contact,” the tangential behavior was represented by Coulomb friction, and the coefficient of friction of the glass fiber layer in contact with the HDPE surface was 0.2.
Boundary conditions and loads
The boundary conditions and loads applied to this model are shown in Figure 4. The right end of the pipe was fixed in all six degrees while the left end face is kinematically coupled to a reference point located at the center of its cross-section to ensure uniformity and stiffness of the cross-section deformation.
28
Several working loads such as internal pressure, bending, torsion, and tension loads were applied on the left end face of GFRTP. Schematic diagram of the loading and boundary conditions: (a) inner pressure; (b) tension; (c) torsion; (d) bending.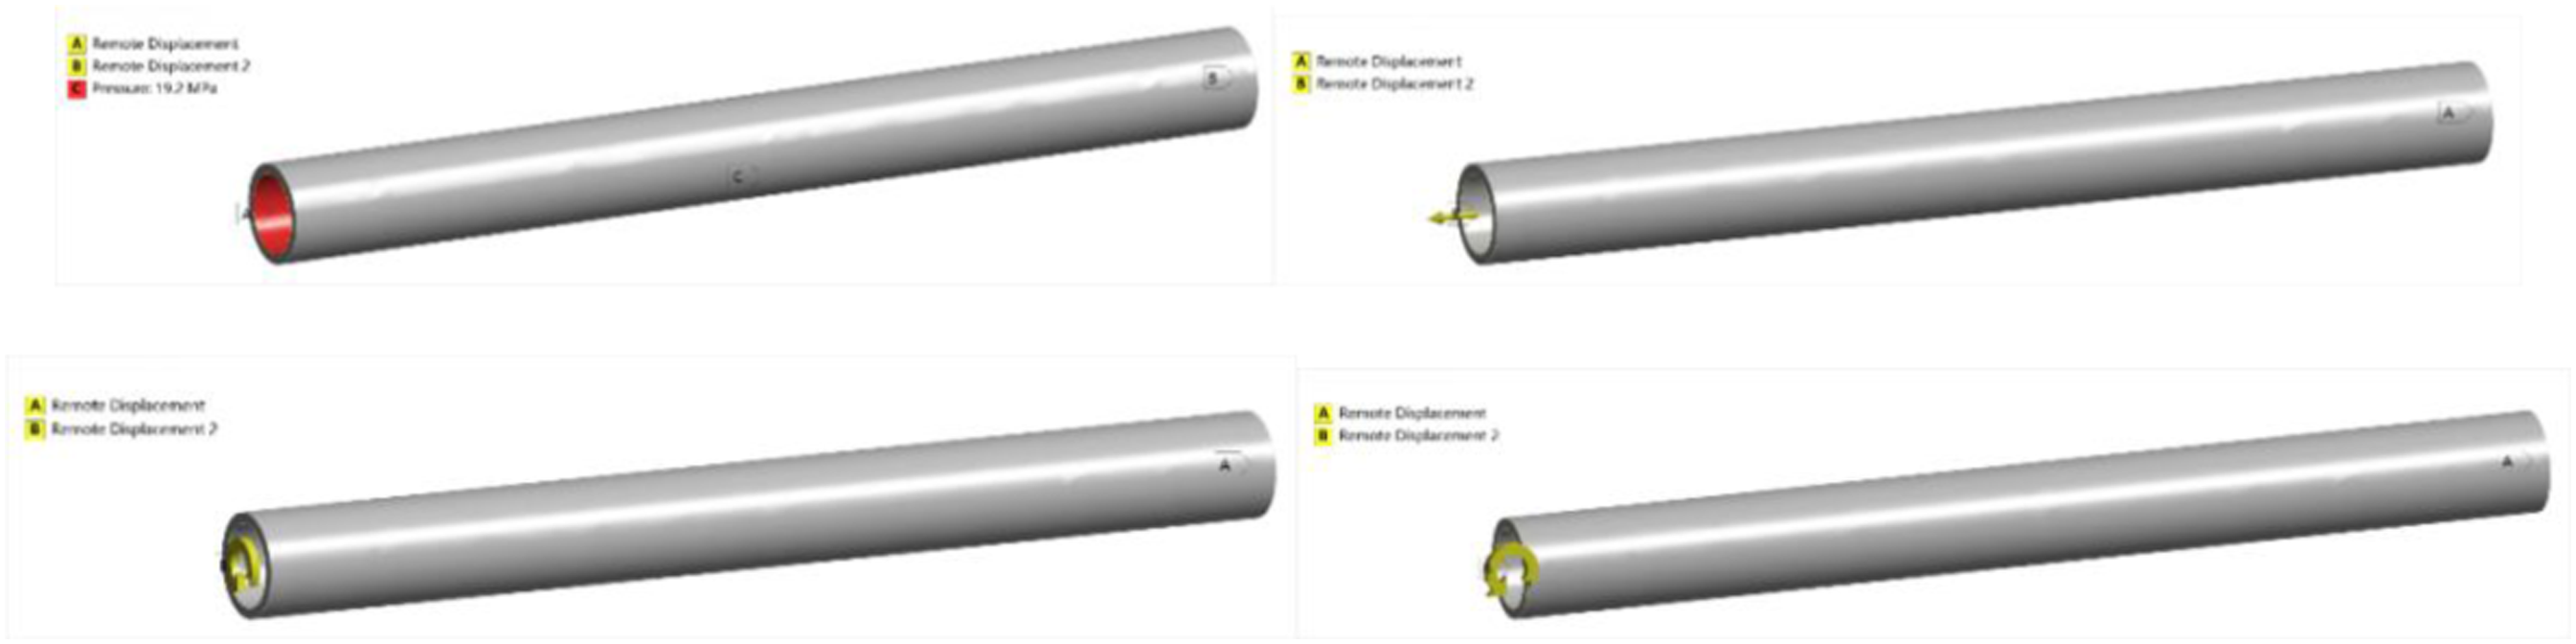
Finite element model validation
Based on the established GFRTP model, the mechanical behavior of GFRTP with nominal size DN150 under internal pressure was simulated by the finite element method. It is empirically evident that the stress of the innermost fiber layer is the largest one among all the layers, which means the first to reach ultimate strength. In contrast, the HDPE has high plasticity and is not prone to failure. So the maximum stress of the innermost fiber layer is utilized to determine the burst pressure of the GFRTP. Under the pressure of 19.2 MPa (3 times the nominal pressure of 6.4 MPa), the deformation and stress distribution of each layer of the RTP are obtained as shown in Figures 5 and 6. Taking the middle part as the observation point, it can be seen that the simulated outside diameter of RTP increases by 10.8 mm, which is consistent with the measured increase of the outside diameter of the physical pipe by 10.1 mm in the hydraulic test at a holding pressure of 19.2 MPa. Despite the increase in pipe diameter, the cross-section of the pipe still maintains the circular cross-section. So it is concluded that the established FE model is reliable. Radial deformation of GRF-RTP(Internal pressure 19.2 MPa). Stress distributions of each layer of the RTP at the inner pressure of 19.2 MPa: (a) liner; (b) the outermost reinforced layer; (c) the second reinforced layer; (d) the third reinforced layer; (e) the innermost reinforced layer: (f) outer cover.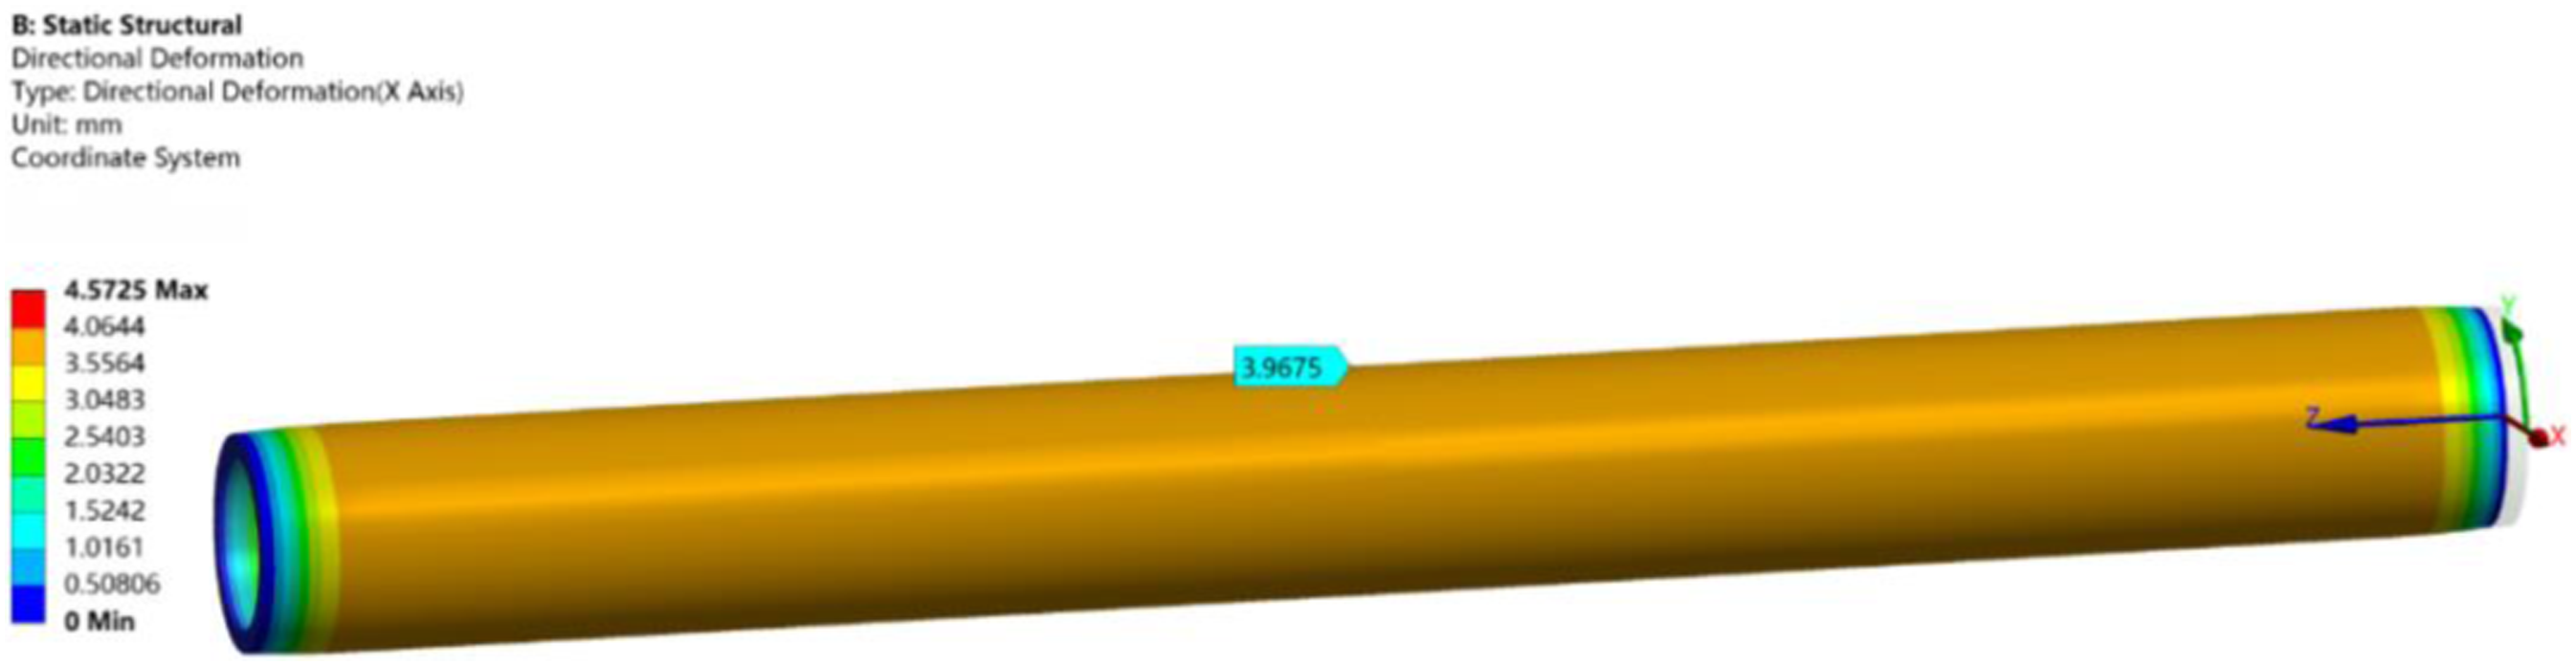
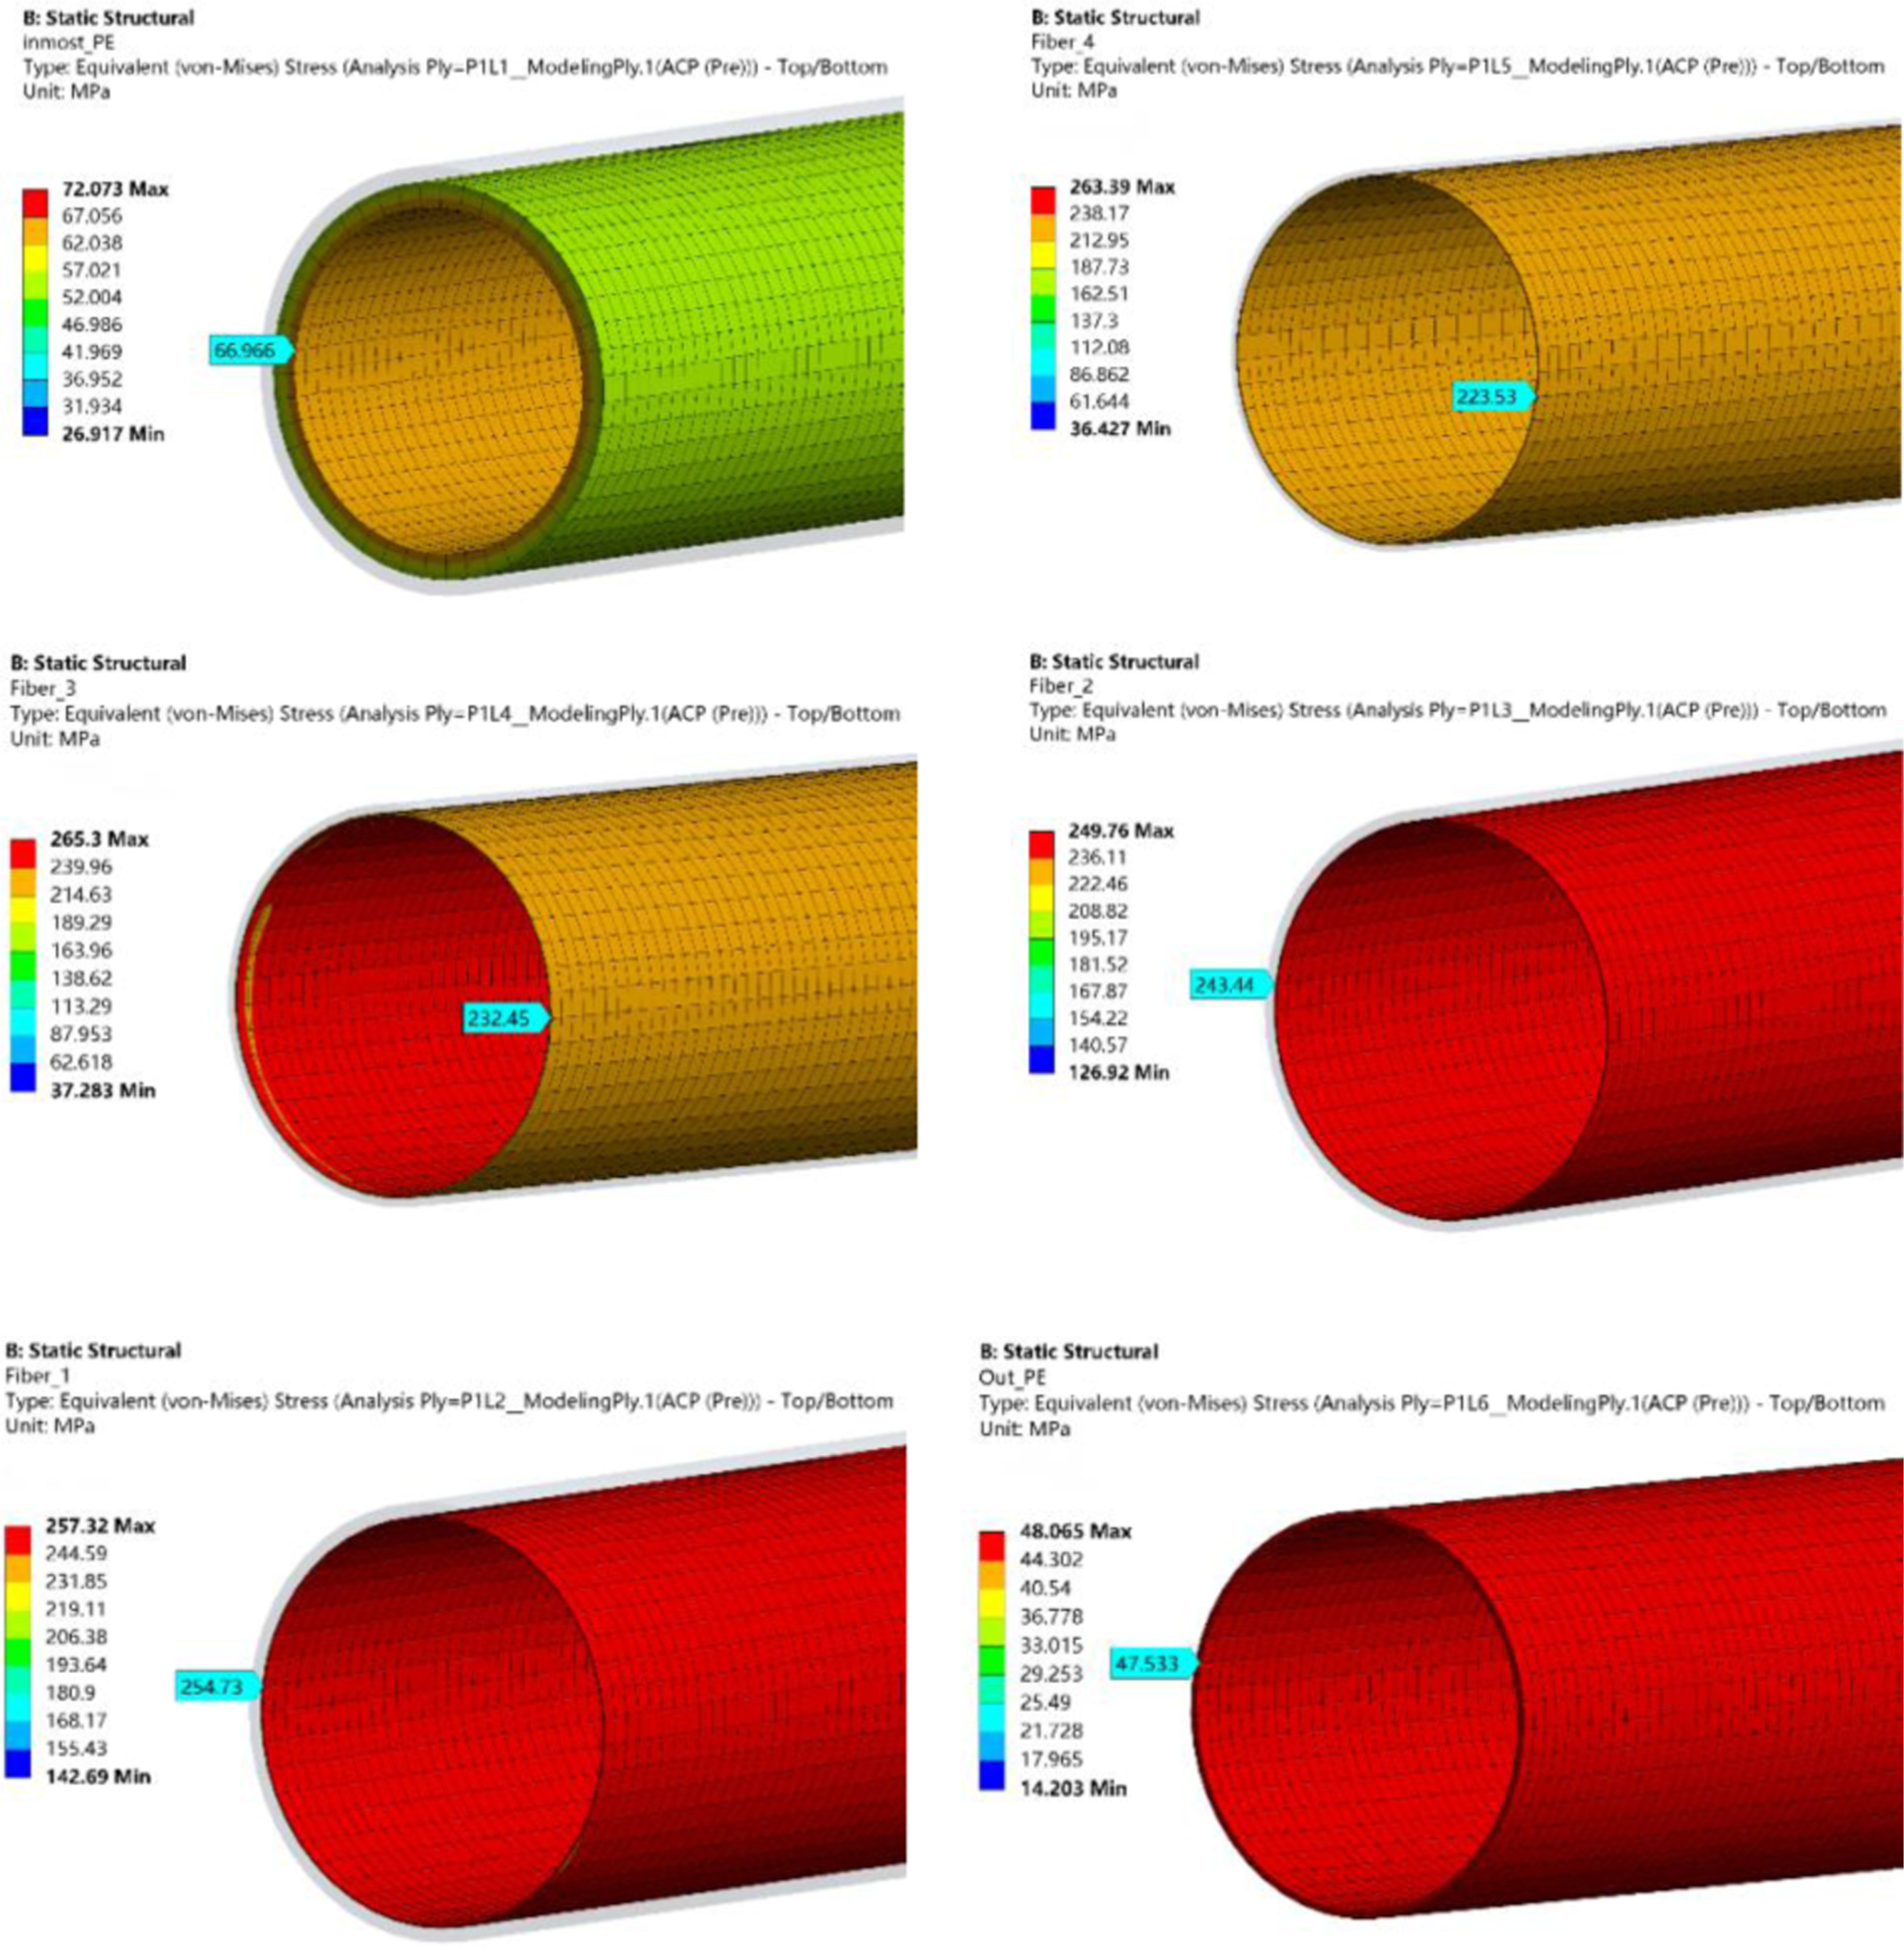
In the case of the internal pressure of 19.2 MPa, the stress distribution of each layer is shown in Figure 6 by observing the middle cross-section of the pipe. The stress of the liner and outer protective layer with the material of HDPE are 66.9 MPa and 47.5 MPa. Compared to the outer layer, the stress of the liner is greater. Practically, the load is firstly applied on the inner surface of the liner, and transferred to fiber layers and the outer protective layer in turn. During the load transfer process, the high-strength fiber reinforced layer bears most of the load, which makes the outer protective layer less stressed and shows a smaller stress value. The stress of the fiber reinforced layers, from the first layer (the innermost layer) to the fourth layer (the outermost layer), is 254.7 MPa, 243.4 MPa, 232.4 MPa, 223.5 MPa, which are not more than the yield limit of the fiber material. But those are much larger than ones of the inner and outer polyethylene layer, indicating that the fiber reinforced layer is the main part of the load-bearing part and the stresses on the fiber layers gradually decrease from the inside to the outside. According to the material properties, the elastic modulus of the inner and outer layers of HDPE is much smaller than the glass fiber. Thus, the maximum strain withstood by the glass fiber layer is much smaller than the HDPE. Therefore, the deformation of the inner and outer HDPE layers is limited by the glass fiber layer and failures are not easy to occur. For the stress distribution, it can be seen that the stress of the first reinforced layer is the largest and most likely to fail, which is reasonably the key part in deciding the load-carrying capacity of the GFRTP. So the stress of the innermost fiber reinforced layer can be used as the basis for estimating the failure of the GFRTP.
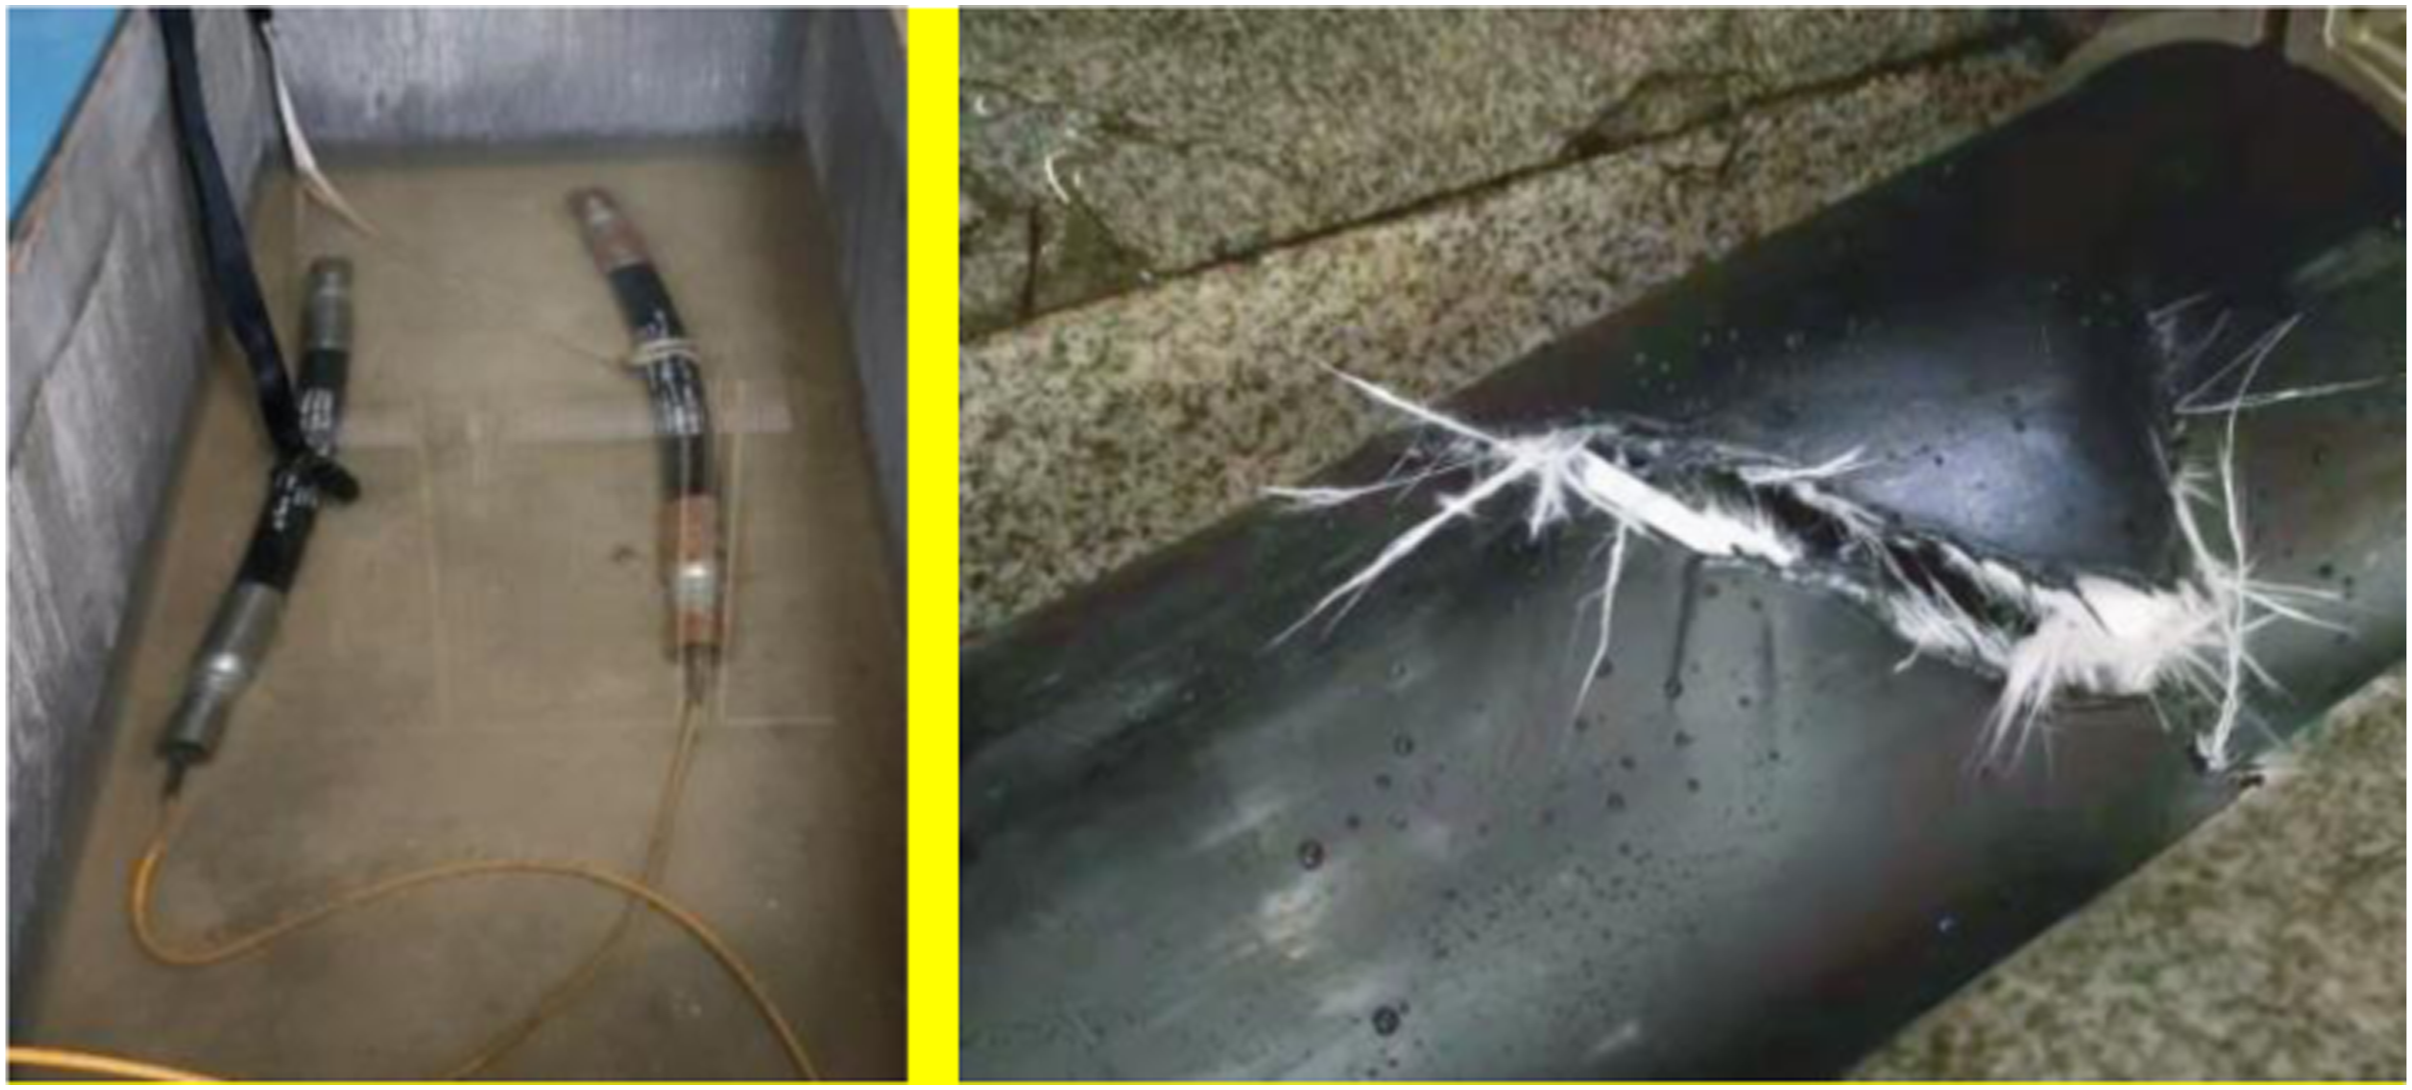
The maximum stress criterion is used as the failure criterion of the glass fiber layer, that is, as long as any stress component in the main direction of the glass fiber layer reaches its tensile strength, the fiber layer will fracture and break, and the composite pipe will fail. The internal pressure at this time will be the burst pressure of GFRTP. Figure 7 shows the stress of the first layer of the reinforced layer stress and the stress difference between the inner and outer fiber layers varying with the pressure. As is shown, when the stress of the innermost fiber layer reaches a tensile strength of 780 MPa, the corresponding pressure is 61.7 MPa, which is theoretically the burst pressure for GFRTP. Besides short burst pressure test of the GFRTP by the standard ASTM D1599-2018 was conducted by the test bench with a maximum applied pressure of 100 MPa. The internal pressure gradually increased until the pipe burst, recording the pressure values, as shown in Figure 8 The ultimate burst pressures of the GFRTP under internal pressure measured are 57.5 MPa, which is 6.8% lower than the value from FEM. Stress-internal pressure curve for the innermost polyester fiber layer of the GFRTP. Burst test of GRFRTP subjected to internal pressure.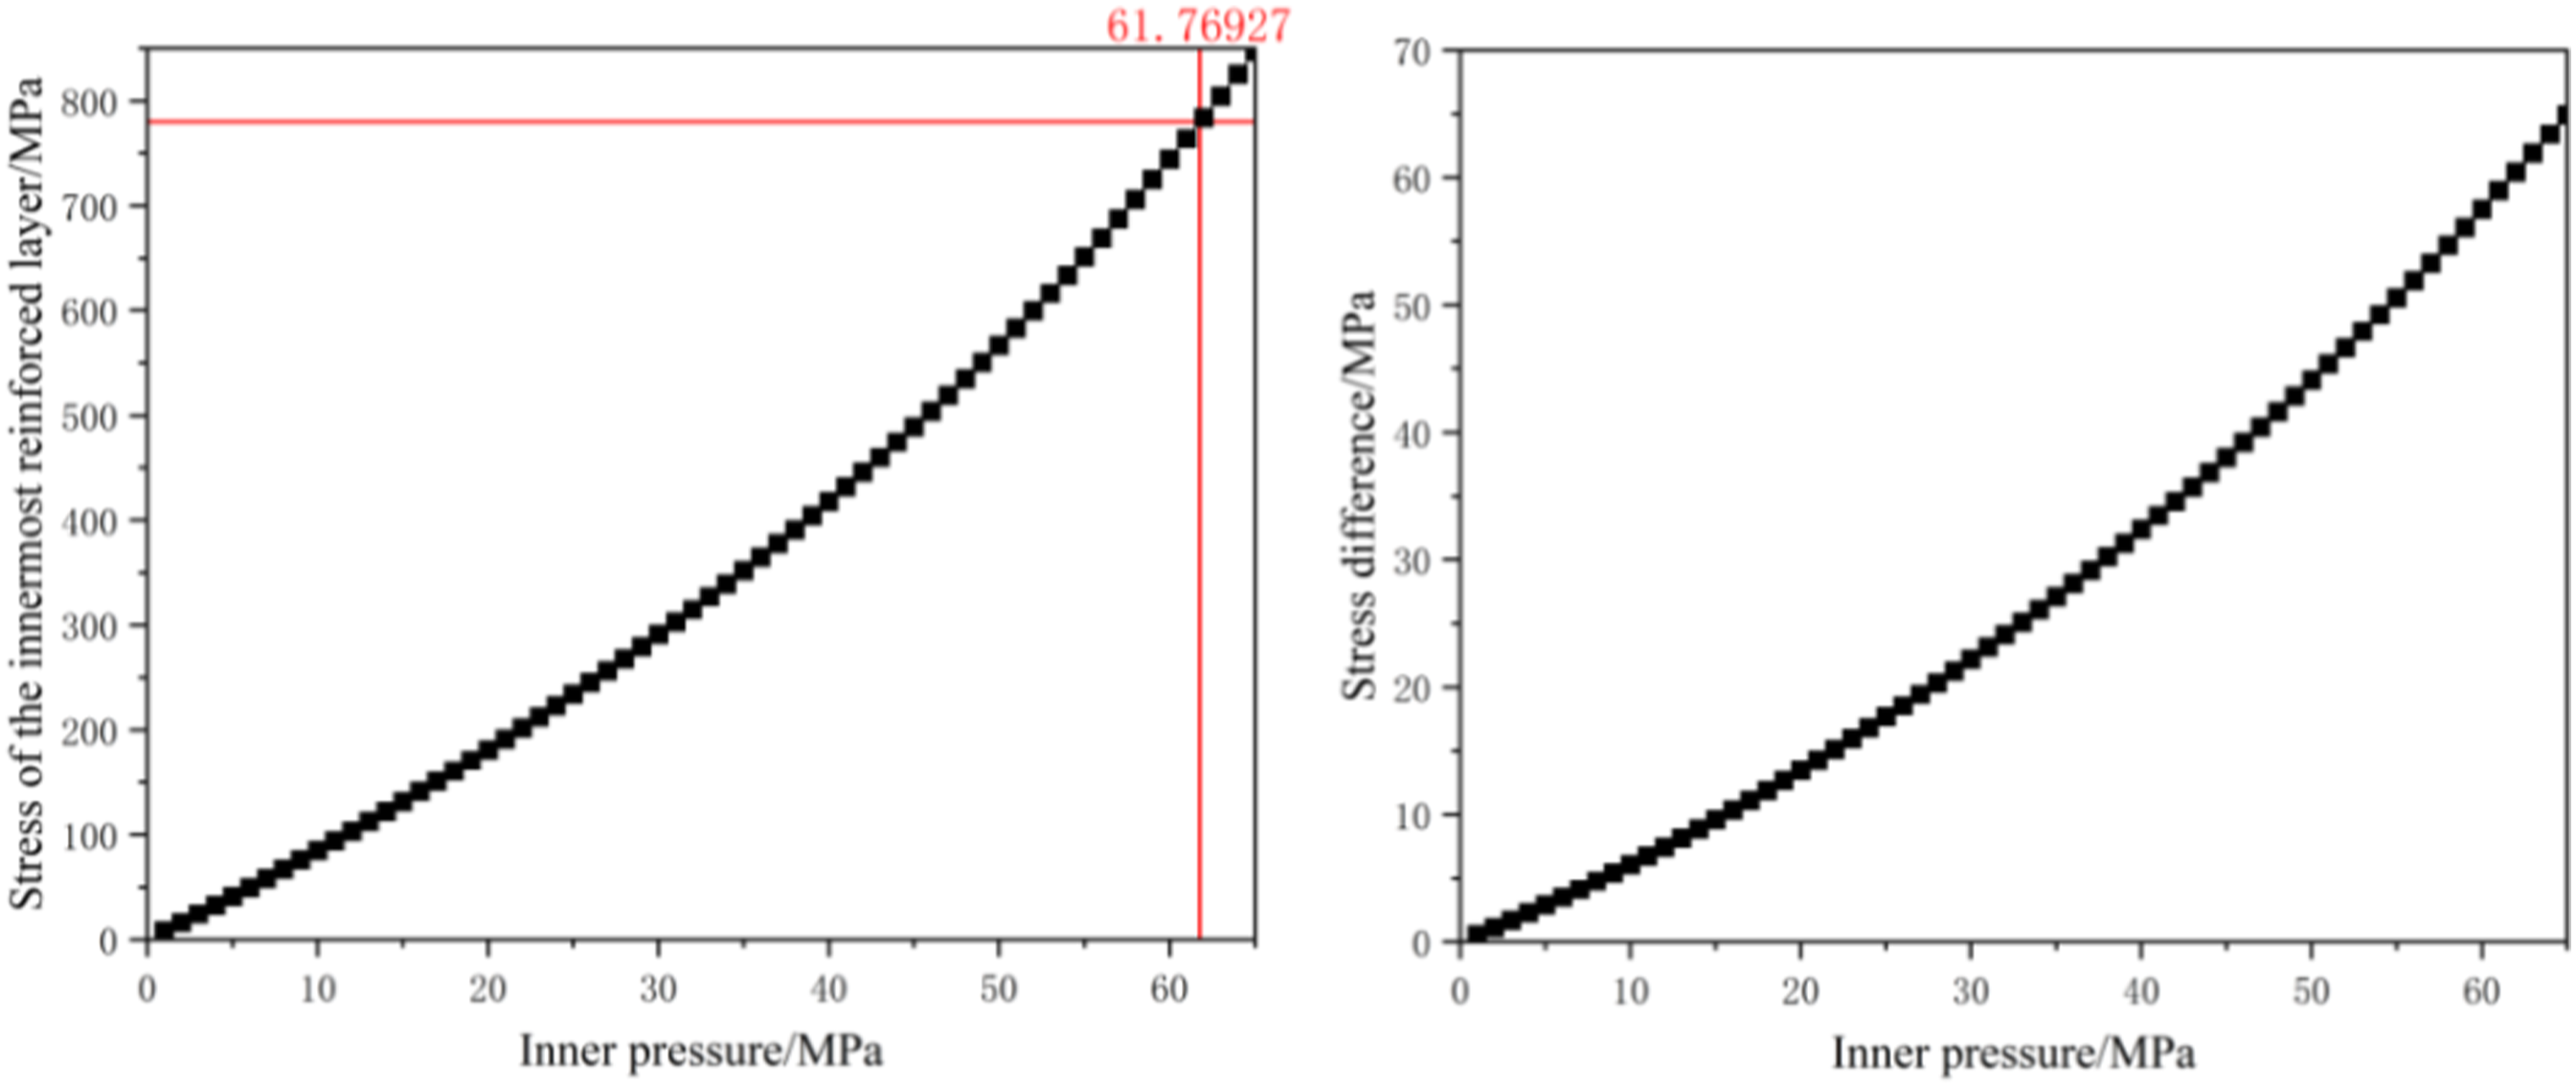
Extreme in-service performance analysis of GFRTP
Tension analysis of GFRTP
The tensile behavior of GFRTP was explored by applying axial displacement load. The right end of the composite tube was fixed and the left end was subjected to axial stretching, setting the axial displacement increment to 10 mm per step and gradually increasing to 100 mm.
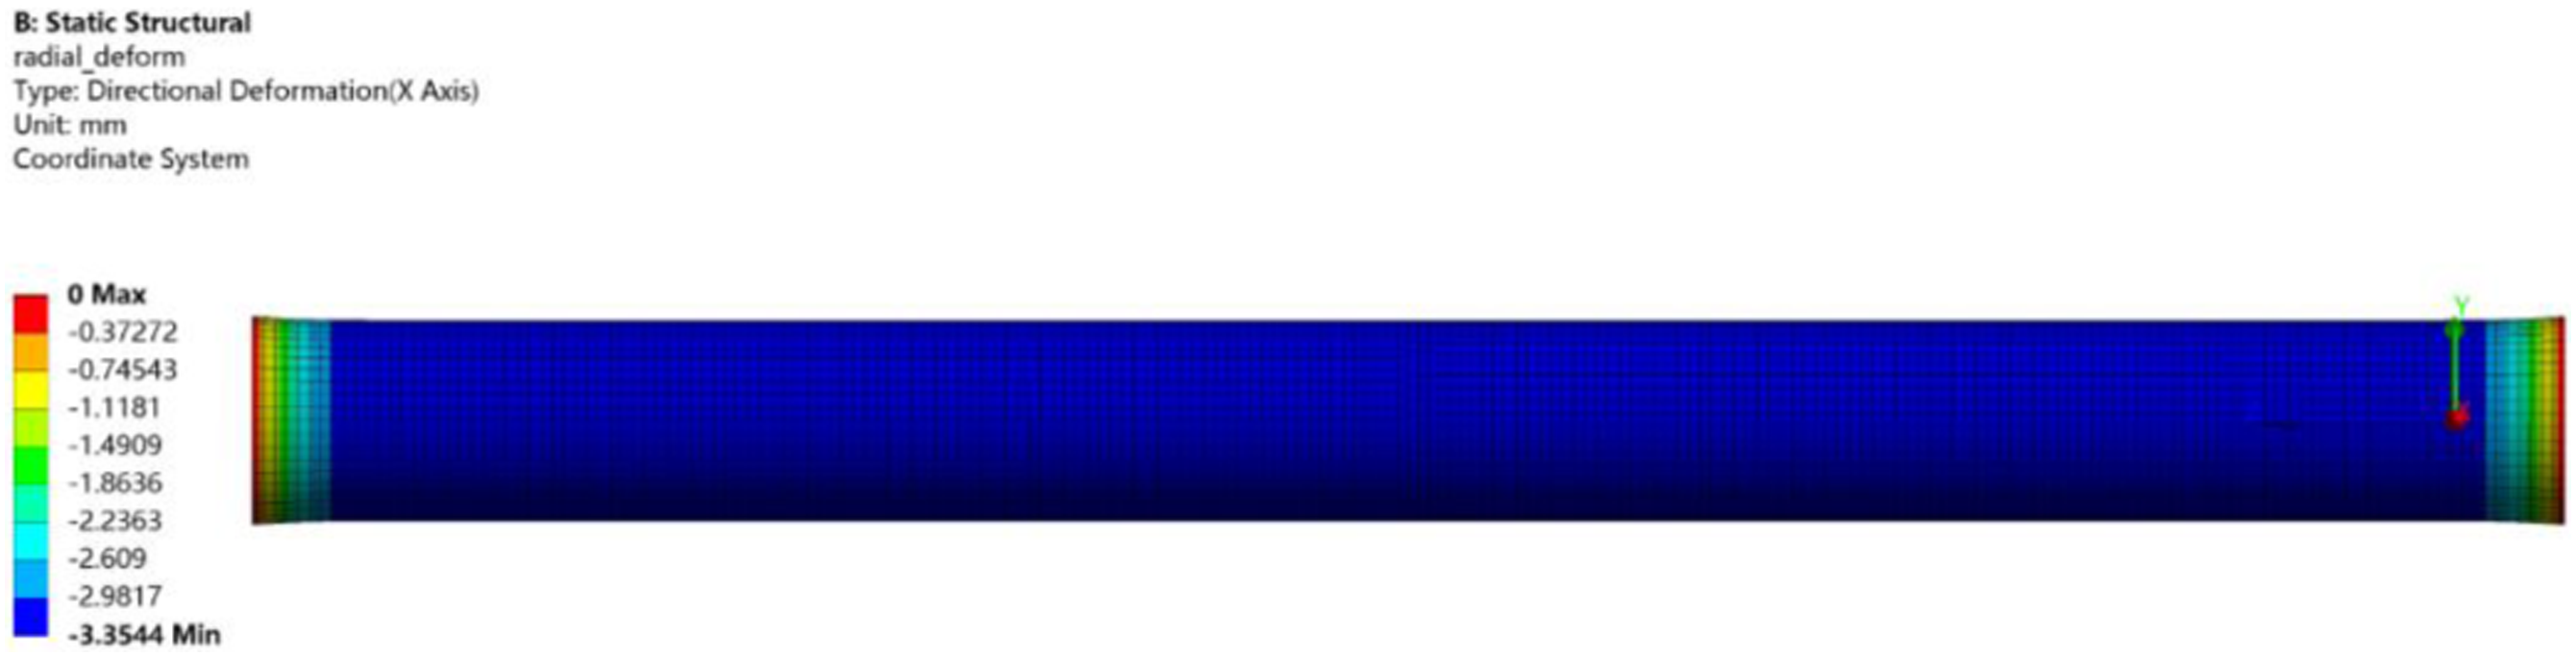
Figures 8 and 9 show the deformation cloud diagram of GFRTP under axial tensile displacement, respectively, and it can be seen that the composite pipe cross-section shrinks as the tensile displacement of the pipe increases, and the radial size of the composite pipe decreases by 3.31 mm at a displacement of 100 mm. Figure 10 shows the stress cloud diagram of each structural layer under the corresponding tensile displacement. The maximum stress value of the inner liner layer and the outer protective layer are larger than the yield strength value of HDPE 21 MPa, but the HDPE material has good elasticity and plasticity and is not easy to be broken, and its elongation at break can be up to 200% or more, and it needs a larger strain to reach its breaking strength, so it is still considered that the inner and outer layers have not been destroyed. Under the action of tensile load, the stress of the glass fiber reinforced layer is still much larger than that of the inner and outer HDPE layer, which is the main bearing part of the pipeline, and the stress of the outermost reinforced layer under the tensile load is 606.8 MPa, which is slightly larger than that of the innermost reinforced layer of 602.0 MPa (ignoring the stress concentration at the end of the composite pipe). The stress in the reinforced layer is much smaller than the breaking strength of glass fiber 780 MPa, indicating that the glass fiber can withstand the tensile action, and the fourth layer stress in the reinforced layer of the composite pipe can be used as a basis for judging whether the composite can withstand tensile loads. According to the maximum stress criterion, the stress of the outermost reinforced layer exceeds the tensile limit of the glass fiber material and the GFRTP comes into failure. At this time the corresponding tensile displacement is the limit of tensile displacement for GFRTP. Axial deformation of GFRTP subjected to tension. Radial deformation of GFRTP subjected to tension.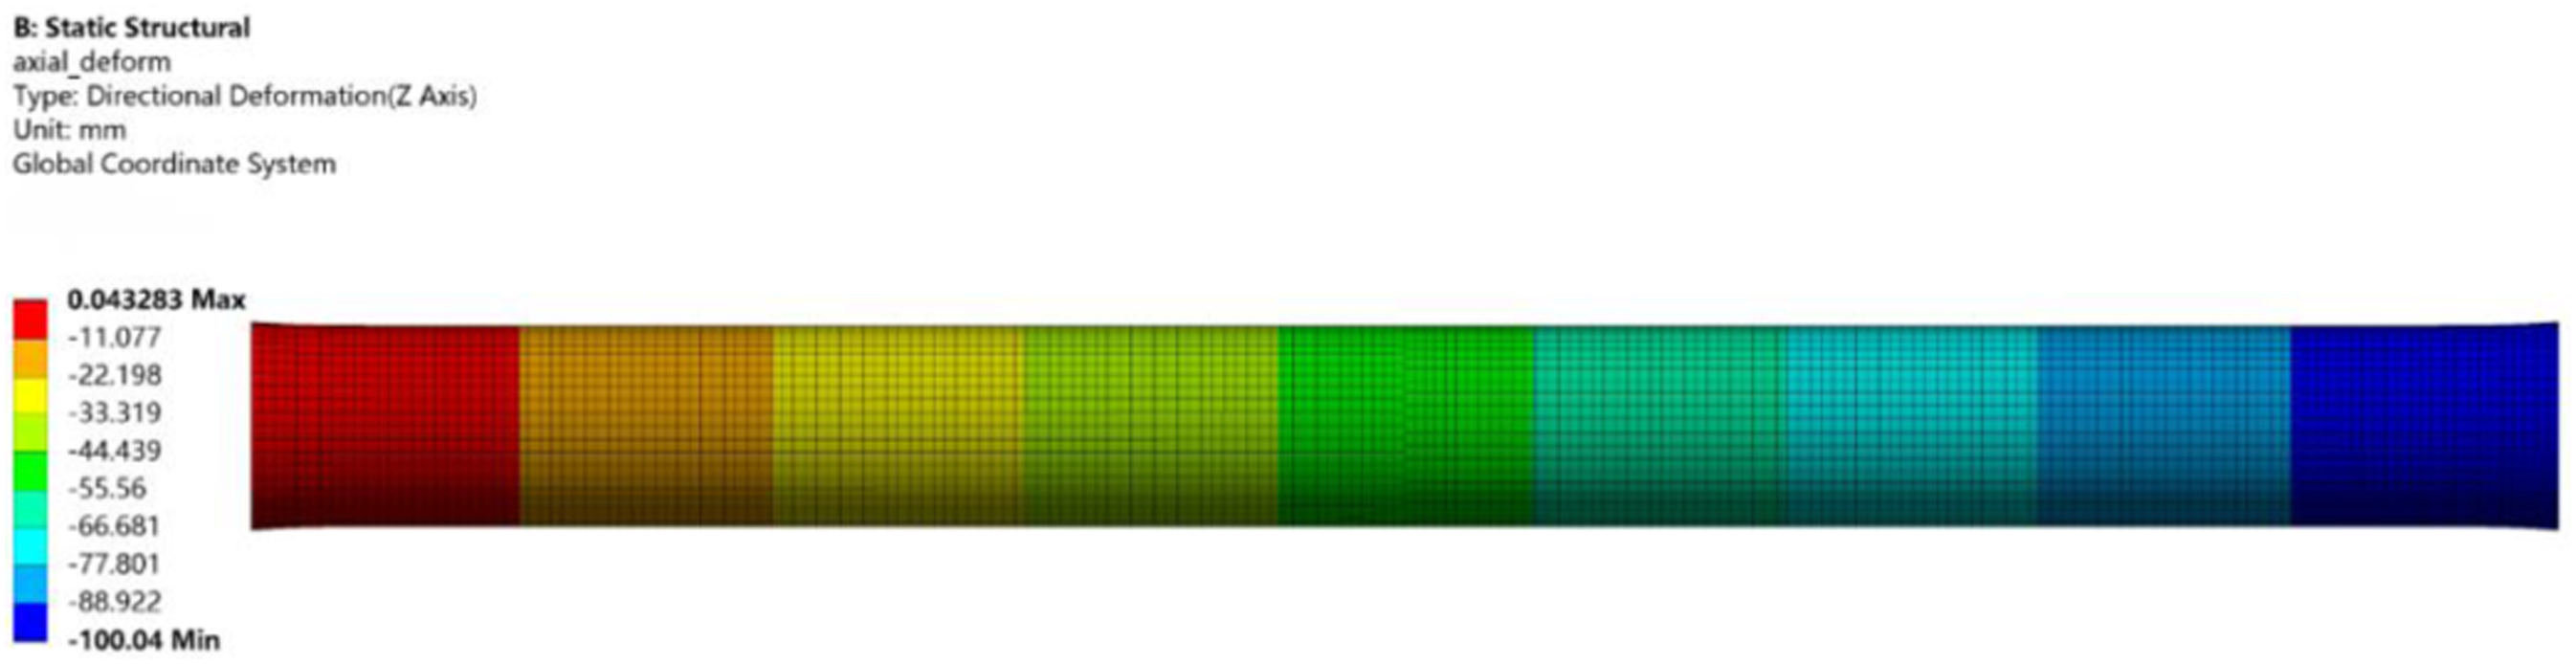
The stress of the outermost reinforced layer and the stress difference between the innermost and outermost fiber layers with tensile displacement curves are given in Figure 11. When the stress suffered by the innermost glass fibers reaches its tensile strength of 780 MPa, the simulation calculates that the axial tensile displacement of the GFRTP, and the axial tensile load is 1.66 × 10⁶ N. The maximum axial tensile displacement of GFRTP is 132.8 mm (6.64% unit deformation). Stress distributions of each layer of the RTP under tension: (a) liner; (b) the first reinforced layer; (c) the second reinforced layer; (d) the third reinforced layer; (e) the fourth reinforced laver: (f) outer cover.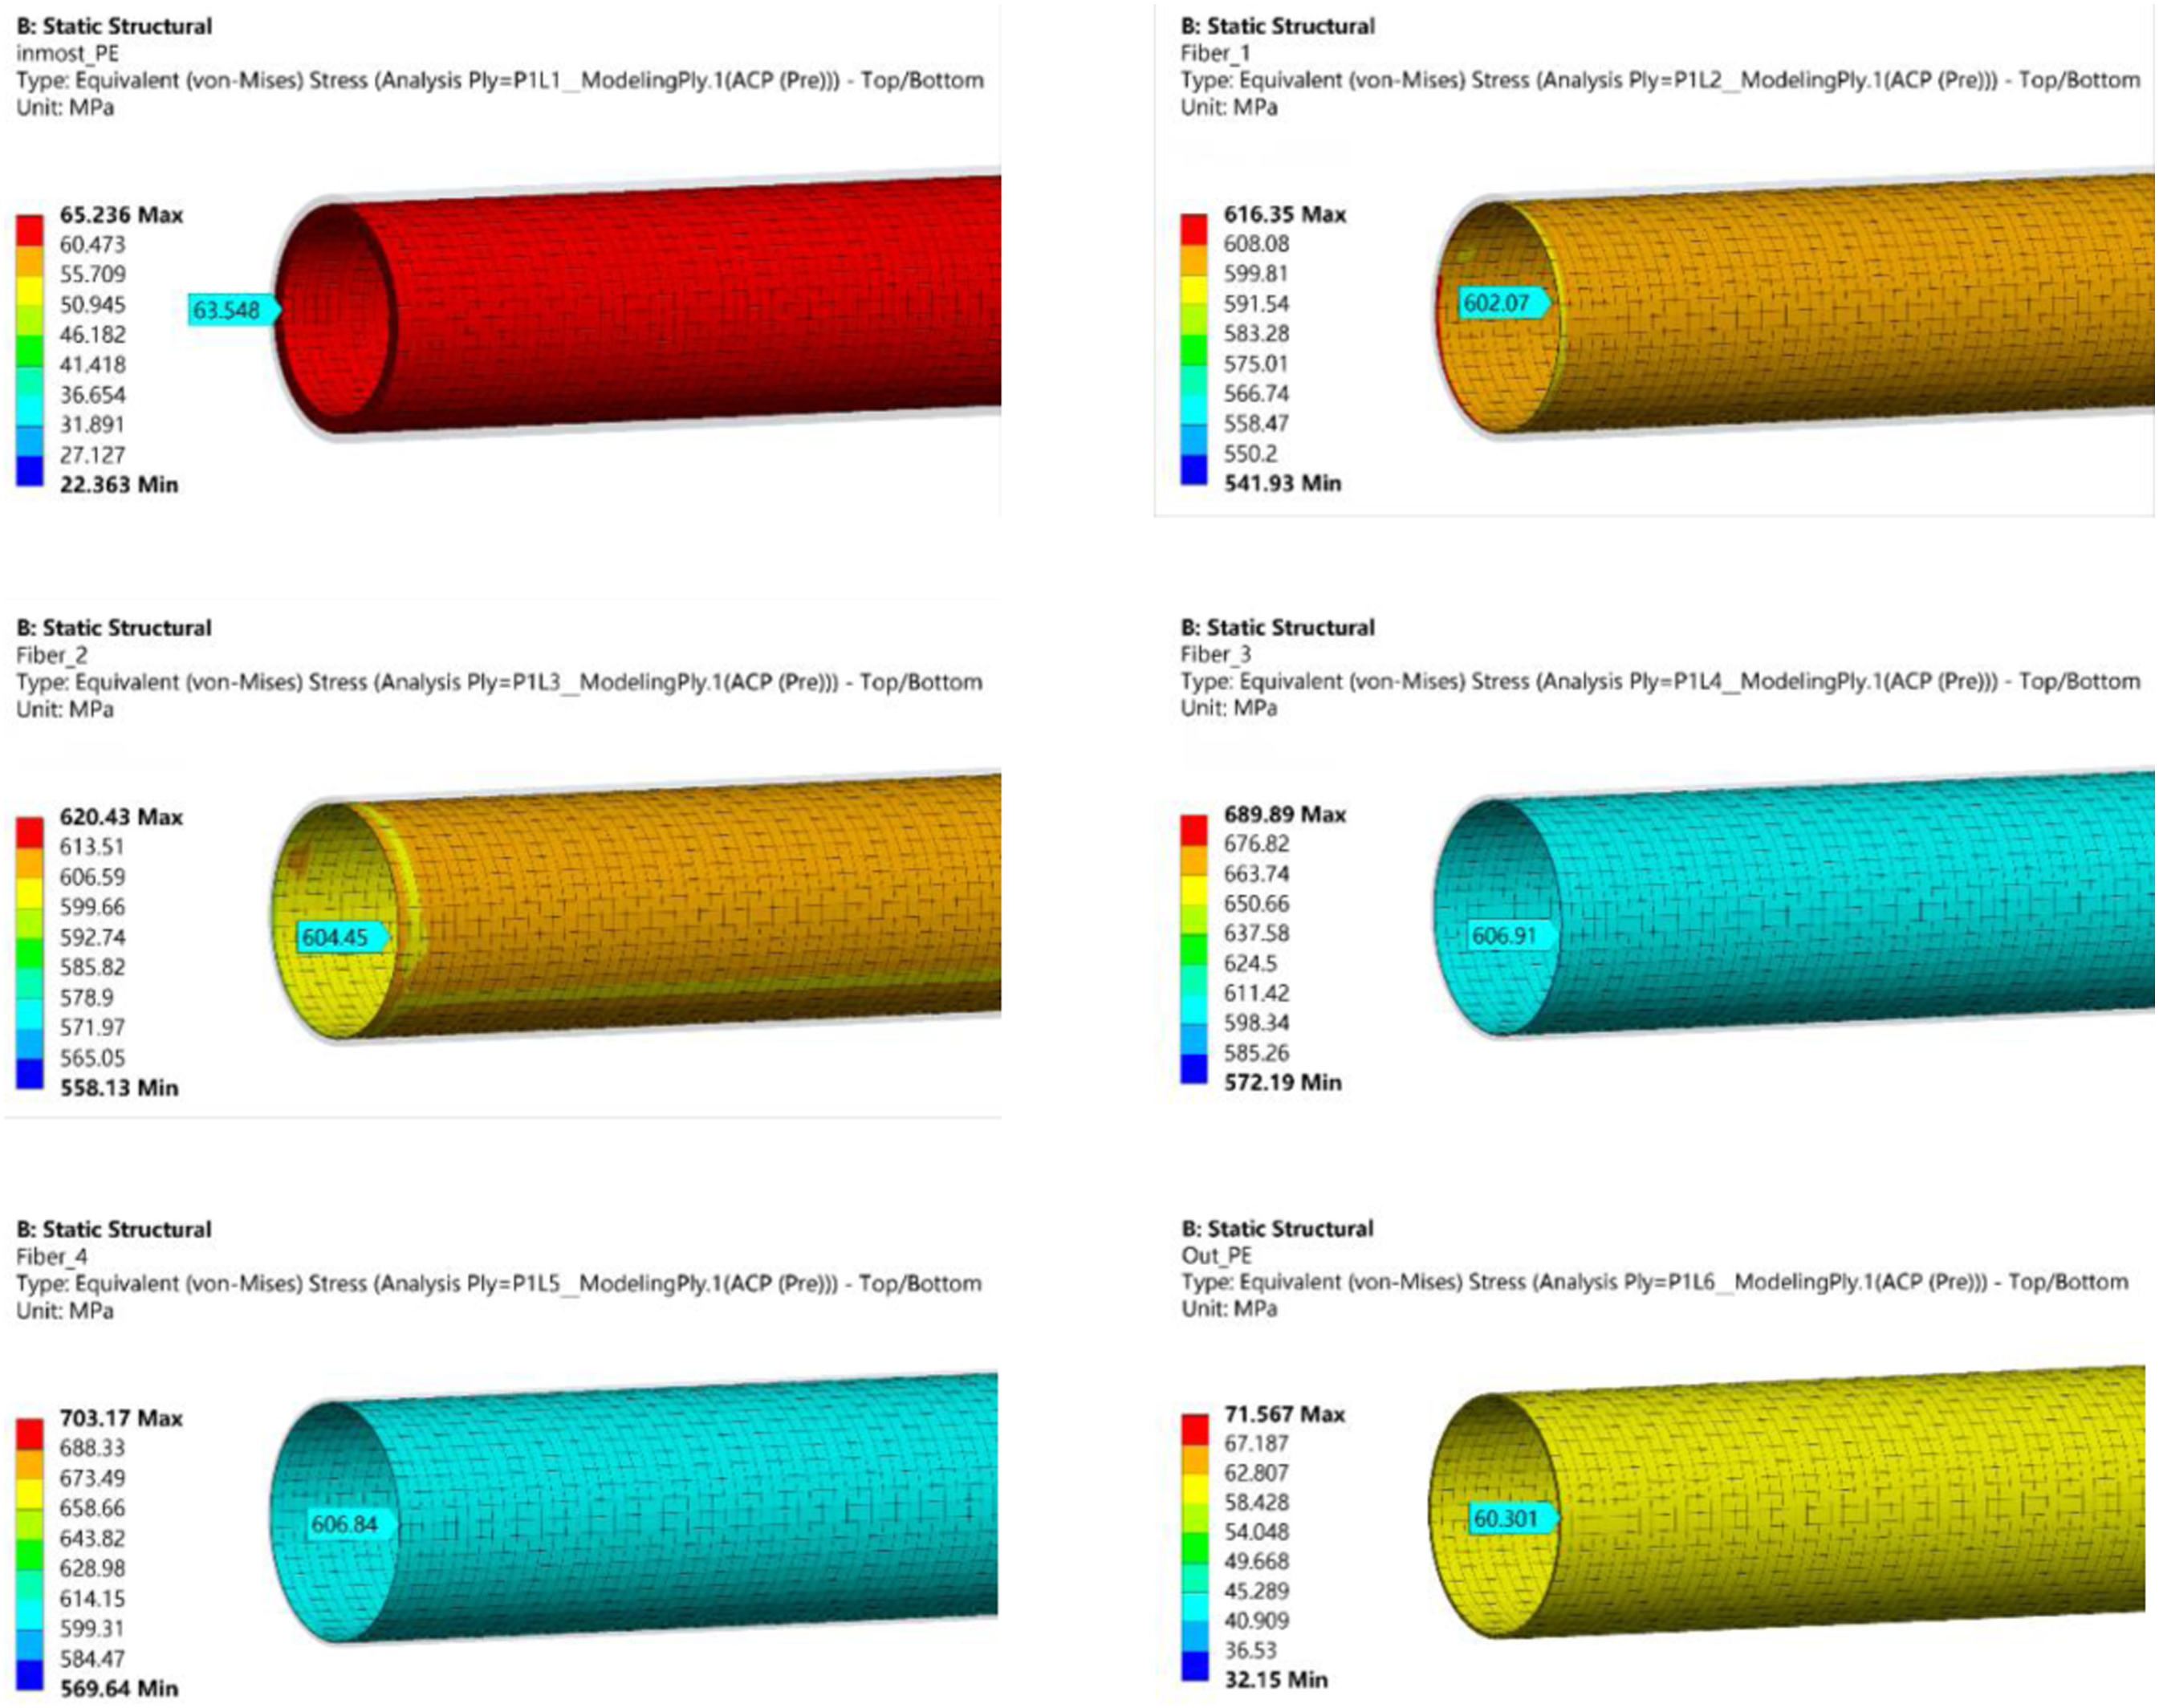
Bending analysis of GFRTP
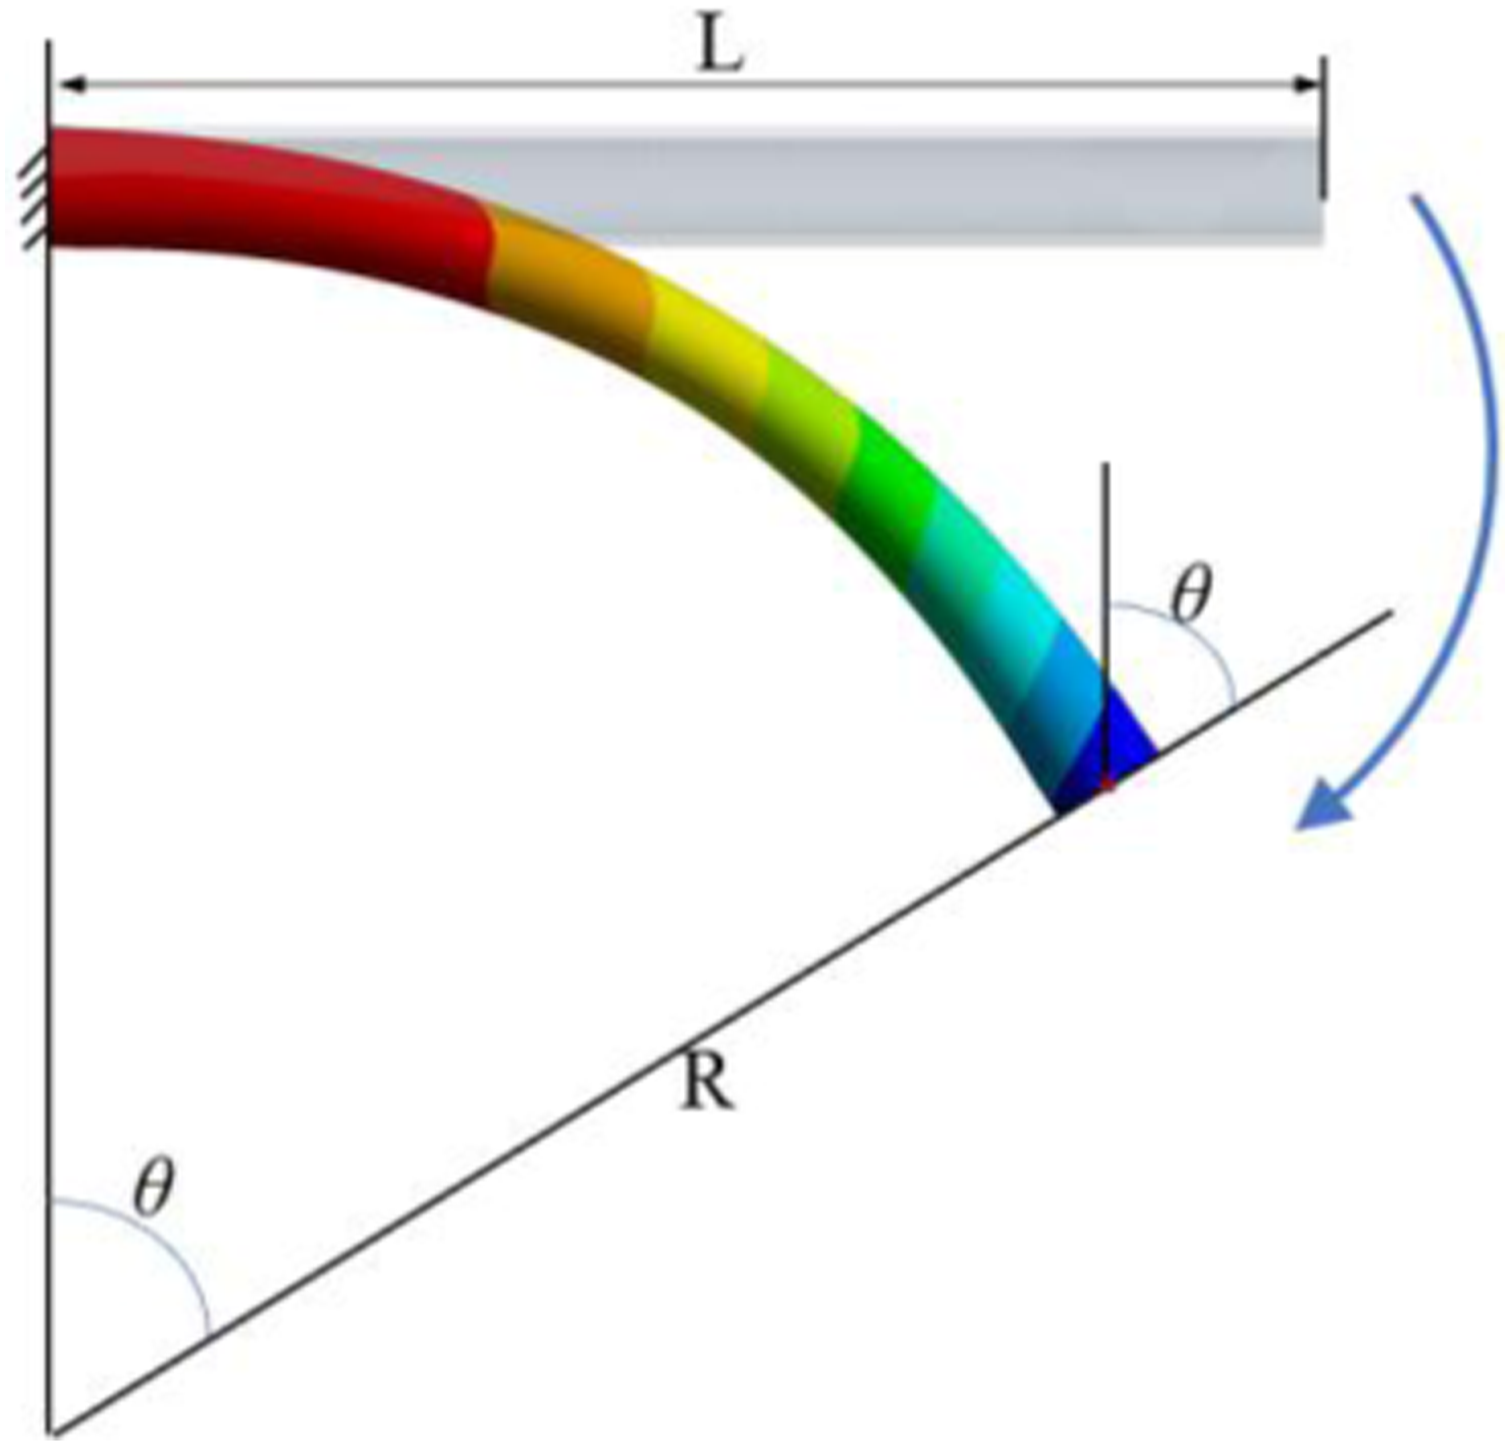
Smaller spooling radii may unavoidably be necessary for the storage and transportation of TCP designed to operate under the most extreme in-service conditions. To simulate the bending deformation of GFRTP, the right end part of the composite pipe is fixed, the left end part is free and exerted to rotate clockwise around the X-axis, and the rotation angle is uniformly increased from 0, with a unit step of 5°, and the nonlinear analysis is used to obtain the stress and deformation cloud diagrams of the pipeline under each loading step.
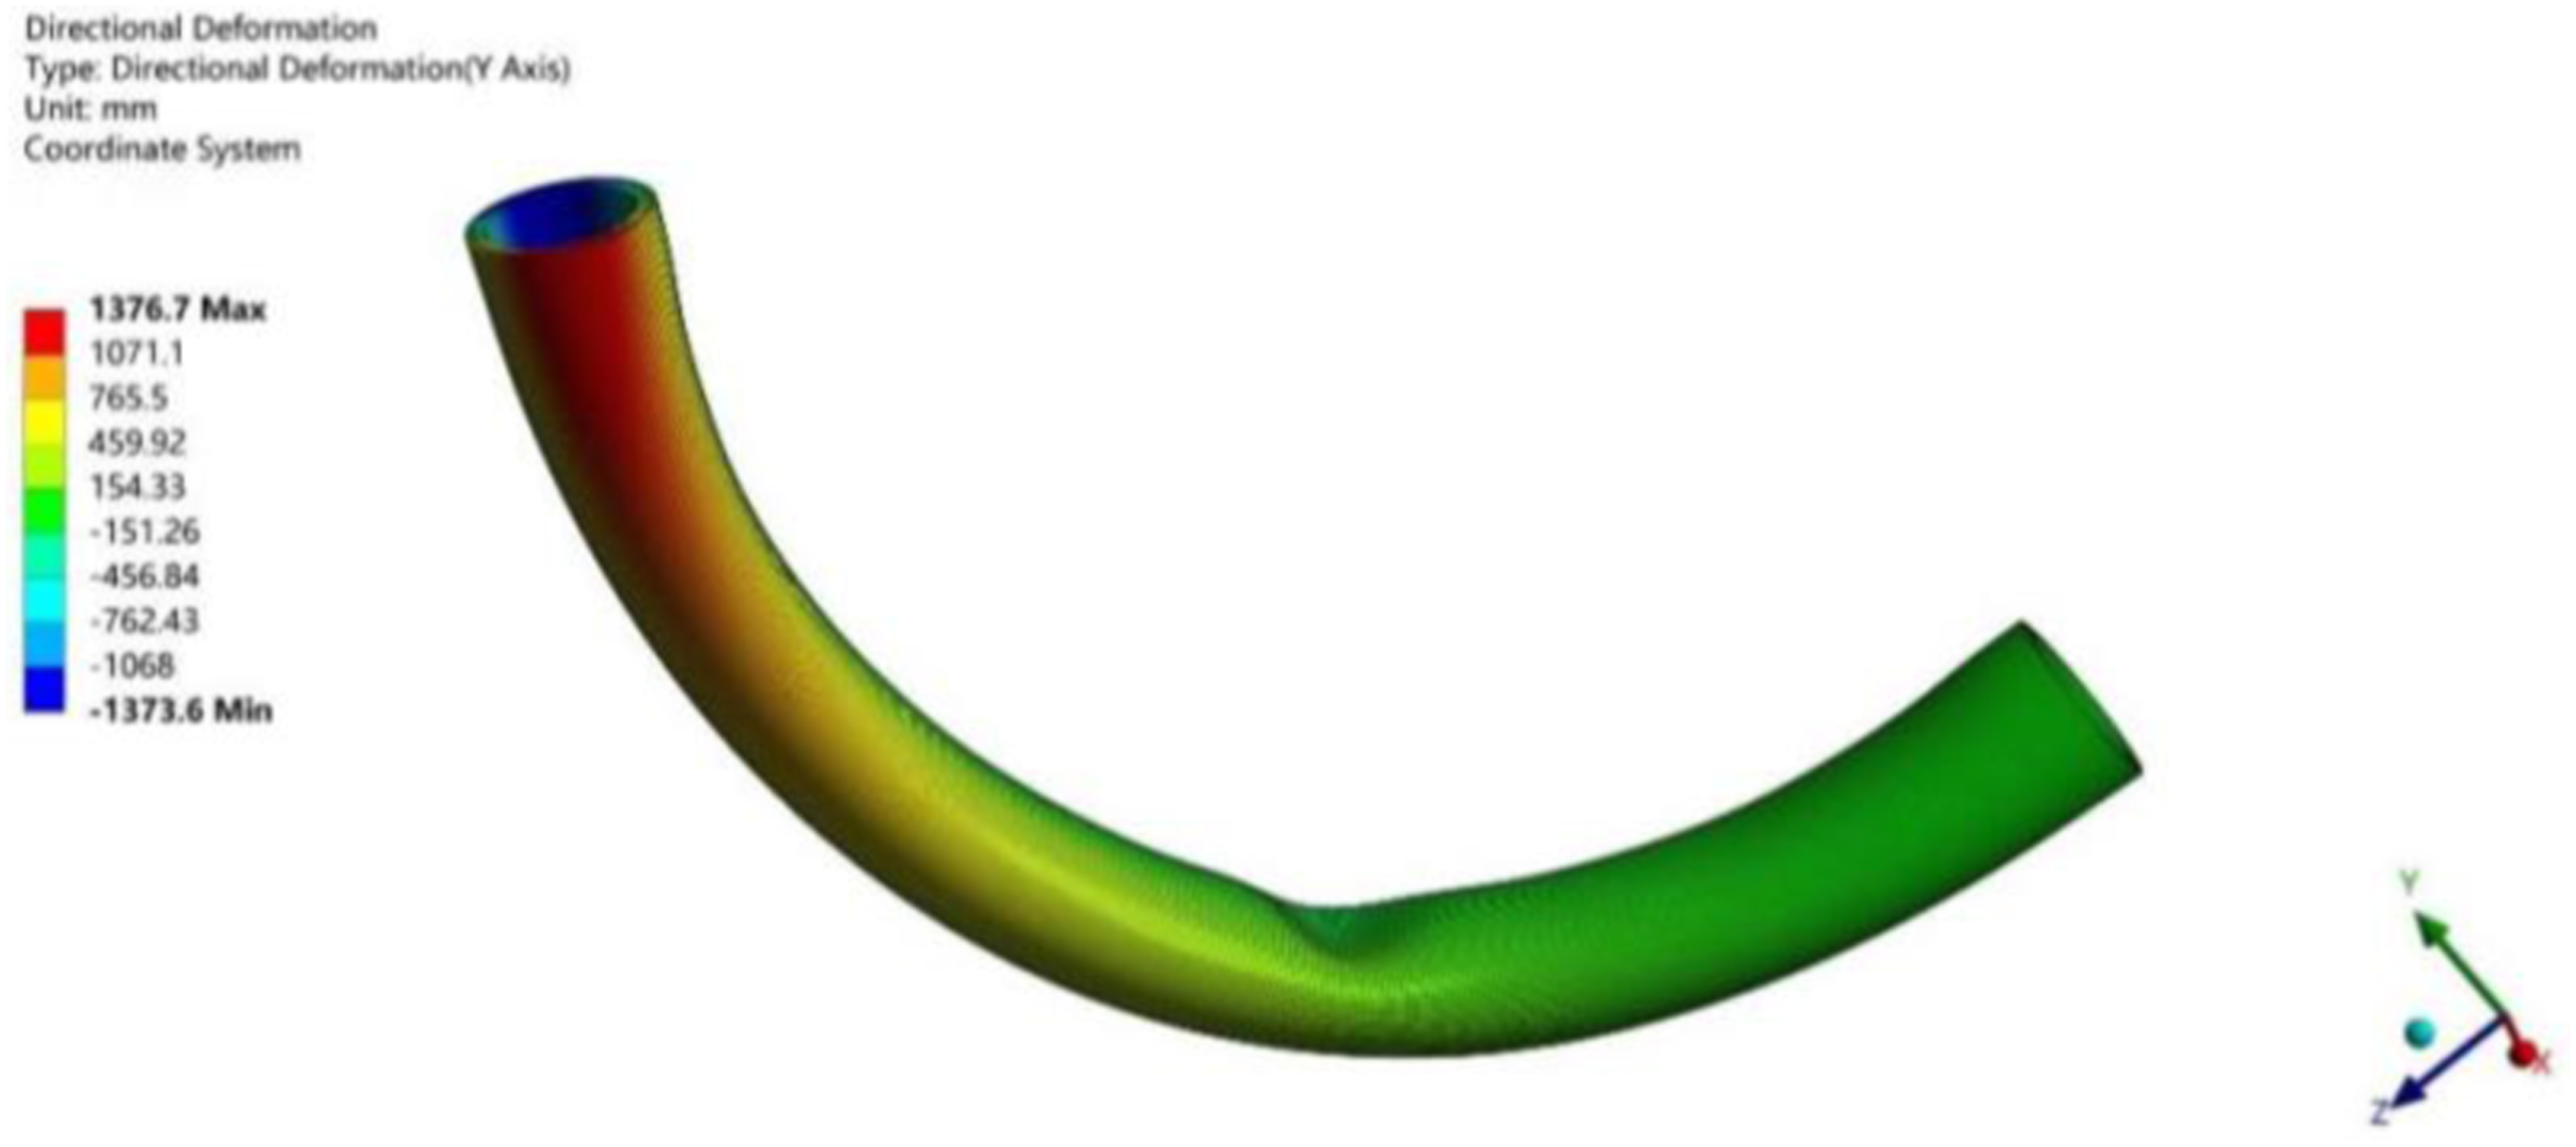
Composite pipe subjected to the larger external force or deformation under the elastic destabilization or the pipe itself defects induced local buckling of the pipe will lead to the loss of stability of the composite pipe. The bending loading analysis of composite pipe needs to determine the critical load or deformation at the time of instability. Figure 12 shows the deformation of GFRTP under bending load. It can be seen that an obvious depression occurs near the middle of the pipe, indicating that the pipeline structure has lost stability. Based on the deformation of the composite pipe under each load step, the load corresponding to the critical instability can be determined (the maximum load without local depression deformation), and the corresponding geometric parameters of the composite pipe, which can be calculated from Figure 13 to obtain the bending radius of 978.9 mm. Figure 14 shows the stress distribution for GFRTP in the critical bending load. It can be seen that the innermost layer of the fiber stress and the outermost layer of the fiber maximum stress are respectively 762.6 MPa and 969.7 MPa. The stress of the outer reinforcing layer is greater than the inner reinforcing layer. Meanwhile, the value of the reinforcing layer stress is much greater than the inner and outer plastic layers. However, the outermost fiber layer’s local stress has been more than the fiber breaking strength of 780 MPa, though the innermost fiber layer has not yet reached the breaking strength. It is observed that the maximum stress of the outermost fiber layer occurs in the vicinity of the remote point. The remote point is applied by the forced displacement constraints, leading to simulated stress concentration, which is not true in practice. So the stress of the outermost fiber layer for bending GFRTP can be as a reference to determine the failure. Stress response to axial tension displacement: (a) stress of the innermost reinforced layer; (b) stress difference between the first and fourth reinforced layer. Buckling of GRF-RTP subjected to bending load. Schematic diagram of the bending radius of the GFRTP.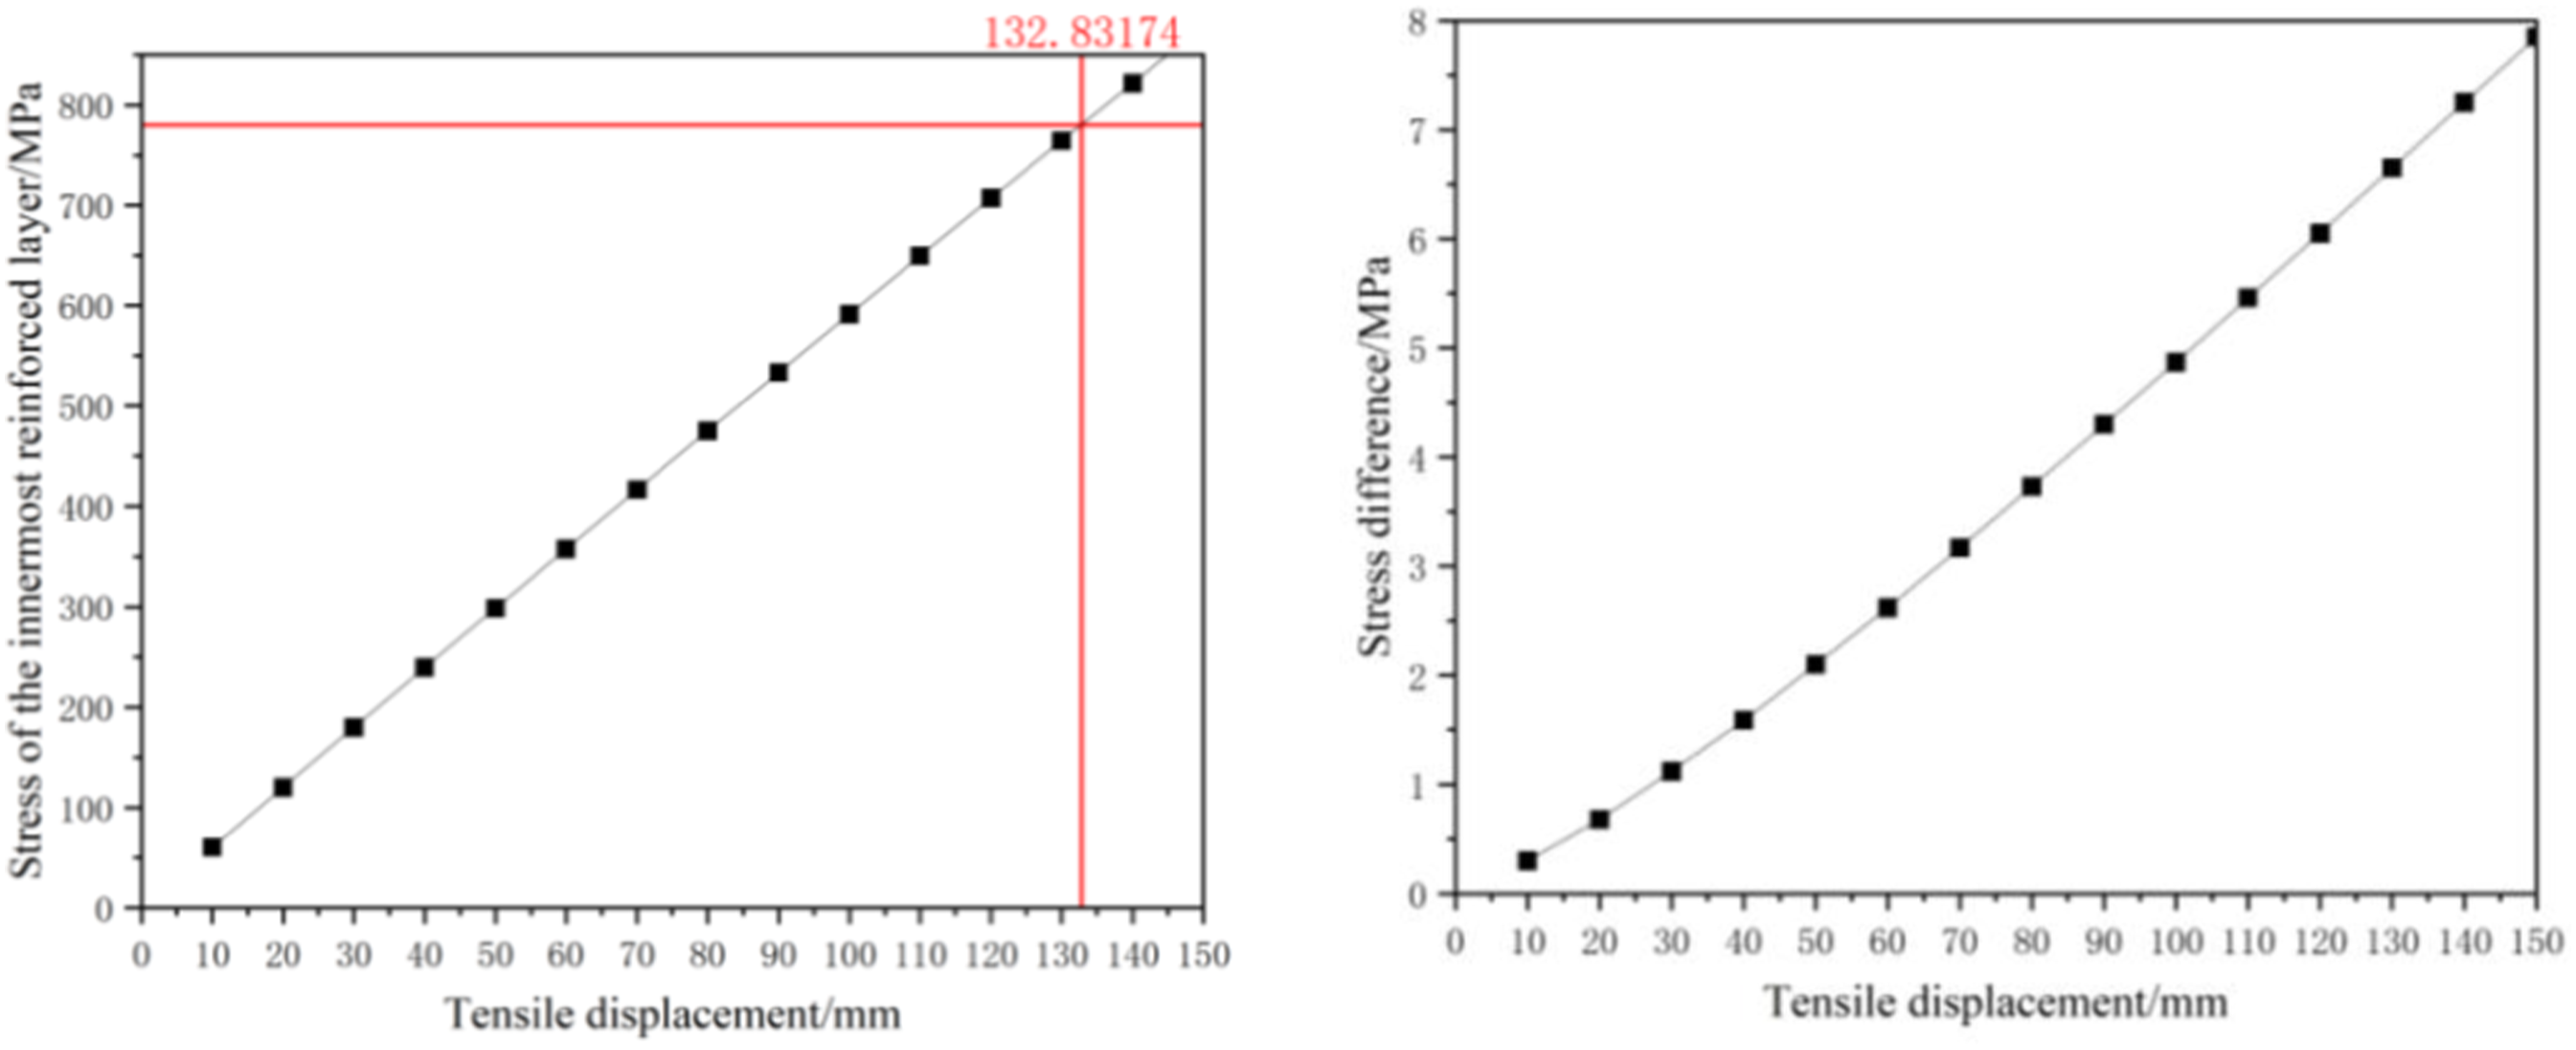
Torsional analysis of GFRTP
In the simulation of the torsional behavior of GFRTP, the right end of the composite tube is completely fixed, and counterclockwise torsion with the Z-axis as the center of rotation is applied at the remote endpoint of the left end, and the whole torsional load is loaded in 1° incremental steps.
During the torsion process of the GFRTP, the left end portion is more obviously twisted and deformed relative to the right end because its right end is completely fixed. Figure 15 shows the deformation cloud diagram of GFRTP when twisted by 40°. Figure 16 shows the stress distribution of each structural layer of the composite pipe corresponding to the torsional load (40°), similar to the results of the tensile load fiber layer stress, the fiber reinforcement layer stress in the torsion state from the inside to the outside gradually increased, the first to the fourth layer of the reinforcement layer stress were 410 MPa, 423.4 MPa, 419.1 MPa and 433.2 MPa, which did not reach the yield strength of the glass fiber material. The stresses of the liner layer and outer protective layer are 19.2 MPa and 22.1 MPa respectively, close to or slightly exceeding the yield strength of HDPE (21 MPa), and it can be considered that the material is in the elastic-plastic range, therefore, the glass fiber layer is the main load-bearing part of the pipe, and the composite pipe meets the performance requirements under this load. Stress distributions of each layer of the RTP subjected to bending load: (a) liner; (b) the first reinforced layer; (c) the second reinforced layer; (d) the third reinforced layer; (e) the fourth reinforced layer: (f) outer cover. Deformation of GFRTP subjected to torsion.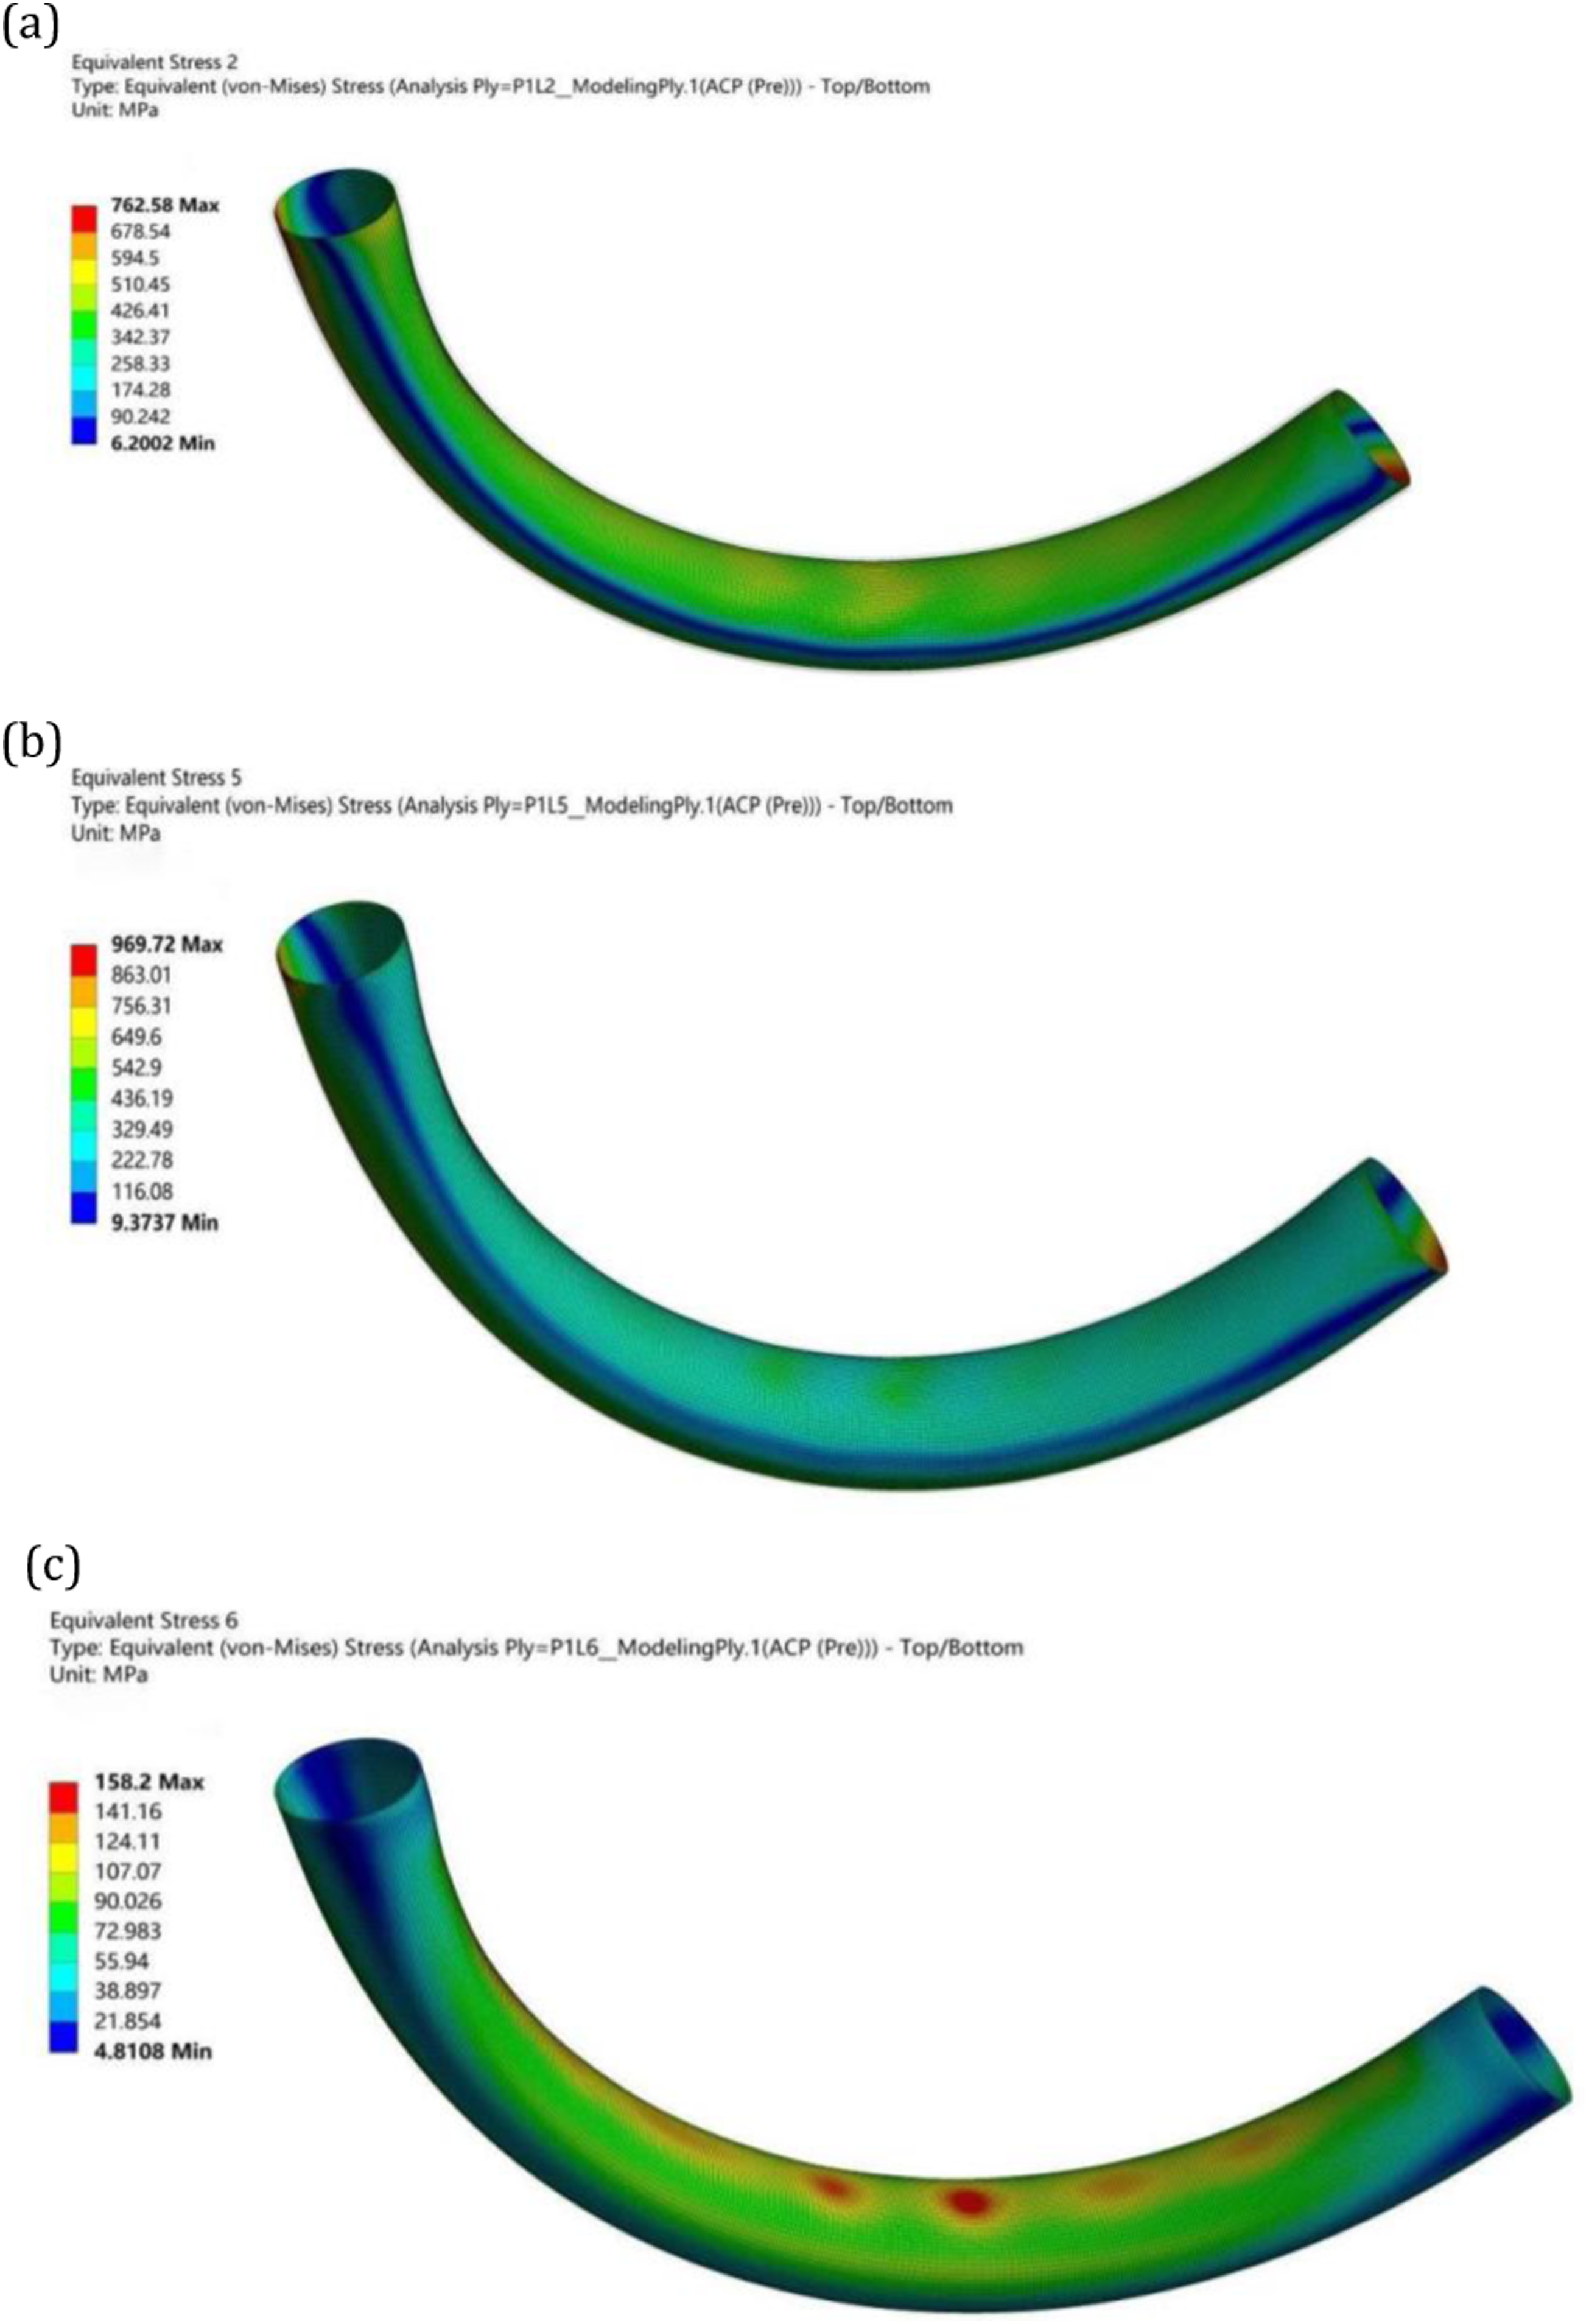
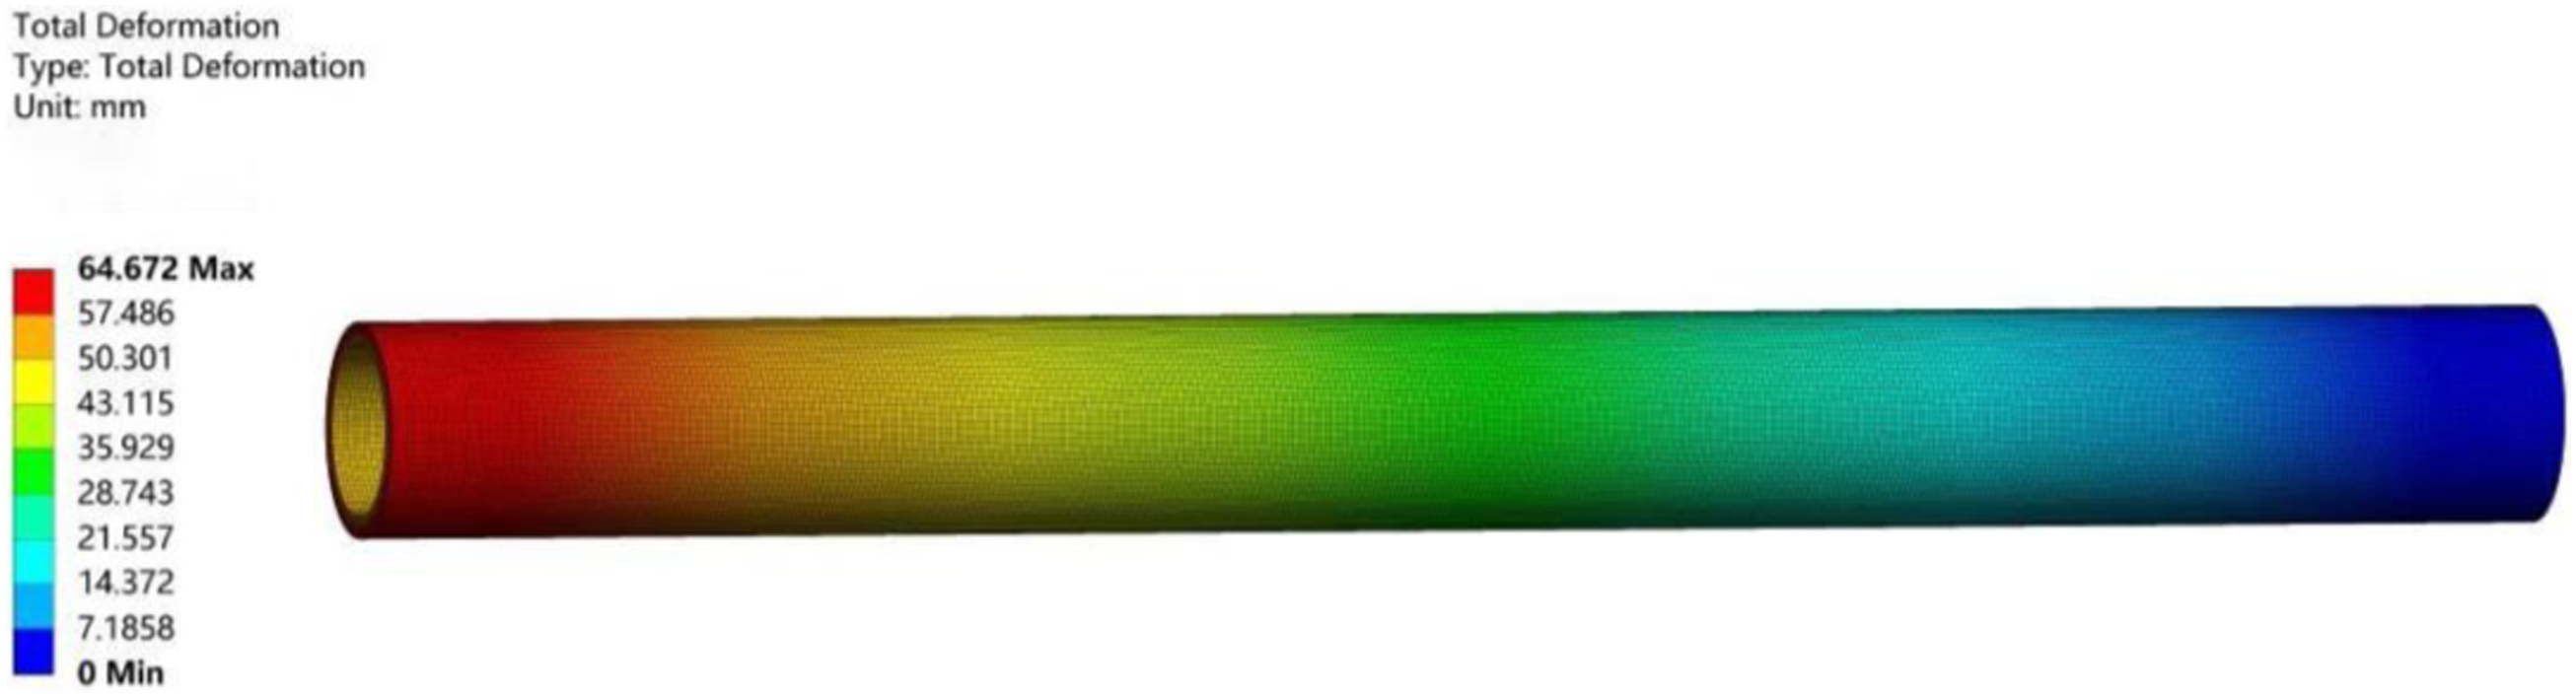
Figure 17 gives the stress of the outermost reinforcing layer with the torsion angle change curve, when the stress on the outermost glass fiber reaches its tensile strength of 780 MPa, the simulation calculates that the GFRTP torsion angle is 71.5°, which is the maximum torsion angle of the composite pipe. Stress distributions of each layer of the RTP at the inner pressure of 3.75 MPa: (a) liner; (b) the first reinforced layer; (c) the second reinforced layer; (d) the third reinforced layer; (e) the fourth reinforced layer: (f) outer cover.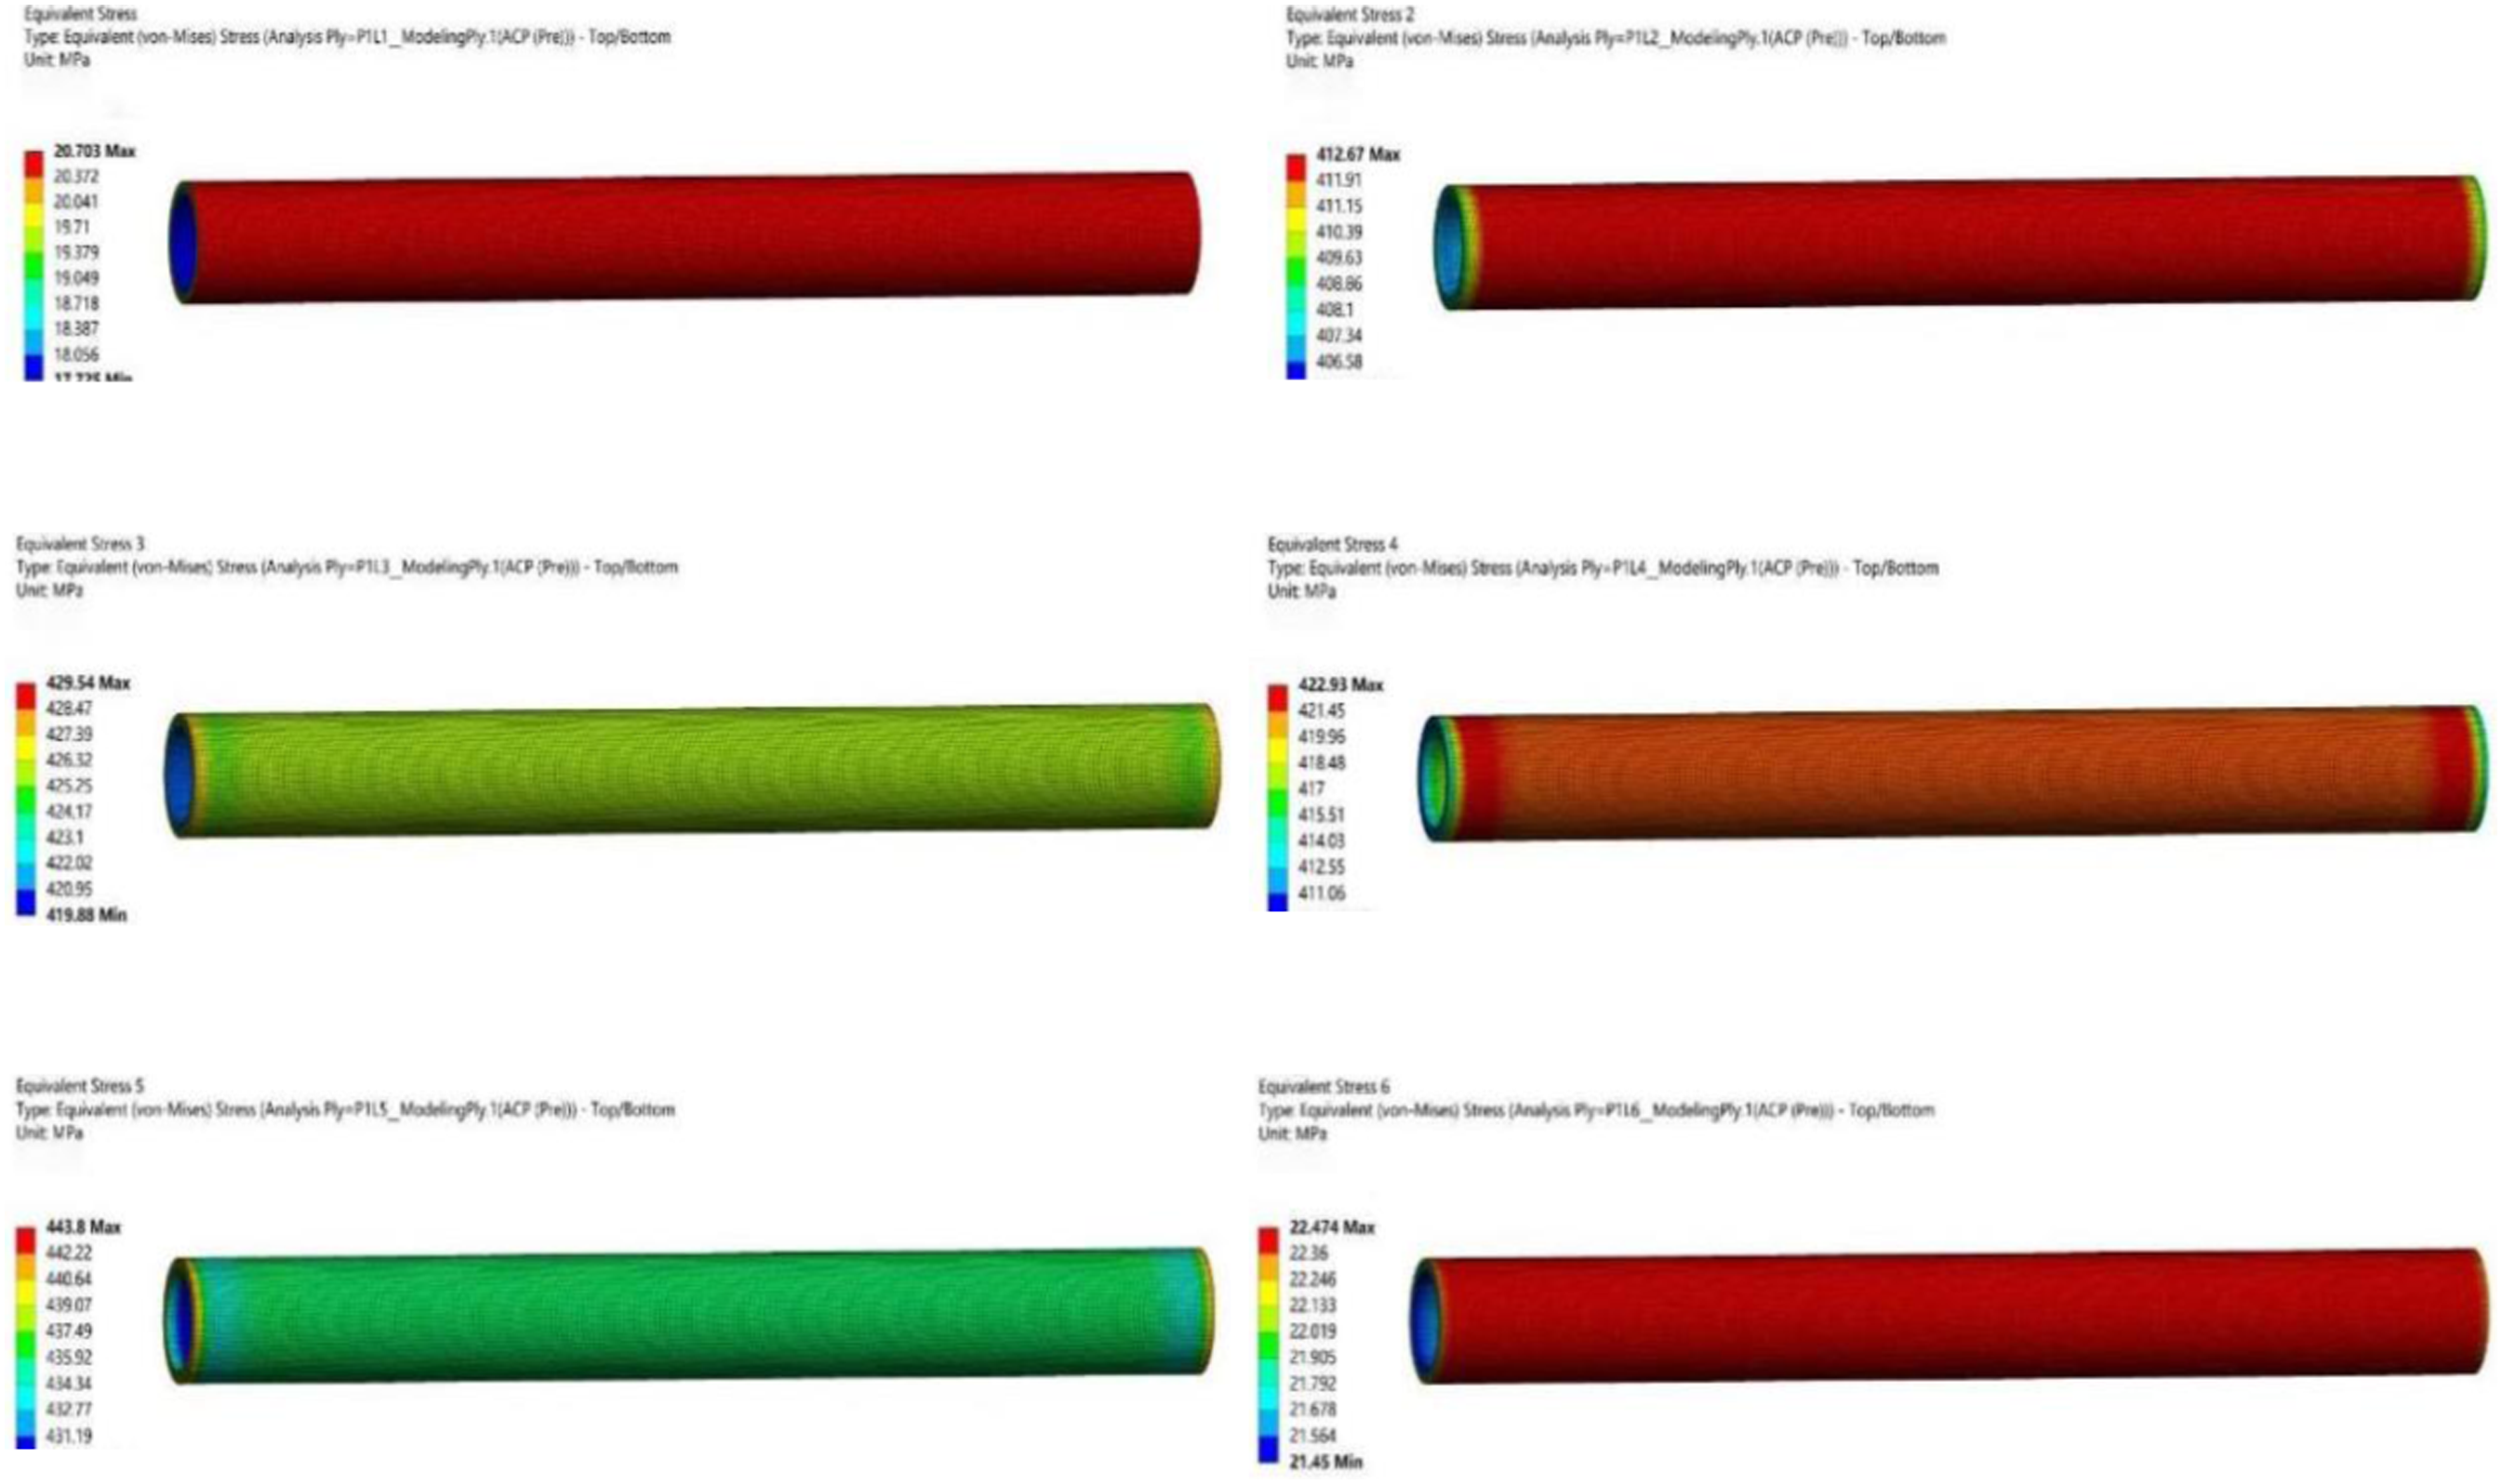
Experimental program
Multi-functional test bench (MFTB) design
According to the testing requirements, a multifunctional test bench was designed to determine the tensile, flexural, and torsional properties of GFRTP. The test bench mainly consists of a base, slide, slider, fixture, and other components as shown in Figure 18. The left and right ends can slide freely to fit the length of GFRTP. Different test functions are realized by some detachable parts and parts reorganization techniques. Figure 19 is a multifunctional lab. bench site shot. Multifunctional test bench (MFTB) for RTP. Multifunctional test bench (MFTB).
Tensile test
First fix the right end of MFTB, set the fixed end as the right end, and the left end slider pulls the RTP tube to slide to the left to complete the tensile test. As shown in Figure 20. The test was carried out by an servo machine with 6 mm/min speed, and repeated three times and the results were averaged as final value. Principle of the tension test using MFTB.
Torsion test
The left end of MFTB is fixed and the right end is converted from a fixed connection to a rotating vice connection to realize the torsion test. As shown in Figure 21. The rotating end was applied a torque from a motor with a reducer. The test was also repeated three times to find the average value. Principle of the torsion test using MFTB.
Bending test
Both end connections are converted to rotating vice connections to realize the bending test. This is shown in Figure 22. In order to ensure pure bending conditions, both end of MFTB were applied given torques, which was realized by a motor with gear reducer. The test was also repeated three times to calculate the average value. Principle of the bending test using MFTB.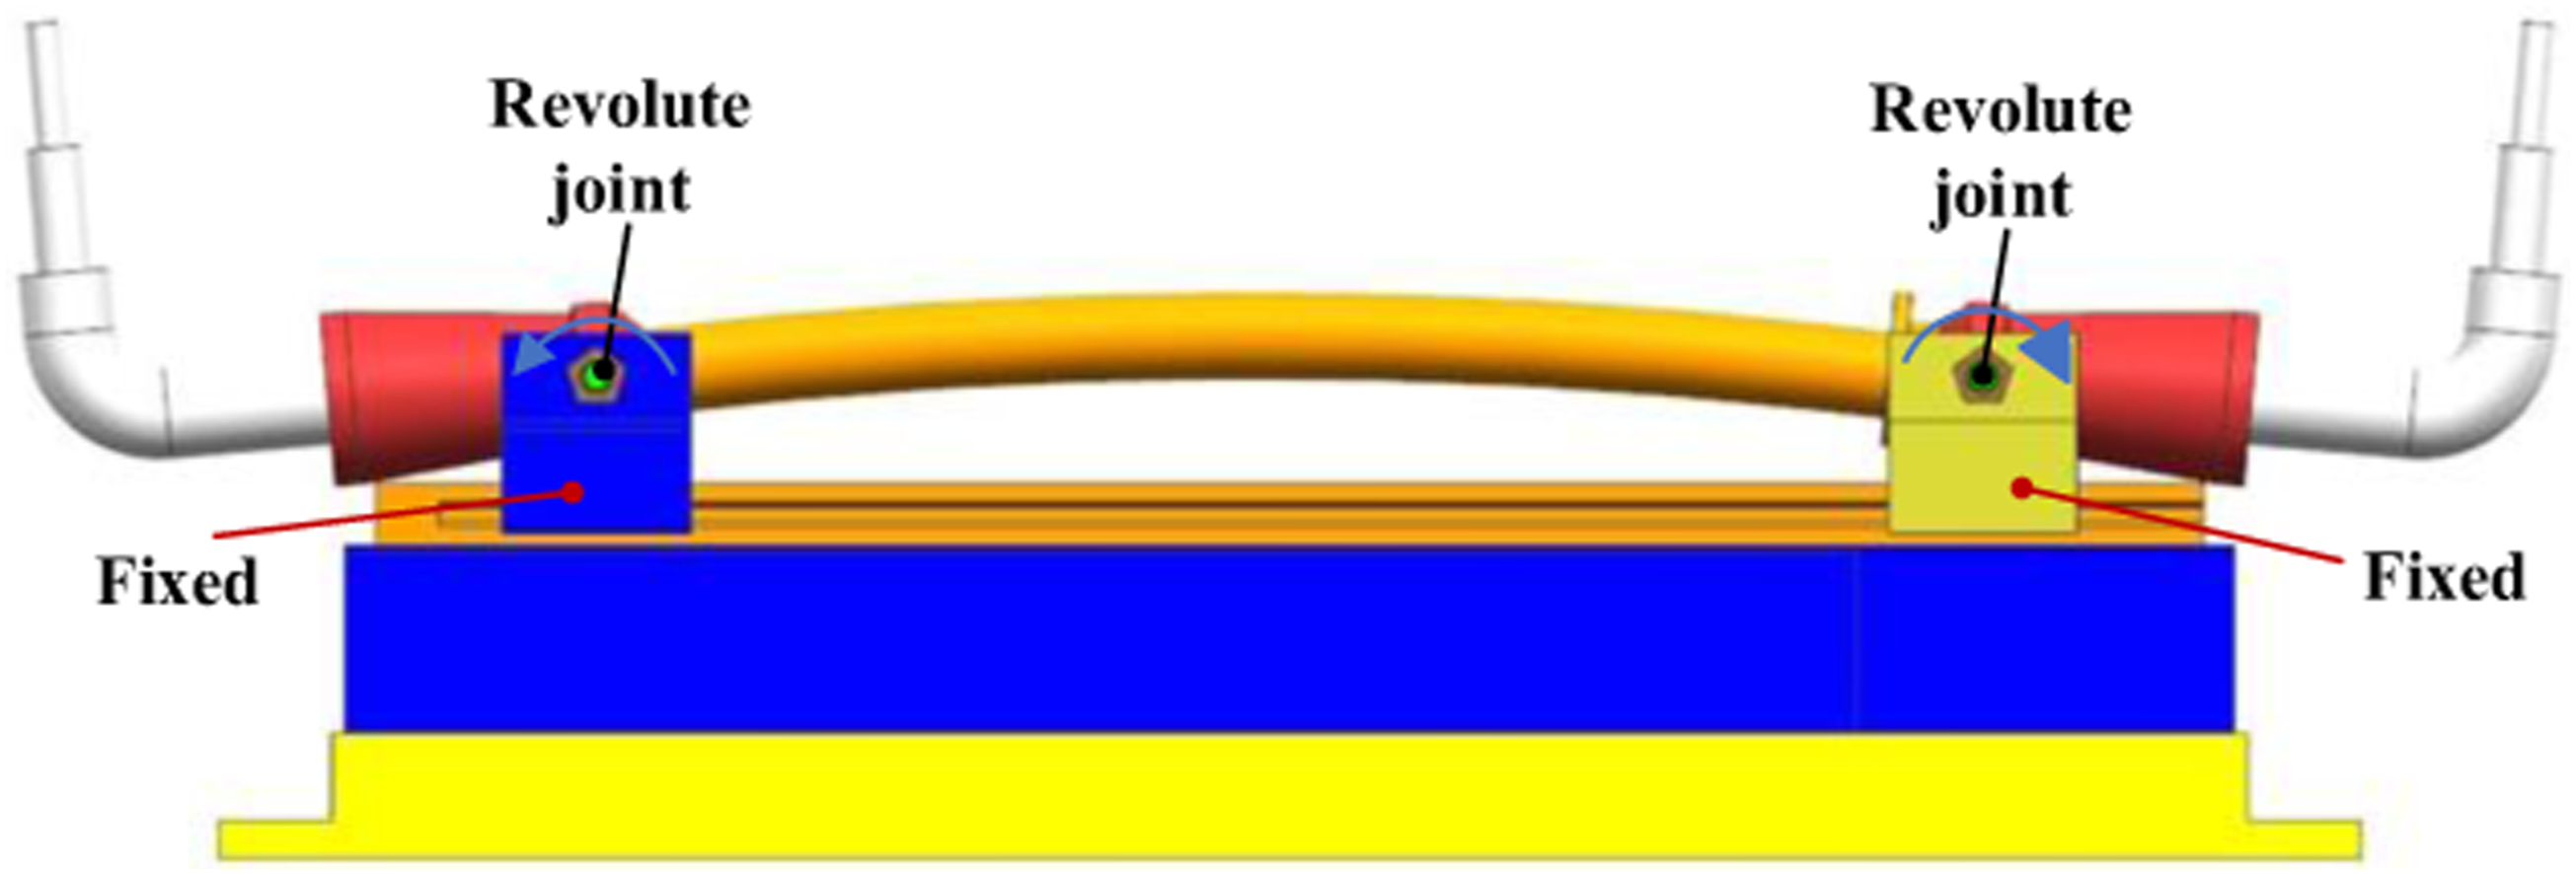
Test results
The load-strain curves derived from tensile experiments and FE simulations are given in Figure 23, and it can be seen that the two sets of curves have the same trend. The maximum error between the simulation results and the experimental results is within 10% at the same strain. Considering the simplifications made in the finite element modeling process, the simulation results can be considered reasonable and reliable. In engineering practice, when the tensile strain of GFRTP exceeds a certain value, it is considered to fail. According to Bai et al.,
27
the strain of the HDPE layer of metal strip reinforced flexible pipe (MSFP) should not exceed 7.7%. As can be seen in Figure 23, the tensile process of GFRTP consists of a linear elastic phase and a plastic elongation phase, and the critical strain is the turning point of these two phases. The strain values determined from the simulation and experimental results are 6.64% and 6.84%, respectively. These two critical strains are very close to each other and do not exceed the permissible strain of the HDPE layer, which on the one hand indicates the reasonableness of taking the fracture of the reinforcing layer as the basis of pipe failure, and also further verifies the accuracy and reliability of the finite element model in this paper. Load-strain curves obtained from the experiment and FEM for tensile load (left).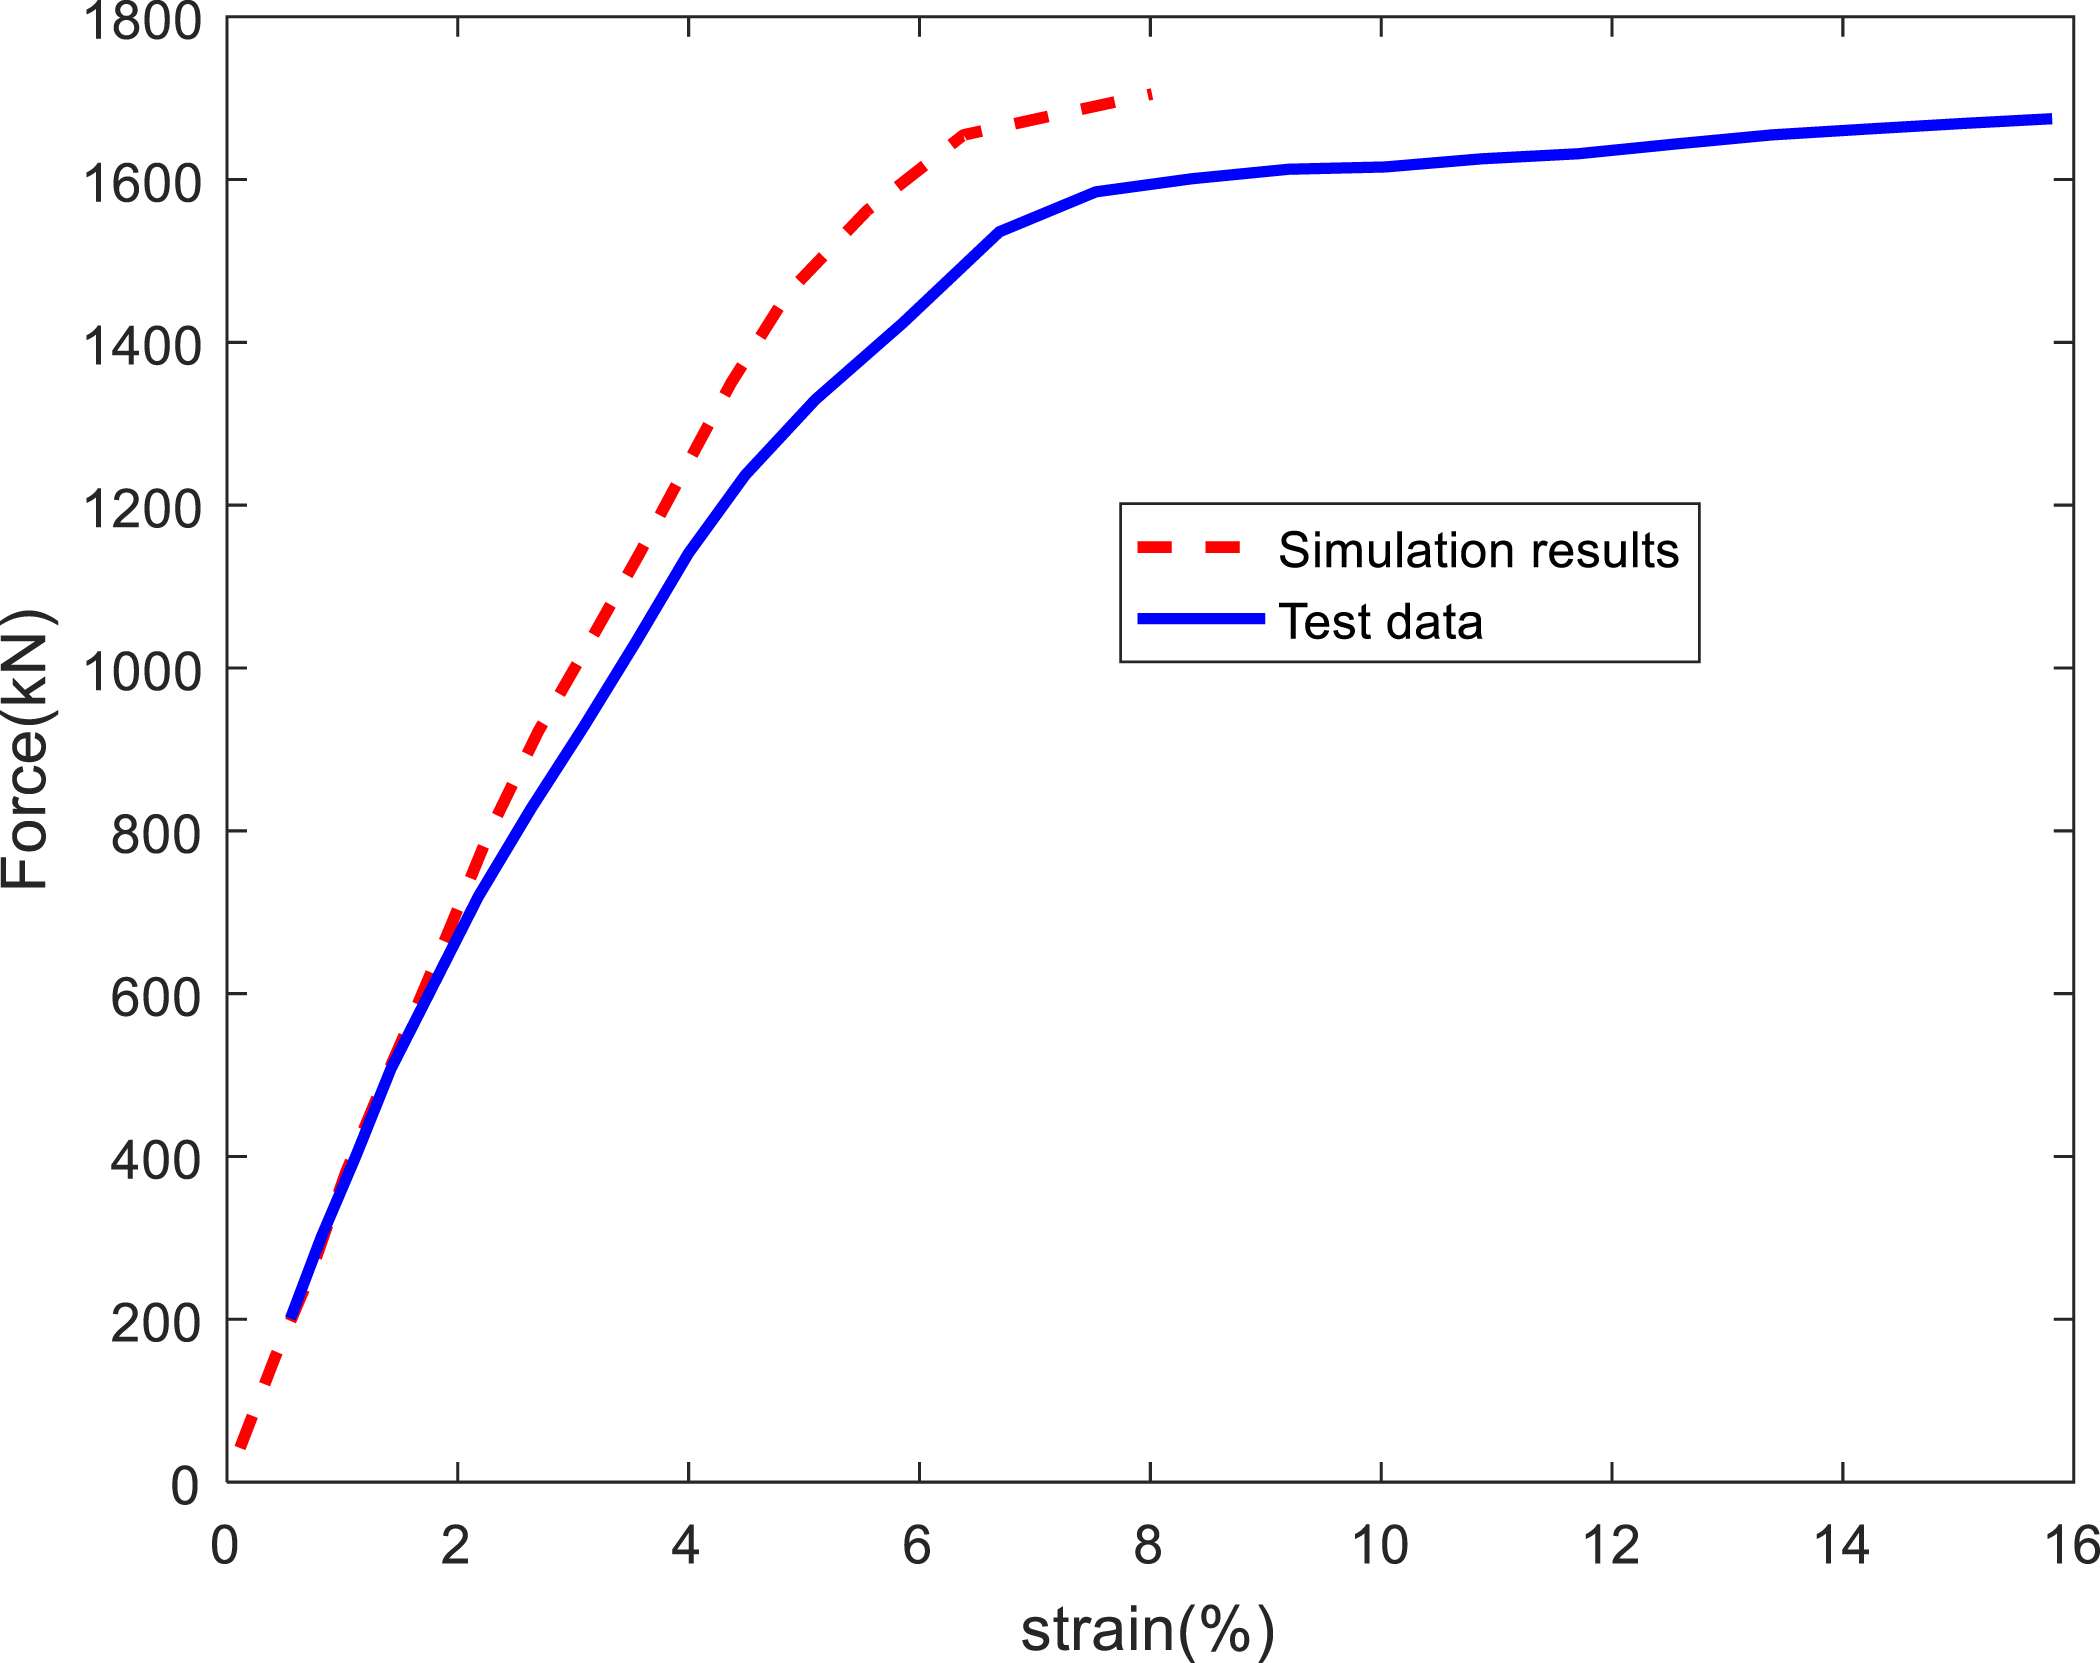
The initial bending radius of 2000 mm was tested at decreasing intervals of 100 mm, and the outer surface of the tube body of GFRTP was observed visually. When the bending radius of the GFRTP was reduced to 1100 mm, obvious morphological changes occurred. When the GFRTP continued to bend to a radius of 1000 mm, obvious buckling occurred, which was very similar to the simulation results shown in Figure 12. Based on the experimental results, it can be concluded that irreversible buckling damage occurs when the bending radius is less than 1000 mm. Therefore, the minimum bending radius of GFRTP is 1000 mm, which is consistent with the simulated value of 978.9 mm.
In the torsion test of GFRTP, the angular displacement loading speed is 10°/min, and the torque-torsion angle curve is shown in Figure 24. In the initial stage, the torque increases linearly with the increase of the torsion angle; beyond a certain critical value, the torque curve suddenly decreases, and its corresponding torsion angle is the ultimate torsion angle. The simulated curves have a consistent trend with the test results. The simulated ultimate torsion angle of GFRTP is 71.5°, which is close to the experimental result of 68.9°. Torque–torsion angle response for the RTP (right).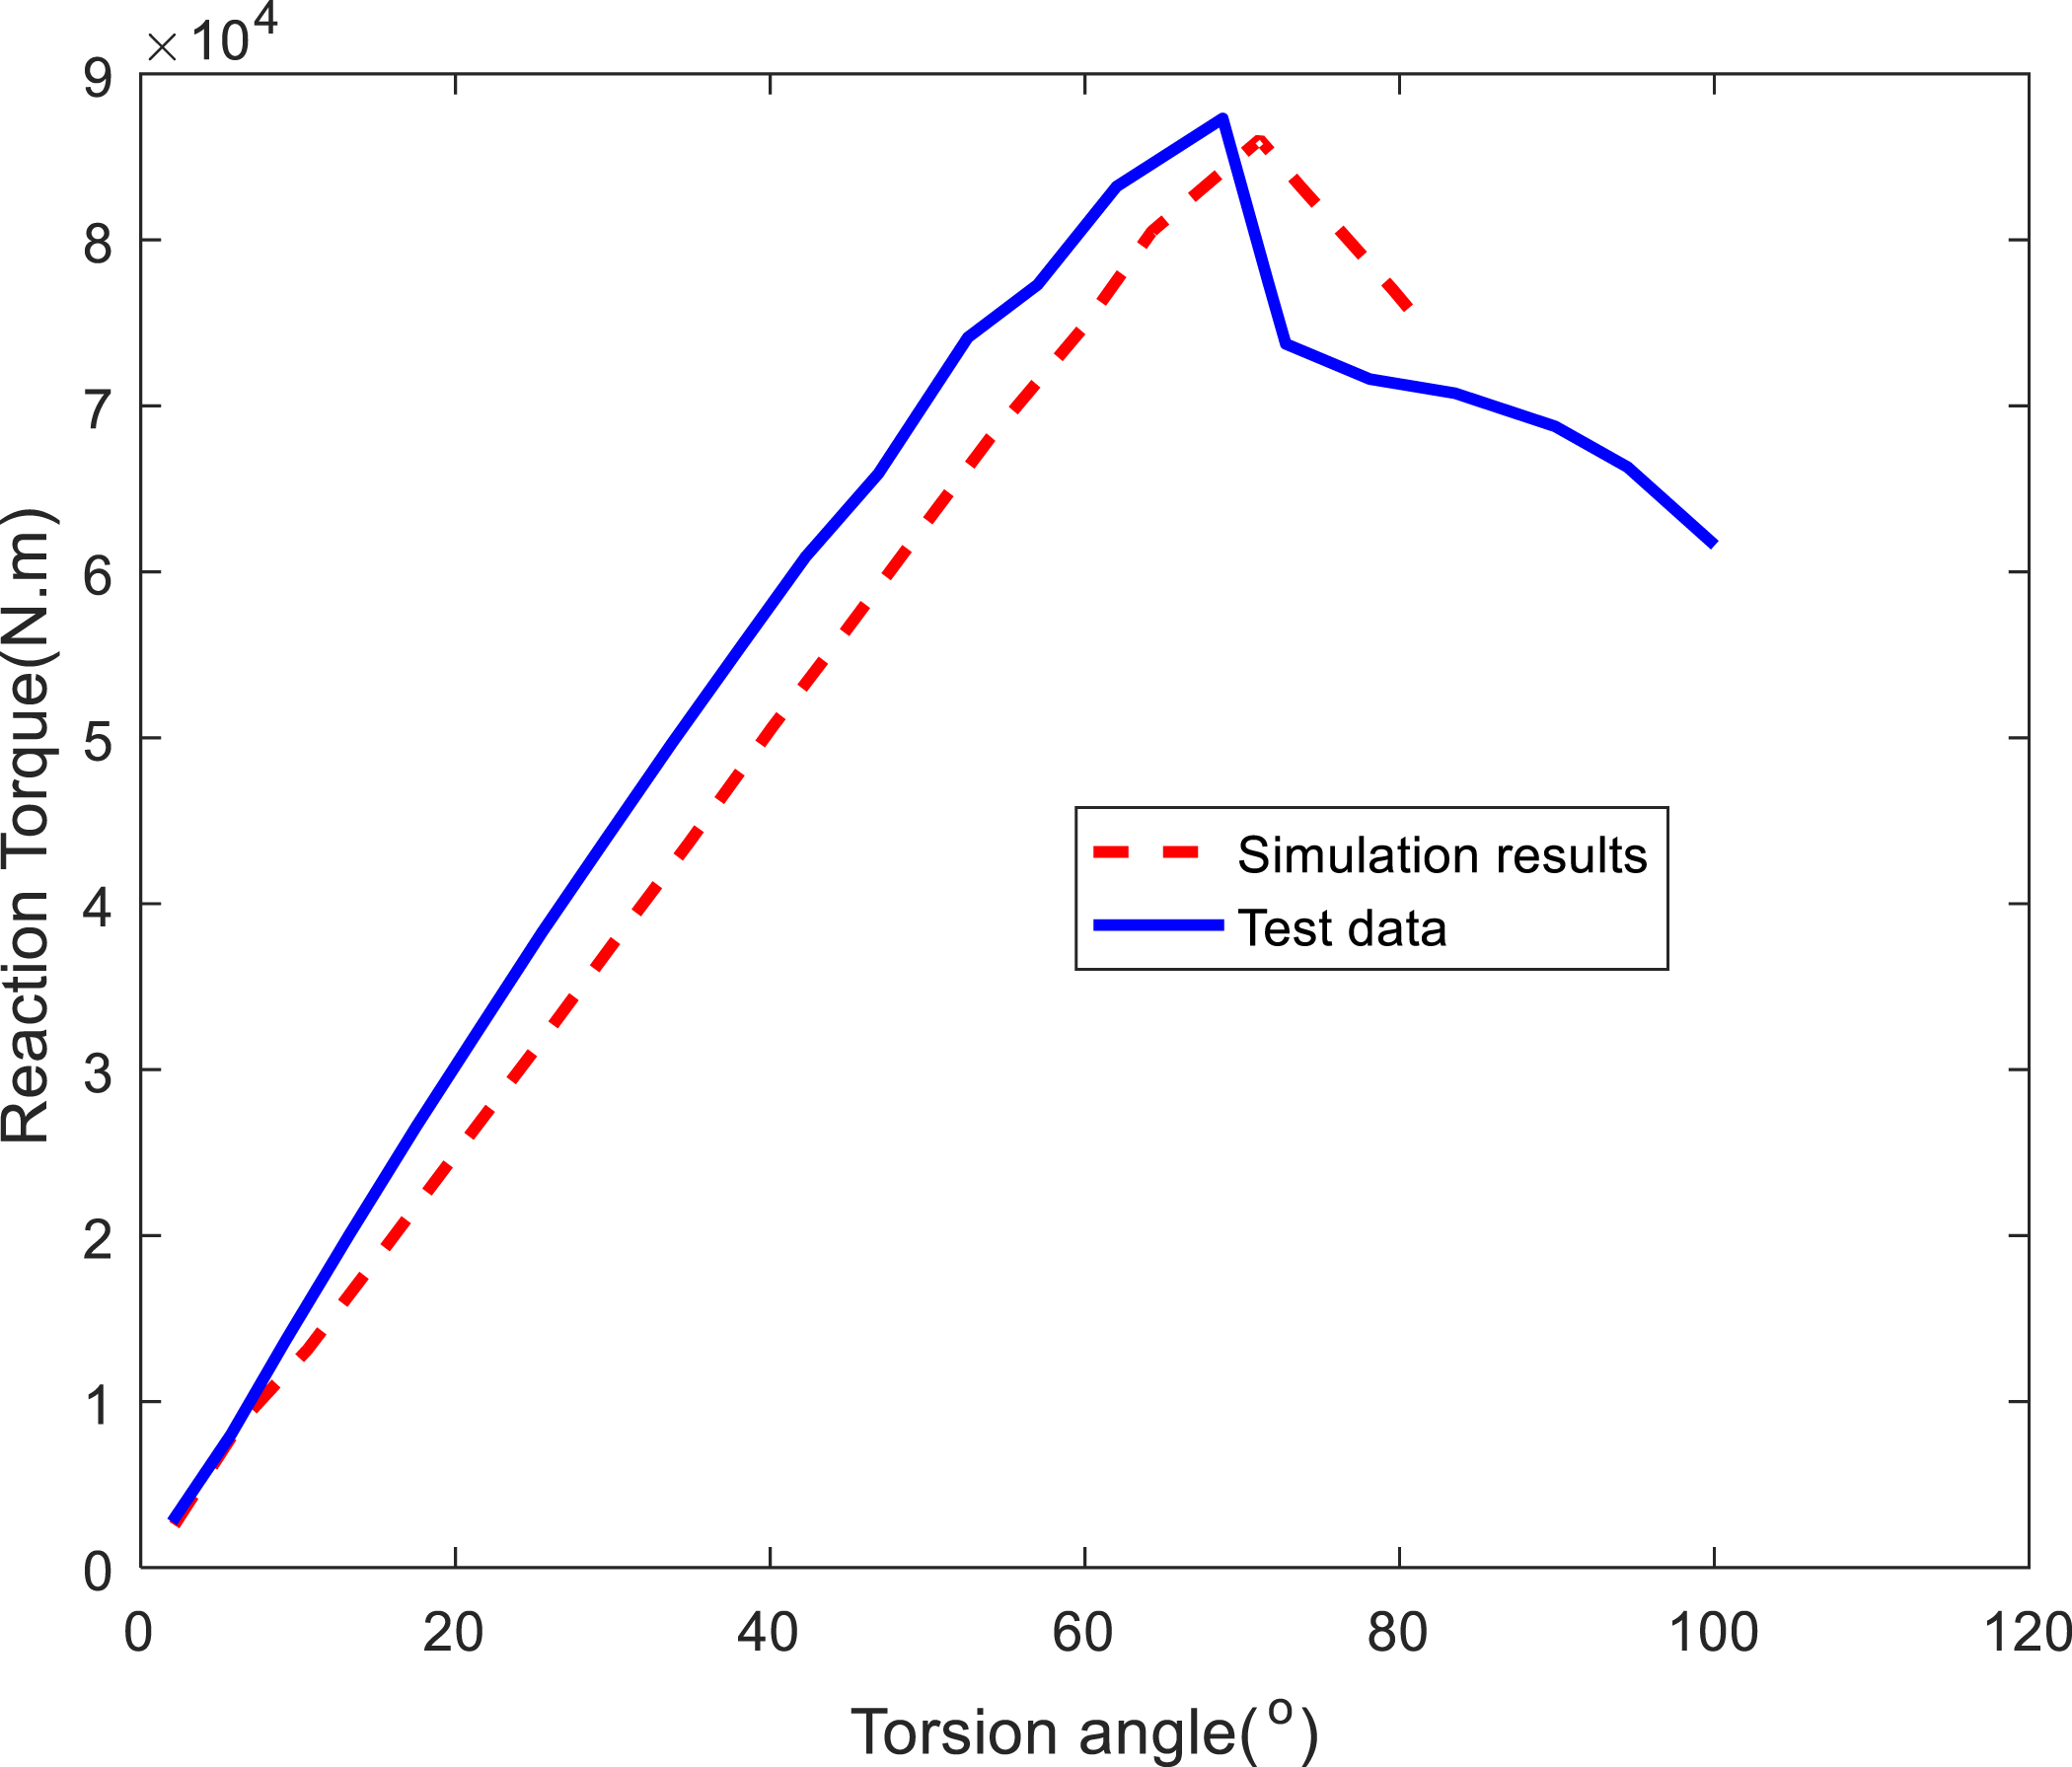
Conclusion
In this paper, a finite element model GFRTP (DN150 PN6.4 MPa) subjected to internal pressure, axial tensile, bending, and torsional loads is developed and experimentally verified. The finite element simulation quickly and accurately determined the extreme working performance of GFRTP under different service-in loads.
The burst pressure of GFRTP obtained by simulation is 61.7 MPa, which is the same as that of the test of 57.5 MPa. The ultimate axial tensile displacement of GFRTP with a length of 2000 mm is determined by the simulation to be 132.8 mm, and the corresponding critical strain is 6.64%. The critical strain obtained from the tensile test was 6.84%, indicating that the finite element model used in this study is accurate and reliable. Based on the bending test results, the minimum bending radius of GFRTP is considered to be 1000 mm, which is consistent with the simulated value of 978.9 mm. The critical torsion angle of GFRTP is 71.5° obtained from the simulation.
Based on the research and analysis of this paper, it can be concluded that finite element model simulation is a reliable method to analyze the mechanical behavior of RTP, which can be used to guide field construction operation and failure prevention. In actual engineering, RTP is often subjected to complex loads such as internal pressure-tension, internal pressure-bending-tension-torsion, bending-torsion, etc. The ultimate working performance of RTP under complex working conditions will change, which requires further systematic research.
Footnotes
Author’s note
I would like to declare on behalf of my co-authors that the work described was original research that has not been published previously, and not under consideration for publication elsewhere, in whole or in part. All the authors listed have approved the manuscript that is enclosed.
Author contributions
Declaration of conflicting interests
The author(s) declared no potential conflicts of interest with respect to the research, authorship, and/or publication of this article.
Funding
The author(s) disclosed receipt of the following financial support for the research, authorship, and/or publication of this article: This research is funded by National Natural Science Foundation of China (NSFC) under grant number 52275508, the Xi’an Science and Technology Bureau, universities and institutes of science and technology personnel service enterprise project under grant number 22GXFW0051 and Xi’an Science and technology plan under grant number 22NYYF063, Xi’an Beilin District 2022 science and technology plan under grant number GX2218 and the Key project of Shaanxi provincial department of education under grant number 2018JS043.
Data availability statement
The data used to support the findings of this study are available from the corresponding author upon request.