
Abstract
The final product of additive manufacturing (AM) or 3D printing critically depends on the surface quality. An experimental study on the 3D printed intake manifold flange using acrylonitrile butadiene styrene (ABS) material was executed by varying the four process parameters. A fused deposition modeling (FDM) based 3D printer was used to fabricate the flanges. The association between the parameters and the surface roughness of printed ABS flanges was investigated. A feed forward neural network (FFNN) model trained on particle swarm optimization (PSO) optimized with a genetic algorithm (GA) was used to estimate the surface roughness. A Box-Behnken design (BBD) with printing parameters at three levels was used, and 25 parts were fabricated. The suggested model demonstrated a coefficient of determination (R2) of 0.9865 on test values, mean of root-mean-square-error (RMSE) of 0.1231 after 500 times training for generalization. And also mean of overfitting factor is 0.7110. This means that the suggested system could generalize. Comparing the results from the suggested model and ANN, the suggested hybrid model outperformed ANN in predicting the surface roughness values with no overfitting. This suggests that GA optimized PSO based FFNN may be a more suitable method for estimating product quality in terms of surface roughness.
Keywords
Introduction
Additive manufacturing (AM) or 3D printing is an advanced manufacturing technology in which materials are combined layer by layer to create a 3D object using a computer-designed model. 1 AM comprises computer-aided design (CAD), computer-aided manufacturing (CAM), computer numerical control (CNC), and electron energy beam (EEB) technology.2,3 The use of prototypes made with AM technology directly depends on their properties, one of which is surface quality. This is especially important regarding functional prototypes. Compared with traditional fabrication techniques, the most important advantage of AM technologies is that they do not require any tools.4,5 In addition, it allows the fabrication of difficult and complex geometries at a low cost. Thus, its use in industries, such as medicine, space, robotics, and automobiles is increasing daily.6–9
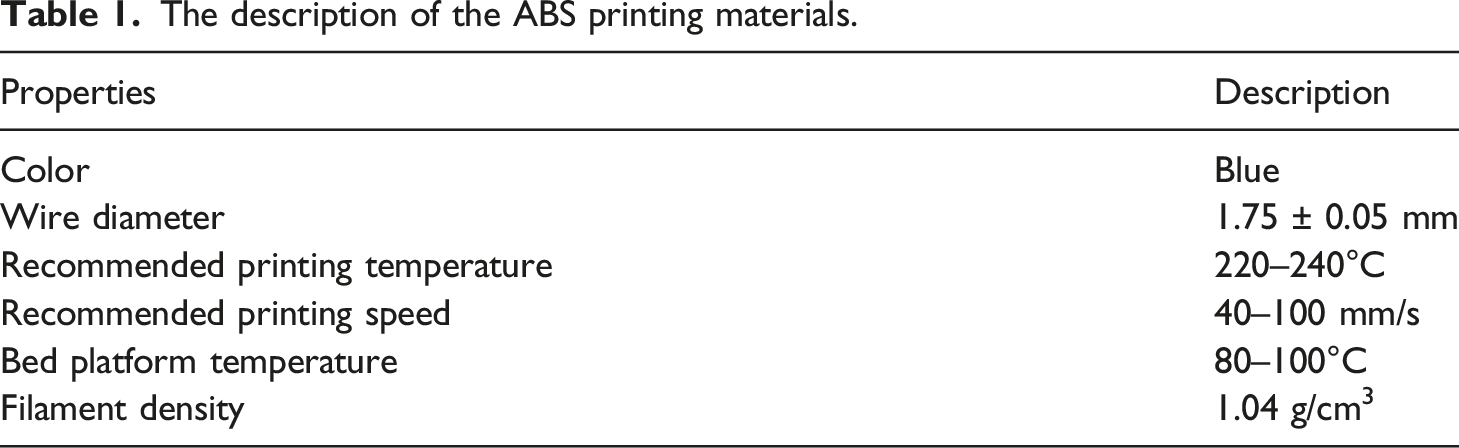
Additive Manufacturing methods can be classified into seven categories: material extrusion, powder bed fusion, vat photo polymerization, material jetting, binder jetting, sheet lamination, and directed energy deposition.10–12 Fused deposition modeling (FDM), a material extrusion method, stands as one of the most favored additive manufacturing (AM) techniques. 13 In this method, customized parts are produced from thermoplastics, often with complex geometries. FDM involves stacking polymerized construction and support material, and an extrusion head is used to shape a wire. 14 Thermoplastic is a filament that is heated in an extrusion chamber and used to build the material on the bed. Many special filament types, such as polylactic acid (PLA), 15 acrylonitrile butadiene styrene (ABS), thermoplastic polyurethane (TPU), polyethylene terephthalate glycol (PETG), 16 polyvinyl alcohol (PVA), and nylon, are used in the FDM process. 17 In this study, the surface quality of the intake manifold flange made of ABS was examined. ABS material has good resistance to heat and chemicals and is easy to process, because of its strong and durable structure even at low temperatures. 18 In addition, it has positive mechanical properties, such as good surface quality, low weight, and high strength.19,20
Although the AM method is widely used to obtain prototypes in many industrial applications, it has limitations such as surface quality and control. 21 The final product can have the desired functionality by considering the surface roughness requirement, which plays an important role in achieving high surface quality. Additively manufactured products usually have poor surface quality in contrast to subtractive manufacturing processes. 22 Because rough surfaces wear more quickly than smooth surfaces, it is very important to estimate the surface roughness of products.23,24 Many printing parameters, such as nozzle diameter, printing speed, nozzle temperature, layer height, and print orientation, affect the surface roughness.25–27 The effect of these parameters on roughness must be examined to obtain quality parts. In the current study, 3D fabrication and experimental studies were conducted by selecting the four parameters (layer height, nozzle diameter, nozzle temperature, and extrusion rate) that most affect roughness as a result of literature research. Recently, different methods and algorithms have been studied to examine, predict, and optimize the surface roughness of additively manufactured parts.28–30 Central composite design (CCD), response surface method (RSM), artificial neural network (ANN), and support vector machine (SVM) are some of these methods.31–34
Scientific studies are being conducted to create a data-based prediction model and investigate the effect of fabrication input parameters on the surface roughness of FDM components.35–38 Li et al. presented a data-driven prediction model to predict the surface roughness of AM-fabricated parts. 29 They used multiple sensors of different types, including thermocouples, infrared temperature sensors, and accelerometers, to collect temperature and vibration data. Experimental results have shown that the proposed predictive modeling approach can predict the surface roughness of 3D printed components with high accuracy. Naga Malleswari et al. proposed a model to predict the relationship between surface roughness and stress factors. 39 In this study, the response CCD method was used to design the experiments, and the response was estimated using two methods: RSM and ANN. The total number of experiments was 27, and roughness was measured for each fabricated part. Because of experimental studies, the ANN may be a more suitable method for measuring product quality in terms of surface roughness. Kandananand et al. used the ANN method to predict the surface roughness of cylindrical-shaped workpieces fabricated by FDM, taking into account different 3D printing parameters. 40 The parts were fabricated using PLA type filament. Box-Behnken design (BBD) was used to design the experiment, and statistically predict the response. Nadir investigated the effect of layer thickness on the surface roughness, and wettability of 3D printing samples made of wood flour/PLA filament. 41 Four different layer thicknesses of 0.05 mm, 0.1 mm, 0.2 mm, and 0.3 mm were used in the fabrication of 3D printed samples. The surface smoothness of the samples increased significantly with the reduction of layer thickness. The wettability of the samples increased significantly with increasing layer thickness. Xinbo et al. reviewed different papers and showed how the machine learning (ML) concept changed the agile manufacturing industry in the AM of a product. 5 Nangare and Chavan used a design of experiment (DOE) method to evaluate how specific features such as orientation, filler density, and nozzle diameter affect the surface roughness of products fabricated with Ultimaker 2 + 3D printer. 42 The Taguchi orthogonal array was used to limit the number of experiments and to provide different combinations and levels of these three elements in each experiment. When studies in the literature are examined, various prediction and optimization methods are used to improve the surface quality of parts fabricated using the AM method. Different input factors were examined to determine the effect of 3D printing parameters on the surface quality of the fabricated parts. However, estimation and optimization of surface roughness with a feed forward neural network (FFNN) approach model trained based on particle swarm optimization (PSO) optimized with a genetic algorithm (GA) will be applied for the first time in this study.
In summary, while previous studies have attempted to develop various techniques to predict surface roughness in AM processes, there have been few reports on predicting surface roughness in AM using hybrid learning methods. To address this research gap, a novel hybrid modeling approach based on ML is proposed to predict the surface roughness of components additively manufactured with FDM. In addition, the intake manifold flange, which is normally fabricated using aluminum material, will be fabricated using the AM method for the first time and its surface quality will be examined. With these features, this study contributes to the literature by filling this research gap.
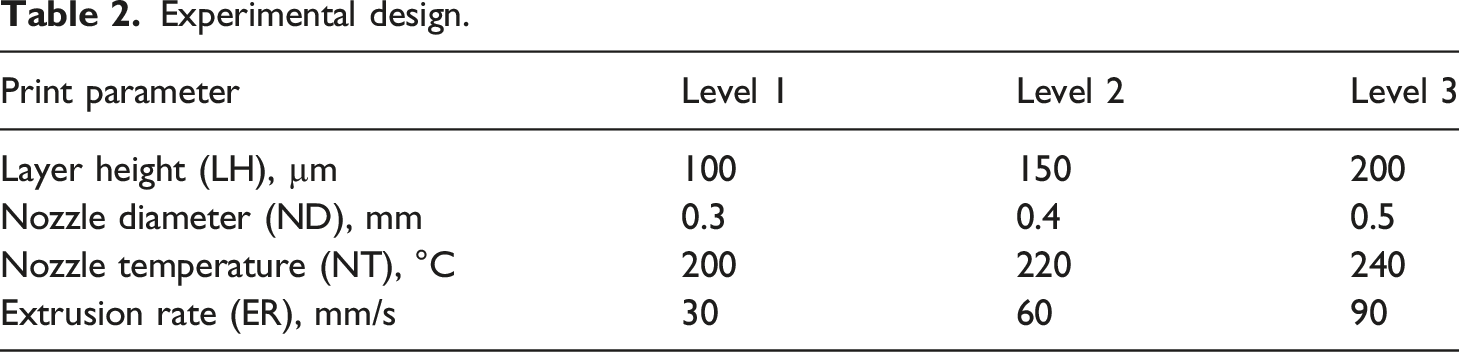
Printing parameters selected before AM significantly affect the mechanical properties of FDM-fabricated parts. Consequently, the surface roughness of the intake manifold flange samples fabricated from ABS was investigated using real-time experimental studies. Four critical pre-processing factors (layer height, nozzle diameter, nozzle temperature, and extrusion rate) for obtaining high-surface quality products were selected. A minimum number of the experimental designs were created by examining the effects of experimental parameters on the test results using the BBD method. Samples designed with BBD were fabricated with an FDM-based 3D printer. A data set of 25 samples was obtained by determining the four factors and three levels that most affected roughness. A GA-optimized PSO-based FFNN approximation model was used to estimate the surface roughness using these data. When the prediction results of the proposed model were compared with ANN, the suggested hybrid model outperformed ANN in predicting the surface roughness values with no overfitting. The results showed that the proposed predictive model may be a more suitable method for predicting product quality in terms of surface roughness. Finally, a regression equation was used to predict the surface roughness values, and significant input factors were determined using ANOVA.
Materials and methods
Experimental design
In this study, a fused deposition modeling (FDM) based Zaxe Z1 Plus 3D printer was used to fabricate intake manifold flange parts using the additive manufacturing (AM) method. The 3D printer is capable of printing parts with maximum dimensions of 300 × 300 × 300 mm. In addition, it has 50–400-micron layer resolution and 10–300 mm/s print speed capability. The most significant advantage of this printer is that it is compatible with materials, such as acrylonitrile butadiene styrene (ABS), polylactic acid (PLA), polyethylene terephthalate glycol (PETG), composite materials, carbon fiber, and wood. FDM technology works by melting a thermoplastic filament and extruding it onto a base to create an object layer by layer. This technology is popular in prototyping, product development, and manufacturing processes used across a wide range of industries. FDM 3D printer technology begins with melting a thermoplastic filament by passing it through an extruder. The melted filament is extruded onto the base or previous layer and cooled. This process is repeated layer by layer to create an object (Figure 1). FDM-based additive manufacturing process.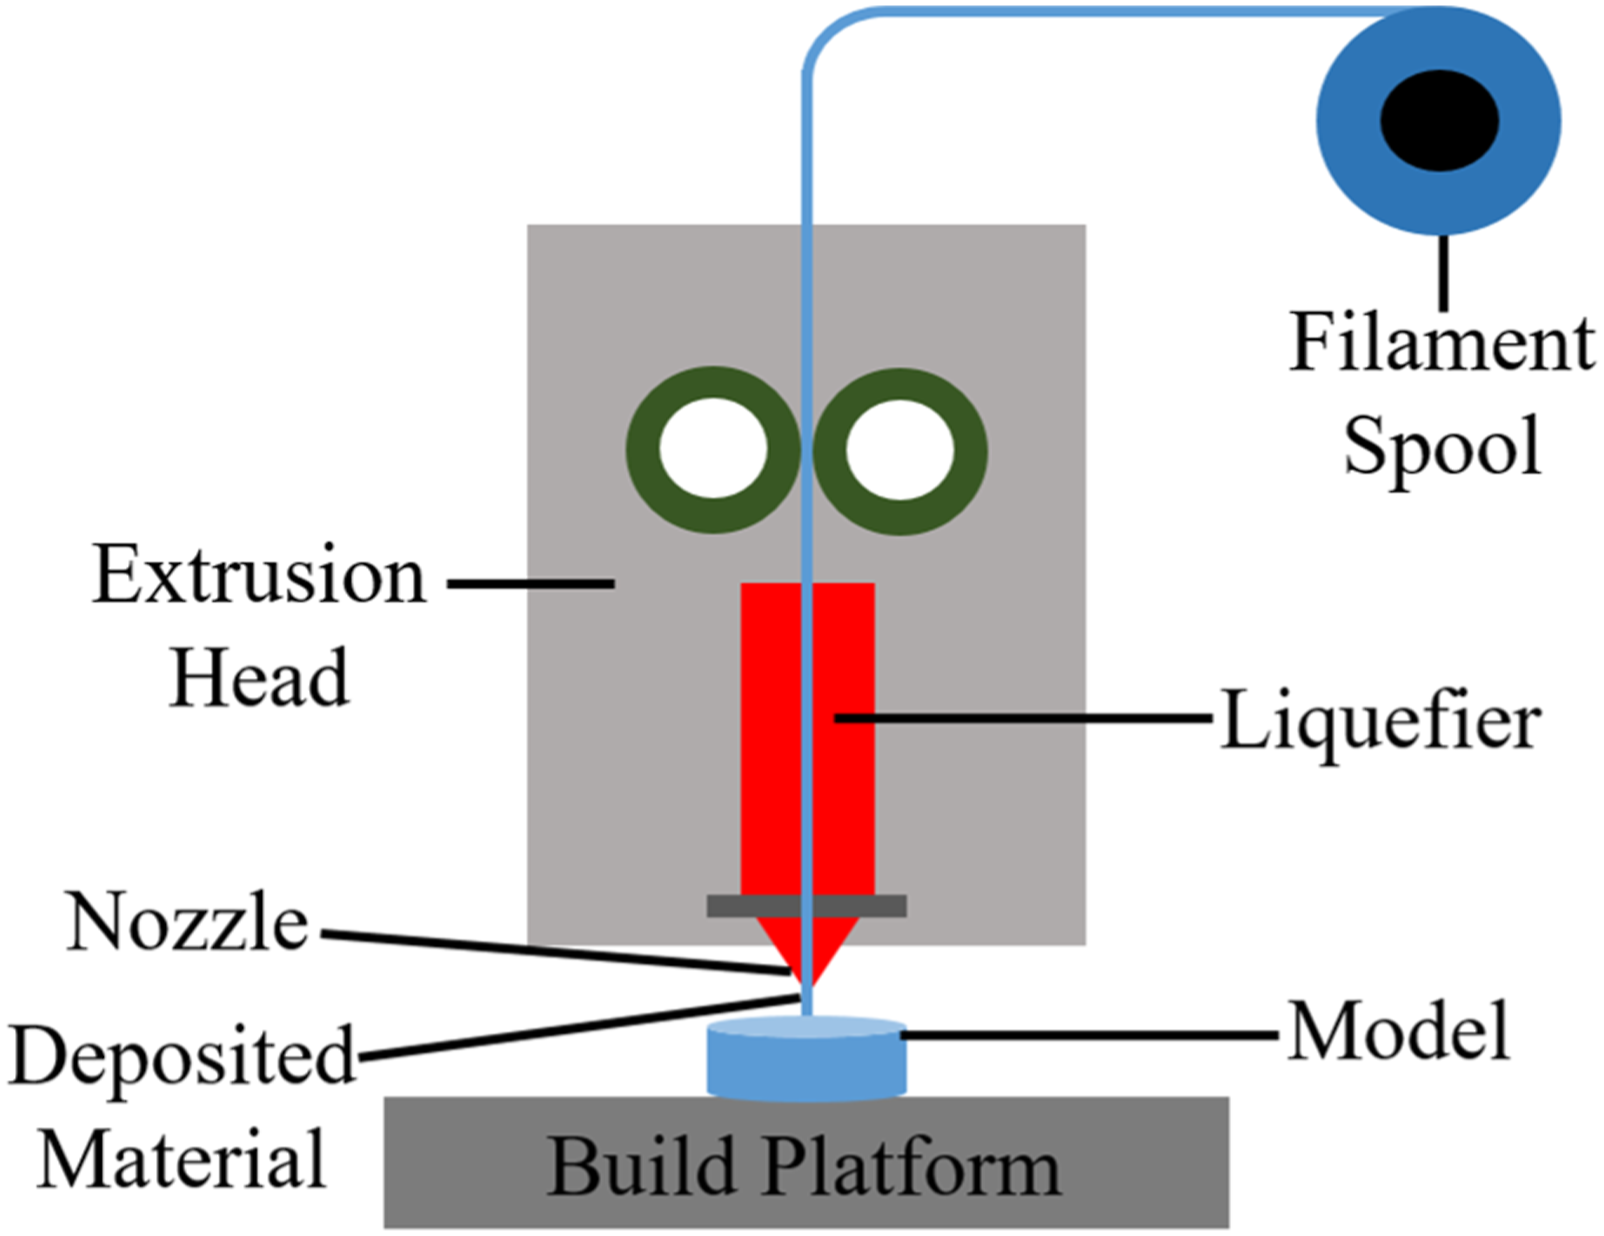
The description of the ABS printing materials.
Experimental design.
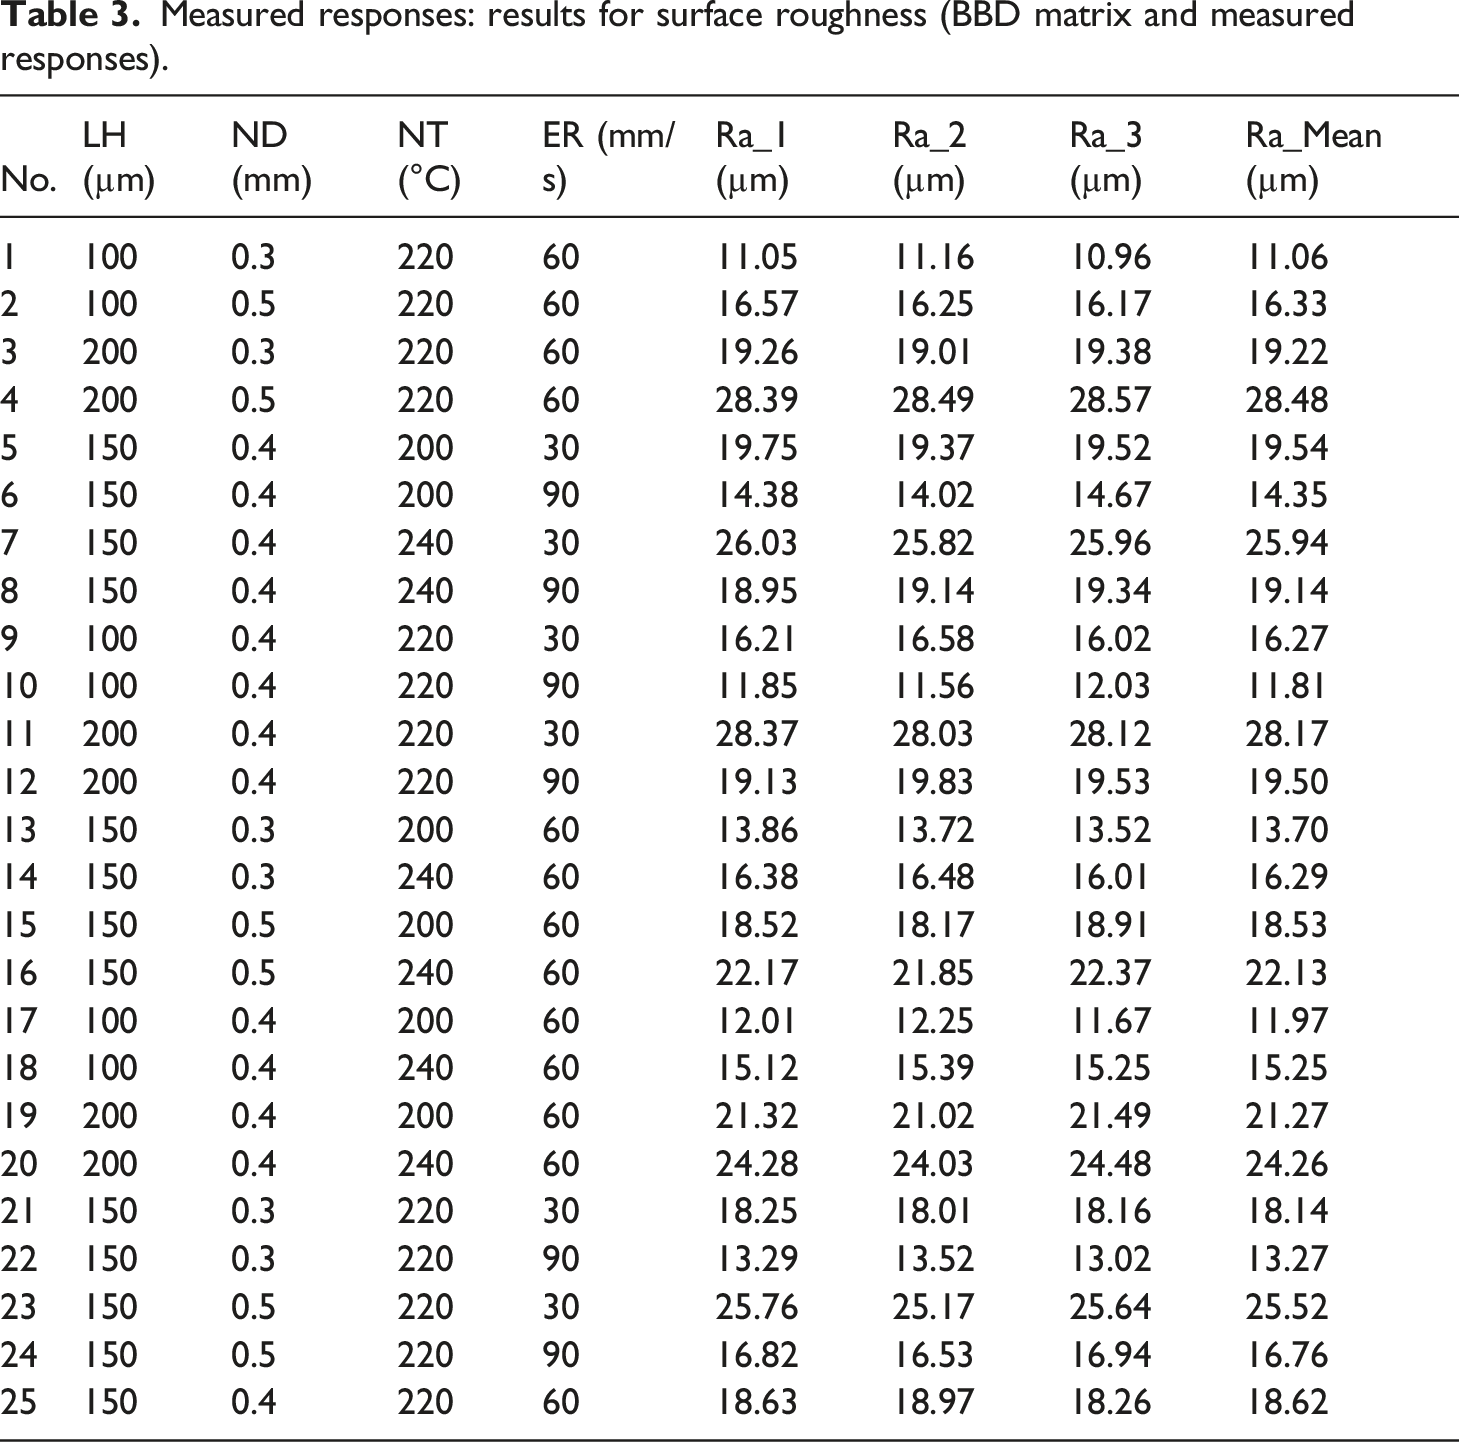
Measured responses: results for surface roughness (BBD matrix and measured responses).
Experimental procedure
The surface roughness sample was modeled in a computer environment in 3D using SolidWorks software in accordance with the determined criteria. In this study, a Honda B16/B18C intake manifold flange was designed as a sample. Featuring a series of tubes, the intake manifold ensures that the air entering the engine is evenly distributed to all the cylinders. This air is used during the first stroke of the combustion process. The intake manifold also helps cool down the cylinders to prevent the engine from overheating. Intake manifolds are usually made of cast iron or aluminum alloys. Figure 2(a) gives the computer aided design (CAD) model of the Honda B16/B18C intake manifold flange. (a) CAD model of the Honda B16/B18C intake manifold flange (b) measurement of surface roughness (c) additive manufactured part.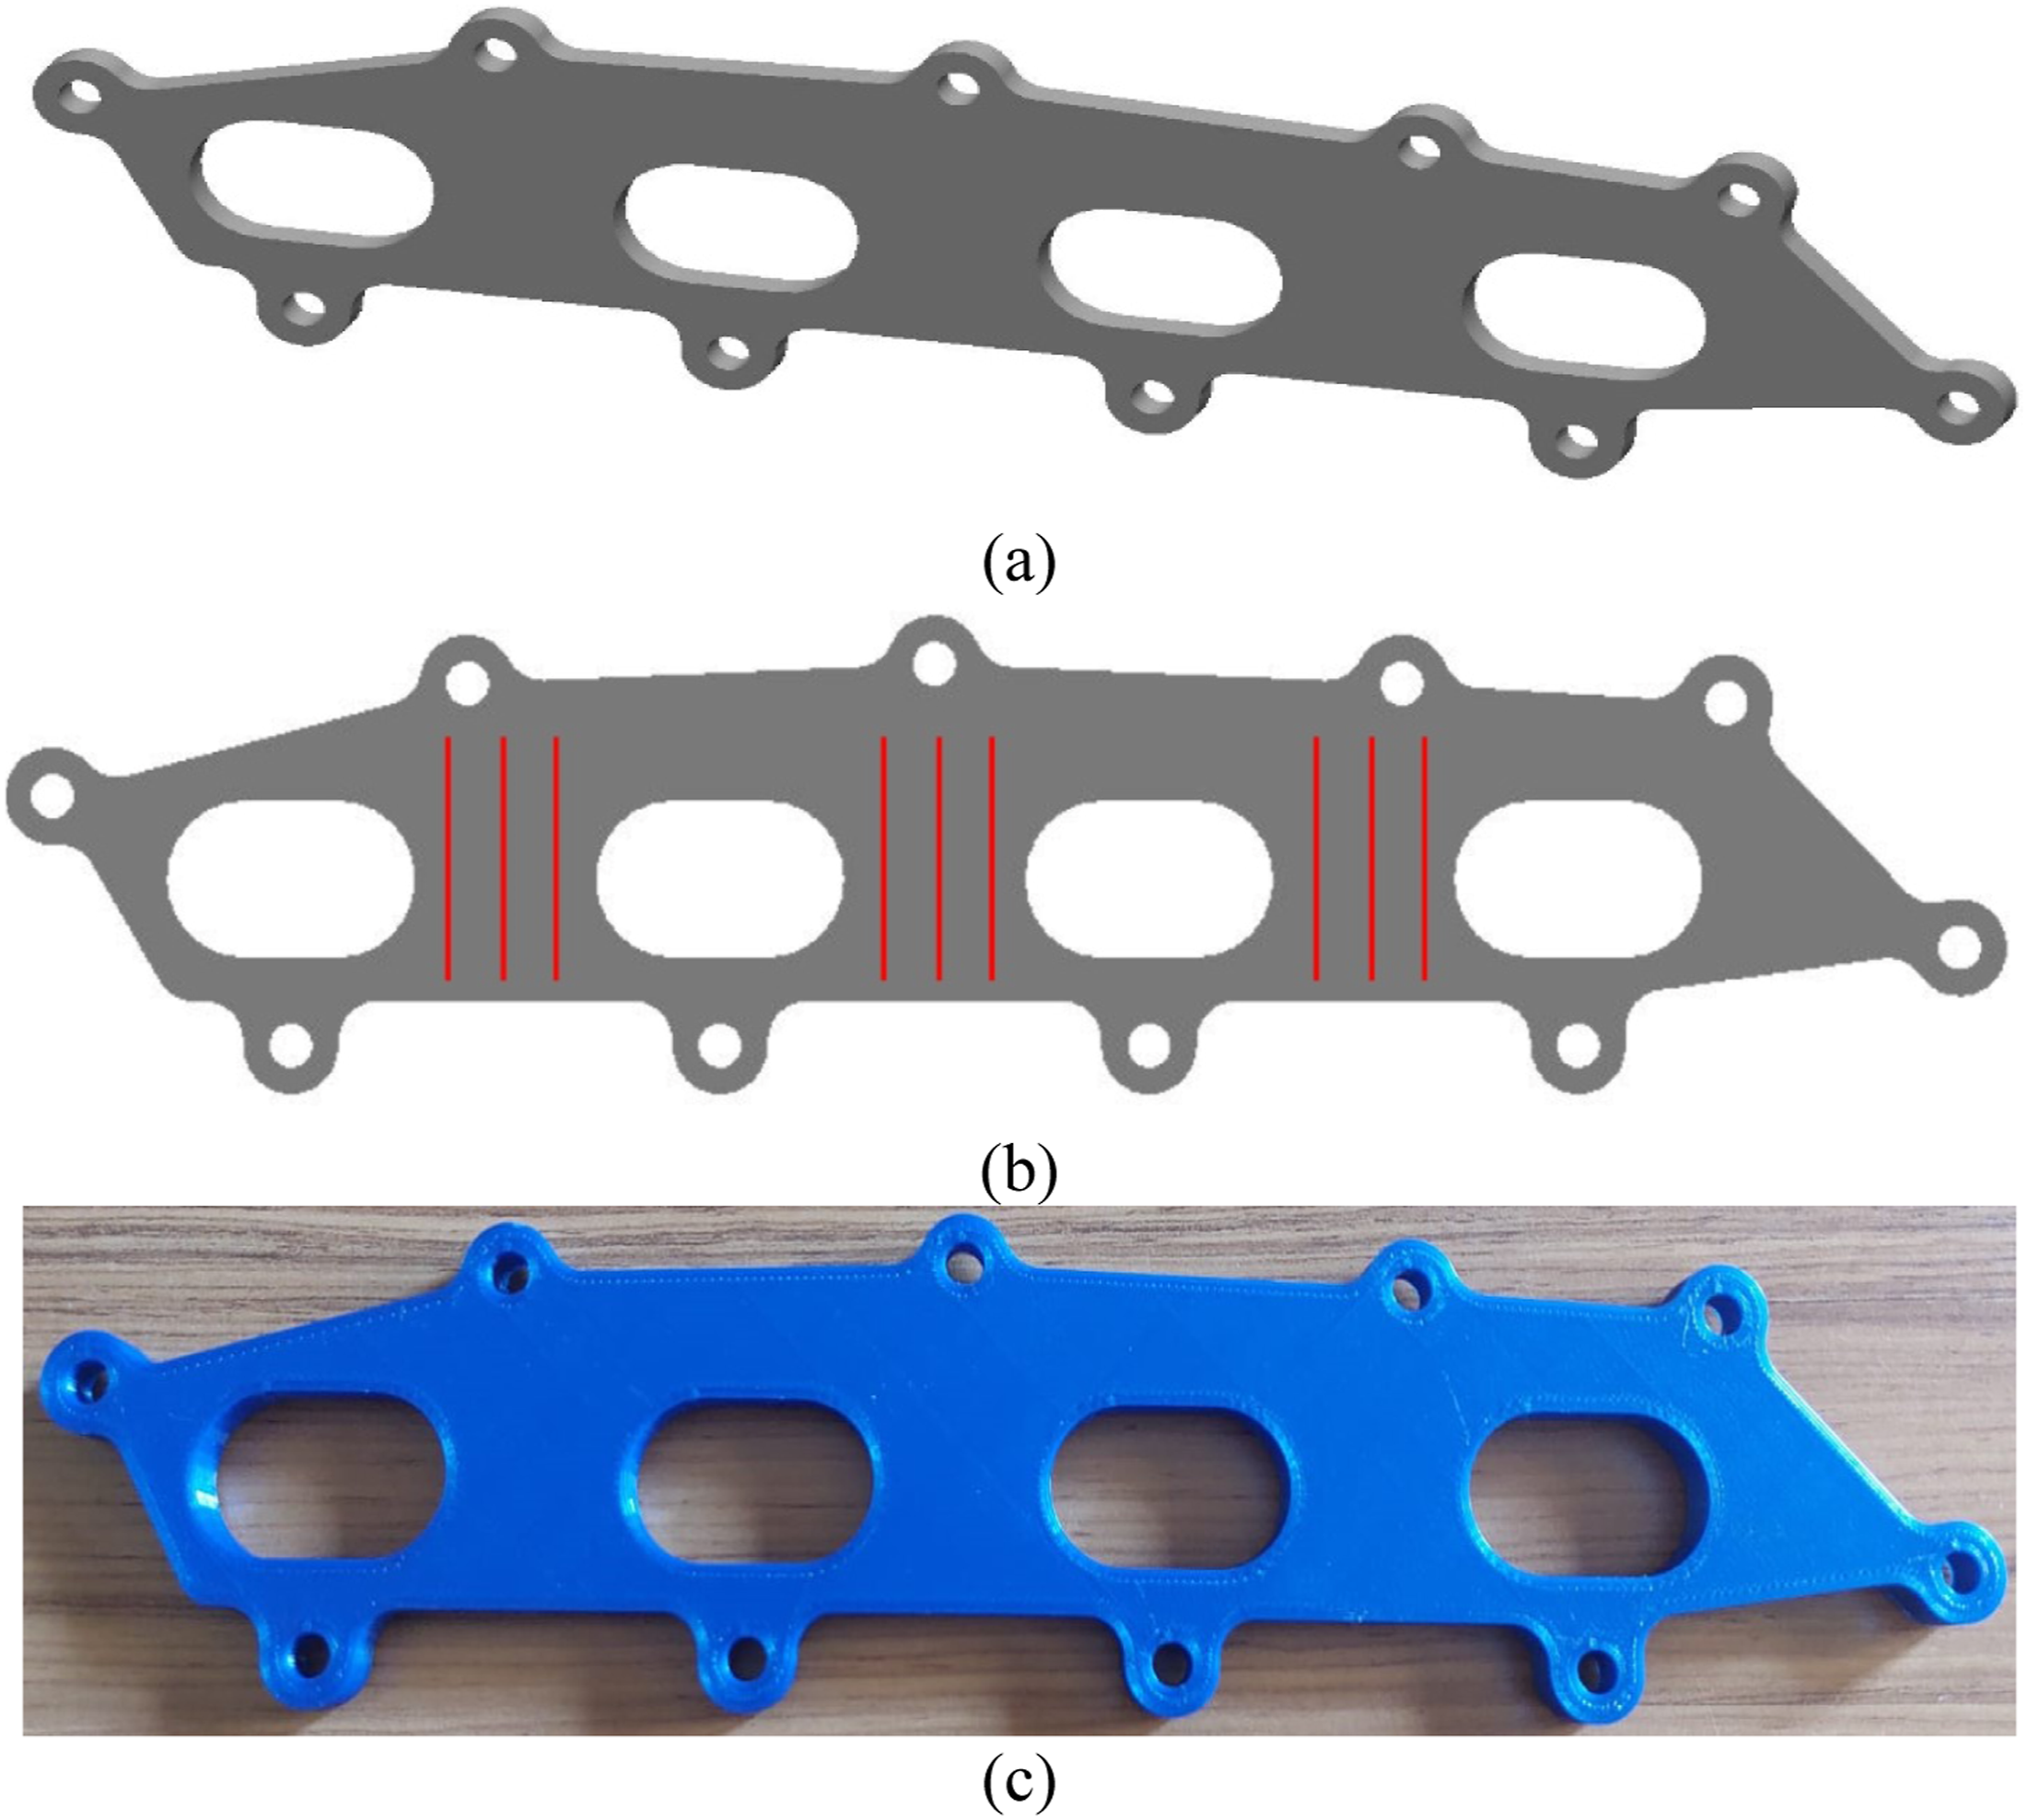
After creating the solid model, we need to convert the file to a format specific to 3D printing. Although there are many formats, the most commonly used format in 3D printers is standard triangle language (STL). After the STL file is created, it is translated into G-Code, the language that the 3D Printer understands, via Slicer. In this way, the work path of the machine is determined for each layer. Once the 3D printer is ready for printing, G-Code is loaded using a USB and the FDM printing process begins. All parts were fabricated at room temperature with blue ABS according to the combinations given in Table 3 under equal conditions. The samples are in 60 mm × 40 mm with a thickness of 5 mm. Under the same conditions, 25 samples were fabricated and surface roughness measurements were started. Figure 2(c) shows the additive manufactured Honda B16/B18C intake manifold flange. In this study, it has been shown that manifold type parts can be fabricated using the FDM technique and that the surface roughness can be examined experimentally.
Surface quality is important in determining surface quality because it basically shows the quality of the produced part. The surface roughness of the parts was measured using the Mitutoyo Surftest SJ-210 model, one of the digital profilometer devices, with a sampling length of 2.5 mm and a measuring speed of 0.65 mm/s. A profilometer determines the surface profile by scanning the surface of a part with or without touching it. Before the measurement begins, the profilometer device is adjusted and calibrated. The profilometer device is then carefully moved around a designated area of the part. The device detects height differences on the surface of the part and records this information as a data set. The resulting data is used to measure the roughness of the surface. As a result, the average surface roughness value (Ra) is automatically calculated by the device. The Ra value indicates the general roughness of the surface. The Ra value is usually expressed in micrometers (μm) or microns. A lower Ra value indicates a smoother surface, while a higher Ra value indicates a rougher surface. The surface roughness of all parts was measured three times to minimize measurement errors. Figure 2(b) shows where the surface roughness was measured. The experimental results for the average surface roughness are given in Table 3.
Response surface methodology
Response Surface Method is a method that defines the relationship between the output 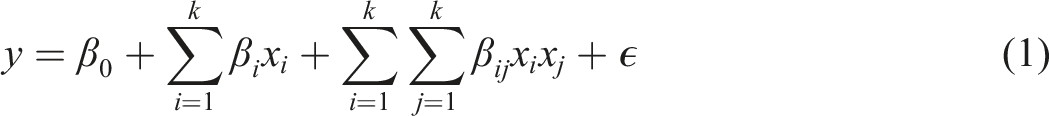

Box-Behnken design
A factorial design is implemented using three levels for each independent variable for the second-degree model specified in equation (1), resulting in a BBD and full factorial experimental design. (a) Full factorial design. (b) The Box-Behnken design.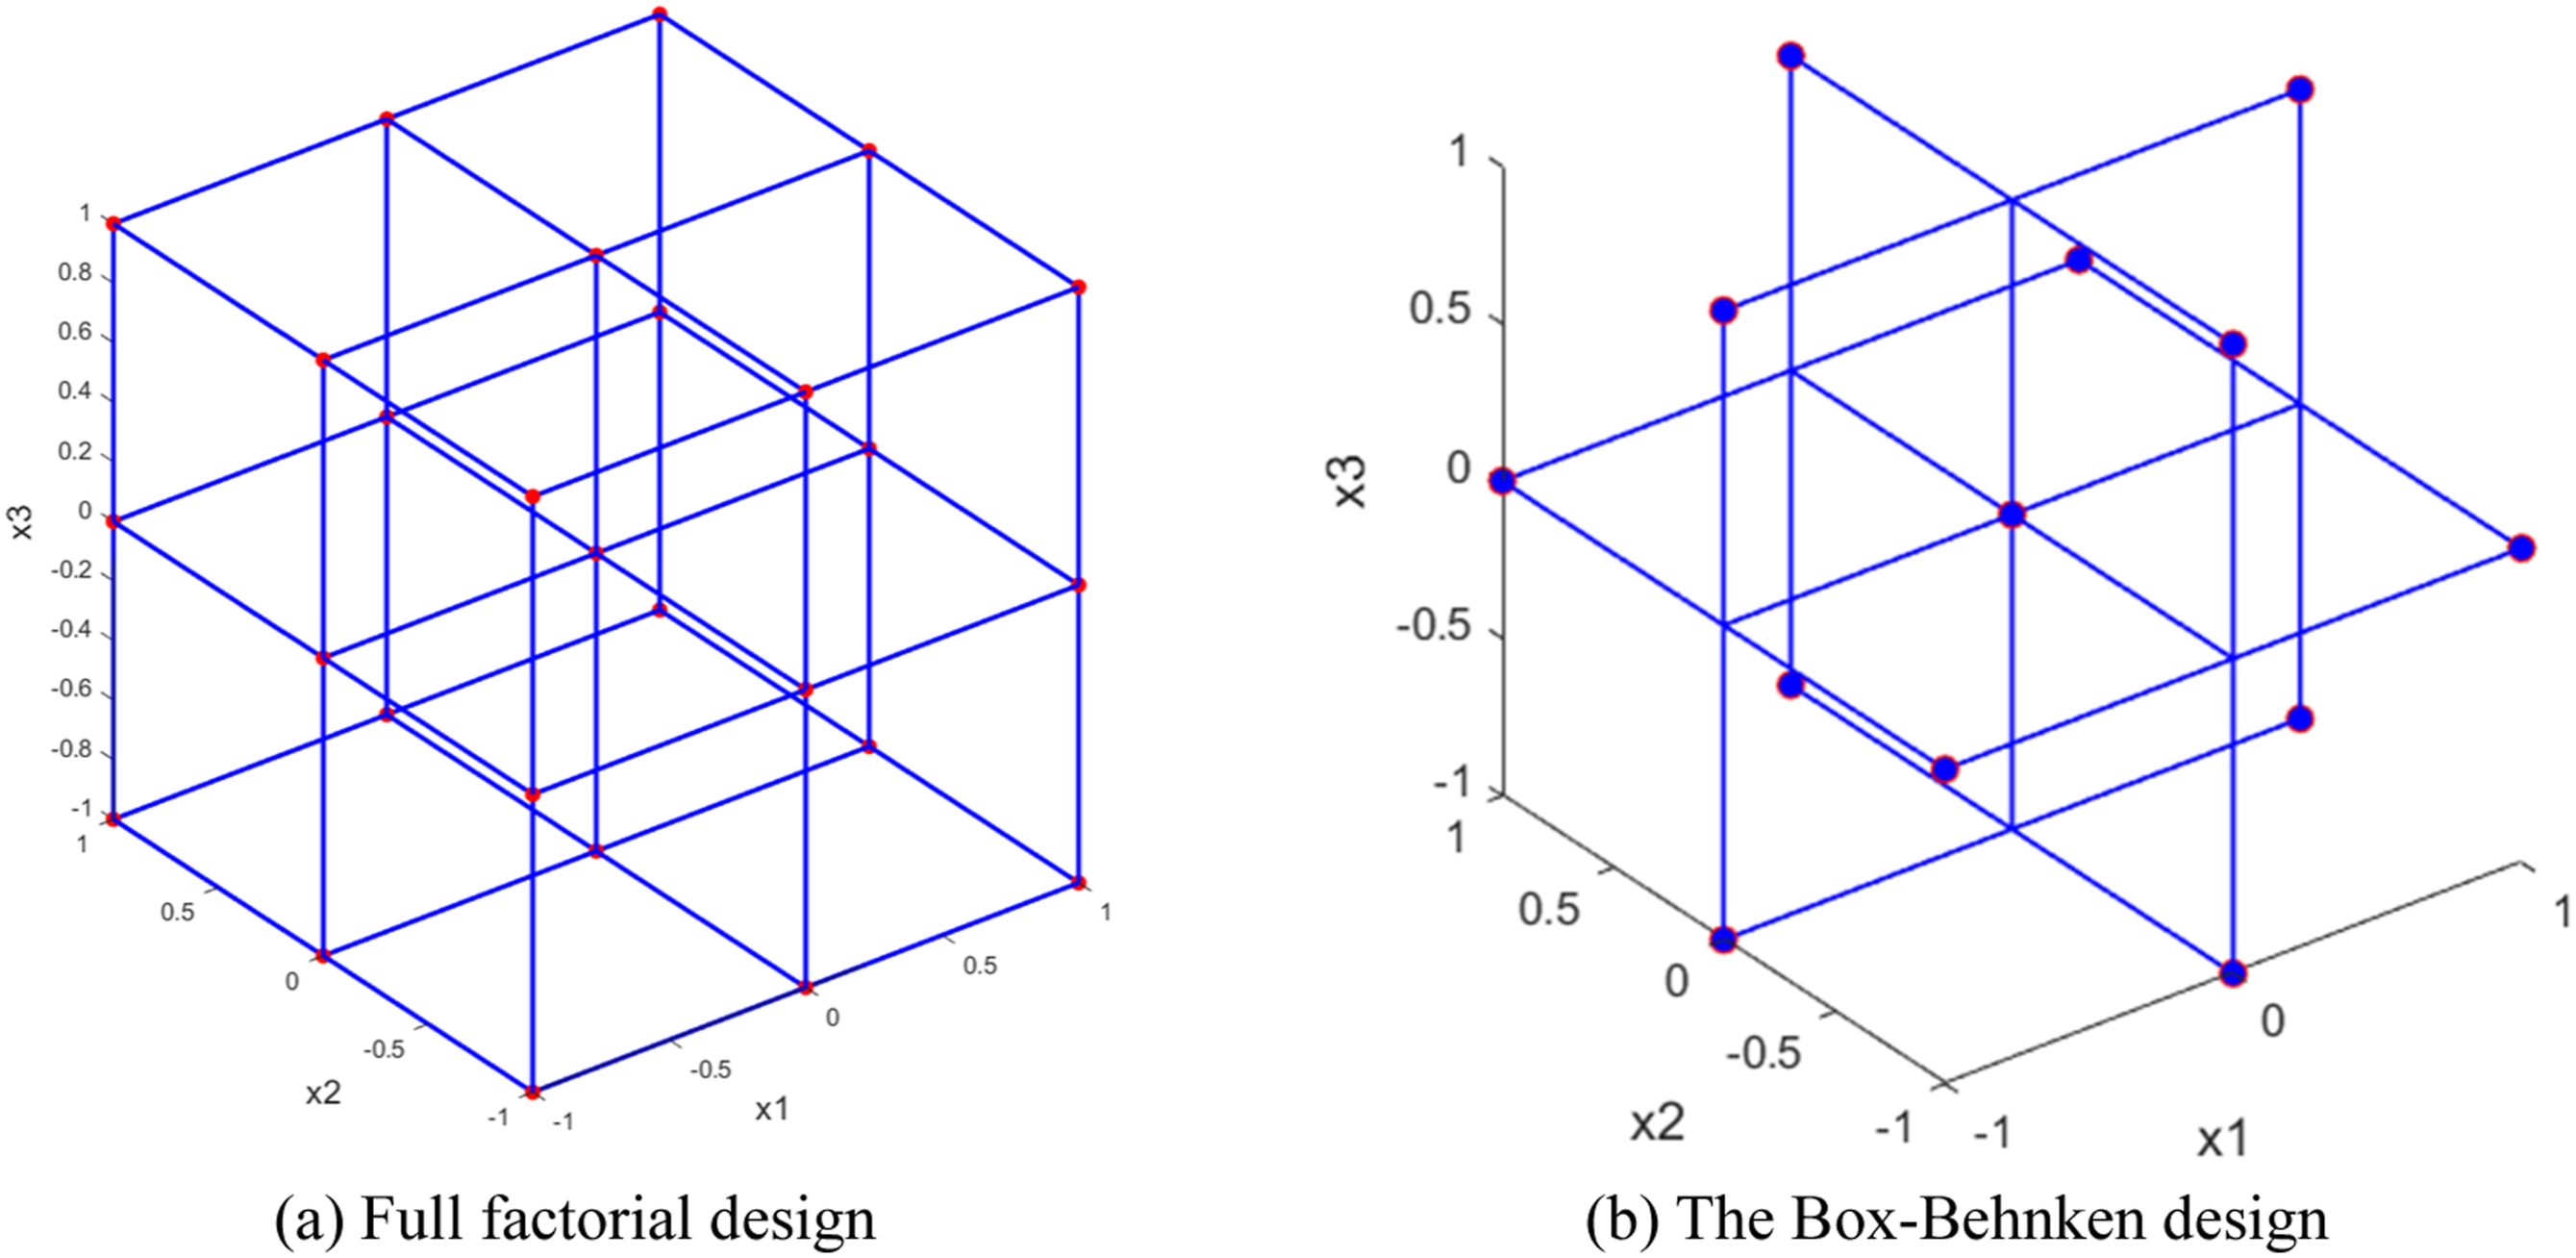
GA optimized hybrid PSO trained feedforward neural network
In this study, data collected as training data include layer height (LH), nozzle diameter (ND), nozzle temperature (NT), and extrusion rate (ER), which are labeled with surface roughness. The available data are limited for developing a model using gradient-based training algorithms.48,49
When training is performed with such a small dataset, the model tends to over fit. Although regularization methods such as the Lasso algorithm have been employed to prevent overfitting, it has been noted that these methods also negatively impact the training performance. The proposed genetic algorithm (GA) optimized particle swarm optimization (PSO)-feedforward neural network (FFNN) hybrid model is illustrated in Figures 4 and 5. Proposed hybrid training model. Feed forward neural network.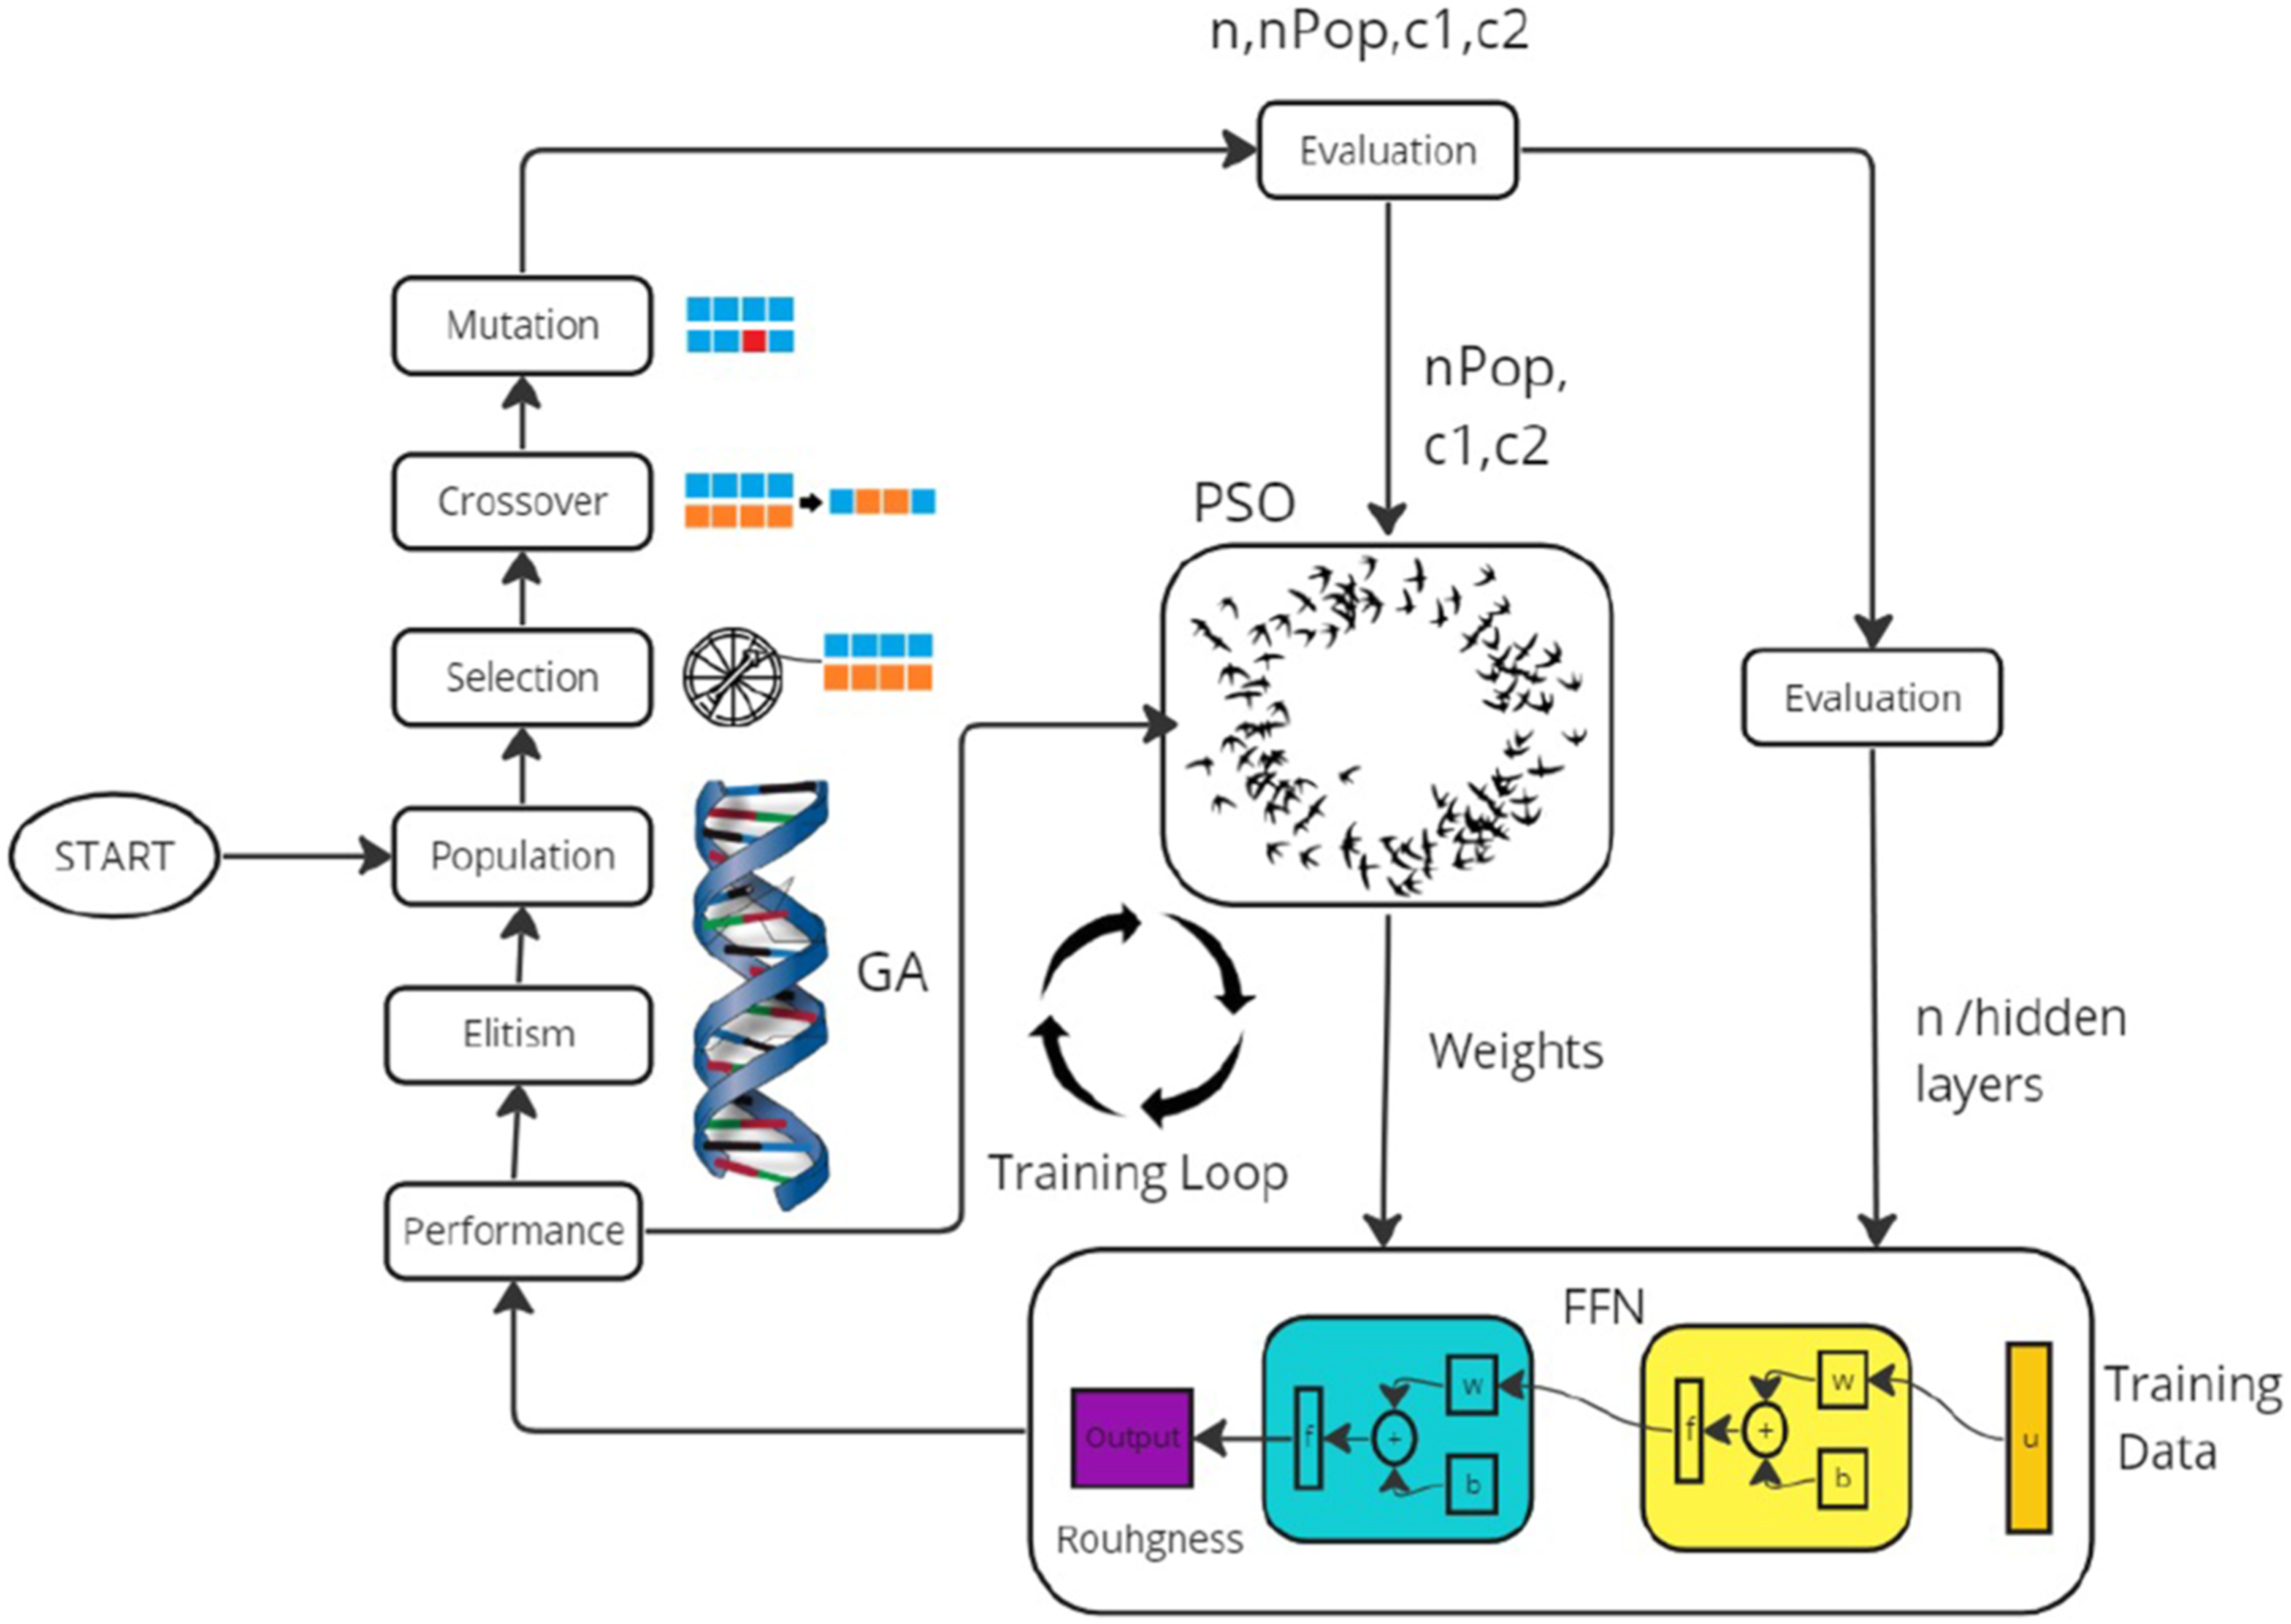
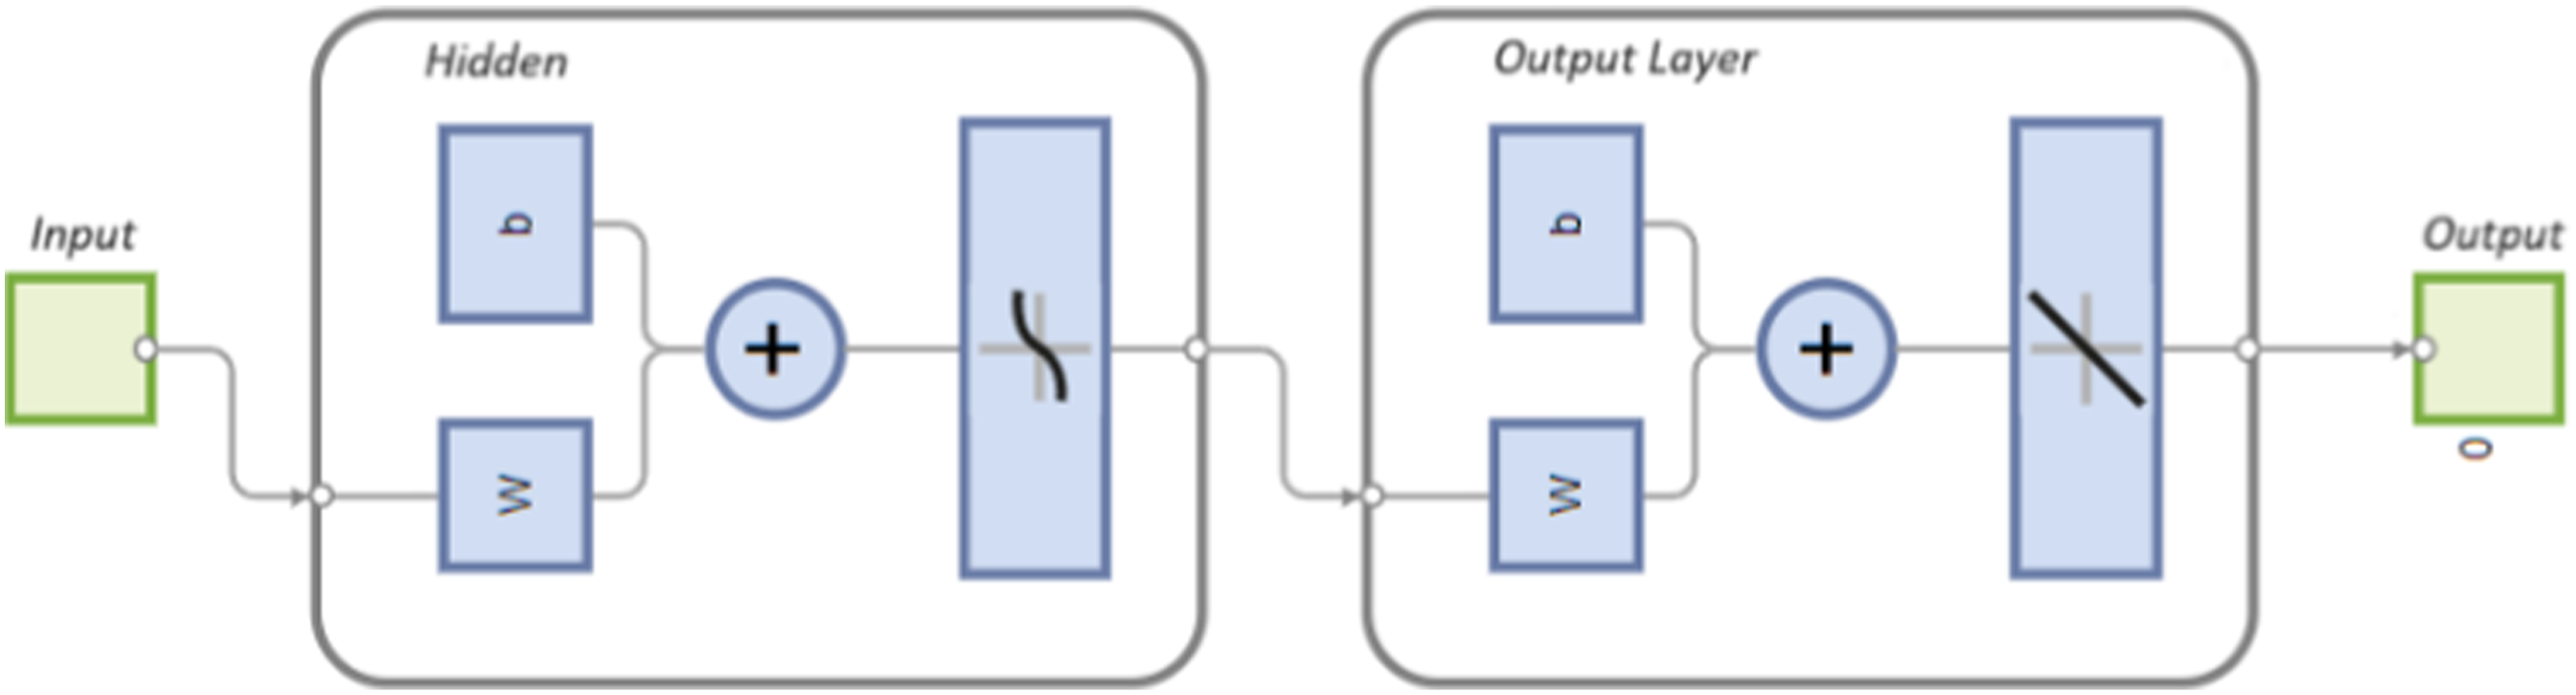
The proposed feedforward neural network architecture is trained using an optimization algorithm called particle swarm optimization (PSO). The output of the feedforward neural network model is shown in equation (3).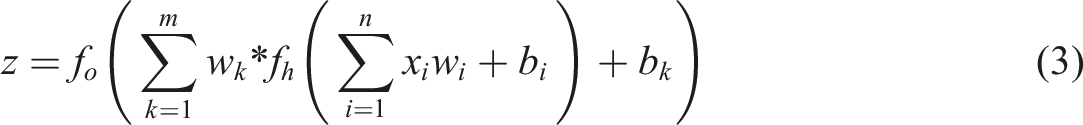
In this study, the weights and bias values were randomly set to small values, and the model was trained using the PSO algorithm. PSO is an optimization technique proposed by Kennedy drawing inspiration from social psychology and developed based on group social behavior. 50
Each particle seeks the optimal point of a fitness function in the search space within PSO. Particles are initially placed randomly in the search space and their performance (fitness or quality) is evaluated at that position. Subsequently, each particle moves towards the best position over a predefined number of iterations. The movement vector for each particle is represented as shownd in equation (4).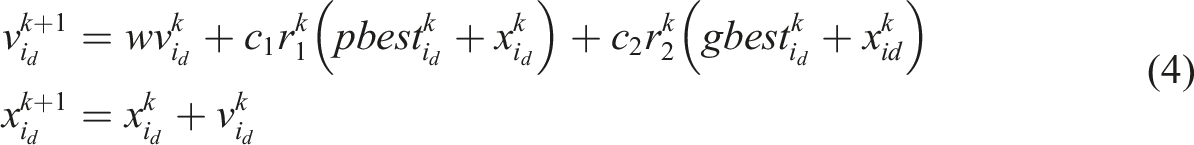
Particle Swarm Optimization, genetic mutation, and selection operations are not included, making it a simple calculation algorithm that operates not only on an individual’s information but also on the group’s information, guaranteeing the optimum. In addition, the population size and coefficients influencing individual and group success in this simple calculation algorithm need optimization.
In this study, the behavior pattern of each PSO population, defined by the number of hidden layers (n) in the FFNN, the population size of PSO (nPop), the coefficients for balancing individual and group behavior (
Genetic Algorithm is a heuristic optimization method inspired by evolutionary computation. Each candidate solution specified in the solution space is referred to as an individual in the GA. Individuals are tested with a cost function, and based on their success results, subsequent generations are created.
Each chromosome is endowed with several genes equivalent to the number of variables within the solution space. The fitness value denoted as
Along with the crossover operation, a mutation is imparted upon genes randomly identified at a specified rate to uphold gene diversity during the transition of each generation 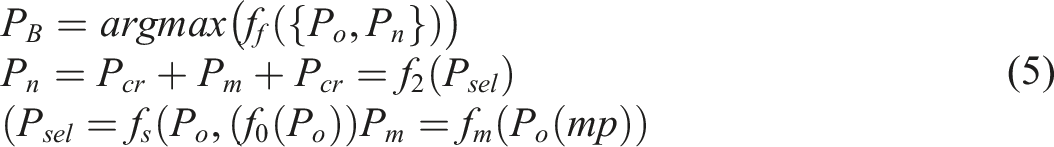
Results and discussion
Results of the response surface methodology
Box-Behnken experimental design model statistics and ANOVA.
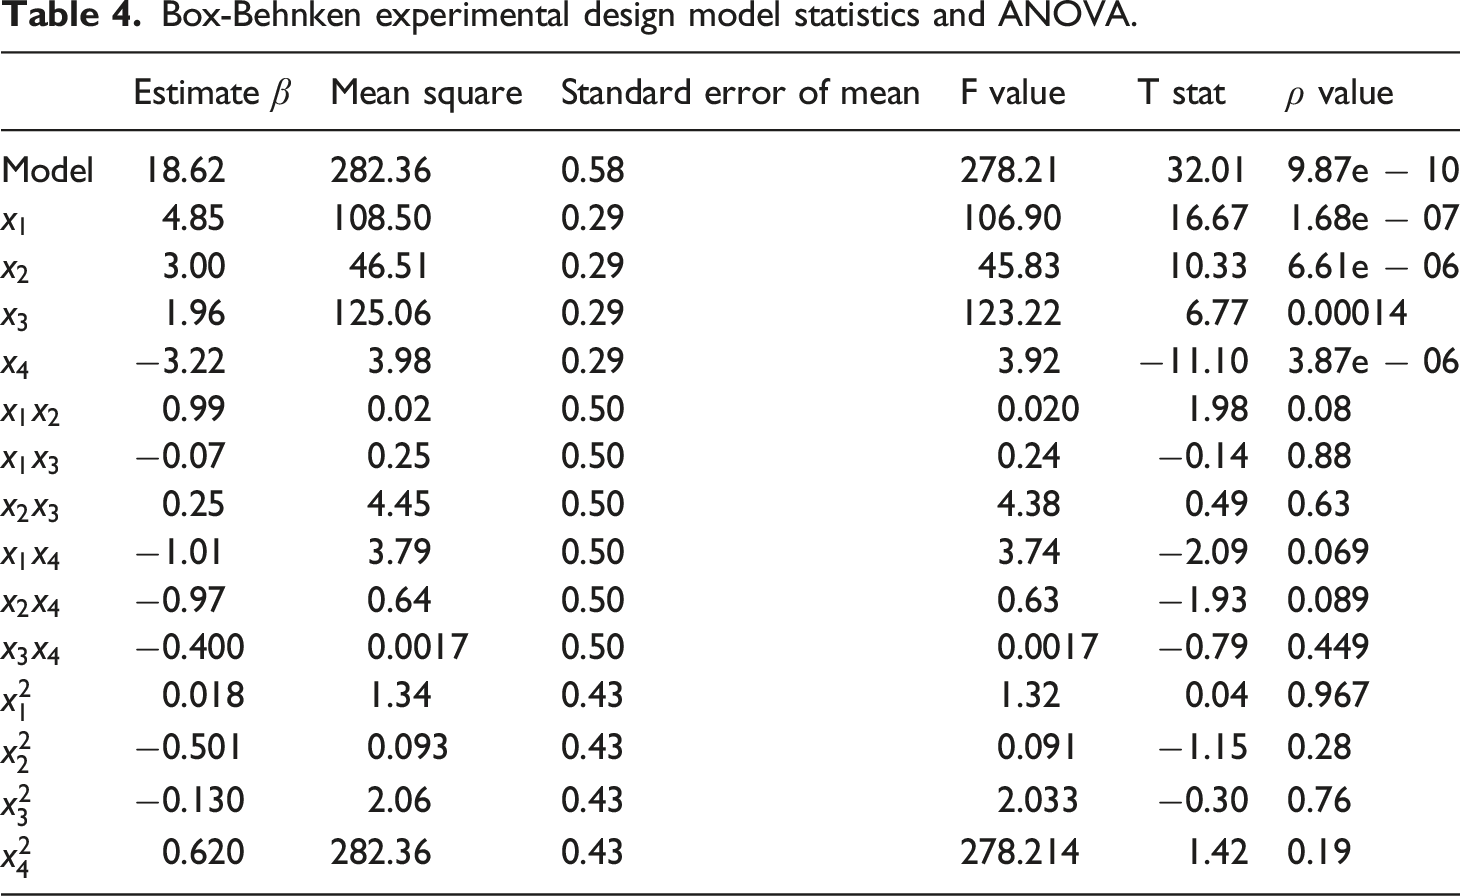
The prediction model created with the coefficients estimated by the RSM is as follows, represented by equation (6). This model includes the relationships and quadratic relationships of all four parameters, allowing it to explain non-linear situations as well.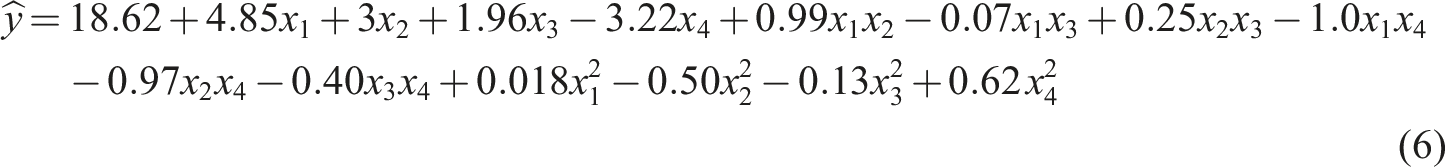
The relationship between each parameter and the surface roughness in the model predicted by RSM is depicted in Figure 6. Quadratic model of the coefficient.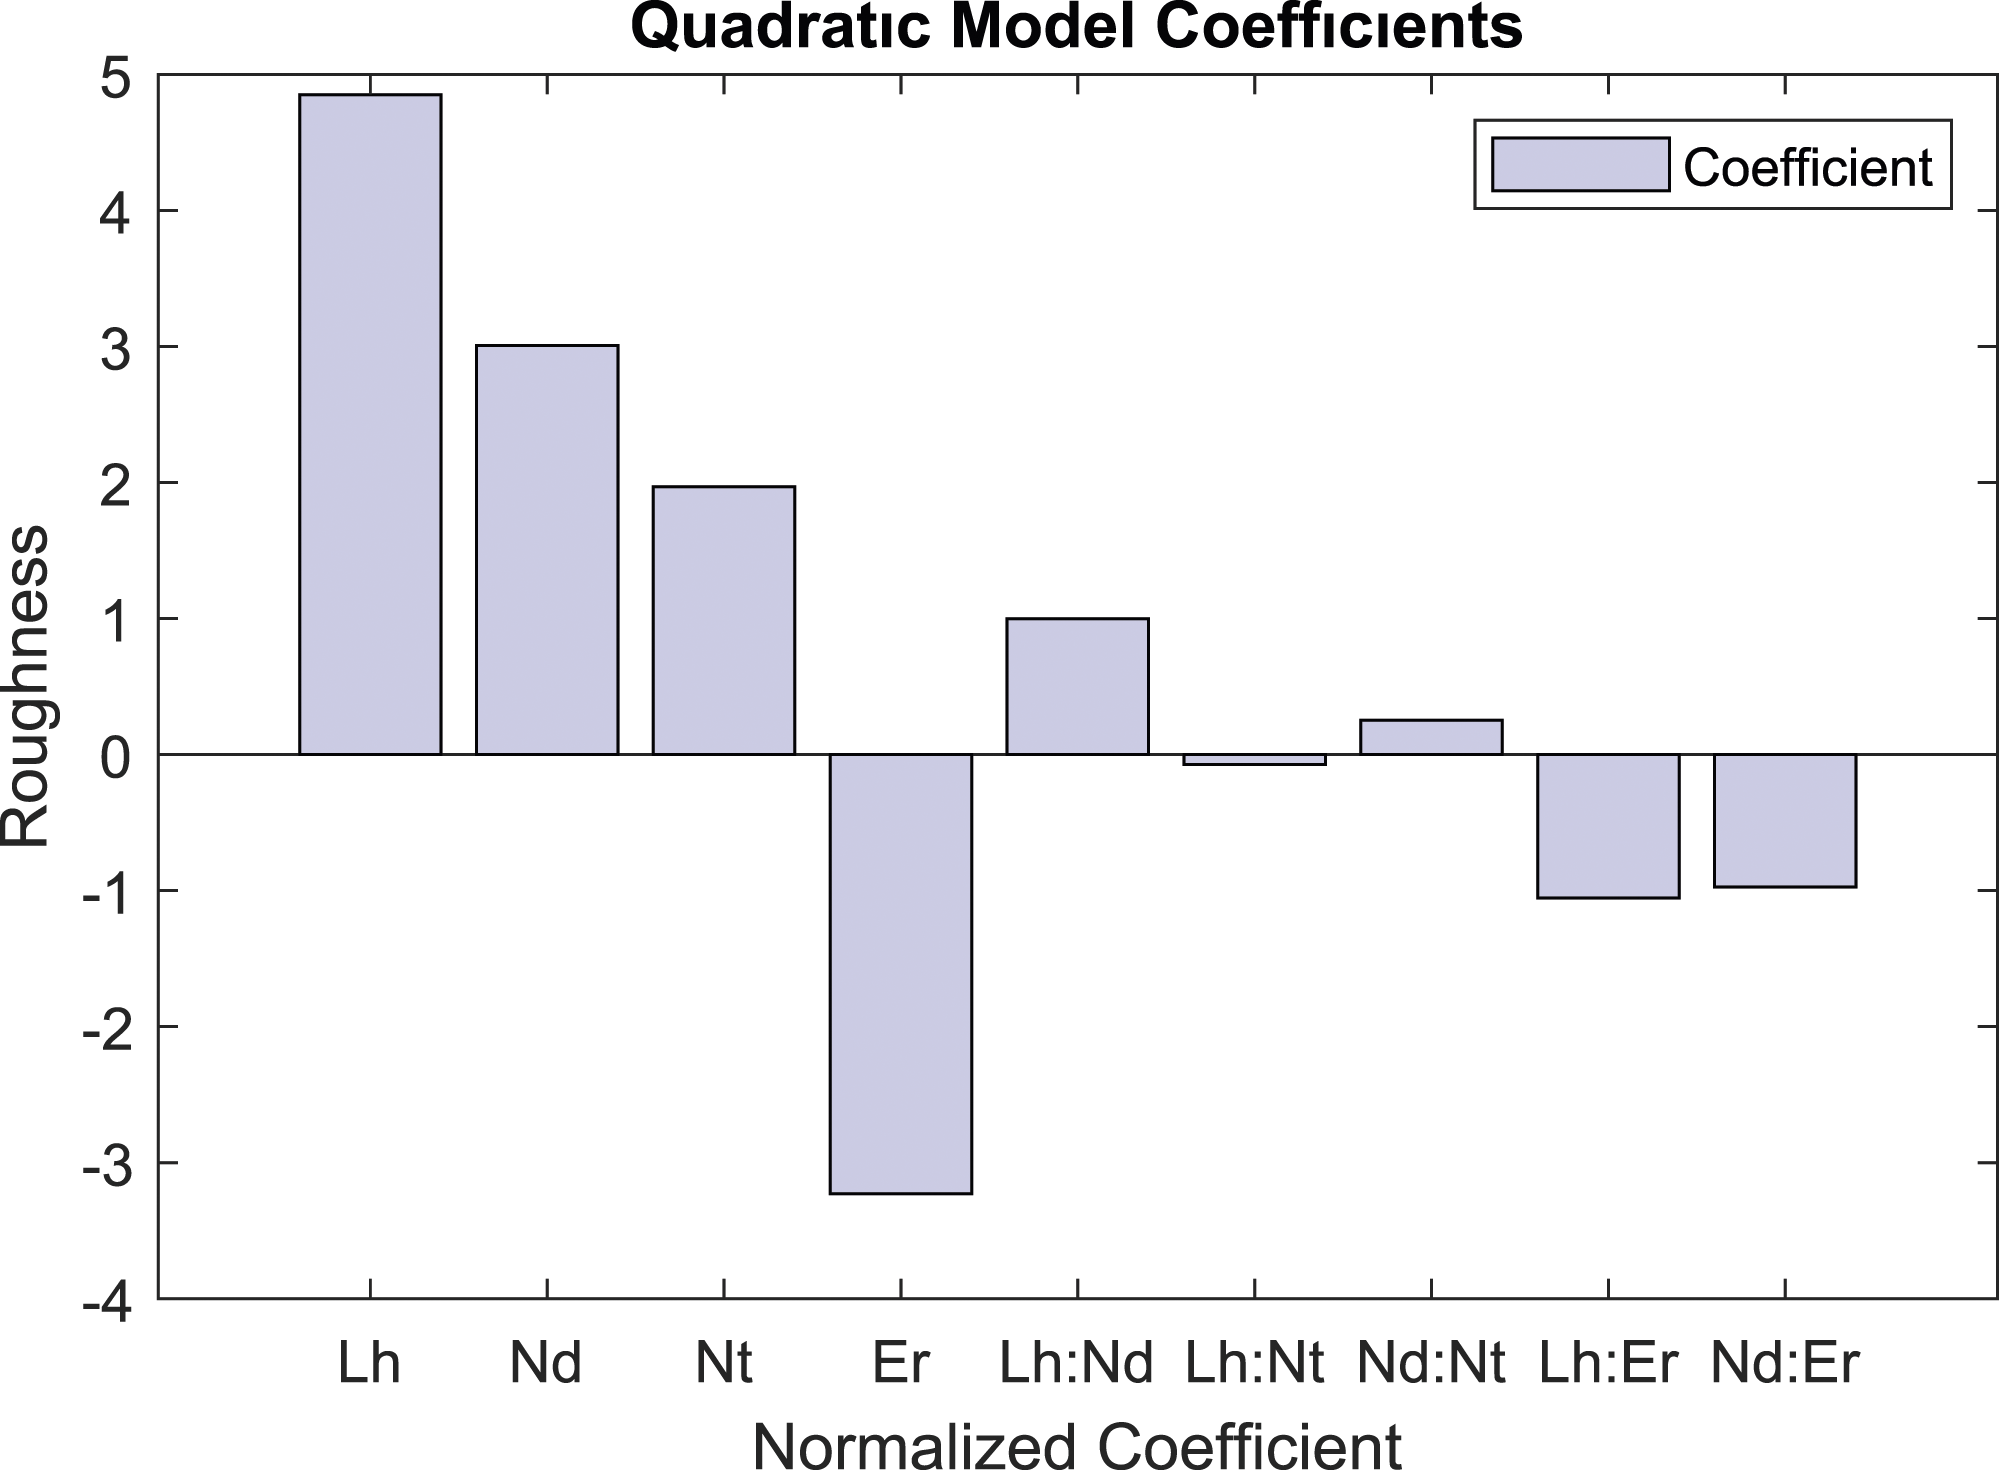
The cross relationships of each parameter in the linear model estimated with RSM are shown in Figure 7. For example, Figure 7, column 2, and row 2 represent the relationship between Correlation matrix of input parameters.
Trained artificial neural network
The data obtained from the experiments designed with BBD can be trained as an artificial neural network (ANN) model using gradient-based algorithms. The limited amount of data poses a disadvantage in this methods. In this study, a performance graph of a network trained with the Levenberg-Marquardt is shown in Figure 8(a). Considering the training performances with test, validation, and training data, it is evident that the model is overfitting. When the model is tested with test data, a regression, as in Figure 8(b) is encountered. Although success may seem apparent, the model’s performance indicates overfitting. Training performance and regression with ANN. (a) The performance graph of a network. (b) Regression results.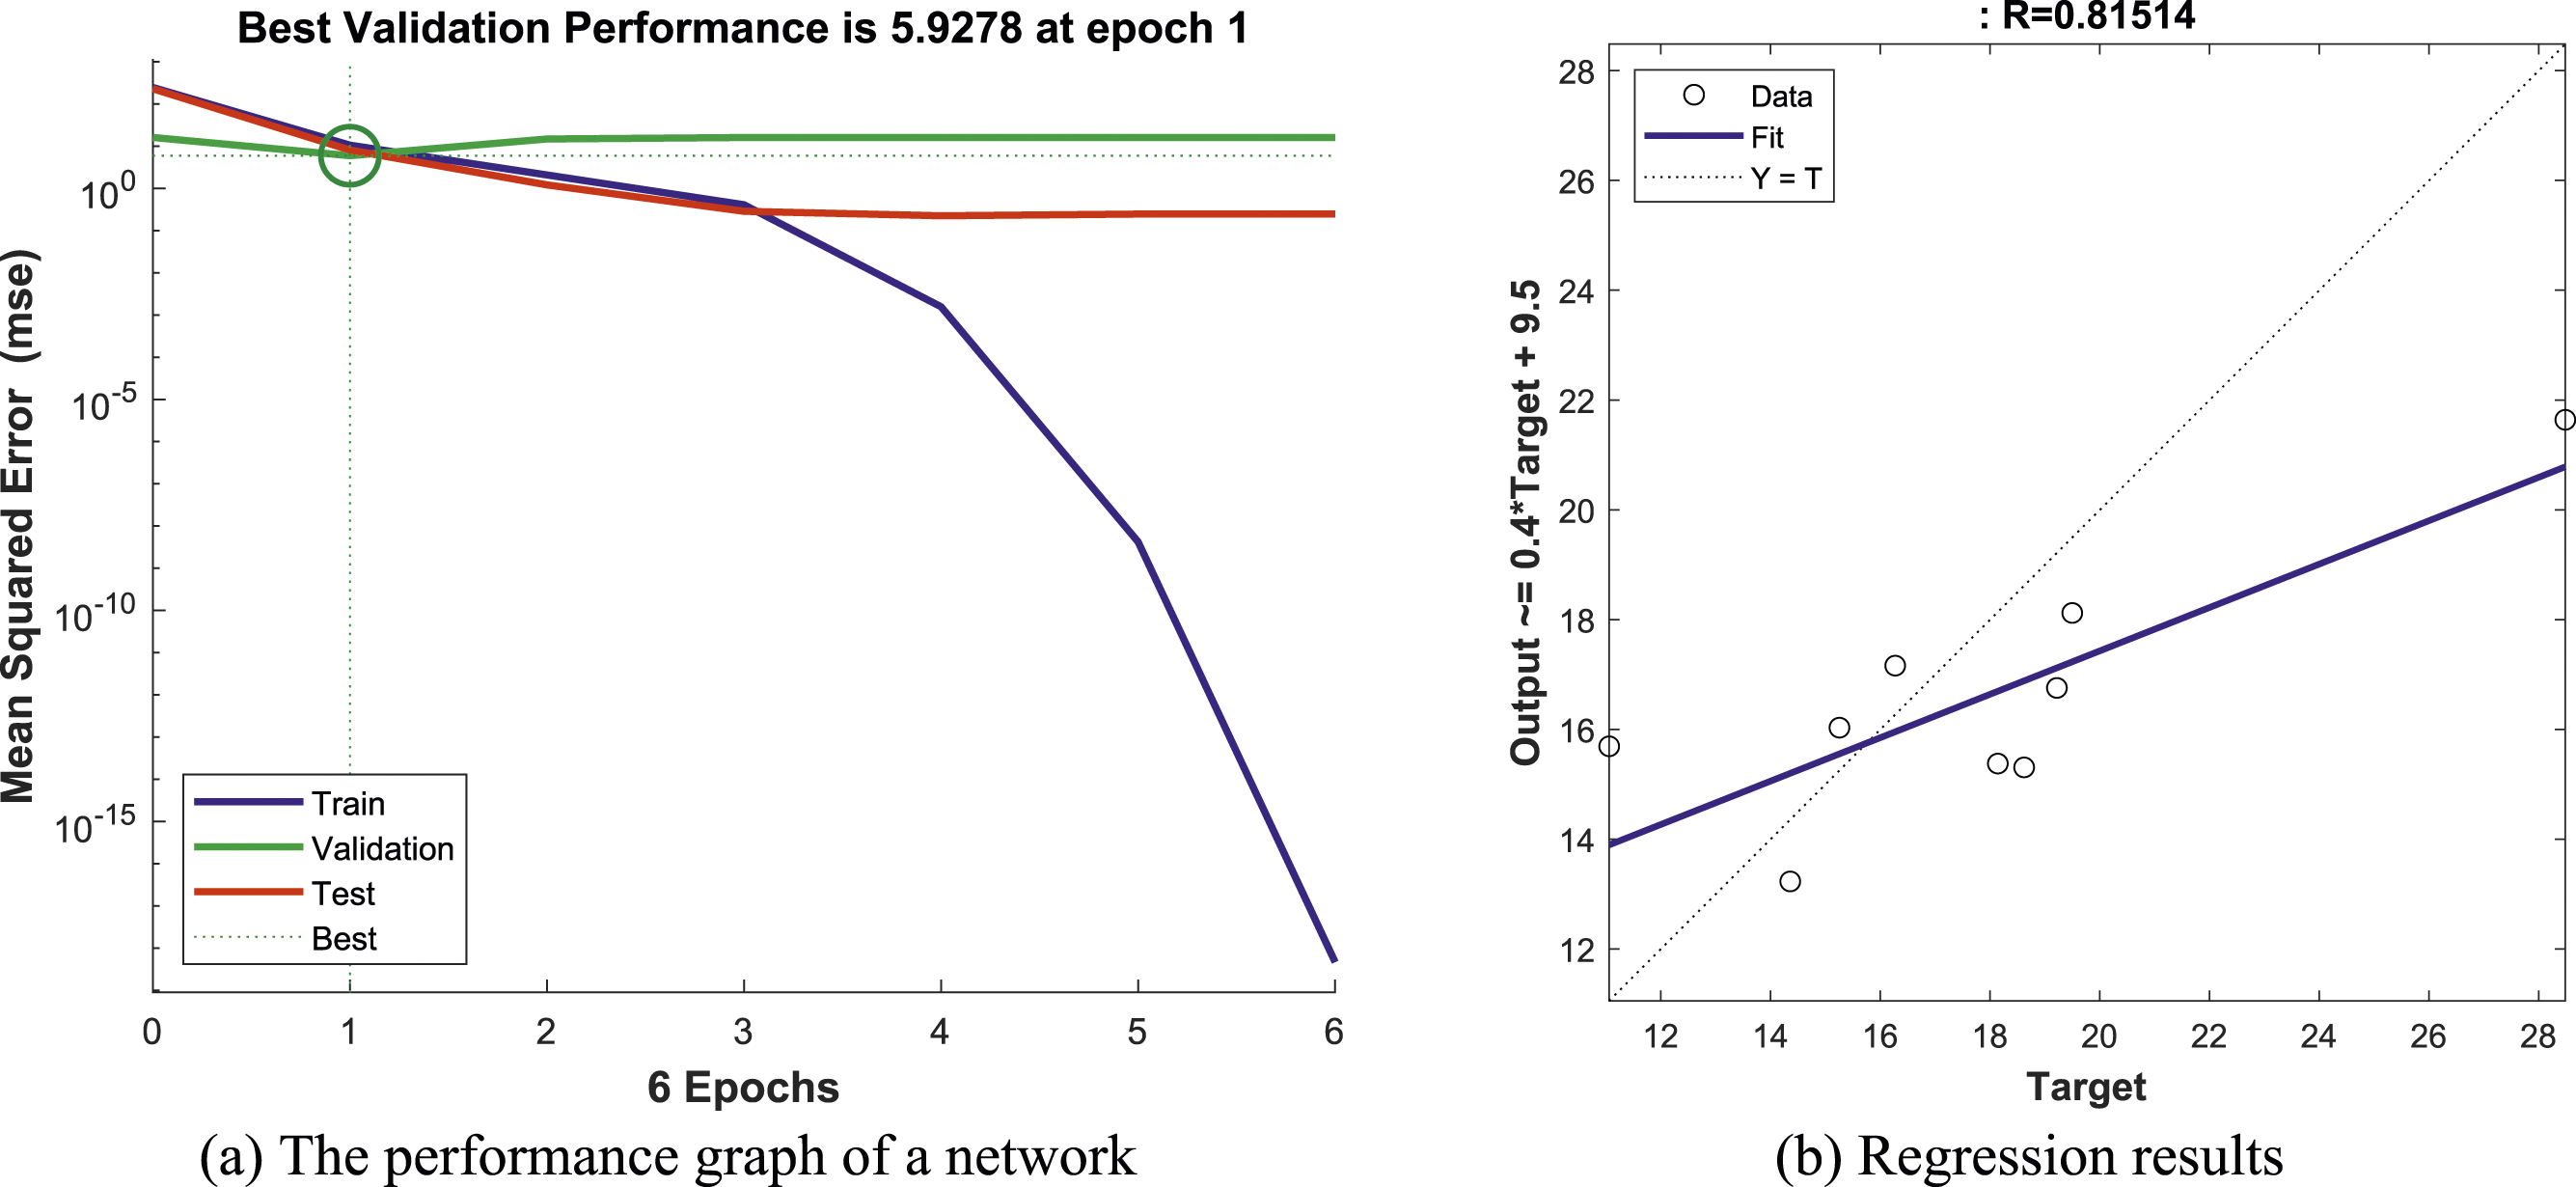
The least absolute shrinkage and selection operator (LASSO), and L1 regularization were applied, and the training was performed, as seen in the performance graph in Figure 9(a), to prevent overfitting. The Lasso method adds a penalty term to the objective function of the model. This term prevents the model from overfitting by shrinking some parameters toward zero. The Lasso model is shown in equation (7). Training performance and regression ANN with L1 regularization. (a) The performance graph of a network. (b) L1 regularization.
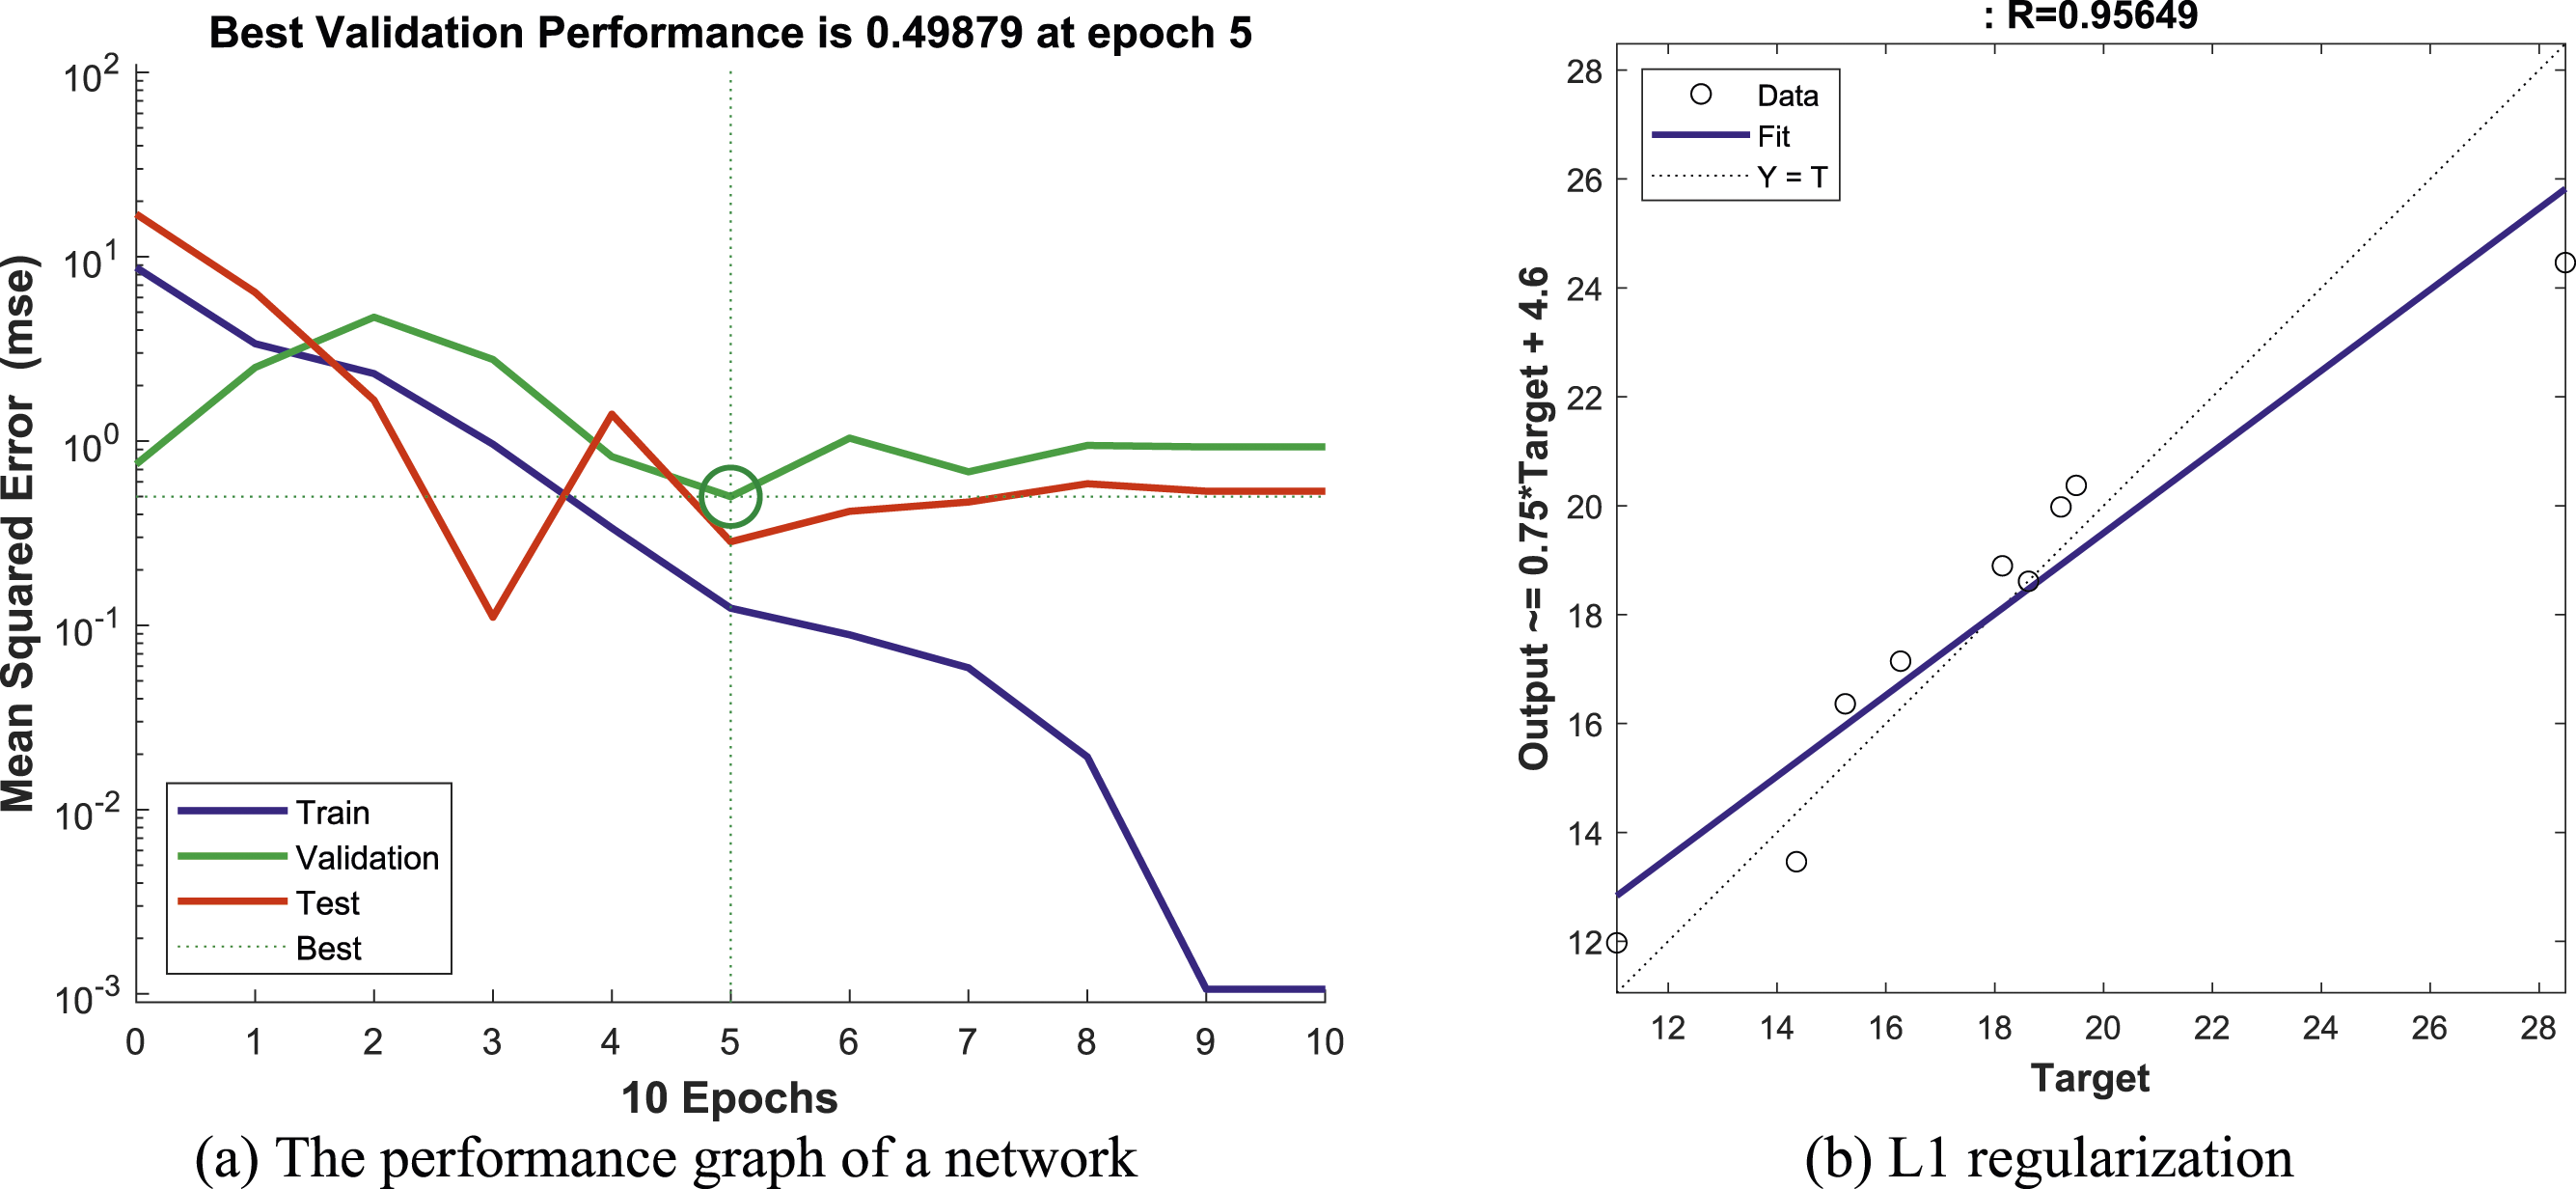
Here, despite having a lower degree, it is still observed that the model is overfitting. Despite the clear success of the regression, the model is overfitting. The limited amount of data within a specific range makes it challenging to use gradient-based algorithms.
Hybrid ANN and PSO algorithm
In this study, when the proposed hybrid training model is executed, it will suggest the optimal model for GA-based PSO (Figure 10). Here, the GA optimization, conducted for a population with 10 generations and 10 individuals, calculated the following values for the feedforward net: three for the number of hidden layers, 1.78 for Optimized PSO training parameters with GA.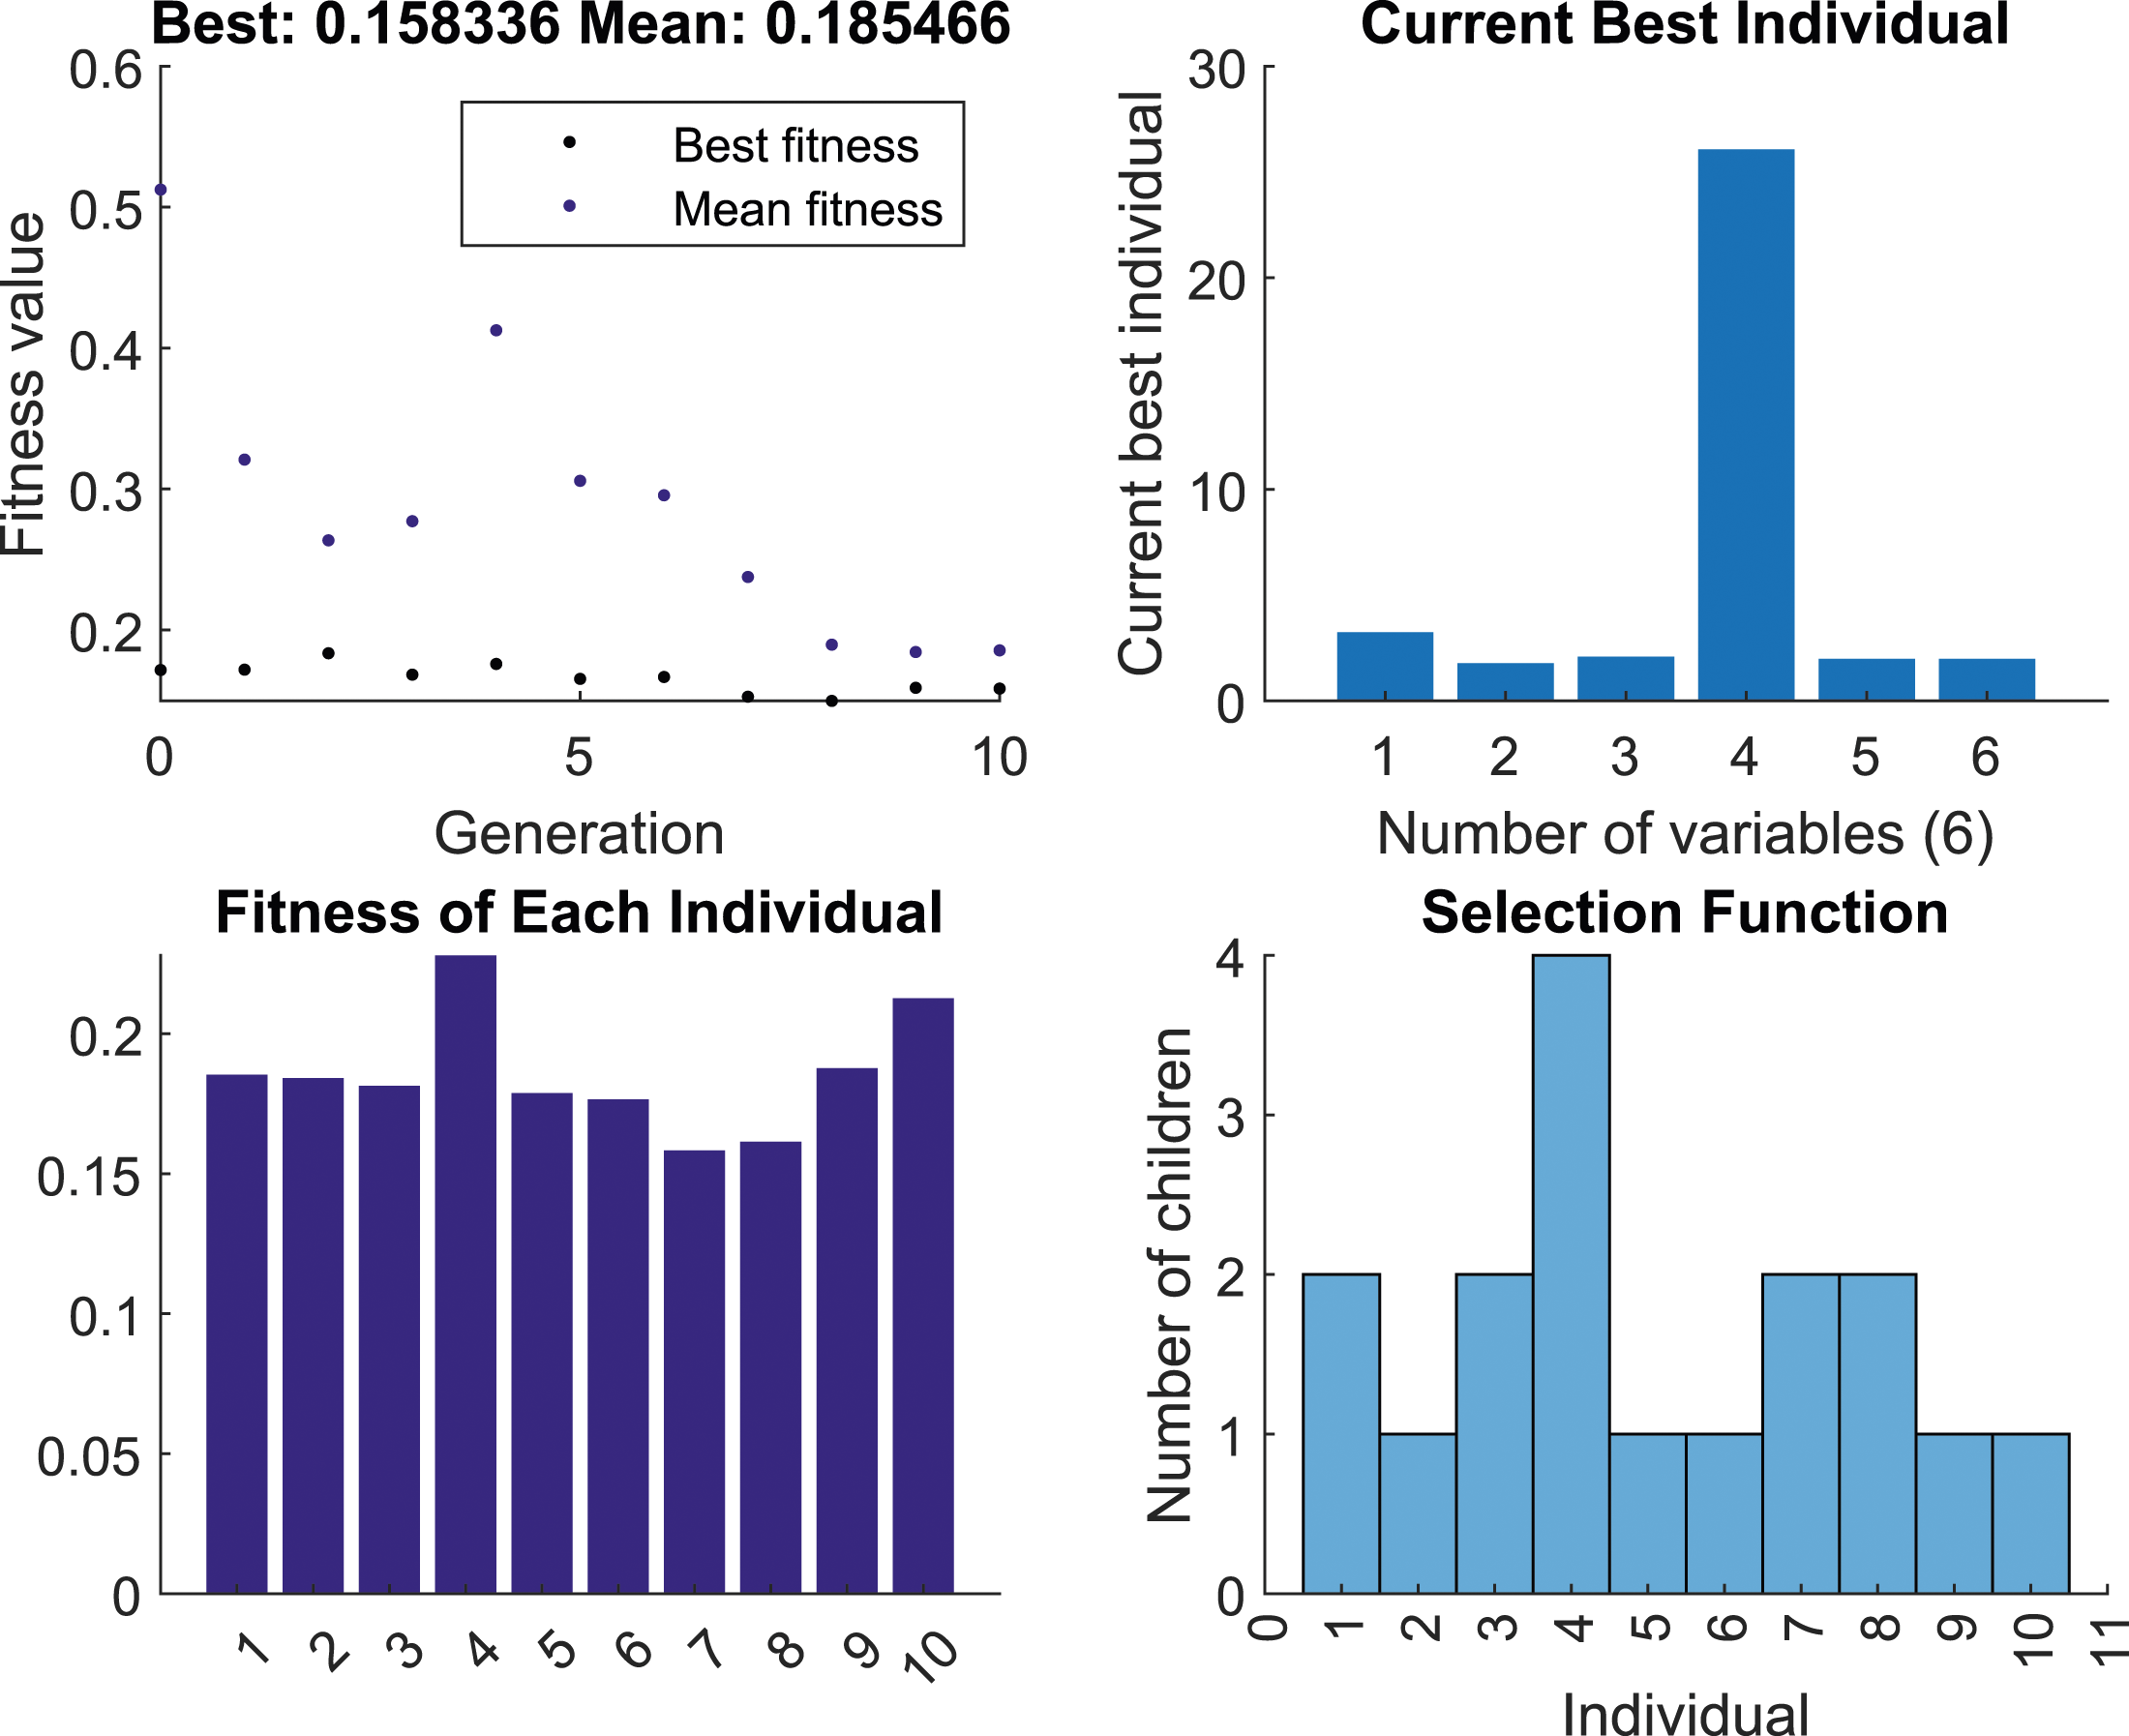
The feedforward neural network (FFNN) model trained with GA optimized PSO, achieved the results presented in Figure 11, using training data collected from experiments designed with the BBD method. It was observed that the trained model exhibited a training error of Regression plot and results on test data using GA-optimized PSO learning FFNN model. (a) Regression plots. (b) Proposed prediction model results. The results obtained from the neural network trained 500 times.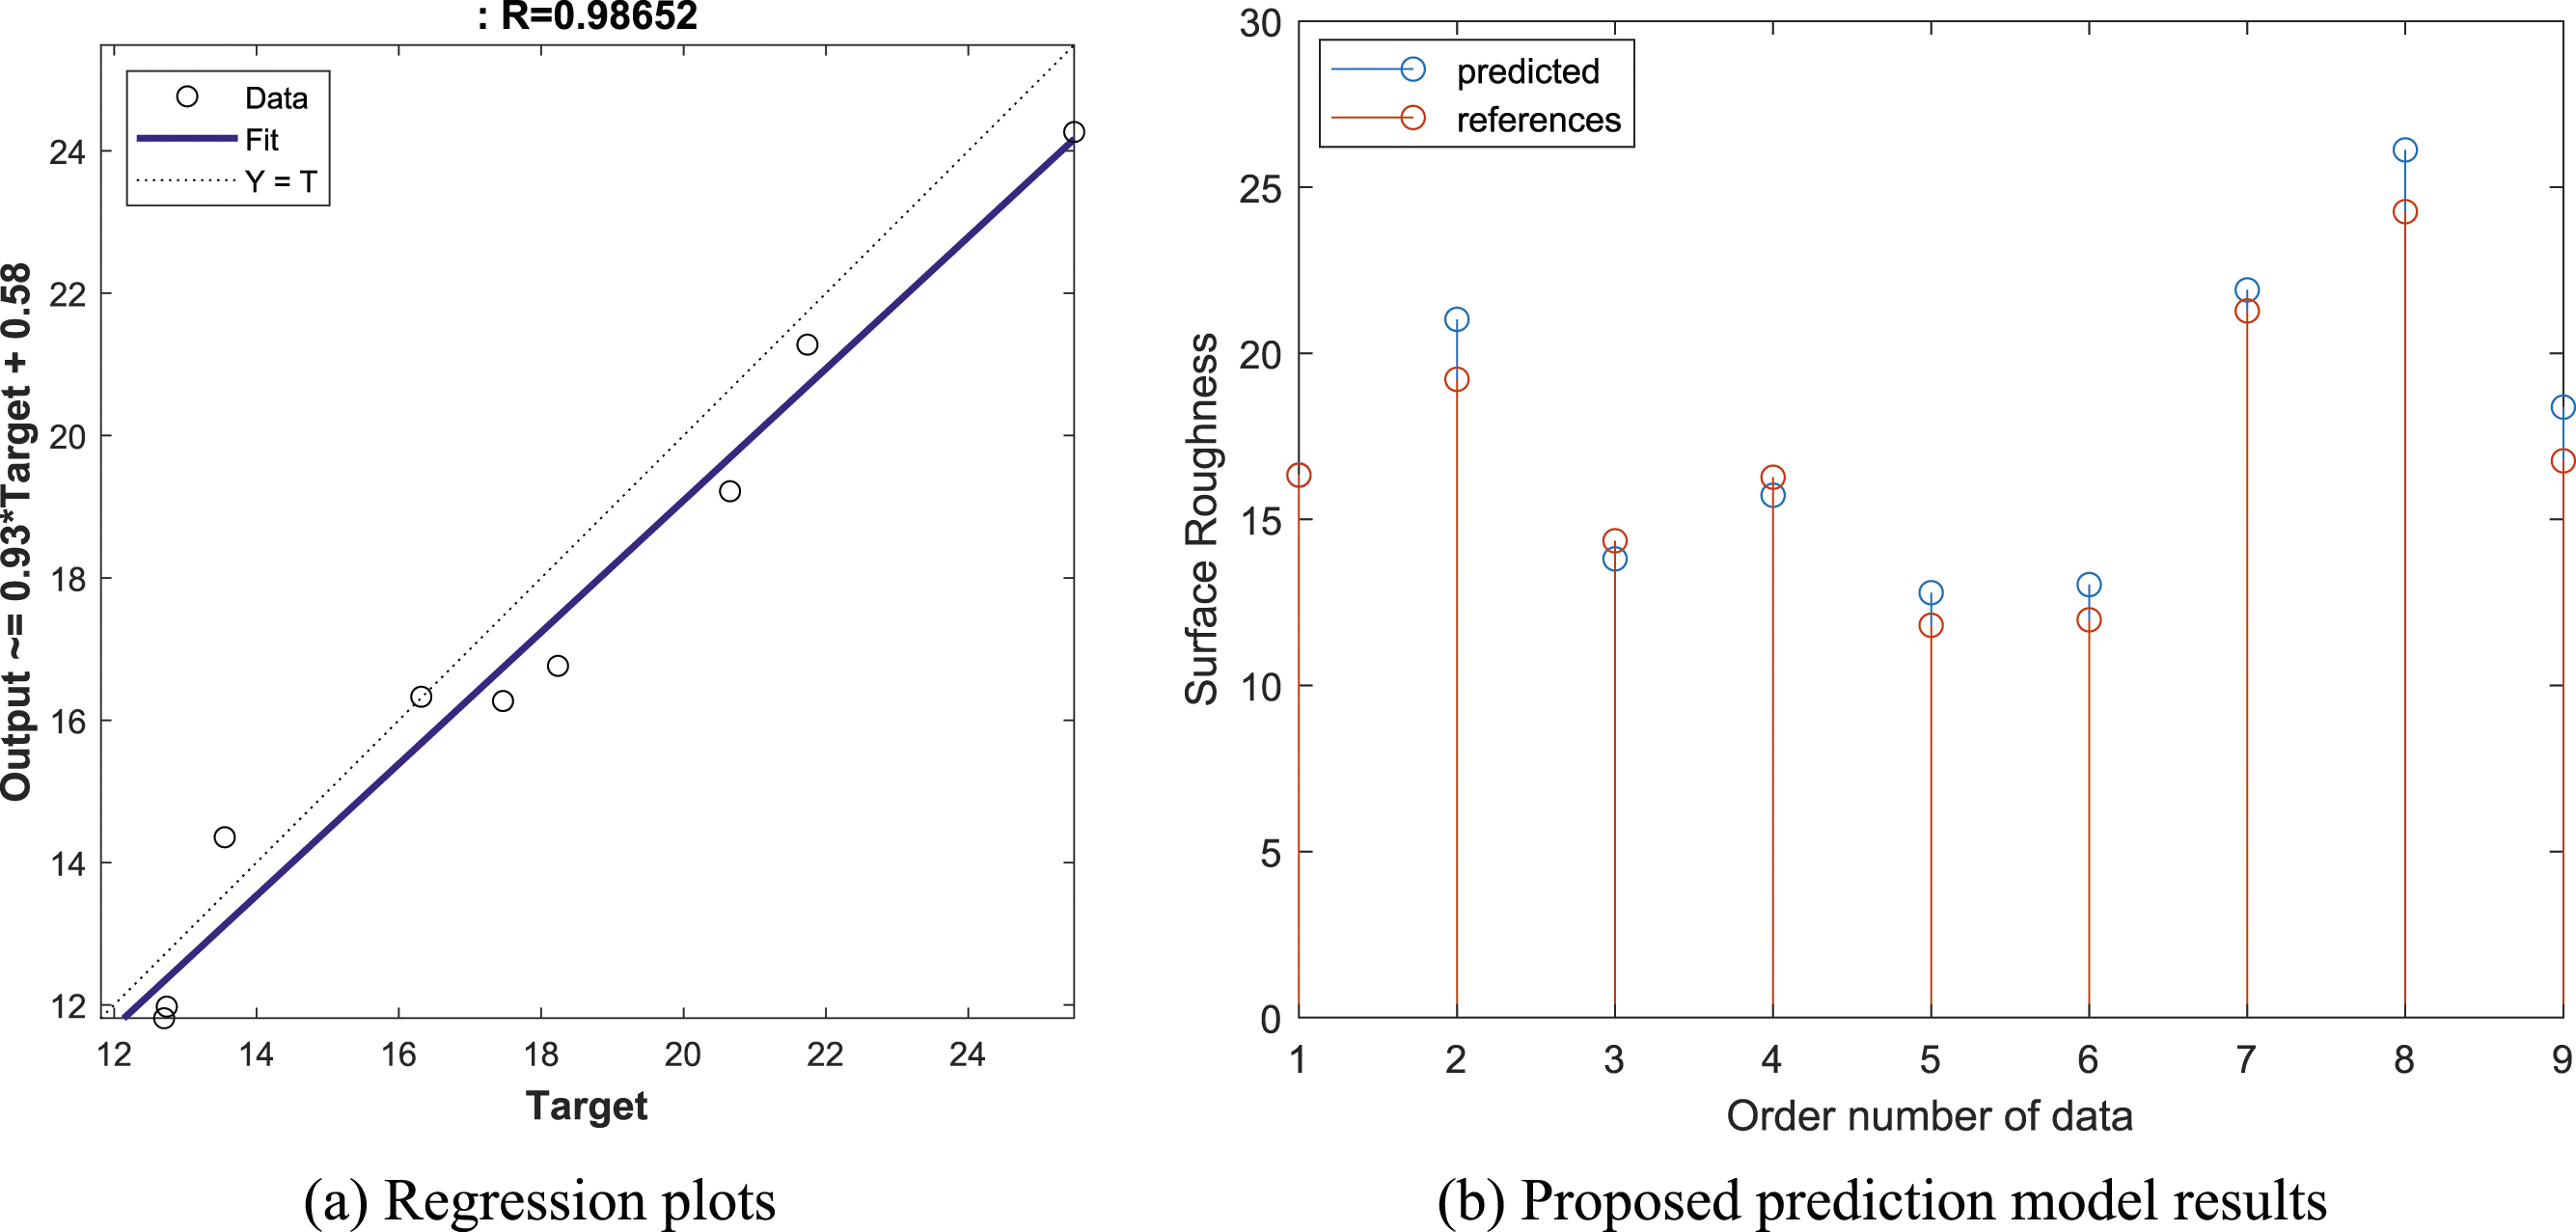
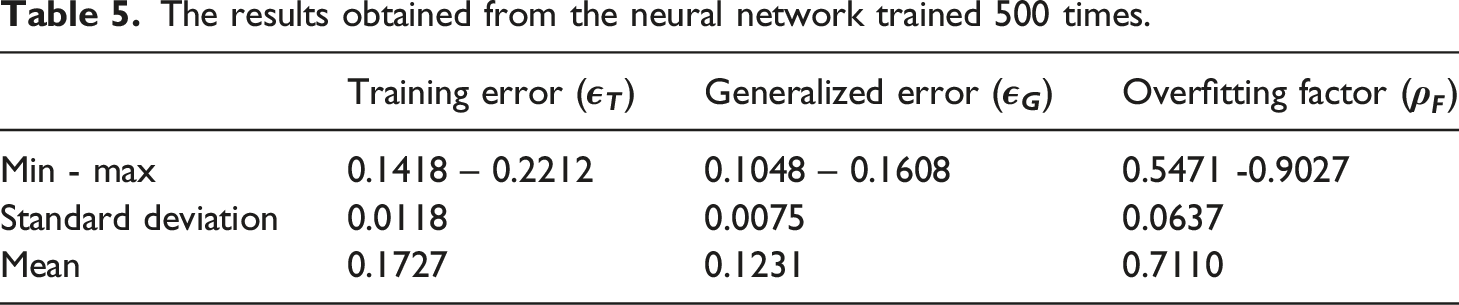
Robel suggested the generalization factor, or
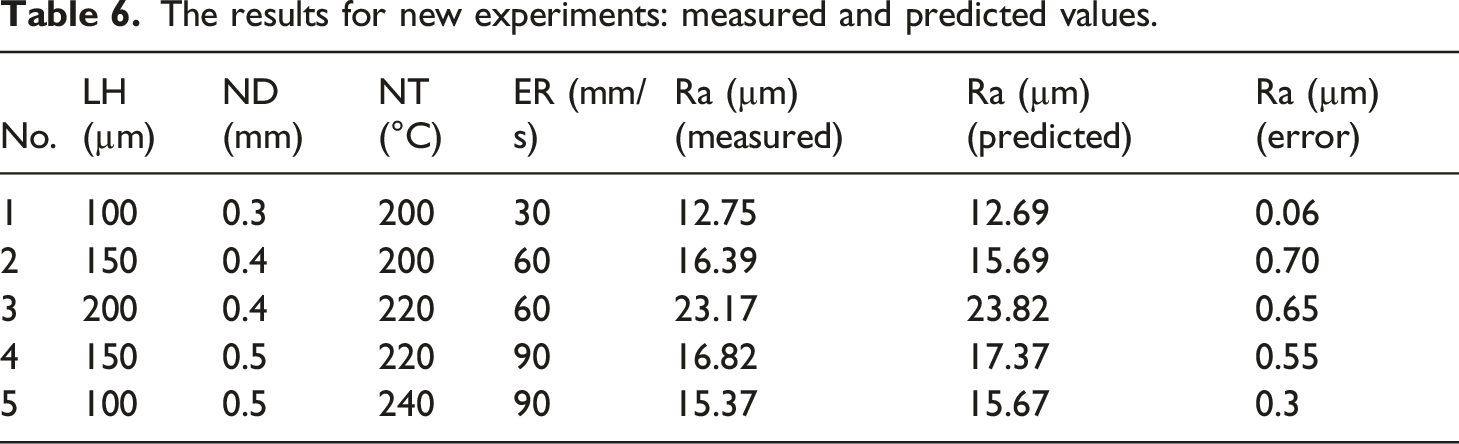
The results for new experiments: measured and predicted values.
Conclusions
An experimental study was conducted on 3D printed intake manifold flanges using acrylonitrile butadiene styrene (ABS) material, varying four process parameters—layer height, nozzle diameter, nozzle temperature, and extrusion rate. The surface roughness correlation between these parameters and the surface roughness of printed ABS parts was explored. Parts were fabricated using fused deposition modeling (FDM) technology, an additive manufacturing method. This study used a GA optimized PSO learning FFNN approach to predict the relationship between surface roughness and printing parameters. A Box-Behnken design (BBD) with four independent printing parameters at three levels was employed, resulting in the fabrication of 25 parts. A regression equation estimated the surface roughness values, and ANOVA identified crucial input factors. The hybrid model demonstrated a coefficient of determination (R2) of 0.9865 on test values, and a mean of root-mean-square-error (RMSE) of 0.1231 after 500 trainings for generalization. The mean of overfitting factor is 0.7110. This means that the suggested system could generalize. The results indicate that suggested hybrid model outperformed ANN in predicting surface roughness values, suggesting that the former is a more suitable method for assessing product quality in terms of surface roughness. In future studies, an experiment could be conducted using it on a real manifold to see if the FDM-fabricated manifold performs as well as the aluminum gasket. In addition, it is obvious that the hybrid model applied to determine surfaces can always be used as a reference in many applications.
Footnotes
Declaration of conflicting interests
The author(s) declared no potential conflicts of interest with respect to the research, authorship, and/or publication of this article.
Funding
The author(s) received no financial support for the research, authorship, and/or publication of this article.