
Abstract
Ongoing research in additive manufacturing towards structural and industrial application has led to the use of commingled roving as a manufacturing feedstock for printing high fiber volume fraction composites. The prospects of using this technology for high performance applications necessitates the need for a comprehensive experimental investigation into the effects of processing parameters on the quality of an additively manufactured composite printed from commingled roving feedstock. In this work, transverse flexure and void fraction matrix pyrolysis testing are both performed to evaluate composite quality. The transverse flexure test is a testing approach that evaluates the quality of the interfacial fiber-matrix bond while the void fraction test estimates the void content in the printed composite. A full observational study consisting of 27 different test combinations is done to investigate the effects of three different process parameters namely, temperature, pressure, and print speed across three different levels. Composite samples were made from commingled roving of E-glass and amorphous PET using an in-house built continuous fiber composite digital manufacturing system. Least squares regression analysis is performed to study the main, interaction and quadratic effects of process parameters. A statistical regression model having an R2 adjusted value of 80.1% is generated from the transverse flexure study, which is used to explain main and interaction effects and also predict performance. Response surface plots are also generated and are used to optimize process parameters which can subsequently be of help in scaling up composite manufacturing. Results show that all three process parameters are highly statistically significant at the 0.01 level of significance. Pressure * Temperature and Pressure * Printspeed are significant interaction terms. Pressure plays a weightier role when print speed is increased or temperature is decreased as it closes more voids that would ordinarily have been introduced because of drop in polymer melt viscosity. Micrographic analysis is also performed.
Keywords
Introduction
Additive manufacturing (3D printing) of continuous fiber reinforced thermoplastic composites is an emerging field, with the potential for use in structural, industrial, and aerospace applications. Various authors have performed comprehensive reviews on the different manufacturing techniques for the creation of thermoplastic polymer matrix composite parts using additive manufacturing.1–4 Common additive approaches currently employed in the manufacture of continuous fiber reinforced composites are based on fused filament fabrication (FFF). This process has seen the most success using short fiber reinforced thermoplastic feedstock or low fiber volume fraction continuous fiber feedstock. The low fiber volume content in these composites, where the matrix and dry fiber are mixed in the extruder, make them unsuitable for many industrial applications. Further, a good proportion of composites using this FFF-based processing technique lack in-situ consolidation, giving rise to the problem of considerable void content.5,6 Some researchers have been able to reduce void content in these printed composites using a secondary post-processing step of compression molding to further consolidate the parts.7,8 To achieve higher fiber volume fractions, researchers have found success using continuous fiber feedstocks that incorporate measured amounts of both the continuous fiber and the matrix material, such as prepreg tapes and commingled yarns. These offer the advantage of making composites with predetermined, consistent and high fiber volume fractions comparable to other conventional manufacturing methods. Examples of processes utilizing prepregs are Automatic Tape Layup (ATL) and Automatic Fiber Placement (AFP). Automatic Tape Laying process usually uses wider tapes of up to 304.8 mm (12 in), whereas Automatic Fiber Placement utilizes narrower tapes usually between 6.35 mm (0.25 in) and 25.4 mm (1 in).
9
These prepregs are processed through a heated zone and then deposited along a numerically controlled toolpath, with the aid of a roller for consolidation. Commingled yarn works similar to prepreg tapes but are not prepregs themselves as the matrix component is yet to be pre-impregnated. A major advantage it has over pre-impregnated tape is the ability to steer at very tight radii. Warlick et al.
10
showed that using commingled fibers, acute steering could be achieved. Commingled yarns are a blended mix of reinforcing fibers and thermoplastic fibers spun together with both fibers well-distributed to form a coherent hybrid tow with a depiction of a cross section portrayed in Figure 1(a). (a) Cross-section of commingled tow, (b) image of commingled tow.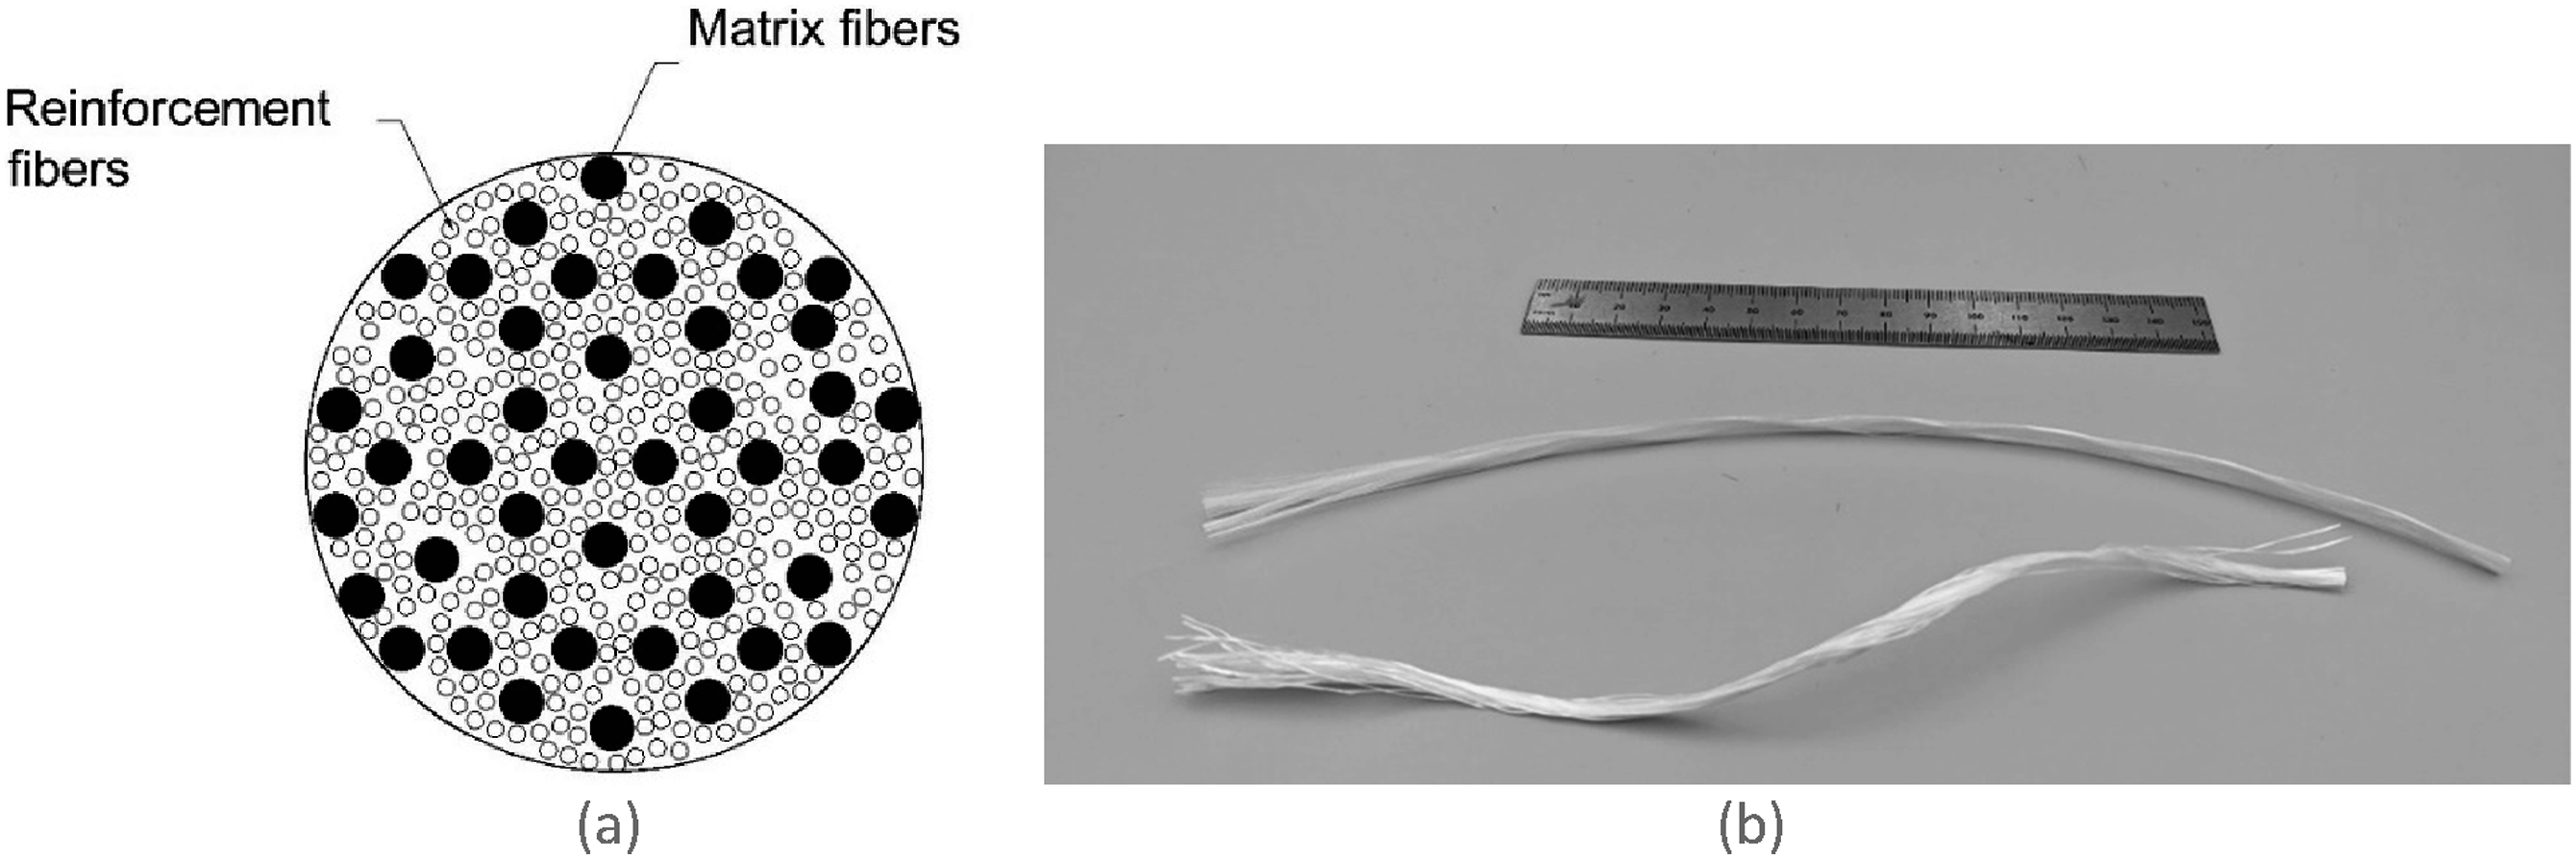
They look like dry reinforcement fibers but have fibers of thermoplastic material intermingled within. When this yarn gets heat processed, the matrix fibers melt and need only to flow a short distance to surround the reinforcement fibers, thereby creating a fully wetout composite. This reduced impregnation distance, makes commingled yarn quite different to other in-situ fusion approaches which typically requires the use of an intermediate processing stage where separate spools of dry fiber and thermoplastic filament are needed to be heated and combined together4,11 during the print process before the composite can be deposited. Commingled yarn, woven into fabrics and preforms, first gained popularity in compression molding applications as they enhanced the manufacturability of thermoplastic composites through improved melt flow and drapability. 12 Polymer melt impregnation is improved when commingled preforms are used because resin only needs to travel a reduced distance in a commingled tow. Some authors13,14 have reported resin mass transfer flow distances ranging from 20 to 100 µm in commingled materials. Warlick and Radford 10 were able to employ a commercially available 3d printing end effector with a custom nozzle to process commingled yarn in curved paths on a rotating mandrel, consistent with filament winding. Vaneker 15 also demonstrated the use of commingled yarns in a fused filament fabrication setup. Commingled yarns are rope-like and are unsuited to being pushed through an extruder. Vaneker first pre-processed the rope-like commingled tow through a pultrusion die to form rigid rod like filaments that could easily be fed by an extruder into a heated end effector. Vaneker’s technique had no post-impregnation fiber bed consolidation step and resulted in composites with void fractions up to 20%. Zhuo et al. 16 also used a pre-processing step of converting the commingled yarn to rigid rod like filaments, but they repeated the pre-process step three times and added a final post-processing step which consisted of vacuum bagging the printed composite parts, placing them in a high temperature oven to improve consolidation and reduce void content. Eichenhofer et al. 17 demonstrated the ability to make lattice structures with the ability to print in the z-direction without the need for a mold support. They performed this in-air printing with a robotic arm by control of the commingled extrudate temperature and manipulating the end effector to take advantage of the extrudate’s high viscosity which enables it to have some degree of rigidity without being in contact with a mold. Bourgeois and Radford 18 were able to demonstrate the manufacture of a sandwich panel with a core structure using commingled yarn with reduced tooling. The facesheets and core were manufactured by a processing technique that employed controlled air cooling, and 3D printed “scaffolds” to make the sandwich structure. All these previous efforts demonstrated the potential of using commingled yarns as feed material for producing high fiber volume fraction continuous fiber reinforced composites.
An understanding of the effects of different manufacturing process parameters is crucial to improve the quality of parts made using continuous reinforcing fibers and direct digital manufacture. This work builds upon that by Rodriguez and Radford 19 which explored the effect of just one process parameter, namely print speed, on the quality of composites additively manufactured from commingled yarn. Composite quality is evaluated in this current effort using transverse flexure testing and constituent fraction testing. Further, statistical analysis is used to explain process effects, their significance as well as their interactions. Statistical modeling has been used by engineers to study and optimize process parameters, and a huge wealth of technical resources exist that demonstrate the use of statistical modeling to filter and analyze process effects with the goal of improving yield. Ye et al.20,21 used transverse flexure testing to study the consolidation quality of thermoplastic composites made from commingled yarn. Bernhadsson and Shishoo 14 used statistical analysis to optimize process parameters for compression molding of composites made from commingled E-glass/polypropylene. Ramasamy et al. 22 performed a full factorial statistical analysis to study the influence of consolidation on void content and on the mechanical properties of laminates made from commingled fabric. Kam et al. 23 used a different statistical tool called the Taguchi method to investigate the effect of process parameters on properties of PA12 samples made via fused filament fabrication.
Since, additive manufacturing with commingled yarn has already been demonstrated as a manufacturing technique to generate high fiber volume, low void fraction composites, 19 the motivation behind this current effort is to take a manufacturing approach that has been shown to work and investigate the effects and inter-relationship of various process parameters involved in material processing. Bernhadsson and Shishoo 14 had already looked at process parameters for using commingled fabric in a compression mold configuration. In the current work, statistical modeling is used to study the effects of three different process parameters encountered in a continuous fiber direct digital manufacturing approach using a glass fiber/PET commingled feedstock. Thus, the goal of this article is to investigate the combined effect of multiple process parameters used in the preparation of high volume fraction, continuous fiber reinforced composite produced from commingled yarn using direct digital manufacturing.
Experimentation
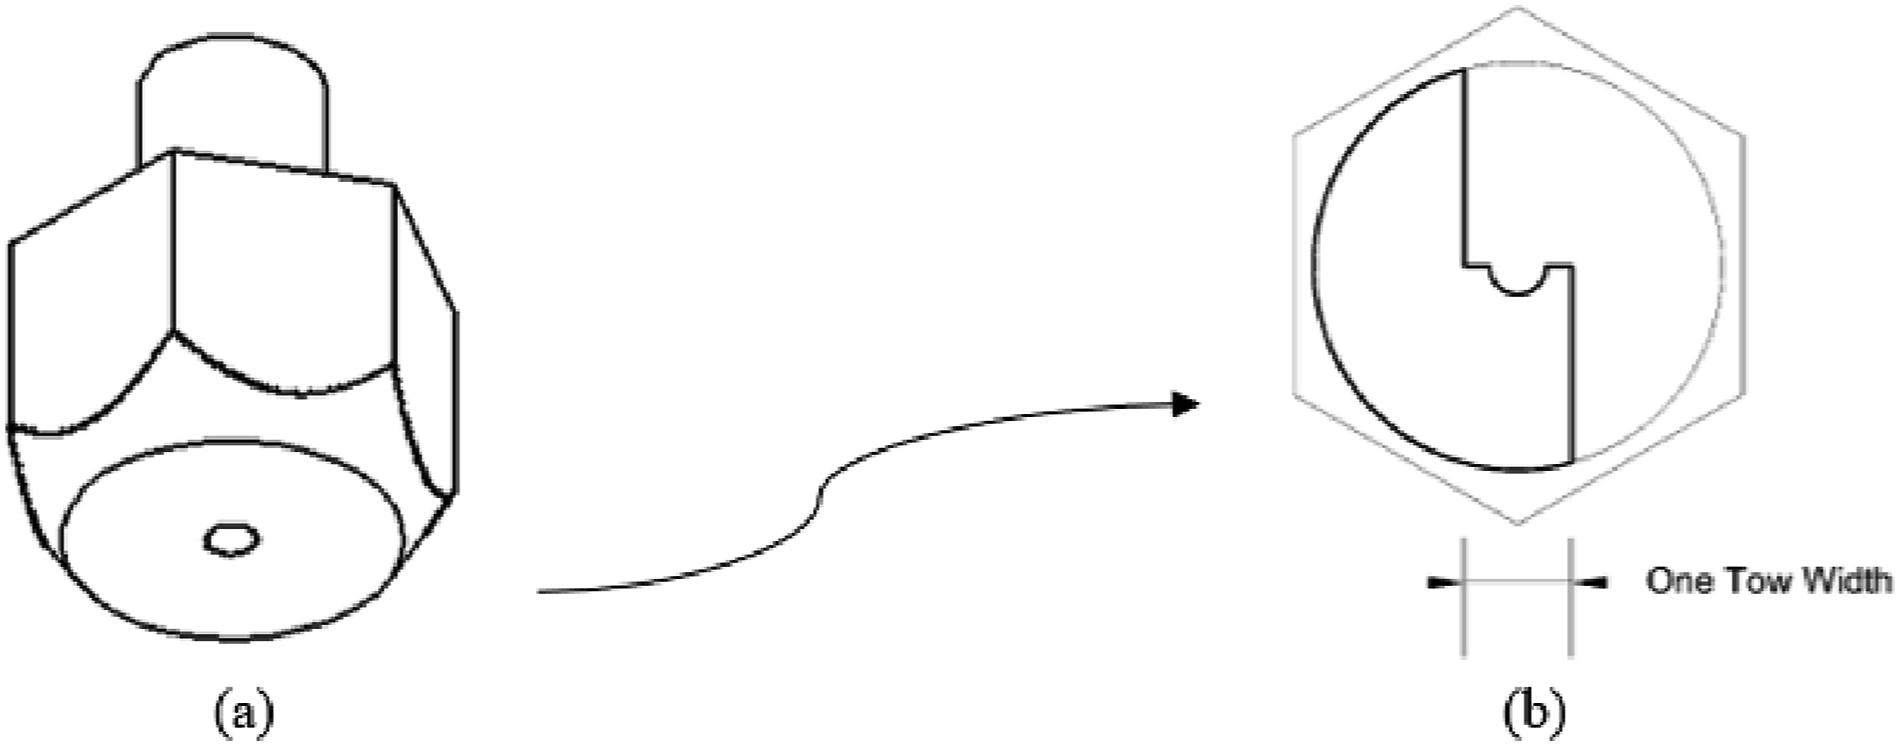
Test matrix.
Material
Commingled E-glass/PET from Fiber Glass Industries Twintex RPET70N184 with a tex of 2690 was used. It consists of continuous strands of both e-glass and amorphous PET. E-glass makes up 70% of the material by weight while PET makes up 30% of the material by weight. This is equivalent to a fiber volume fraction of 53.1% using manufacturer supplied density values. The glass transition temperature of the material, determined through differential scanning calorimetry, shows a midpoint Tg value of 75.7°C.
Equipment
The equipment used in manufacturing the test samples was an in-house built 3D printer which uses a highly modified form of the commercially available E3D extruder. An advantage this end effector has over other 3D printing techniques using commingled yarn, demonstrated by Vaneker and Zhuo, is that the pre-processing stage, where the commingled yarn has to first be thermally converted to a stiff rod-like filament that an extruder motor gears can push, is by-passed. In this work, the commingled yarn, in its rope-like form, is pulled through the end effector heat zone and exits through a specially made nozzle onto a print bed. A broad, flat-faced nozzle is attached to the hot-end which serves the dual purpose of first collimating the commingled tow in the nozzle and second, applying consolidation force on the deposited layer of material as it flows under the flat face. The manufacturing process used by this printer is more closely aligned with pultrusion than the extrusion method commonly encountered in FFF. This is because the feedstock is pulled through the heated zone and nozzle, and the deposition is driven by adhesion between the previously deposited material and the build plate, and friction between the commingled material and the nozzle.
24
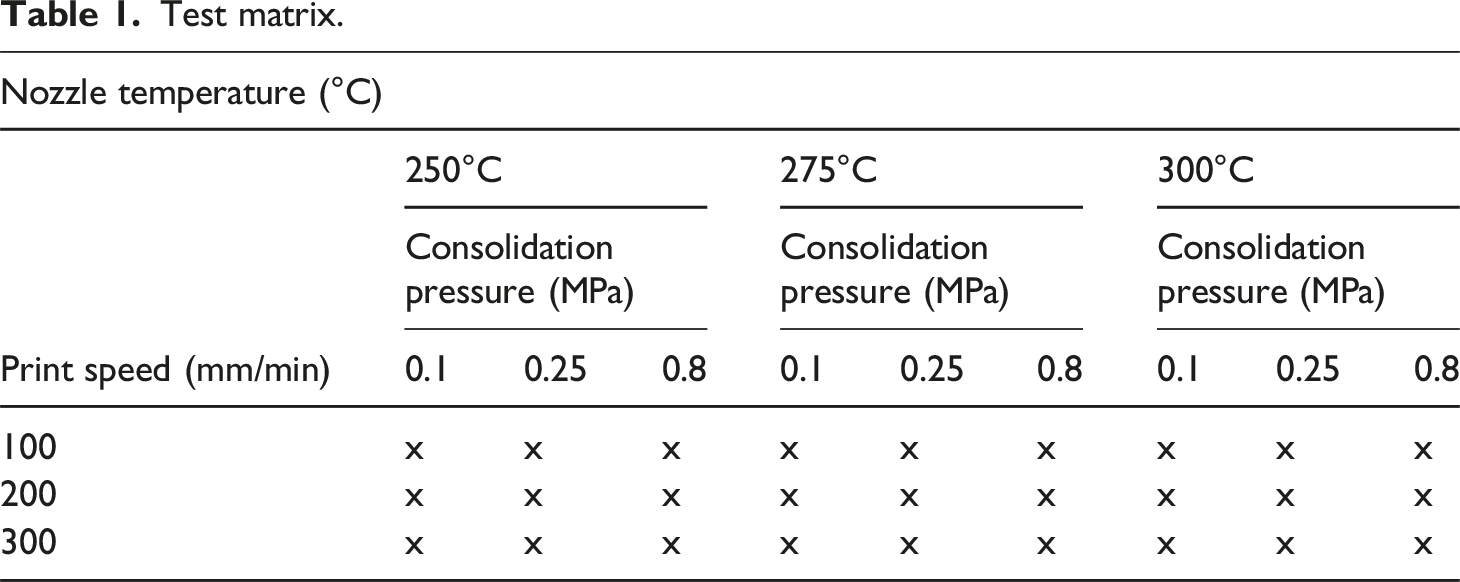
A schematic of the end effector used is shown in Figure 2(a) and it highlights the length of the heated zone, which is 11.5 mm. An actual image of the end effector type used in this work is shown in Figure 2(b). (a) Schematic end effector (b) end effector used in custom built printer.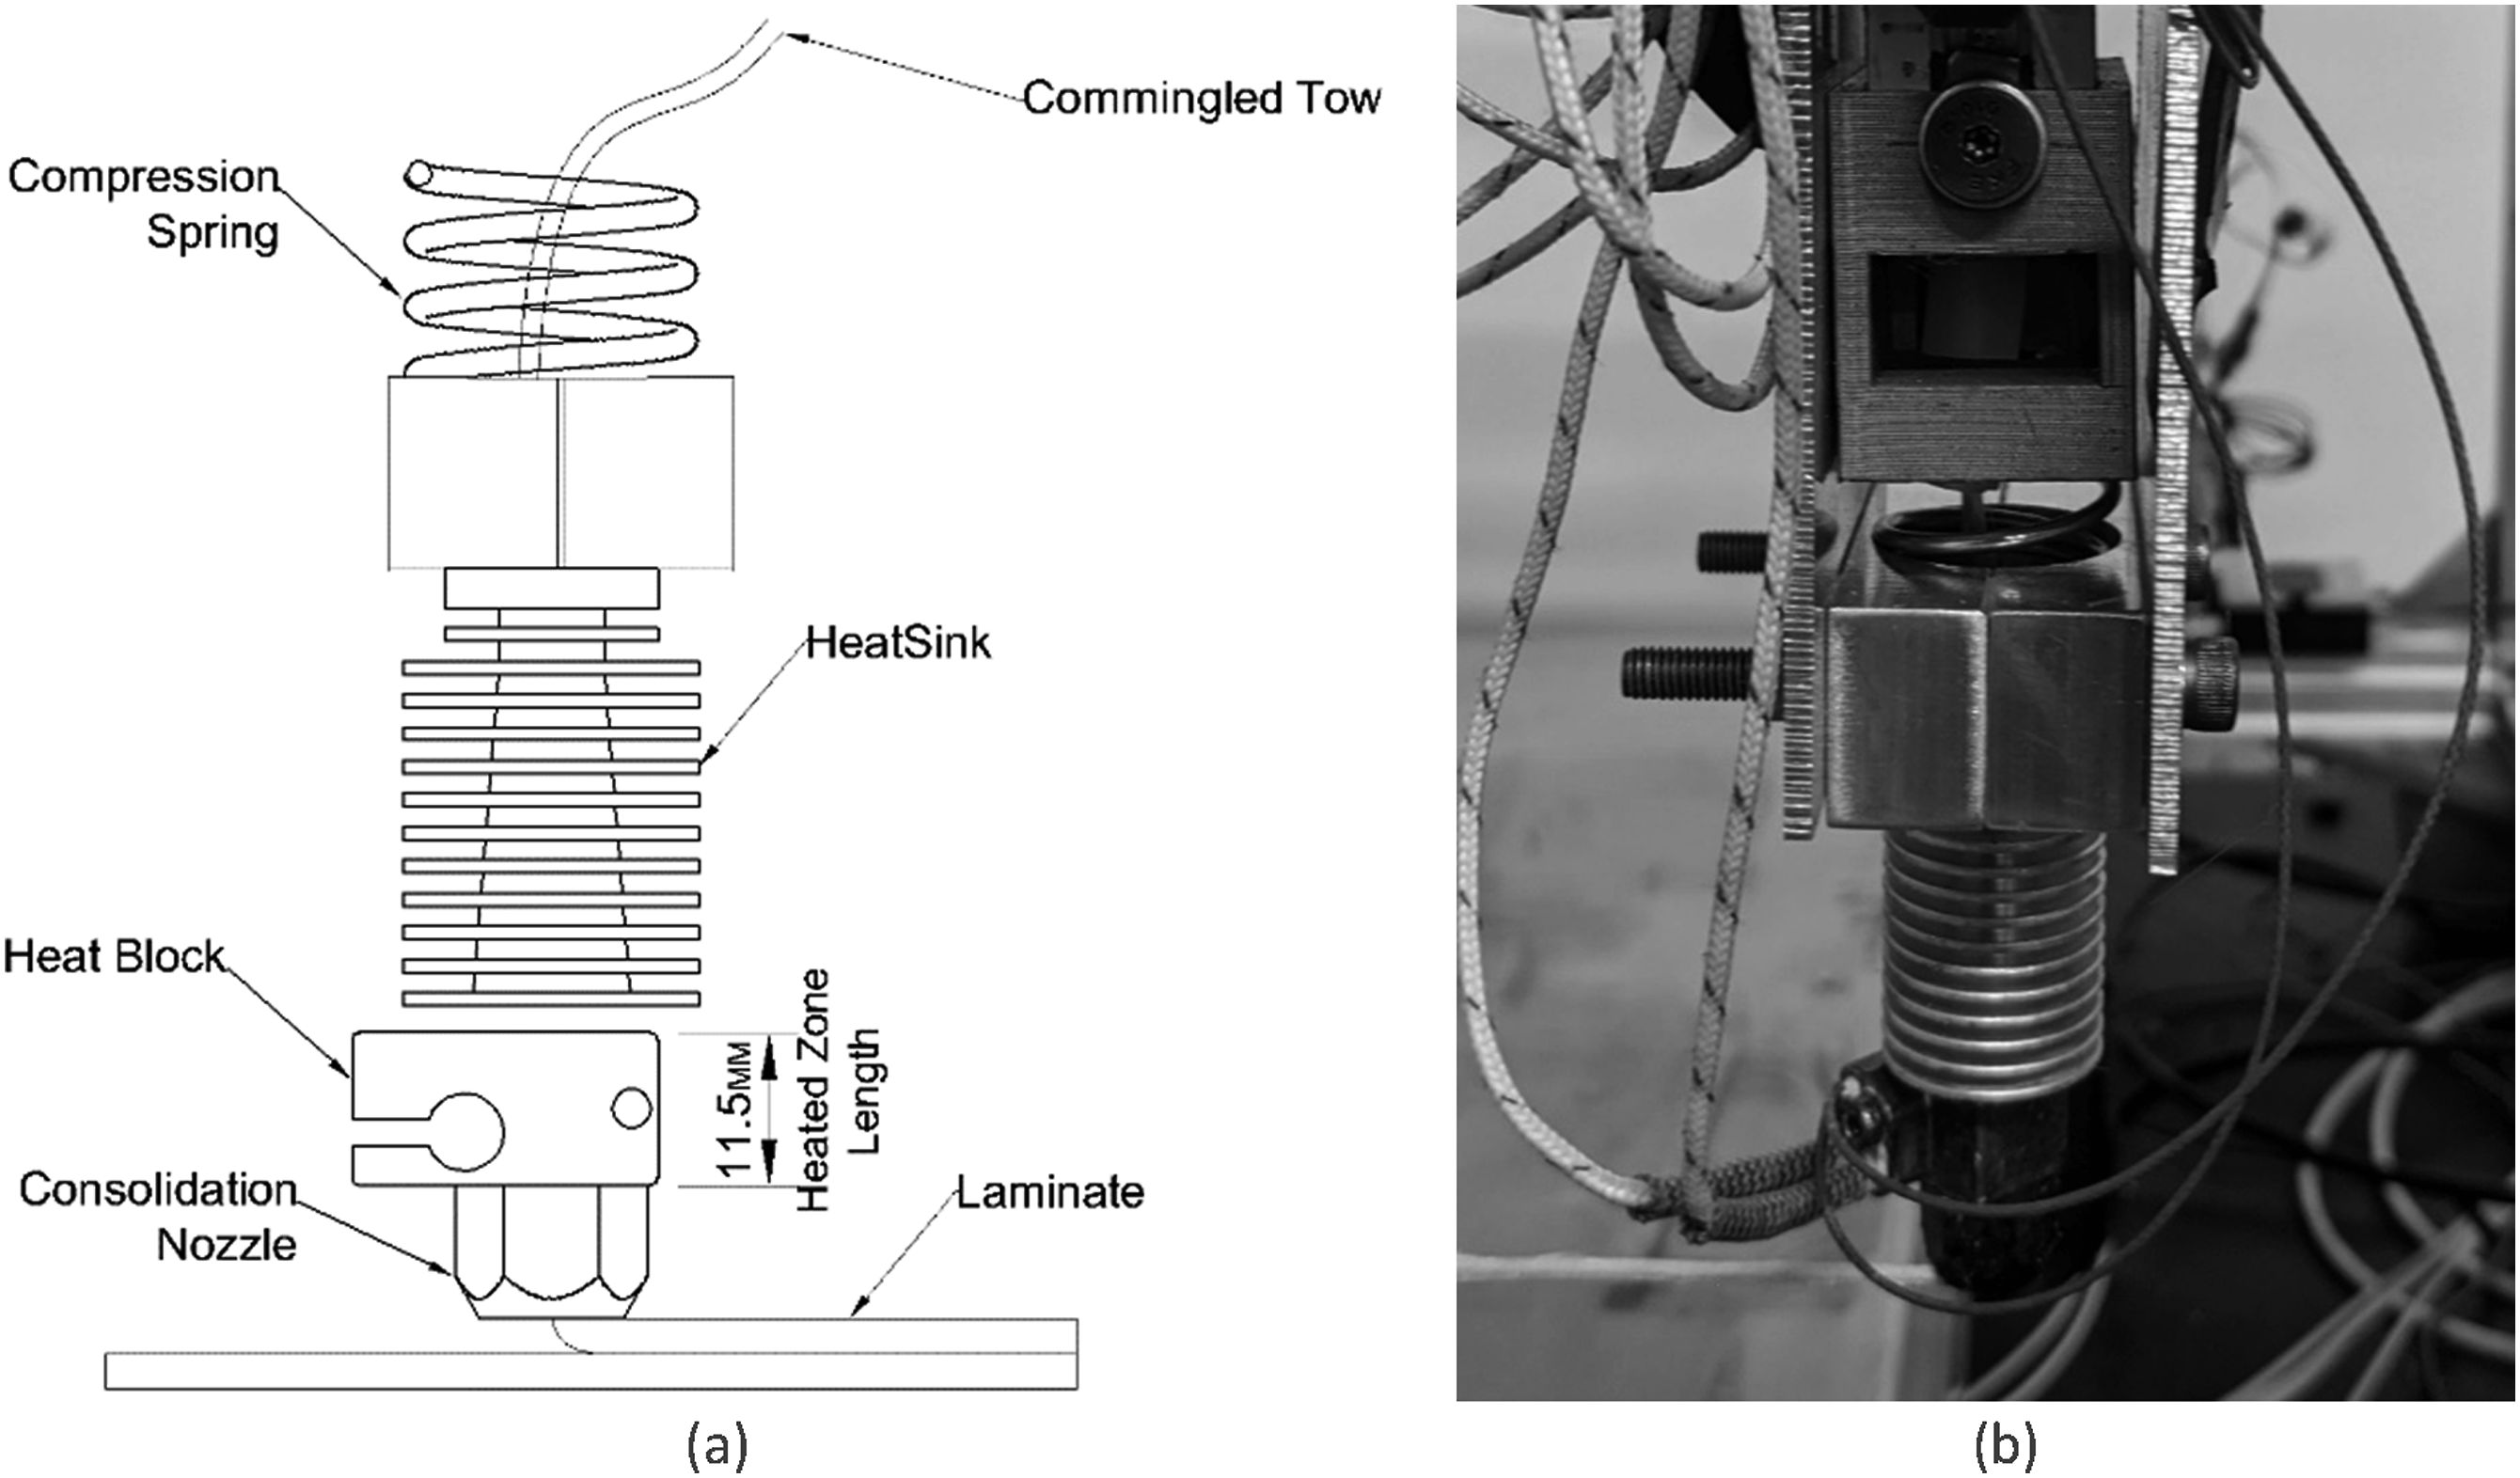
A more complete description of the in-house built composites printer and processing approach is provided in previous work.19,25 The key attributes of the system are a compression spring loaded end effector with a specialized nozzle to provide consolidation. The compression spring stiffness used on the end effector is about 7.5 N/mm. This enables a programmable consolidation force to be exerted on the deposited tow by changing the z-height in the print path. The specialized nozzle that sits on the end effector is flat faced with an outer diameter of 11.5 mm permitting the application of consolidation force to the tow at the point of deposition. The nozzle also has an inner nominal diameter of 1.4 mm where the commingled yarn passes through. Load cells are configured underneath the print bed to simultaneously record consolidation force. To initiate a print, about 10–20 mm of commingled material has to first be pulled through the nozzle and manually tacked down to the build plate. This gives enough adhesion force to allow continuous deposition of material as the gantry moves along a programmed path.
Test matrix
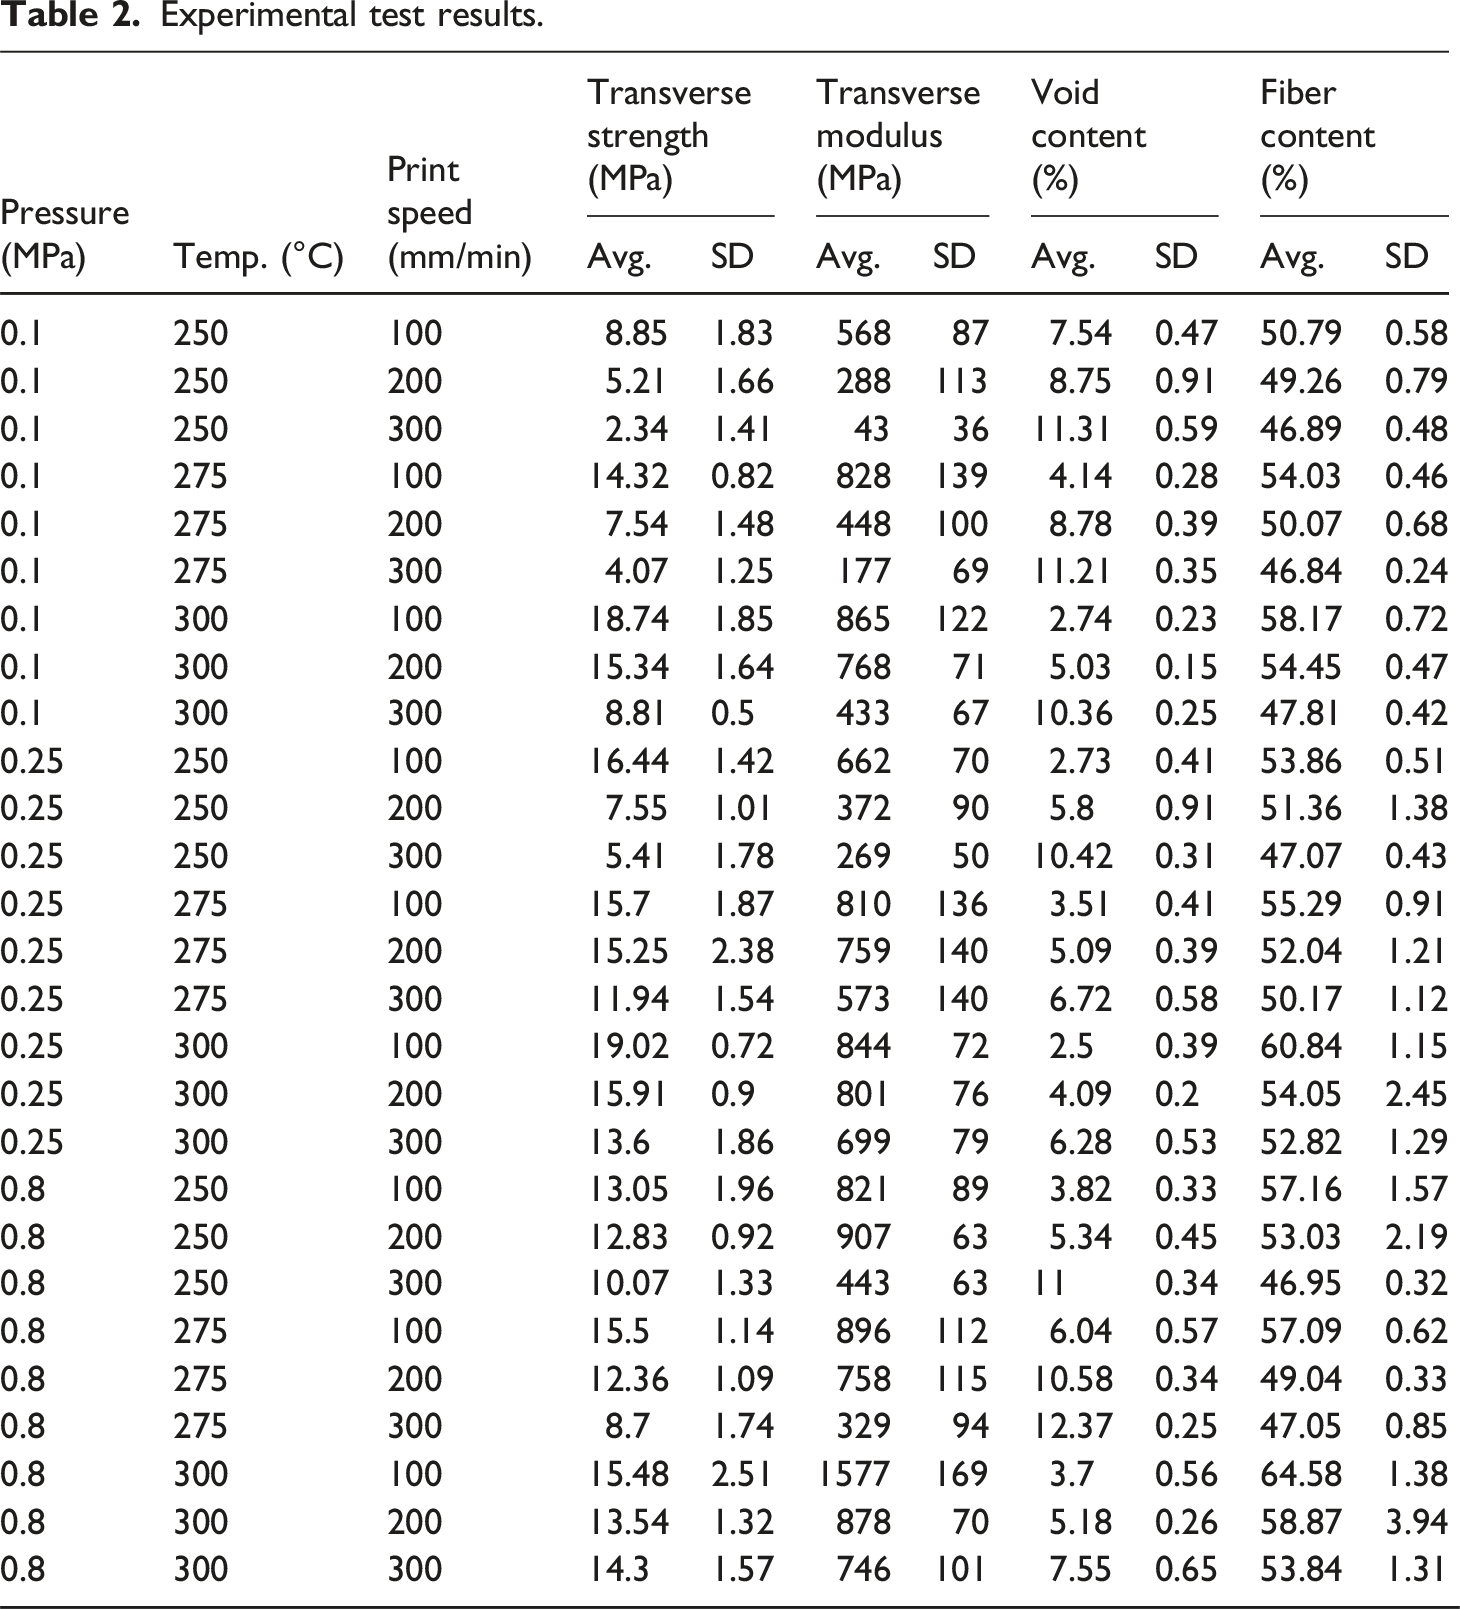
Temperature, consolidation pressure and print speed were varied, each consisting of three levels, resulting in a 33 full observational study. Rodriguez and Radford 19 had previously done work with samples printed at 220°C, but this current effort is intended to investigate the quality of samples printed at higher temperatures. 250°C was selected as the lower bound and 300°C was selected for the upper bound. 300°C was chosen, in an attempt to remove concerns of thermal degradation, because it was the highest temperature for which published thermogravimetric degradation data was available. 26 Temperature was evaluated at 250°C, 275°C and 300°C, consolidation pressure was evaluated at 0.1 MPa, 0.25 MPa and 0.8 MPa, and print speed was evaluated at 100 mm/min, 200 mm/min and 300 mm/min, resulting in a matrix of 27 test combinations. 6–7 specimens were tested for each combination. The test matrix is shown in Table 1.
Determination of pressure
The area over which consolidation force is applied, is the section of the nozzle face that is in contact with the commingled material. This is shown in Figure 3(b), with thick lines. Pressure is determined by dividing the force level collected by the load cells which support the build plate and dividing by the area of nozzle section in contact with the commingled tow as it is being deposited. (a) Nozzle isometric view (b) nozzle face top view.
Specimen preparation
Samples were manufactured by depositing six tows of commingled material adjacent to one another to form the width of the composite. 6–8 layers were stacked to form a target thickness of 2.9 mm. More layers had to be used for test cases with higher consolidation pressures to achieve comparable thickness. A nominal span to thickness aspect ratio of 4:1 was used during testing. Temperature and print speed parameters were controlled using a GUI which interfaces with the firmware on the microcontroller board. Consolidation force was measured with the aid of load cells located underneath the print bed, which yields the consolidation pressure exerted on the deposited tow by the spring-loaded nozzle. Force data generated by the load cells was converted to pressure by dividing force by the nozzle face surface area in contact with the tow. Specimens for testing were cut from the composite laminates using a water-cooled diamond saw. The edges of the specimens were ground on wet sandpaper to make them regular and square. Specimen widths and thicknesses were measured at five positions along the length of the specimen using a caliper and digital micrometer respectively. Images of test specimens are shown in Figure 4. Prepared specimens for transverse flexure.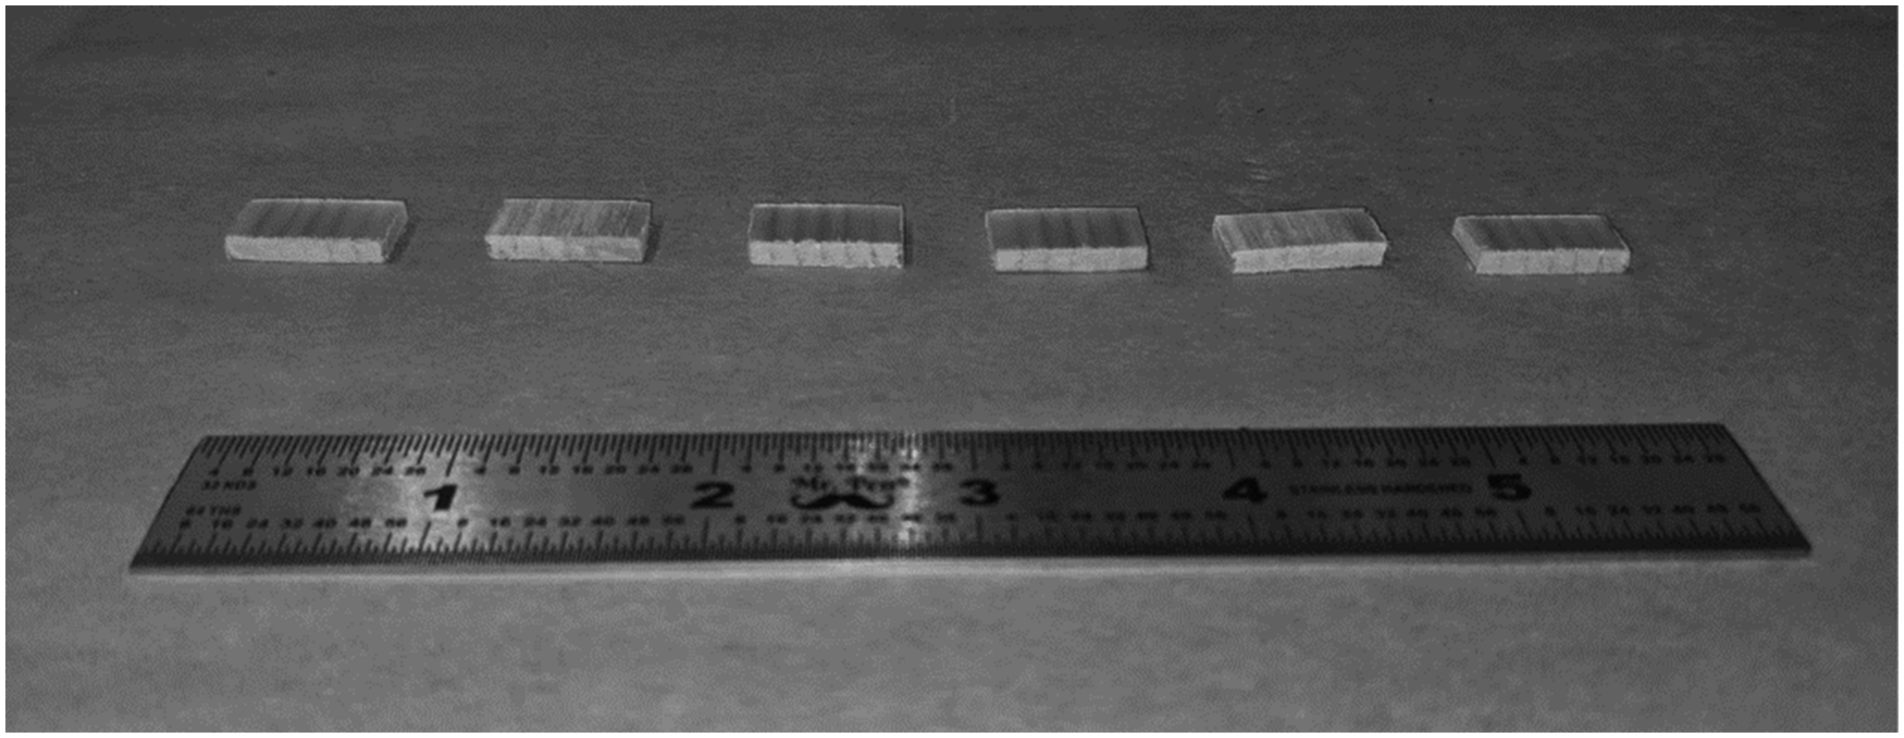
Transverse flexure test procedure
The quality of a composite can be evaluated by the level of adhesion between fiber and matrix, as well as the adhesion between layers and by the void content of the composite. Interfacial adhesion can be evaluated using a number of techniques such as transverse tension and short beam shear (SBS). Previous work by Rodriguez et al. on composites made from this commingled material showed that SBS tests were insensitive to the measured thermoplastic void content and showed no consistent trend in SBS strength over a range of 2–6%.
19
Furthermore, the SBS test approach has been criticized because the stress states in a three-point loaded short beam shear specimen have been discovered to be complex and the composite is not really being subjected to pure shear.27,28 Transverse tension is a technique that can be used to evaluate the quality of a bond between the fiber and the matrix. This technique is considered to be sensitive to changes in the interface strength because the forces in the laminate have to pass the interface between fibers and matrix.
29
Another feature of this test is that it is also quite sensitive to flaws and voids in composites and as a result has been described, by some, as a “weakest link” test.
30
Adams et al.
31
suggested using the transverse flexure test in lieu of the pure transverse tensile test when interested in studying fiber-matrix interface, as this theoretically halves the gage thickness subjected to pure tension across the midplane, therefore reducing the propensity for failure to occur based on flaws and voids. Since the goal of this study is to evaluate composite quality using metrics like interfacial adhesion and void content, the transverse flexure test was selected. A schematic of the transverse flexure test is shown in Figure 5. Transverse flexure schematic.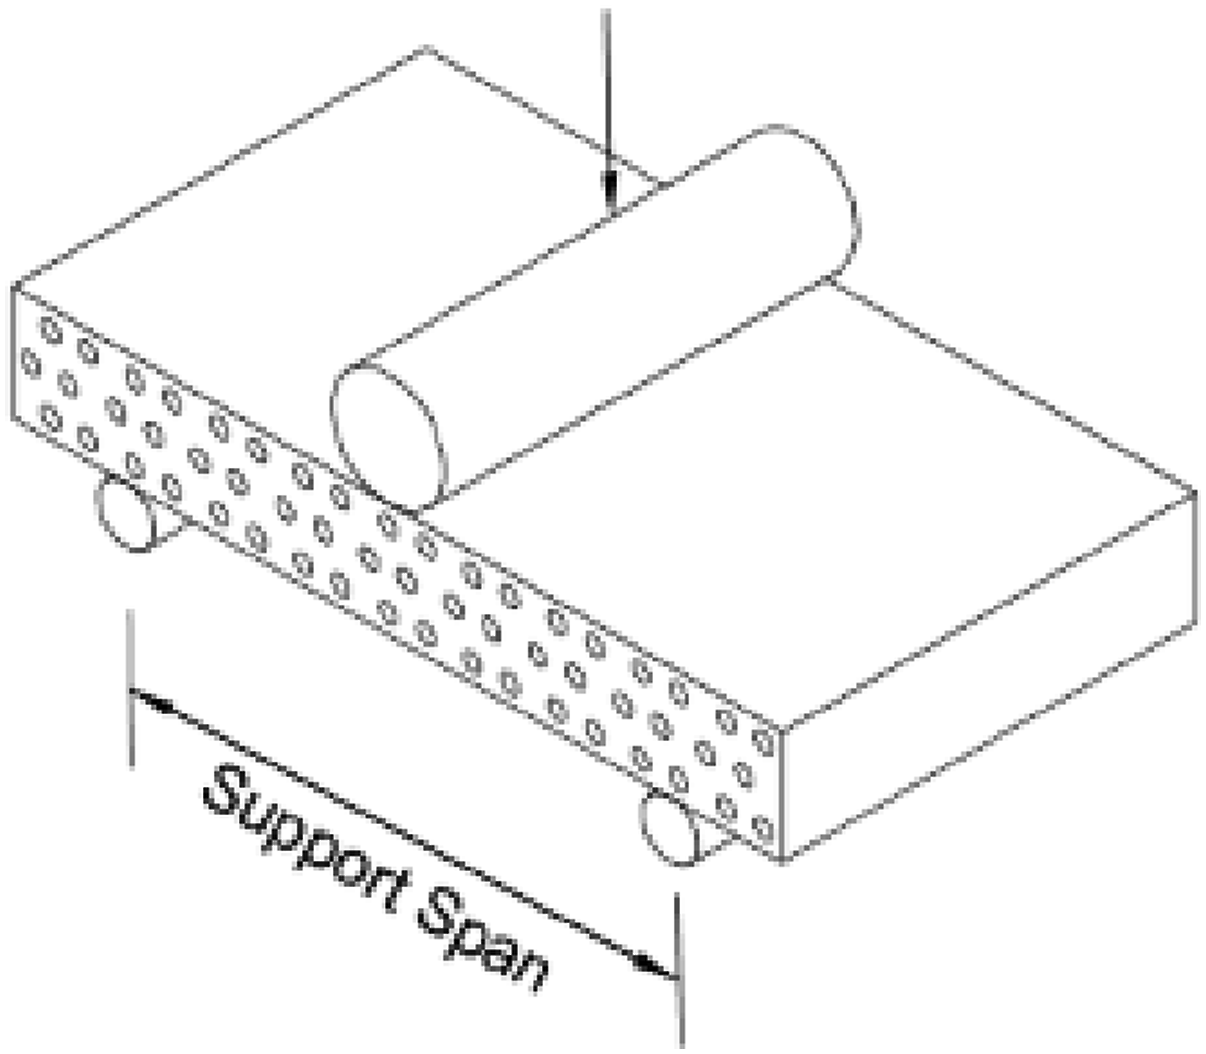
It has also been shown that the transverse flexure test produces consistent results with the composite always failing in tension. 31 All testing was conducted at a crosshead rate of 0.25 mm/min on an Applied Test Systems, ATS Series 910, universal test machine, configured with a 22 kg rated load cell. Since there is no particular standard for the transverse flexure test, reference was made to the general ASTM flexure standard, D790. 32
Fiber and void content measurement procedure
Constituent volume fractions were conducted in accordance with ASTM D3171. 33 Density measurements were first performed according to the Archimedes principle to determine density of each specimen. Five specimens were tested for each process combination (27 combinations) resulting in a total of 135 specimens. Once densities had been determined, specimens were placed in a ceramic crucible and then into a muffle furnace. Matrix burn-off was performed at 595°C for 5 h, leaving behind the glass fibers. These were weighed and the results evaluated using manufacturer supplied density values of 2.62 g/cm3 and 1.27 g/cm3 for the glass fiber reinforcement and PET matrix respectively.
Results
Experimental test results.
Regression model suitability and assumption
The suitability of the model was first examined by applying statistical good practices such as checking the distribution of the residuals that is, the difference between the observed and predicted values, to see if they were normally distributed. Check for normality was done graphically and with a Shapiro-Wilks hypothesis test. Shapiro-Wilks test is a hypothesis test that evaluates whether a data set is normally distributed. It evaluates data from a sample with the null hypothesis that the data set is normally distributed. A large p-value indicates the data set is normally distributed, a low p-value indicates that it isn’t normally distributed. 35 The result of the Shapiro-Wilks test showed a p-value of .081 for the transverse flexure strength regression model and a p-value of .563 for the void content regression model meaning the null hypothesis of normality is failed to be rejected at the .05 level of significance. Also, the homogeneity of variance of residuals was checked graphically and found to satisfy the equality of variance assumption required for regression models. Finally, multicollinearity among independent variables was checked by examining the Variance Inflation factor (VIF) for each independent variable. VIF of one means no collinearity among variables, VIF higher than five suggests moderate to high collinearity. The highest VIF within both models was 3.08 which is within tolerable limits.
Parameter effects
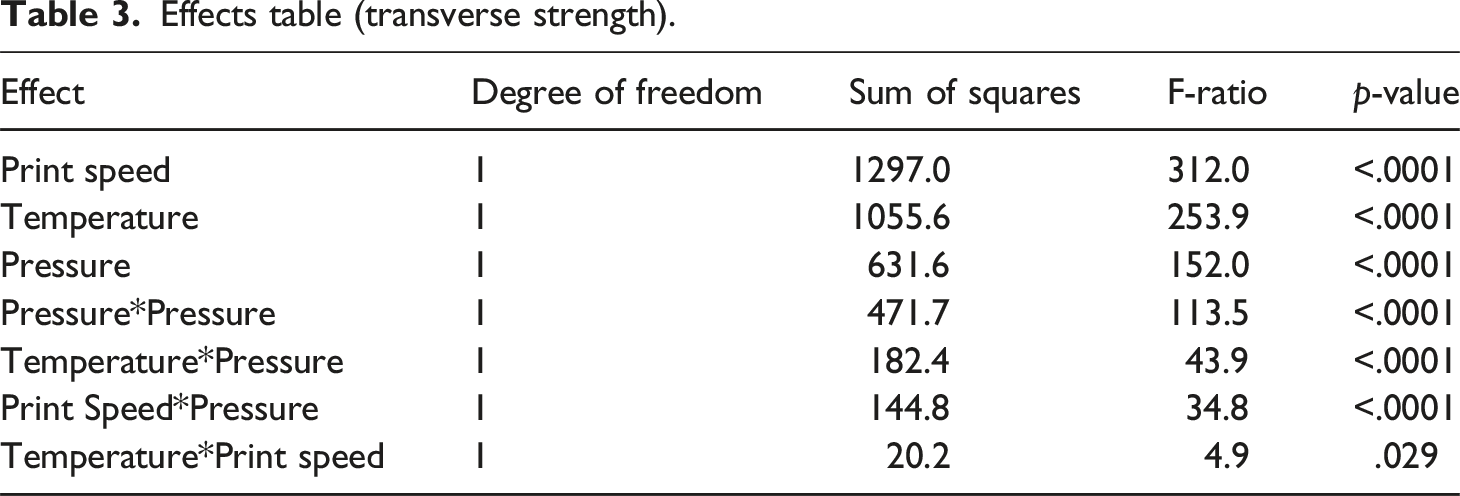
Effects table (transverse strength).
Effects table (void fraction).
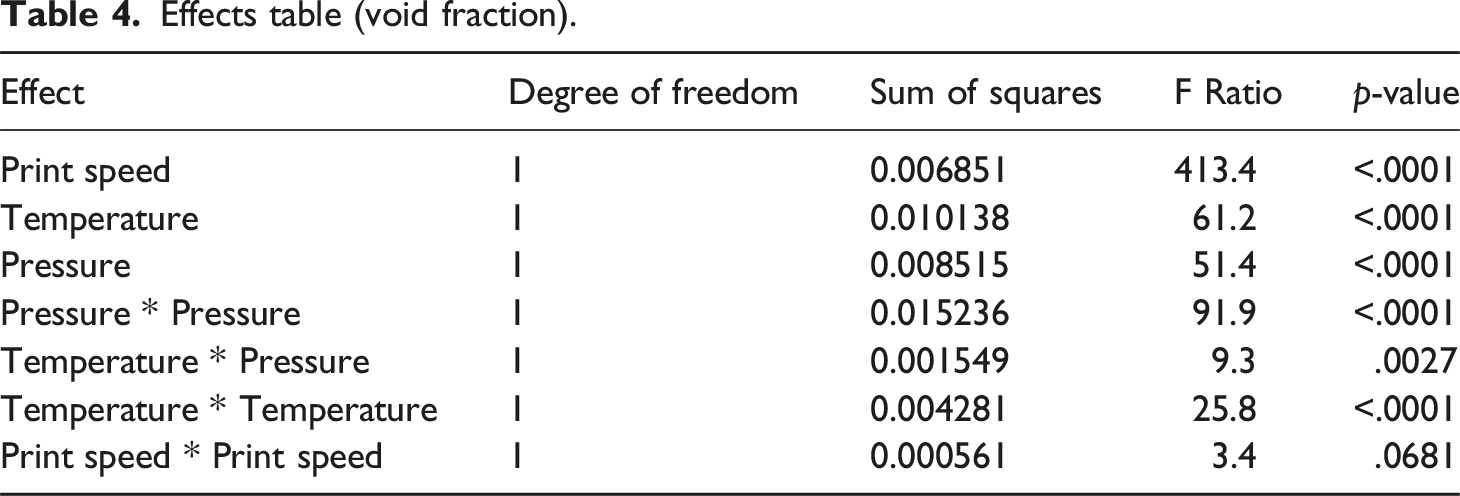
The interaction between pressure and temperature is predicted by both models to be statistically significant at a .01 level of significance, as shown in both Tables 3 and 4 which means that the effect of temperature on transverse strength and void content changes depending on what level of pressure is present in the manufacturing process.
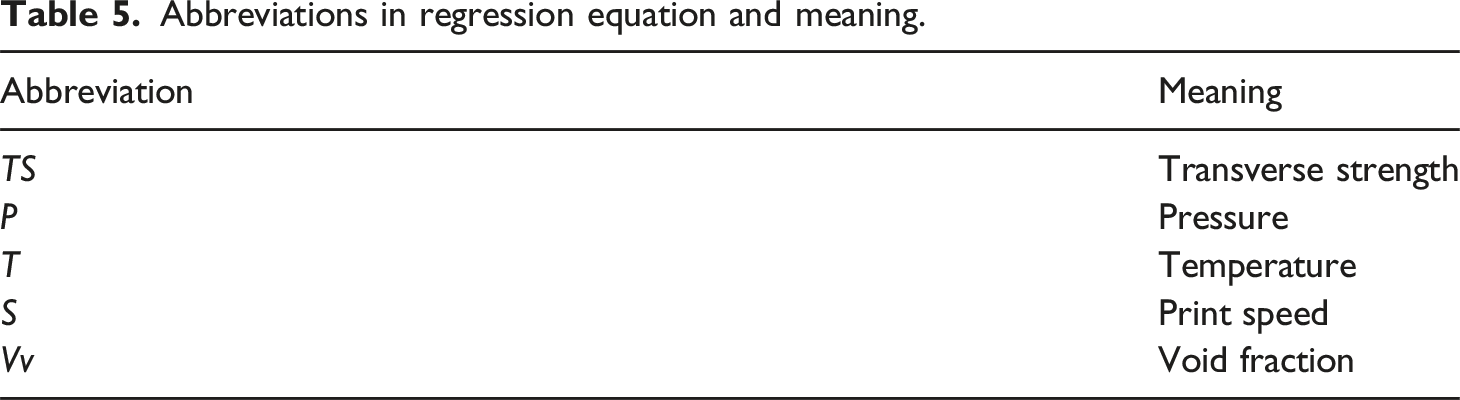
Abbreviations in regression equation and meaning.
Plots of test data are shown in Figures 6 and 7. (a–f): Plots of transverse strength and modulus against print speed at various pressures and temperatures. (a) At 0.1 MPa consolidation pressure. (b) At 0.1 MPa consolidation pressure. (c) At 0.25 MPa consolidation pressure. (d) At 0.25 MPa consolidation pressure. (e) At 0.8 MPa consolidation pressure. (f) At 0.8 MPa consolidation pressure. (a–f): Void and fiber content at various pressures. (g–l): Void and fiber content at various temperatures.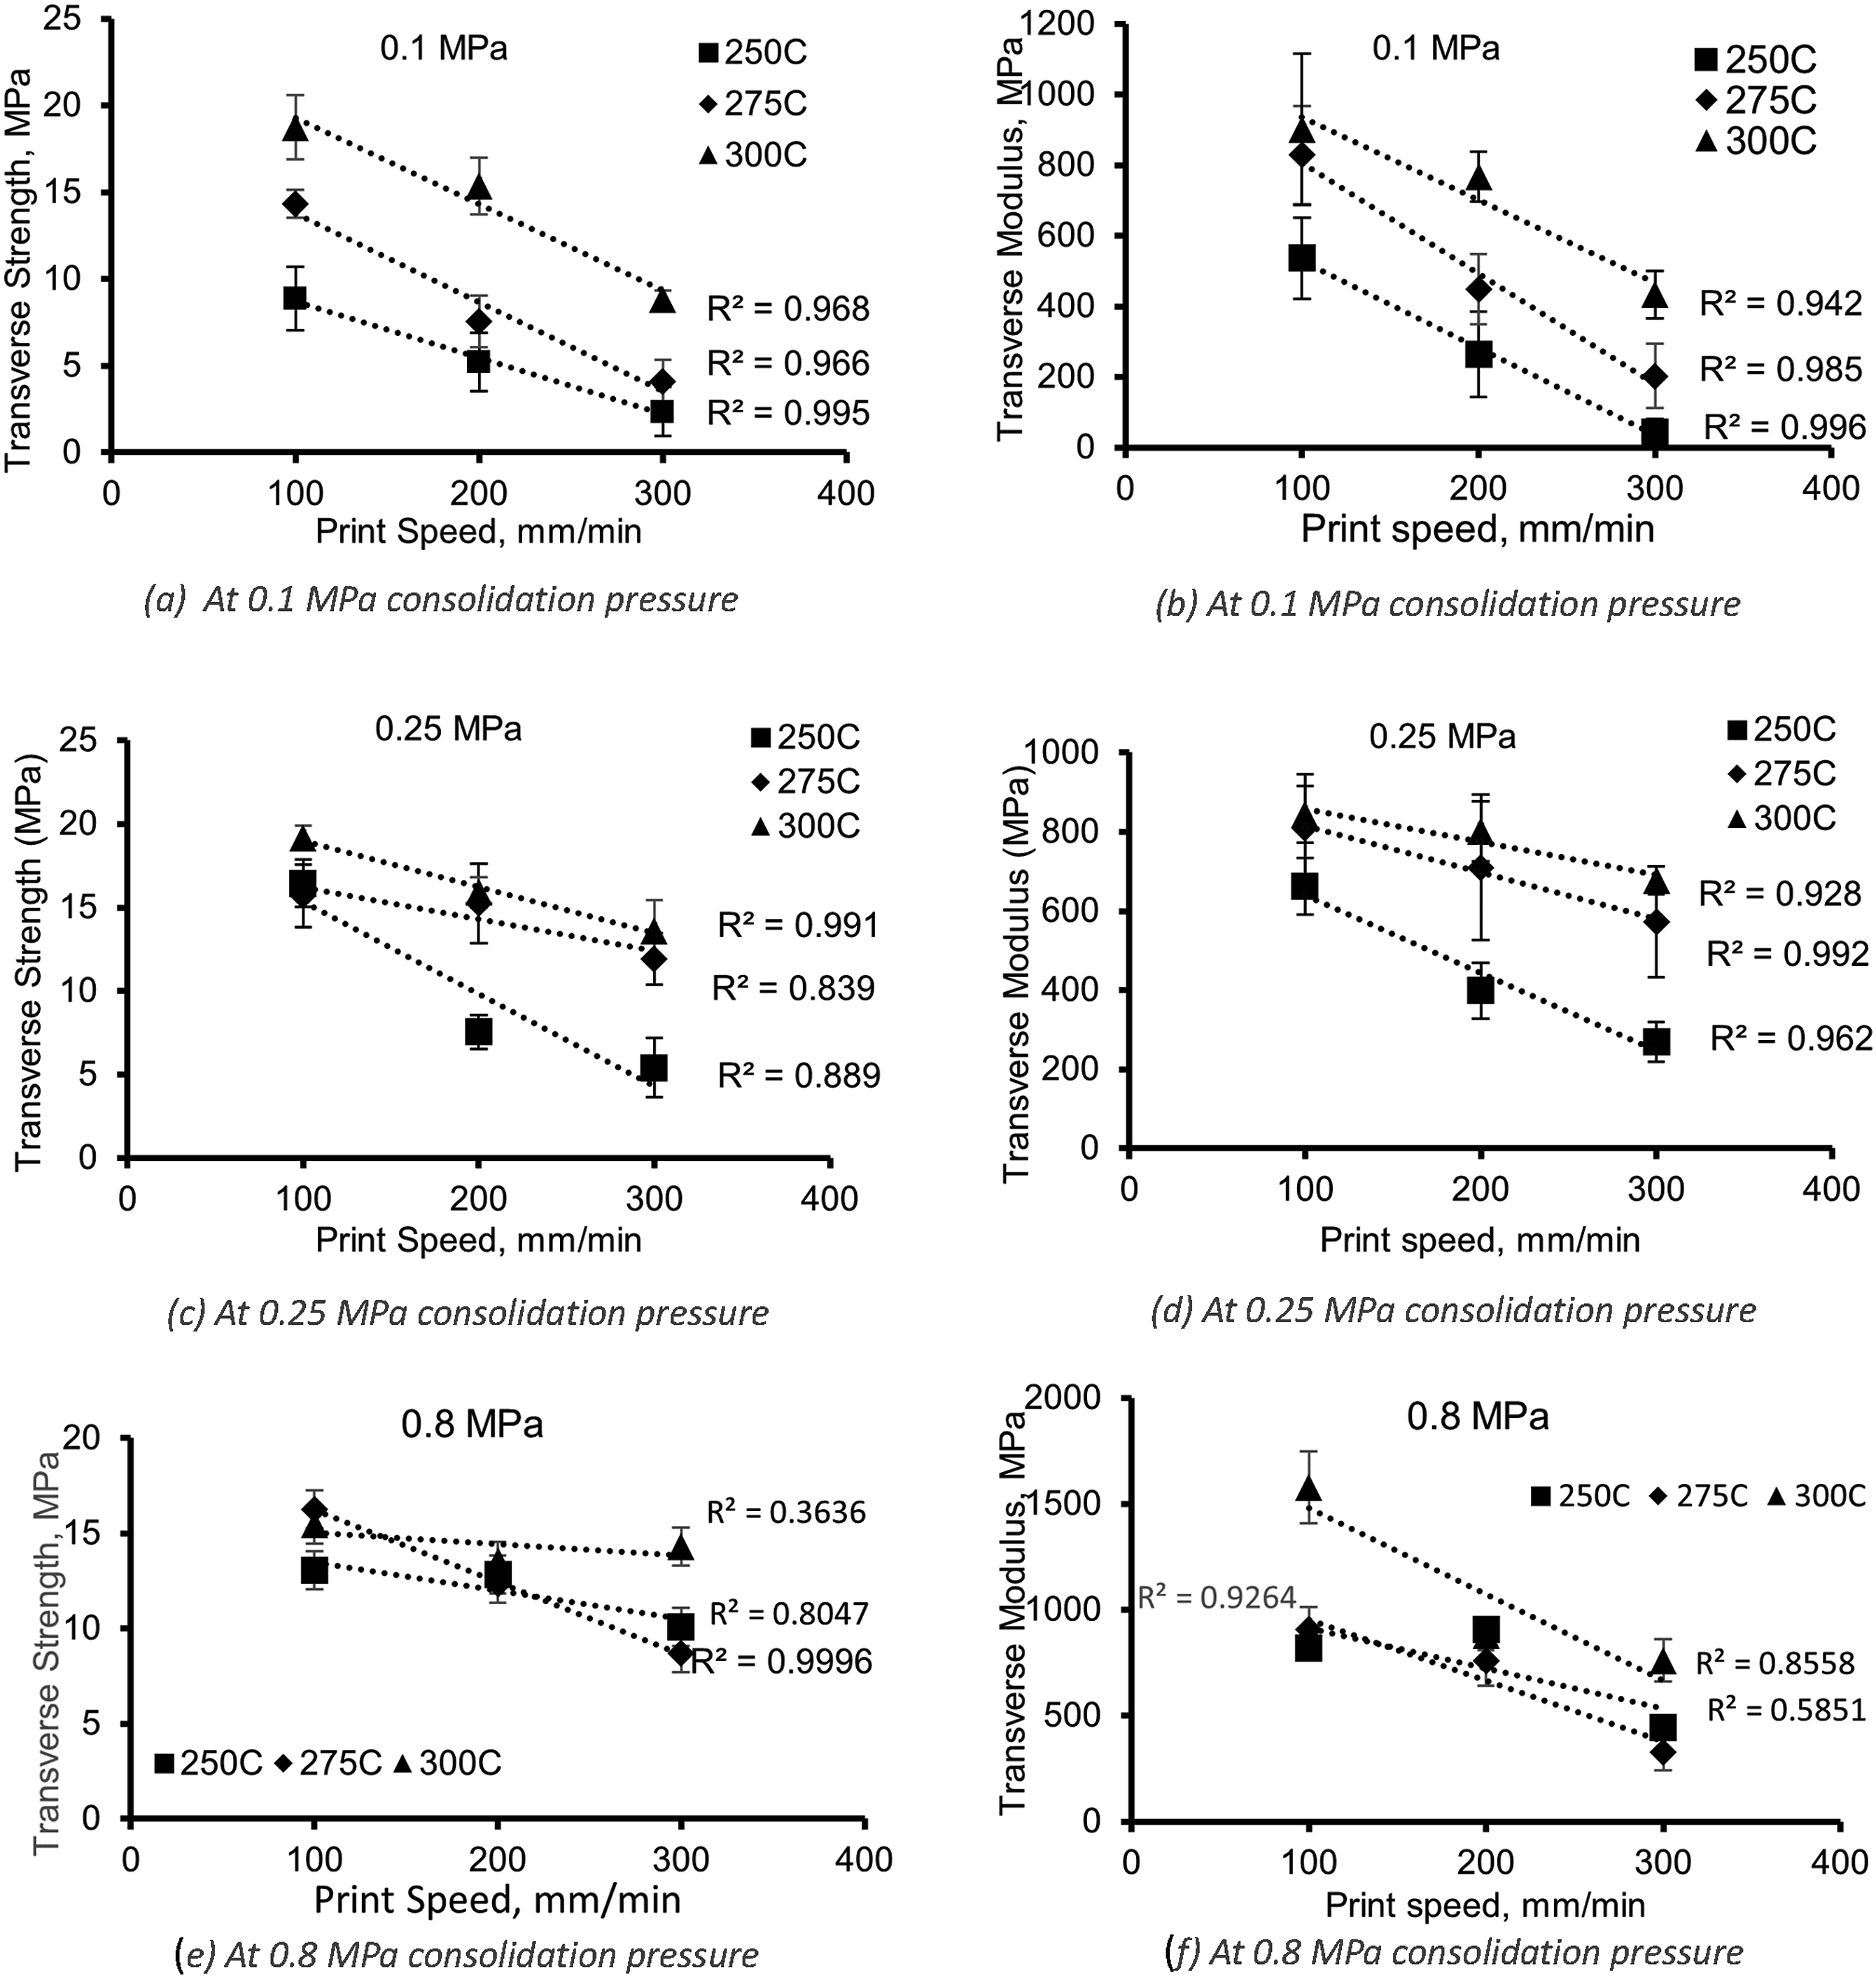
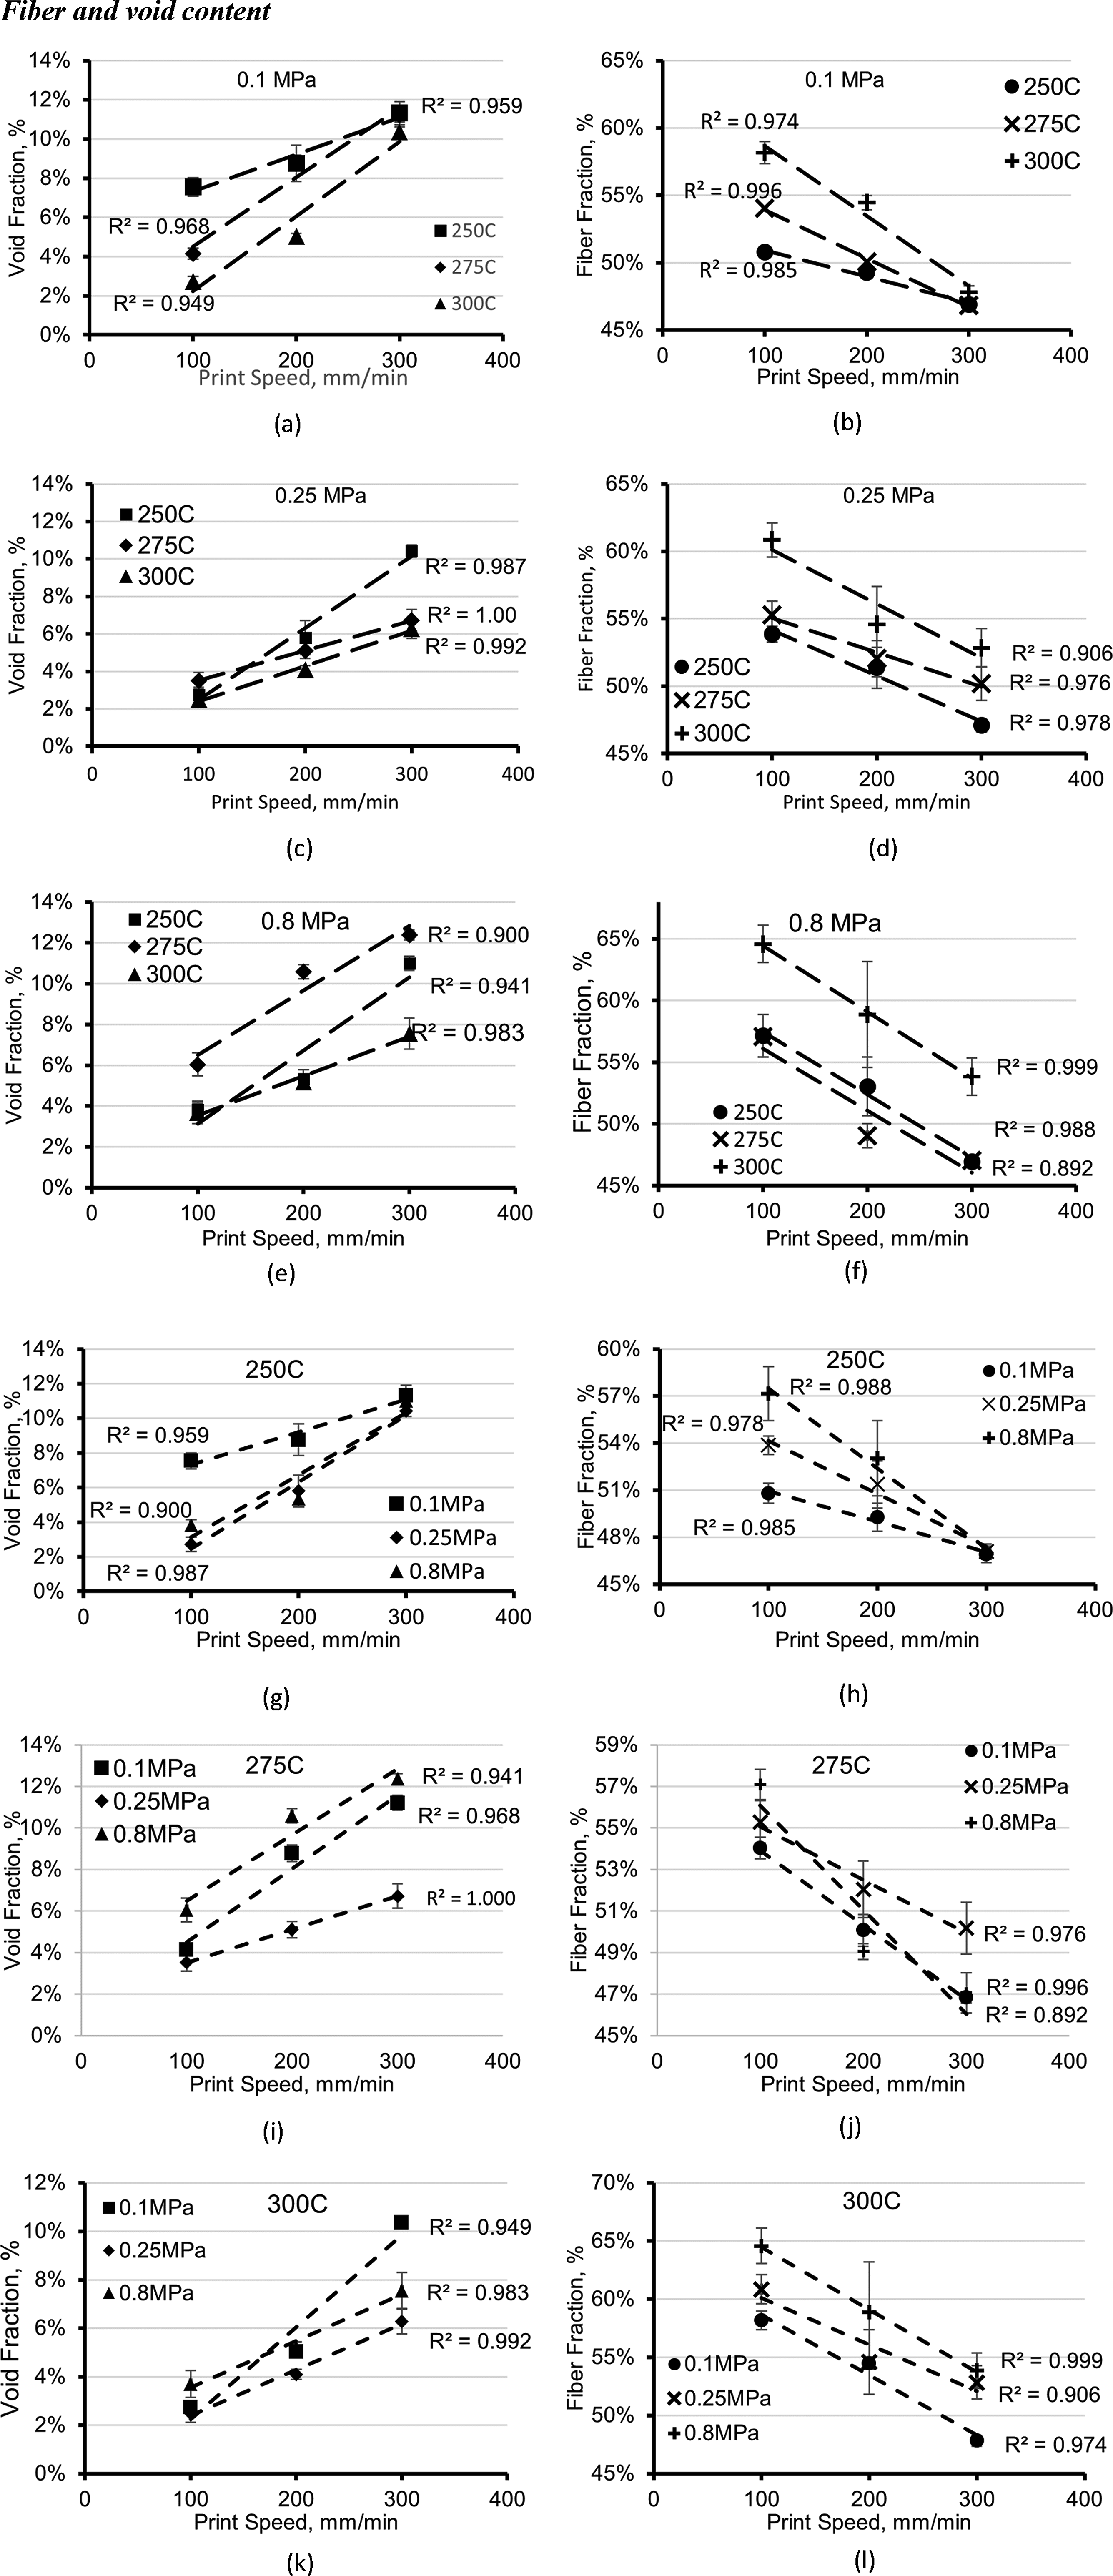
Fiber and void content
Figure 8 shows a linear correlation between transverse strength and void content. This implies that composite quality can be assessed similarly by either transverse flexure testing or constituent fraction testing. It could also imply that as void fraction increases, the transverse flexure test becomes more sensitive to voids than to interfacial adhesion quality between fiber and matrix. Correlation between transverse strength and void content.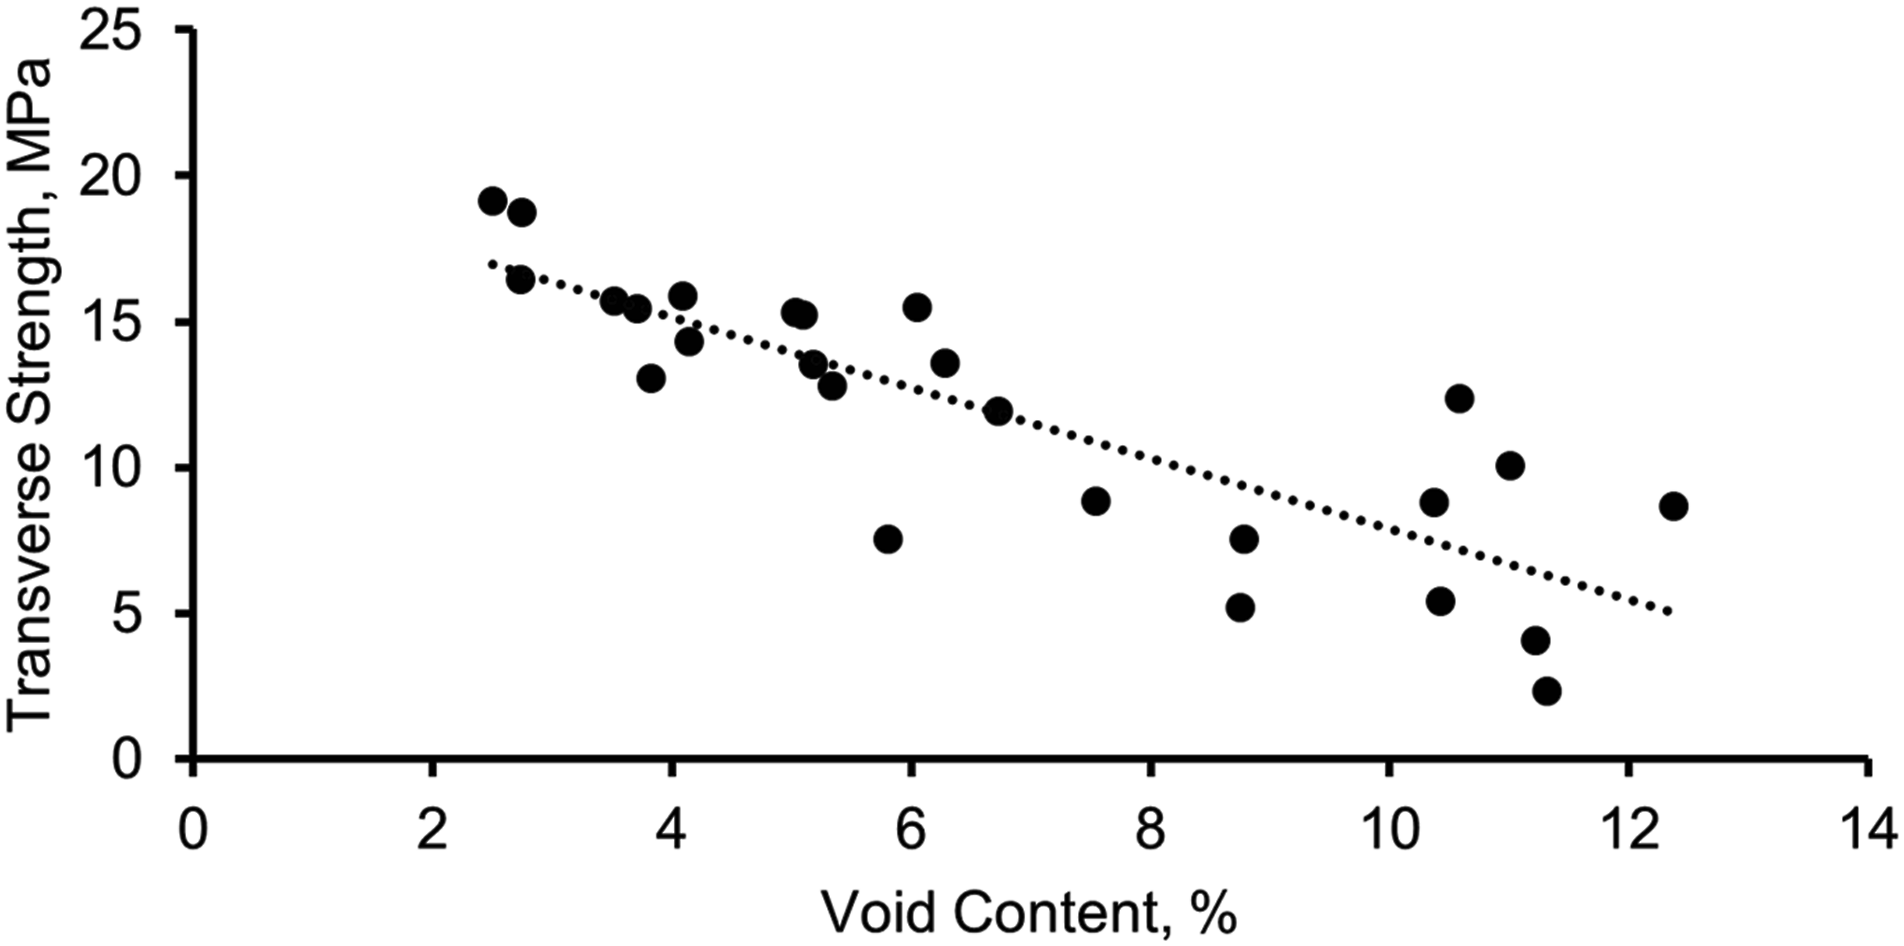
Discussion
Effect of pressure on quality
Pressure has a significant quadratic effect on the quality of the composite as supported by the regression models. Between pressure levels 0.1 MPa and 0.25 MPa, the quality of the composite part increases. This is because the increased pressure forces the molten matrix to flow and further impregnate the reinforcement fibers. Also, voids within the commingled material are further closed with the further increase in pressure leading to reduced void content for the 0.25 MPa level. Pressure causes consolidation of tow to previously deposited tow eliminating or reducing interlaminar voids. Interaction plots involving pressure is shown in Figure 9(a) and (b). (a) Surface plot of temperature and pressure against transverse strength. (b) Surface plot of print speed and pressure against transverse strength.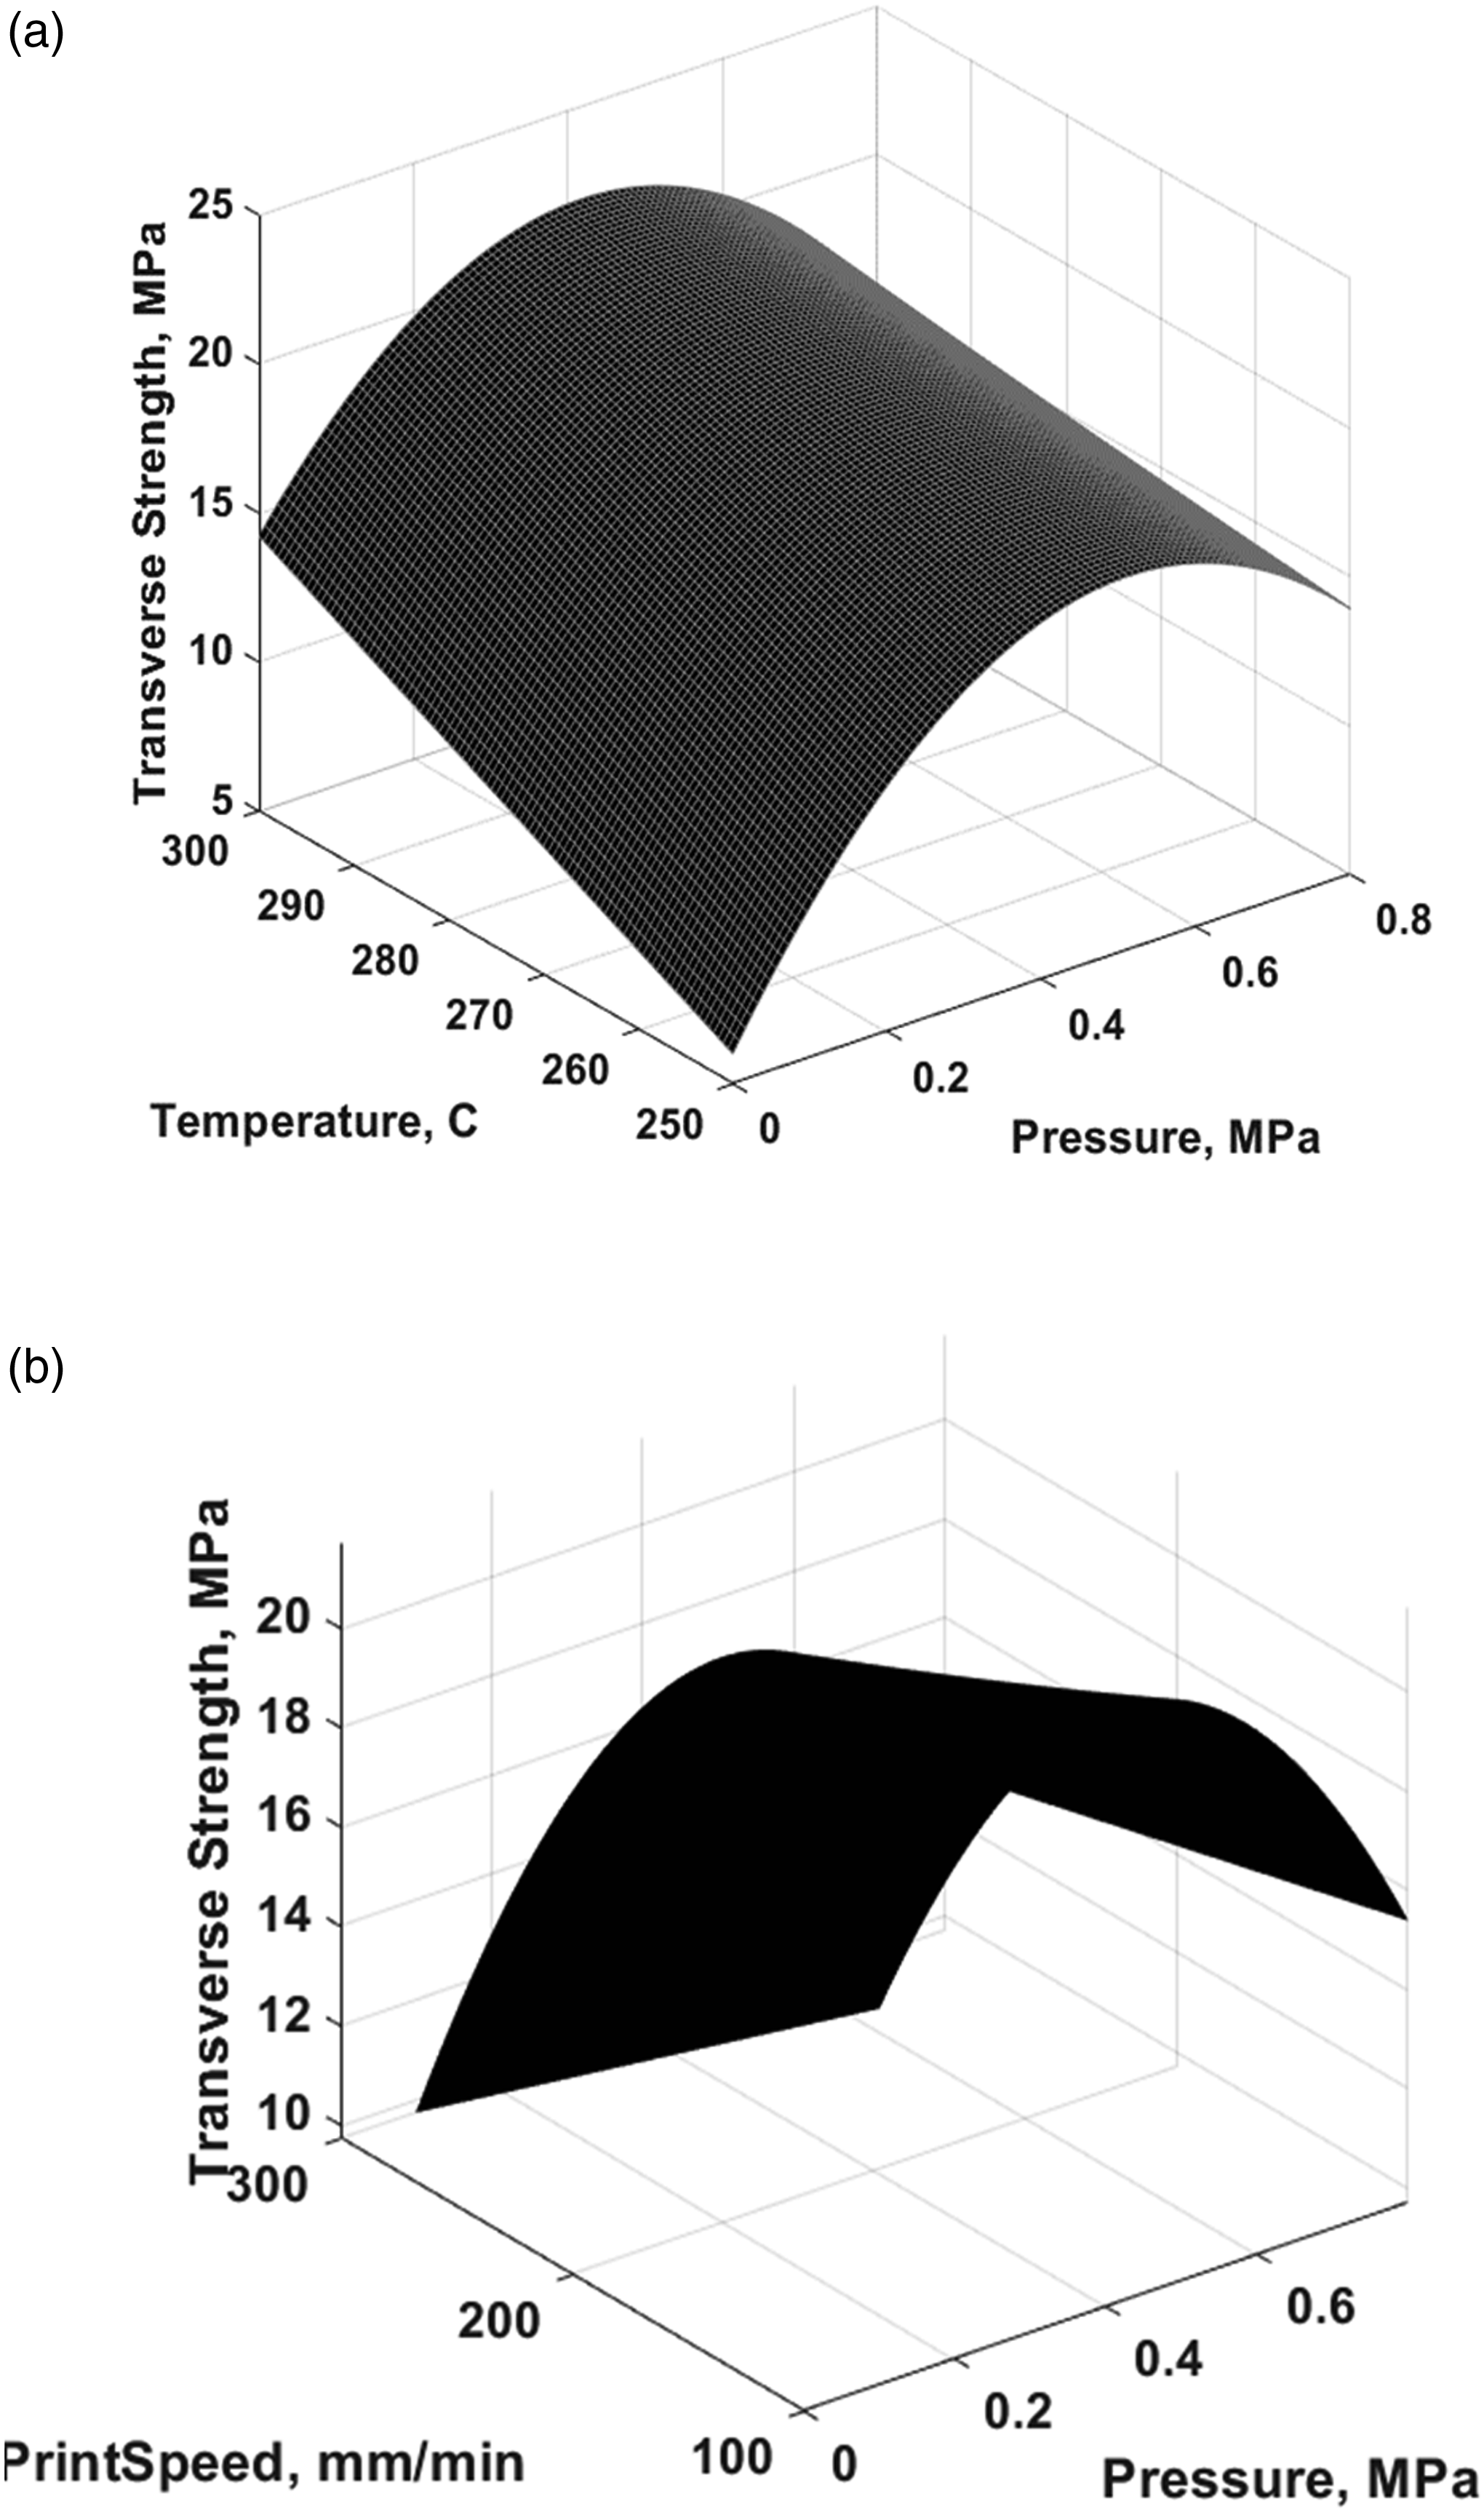
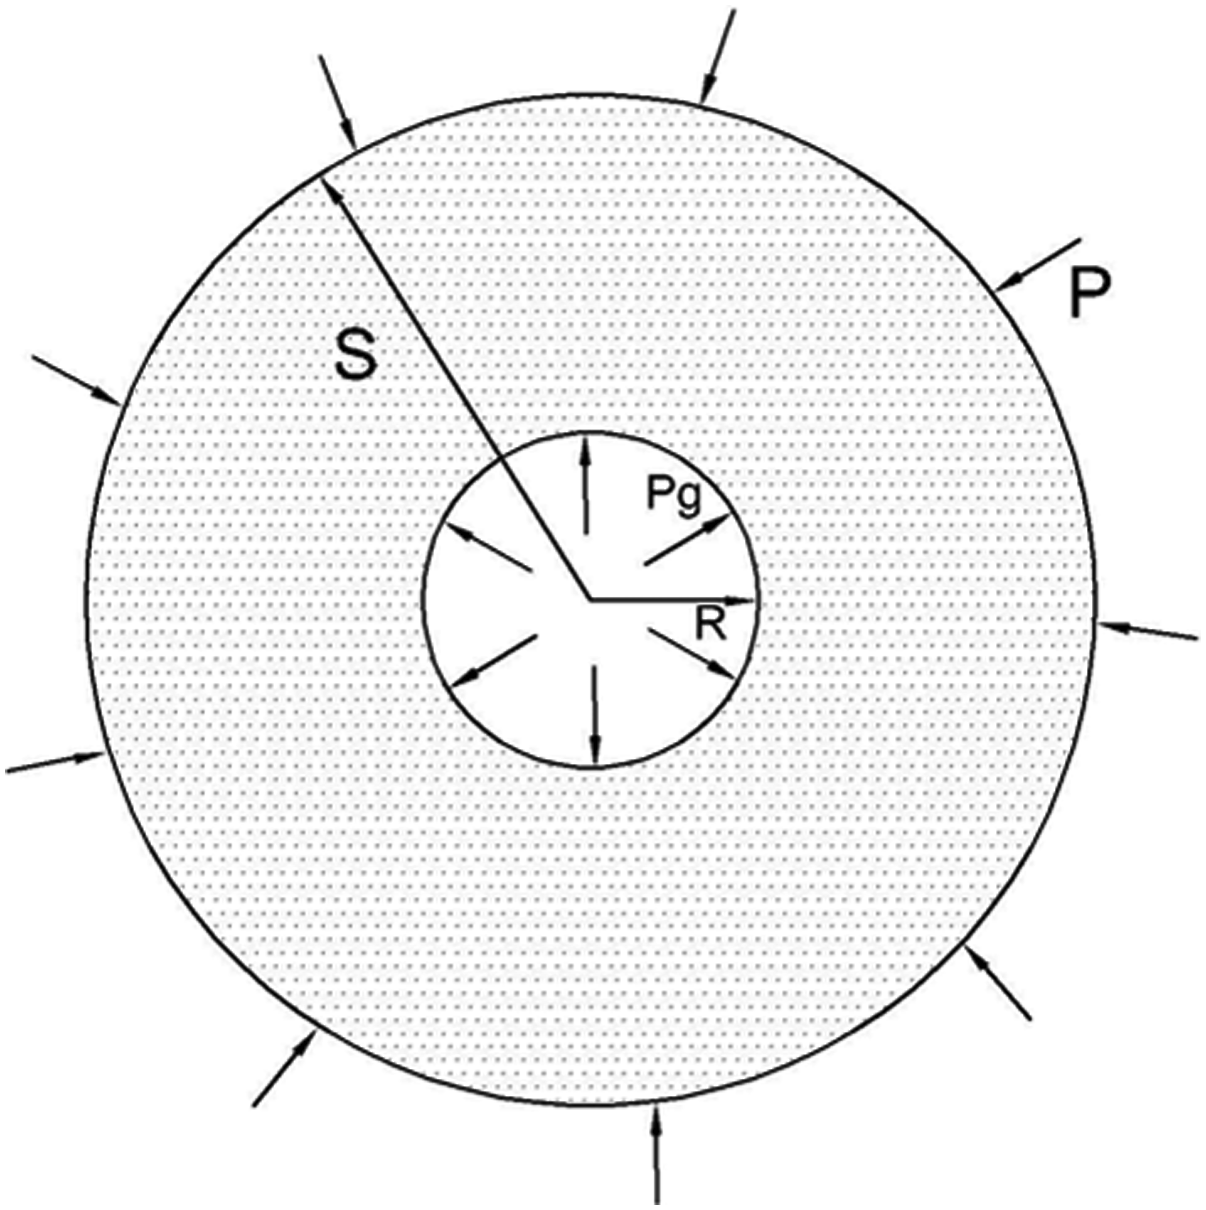
This reduction in void content can be explained using equation (4) which is a microscopic model for void dynamics which explains how void growth or collapse is governed by a balance between the pressure inside and the outside of the void, surface tension and resin viscosity.
36
Single void element.
Unexpectedly, a further increase of consolidation pressure to 0.8 MPa leads to a drop in the transverse strength and an increase in void content. The drop in quality may be explained by the lack of molds against which the deposited material flow can be constrained. Samples made using the test combination involving the pressure level 0.8 MPa and the low print speed (100 mm/min) had a considerable amount of molten matrix flow out of the edges of the sample. Figure 11 shows a piece of as-manufactured material, processed at 300°C, 100 mm/min and 0.8 MPa, prior to grinding to final dimensions, where matrix has flowed out along the edges.
Also, the higher consolidation pressure leads to denser fiber packing and thus a higher fiber volume fraction. The corresponding reduction in matrix fraction leaves some regions of the composite deprived of resin therefore leading to higher void content. The surface plot in Figure 9(a) indicates an optimal value of 0.42 MPa for consolidation pressure based on transverse strength.
It was also observed that though transverse strength decreased for [300°C, 100 mm/min, 0.8 MPa] test case, the transverse modulus increased. Void content also increased in this test case. The higher transverse modulus in this test case can be explained using the rule of mixtures. Denser fiber packing leads to a composite with higher fiber volume fraction. Increasing the fiber volume fraction of a composite will in turn increase the transverse modulus (E22) as portrayed in the rule of mixtures equation for transverse modulus shown in equation (5).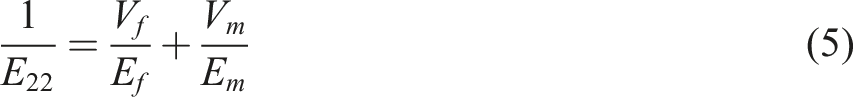
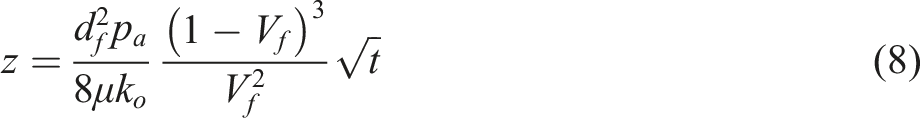
Higher void content can be explained in terms of loss of matrix as shown in Figure 11. It can also be explained in terms of impregnation of fibers using Darcy’s law. For a polymer melt impregnating a fiber bundle normal to the fiber axis, the rate of impregnation is given by: Matrix outflow shown for test case (300°C, 100 mm/min & 0.8 MPa).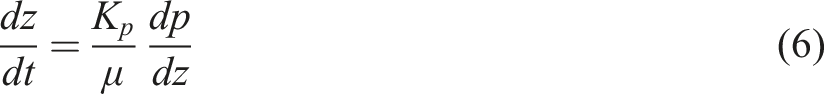
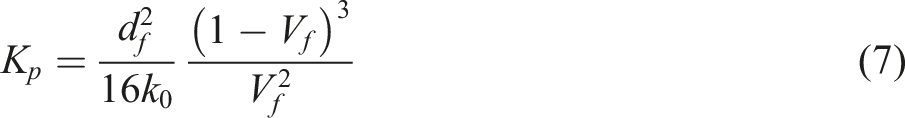
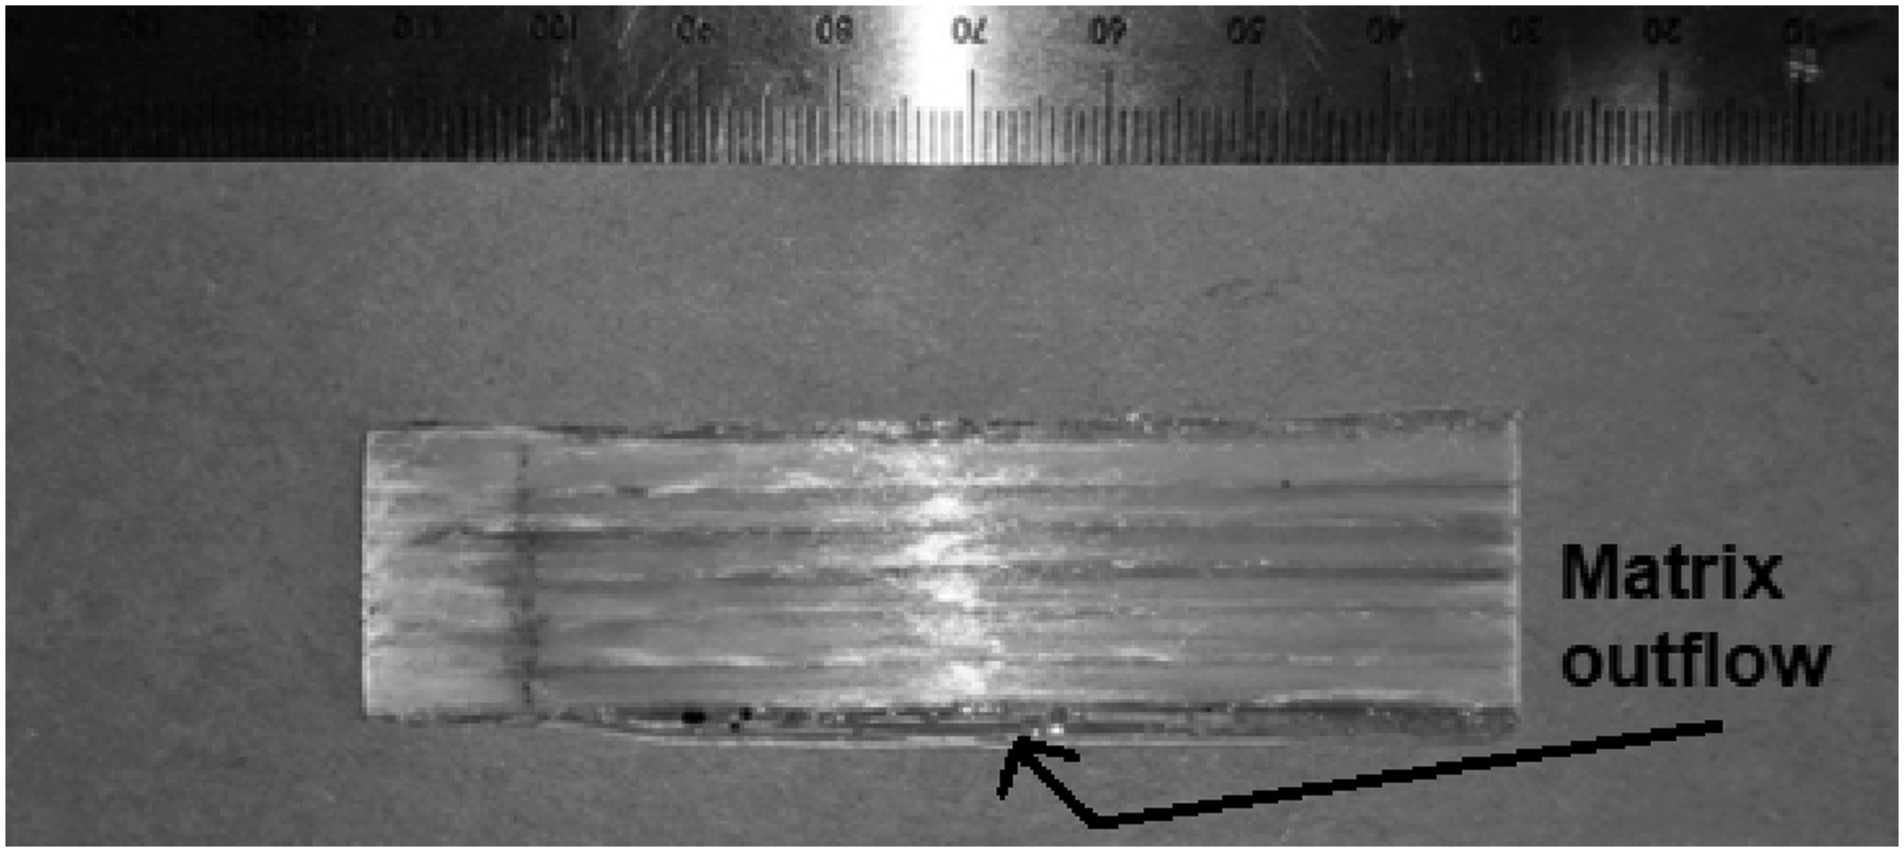
Figure 12 shows the average transverse modulus of the 27 test combinations plotted against the average fiber volume fraction. The low transverse modulus around test combinations with 47.5% fiber volume fraction is due to the commensurate high void fractions found in these composites. Plot of experimental data showing transverse modulus against fiber fraction.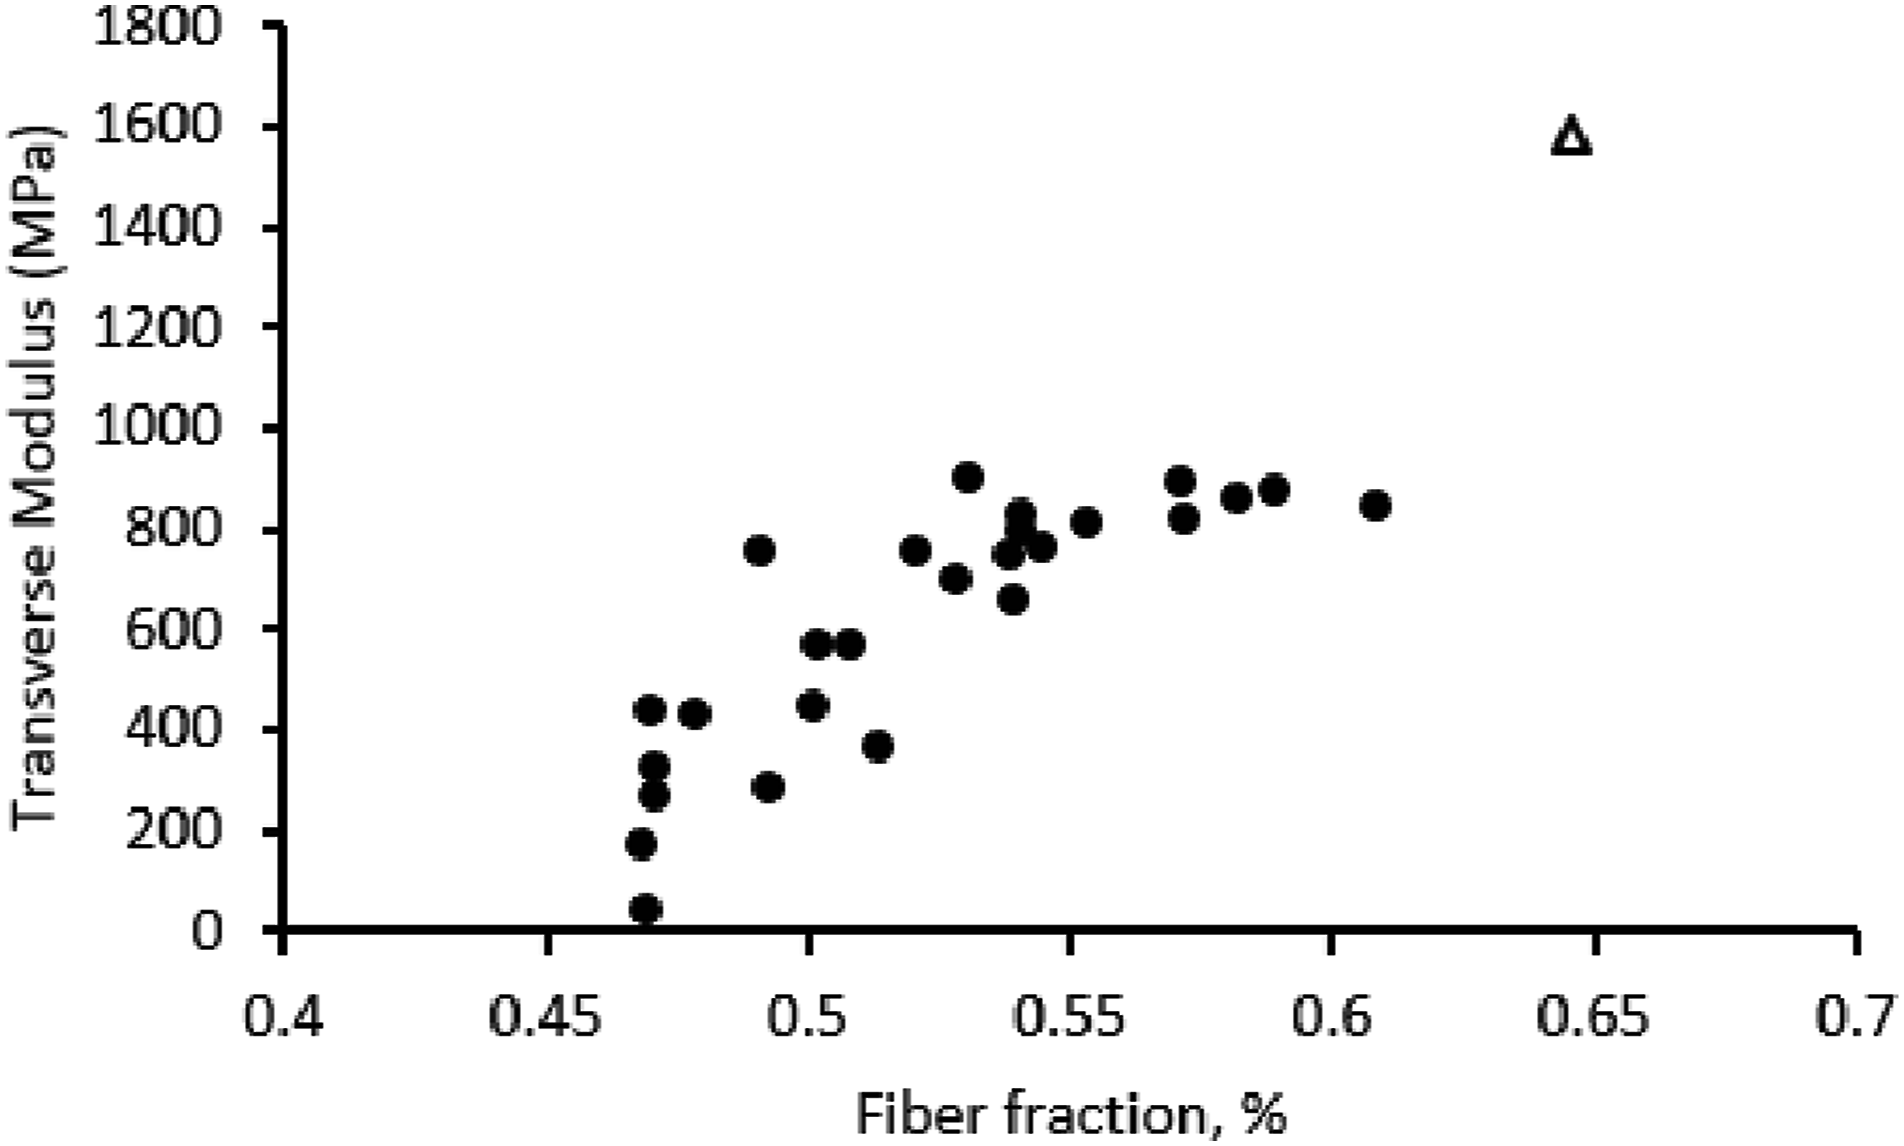
The data point at the right most end of the graph is the data point for test combination [300°C, 100 mm/min, 0.8 MPa] which indicates that high transverse modulus is not just dependent on pressure, but also on temperature and print speed.
Effect of temperature and print speed on quality
Like other manufacturing techniques such as compression molding, temperature is an important process parameter. Higher temperatures lead to a reduced viscosity of the thermoplastic PET resin resulting in better wetting and impregnation of the fiber bundles. It is necessary to mention that temperatures reported in this work are heatblock control temperatures and not measured temperatures of the commingled tow. Figure 6(a) shows that at a pressure level of 0.1 MPa, and print speed of 100 mm/min the transverse strength at 300°C is 112% greater than the corresponding strength at 250°C. At the intermediate pressure level (0.25 MPa), larger improvements in quality are observed when the temperature is increased from 250°C to 275°C, than when it is increased from 275°C to 300°C. This can be observed from examination of Figures 6(c) and 7(c).
The effect of increased temperature is more keenly felt at higher print speeds, as the higher viscosities in the commingled yarn that would have resulted due to the reduced time for the heat conduction is compensated for by the increased temperature. Faster print speeds without complementary increases in temperature lead to lower average tow temperatures, higher matrix viscosity, poorer impregnation, higher void content and therefore poorer quality composites. It must also be noted that the upper practical temperature for the inside surface of the nozzle, for this manufacturing approach, is constrained by the degradation temperature of the polymer. At higher print speeds, there will be less average heat in the tow, but there will also be a greater temperature gradient through the radius of the tow. It can be implied that a higher temperature gradient results in less flow in the interior of the tow than might be expected if only the “average” tow temperature were considered. Since viscosity is a function of both temperature and print speed these two factors play a role in the duration permitted for heat flow from the walls of the heated zone into the commingled material. The surface plot in Figure 13 illustrates this phenomenon. Surface plot of transverse strength against print speed & temperature.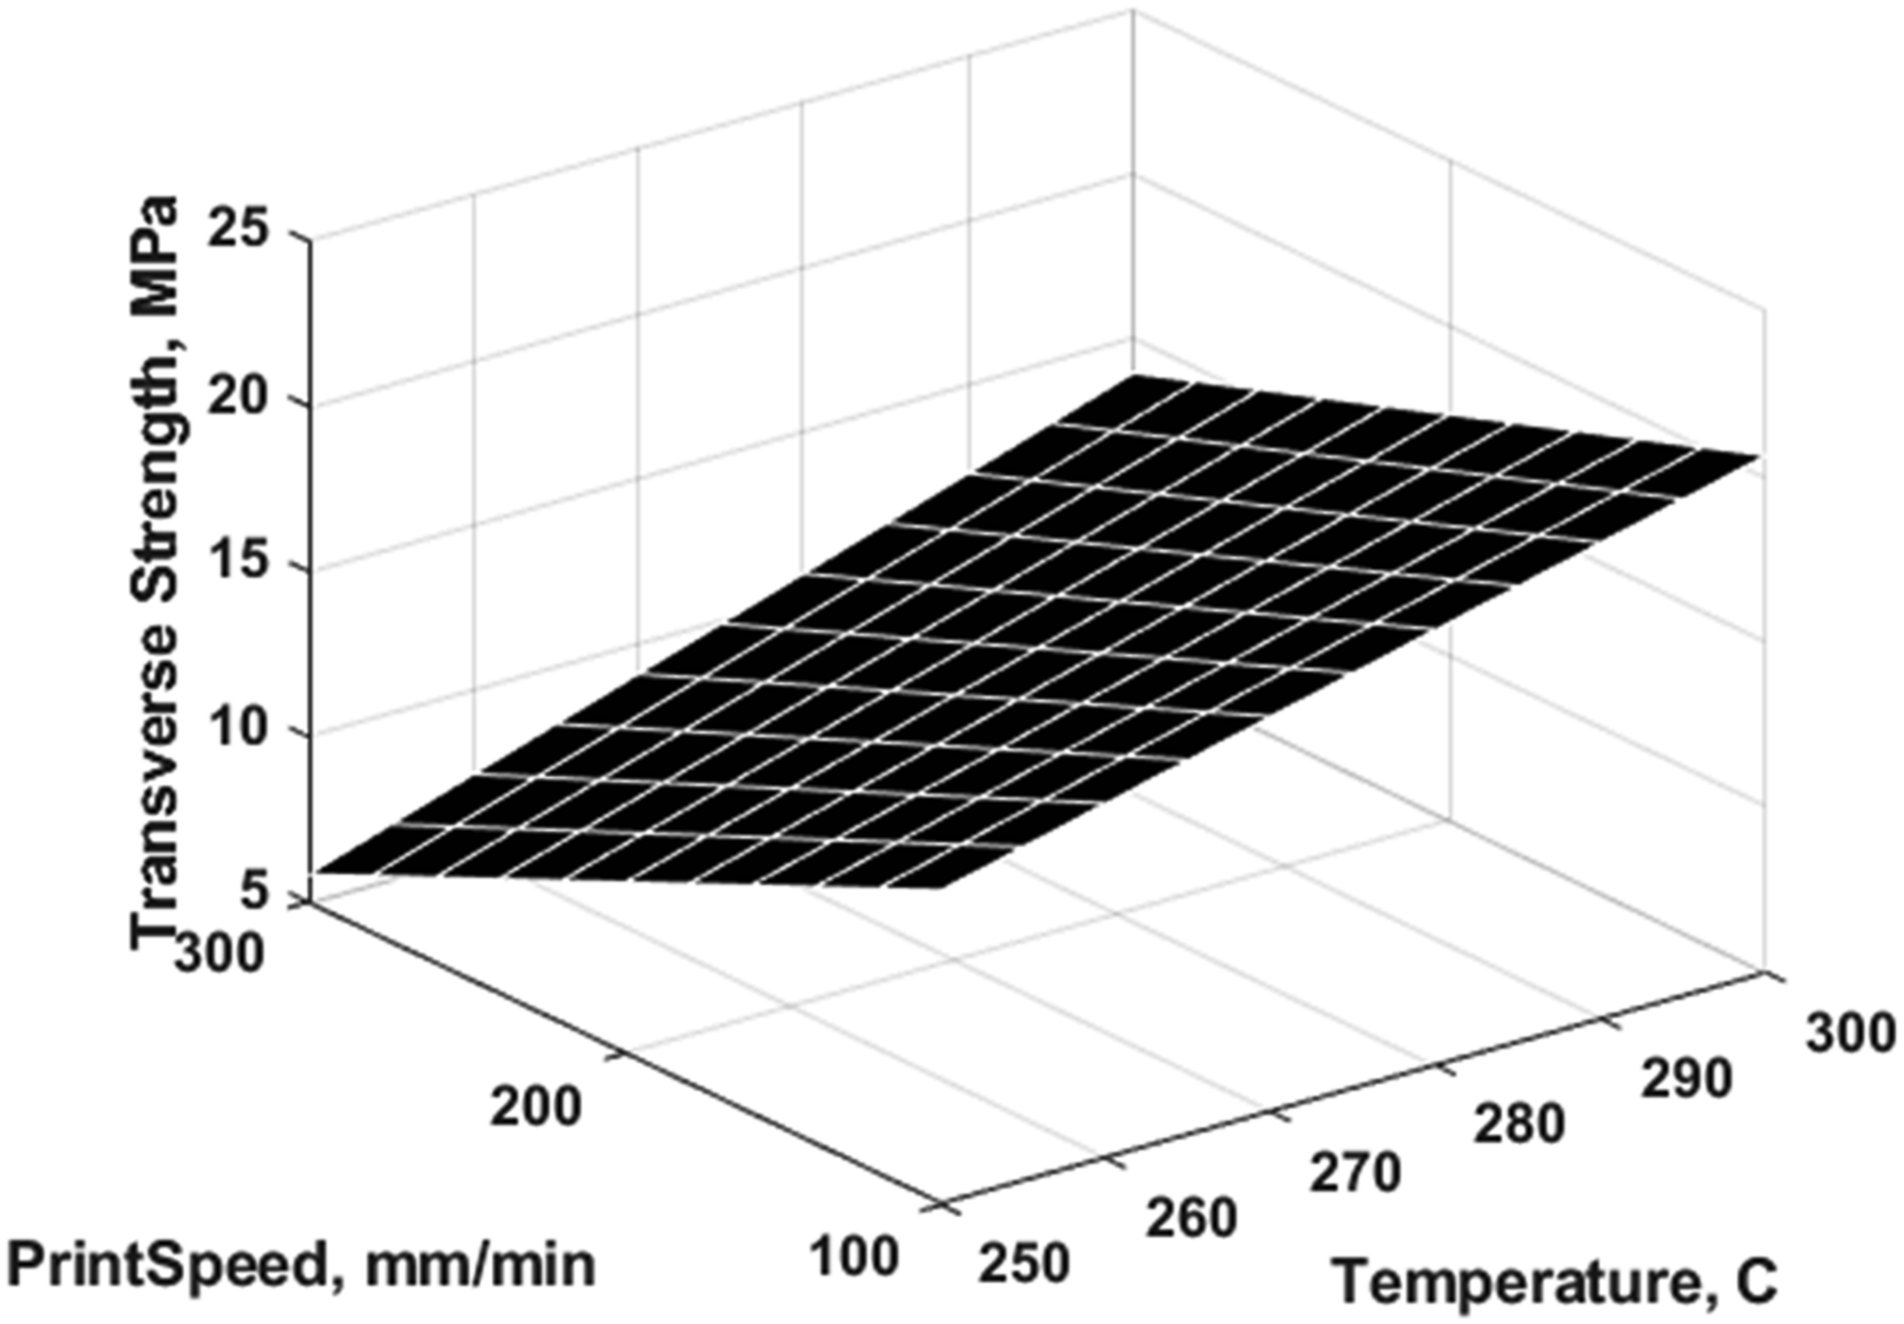
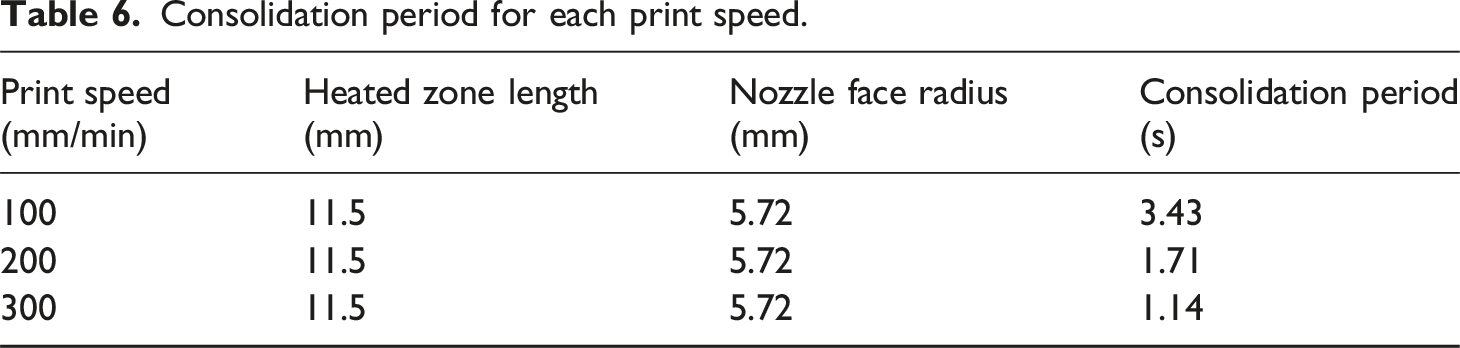
Print speed also has an effect on the duration the consolidation pressure is applied by the nozzle. The faster the print, the less time consolidation pressure is applied to the deposited material. Solution of the Darcy’s equation for permeability shows that penetration distance is affected by consolidation period.
18
Consolidation period for each print speed.
Also, the experimental studies performed in this work show that at the maximum temperature of 300°C and slowest print speed (100 mm/min), there wasn’t any drop in transverse strength compared to other temperature and print speed combinations, inferring that significant matrix degradation had not yet occurred for the PET matrix. It was mentioned earlier that the temperatures reported in this work are given by the thermocouple attached to the heater block which operates in a feedback control system. The approximate average temperature of the commingled material is estimated to be about 15°C lower than target temperature, based on measurements determined by inserting a second thermocouple into the end effector contacting the commingled material just before printing began. The lack of perceptible matrix degradation suggests that maximum operating temperature for the PET matrix has not been attained, implying that print temperatures can still be increased. To confirm this, thermogravimetric analysis (TGA) needed to be performed on the commingled material.
Matrix degradation
Experimental work was conducted to investigate the maximum operating temperature permissible for the commingled material in the manufacturing process used in this study. Thermogravimetric analysis (TGA) was performed using a SEIKO Instruments SSC 5200 TG/DTA 220 equipment. This instrument works by enabling a very sensitive cantilever balance to measure mass change between a reference pan and a sample pan as temperature changes. Degradation plot output from the thermogravimetric analyzer is shown in Figure 14(a). Results are quite similar to those presented by Volk.
26
In addition, a degradation plot for a target maximum heat exposure time of 20 s (a print speed of 100 mm/min is equivalent to a heat exposure time of 18 s, which is derived by dividing the heated region of the end effector by print speed) during fiber placement is shown in Figure 14(b). An exponential function is used to fit experimental data and the resulting mass loss function is shown in equation (9) where T is temperature in Celsius. (a) TGA degradation plot. (b) Degradation plot for EG/PET commingled tow at exposure time of 20 secs.
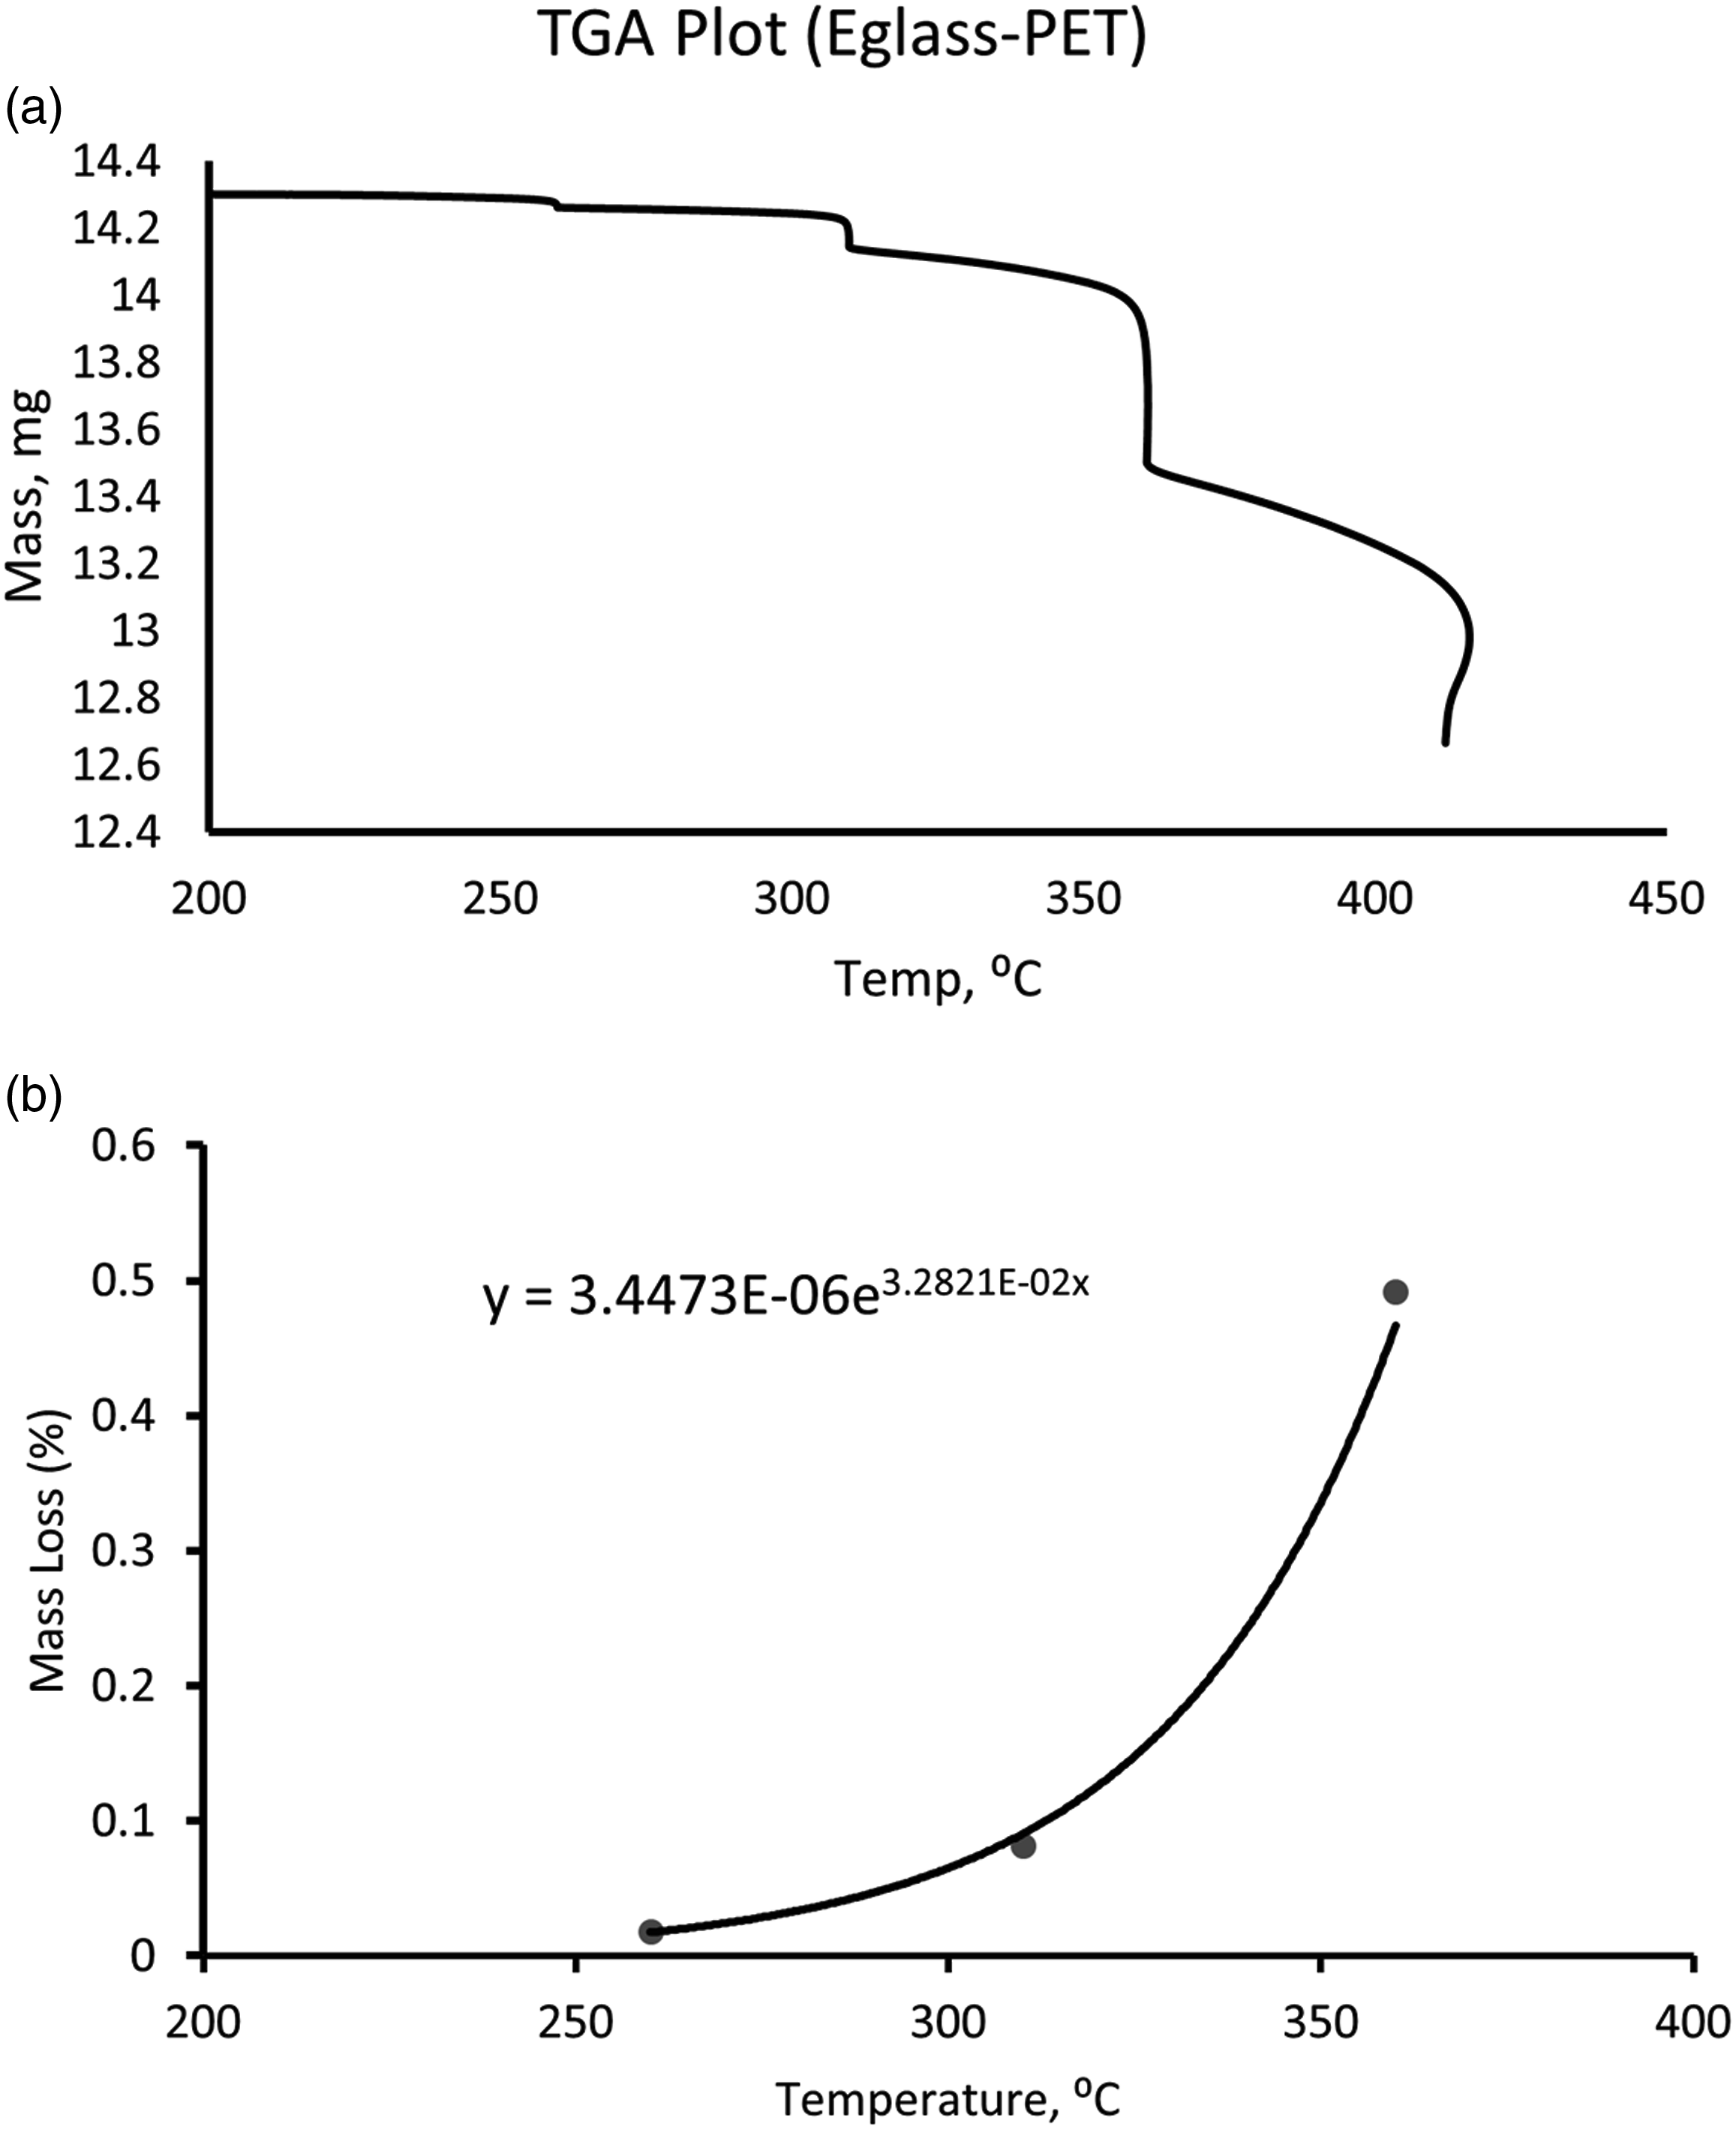
Assuming a permissible degradation limit of 0.2% at an exposure period of 20 s for the commingled tow, a maximum tow temperature of 335°C during printing is acceptable. This suggests that print temperature can be increased.
Microscopy
Micrographs were taken to look at fiber distribution, “intertow” and “interply” spacings, failure mode and location. Interply can be considered interlaminar regions while intertow can be considered as intralaminar. Figure 15(a) shows an optical micrograph of sample printed at (275°C, 0.25 MPa, 100 mm/min) while Figure 15(b) shows an optical micrograph of a sample printed at the same temperature and pressure but at a higher print speed (300 mm/min). Intertow and interply regions are more visible in Figure 15(b) owing to the reduced consolidation period. (a) Optical micrograph at 275°C, 0.25 MPa, 100 mm/min. (b) Optical micrograph at 275°C, 0.25 MPa, 300 mm/min.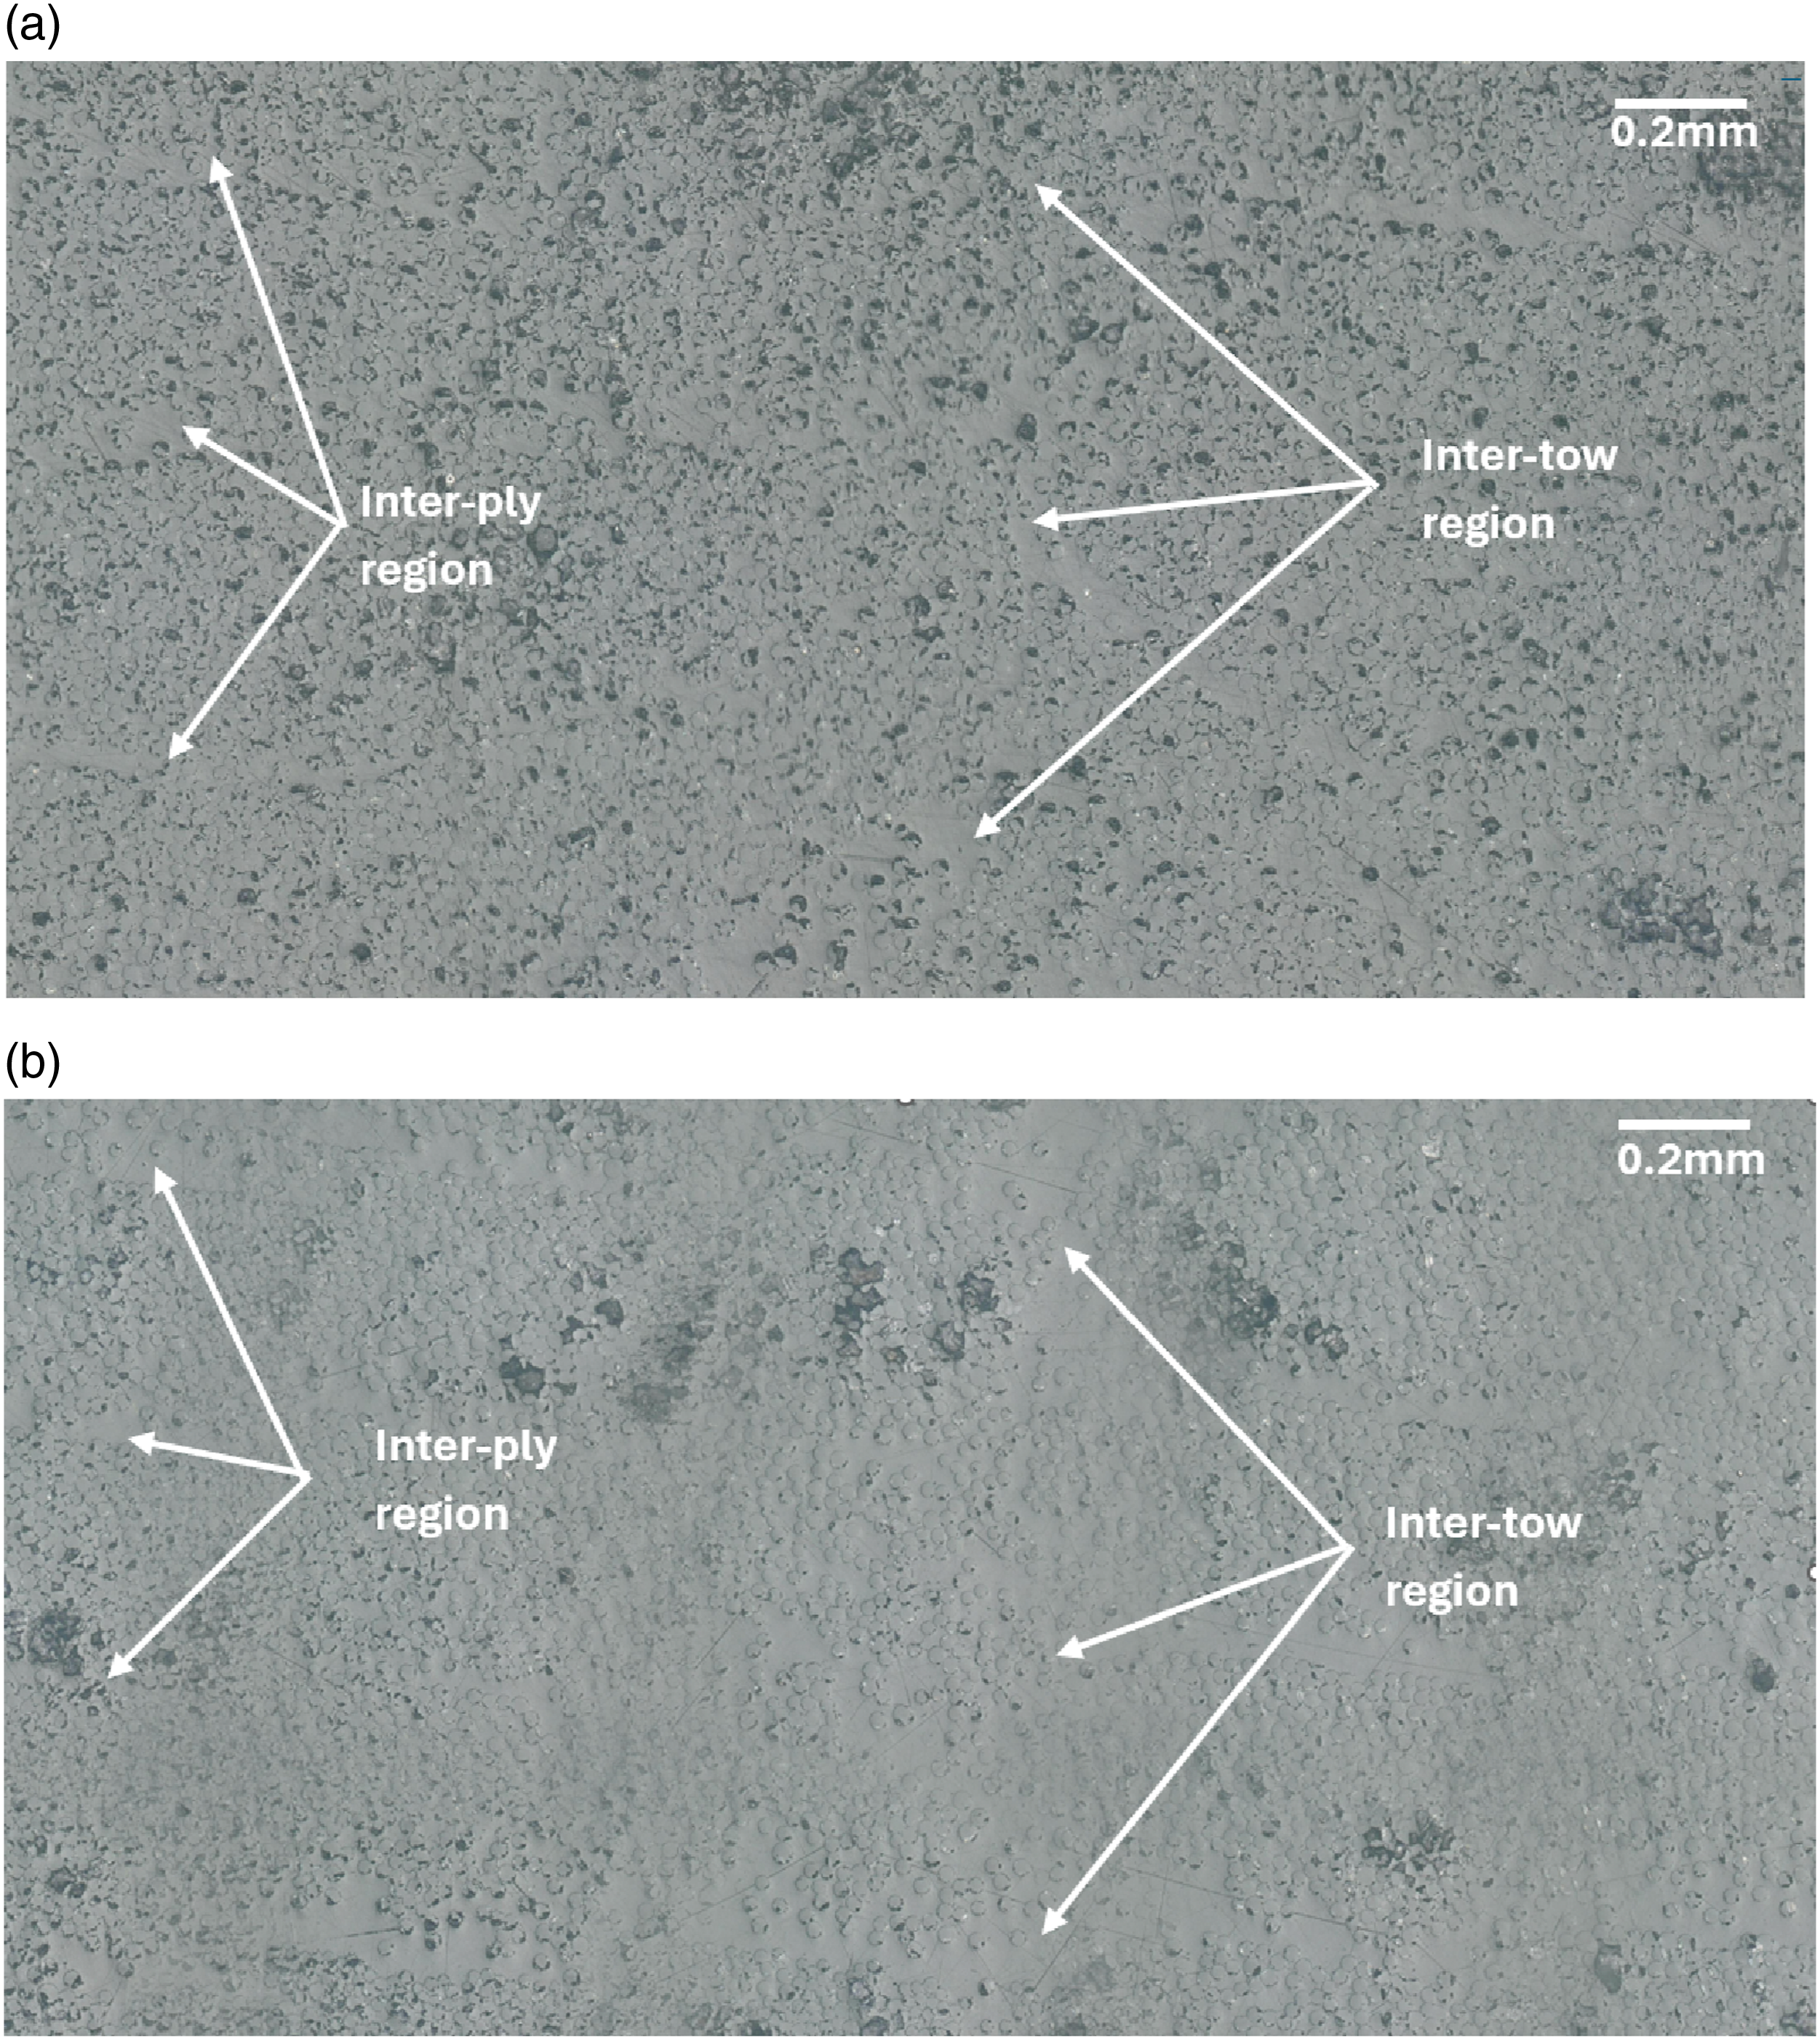
Figure 16(a) shows a sample printed with the process parameters (300°C, 100 mm/min, 0.1 MPa). When pressure is increased to 0.25 MPa, while holding other print parameters constant, a reduction in voids is recorded from the matrix pyrolysis study and also by observation of Figure 16(b). The application of pressure by the nozzle consolidates the tow, and helps the tow flow laterally, but this degree of lateral flow varies with the process conditions. As consolidation pressure increases, more reinforcing fibers are forced into what would be the intertow region, and these regions become more obscured. The converse is true as well, lower consolidation pressure leads to more distinct intertow regions. Similarly, as print speed increases, there’s less reinforced fibers in the inter-tow region, and this region is more matrix rich. This is also the case for the inter-ply regions. During printing, some overlap is included in-between tows to ensure a good inter-tow bond. (a) Optical micrograph at 300°C, 0.1 MPa, 200 mm/min. (b) Optical micrograph at 300°C, 0.25 MPa, 200 mm/min.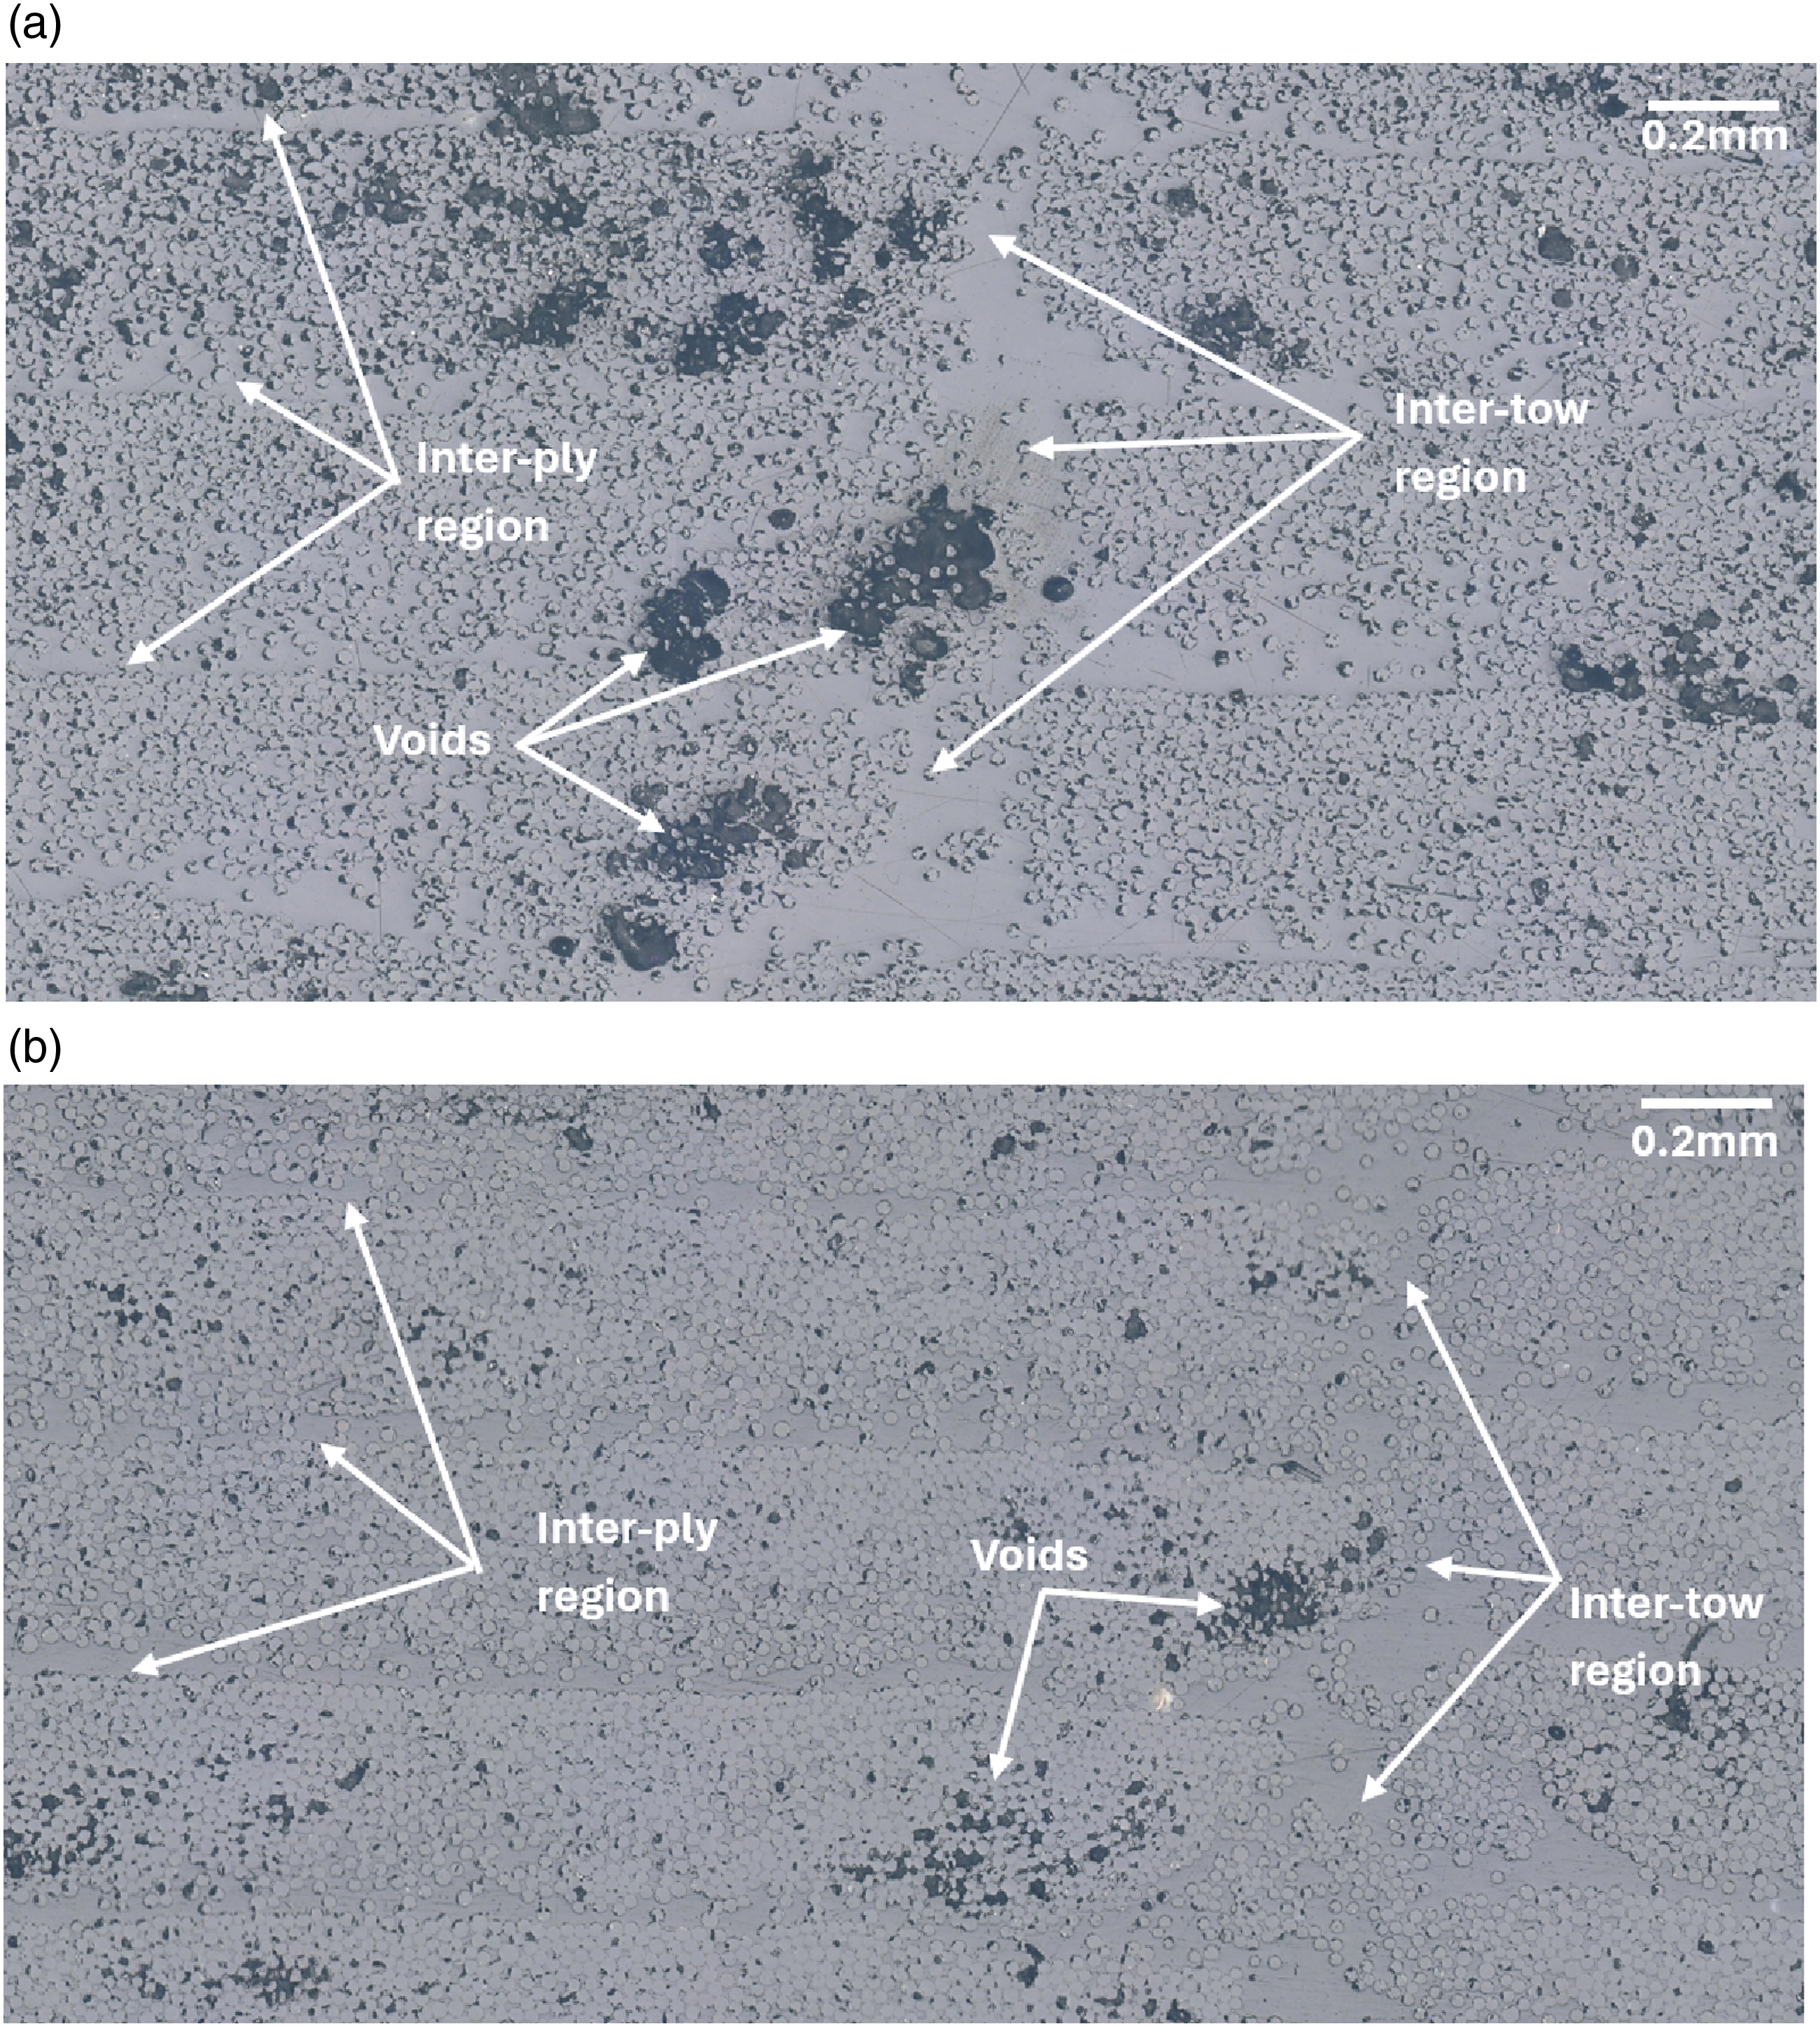
Figure 17 shows a sample printed at the same pressure and printspeed as Figure 16(b) but at a different temperature (250°C). Figure 17 shows more voids within tows relative to Figure 16(b). Lower print temperature leads to more viscous resin which in turn causes less impregnation of the reinforcing fibers. Optical micrograph at 250°C, 0.25 MPa, 200 mm/min.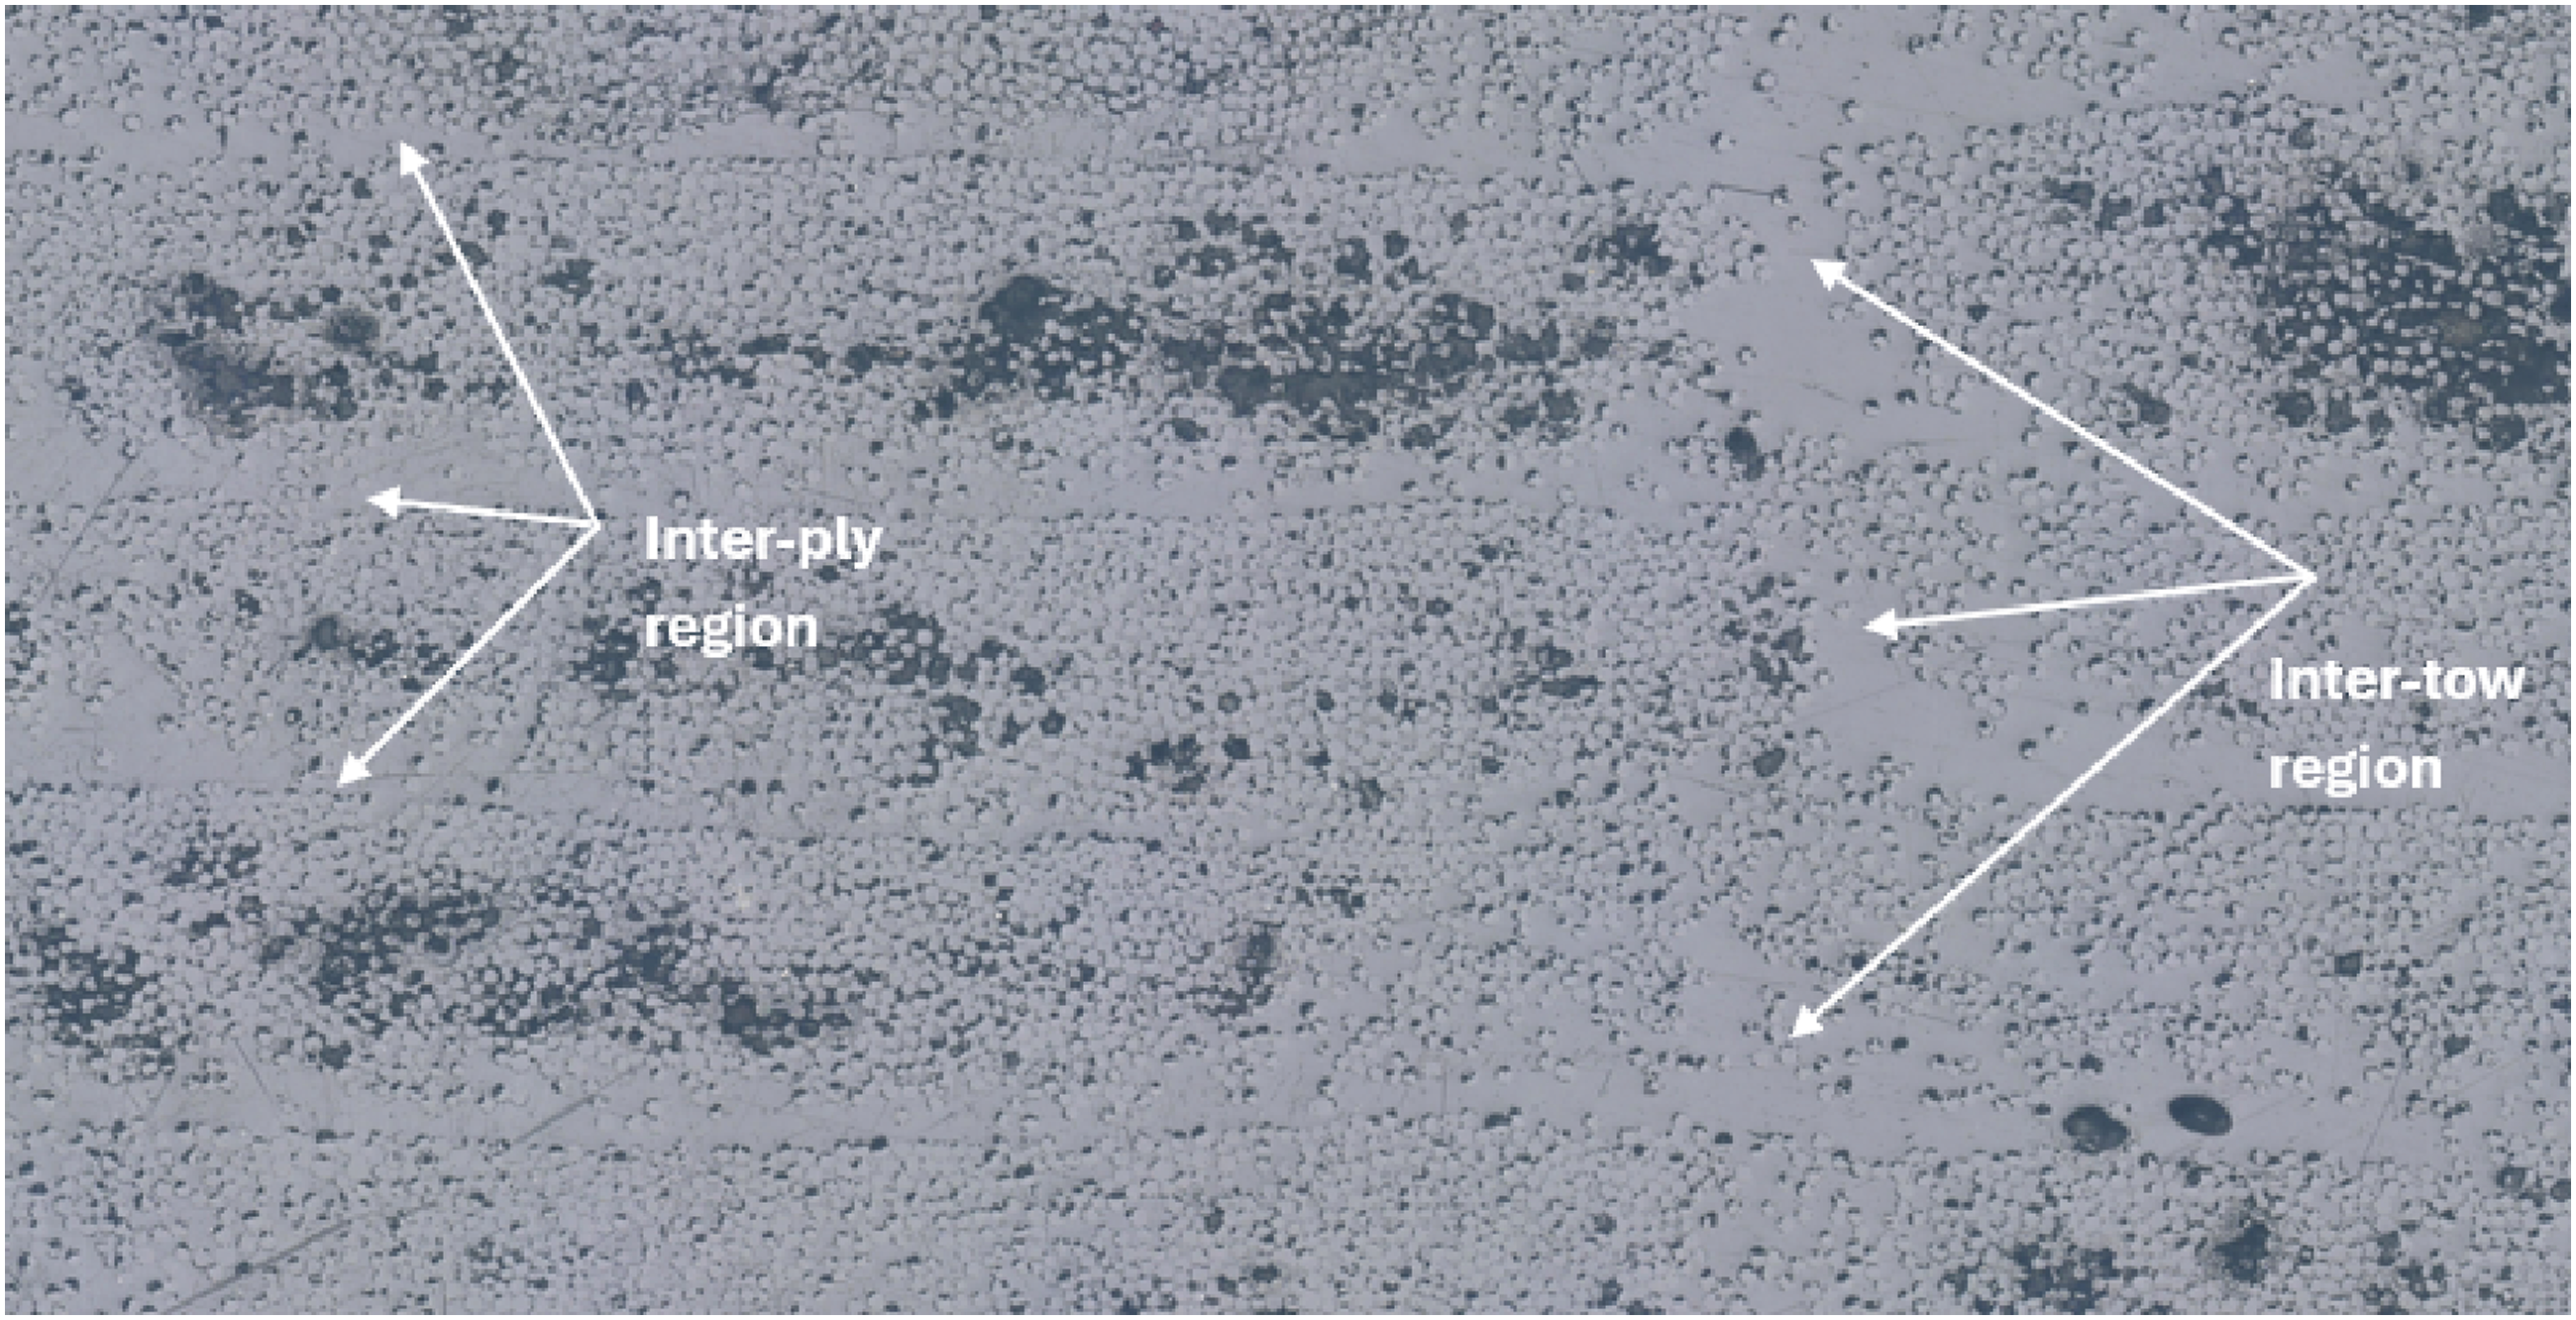
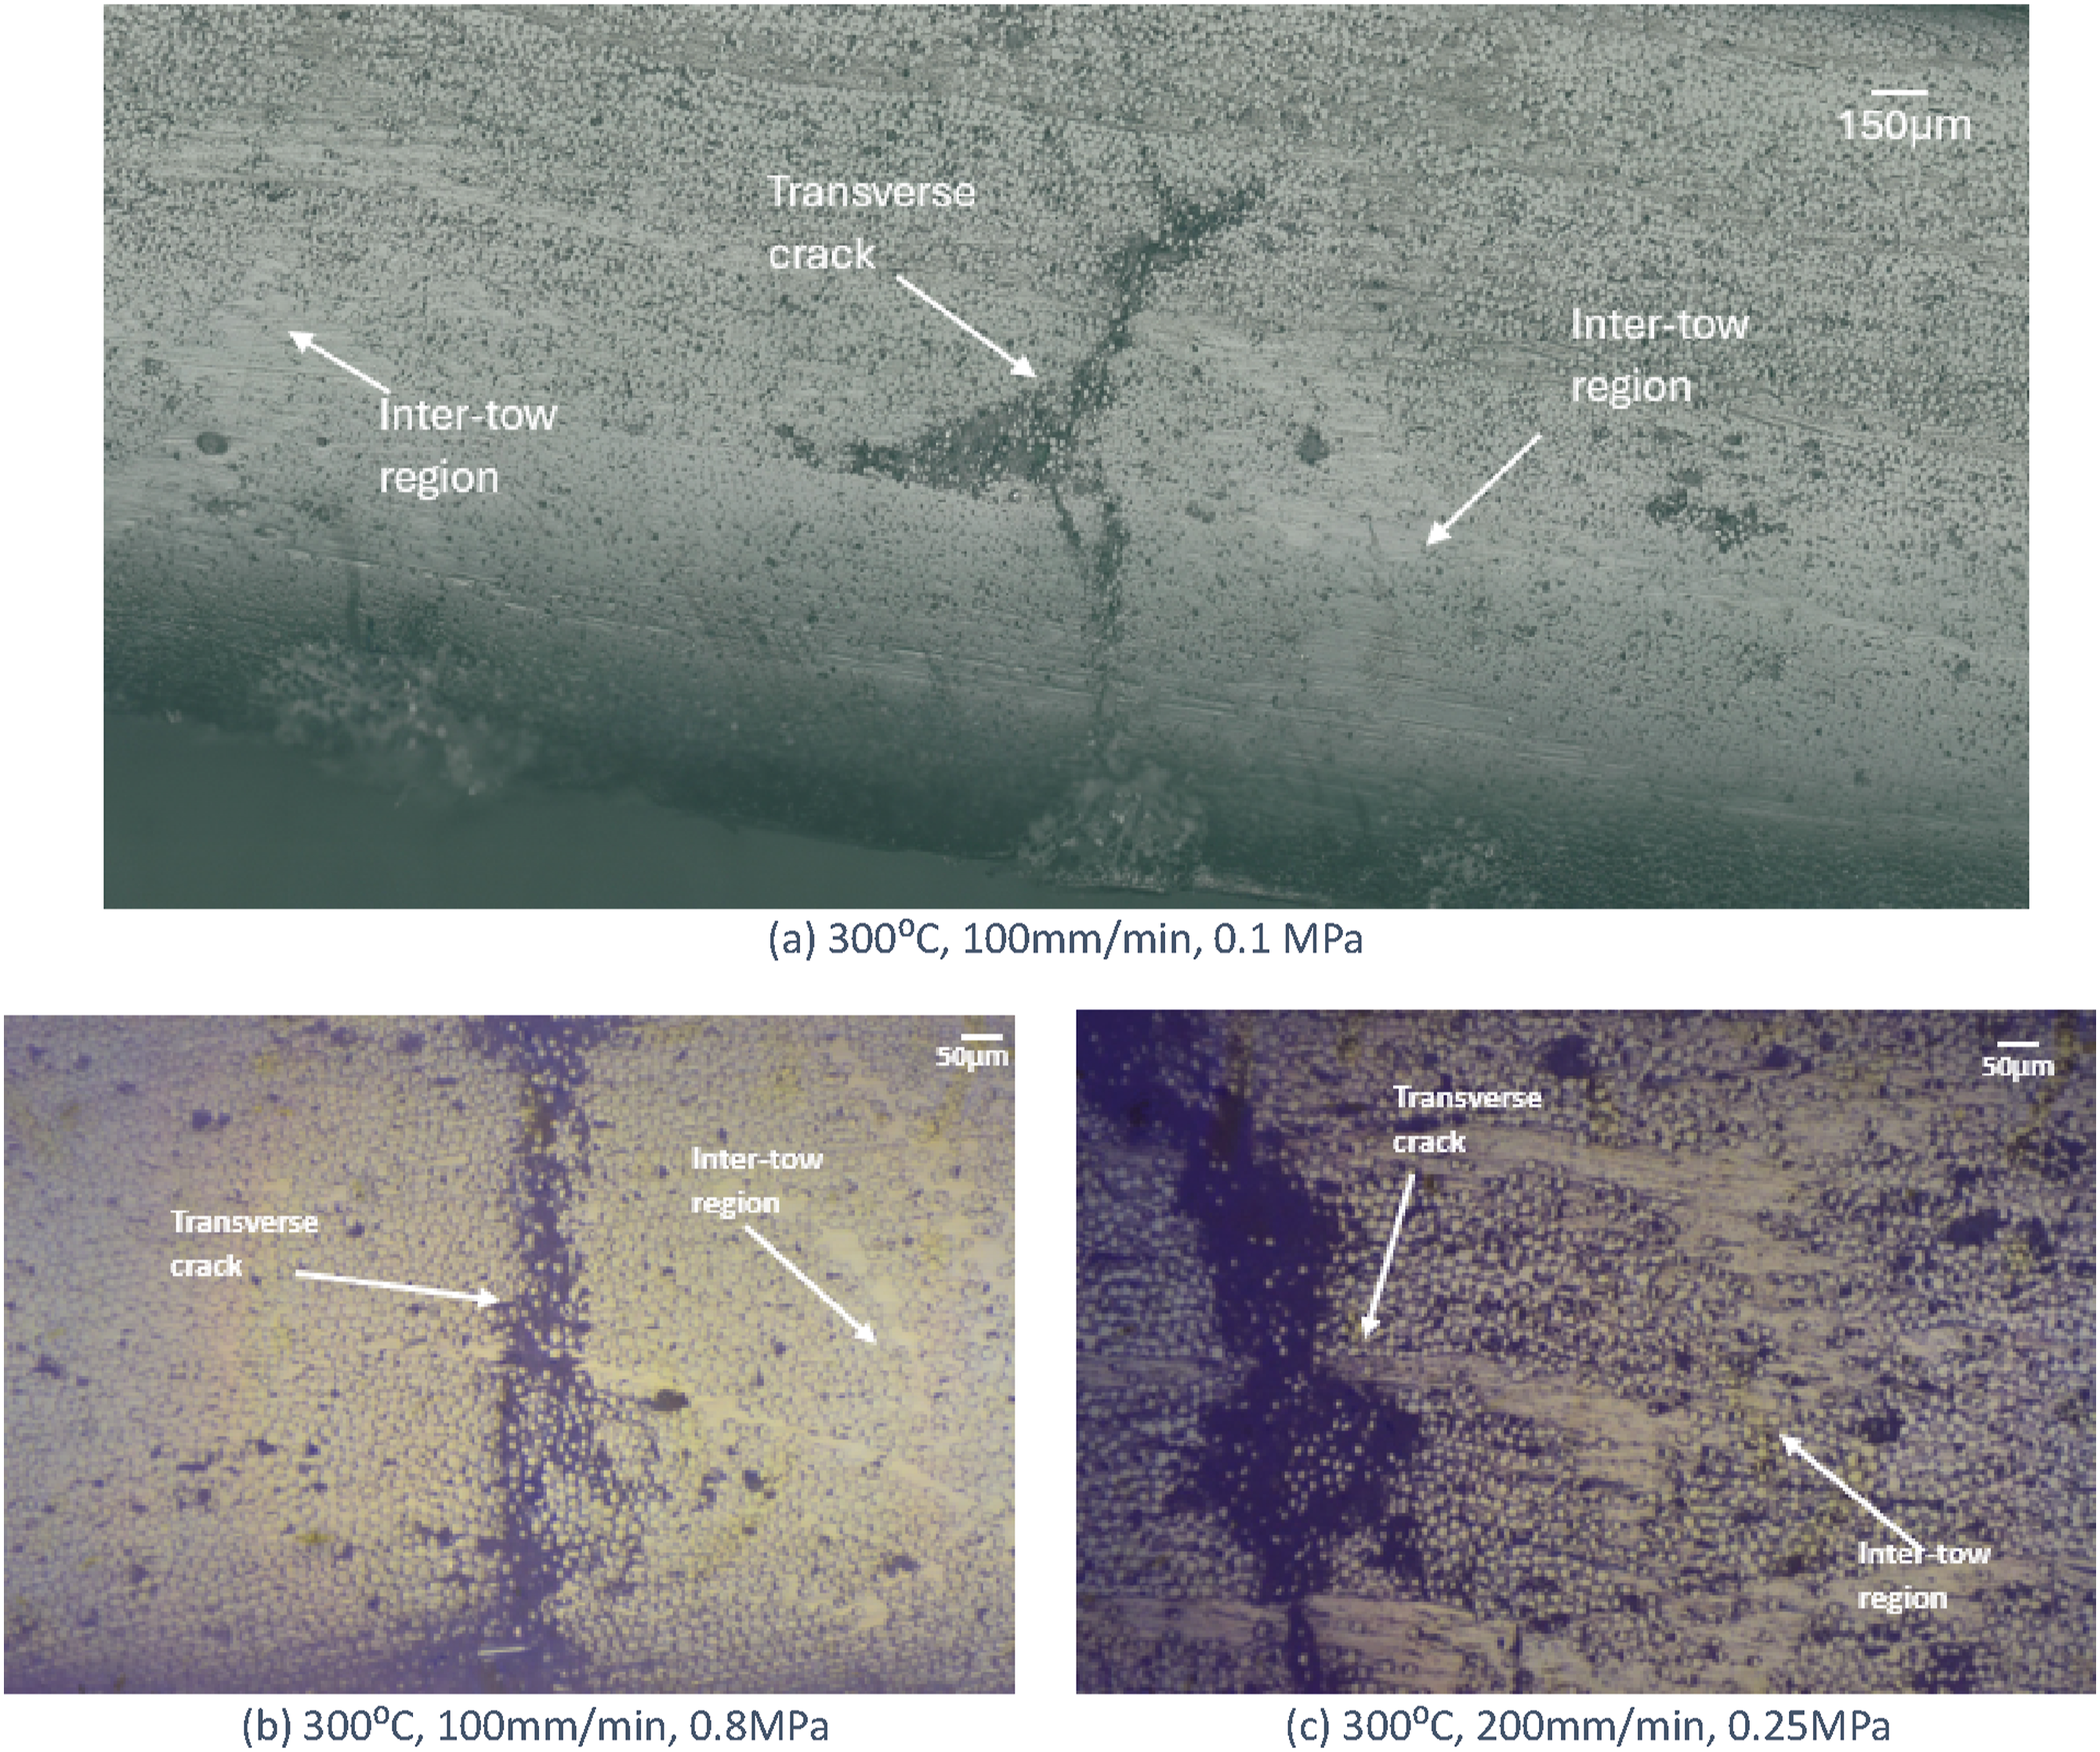
Failure mode
Transverse cracking was the dominant failure mode. Failure occurs universally by transverse cracking and this transverse cracking typically occurs within the tow and not at the inter-tow region. A schematic of a transverse crack is shown in Figure 18. Also, actual images of transverse cracks are shown in Figure 19 where the crack is seen to be within the tow. The crack begins on the tension loaded side of the specimen, under the loading nose. Illustration of transverse crack. (a–c) Optical micrographs showing transverse crack at various process conditions. (a) 300°C, 100 mm/min, 0.1 MPa. (b) 300°C, 100 mm/min, 0.8 MPa (c) 300°C, 200 mm/min, 0.25 MPa.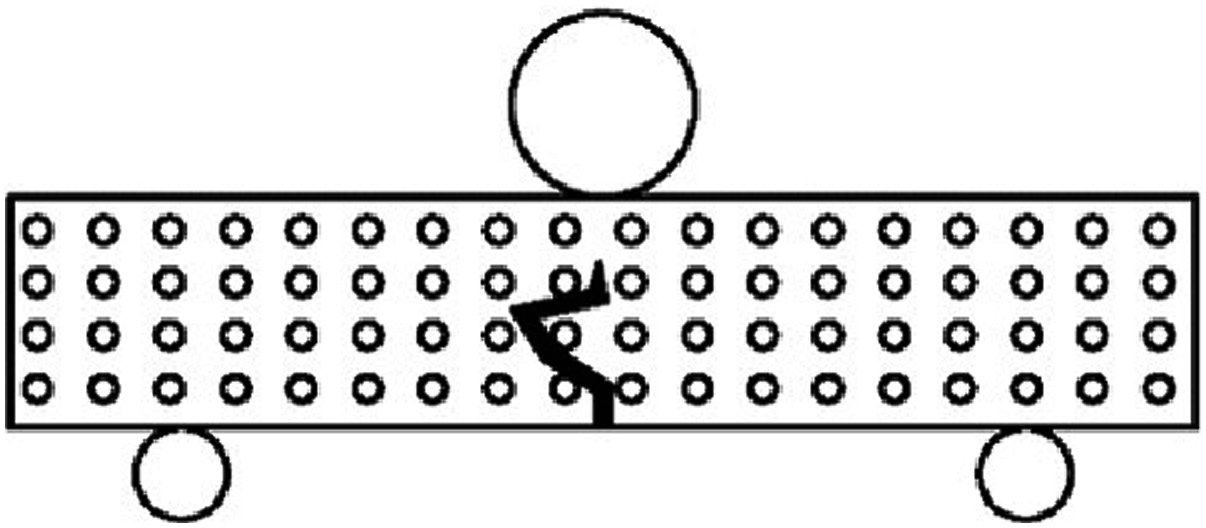
Scanning electron microscopy (SEM) was also performed to investigate the fracture surface at the location of transverse cracking. An electron micrograph is shown in Figure 20 for the test case [250°C, 100 mm/min, 0.25 MPa] which is representative of the fracture surfaces caused by transverse cracking. Failure surfaces are predominantly caused by interfacial debond between the glass fibers and the PET matrix. Transverse flexure testing tends to lead to this form of fracture surface as tensile forces beneath the midplane of the [90]n beam are being transferred from matrix to fiber through the interface. This suggests that the interfacial bond strength is poorer than the intrinsic matrix strength. Scanning electron microscopy showing transverse crack at 250°C, 100 mm/min, 0.25 MPa.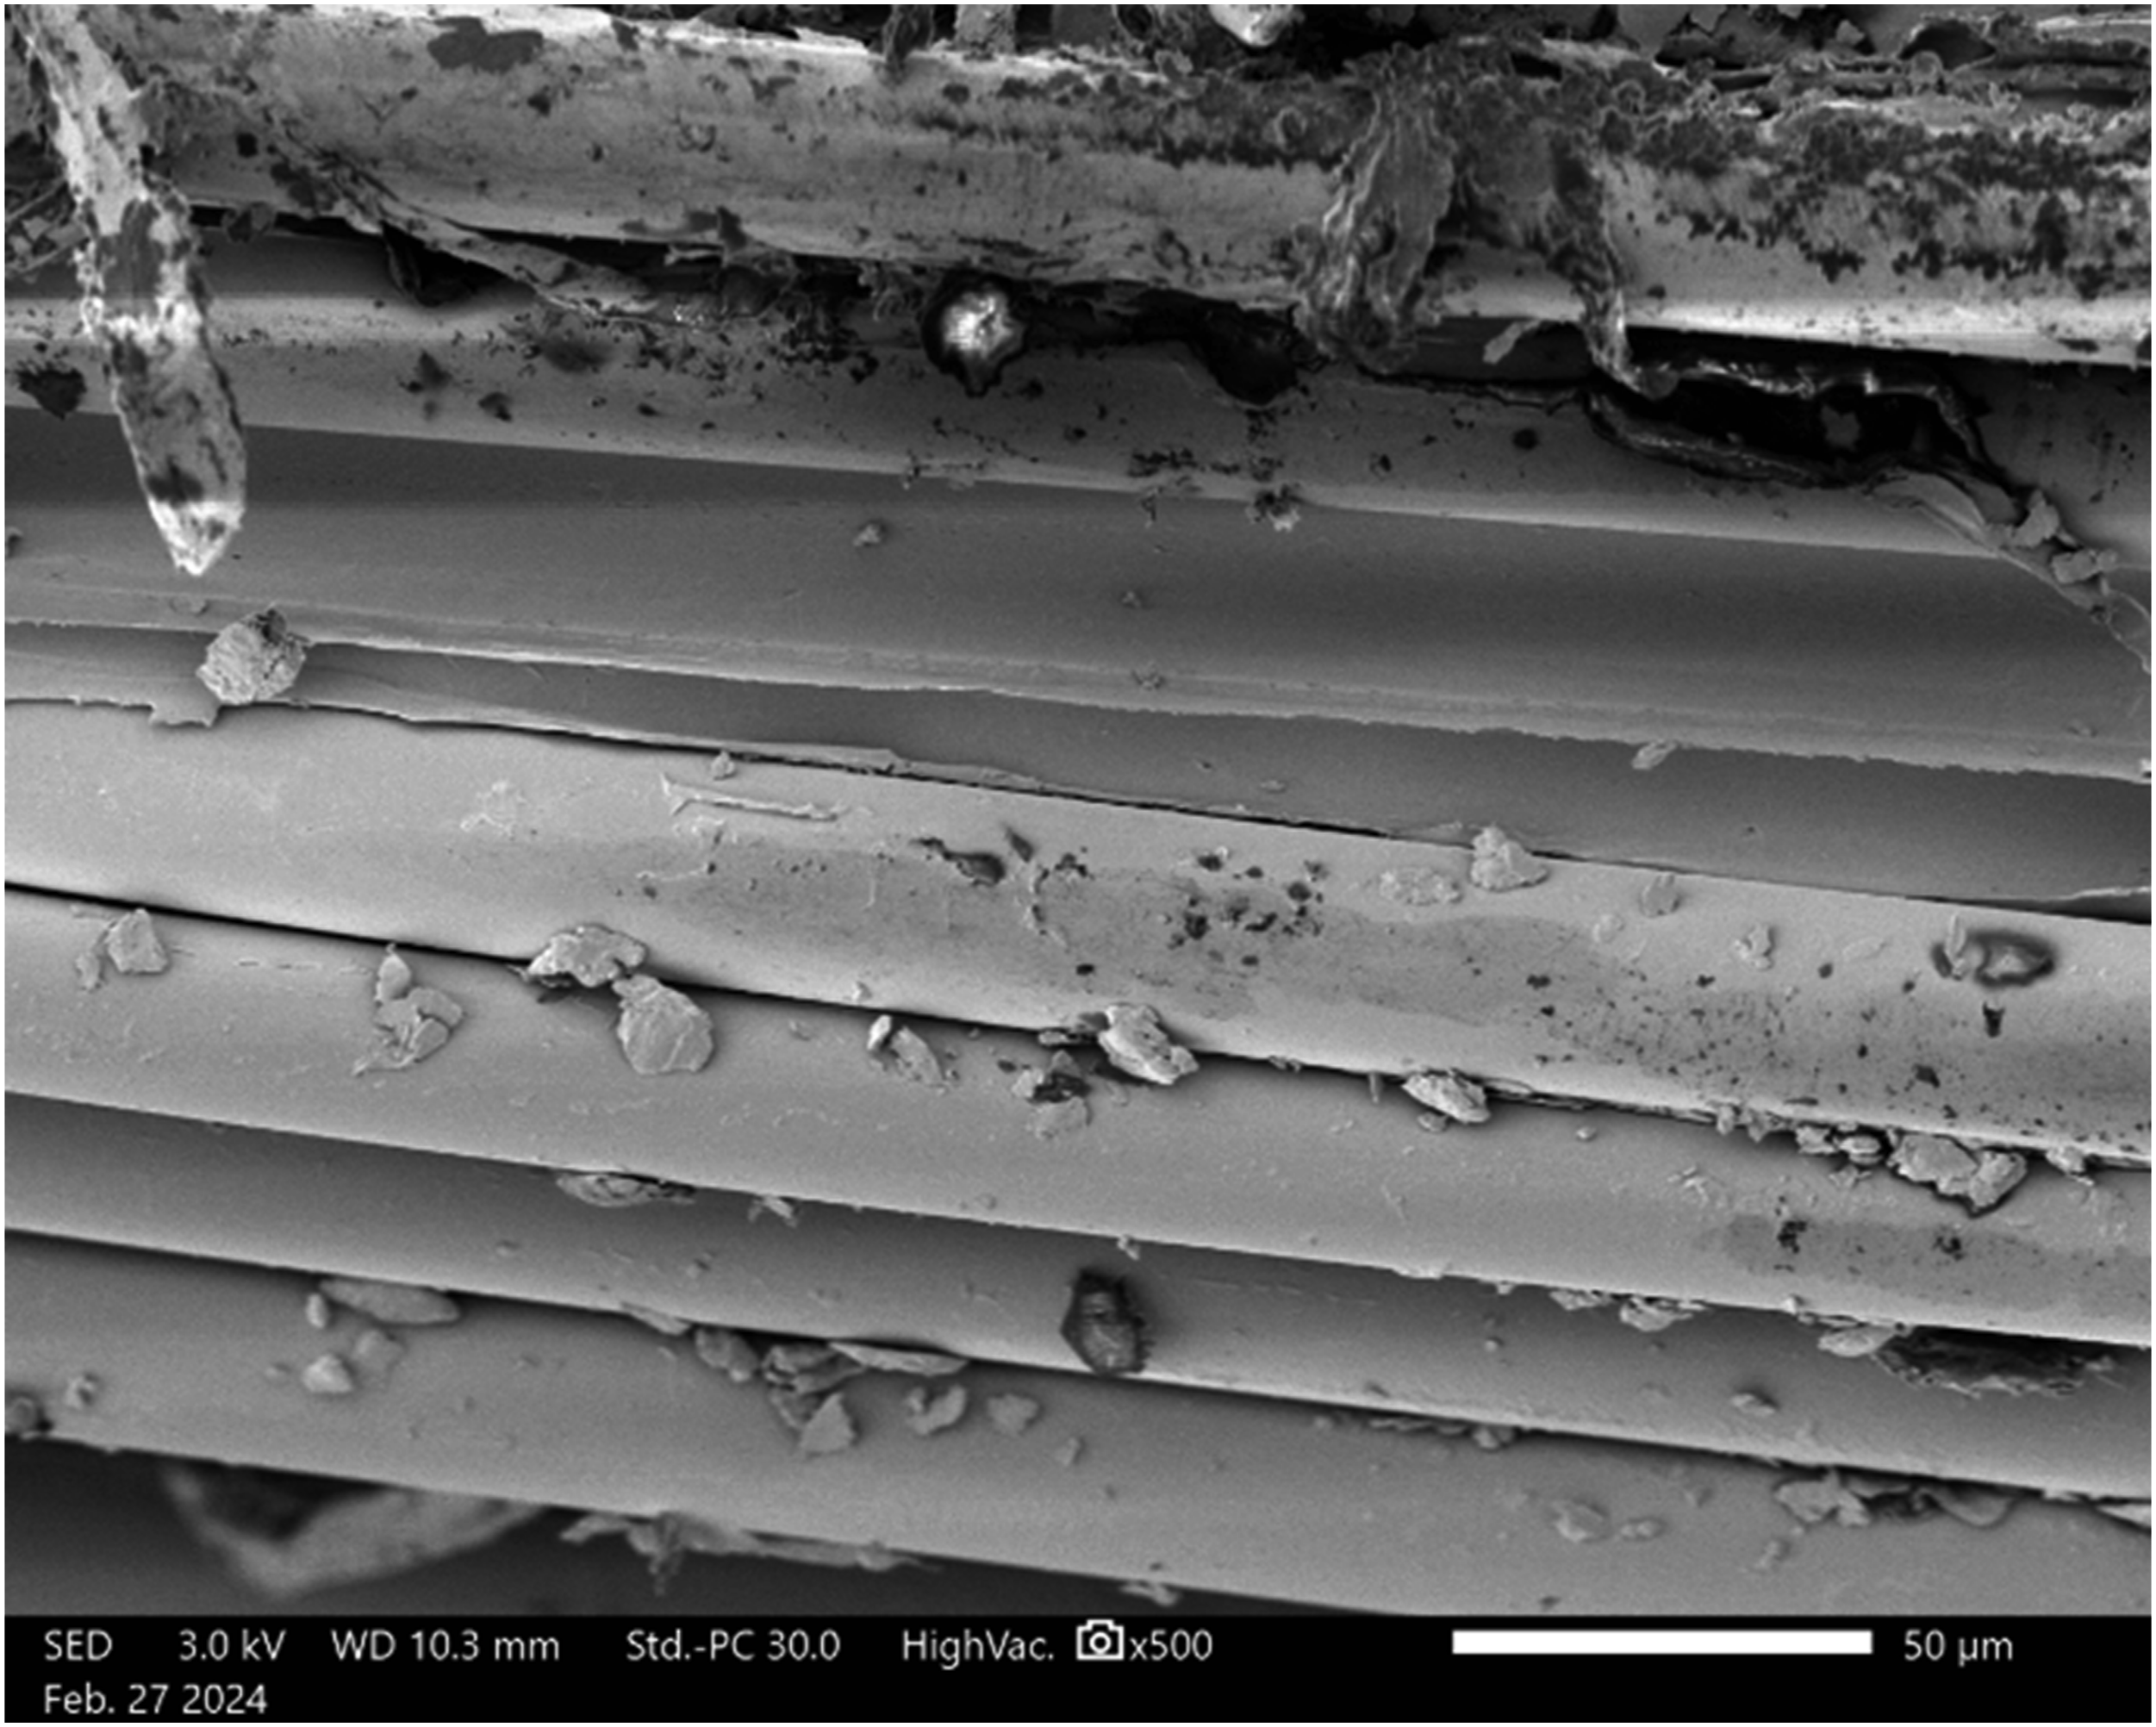
Optimization of process parameters
Surface plots from the regression model, shown in Figure 9 portray an optimum combination of parameters as 300°C, 100 mm/min and 0.42 MPa. New specimens were printed with these process parameters for verification purposes. Transverse flexure testing and constituent fraction testing were performed. Results showed a transverse strength of 19.62 ± 0.97 MPa which was smaller than the predicted optimized value of 21.7 ± 1.1 MPa but still larger than the best transverse strength determined from the full factorial study. The highest transverse strength from the full factorial study was 19.02 ± 0.72 MPa which corresponded to the parameter combination (300°C, 100 mm/min and 0.25 MPa). Results of the full factorial study constituent fraction testing showed a void fraction of 1.93 ± 0.20% and a fiber fraction of 61.12 ± 0.22%. The void fraction of the verification specimen produced using the optimized parameters was lower than the best void fraction (2.50 ± 0.36%) achieved in the full factorial study. The slight increase in the transverse strength and perceptible decrease in void fraction indicates that the optimal process settings do introduce a discernible improvement in composite quality. The overprediction of transverse strength from the surface plots can be attributed to the very sensitive nature of the transverse flexure test, with its tendency for failure to occur at flaw locations. Also, the interval between the intermediate level pressure, 0.25 MPa, and highest pressure, 0.8 MPa, is quite large, and likely enough for the quadratic behavior of the pressure parameter to overshoot the prediction of transverse strength.
In addition, to further improve composite quality, future work could look at printing at higher temperatures. Degradation of the material did not appear to occur at the maximum temperature (300°C) studied here. This implies that higher temperatures could be experimented with, to see if improved results could be attained. Use of a longer heated zone length could also be investigated. High print temperatures and longer heated zone lengths could compensate for faster printing, which is advantageous when scale-up of manufacturing is important.
Conclusions
In this effort, experimental and statistical studies have been performed on the effect of the three process parameters, print speed, temperature, and pressure, on the quality of continuous fiber reinforced composites additively manufactured from commingled yarn. Effects tables from regression analyses showed that all three main process parameters have significant effect. There were also significant interaction effects between pressure and temperature, and between pressure and print speed. Print speed and temperature are significant, as they both have a direct effect on the viscosity of the polymer matrix melt which in-turn relates to the degree of impregnation of the reinforcing fiber tows and to the subsequent quality of the composite. Consolidation pressure is significant and interacts with temperature and print speed. Pressure has a quadratic effect with transverse strength, where strength increases with pressure up to a point, before steadily decreasing. The decrease in transverse strength corresponded to a fiber volume fraction increase due to the lateral loss of resin during manufacturing and could be attributed to insufficient matrix material to fully transfer the stresses. The use of commingled material does not require the high-pressure levels commonly needed in infusing a dry fiber bed with thermoplastic resin, as penetration distance is less. The dominant failure mode across all test cases was by transverse cracking within the tow and not at the intertow regions. Electron micrography showed that this failure occurred largely at the fiber-matrix interface and not in the matrix itself. Transverse strength was also found to have a linear correlation with void content which supports the premise that the transverse flexure test can be a suitable experimental technique for evaluating composite quality.
Footnotes
Acknowledgements
The authors are thankful to Fiber Glass Industries, Amsterdam, New York for providing the commingled material used in this research work.
Declaration of conflicting interests
The author(s) declared no potential conflicts of interest with respect to the research, authorship, and/or publication of this article.
Funding
The author(s) disclosed receipt of the following financial support for the research, authorship, and/or publication of this article: This research is based upon work supported by the U.S. Department of Energy’s Office of Energy Efficiency and Renewable Energy (EERE) under the Advanced Manufacturing Office, [Award Number DE-EE0009404]. The views expressed herein do not necessarily represent the views of the U.S. Department of Energy or the United States Government.