
Abstract
The flourishing environmental concerns have grabbed the attention of researchers developing environmentally supportive materials in various fields. A green approach was used to create biopolymer blend composites based on polyvinyl alcohol (PVA) and chitosan (CS) doped with various concentrations of grape seed (GS). Various analytical techniques, such as Fourier-transform infrared spectroscopy (FTIR), UV–visible (UV) spectra, field emission scanning electron microscope (FE-SEM) and differential scanning calorimetry (DSC) were used to evaluate the optical, structural and thermal properties of the prepared blend composites. The optical properties of blend composites were determined by UV spectroscopy and the findings revealed that absorption intensity increased with increasing GS, while bandgap energy decreased from 4.18 eV for pure blend to 2.91 eV for blend/15 wt% GS. The homogeneous distribution of GS particles in the biopolymer blend was identified with FE-SEM images. DSC results showed that increasing the GS content increased the glass transition temperature of the blend composites. The AC conductivity and dielectric constant were measured using the LCR meter. The conductivity rises with increasing frequency and dosage of GS, with the greatest conductivity obtained at 15 wt% loading. In comparison to a pure blend, it was discovered that the inclusion of 15 wt% GS enhanced the tensile strength by 50%, hardness by 17% and the reduction in elongation at break by 19 %. As a consequence, environmentally friendly PVA/CS/GS biopolymer blend composites with excellent mechanical, thermal, electrical, and dielectric parameters might be a viable green option for flexible electronic, electrochemical and energy storage devices.
Keywords
Introduction
Ecological and industrial contaminations, pollution, and crises have allured appreciable interest in the production of different polymers with versatile properties. These polymers become attractive because of their potential uses in different fields. Most polymers are being used as a replacement for conventional plastic materials due to their increased characteristics, such as their lightweight and low cost, along with their enhanced physiochemical properties.1–3 Due to the increased consumption of various petroleum-based polymers, there is an urgent obligation for the advancement of biodegradable polymers. 4 In this era of huge energy consumption, the manufacture and use of petroleum-based polymers have enhanced the environmental catastrophe. As a result, increasing biodegradability is a key challenge in industrial applications of biopolymers.5–7 Synthetic macromolecules, such as polyvinyl alcohol (PVA), have a prominent status as important and biodegradable materials with biocompatible properties. PVA is a semicrystalline, water-soluble, non-toxic, colourless, slightly soluble in ethanol but insoluble in other organic solvents.8,9 It has been widely used in diverse fields, including the industrial, medical and food sectors. It is also a thermoplastic polymer that is beneficial to living tissues, commercial usage, and the production of lacquers, surgical threads, resins, and packaging materials.10,11
Chitosan is a cationic polysaccharide made up of evenly distributed N-acetyl-
Blending various biopolymers with seed extract produces novel materials with altered and enhanced properties that are different from their constituent polymers.23,24 The introduction of seed extract to the blend results in the upgrading of several characteristics and technological properties, as well as a reduction in cost. Reinforcement of various plant seed extracts in the polymer matrix has gained much interest as it is rich in a variety of reactive functional groups with antioxidant properties. 25 Grape seeds account for around 15% of solid waste in the wine industry and contain 70% of polyphenol compounds, including catechins and epicatechin, gallic acid and oligomeric procyanidins.26,27 The objective of this study is to explore the effect of embedding GS extract into a biopolymer blend (PVA/CS) using a simple green technique. The chemical bonding involved in the PVA/CS blend with GS is investigated using FTIR and UV spectroscopy. FE-SEM is used to examine the morphology and dispersion of reinforcing filler in the biopolymer blend. The effect of GS on the variations in the glass transition temperature of the biopolymer blend is studied by DSC. Furthermore, the impact of seed extract on temperature-dependent AC conductivity and dielectric characteristics is investigated. Finally, the tensile strength, elongation at break and surface hardness of different contents of GS incorporated PVA/CS biopolymeric blend composite films are tested using ASTM techniques.
Experimental
Materials and methods
Chitosan with 88.1% degree of deacetylation and PVA with an average molecular weight of 1.95 × 10³ g/mol were received from Hi-Media, India. Acetic acid was purchased from Merck (India). The grape seeds were bought from Manjri Farm, Pune, India. All the experiments were carried out with freshly prepared solutions.
Preparation of grape seed extract
The powdered grape seed samples (100 g) were extracted with methanol at 45°C for 3 h. The extracts were pooled together, filtered and concentrated under reduced pressure at 50°C by rotary evaporation, and lyophilized under a high vacuum at −40°C to yield the freeze-dried aqueous extract of GS.
Preparation of PVA/CS blend film
Approximately 5 g of CS was dissolved in 2% acetic acid with constant stirring. The prepared solution was filtered to eliminate dust and other contaminants. Airborne particles were removed by keeping the solutions for 2 h. Approximately 5 g of PVA was dissolved in 100 mL of distilled water and slowly heated until it became a homogenous solution. The CS solution was added drop by drop to the PVA solution and swirled for 30 min. The resultant homogenous solutions were poured into a petri dish and dried at 60°C for 48 h. The uniform films were peeled off and preserved in a desiccator for future research. All of the films produced were clear and devoid of air bubbles.
Preparation of PVA/CS blend with GS
The aforementioned procedure for the preparation of PVA/CS blend was carried out in the presence of 5, 10, 15 and 20 wt% of grape seed extract using water as a solvent. The films from PVA/CS blend with various contents of GS composites were prepared using the same solution casting method as discussed above.
Characterization
A JASCO V-750 spectrophotometer (200–800 nm) was used to measure the UV-vis spectra of blend composites. The infrared spectra in the 400–4000 cm−1 region were evaluated using FTIR spectroscopy (JASCO 4100). FE-SEM (Carl Zeiss, VP500 model) was used to examine the surface morphology of the PVA/CS/GS. Thermal transitions of PVA/CS/GS composites were measured using a PerkinElmer Inc. DSC-8000 analyzer at a heating rate of 10°C per min. Tensile tests of the PVA/CS blend and its composites were performed using the dumbbell-shaped samples as per the ASTM method D638 (AGS-X 5000N universal testing machine) at a crosshead rate of 10 mm/min. At least six specimens were measured for each sample. The surface hardness of the samples was determined using an ASTM D-2240 Shore A-type durometer. The electrical conductivity measurement was carried out on circular-shaped samples using the LCR meter of the HIOKI 3570 over a temperature range of 30 to 90°C at various frequencies.
Results and discussion
UV–visible spectra
Figure 1 shows the UV spectra of the PVA/CS blend with different loadings of GS at room temperature. The UV peak observed at 274.28 nm is attributed to the π→π* transition of the carbonyl group present in the PVA/CS blend.
21
However, the blend with 5, 10, 15 and 20 wt% GS incorporated samples show the UV absorption peaks at 275.4, 275.8, 276.2 and 275.6 nm, respectively. Furthermore, the strength of composite absorption peaks dropped progressively with increasing seed extract concentration in blend films, along with a minor shift to a higher wavelength, due to a strong hydrogen bonding interaction between the PVA/CS segments and GS. It is also visible from the graph that the broadness of the UV peak of the composite decreases with an increase in the loading of GS. This suggests that there is a strong adhesion between GS extract and the PVA/CS blend. UV-Vis spectra of PVA/CS with different contents of GS.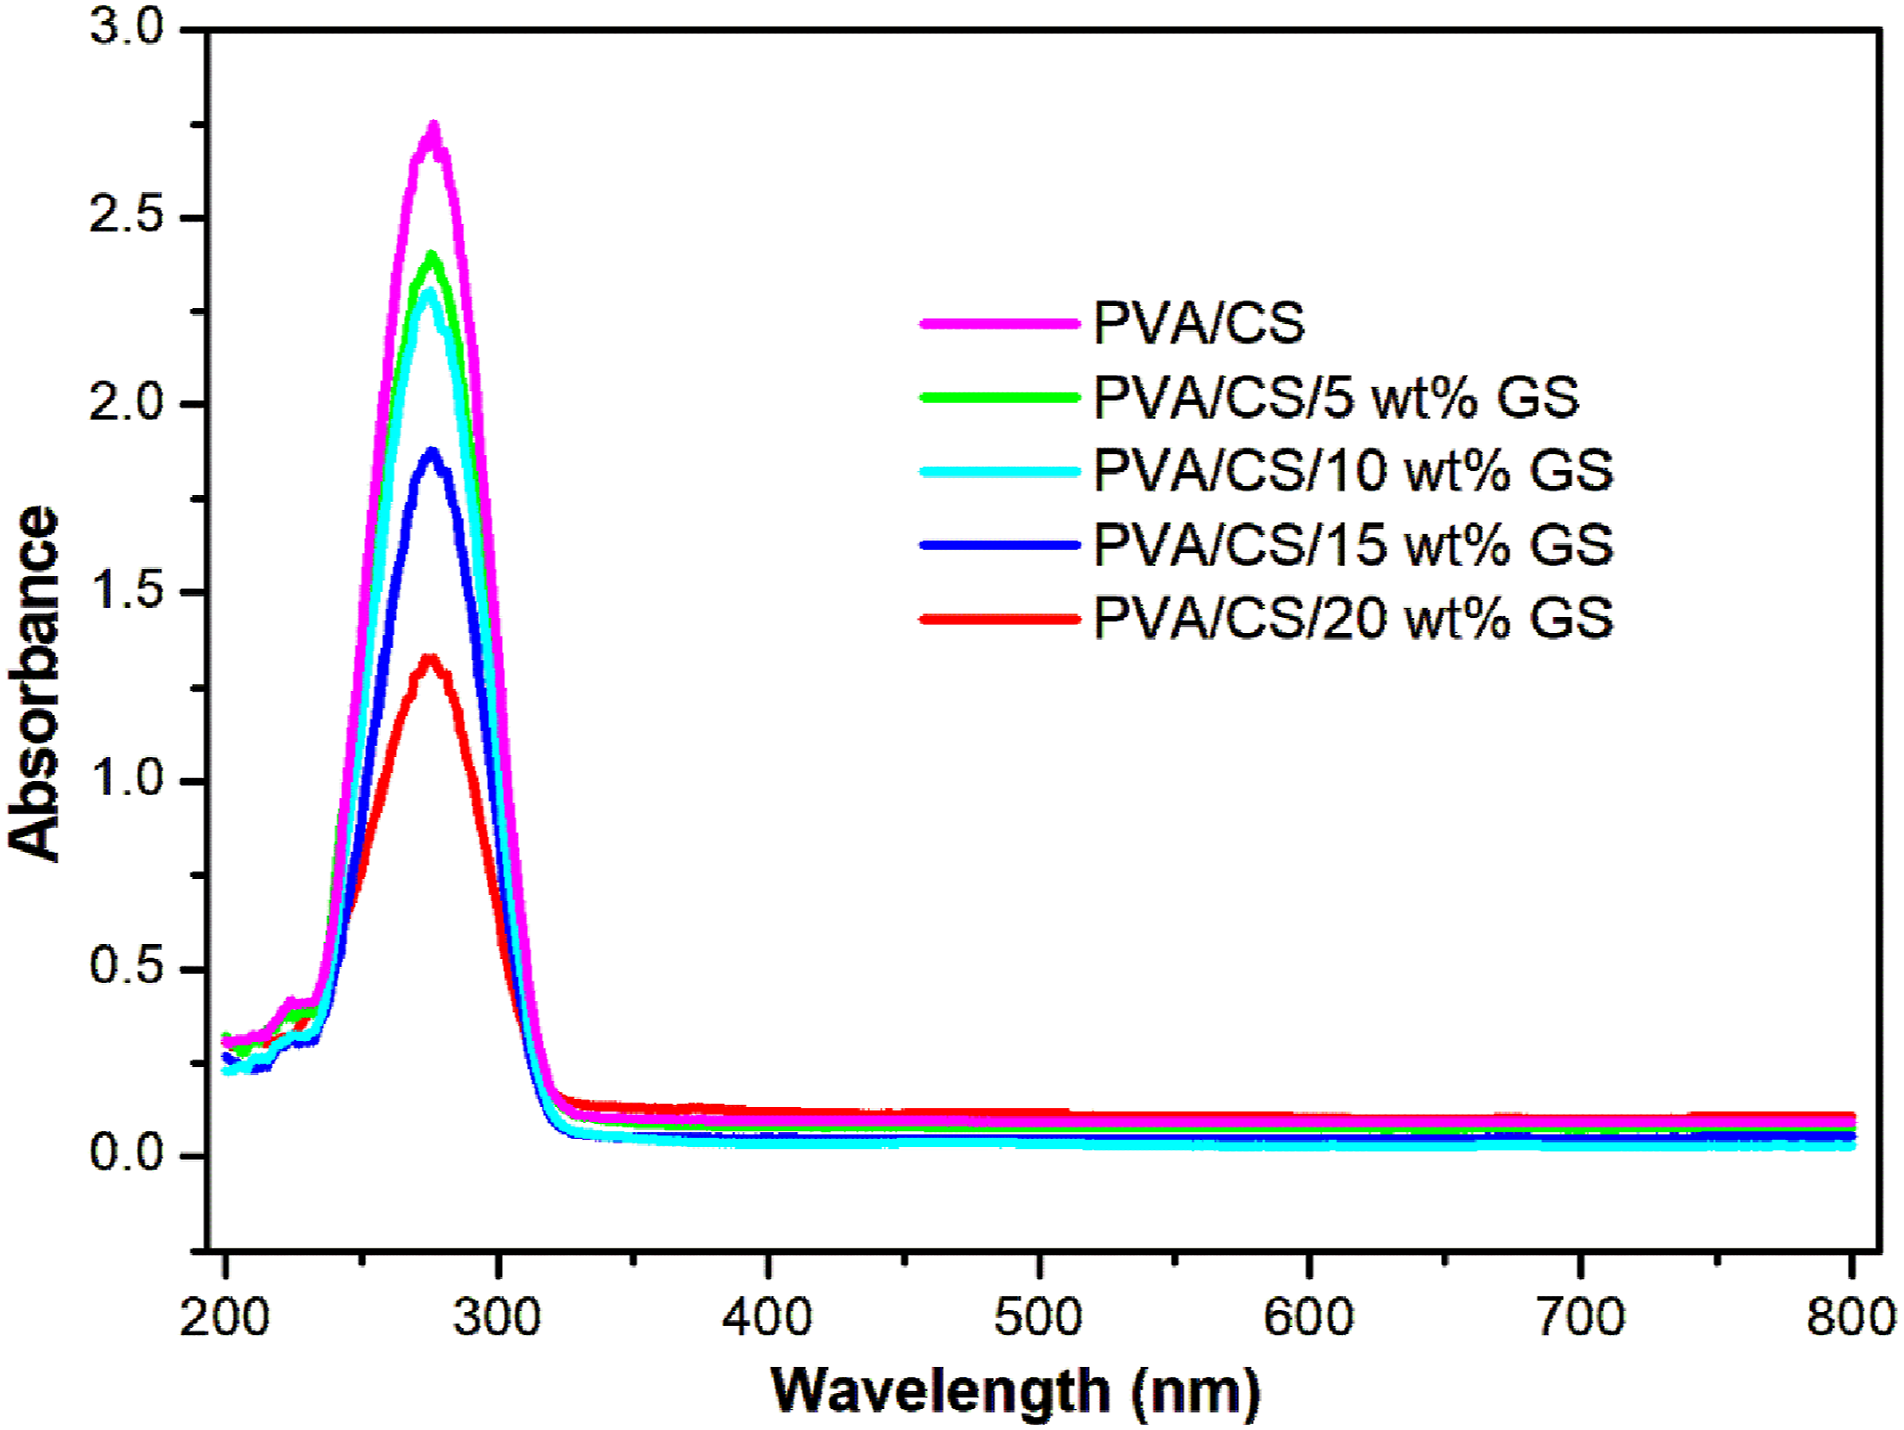
Figure 2 depicts the optical bandgap energy (Eg) of PVA/CS/GS and the measured Eg values of all films are recorded in the figure. It can be seen that the PVA/CS blend film has Eg value of about 4.093 eV, which is consistent with the value of the blend reported elsewhere.21,28 The seed extract incorporated blend composite decreases with the loading of bio-filler indicating the transition of electrons arises from the activation/conductive band of the composite as a result of light entering it. Furthermore, the Eg falls from 4.093 eV for the blend to 4.065 eV for the 15 wt% bio-filler containing PVA/CS blend. The drop in Eg is ascribed to the defects and the changes in morphology developed in the forbidden bandgap energy of samples, which promote the electron transfer from valance bands to the conduction band energy level. Tauc plots of PVA/CS blend and PVA/CS/GS composites.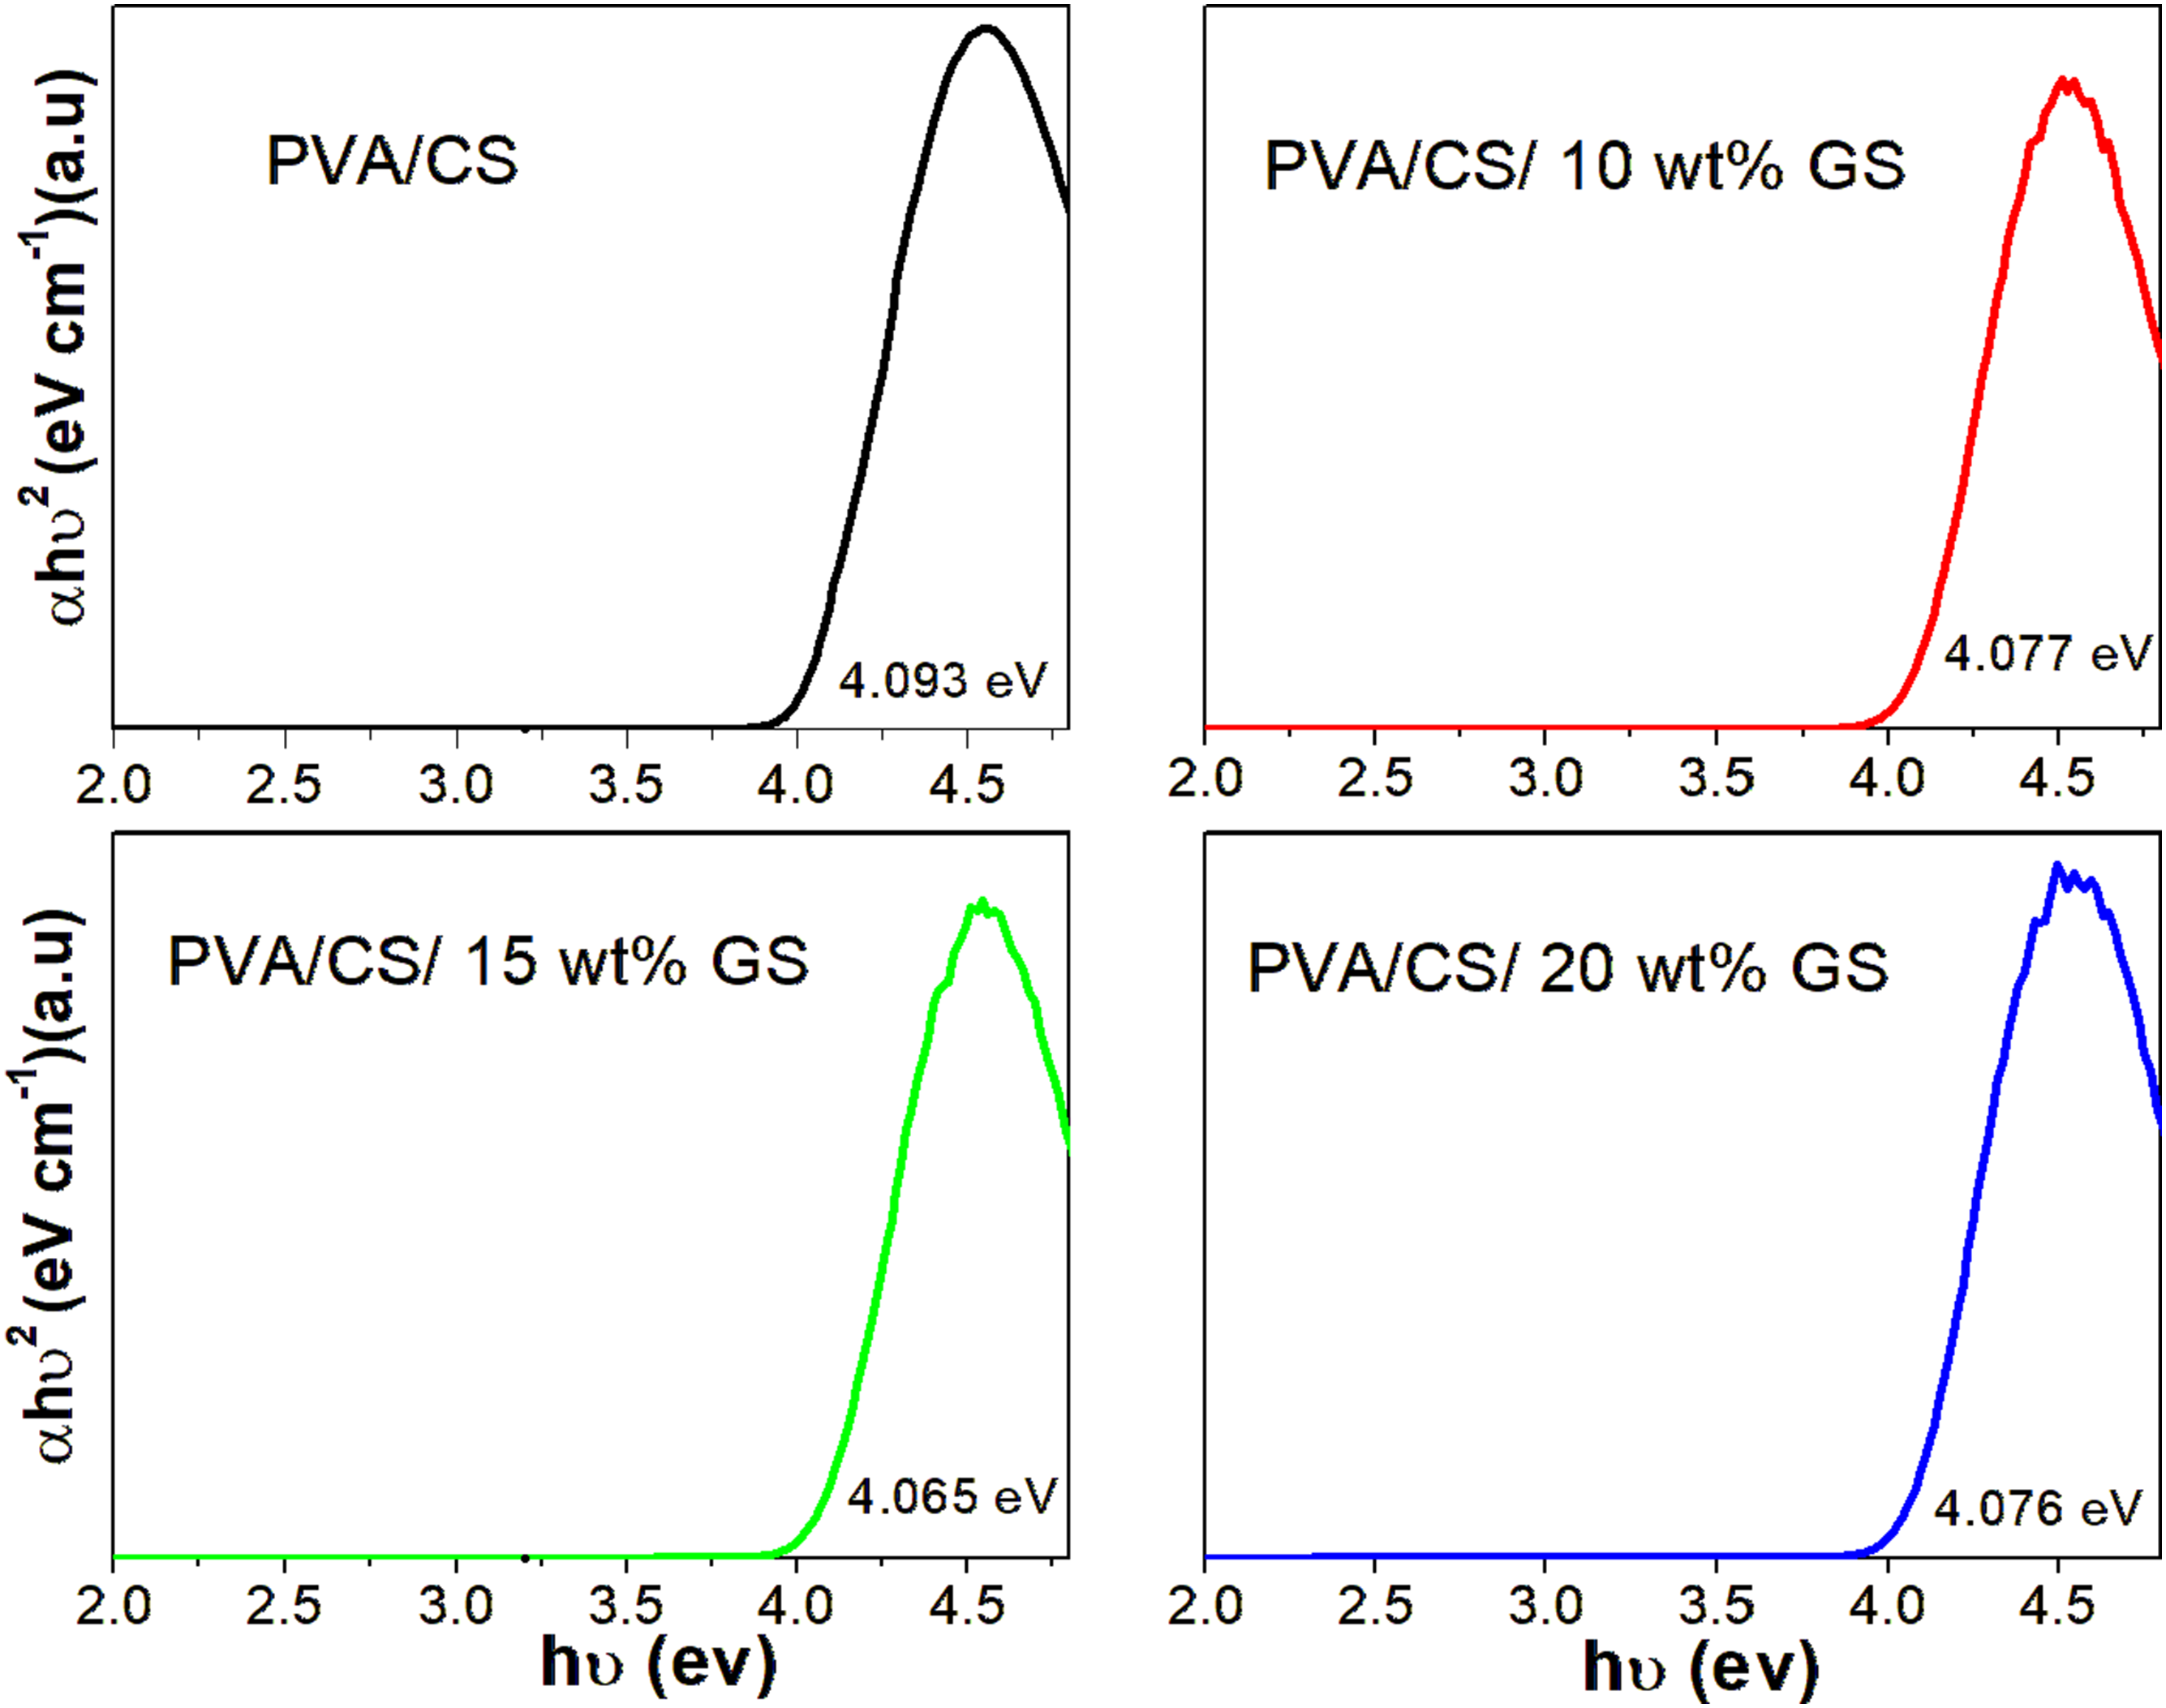
Fourier-transform infrared spectroscopy spectra
The FTIR spectrum of PVA/CS blend given in Figure 3 shows a broad absorption band in the area of 3600–3200 cm−1 ascribed to stretching vibrations of the hydroxyl groups of PVA and of the primary amine of CS molecules (OH and NH2).29,30 A broad and strong absorption band appears at 3378 cm−1 is assigned to the stretching vibrations of the functional groups. The peak observed at 1654 cm−1 is related to the O–H scissor vibrations or amino group deformations from attached water molecules. The polymer blend shows a peak at 1076 cm−1, which is due to the stretching vibrations of the O–H bending of the blend segments.
22
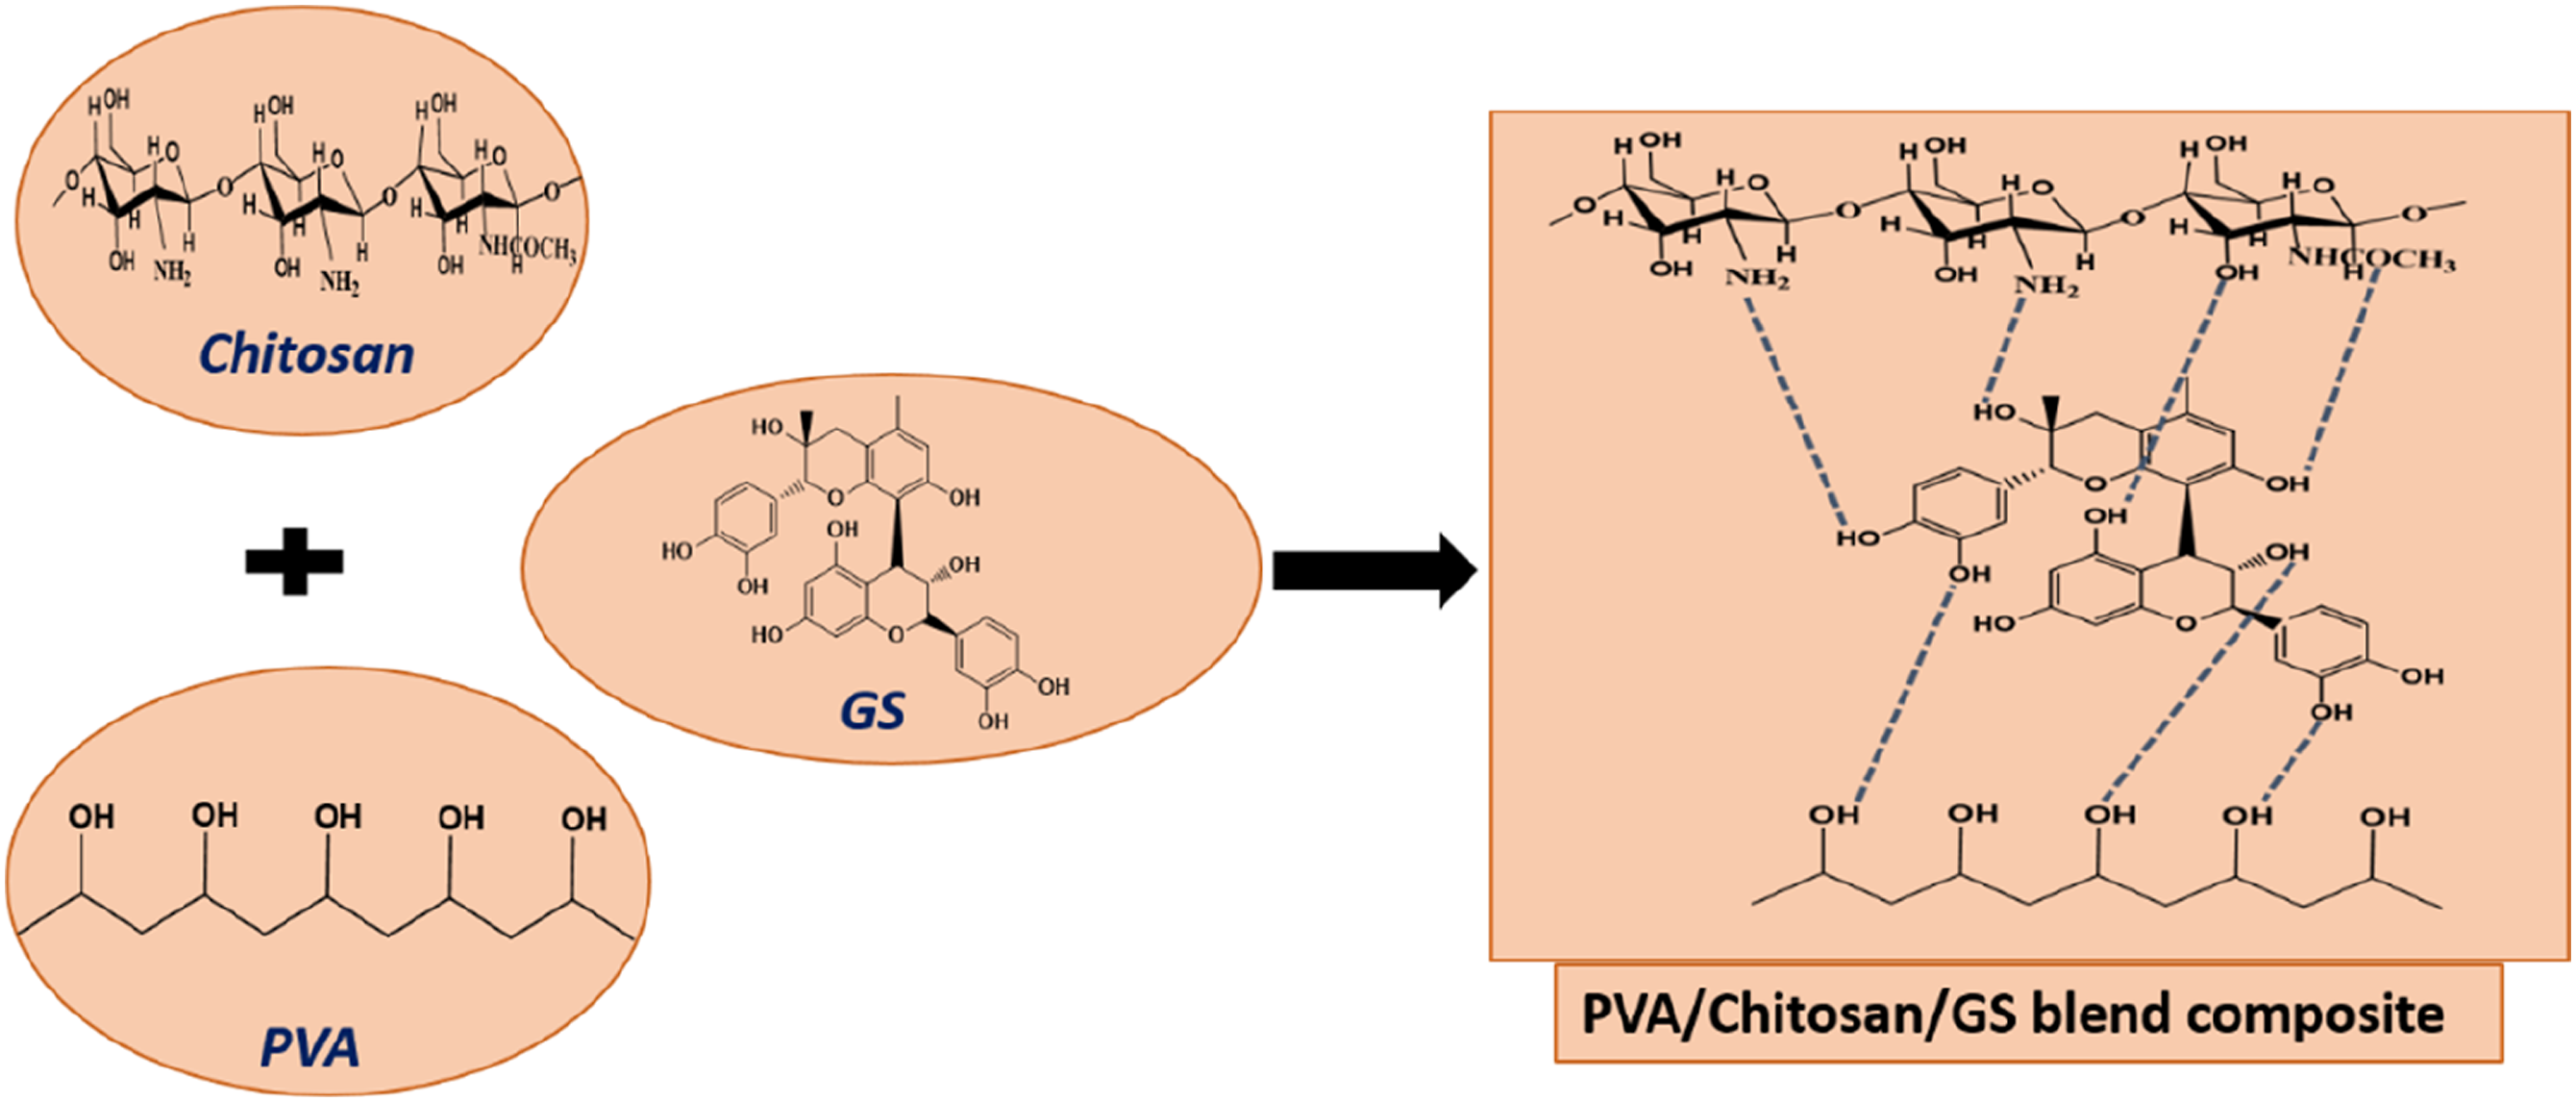
FTIR analysis confirmed the intermolecular interaction of the hydroxyl groups of PVA with the amino groups of CS. The FTIR spectra of PVA/CS blend composite show the characteristic bands of PVA and CS, with some slight shifts in the IR peaks. It is interesting to observe that the peak at 1654 cm−1 of the PVA/CS blend is found to be displaced to a lower wavenumber at 1644 cm−1 by the reinforcement of GS, clearly indicating the attachment of GS to the macromolecular chain of PVA/CS. In addition to this, the broadness of the peak around 3600–3200 cm−1 is found to increase with an increase in the loading of seed extract, along with an increase in the intensity of the peak or a slight shift in other peaks as compared to the pure PVA/CS blend, indicating the effective interaction of GS with the blend segments. A schematic illustration of the formation of PVA/CS/GS composite is given in Scheme 1. FTIR spectrum of PVA/CS blend with different contents of GS. A schematic representation of the formation of PVA/CS/GS composite.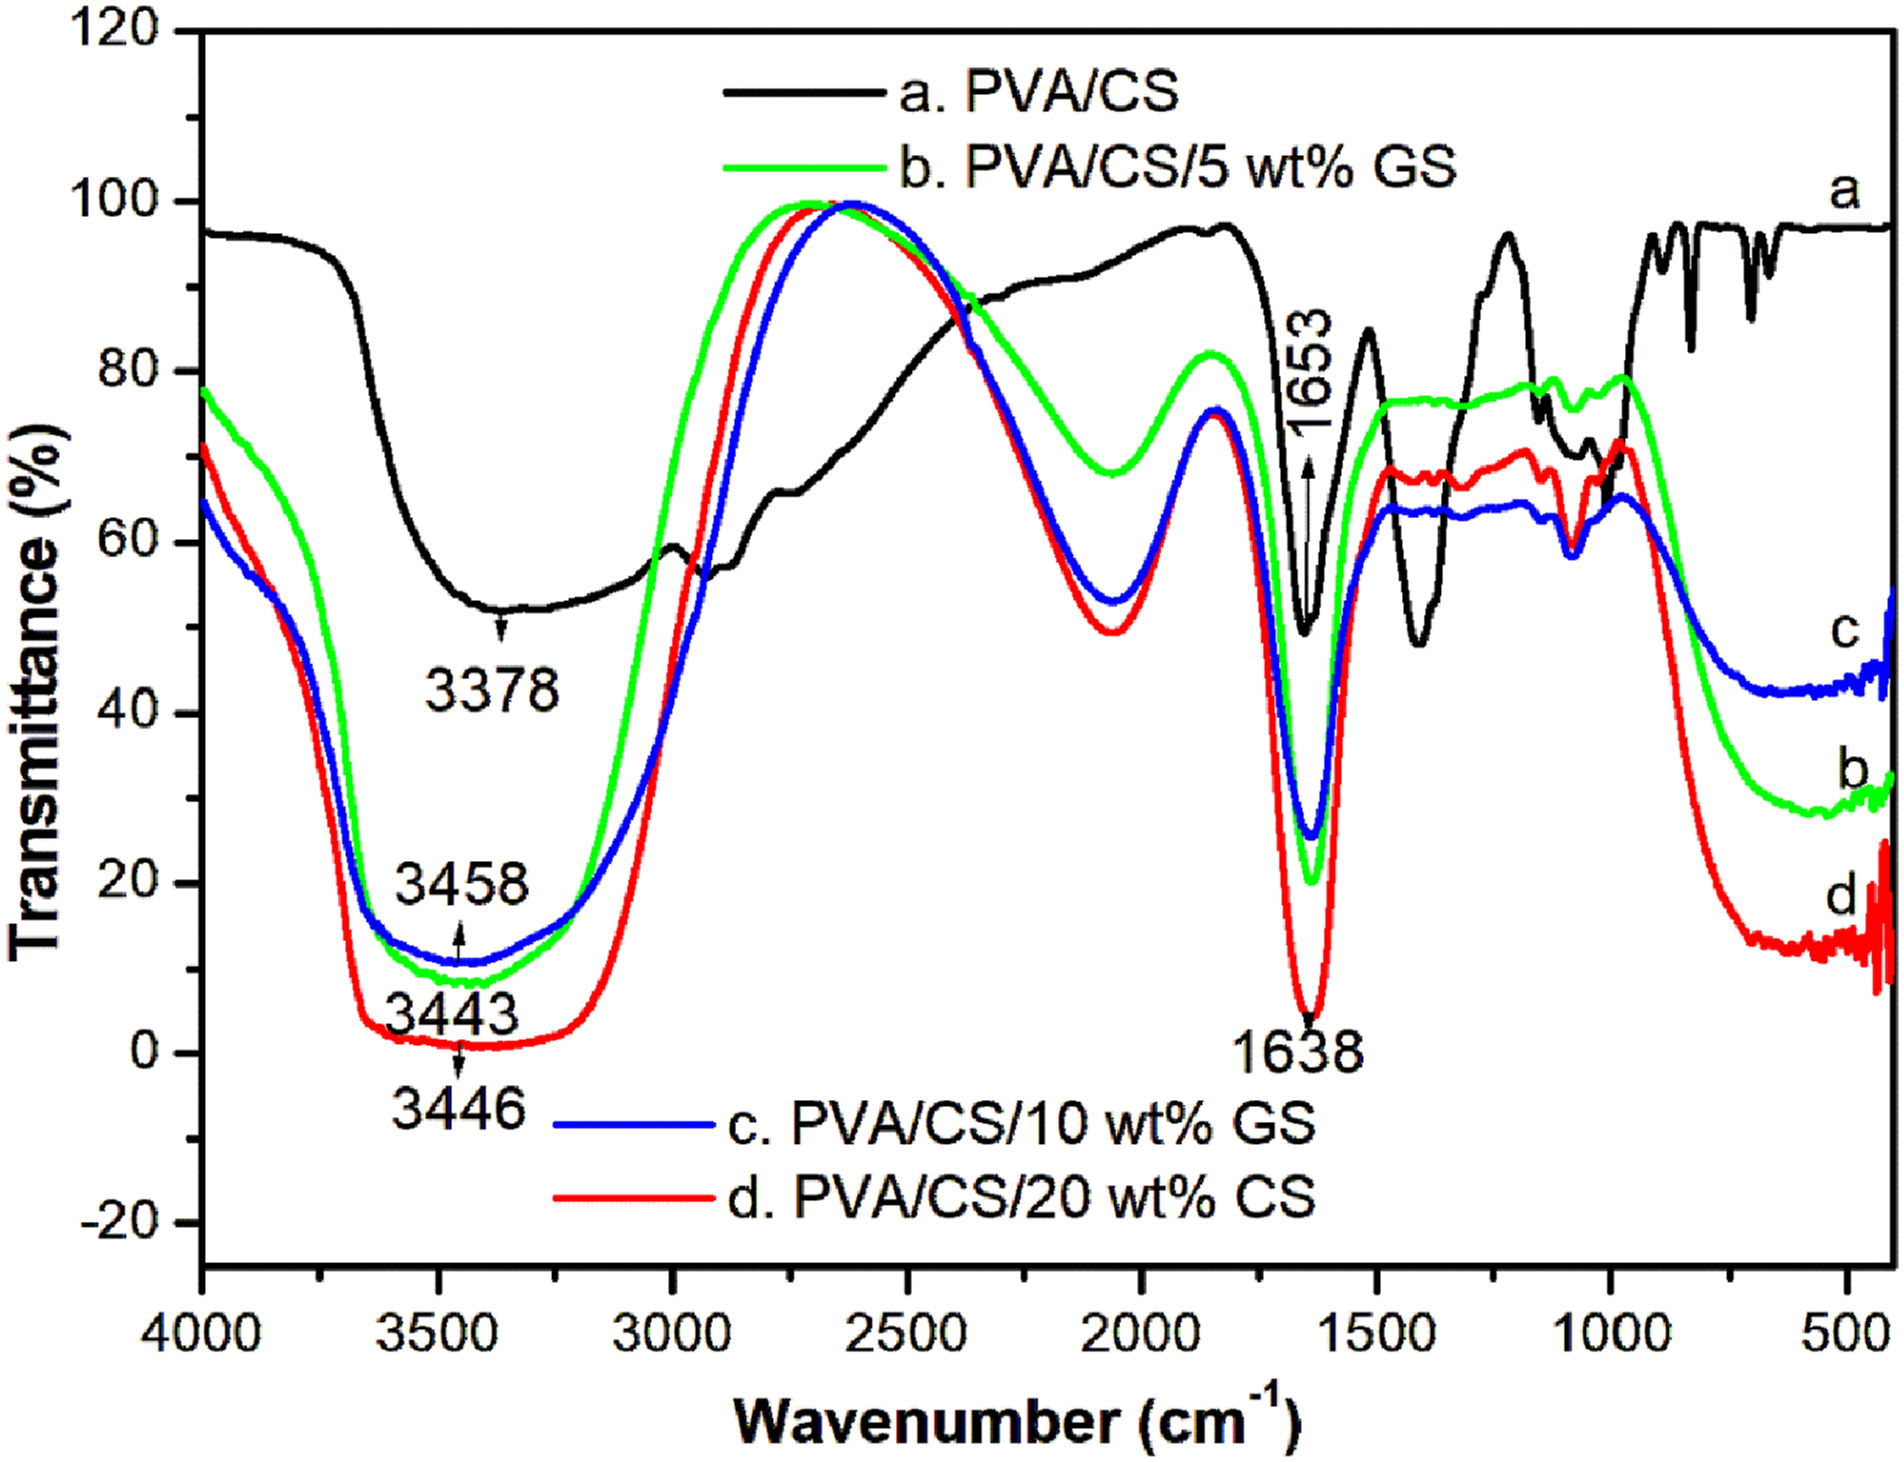
Field emission scanning electron microscopy
Surface morphological assessments of the PVA/CS blend with different contents of GS are presented in Figure 4. The presence of a homogeneous surface in the control blend film suggests good compatibility between CS and PVA. However, when GS is loaded into the PVA/CS matrix, it is clear that the presence of the GS component changes the uniform morphology of the blend matrix. The improved dispersion of GS in the PVA/CS phase is found at 10 wt% loading, indicating stronger adhesion between the polymer and the seed extract. The increased cohesive surface at lower loading suggests that bio-filler is well-compatible with the blend matrix. However, at higher loadings of bio-filler, i.e., for 20 wt% blend composites, an accumulation of particles can be observed. This could be due to the accumulation of bio-filler at higher concentrations in the blend matrix.4,31 FE-SEM images of (a) PVA/CS blend (b) 10 (c) 15 and (c) 20 wt% of GS incorporated PVA/CS blend.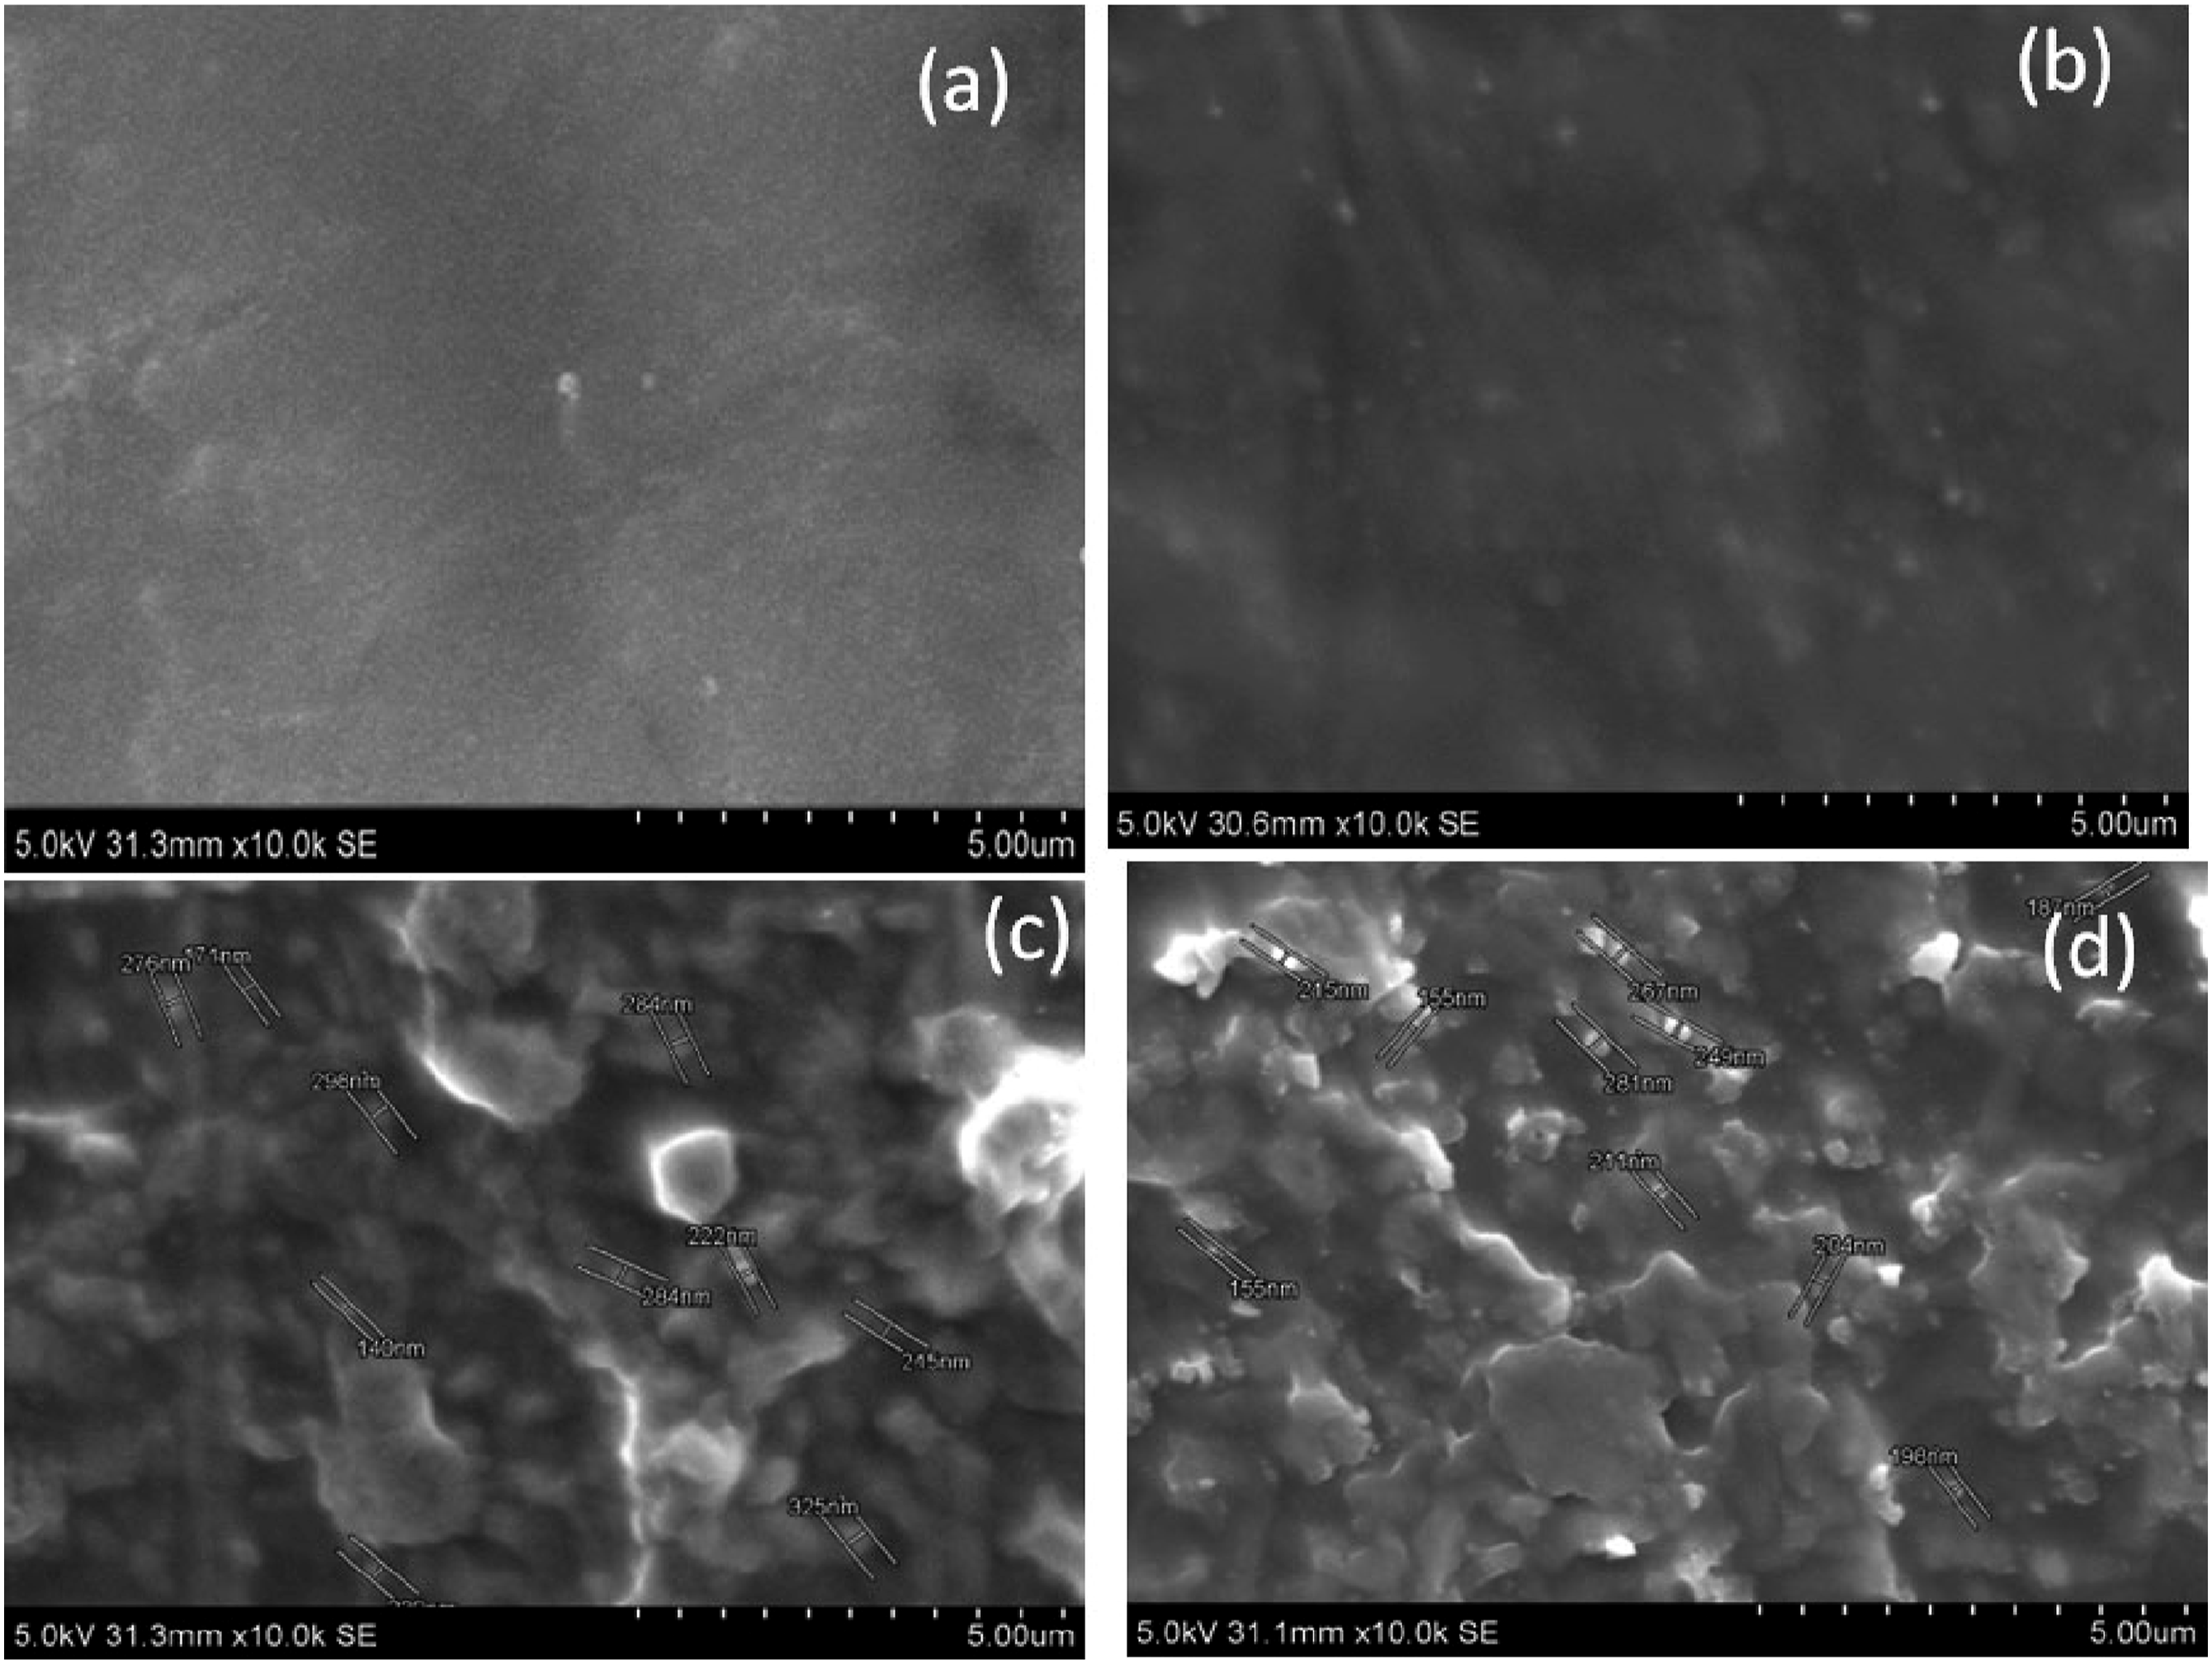
Differential scanning calorimetry
DSC analysis is used to investigate the thermal characteristics of biopolymer blend composites as the temperature rises from 25 to 325°C. Figure 5 shows a comparison of DSC thermograms for all developed samples and there are two endothermic processes for all the samples. The major endothermic dip corresponds to the glass transition temperature (Tg) and the second endothermic region is the melting temperature of the samples.
32
It is evident from the figure that the Tg value of PVA/CS blend composites is higher than that of the pure PVA/CS blend. The Tg of neat PVA/CS blend is 130.2°C
33
while that of the blend with 10, 15 and 20 wt% GS is 133.6°C, 138.4°C and 140.1°C, respectively. The melting peak of all the composites moved from 207 to 221°C. The significant enhancement in transition and melting temperature shows that the GS plays a significant role in improving the thermal properties of the composites and this might be attributed to the restricted motion of molecular segments of the polymer blend backbone at the polymer-filler interface. DSC curves of PVA/CS blend with different contents of GS.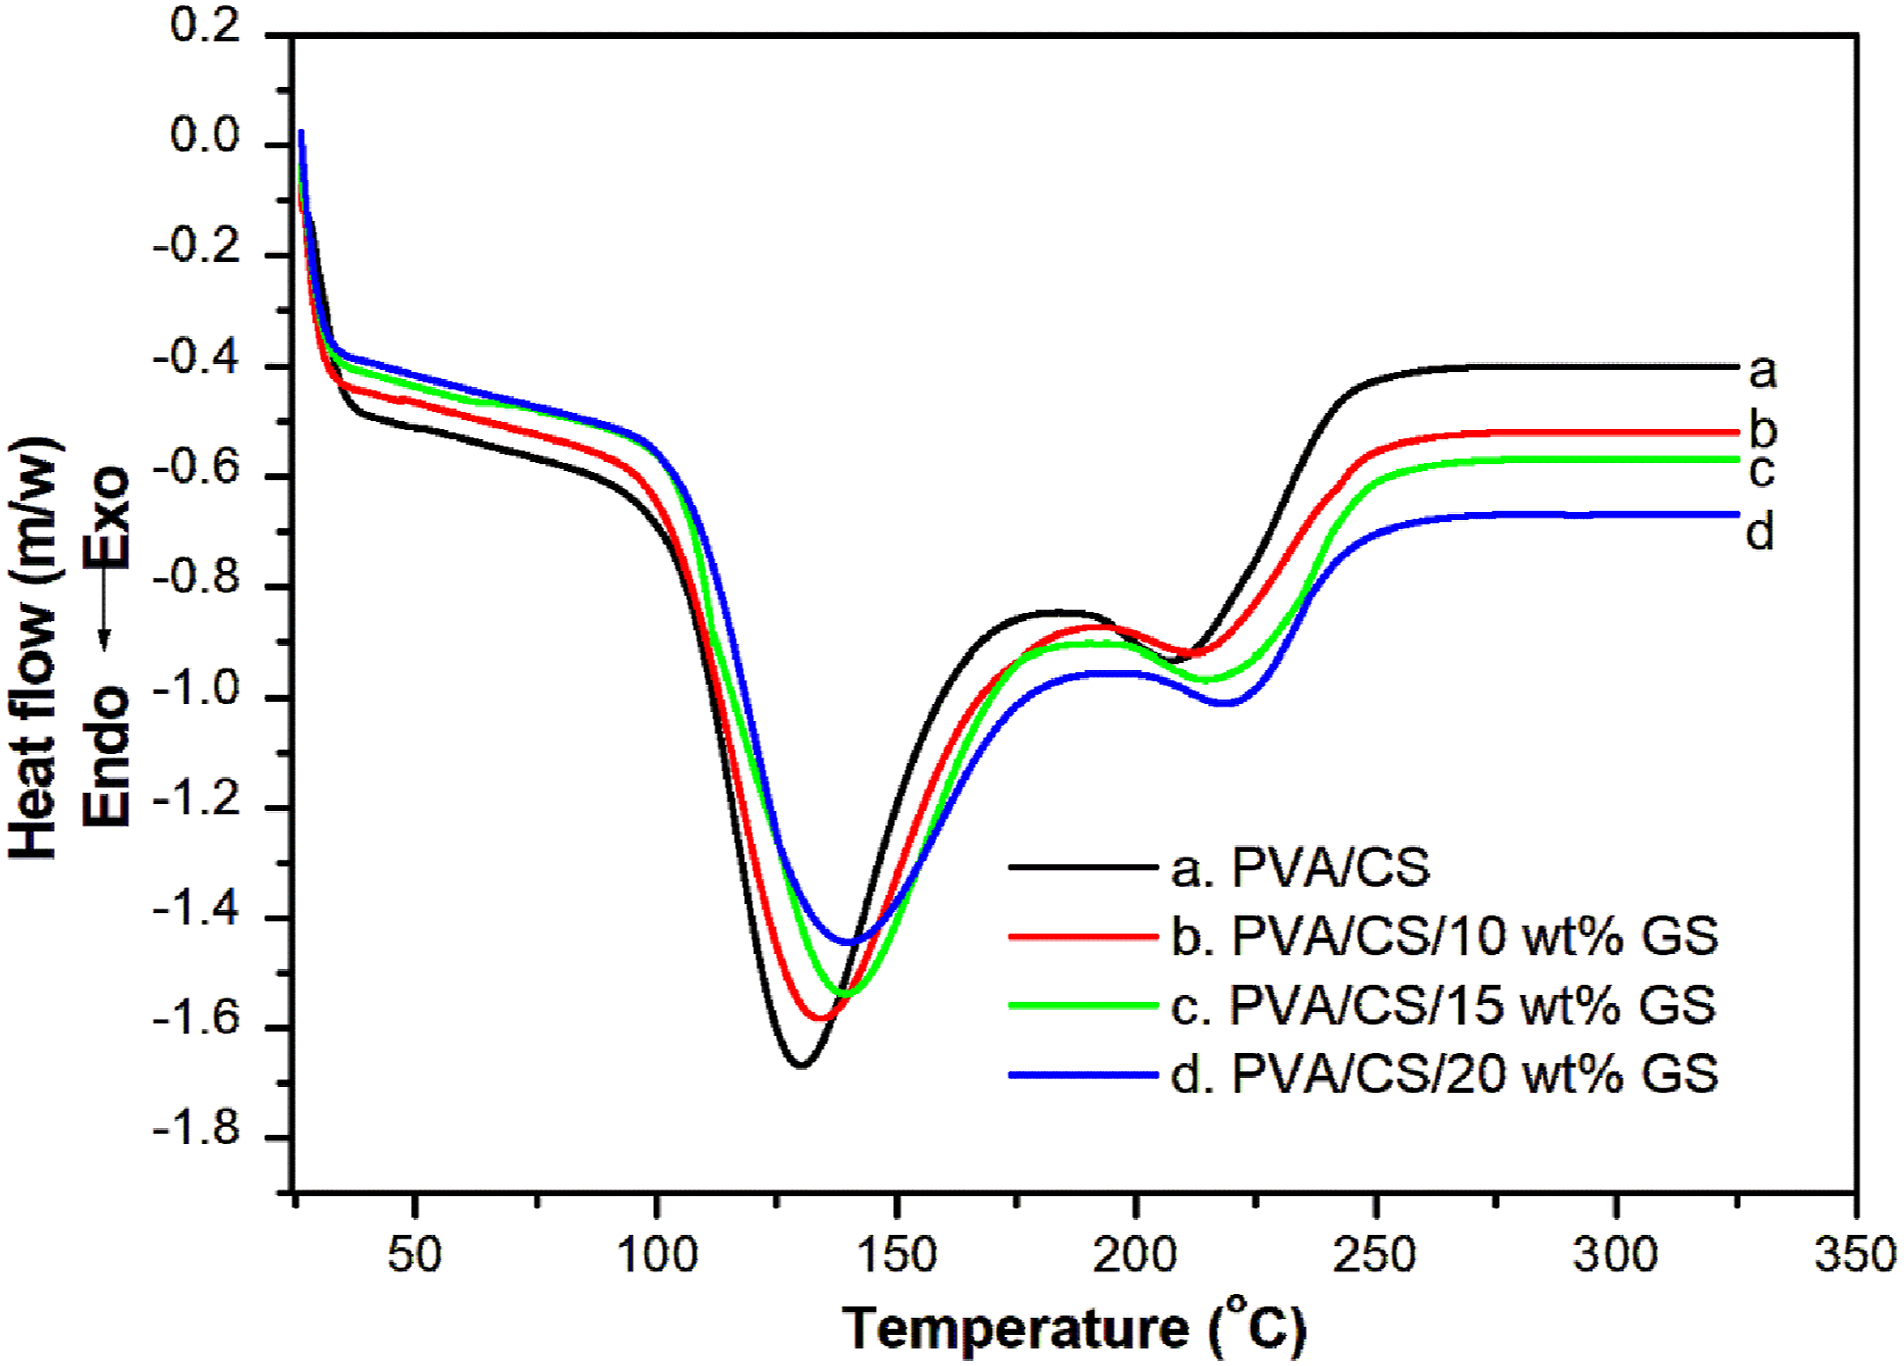
Mechanical studies
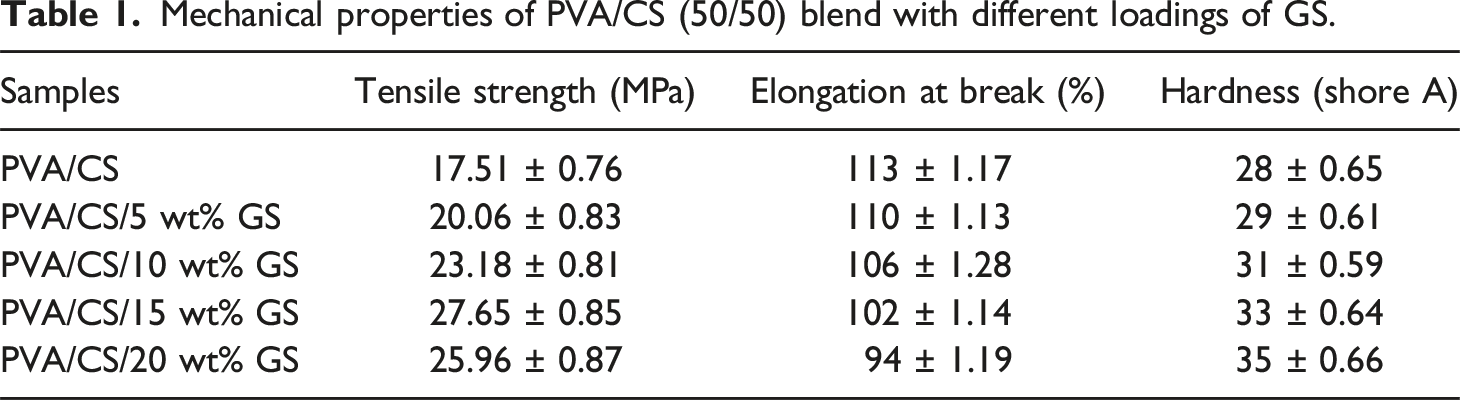
Mechanical properties of PVA/CS (50/50) blend with different loadings of GS.
AC Conductivity
The electrical conductivity of PVA/CS with GS composites at room temperature is shown in Figure 6. The AC conductivity of all polymeric blend samples change gradually at lower frequencies, whereas a substantial increase in conductivity is seen at higher frequency ranges. The frequency-dependent AC conductivity is induced by the hopping between equilibrium states formed in the polymer blend matrix, as well as electron transport across the samples.
36
The bio-polymer blend has a lower AC conductivity than the filler-injected blend. The AC conductivity of the blend composite is shown to be heightened at a given dosage of GS (15 wt%). This is the critical filler loading at which electrical conductivity achieves an optimal value, and above this loading, a drop in conductivity is seen for the composite with a 20 wt% sample. The increased conductivity of the 15 wt% bend composite is due to the homogeneous dispersion of the bio-filler in the blend. The homogeneous distribution of fillers in the PVA/CS blend (as revealed by FE-SEM examination) produces a conducting channel for charge transfer in the blend matrix, resulting in a higher number of conductive pathways and better composite conductivity.
37
At higher loadings, the particle-to-particle spacing in the polymer mix is shorter, resulting in the clustering of bio-fillers (over 15% wt.% composite), which hinders charge transmission and results in poor conductivity. The variation of AC conductivity of PVA/CS blend and its composites at room temperature.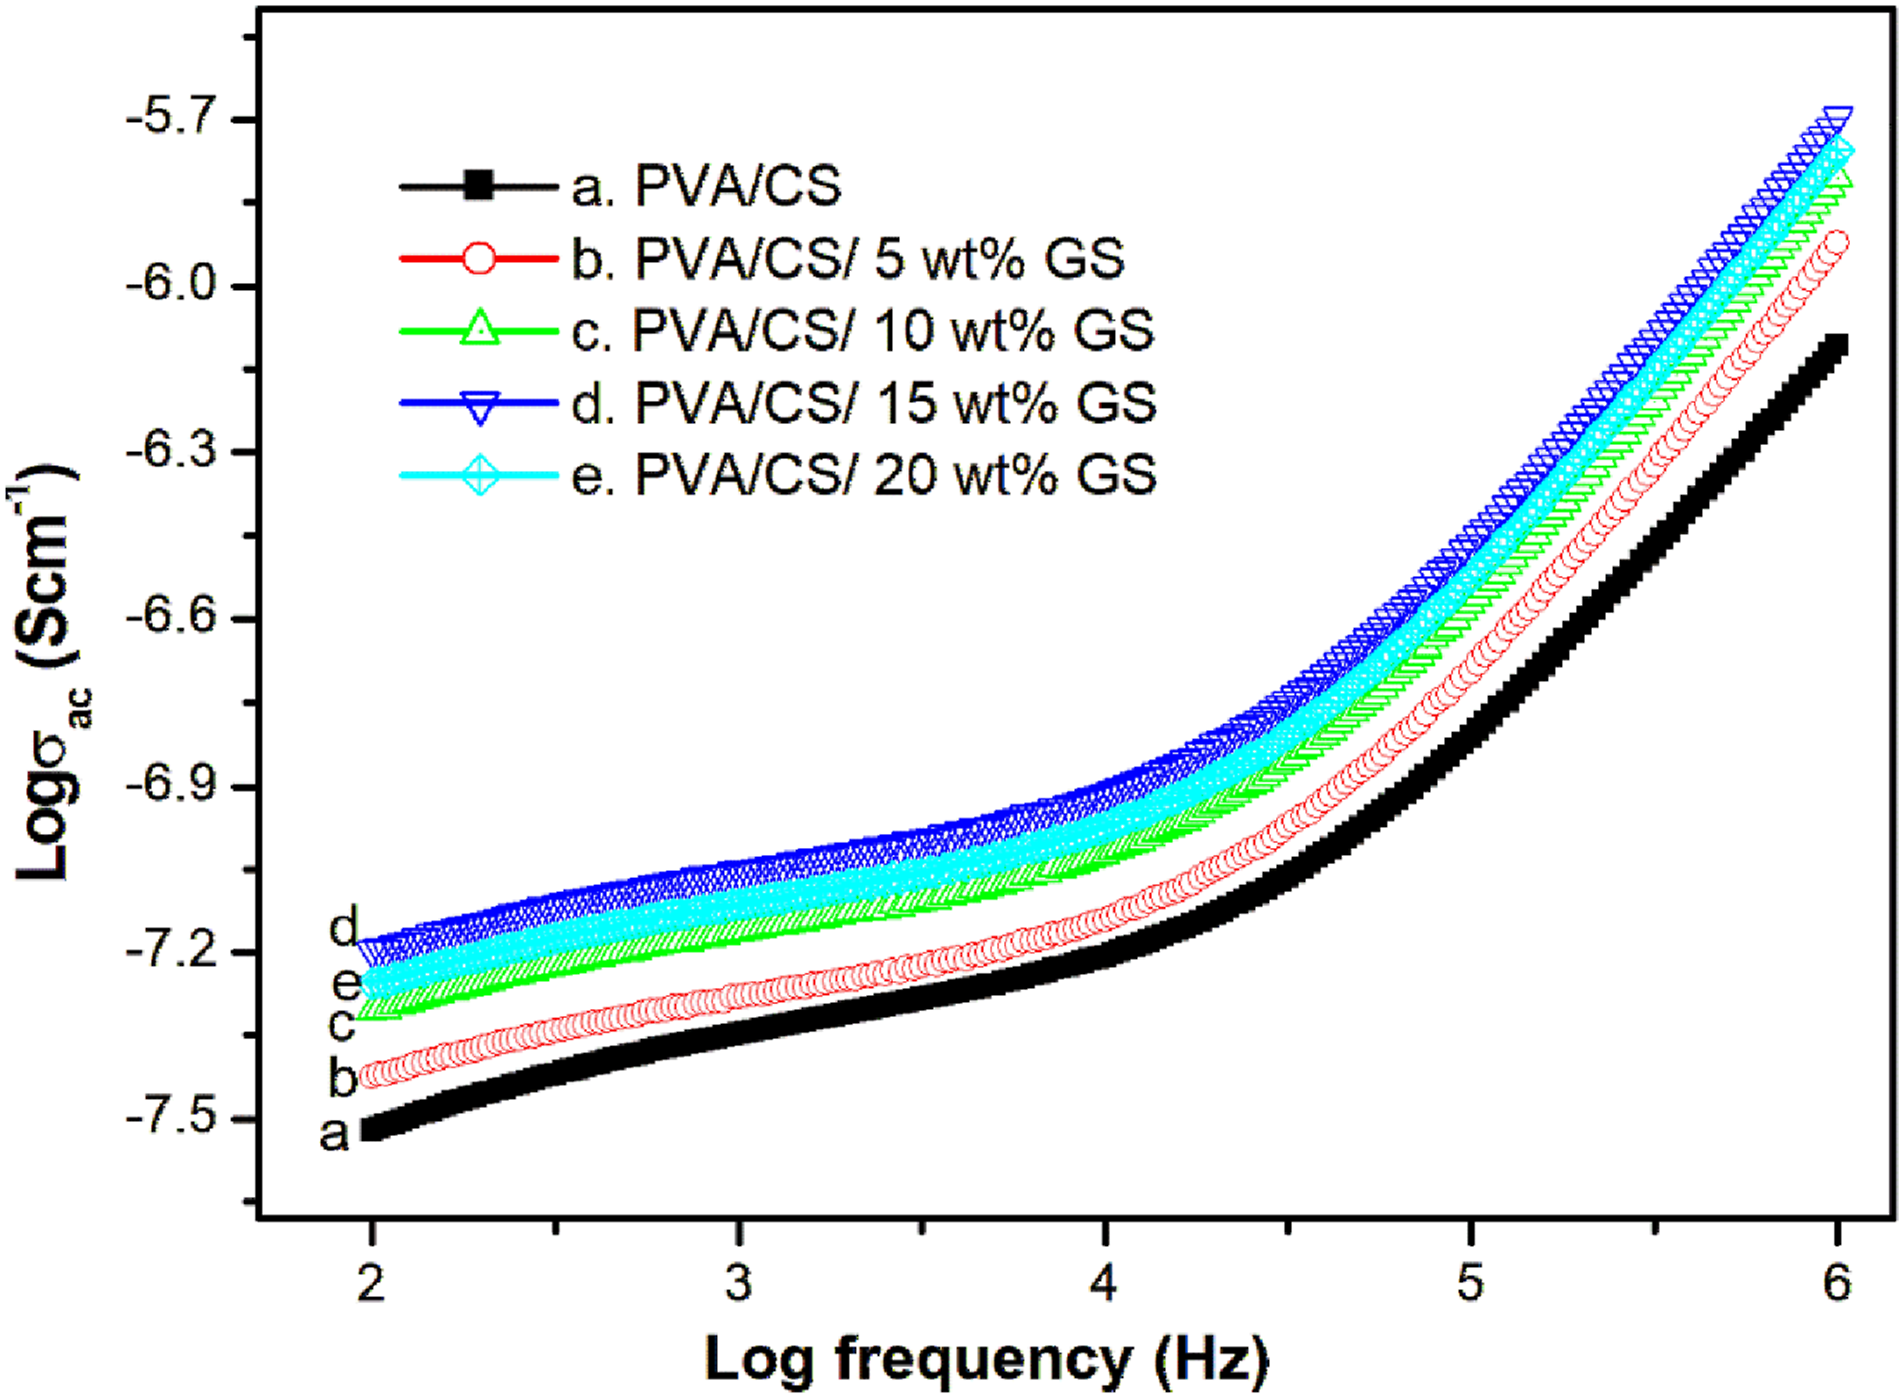
Temperature dependence of AC conductivity
The changes in AC conductivity with various frequencies and temperatures for PVA/CS blend and PVA/CS/GS blend composites are given in Figure 7. The graph clearly shows that conductivity rises with temperature, which is attributable to charge carrier hopping as well as interfacial polarisation. Temperature increases the mobility of the charge carrier (through a thermal-induced process) and also the number of transit sites.
38
The charge carriers can move from one location to another rapidly without requiring tremendous energy polarisation. The increased loading of GS might have increased the disorderliness in the blend composites and the polar group of filler particles induces conformational changes to the blend matrix, resulting in lower conductivity at higher loadings. The AC conductivity increases as a function of both temperature and frequency, and such behaviour reveals the semiconducting nature of the prepared biopolymer blend composites. The variation of AC conductivity of PVA/CS blend and its composites at different temperatures.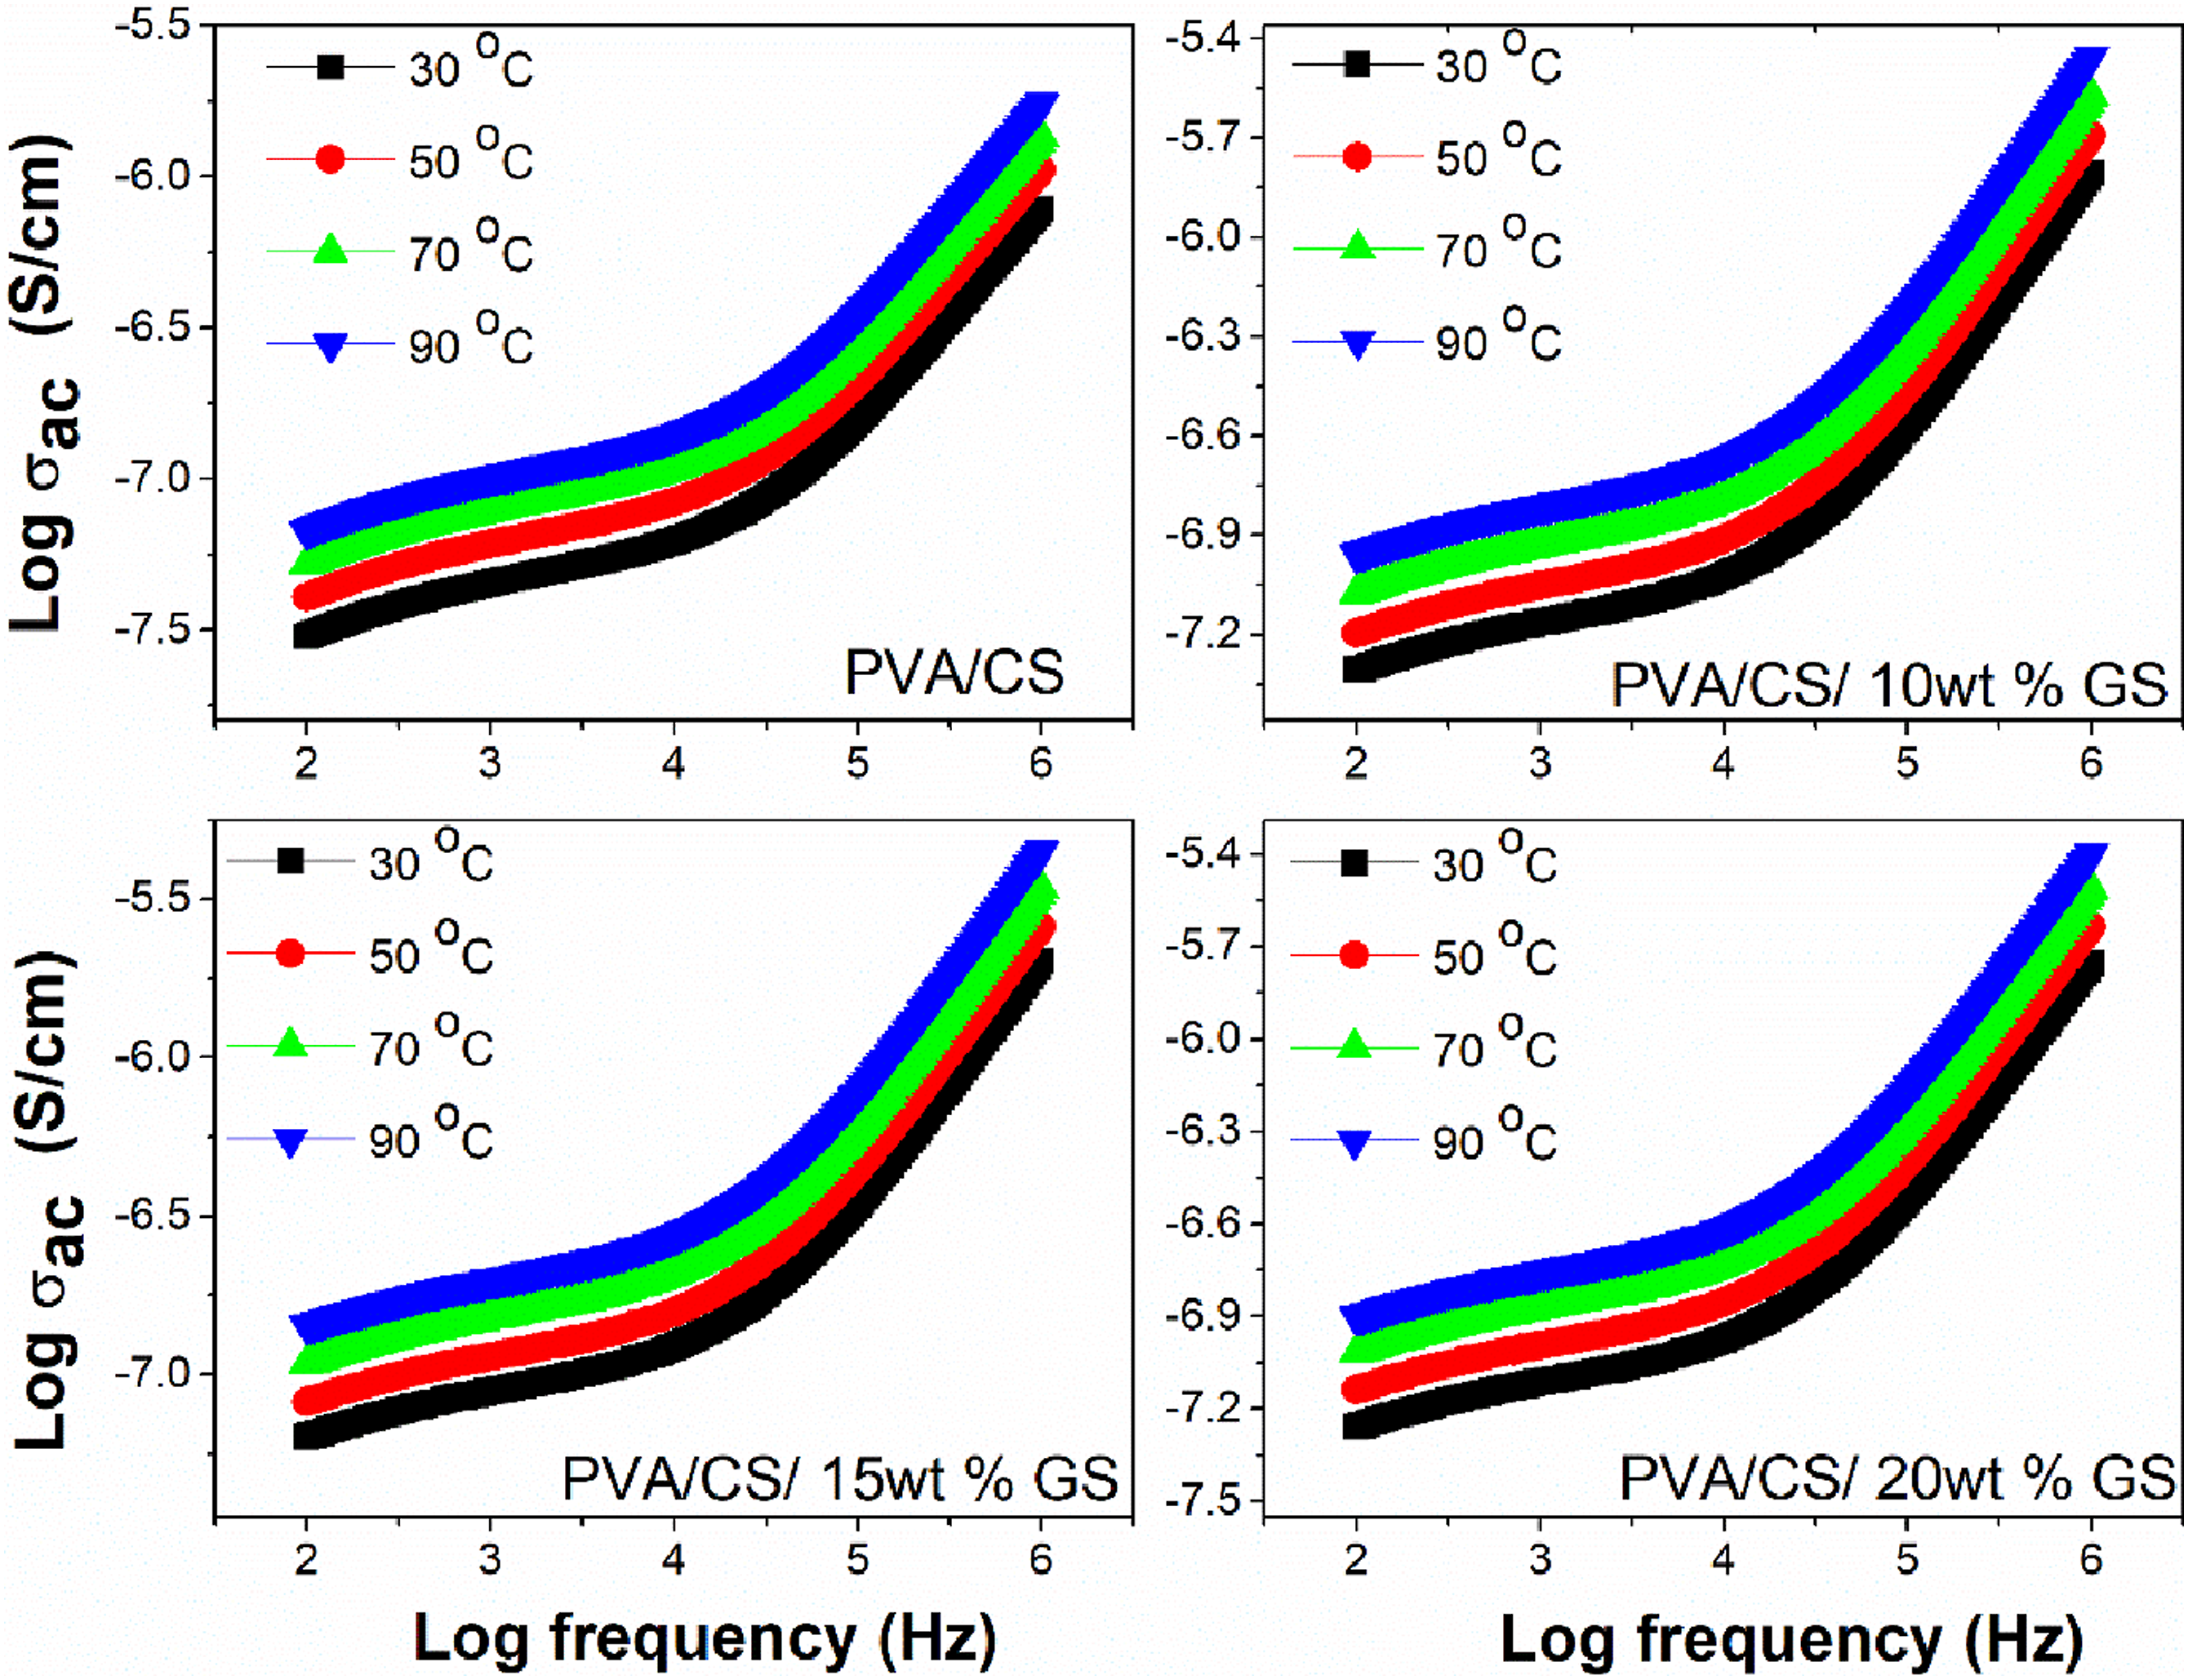
Activation energy
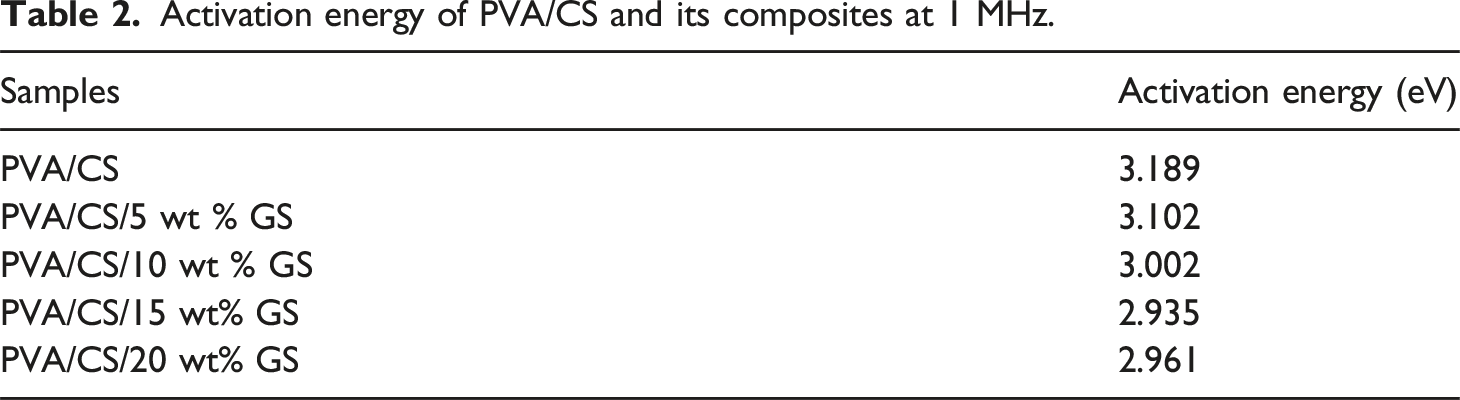
Figure 8 illustrates the variation of AC conductivity inverse temperature for PVA/CS blend and PVA/CS/GS blend composites. The plot of the fluctuation of AC conductivity at different temperatures is mapped to the Arrhenius exponential law and the activation energy of blend and its composites is obtained from the slope of the curve, as given in Table 2. The activation energy reduces as the filler content increases. This is due to charge carrier hopping between localized states which increases the movement of charge carriers from one region to another.
39
The minimum activation energy observed for the blend composite with a 15 wt% sample indicates enhanced electrical conductivity. The activation energy increases as the filler amount climbs to 20 wt%. Higher filler loading breaks down structural regularity owing to aggregation or cluster formation, which inhibits electron hopping, resulting in increased activation energy. The plot of AC conductivity Vs 1000/T of PVA/CS blend and its composites. Activation energy of PVA/CS and its composites at 1 MHz.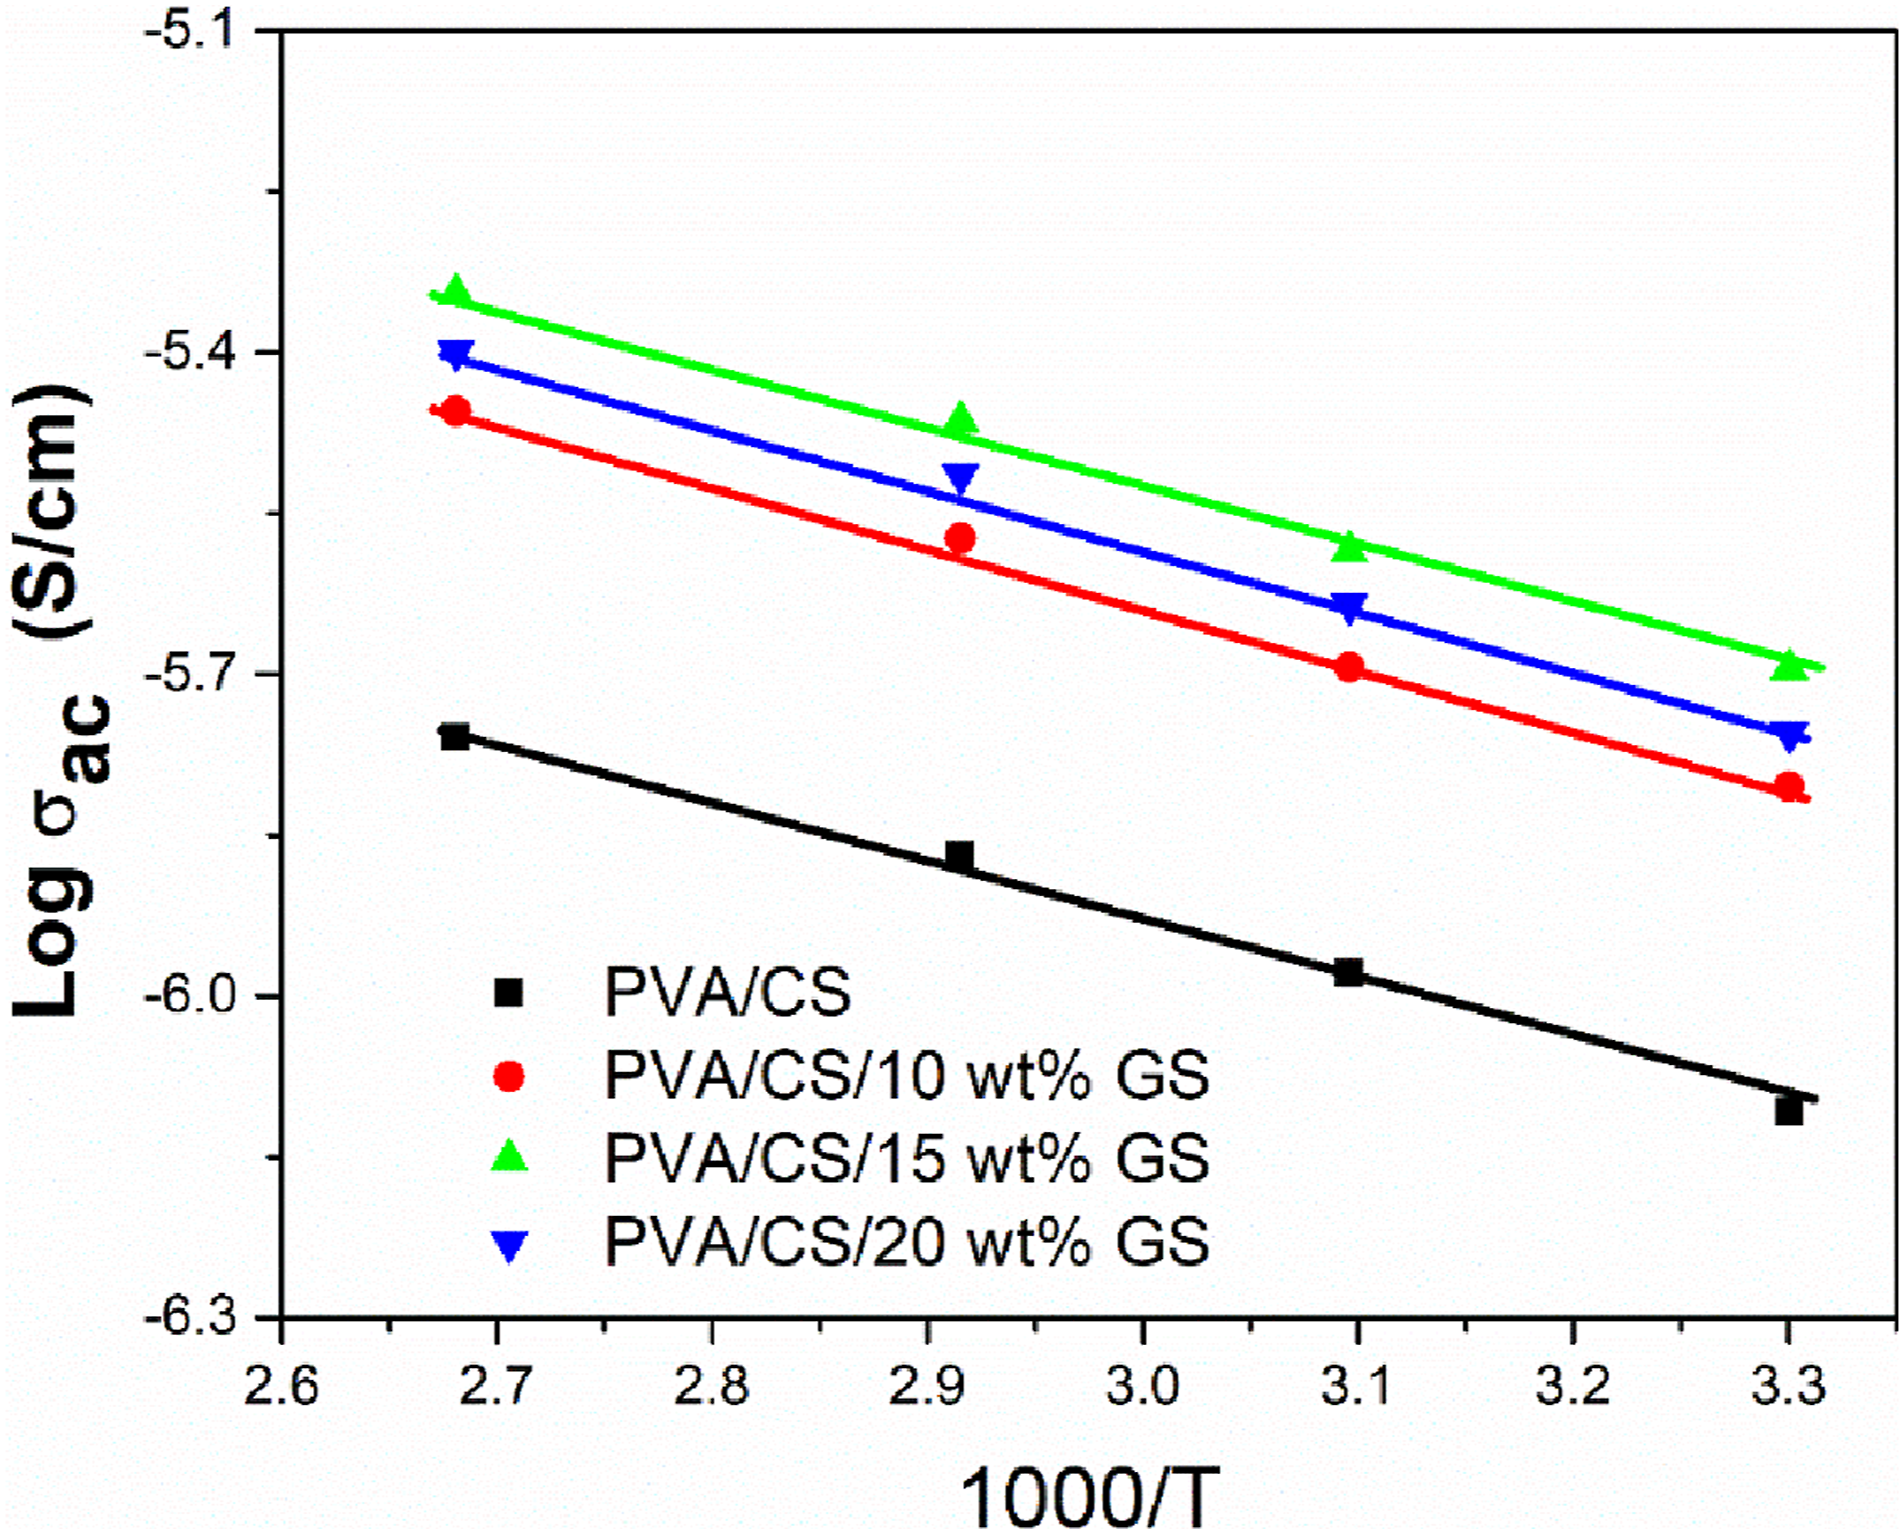
Dielectric constant
The dielectric constant of the PVA/CS blend and its composite versus frequency is presented in Figure 9. The higher values of the dielectric constant can be seen in the lower frequency range <10,000 Hz. It might be ascribed to polarised particles at sample boundary interfaces induced by the electrode polarisation effect, which is typically triggered by space-charge buildup at the film-electrode junction.
40
However, at high frequency range, the dielectric constant drops or levelled off. At higher frequencies, the direction of oscillation changes so quickly that dipoles of polar groups in polymer blends and polarised bio-fillers do not have enough time to orient themselves in the direction of the applied frequency. The addition of bio-filler to PVA/CS blend films leads to induced polarization in the composite structure, which enhances the dielectric constant from 278 for pure blend to 396, 455, 580 and 524 for bio-filler with 5, 10, 15 and 20 wt% loadings, respectively at 100 Hz. The maximum dielectric constant for the 15 wt% GS incorporated polymer blend is due to the strong adhesion between the filler particles and polymer blend components. The rise in dielectric values is a frequent critical rule used to increase the capacitance of a certain capacitor design.
41
The spacing between particles decreases as the bio-filler concentration rises up to 20 wt%, resulting in the development of clusters and a considerable drop in the dielectric constant. Frequency dependence dielectric constant of PVA/CS blend and its composites.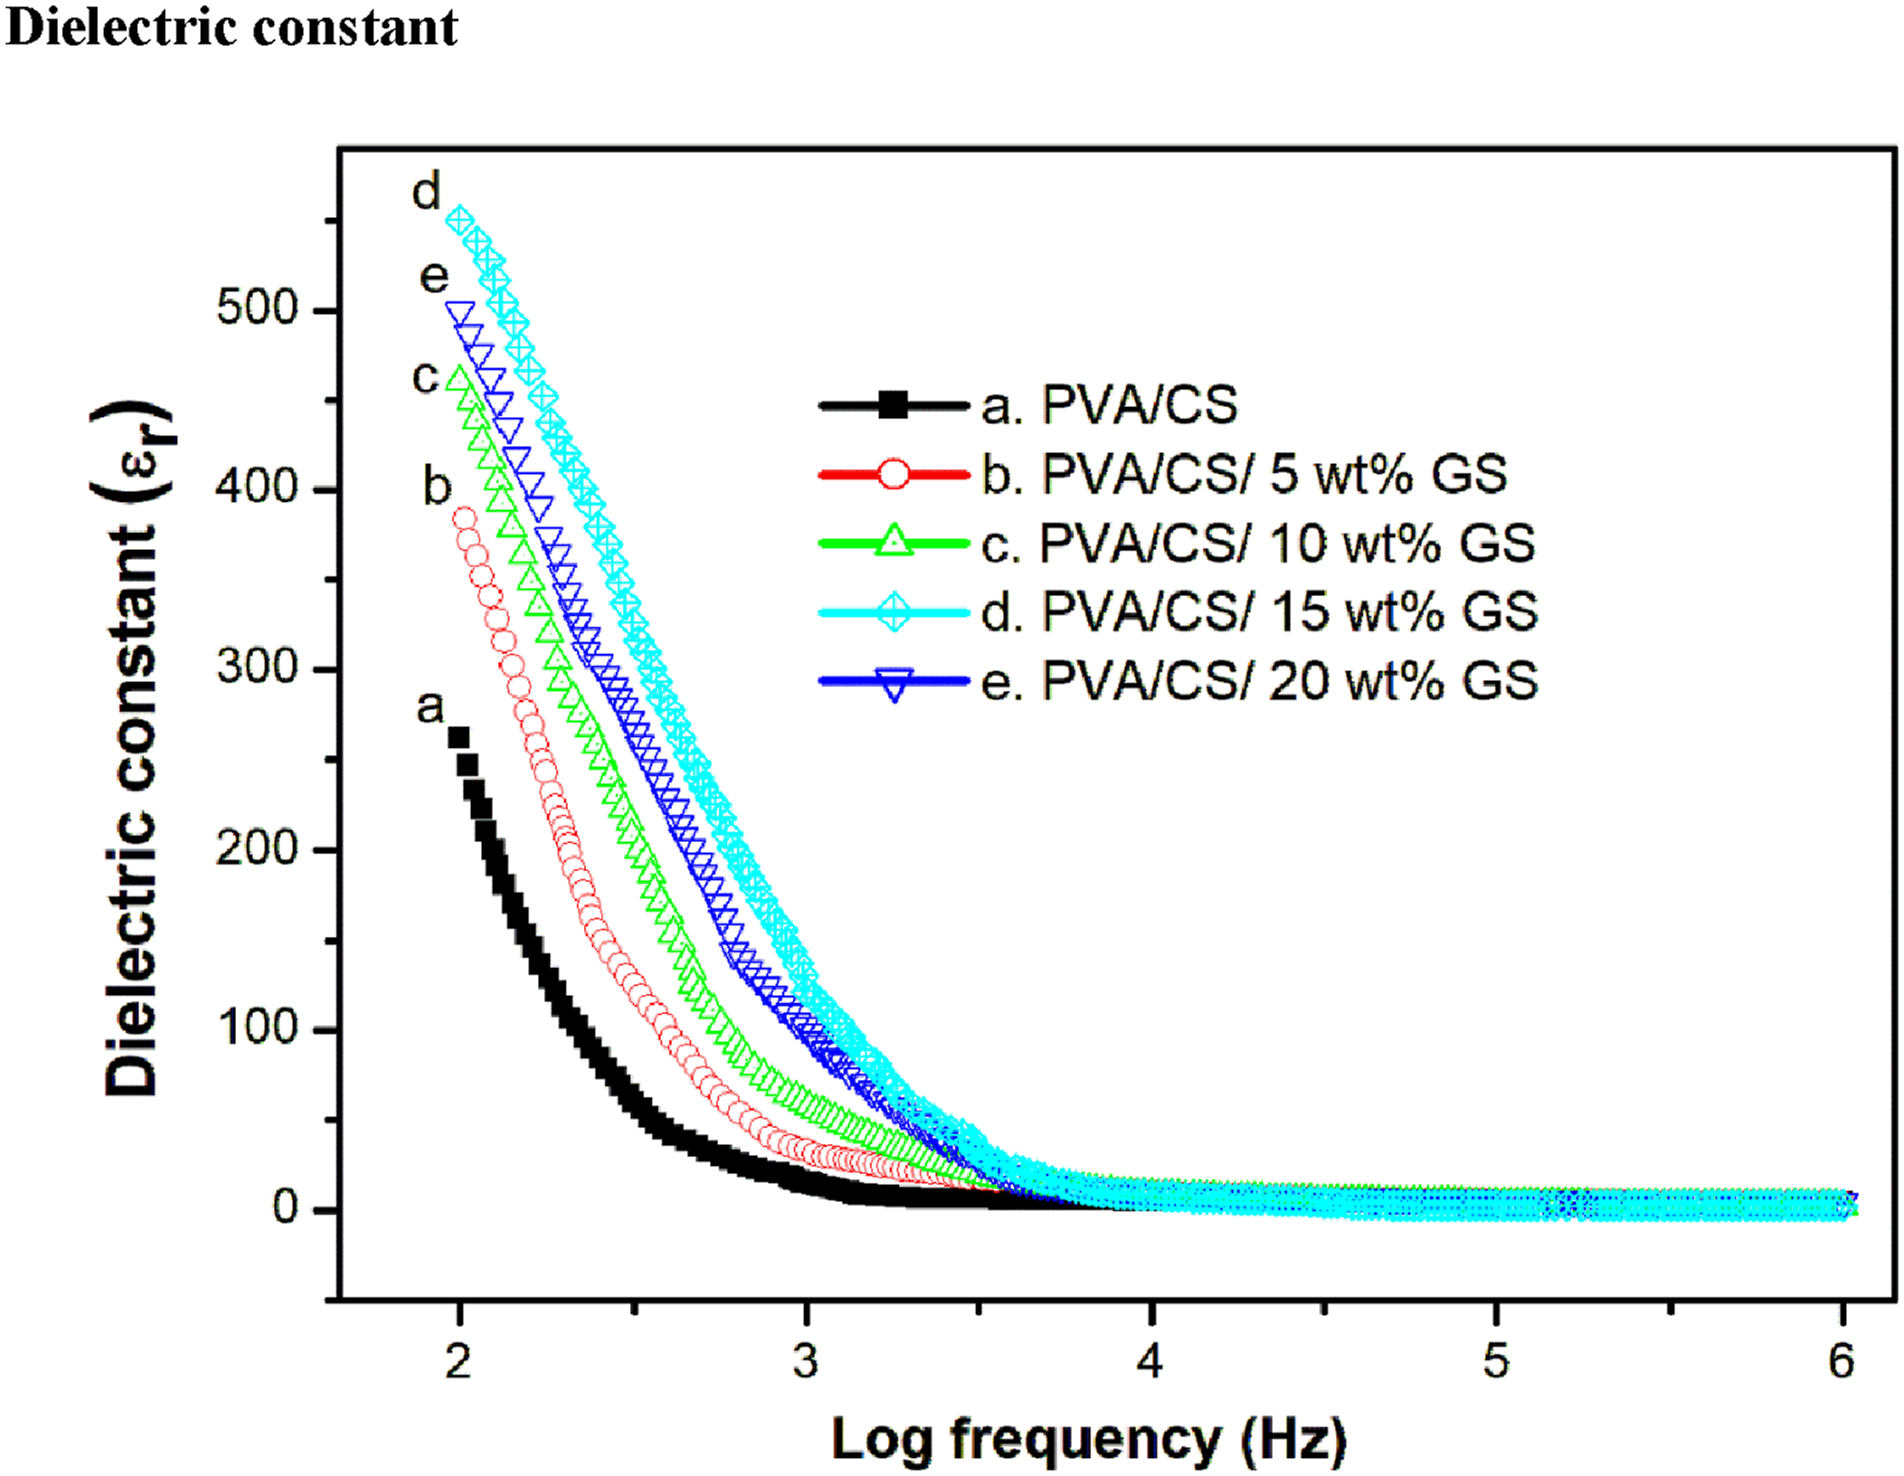
Dielectric loss
The variation of dielectric loss of PVA/CS blend and GS @ PVA/CS blend with frequency in the range of 102–106 Hz has been measured by dielectric spectroscopy. As shown in Figure 10, the tan δ of the blend composites gives rise as the filler content increases due to the reinforcement of bio-filler. This is not only due to the inherent internal polarization of bio-filler but also to the interfacial polarization developed at the interfaces between the filler and the blend matrix.
42
The dielectric loss follows the same pattern as the dielectric constant with the addition of bio-filler and these parameters steadily decrease up to a frequency of 104 Hz. Beyond this frequency, the tan δ value becomes level off. The interfacial polarization and conductivity are crucial elements influencing dielectric loss. Among the blend composites, the 15 wt% sample shows the highest tan δ value, which might be attributed to interfacial adhesion between the reactive functional group of the PVA/CS blend and GS particles.
43
However, there is a decrease in dielectric loss at 20 wt% loading. At higher filler loadings, more stress concentration spots formed, leading to a lower tan δ value. Furthermore, an increase in an irregular surface (as evident from the FE-SEM analysis of the 20 wt% sample) decreases the polarization, which in turn decreases the dielectric loss. The bio-polymer blend composite film has enhanced conductivity, glass transition temperature and tensile strength, indicating that it can be used as an active component in flexible electronic devices. Frequency dependence dielectric loss (tan δ) of PVA/CS blend and its composites.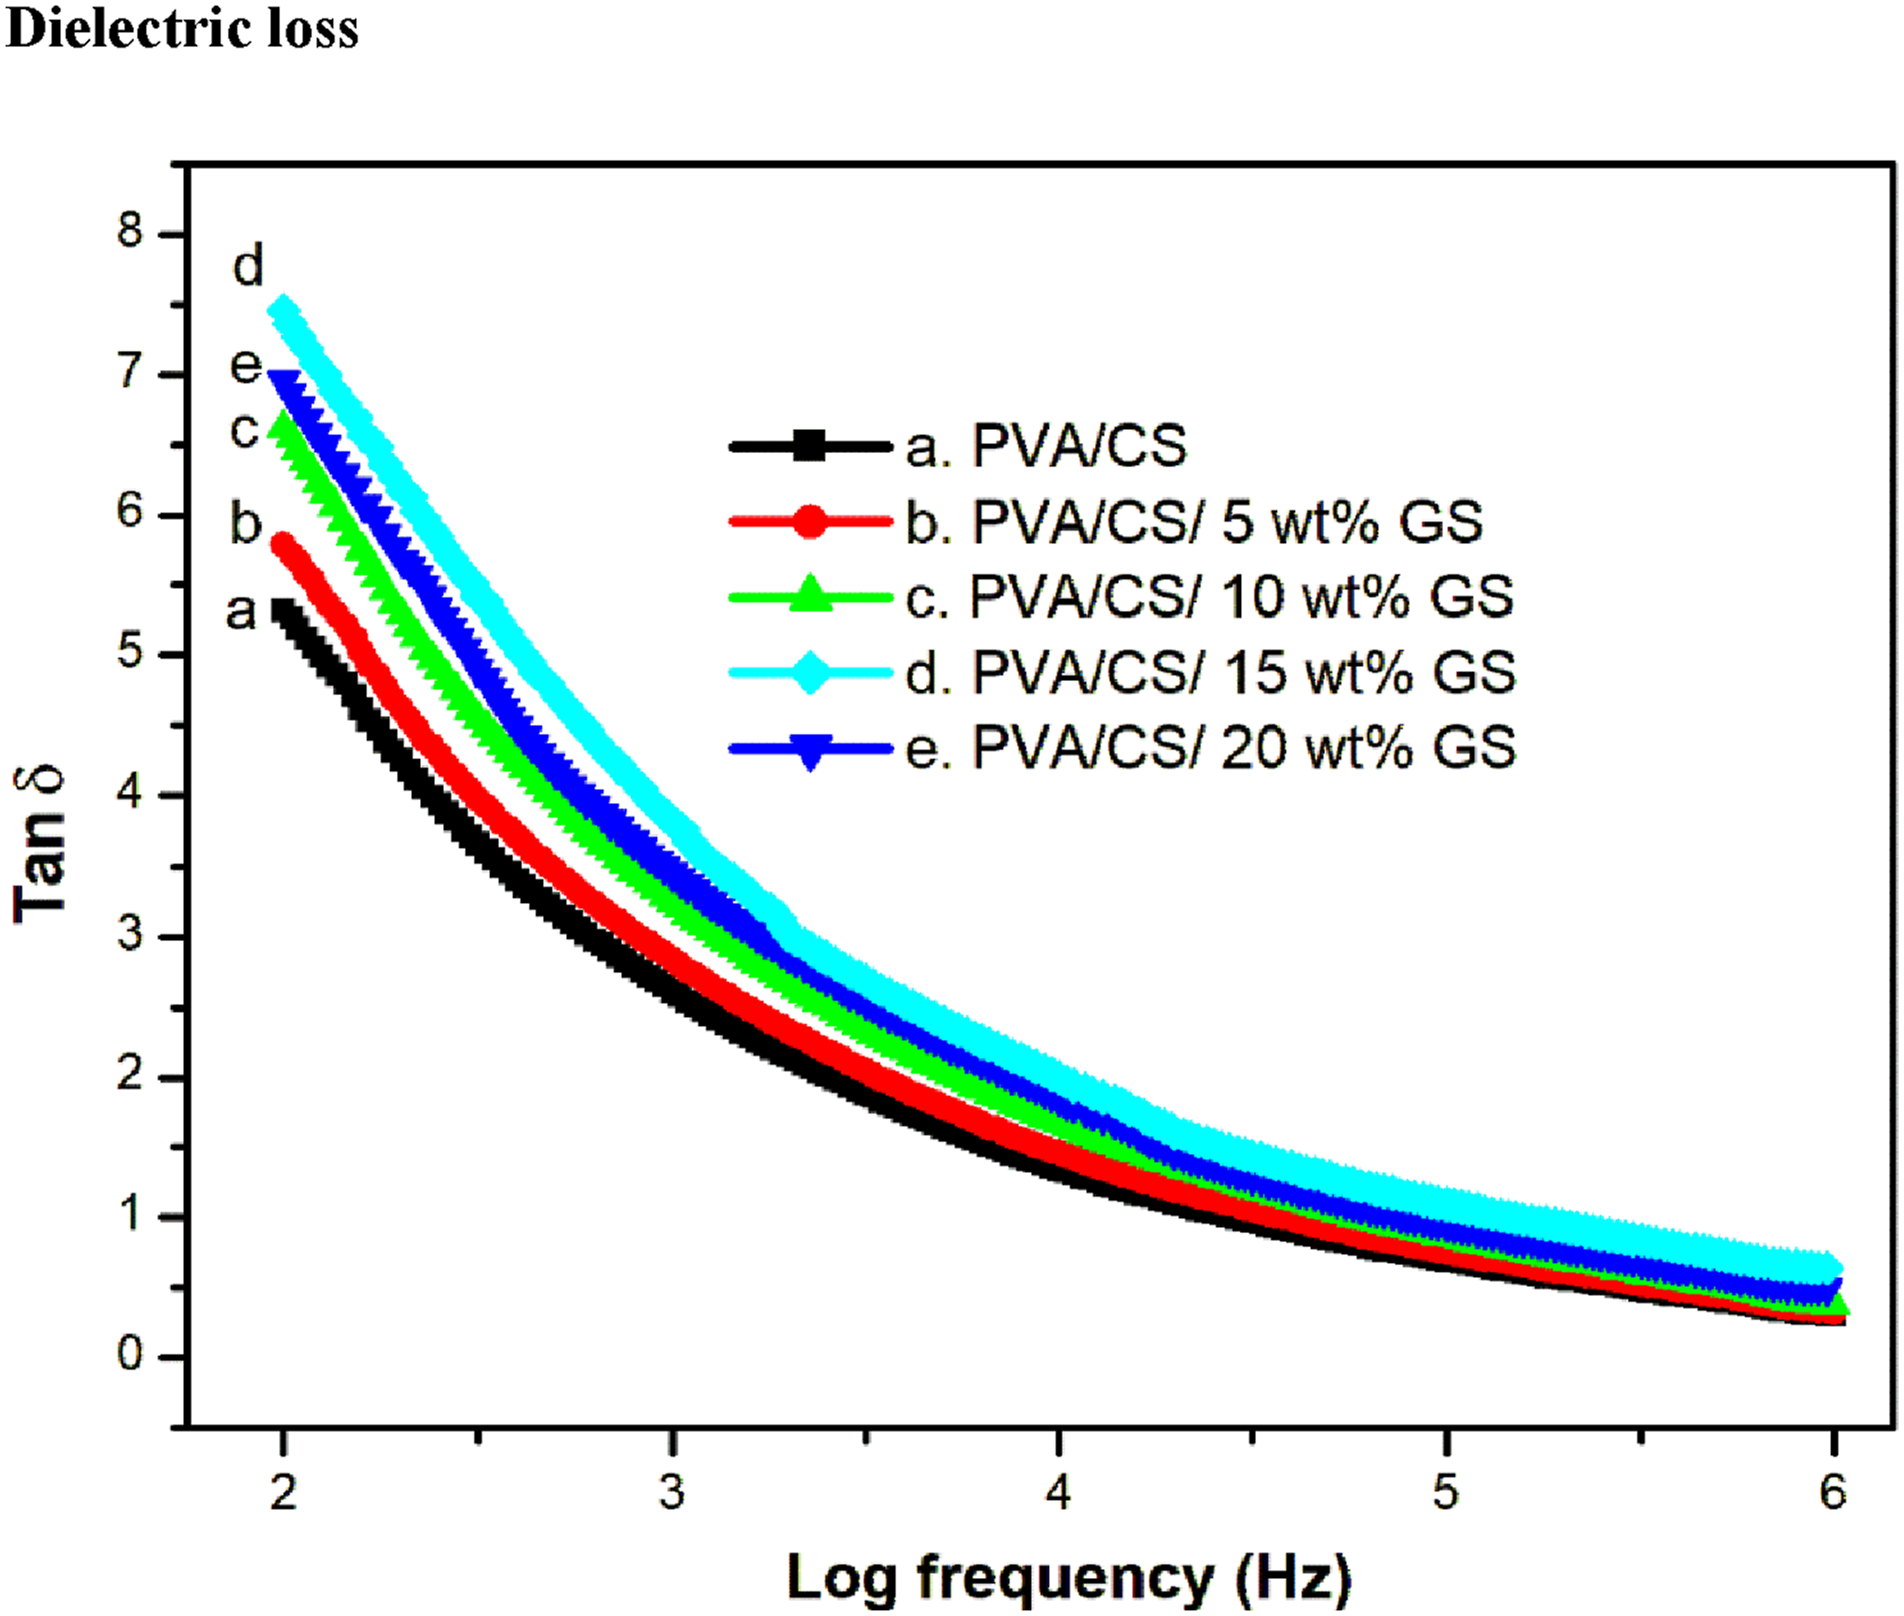
Conclusions
PVA/CS blend with various contents of GS was developed by a simple solution mixing method using water as a green solvent. UV-visible spectroscopy, Fourier transform infrared (FTIR), scanning electron microscope (FE-SEM), and differential scanning calorimetry (DSC) were used to investigate the structural, morphological, and thermal characteristics of polymer blend composites. The FTIR and UV spectra showed the existence of an intermolecular interaction between the PVA/CS blend and GS. The FE-SEM images revealed the homogenous dispersion of GS in the blend chain. DSC research revealed that the inclusion of GS increased the glass transition temperature of a PVA/CS blend. Similarly, the thermal stability of the polymer blend composites was significantly enhanced with the loading of filler in the polymer matrix. The mechanical strength and hardness of PVA/CS blend composites were substantially enhanced with the interaction of seed extract. The polymer blend reinforced with 15 wt% GS showed the highest mechanical strength compared with other loadings of fillers. The electrical studies revealed that the AC conductivity of the blend composites was maximum at 15 wt% loading. The activation energy of the biopolymer blend decreased with increasing temperature and filler loading. The dielectric parameters demonstrated that the prepared PVA/CS/GS blend composites had improved energy storage capability. The higher tensile strength, thermal transition, electrical conductivity, dielectric constant, and lower bandgap obtained for the prepared biopolymer blend composites in this study indicate that they can be used as active materials in the fabrication of flexible dielectric devices, energy storage devices, and optoelectronic devices.
Footnotes
Declaration of conflicting interests
The author(s) declared no potential conflicts of interest with respect to the research, authorship, and/ or publication of this article.
Funding
The author(s) received no financial support for the research, authorship, and/or publication of this article.