
Abstract
In this study, bio-composites were developed using polylactic acid (PLA) as the matrix and sisal fibers (SFs) derived from agave sisalana leaves as the reinforcement. The bio-composites were prepared through injection molding with the addition of tributyl 2-acetylcitrate (ATBC) plasticizer. The mechanical, thermal, and rheological properties of these bio-composites were investigated to understand the effects of fiber and plasticizer contents. The results showed that the addition of SFs improved the tensile and flexural moduli of the bio-composites but led to a decrease in tensile strength compared to neat PLA. The flexural strength initially decreased with low fiber content but recovered to the level of neat PLA as the fiber content increased. The impact strength increased with the incorporation of SFs and ATBC. However, the presence of ATBC had a negative impact on the tensile and flexural properties of the bio-composites. The thermal conductivity of the materials was influenced by the fiber content and processing temperature, increasing with SFs inclusion but decreasing with temperature. Differential scanning calorimetry analysis revealed increased crystallinity of PLA with the presence of SFs and ATBC. The specific heat capacity increased with ATBC but decreased with increasing SFs. Dynamic mechanical property testing showed variations in storage and loss moduli of the bio-composites at different temperatures. The storage modulus increased with higher fiber content and abruptly dropped around glass transition temperature. Rheological characterization demonstrated effective interactions between the fibers and matrix with good fiber dispersion, resulting in uniform shear viscosity versus shear rate for different capillary dimensions. The shear viscosity of the SFs/PLA mixture increased with increasing fiber content but decreased with the addition of plasticizer. Furthermore, the compounding and molding processes had a notable impact on the microstructure of the fibers, specifically resulting in fiber breakage and fiber separation during processing.
Keywords
Introduction
The development and use of low-cost polymer composites with high strength have been a major issue in the research area for decades. These composites have found widespread use in various industrial and domestic applications. 1 Recently, there has been a growing interest in eco-friendly composites made from biodegradable polymers and natural fibers in the composite industry.2–4 The driving factors behind the development and utilizing of these bio-composite materials are their potential biodegradability, suitability for specific industrial applications, adequate mechanical properties, and relatively simple manufacturing methods. 5 Consequently, these eco-friendly composites have started replacing synthetic fiber reinforced composites in automotive components such as door panels, trunk panels, and headliners.6,7
The mechanical properties of commonly used natural fibers.
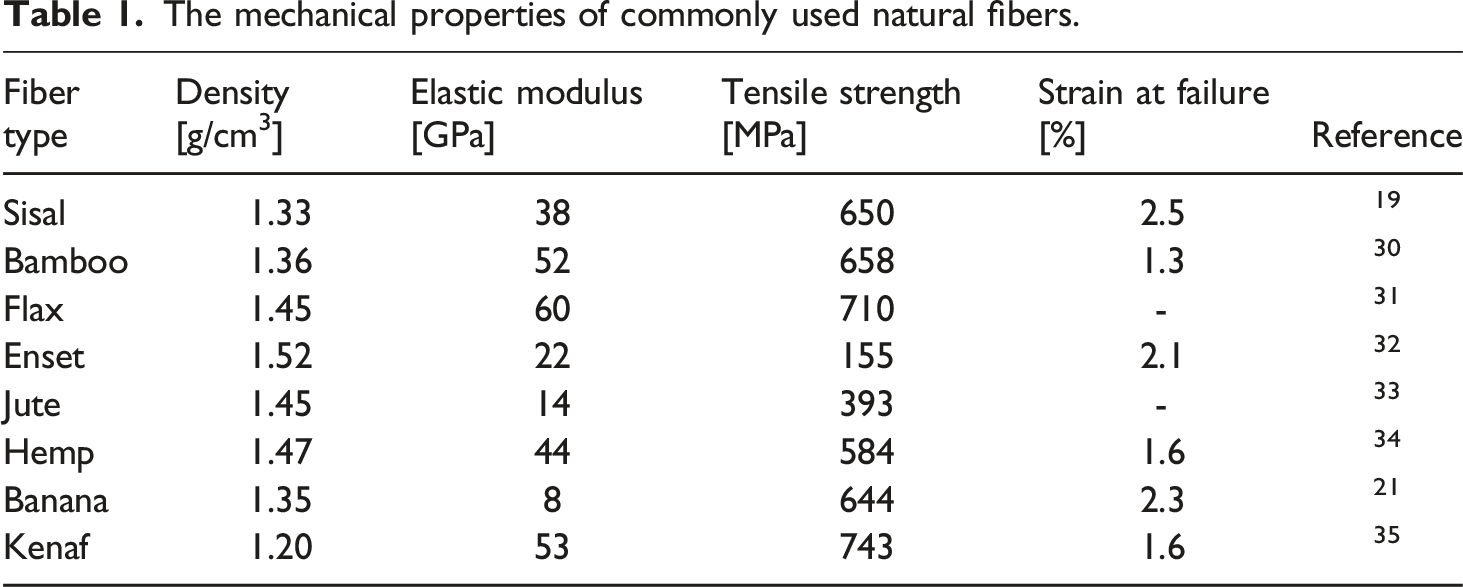
Previous studies have shown that natural fiber reinforced composites have been reported to exhibit comparable mechanical properties to synthetic fiber reinforced composites. 21 Rozite et al 22 reported that composites produced through extrusion and injection molding, utilizing a PLA matrix with 10% weight fraction of 1 mm-long flax fibers and 5% weight fraction of 2 mm-long viscose fibers, demonstrated respective tensile strengths of 29.5 MPa and 26.8 MPa at a relative humidity of 34%. These findings indicate that increasing the fiber content in the composites enhances the mechanical properties, particularly the tensile strength. Despite this, the adhesion between hydrophilic natural fibers and hydrophobic polymer matrix is often poor, 14 which affects composite performance. In addition, there are some shortcomings of natural fibers as a reinforcement such as processing temperature limited to 200°C and low dimensional stability. 5 Researchers have conducted experimental research to address these issues and improve the fiber-matrix adhesion strength, which is crucial for the mechanical properties of the composites. 18
The thermal characteristics of natural fiber reinforced polymer composites have also gained attention to understand their behavior at elevated processing temperatures.12,23 Bio-based polymers have a limited processing temperature due to their thermal degradation starting just above their melting point. 24 Moreover, the presence of natural fiber reinforcements affects the thermal stability, crystallization, and melting behavior of bio-composite materials. 25 The rheological properties of polymer composites are studied to evaluate their processing behavior, 26 and it has been observed that reinforcement influences the rheological properties of PLA composites. 27 Several studies have also investigated the influence of fiber addition on the dynamic mechanical properties, rheology and crystallinity of PLA matrix. According to Wang et al, 28 the incorporation of abutilon natural straw into PLA composites through extrusion and injection molding processes resulted in an observed increase in storage modulus and viscosity with increasing abutilon straw content. In a similar study, Samouh et al 29 found that increasing the weight percentage of sisal fiber reinforcement (5%, 10%, and 15%) in PLA composites processed through extrusion and injection molding resulted in improved mechanical and dynamic mechanical properties. Furthermore, the incorporation of 10% sisal fiber in the bio-composite led to a rise in PLA’s degree of crystallinity from 47% to 61%, as the sisal fibers acted as nucleating agents for the PLA.
The purpose of this study is to investigate the effect of the processing methods and of the loading of SFs on the mechanical, thermal, and rheological properties of the resulting PLA bio-composites. Studying the behavior of SFs reinforced PLA bio-composites under elevated conditions is crucial for assessing their applicability. In addition, evaluating the mechanical and thermal properties of SFs reinforced PLA bio-composites helps assess the effect of processing on the intrinsic properties of PLA. The effects of temperature and fiber content on the mechanical, thermal and rheological characteristics of PLA bio-composites are also critical to study.
Materials and methods
Materials
In this study, the bio-composites were prepared using PLA resin (Natureworks 4043D) with 95% L-lactic acid and 5% D-lactic acid and molecular weight of 110,000 g/mol. 36 Sisal fibers (SFs) were used as reinforcement material in these bio-composites. The SFs were obtained from the Afar region in Ethiopia. To investigate the mechanical, thermal, and rheological properties of the bio-composites, different weight percentages (wt%) of SFs were utilized. Prior to compounding, the SFs were cut to an approximate length of 5 mm. Tributyl 2-acetylcitrate (ATBC) plasticizer was used in the bio-composites. ATBC was selected for its bio-based nature and easily available in the laboratory at KU Leuven.
Processing
PLA-based bio-composites containing SFs were processed using a co-rotating twin screw extruder (Leistritz ZSE18maxx) for compounding and an injection moulding machine (Arburg320S-50T) for sample fabrication with tensile bar ISO 527 geometry. Composites with a fiber content ranging from 0 to 20% were prepared. To conduct this study, bio-composite samples of SF/PLA/ATBC with wt% of 0/100/0, 0/94/6, 5/89/6, 10/84/6, 15/85/0, 15/80/5, 20/80/0 and 20/75/5 were prepared. To maintain a constant ratio of PLA to ATBC, varying amounts of the plasticizer were used in different composite compositions. This was done to better understand the effect of the plasticizer on the matrix material. Compounded pellets were used to perform the rheological, TLS thermal conductivity and differential scanning calorimetry (DSC) tests. Injection-molded samples were used to perform the mechanical, dynamic mechanical analysis (DMA) as well as MTPS thermal conductivity tests.
Mechanical properties
Tensile testing
Tensile sample fabrication and testing were performed according to ISO 527 standard. 37 The tests were performed using an Instron 3367 testing machine equipped with a load cell of 30 kN and a testing rate of 5 mm/min. An extensometer was employed to measure the initial strain of the samples, which was then removed from the samples at a strain of 1%. The tests were conducted at room temperature and relative humidity of 40%. The tests were conducted on five samples of each material composition.
Flexural testing
Flexural (three point bending) sample preparation and testing were carried out according to ISO 178 standard. 38 The tests were performed using an Instron 3367 testing machine equipped with a load cell of 30 kN and a testing rate of 2 mm/min. The maximum displacement of the sample was tuned to 10 mm. The tests were carried out at room temperature and relative humidity of 40%. Five samples of each material composition were tested.
Impact testing
Impact testing was performed using a Ceast resil impactor Charpy impact test setup. The hammer was released from an angle of 150o and hit the sample. The test was performed with a hammer impact energy of 2.75 J and an impact speed of 3.46 m/s. Sample preparation and testing were conducted according to ISO 179 standard. 39 The tests were carried out at room temperature and relative humidity of 40%. Each material composition was tested on five samples.
Thermal conductivity
The thermal conductivity tests were performed using a C-Therm Trident instrument. The tests were conducted using the MTPS sensor according to ASTM D7984 40 and TLS needle sensor according to ASTM D5334. 41 For the MTPS method, measurements of thermal conductivity were conducted across a temperature range from room temperature (24°C) to 70°C. Three tests were performed on both sides of each sample. For the TLS method, measurements of thermal conductivity were conducted at a temperature of 175°C.
Differential scanning calorimetry
Differential scanning calorimetry (DSC) tests were performed using TA Q200 instrument. Degree of crystallinity (Xc) (according to ASTM E794 standard
42
), glass transition temperature (Tg) (according to ASTM E1356 standard
43
) and specific heat capacity (Cp) (according to ASTM E1269 standard
44
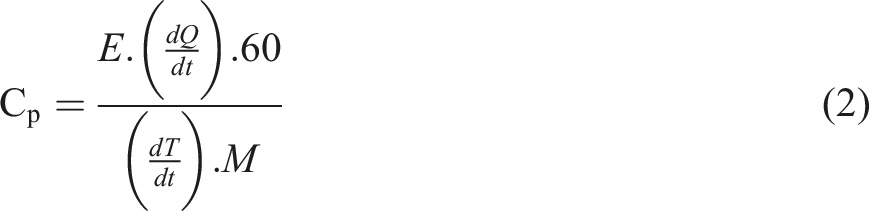
) of the bio-composites were determined. In this experiment, samples of 5 to10 mg were heated from 0°C to 190°C at a rate of 10°C/min, then waited at 190°C for 5 min to eliminate thermal history, and then reheated to 190°C after cooling to 0°C. The thermal parameters including Tg, cold crystallization temperature (Tcc), melting temperature (Tm), and degree of crystallinity (Xc) were evaluated during the second heating scan under controlled conditions. Xc was calculated as the ratio between the heat of fusion of the sample (ΔH = ΔHm - ΔHcc, ΔHm and ΔHcc being the specific melting and cold crystallization enthalpies, respectively), considering only the polymer fraction, and the heat of fusion of 100% crystalline PLA. Xc was determined to analyze the effects of bio-composite process, reinforcement and plasticizer on the crystallinity of PLA. The degree of crystallinity percentage (Xc%) was calculated using equation (1).
45

Dynamic mechanical analysis
Dynamic mechanical analysis (DMA) is used to measure the mechanical properties of viscoelastic materials as a function of time, temperature and frequency. Three-point bending tests as a function of time, temperature and frequency were done using dynamic mechanical analyzer (DMA/SDTA 1+ system - Mettler Toledo). The sample preparation and testing were performed according to ASTM D5023 standard. 47 Storage modulus (E'), loss modulus (E'') and the relationship between the two moduli (Tan δ) were determined over a temperatures range of 0°C to 70°C, at a frequency of 1.0 Hz. Tan δ is defined as the ratio of the loss modulus to the storage modulus (E''/E').
Rheological properties
Rheological testing of bio-composites was performed on melt samples using RheoArt® and Ceast rheometers. In the RheoArt® rheometer, two capillaries with lengths and diameters of 40 and 2 mm as well as 20 and 1 mm, respectively, at melting temperatures of 190°C and 210°C were used. In the Ceast rheometer, one capillary with length and diameter of 20 and 1 mm, respectively, at a melting temperature of 190°C was used. The tests were carried out to investigate the influence of melting temperature, capillary volume and fiber content on the viscosity of the bio-composites. All samples were well dried before testing.
Laser scanning microscopy
Laser scanning microscopy (LSM) was used to analyze the fiber size, dispersion, interaction with polymer matrix, and the effect of the injection molding process on the microstructures of the composites. Pieces of composite specimen were embedded with a resin consisting of 15 mL of Epofix resin and 2 mL of Epofix hardener, and cured inside a desiccator for 24h. Subsequently, the specimens were subjected to grinding and polishing using sandpaper of various sizes and diamond paste. All LSM micrographs were performed by Keyence laser microscope (VK-X3000, Japan).
Results and discussions
Mechanical properties (tensile, flexural and impact)
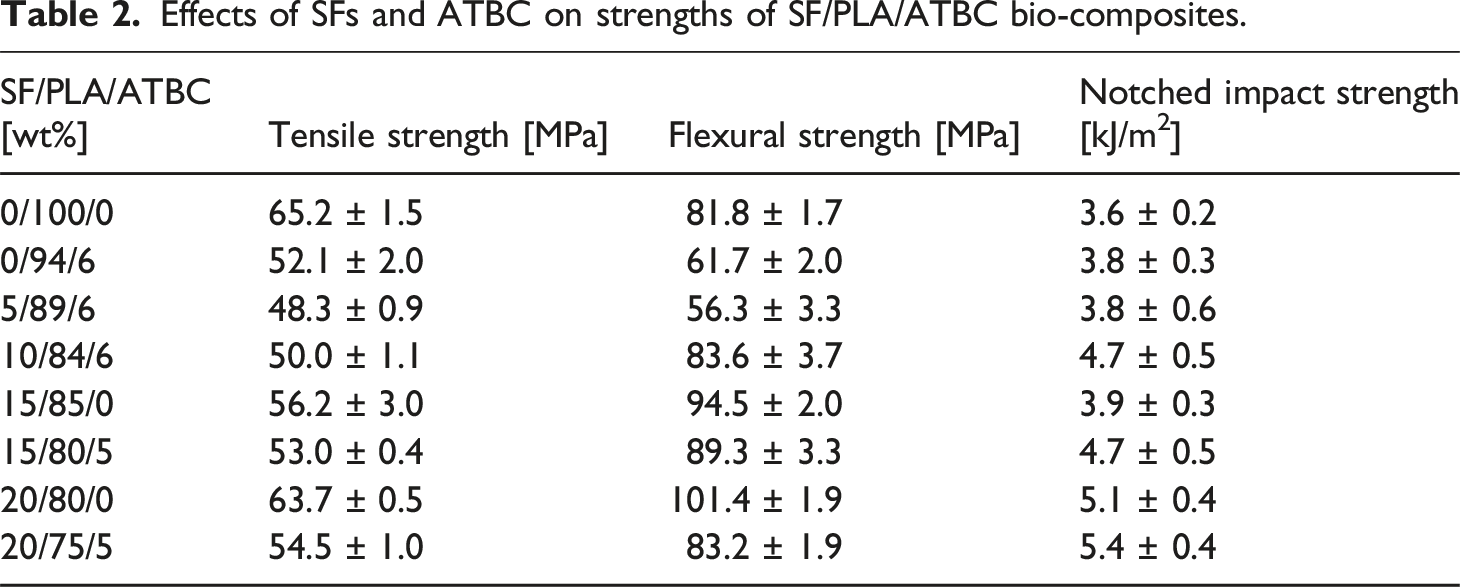
Effects of SFs and ATBC on strengths of SF/PLA/ATBC bio-composites.
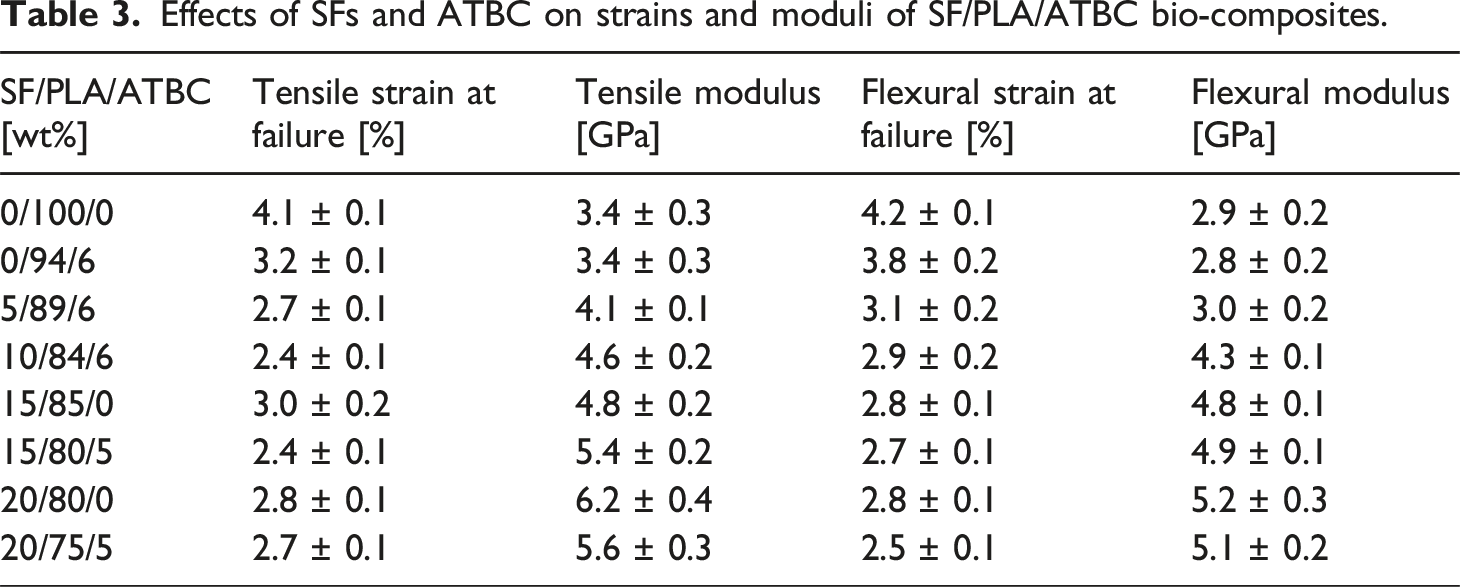
Effects of SFs and ATBC on strains and moduli of SF/PLA/ATBC bio-composites.
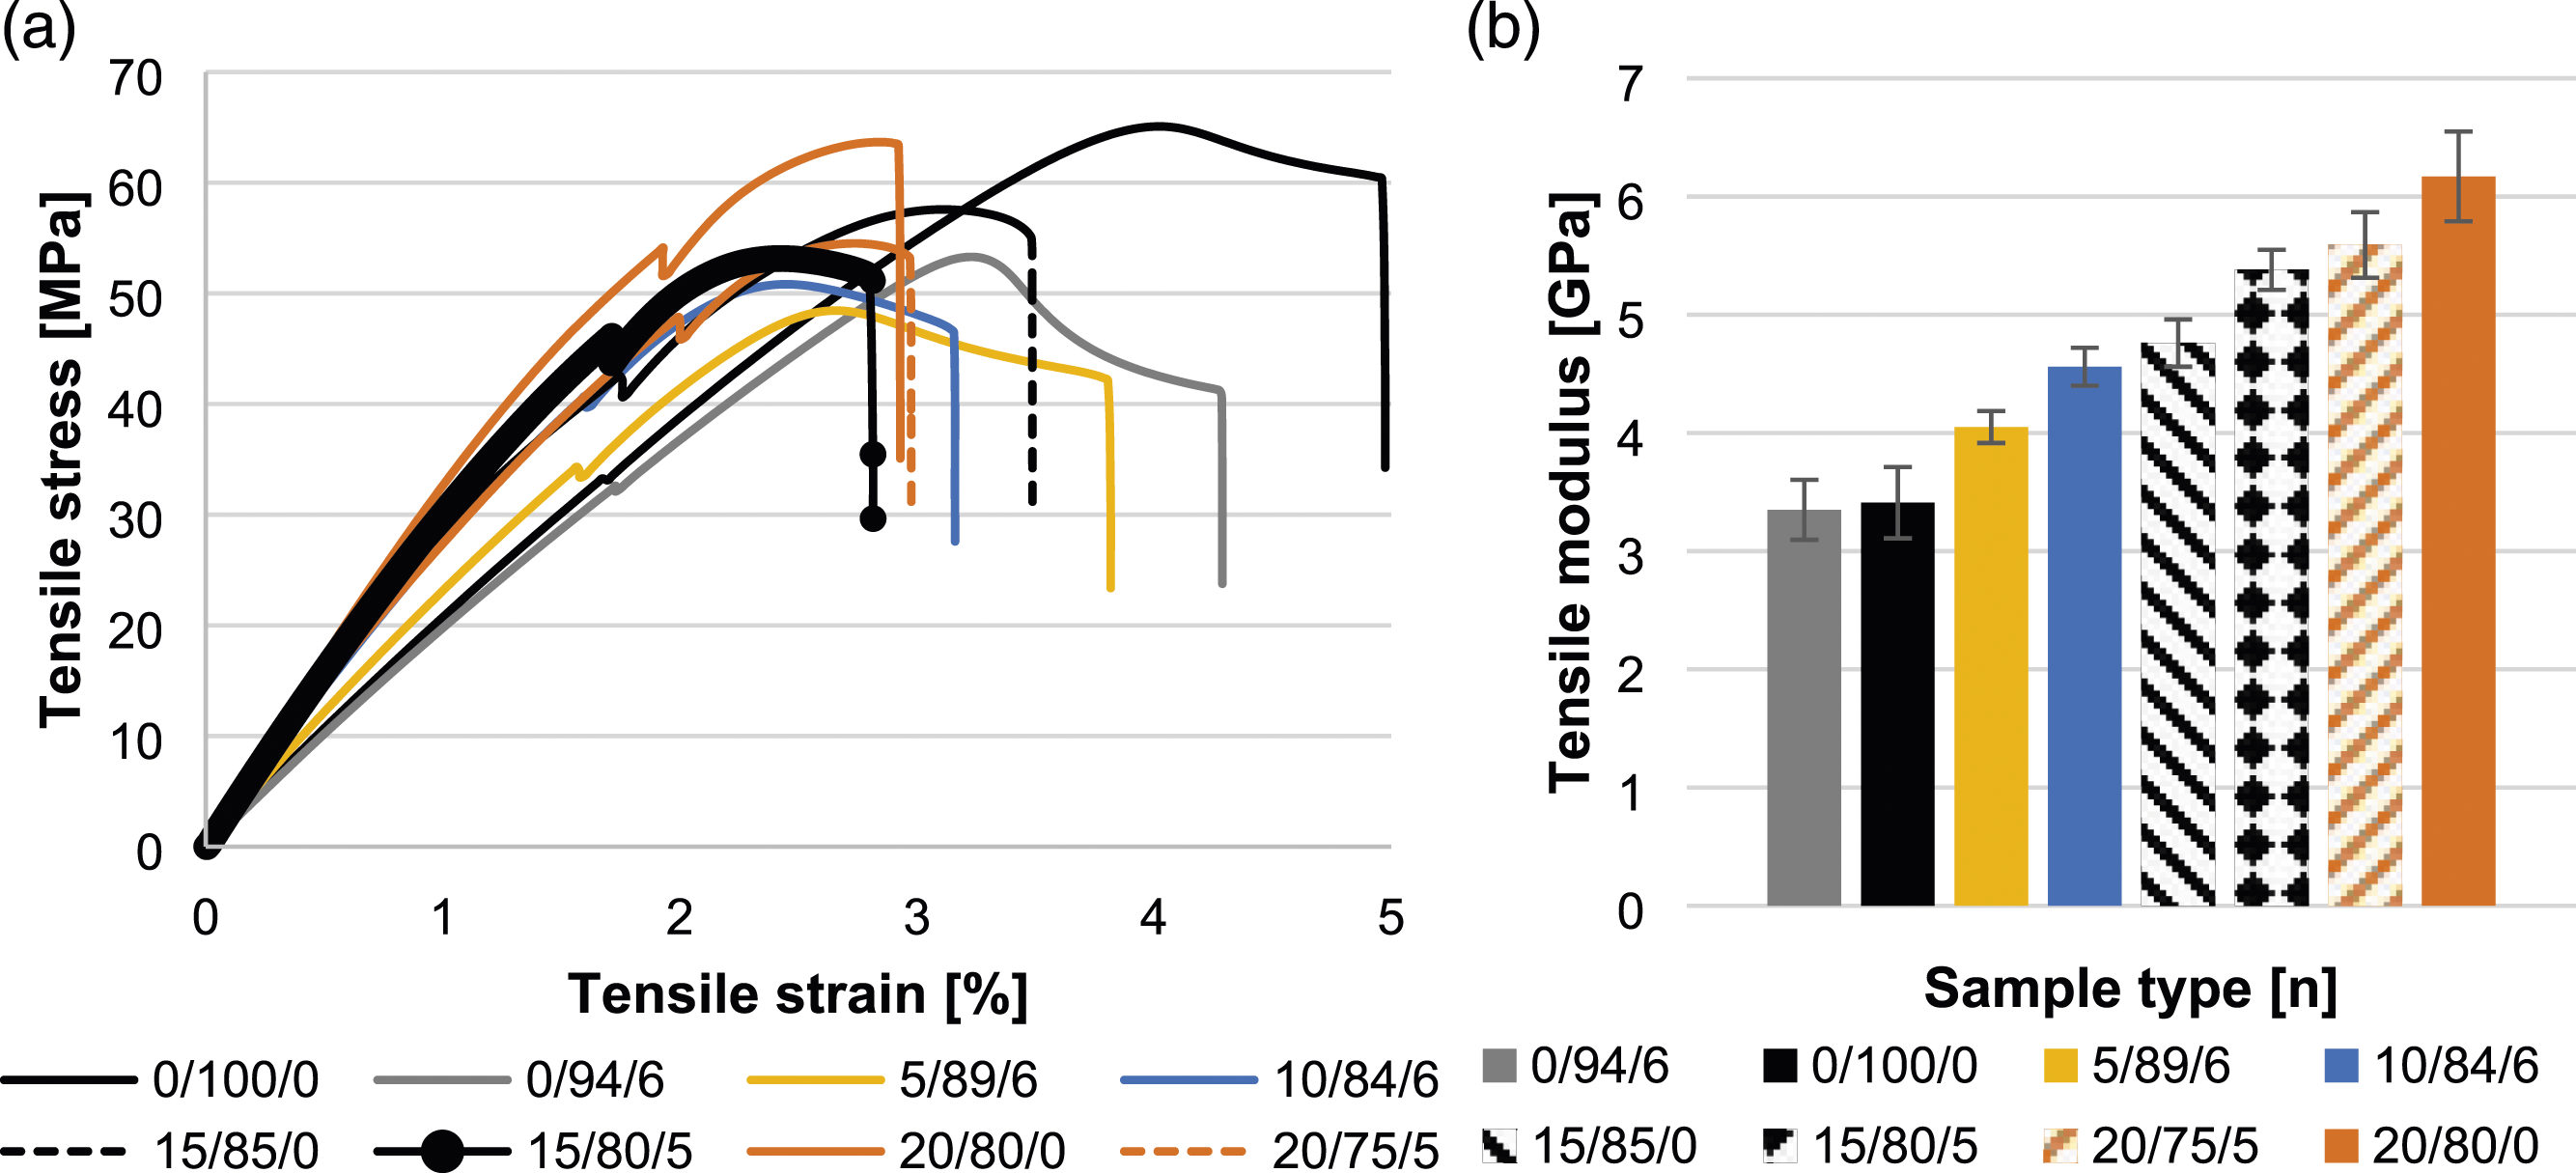
(a) Tensile stress-strain curves, and (b) plots of tensile moduli of the bio-composites.
Table 2 and Table 3 also present the flexural properties of neat PLA and SF/PLA bio-composites with different weight percentages (wt%) of SFs. It is observed that the flexural strength of neat PLA was 81.8 MPa, whereas the plasticized SF/PLA bio-composite containing 5 wt% of SFs exhibited a reduced flexural strength of 56.3 MPa. However, the flexural strength of non-plasticized SF/PLA bio-composites with 15 wt% and 20 wt% of SFs were 94.5 MPa and 101.4 MPa, respectively. This suggests the fiber content and dispersion result in effective load transfer, compensating to some extent for the negative effect of poor fiber-matrix adhesion and breakage of fibers. However, a 22% decrease in flexural strength was observed for plasticized PLA with 20 wt% of SFs compared to non-plasticized PLA with the same fiber content. This decrease is attributed to the dominant effect of the plasticizer, which surpasses the reinforcing effect of the fibers. In addition, the flexural modulus of non-plasticized SF/PLA bio-composites with 20 wt% of SFs was 5.2 GPa, representing an increase of 79% and 2% compared to the values of 2.9 GPa for neat PLA and 5.1 GPa for plasticized SF/PLA bio-composite with 20 wt% of SFs, respectively. Furthermore, the flexural strain at failure for neat PLA was 4.2%, which was 11% higher than the value of 3.8% observed for plasticized PLA. The flexural strain at failure for non-plasticized SF/PLA bio-composites with 15 wt% and 20 wt% of SFs was 2.8%, which was 50% lower than the value of 4.2% observed for neat PLA. The flexural stress-strain curves of the SF/PLA bio-composites are depicted in Figure 2(a). The plot of flexural moduli are also shown in Figure 2(b). (a) Flexural stress-strain curves, and (b) plots of flexural moduli of the bio-composites.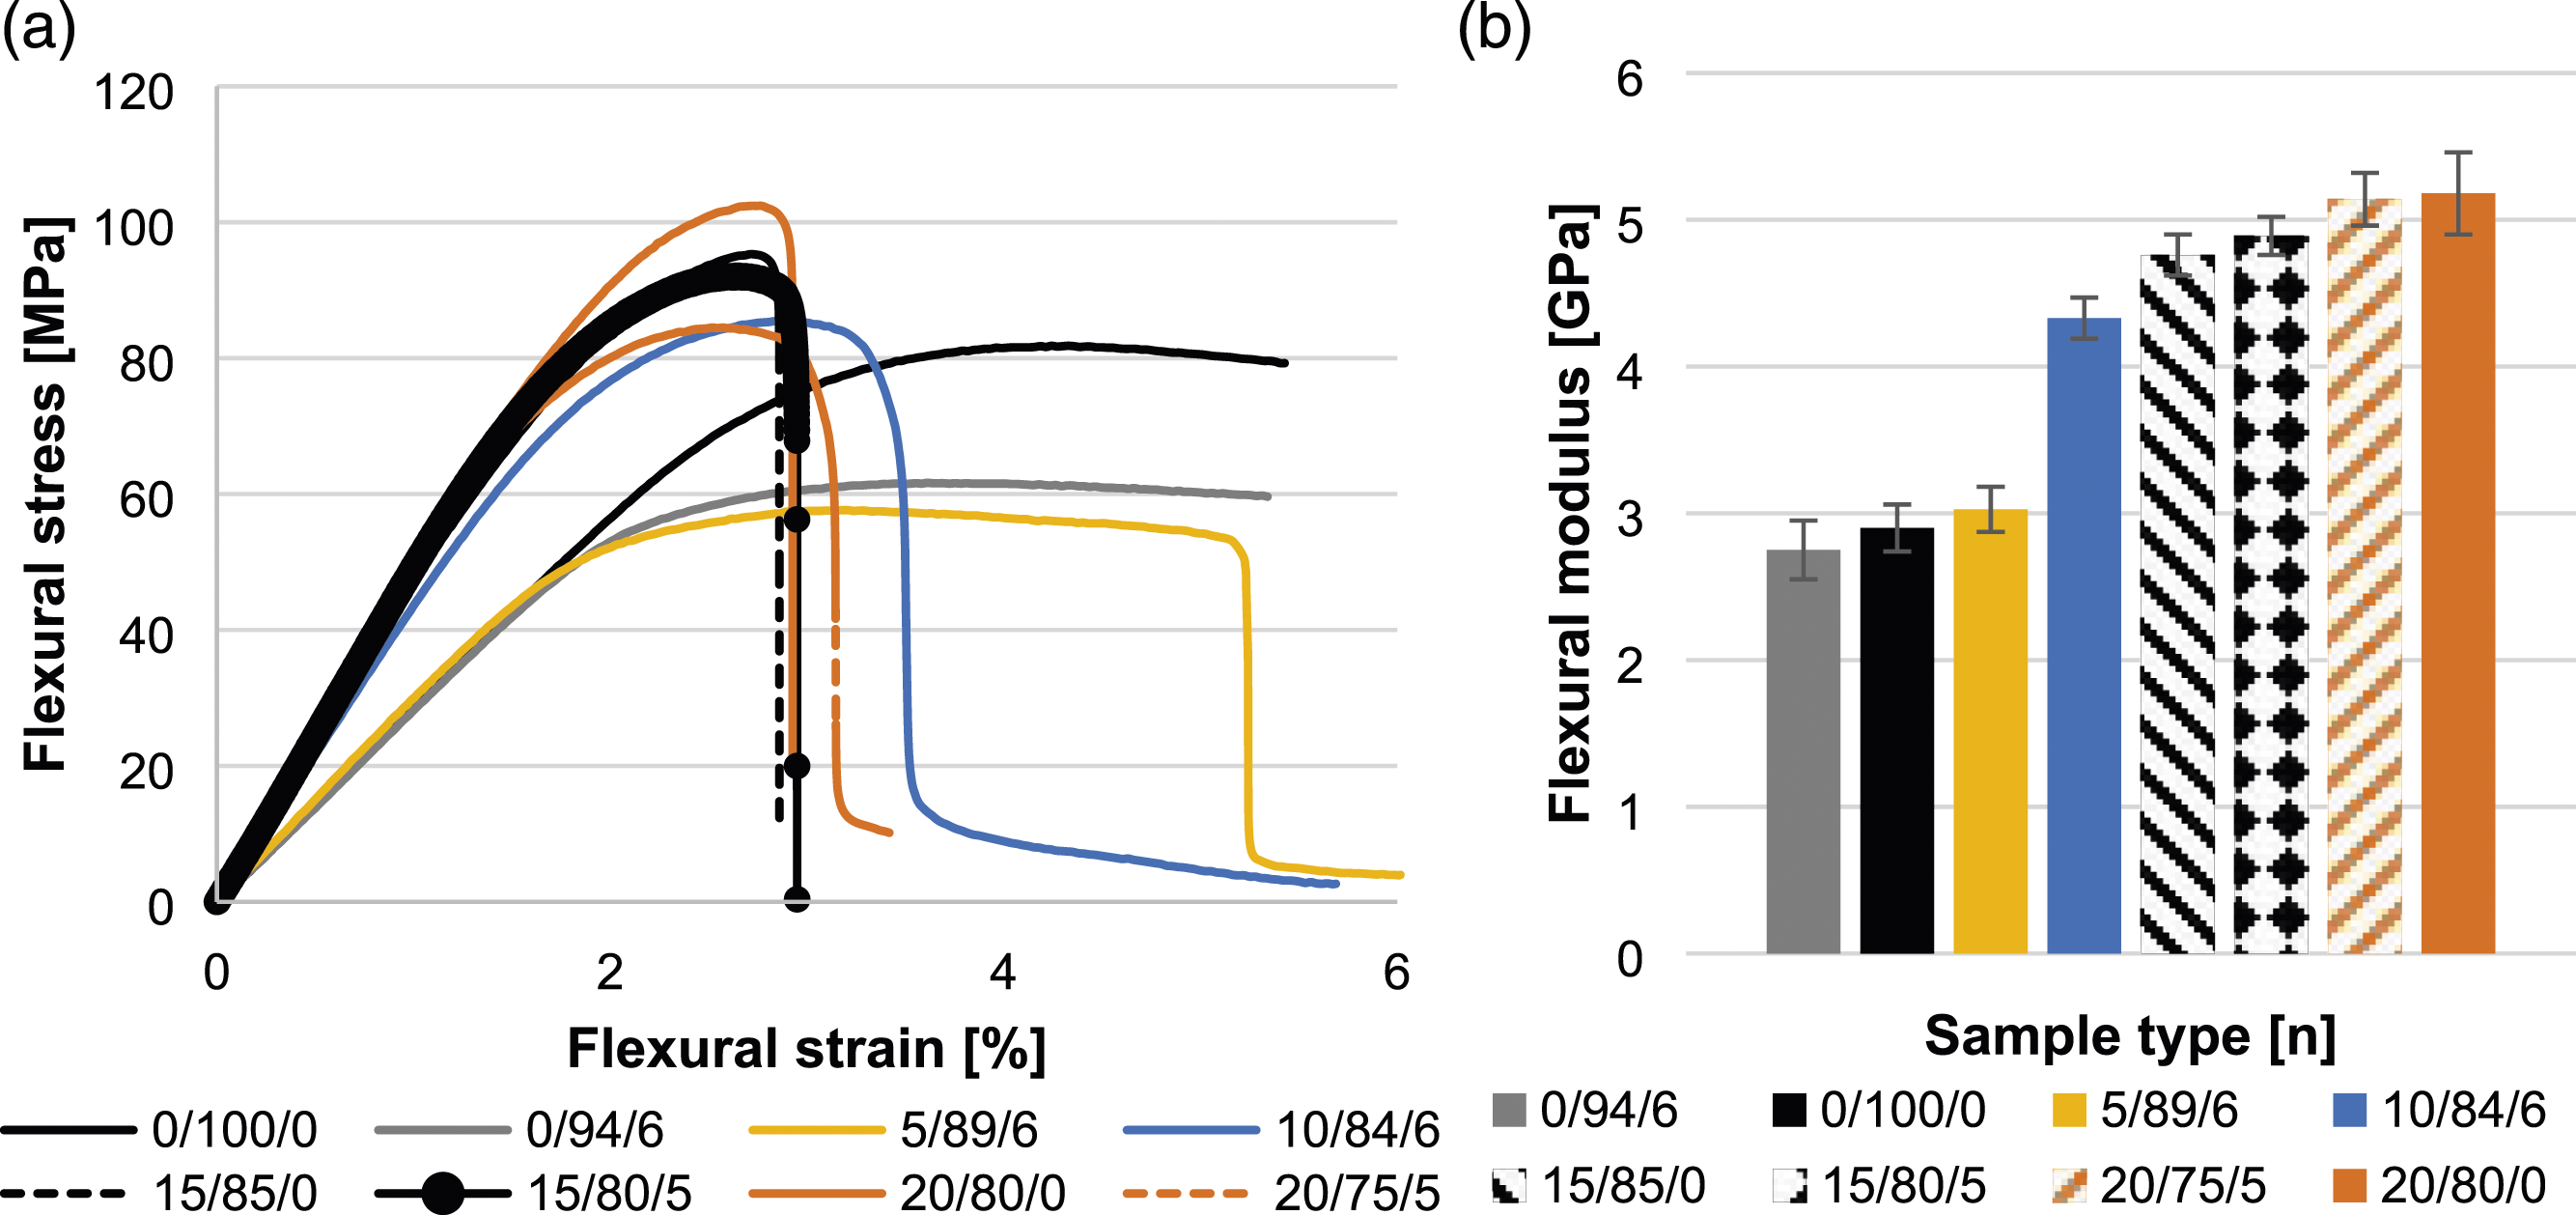
Table 2 also shows on the impact strength of neat PLA and SF/PLA bio-composites with various weight percentages (wt%) of SFs. It is observed that the impact strength of non-plasticized SF/PLA bio-composites with 20 wt% of SFs was 5.1 kJ/m2, which is 42% higher than the impact strength of neat PLA at 3.6 kJ/m2. The impact strength of plasticized PLA was 3.8 kJ/m2, representing a 6% increase compared to neat PLA. Furthermore, the impact strength of plasticized SF/PLA bio-composites with 15 wt% of SFs was 4.7 kJ/m2, which is 21% higher than the impact strength of non-plasticized SF/PLA bio-composites with 15 wt% of SFs at 3.9 kJ/m2. This indicates that the incorporation of the plasticizer in the bio-composites enhances the impact strength. Additionally, the impact strengths of plasticized SF/PLA bio-composites with 5 wt% and 20 wt% of SFs were 3.8 kJ/m2 and 5.4 kJ/m2, respectively. This indicates that the impact strength of SF/PLA bio-composites increases with an increase in the fiber content.
Thermal Conductivity
The thermal conductivity of neat polylactic acid (PLA) and bio-composites of sisal fibers (SFs) and PLA, measured using an MTPS sensor at room temperature, is illustrated in Figure 3. In Figure 3(a), it can be observed that the thermal conductivity increases as the fiber content in the SF/PLA bio-composites increases. For instance, the thermal conductivity of the SF/PLA bio-composite with 5 wt% SFs was 0.24 W/mK, which is 9% higher than the thermal conductivity of neat PLA (0.22 W/mK). Additionally, the thermal conductivity of the SF/PLA bio-composite with 20 wt% SFs was 0.29 W/mK, exhibiting an increase of 32% and 21% compared to the thermal conductivity of neat PLA and the SF/PLA bio-composite with 5 wt% SFs, respectively. This enhancement in thermal conductivity with higher fiber content can be attributed to an increase in crystallinity, as confirmed by DSC results. Previous literature has also established a positive correlation between thermal conductivity and crystallinity.
49
Furthermore, a slight increase in thermal conductivity was observed with the incorporation of tributyl 2-acetylcitrate (ATBC) plasticizer, resulting in a thermal conductivity of 0.23 W/mK for plasticized PLA, which is 5% higher than that of neat PLA (0.22 W/mK). Thermal conductivity of (a) bio-composites using MTPS at 24°C, and (b) bio-composite 20/75/5 using MTPS and TLS at 24°C, 70°C and 175°C.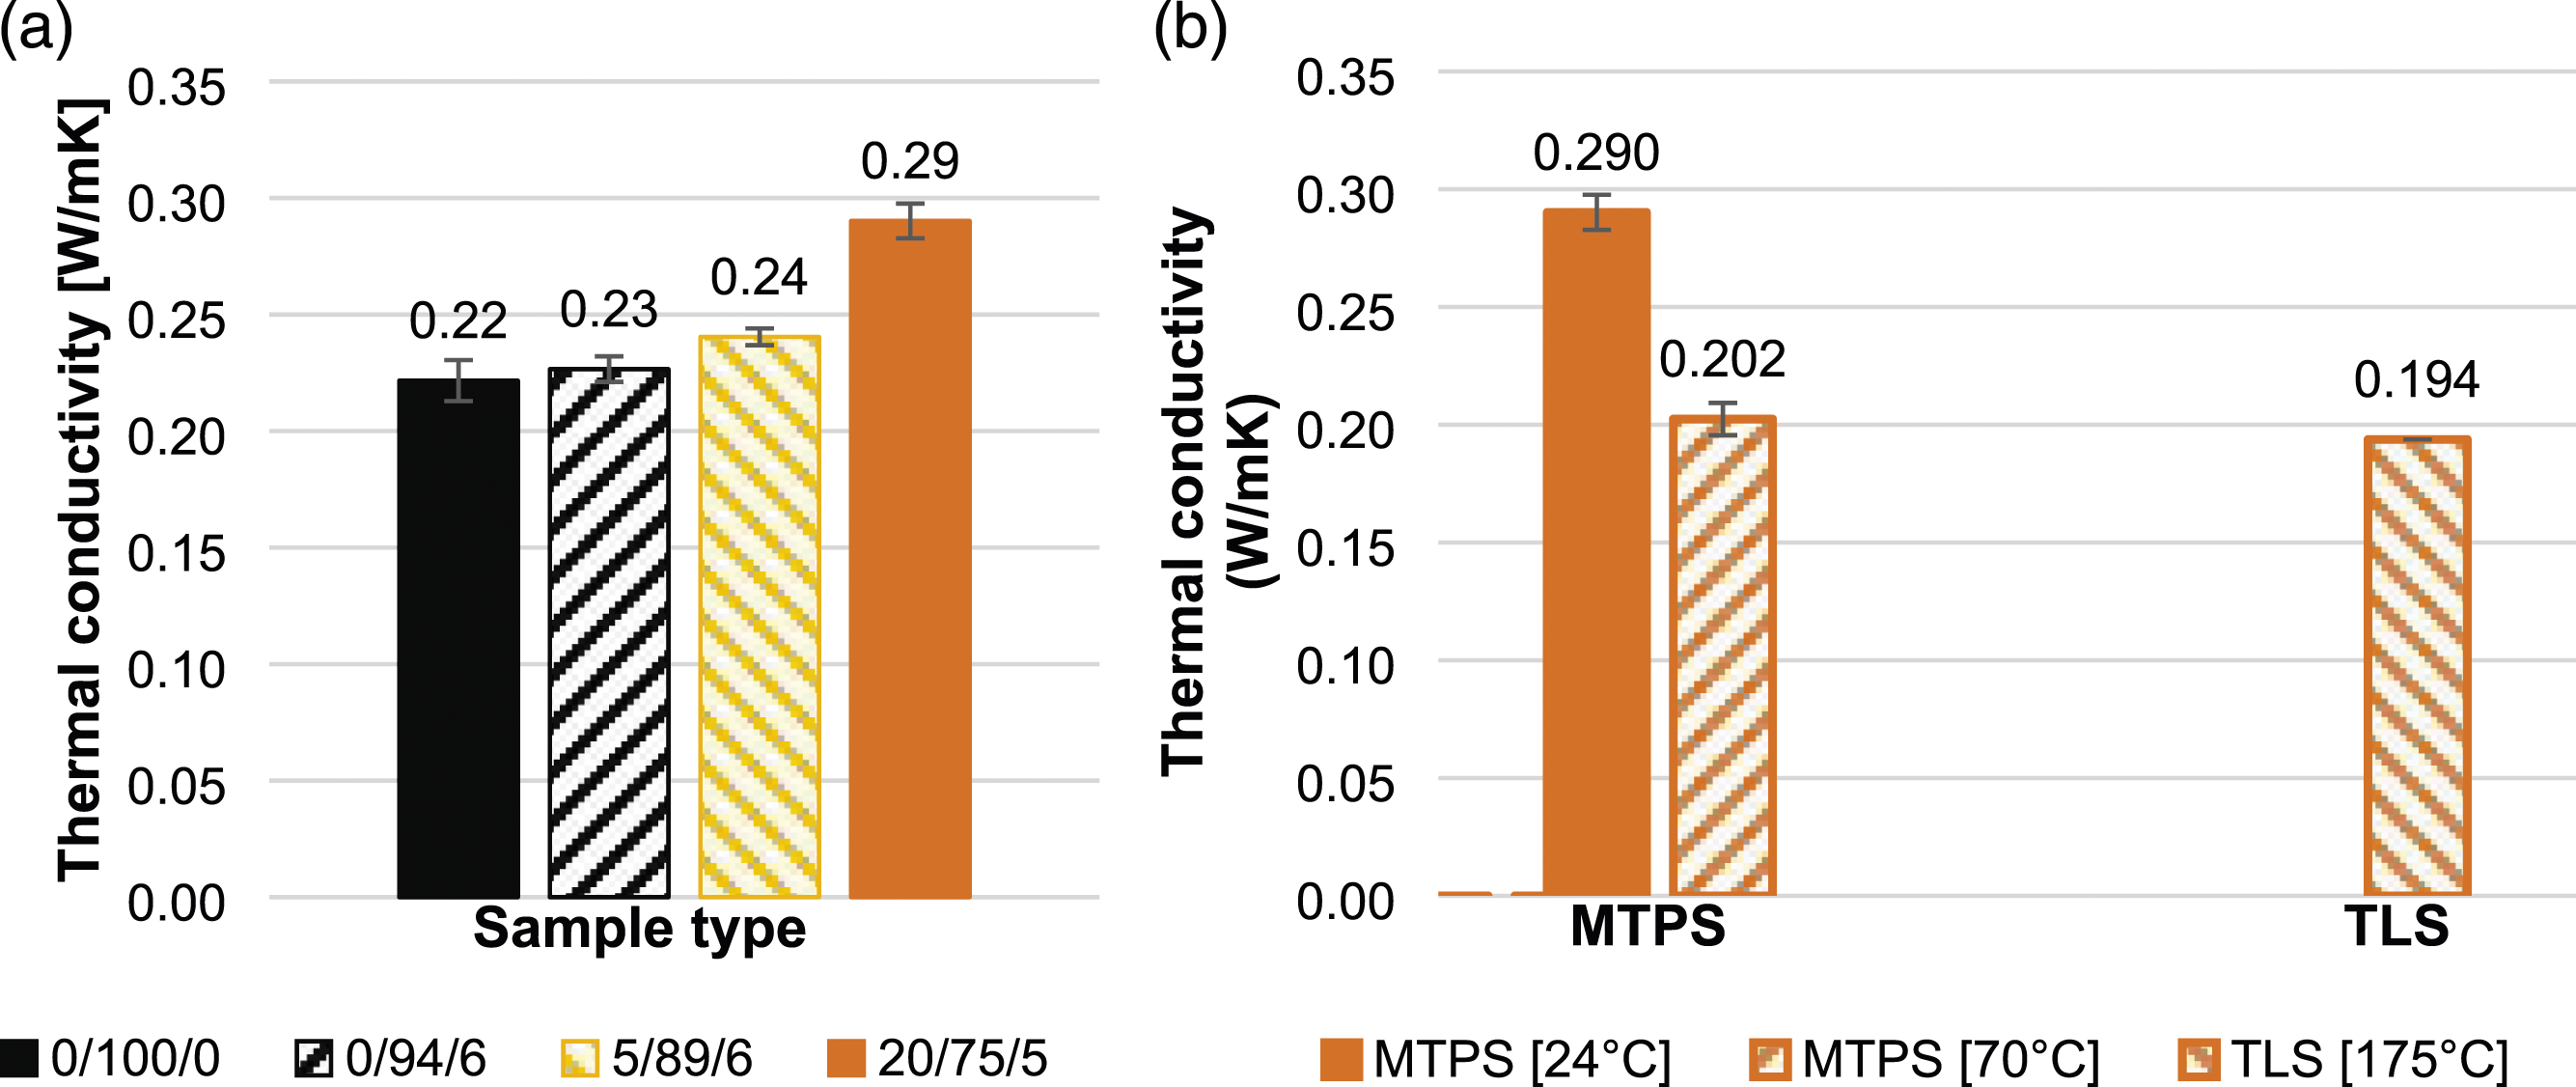
In Figure 3(b), the thermal conductivity of the bio-composite 20/75/5 is shown, measured using both MTPS and TLS sensors at different temperatures. The results indicate that the thermal conductivity decreases with increasing temperature. Specifically, at 70°C, the thermal conductivity of the SF/PLA bio-composite with 20 wt% SFs was 0.202 W/mK, exhibiting a reduction of 44% compared to the same bio-composite at 24°C (0.29 W/mK). Similarly, at 175°C, the thermal conductivity of the SF/PLA bio-composite with 20 wt% SFs was 0.194 W/mK, which is 50% lower than the thermal conductivity of the same bio-composite at 24°C. This decrease in thermal conductivity with temperature can be attributed to an increase in molecular chain mobility, which reduces the efficiency of heat transfer. 50 However, it is worth noting that the thermal conductivity of the bio-composite only dropped by 4% from 70°C to 175°C, indicating a limited decrease in thermal conductivity within this temperature range.
Differential scanning calorimetry
DSC data of PLA and its bio-composites.
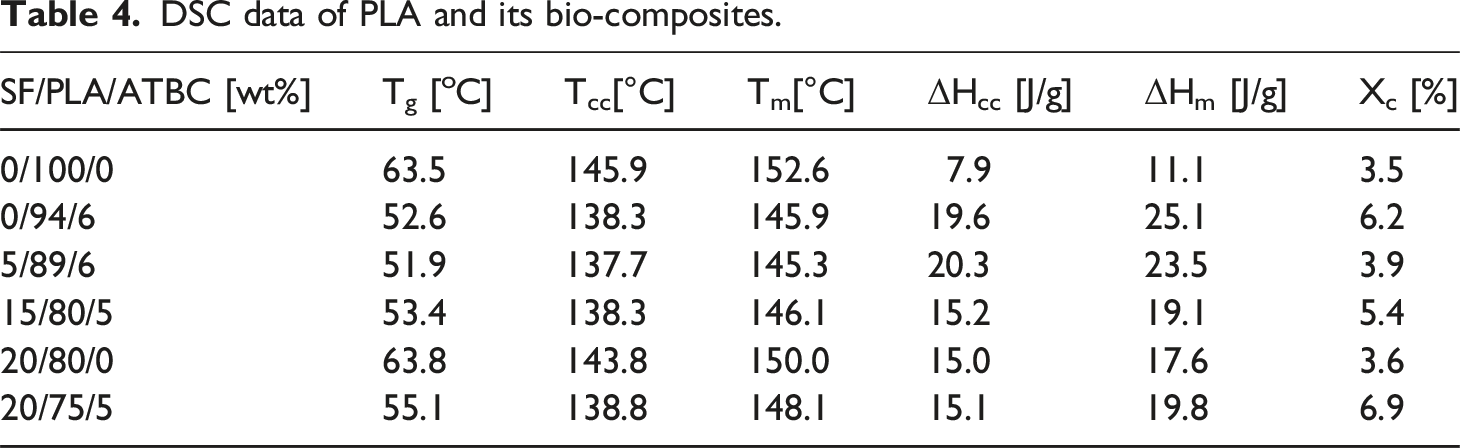
The addition of tributyl 2-acetylitrate (ATBC) plasticizer to polylactic acid (PLA), regardless of fiber incorporation, led to a decrease in Tg values. This decrease can be attributed to increased molecular chain mobility in the SF/PLA bio-composites after plasticization. A similar observation was reported in the preparation and characterization of PLA plasticized with vegetable oil and reinforced with sisal fibers (SFs). 51
In comparison to neat PLA, the Tcc and Tm values of SF/PLA bio-composites decreased after the incorporation of ATBC plasticizer. The Tcc and Tm values of neat PLA were measured at 145.9°C and 152.6°C, respectively. For SF/PLA bio-composites with 20 wt% SFs and 0 wt% ATBC, the Tcc and Tm values were observed at 143.8°C and 150°C, respectively. Similarly, for PLA bio-composites with 20 wt% SFs and 5 wt% ATBC, the Tcc and Tm values were measured at 138.8°C and 148.1°C, respectively. The decrease in the Tcc is attributed to the presence of the plasticizer, enabling the PLA to crystallize at lower temperatures. Numerous studies have confirmed that the addition of plasticizers increases the crystallization process by enhancing the chain mobility of PLA.52–54 Consequently, the crystallinity of plasticized PLA was higher than that of neat PLA, indicating that ATBC plasticizer acts as a nucleating agent in PLA. This is a typical behavior of plasticizers, which can promote crystallinity by enhancing chain mobility. 55 Furthermore, the presence of SFs in the bio-composites acts as a nucleating agent, further enhancing PLA’s crystallinity. 48 The crystallinity of PLA increases with higher fiber content in the bio-composites. 56
However, it should be noted that both neat PLA and non-plasticized SF/PLA bio-composites exhibited almost amorphous characteristics. Although the DSC results suggested an increase in PLA crystallinity due to the presence of the ATBC plasticizer and SFs, the observed increase in crystallinity was minimal. The ΔHcc and ΔHm values of the bio-composites increased after the incorporation of SFs and ATBC plasticizer, indicating a higher tendency to crystallize compared to neat PLA. It was observed that the crystallization effect of the ATBC plasticizer was more pronounced than that of SFs.
The effect of ATBC plasticizer on the Tcc of SF/PLA bio-composites was also investigated (Figure 4). The results indicate that SF/PLA bio-composites incorporating ATBC plasticizer did not undergo cold crystallization during the first heating scan but exhibited crystallization during the second scan (Figure 4(a)). In contrast, SF/PLA bio-composites without the incorporation of ATBC plasticizer demonstrated cold crystallization in both the first and second heating scans (Figure 4(b)). This can be attributed to the enhanced crystallization of the PLA matrix with the addition of the plasticizer. During the first heating scan, the lower Tcc resulting from the addition of the plasticizer indicates a stronger propensity for crystallization.
57
Consequently, the crystallinity (Xc) of plasticized PLA increased compared to neat PLA. The subsequent standardized cooling and second heating scans further elucidate the changes in thermal properties associated with modifications in composition. For amorphous PLA incorporating ATBC plasticizer, the Tcc occurred subsequently during the second heating scan, accompanied by a decrease in Tm. Cold crystallization behavior of PLA matrix (a) with addition of ATBC plasticizer, (b) without incorporation of ATBC plasticizer.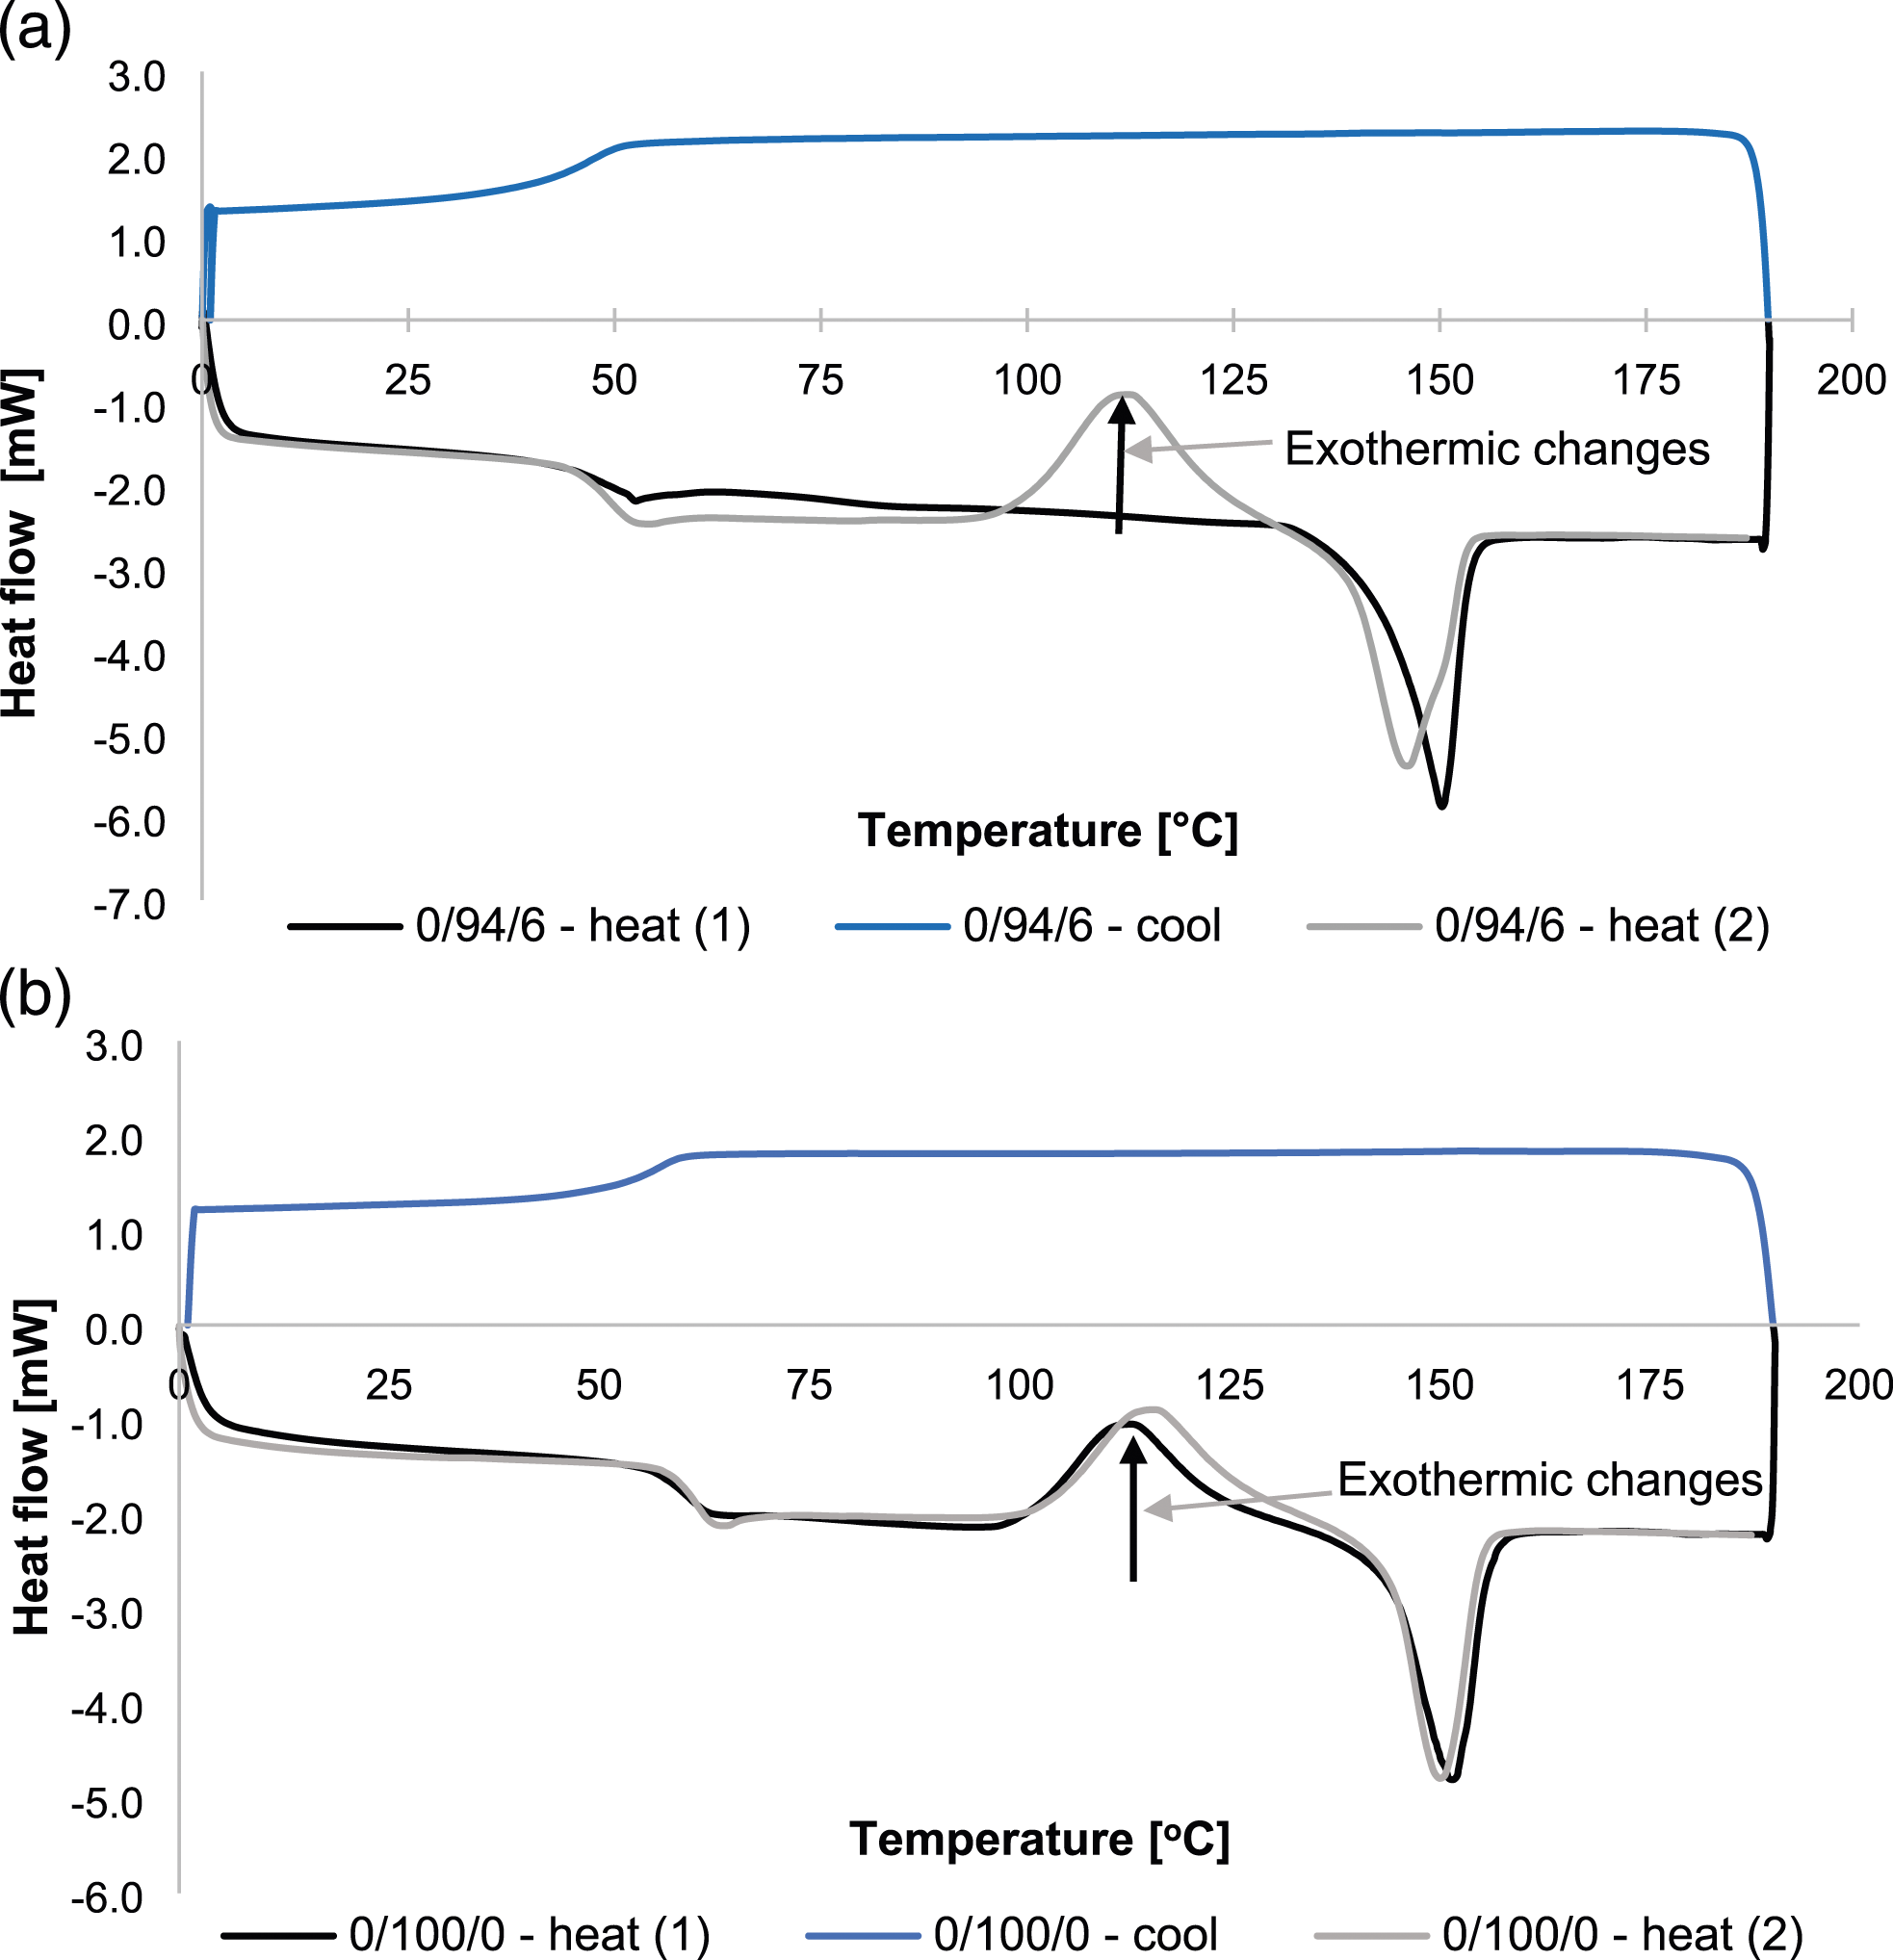
The determination of specific heat capacity (Cp) for both neat PLA and SF/PLA bio-composites was carried out using the sapphire method, according to ASTM E1269 standard.
44
The calculated Cp values for neat PLA and SF/PLA bio-composites are presented in Figure 5. It is observed from the results that the Cp of SF/PLA bio-composites remained relatively constant up to 130°C. In contrast, the Cp of neat PLA remained approximately constant up to 100°C and then gradually decreased until reaching 130°C. This behavior can be attributed to the occurrence of cold crystallization during the first and second heating scans. A significant increase in Cp was observed in SF/PLA bio-composites within the temperature range of 130°C to 150°C, which can be attributed to the change in the free volume of PLA.
49
Subsequently, Cp rapidly decreased until reaching a temperature of 160°C, after which it remained constant. Similarly, the Cp of neat PLA exhibited a sharp increase within the temperature range of 130°C to 155°C, followed by a rapid decline before reaching 160°C. After 160°C, the Cp remained constant in both cases. Furthermore, the addition of ATBC plasticizer resulted in an increase in Cp. However, with an increase in the weight percentage of SFs in the plasticized bio-composites, the Cp decreased. Specific heat capacity (Cp) of PLA and its bio-composites as a function of temperature.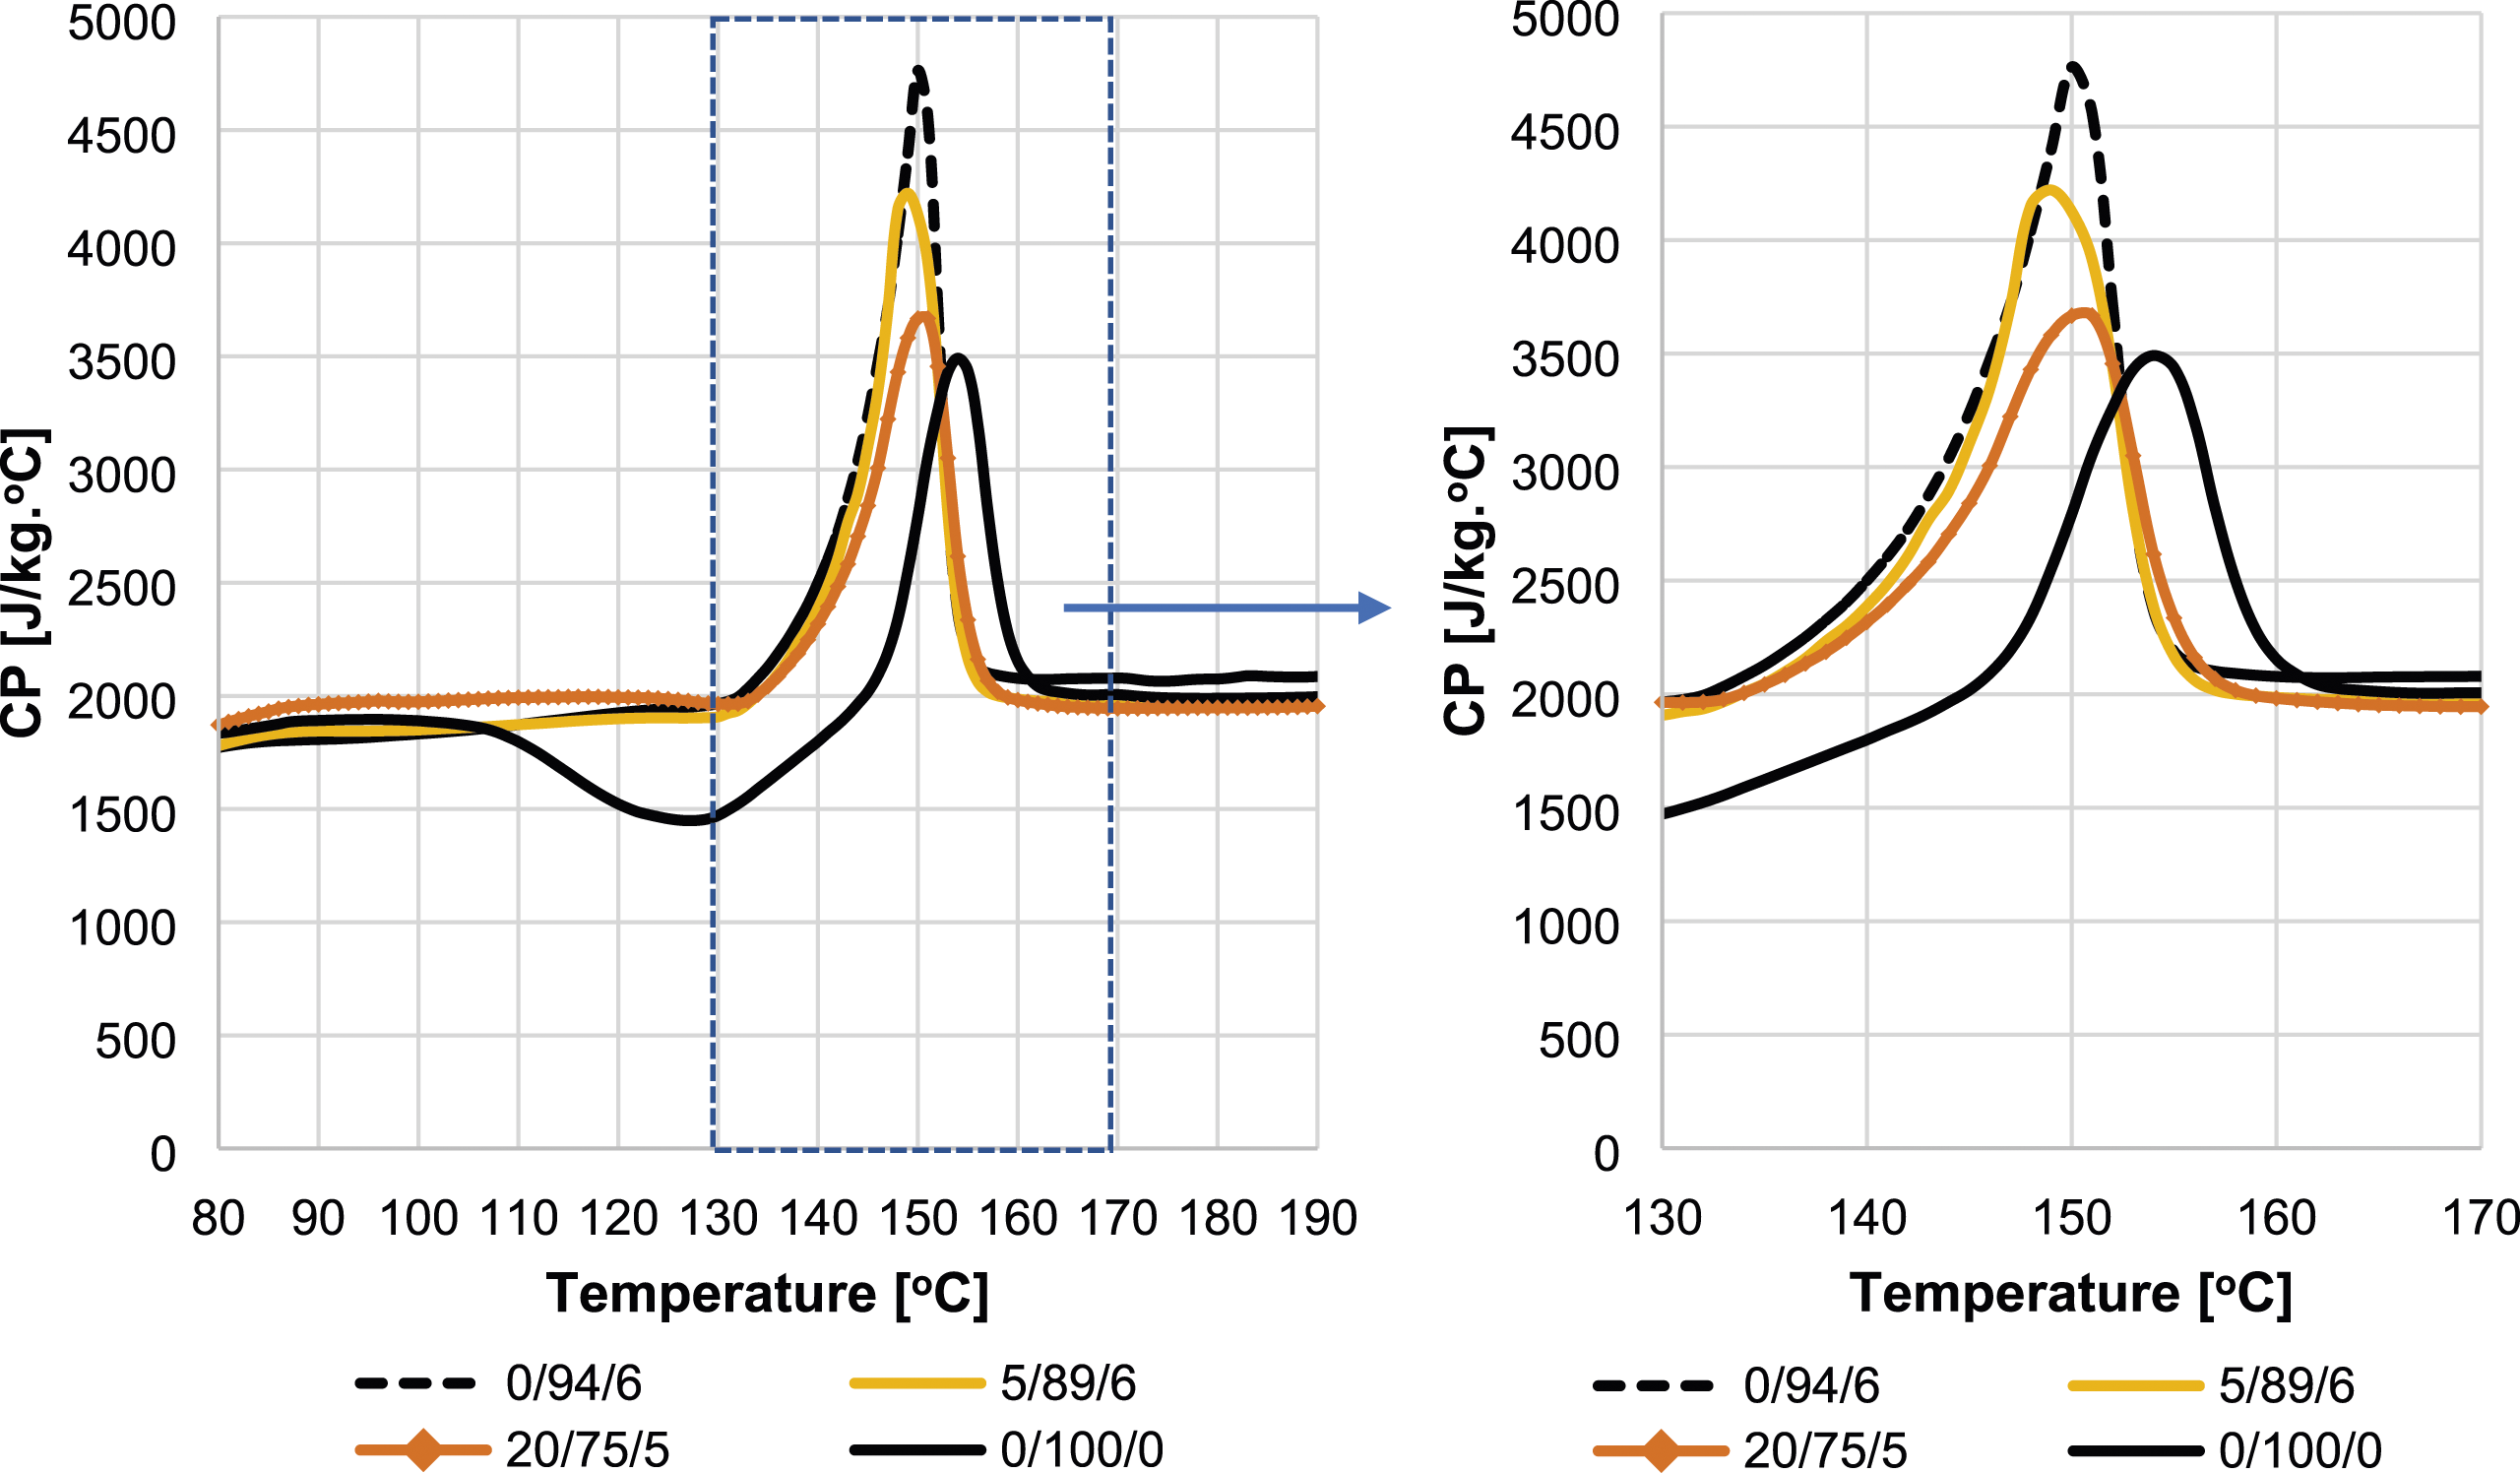
Dynamic mechanical analysis
Figure 6 illustrates the dynamic mechanical properties of SF/PLA bio-composites with varying weight percentages (wt%) of sisal fibers (SFs). Notably, the glass transition temperature (Tg) exhibited a significant influence on the storage and loss moduli of the SF/PLA bio-composites. In Figure 6(a), it can be observed that the storage moduli of plasticized SF/PLA bio-composites experienced a sudden drop between 45°C and 50°C, while the storage moduli of non-plasticized SF/PLA bio-composites decreased between 50°C and 60°C. This decline in storage modulus within the temperature range of 45°C to 60°C is attributed to the loss of material stiffness around Tg.
58
Furthermore, the Tg values of plasticized SF/PLA bio-composites were lower compared to non-plasticized SF/PLA bio-composites (Table 4). Increasing the SFs weight percentages resulted in higher storage moduli, which aligns with the flexural modulus results obtained from the Instron 3367 testing machine. This phenomenon is likely due to the incorporation of fibers with higher stiffness into the bio-composites, in contrast to neat PLA. Therefore, the storage moduli of SF/PLA bio-composites containing 15 wt% and 20 wt% SFs were 5.0 GPa and 5.4 GPa, respectively, which are increased by 47% and 59% compared with 3.4 GPa of plasticized PLA. These values exhibited a slight increase of 2% and 6% when compared to the storage moduli of 4.9 GPa and 5.1 GPa obtained from the same bio-composites tested using the Instron 3367 testing machine. Storage modulus (a), loss modulus (b) and Tan δ (c) of PLA bio-composites by DMA.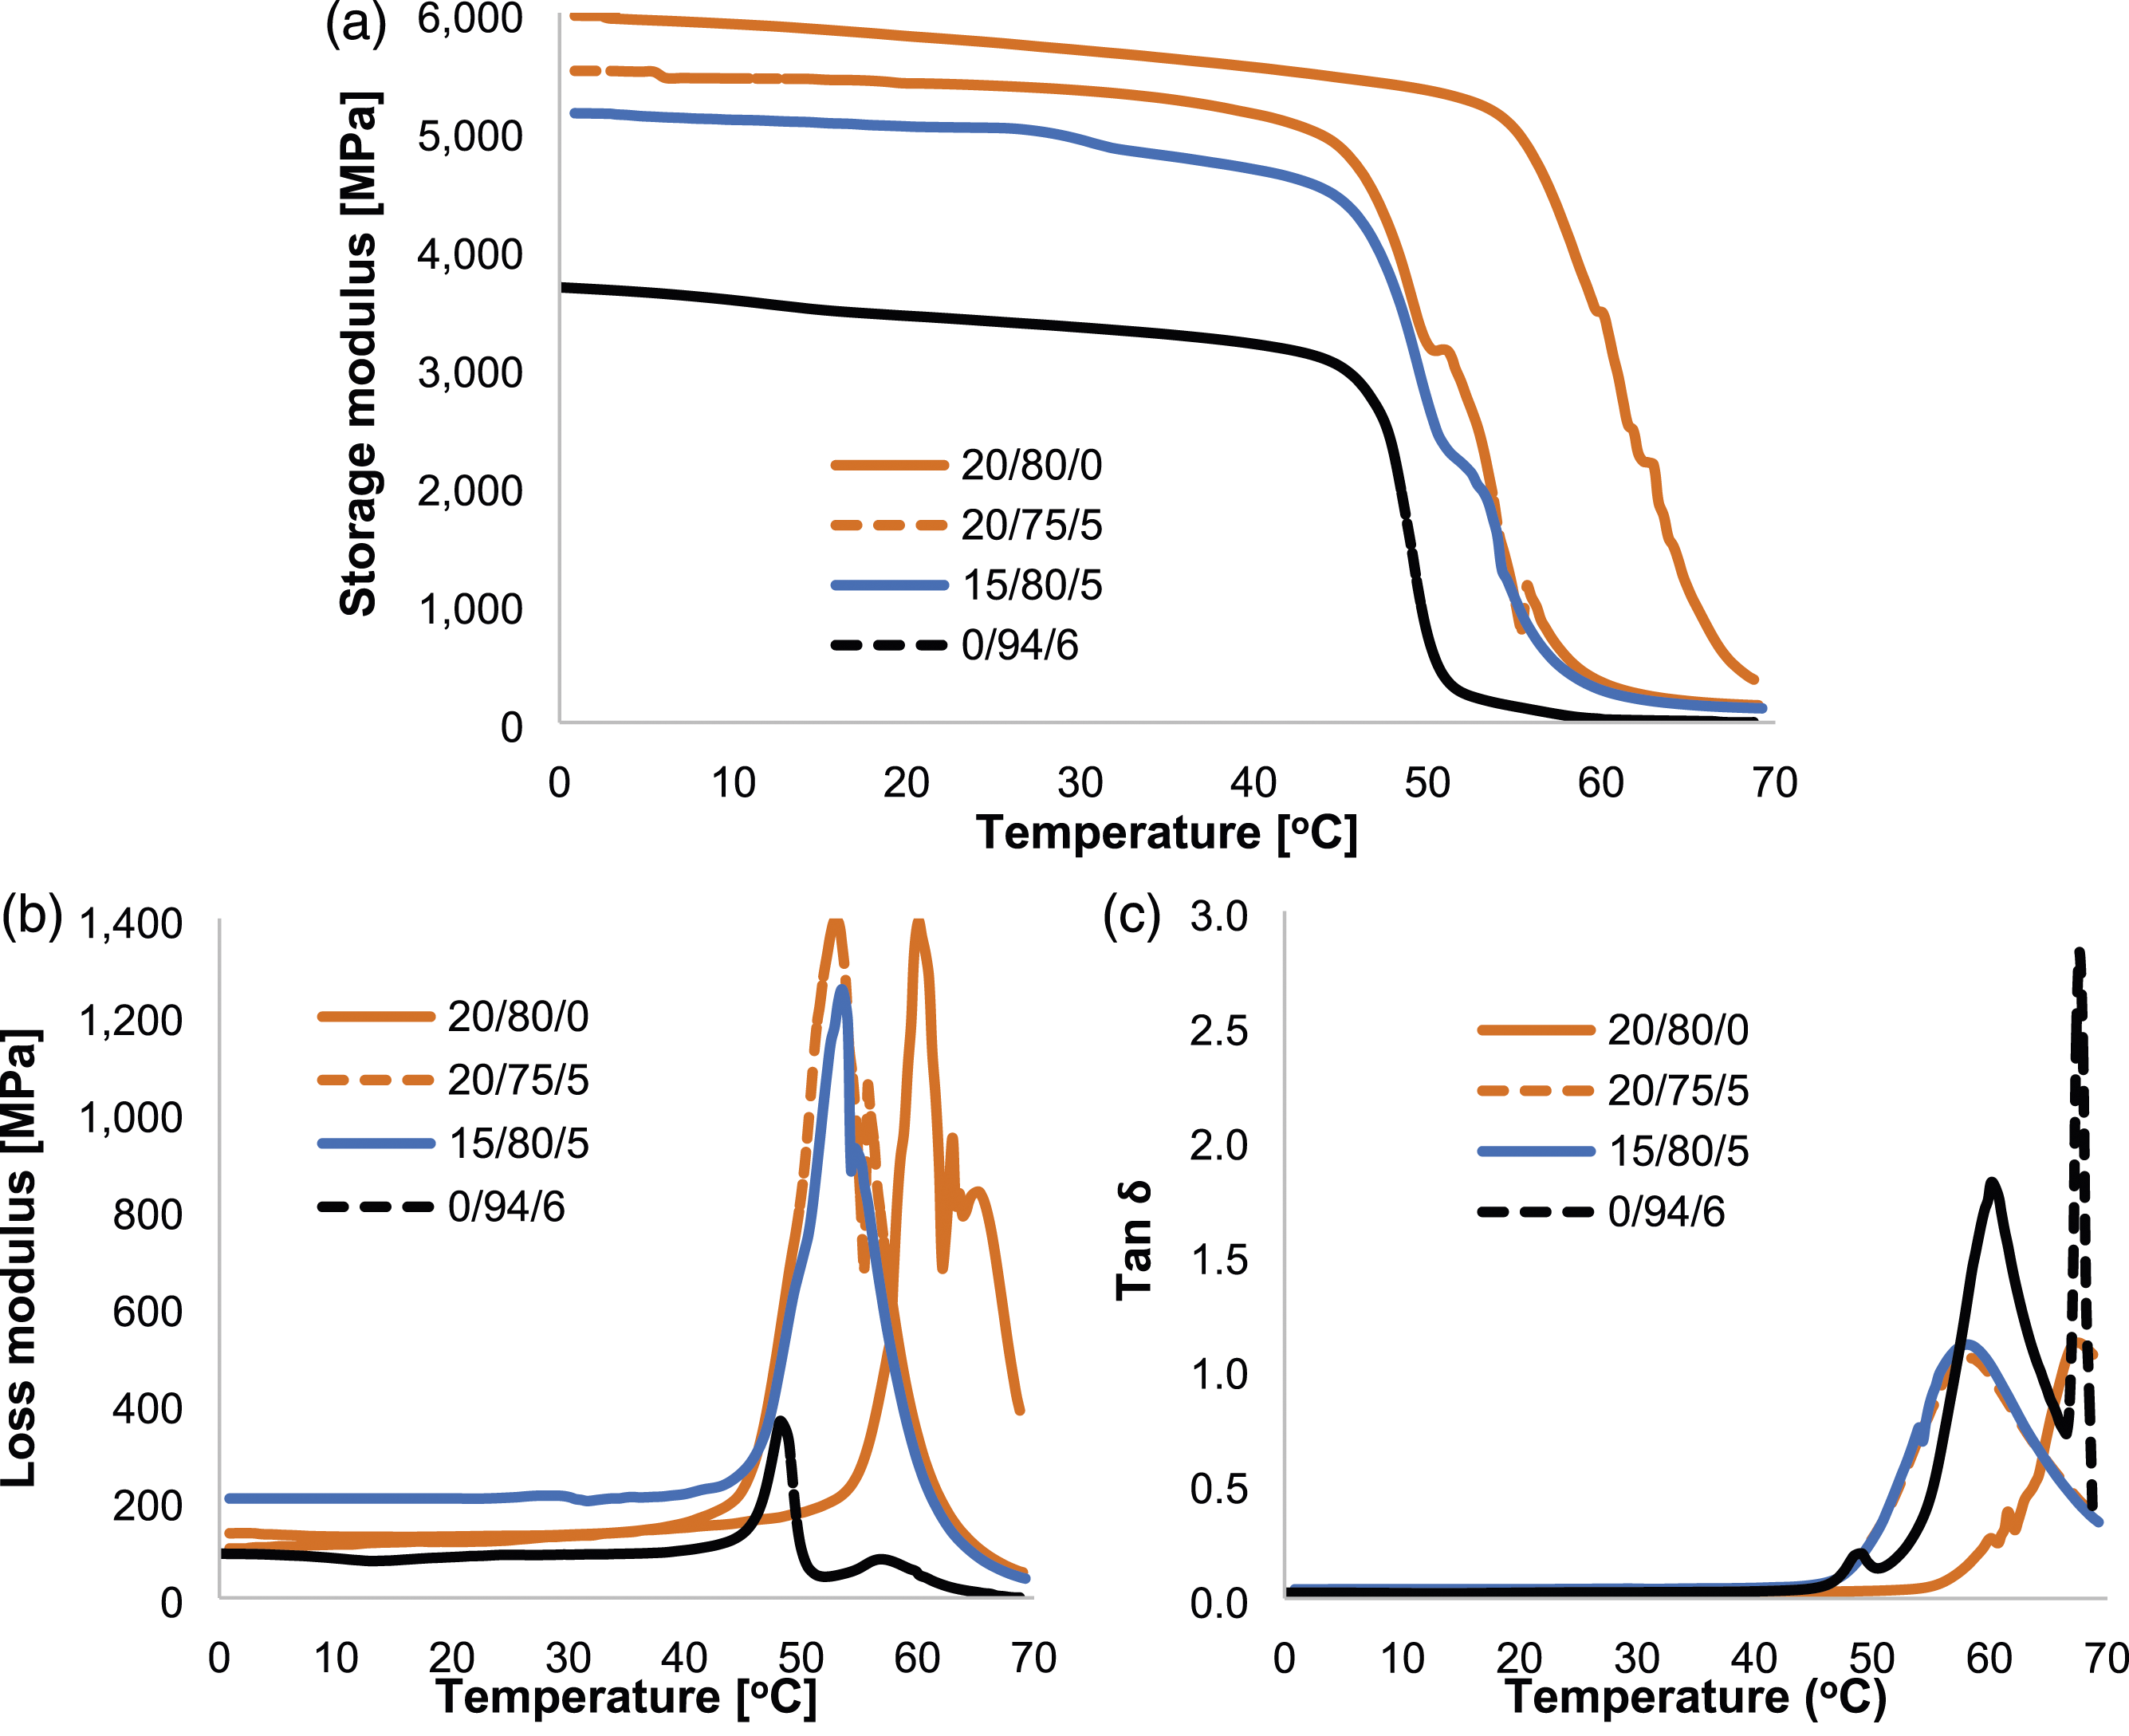
Figure 6(b) depicts the loss modulus of SF/PLA bio-composites as a function of temperature. It can be observed that the loss modulus peak of plasticized PLA without SFs significantly increased after the incorporation of fibers. Similar to the trend observed in the storage modulus curves, the loss modulus peaks of SF/PLA bio-composites containing 15 wt% and 20 wt% SFs were higher than those of plasticized PLA without fiber reinforcement. The increase in the loss modulus peak indicates increased restrictions on the mobility of polymer chains due to effective fiber-matrix interaction around Tg. 59 Furthermore, at temperatures above Tg, the loss modulus experienced a dramatic decline, which would be expected to happen. This decline in the loss modulus peak can be attributed to increased mobility of the polymer chains, which may result from fiber attrition and polymer chain scission during compounding and injection molding processes conducted above 190°C. In addition, the loss modulus peaks of SF/PLA bio-composites with SFs incorporation were observed to widen compared to PLA without fiber incorporation, thereby broadening the glass transition range.
Figure 6(c) illustrates Tan δ of SF/PLA bio-composites as a function of temperature. It is observed from the figure that Tan δ peak significantly decreased after the incorporation of SFs in SF/PLA bio-composites. Moreover, in the case of plasticized PLA, the Tan δ at 60°C decreased from 1.81 to 1.01 after incorporating 20 wt% SFs. The decrease in Tan δ peak following SFs incorporation can be attributed to the restricted mobility of the polymer chains. 58 Polymer composites with higher fiber content typically exhibit a higher degree of crystallinity (as confirmed by the DSC results), which gradually reduces the mobility of molecular segments and consequently lowers Tan δ.
Rheological Properties
The shear viscosity behavior of a polymer is crucial for standard polymer processing methods like injection molding or extrusion, particularly over a wide range of shear rates.
60
Figure 7 illustrates the relationship between shear viscosity and shear rate for a PLA-based bio-composite material containing 20 wt% of SFs and 5 wt% of ATBC plasticizer, using RheoArt® equipment. The measurements were conducted using a RheoArt® capillary rheometer with a diameter of 1 mm and a length of 20 mm, at a melt temperature of 190°C. The results exhibited that the shear viscosity decreased from 1421 Pa.s to 158 Pa.s as the shear rates increased from 62 s−1 to 1983 s−1. In addition, measurements were taken using a capillary rheometer with a diameter of 2 mm and a length of 40 mm, at the same melt temperature of 190°C. The results revealed that the shear viscosity decreased from 1275 Pa.s to 172 Pa.s as the shear rates increased from 54 s−1 to 1664 s−1. These results indicate that the variation in shear viscosity of the bio-composite material was insignificant when using different diameters and lengths of the capillaries. However, when the melt temperature was increased to 210°C, the shear viscosity measured with a capillary rheometer of 1 mm diameter and 20 mm length decreased from 1004 Pa.s to 122 Pa.s as the shear rates increased from 52 s−1 to 1606 s−1. This demonstrates that the shear viscosity of the bio-composite decreases at 210°C melt temperature compared to the shear viscosity at 190°C melt temperature, using the same capillary diameter and length. This behavior can be explained by the fact that shear viscosity decreases as the melt temperature increases, as described by the Arrhenius equation, which relates viscosity to temperature: Shear viscosity of the bio-composite 20/75//5 using RheoArt® rheometer.
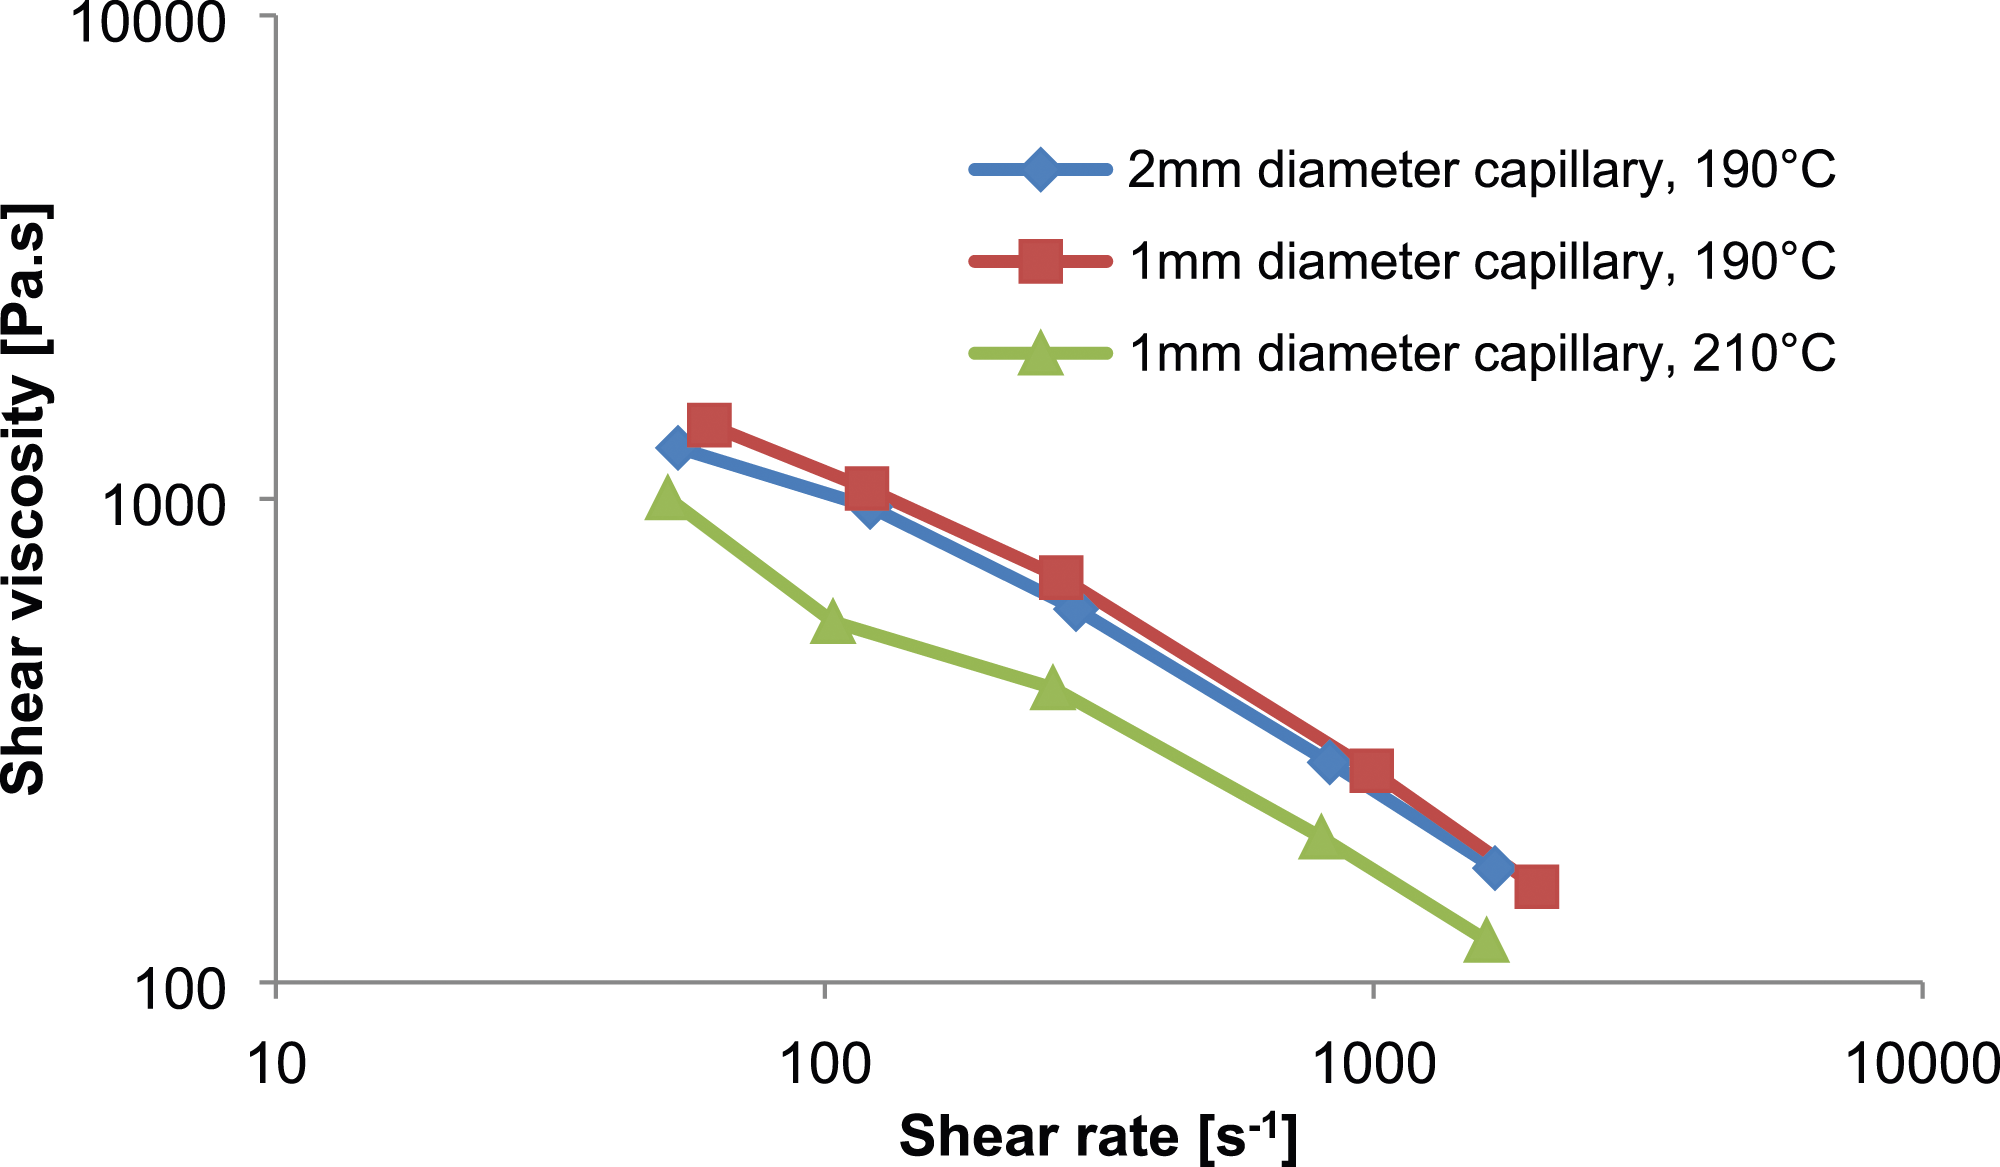
Figure 8 illustrates the relationship between shear viscosity and shear rate for neat PLA and SF/PLA bio-composites with the addition of ATBC plasticizer, at a melt temperature of 190°C using Ceast equipment. The results indicate that the addition of SFs to the PLA matrix increases the shear viscosity of PLA due to the presence of the filler. Figure 8 also demonstrates that the influence of fiber content on shear viscosity is significant at lower shear rates. At lower shear rate, the shear viscosity of SF/PLA bio-composite with 20 wt% of SFs was 1508 Pa.s, which increased by 18% and 7% compared to 1277 Pa.s of neat PLA and 1408 Pa.s of the bio-composite with 10 wt% of SFs, respectively. This increase in shear viscosity in SF/PLA bio-composites can be attributed to strong fiber-fiber interactions and interactions with PLA chains, resulting from the short length and good distribution of the fibers.
27
These interactions may restrict chain mobility, especially at higher fiber content, leading to increased shear viscosity in SF/PLA bio-composites. However, at higher shear rates, the variation in shear viscosity of the bio-composites was not significant. The shear viscosities of the bio-composites with 20 wt% and 10 wt% SFs were 43 Pa.s at a shear rate of 11714 s−1 and 44 Pa.s at a shear rate of 9842 s−1, respectively, while the shear viscosity of neat PLA was 50 Pa.s at a shear rate of 8971 s−1. Changes in shear viscosity with increasing temperature are primarily influenced by the energy transferred to the polymer through shear from the screw rotation. As shearing raises the polymer temperature through viscous dissipation or conversion of mechanical power to heat, the shear viscosity decreases due to the higher temperature. Furthermore, Figure 8 demonstrates a change in the rheological behavior of the bio-composites with the addition of ATBC plasticizer. The results indicate that plasticized PLA exhibits lower shear viscosity compared to neat PLA. The presence of ATBC plasticizer reduces the shear viscosity of PLA, although the variation in shear viscosity between neat PLA and its bio-composites is not significant at higher shear rates. The viscosities of neat PLA and plasticized PLA were 1277 Pa.s at a shear rate of 59 s−1 and 1019 Pa.s at a shear rate of 54 s−1, respectively. These rheological results indicate that the addition of the plasticizer can affect the melt processing of the bio-composites. Shear viscosity of SF/PLA/ATBC bio-composites using Ceast rheometer at 190°C.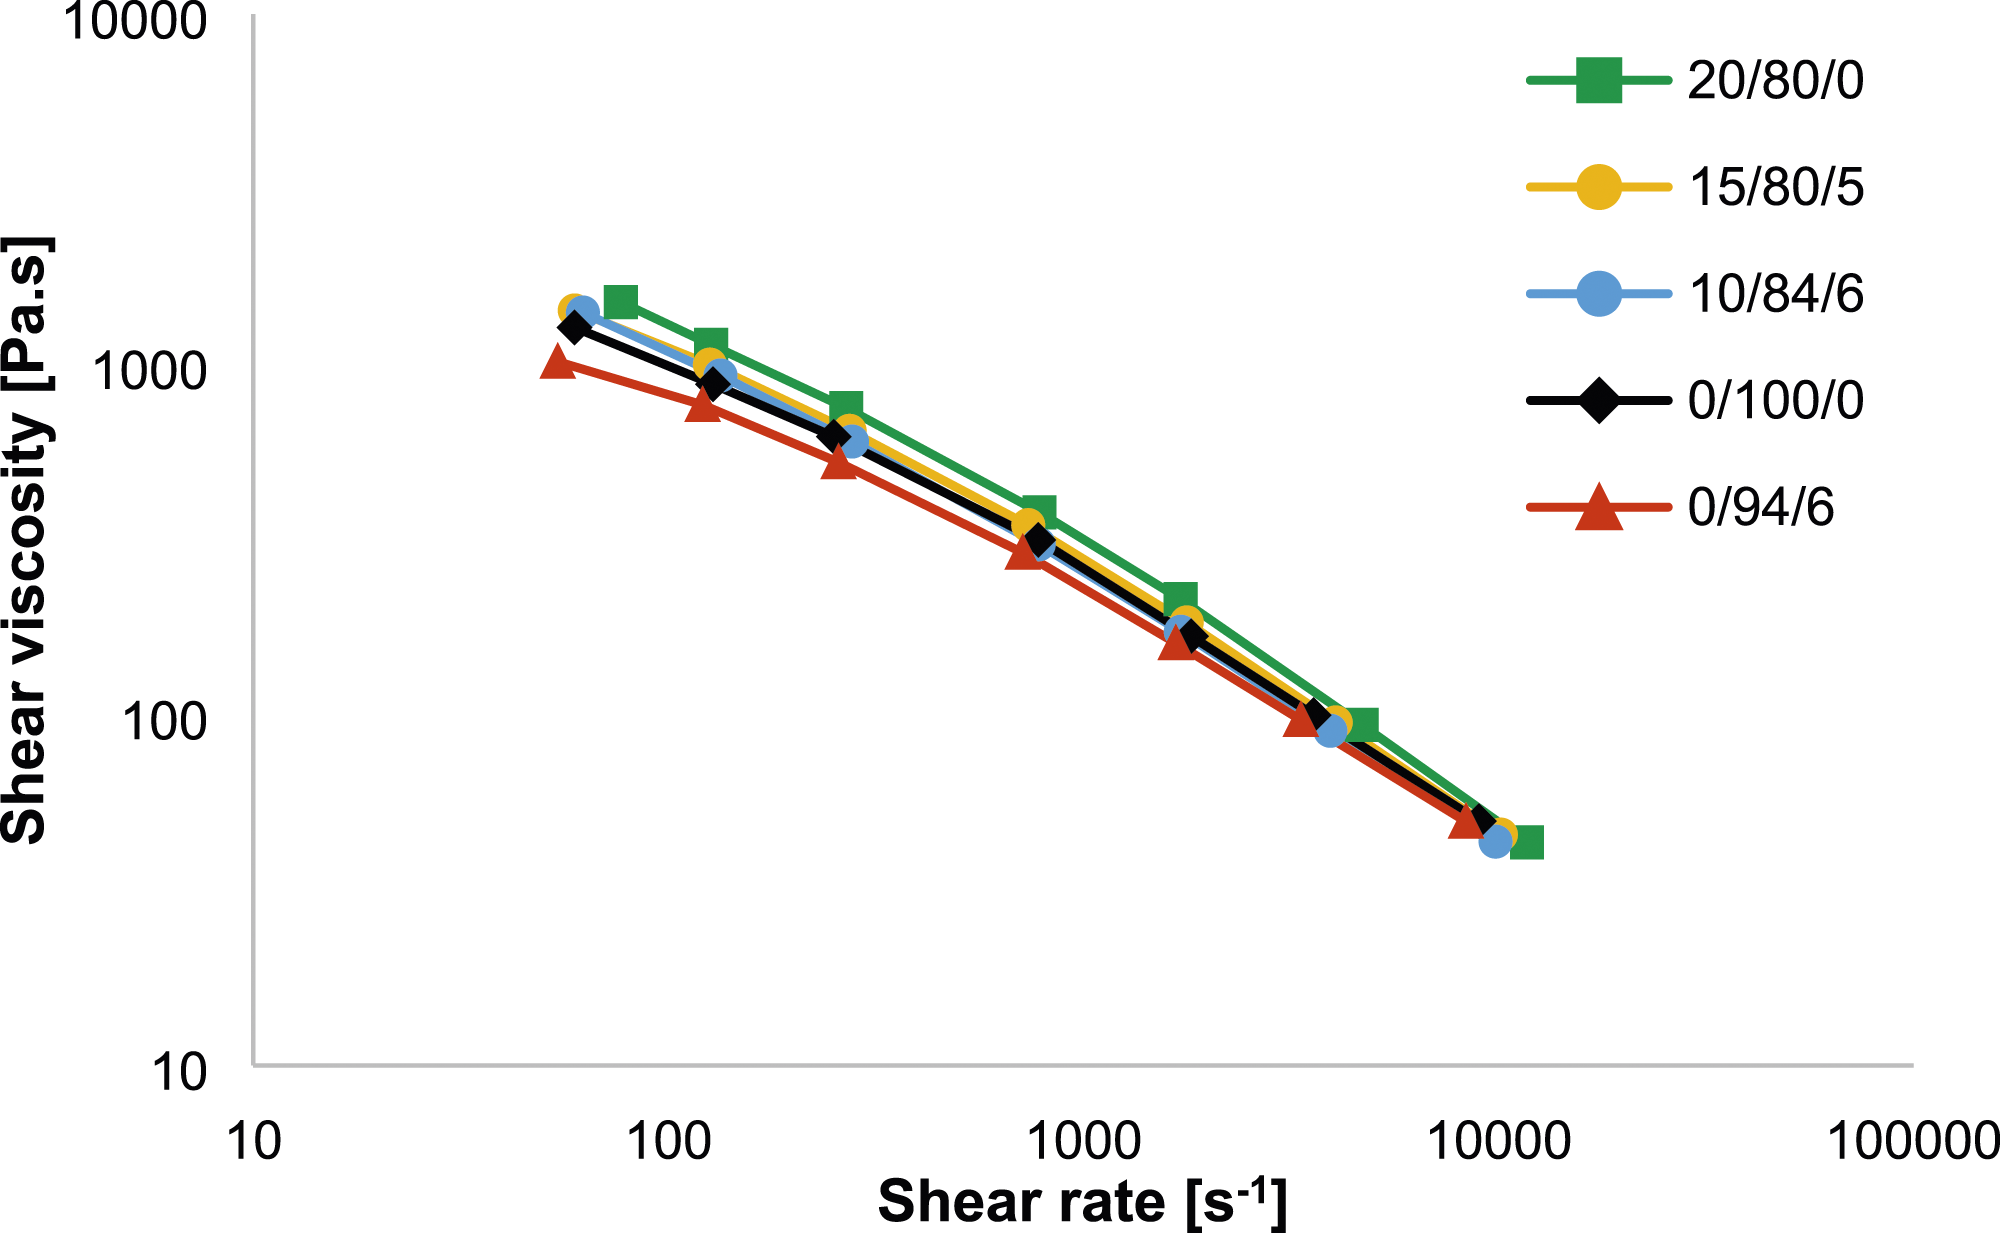
Microstructure of the bio-composites
Figure 9 depicted the microscopic images of the fibers following the compounding and molding procedures of melt PLA with sisal fibers using a co-rotating twin screw extruder and injection molding. Prior to compounding, all fibers were cut to an approximate length of 5 mm. Following the compounding and injection molding procedures, the fiber lengths varied due to fiber breakage. Figure 9(a) demonstrates the breakage of some fibers into pieces as a result of the compounding process. Figure 9(b) illustrates the varying fiber lengths resulting from fiber breakage during compounding. Furthermore, Figure 9(c) and 9(d) display the separation of individual fibers from bundled fibers, which promotes effective fiber dispersion throughout the polymer matrix. This separation of elementary fibers aids in achieving a uniform distribution of mechanical properties within the composites. Subsequently, in Figure 9(e), the well-dispersed elementary fibers can be observed within the PLA matrix, indicated by the red circles. Enhanced dispersion of the fibers within the matrix leads to an increased contact area between the fibers and the matrix, thereby improving the mechanical strength and modulus of the bio-composites. Moreover, Figure 9(f) highlights the poor fiber-matrix interfacial adhesion, which has the potential to negatively affect the mechanical properties of the bio-composites. LSM micrographs of SF/PLA composites: (a), (b) fiber breakage, (c), (d) separation of elementary fibers from bundle fibers, (e) fiber dispersion, and (f) fiber-matrix adhesion.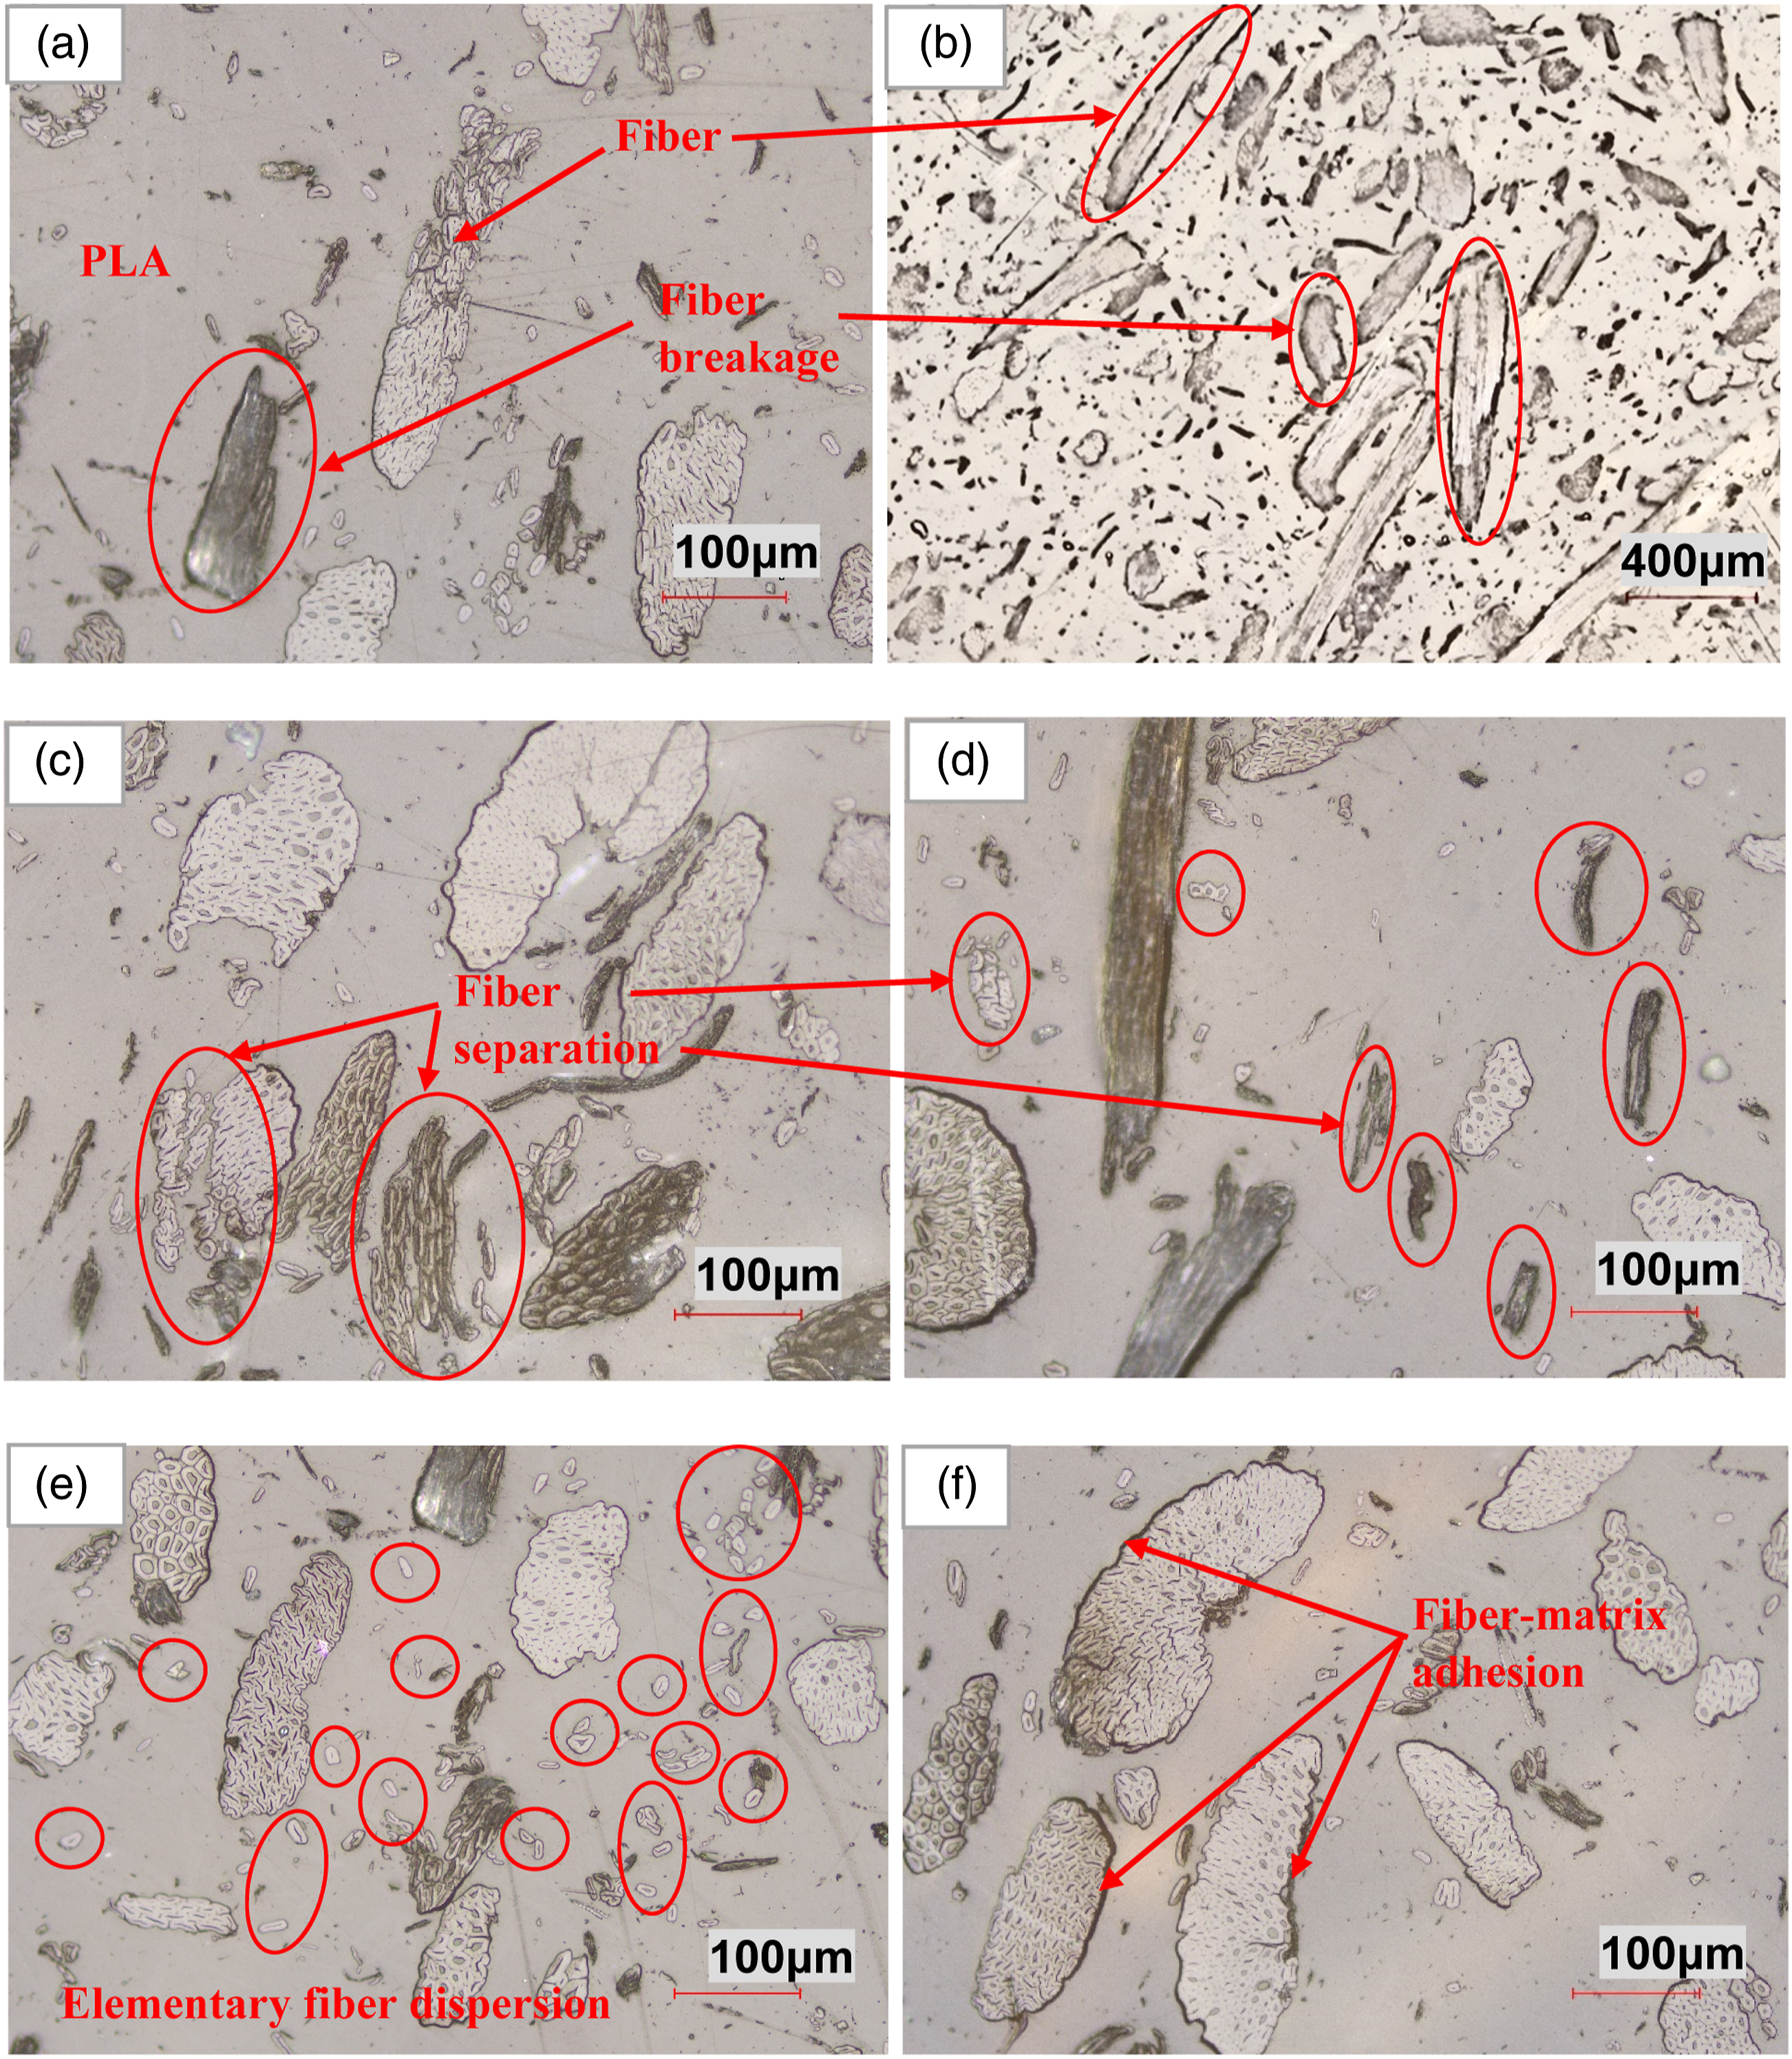
Conclusions
This study investigated the mechanical, thermal, and rheological properties of bio-composites made from polylactic acid (PLA) reinforced with short sisal fibers (SFs). The results revealed that the addition of SFs increased the tensile modulus but decreased the tensile strength. At 5 wt% of SFs, the flexural strength decreased, but it increased at 10 wt% and higher. In addition, the flexural modulus increased with the addition of SFs. The incorporation of tributyl 2-acetylcitrate (ATBC) plasticizer resulted in decreased tensile and flexural strengths and moduli. Furthermore, the addition of ATBC plasticizer led to a decrease in the tensile and flexural strains at failure. Conversely, the impact strength increased with the incorporation of SFs, while it also increased with the addition of ATBC plasticizer.
Thermal conductivity tests indicated an increase in thermal conductivity with the inclusion of SFs. A slight increase in thermal conductivity was also observed with the addition of ATBC plasticizer. However, thermal conductivity decreased as the temperature increased. Differential scanning calorimetry tests revealed that the bio-composites exhibited higher crystallinity compared to neat PLA. The bio-composites exhibited higher cold crystallization enthalpy and melting enthalpy, indicating a higher tendency to be crystalline compared to neat PLA. Plasticized PLA exhibited higher crystallinity than neat PLA, suggesting that ATBC plasticizer acted as a nucleating agent in PLA rather than a plasticizer. The addition of ATBC plasticizer reduced the crystallization temperature and glass transition temperature of PLA and increased its crystallinity. The specific heat capacity increased with the addition of ATBC plasticizer but decreased with increasing fiber content in the bio-composites. Furthermore, the storage moduli obtained from dynamic mechanical analysis were equivalent with the flexural moduli determined by Instron 3367 testing machine at the same temperature for the same bio-composites. The storage modulus was greatly influenced by the fiber content and temperature, which exhibits a significant drop around the glass transition temperature. Rheological test results also indicated that shear viscosity decreased with increasing temperature but increased with increasing fiber content.
Furthermore, the compounding and molding processes influenced the fiber breakage, fiber lengths, fiber separation, fiber dispersion, and fiber-matrix interfacial adhesion within the short sisal fiber-reinforced PLA bio-composites. These factors are crucial in determining the overall mechanical properties of the bio-composites.
Supplemental Material
Supplemental Material - A study of the mechanical, thermal and rheological properties of sisal fiber-reinforced polylactic acid bio-composites with tributyl 2-acetylcitrate as a plasticizer
Supplemental Material for A study of the mechanical, thermal and rheological properties of sisal fiber-reinforced polylactic acid bio-composites with tributyl 2-acetylcitrate as a plasticizer by Eshetie Kassegn, Belete Sirhabizu, Temesgen Berhanu, Bart Buffel, and Frederik Desplentere in Journal of Thermoplastic Composite Materials
Footnotes
Acknowledgements
The authors would like to acknowledge the support of IUPEPPE project for financing the research. Secondly, the authors would like to appreciate the members of the research group Propolis at KU Leuven Bruges campus for their support while specimen preparation and performing experimental tests. Lastly, the authors want to thank all the KU Leuven community for their contribution in one or another way while doing the research work.
Author’s contribution
Eshetie Kassegn, Frederik Desplentere and Bart Buffel designed the research and manuscript. Eshetie Kassegn collected the data from the experimental tests. Eshetie Kassegn, Frederik Desplentere and Bart Buffel analyzed the data and verified the results. Eshetie Kassegn wrote the final draft of the manuscript as a corresponding author. Frederik Desplentere, Bart Buffel, Belete Sirhabizu and Temesgen Berhanu reviewed the draft manuscript and approved the final version of the manuscript.
Declaration of conflicting interests
The author(s) declared no potential conflicts of interest with respect to the research, authorship, and/or publication of this article.
Funding
The author(s) disclosed receipt of the following financial support for the research, authorship, and/or publication of this article: This work was financed by the IUPEPPE project under the framework of collaboration of the Ministry of Education (Ethiopia) and KU Leuven (Belgium).
Data Availability Statement
The data used to support the findings of this study are available from the corresponding author upon reasonable request.
Supplemental Material
Supplemental material for this article is available online.
References
Supplementary Material
Please find the following supplemental material available below.
For Open Access articles published under a Creative Commons License, all supplemental material carries the same license as the article it is associated with.
For non-Open Access articles published, all supplemental material carries a non-exclusive license, and permission requests for re-use of supplemental material or any part of supplemental material shall be sent directly to the copyright owner as specified in the copyright notice associated with the article.