
Abstract
The current research work involves the fabrication and tribological properties analysis of constant basalt filler reinforced (30 wt %) bio-based polypropylene (PP) and high density polyethylene (HDPE) thermoplastic composites. Compression molding technique is used after an internal mixing process in order to produce composite samples. The physical and hardness properties have been evaluated for both neat polymers and composite samples. In order to study the coefficient of friction (COF) and specific wear rate (SWR) of PP and HDPE composite samples, the Taguchi and Analysis of Variance (ANOVA) methodologies were applied. For PP samples, the optimum parameters in response to COF are found to be 0 wt% basalt (rank 3), 9 N load (rank 1), 200 r/min speed (rank 4), and 100 m distance (rank 2); for the SWR output, the optimum parameters are 30 wt% basalt (rank 1), 6 N load (rank 4), 100 r/min speed (rank 2), and 200 m distance (rank 3). For HDPE samples, the optimum parameters in response to COF are 0 wt% basalt (rank 1), 6 N load (rank 3), 100 r/min speed (rank 4), and 100 m distance (rank 2); for the SWR output, the optimum parameters are 30 wt% basalt (rank 1), 6 N load (rank 3), 100 r/min speed (rank 4), and 150 m distance (rank 2). Consistently, it has been shown that incorporating basalt fillers to PP and HDPE composites has more dramatically decreased SWR than COF. The depth of wear constantly rises according to increasing load, irrespective of the processing variables, as shown in 2D depth profiles. It is discovered that the confirmation tests carried out for the optimum parameters are within statistically acceptable bounds. The depth profile plots revealed that the worn track edges are found with polymer bumps because of deep grooves and softened polymer debris, which commonly observed more with HDPE samples due to low softening temperature. Moreover, the worn surfaces of the composites have plowed lines and cracks that are brought about by the micro-cutting and micro-plowing activity of the erosive asperities counterface. In addition to surface characteristics, the transfer films created during sliding also significantly influenced the mode of sample wear.
Introduction
The remarkable friction and wear response of polymer-based materials, including their self-lubricating capacity, viscoelasticity, temperature, and corrosion resistance qualities, etc., make them crucial for a variety of applications in industry. In this context, many researchers are reported the works related to the enhancement of tribological properties by reinforcing the filler materials or short fibers with the polymer matrices.1,2 The first crucial requirement for lowering plastic waste volume is to reuse those waste kinds for which it is feasible, according to the concept of a sustainable future and a secure waste management plan. In the identical time, the current global economic model of the sustainable development concept, which aims to cut down on waste production overall and extend the useful lives of natural assets and commodities, is closely tied to cyclical development.3,4 In this circumstances, it is feasible to use naturally available and sustainable mineral resources for products development. Moreover, it is quiet advantageous in the reduction of polymer ratio within the product by replacing with the mineral materials. Among many mineral materials, the basalt emerged with an attractive material as a reinforcement with polymer matrices. Basalt rock, an exuberant volcanic rock that is overground and filled with 45%–52% silicon dioxide, serves as the foundation for basalt fiber. Because of the conditions that led to its genesis, basalt has many remarkable qualities. The fibers formed of it have a great capacity for wear, heat, and acoustic resistance and are effective vibration isolators in addition to having an elevated elasticity and exceptional heat resistance.5–7
Thermoplastics and thermosets are the two common matrices used with polymer composites. The most popular material nowadays is thermoplastic composite, which has an array of advantages over thermoset composites. In terms of the mechanisms creating friction and wear, polymer tribology is less understood and more complex than that of metal. The tribological characteristics of thermoplastic composites are influenced by operational parameters, such as the force, speed, distance, heat, and time, to produce adequate resistance to wear and the possible friction coefficient.8–10 Surfaces that come in mechanical touch with one another and glide against one another experience a variety of intricate microscopic interactions that cause wear and friction. The substances, geometrical, and topology features of the surfaces as well as the general circumstances in which they are forced to slide across one another affect these interactions in various ways. Examples of these circumstances include loading, temperature, the environment, kind of contact, and the conditions of loading.11–14 In this context, many research works were reported with the study of tribological properties of polymer composites reinforced with various fillers. Pan and team 15 worked on the study of tribology on the rare earth oxide (La2O3) reinforced polyimide composites. According to friction properties, adding 1.5 wt% La2O3 microparticles to PI at elevated preloads of 3–5 N resulted in a 70% decrease in frictional forces and COF. Studies on the impact of sliding velocity revealed that as velocity increased, friction forces drastically decreased. Both of neat PI and La-PI-Cs film experienced linear increases in friction forces when preload was raised from 0.2 N to 5.0 N. In contrast to thermosets, Nayak and Satapathy 16 reported the decrement in wear rate of polyester polymer reinforced with waste marble dust filler. The most important variables discovered to have a substantial impact on the wear rate of these composites are the filler ratio and the velocity, according to the order. An innovative review work on the tribological study and the effect of solid lubricants is reported by Padhan and group 17 reveal the significant potential of nanoparticles in the reduction of wear rate within the polymer matrices. These area of expertise polymers appear to possess a tremendous opportunity to be used in a variety of tribo-applications, including dry bearings, gears, slides, etc., which call for exceptionally low friction and wear under difficult sliding circumstances. Prakash and team 18 also reported the positive response on the wear resistance of epoxy composites reinforced with activated carbon fillers. It has been shown that adding 1% of permeable nano activated carbon to epoxy composites as reinforcement increased the materials’ durability against wear by 106%. Regarding composites with 2% filler, which have nearly three times greater resilience than epoxy polymer, the lowest wear rate was observed. On the P800 abrasion surface, sliding wear study at different forces on various abrasion surfaces shows that 2% wt filler loaded composites had greater abrasive wear resistance with the least amount of the substance loss. Myalski and group 19 presented the influence of carbon fillers on the tribological response of thermoplastic PA6 polymer. According to the acquired results, adding fillers to the PA6 matrix leads to advantageous wear behavior, such as the development of roller-like debris that reduces wear and increases friction. In comparison with the remaining samples, those with filler had a nearly two-fold reduced coefficient of friction. Abdellah and team 20 worked on strengthening of ABS polymer with the reinforcement of short basalt fiber (SBF) and studied the wear properties. SBF is an inorganic substance that has been discovered to have poor interaction with the ABS when utilized as a reinforcing material in an ABS matrix. The surface toughness and wear strength of the ABS matrix were improved by increasing the weight percentage of the SBF component. Another comparison of the wear behavior of basalt fiber/epoxy (BE) and basalt fiber/polyester (BP) composites demonstrates that BE composites exhibit higher wear resistance than BP composites due to BE composites’ minimal shrinkage on cure and strong bonding capabilities. The three main wear processes in BP composites are fiber matrix breakdown, fiber deletion, and fiber shattering. 21 Pelto and team 22 work demonstrated the 80% reduction of specific wear rate with the addition of graphene based nanofillers to the HDPE matrix. The uniform mixing and proper adhesion of fillers with the HDPE prevent the polymer detachment during sliding action. In a regular action, the pristine HDPE shows stable COF values during the testing process, however the changes are observed at the end of the testing due to polymer degradation and mechanical fracture at the transfer layers. Suresha and team 23 developed a bearing material and studied the tribological properties by reinforcing the nanoclay and graphite filler materials with PP/PA66 polymer blend. The minimum wear rate and mechanical stability was achieved with nanoclay fillers at the contact interface. Moreover, the nanoclay addition was the main root cause for the both plastic and elastic deformations at the surface.
In most of the literature works, the authors reported the positive influence of filler material on the wear performance of thermoplastic polymer matrices. However, the works related to the polypropylene and high density polyethylene are found to be less on bio-based concept. Moreover, the utilization of mineral basalt micro-filler is not yet explored completely to fulfill the sustainability concept. In this context, an attempt was made in this research work to study the effect of basalt micro-fillers on the wear and frictional performance of both bio-based polypropylene and high density polyethylene concept. In addition, the Taguchi optimization method and the ANOVA method are used in this work to examine the ideal parameters and determine the importance of each parameter, respectively. Additionally, the depth pattern of the worn surface is going to be studied using a 2D depth profile graph acquired from a profilometer, and the wear surface characteristics of all polymer samples with different conditions will be examined using scanning electron microscopy (SEM) photographs.
Materials and fabrication process
Materials
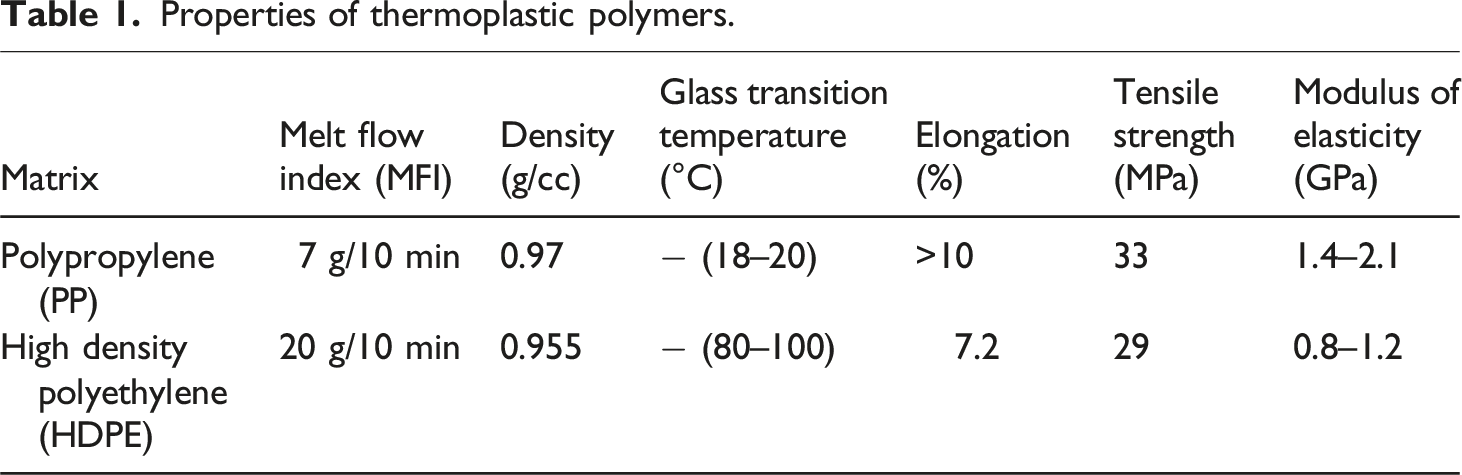
Properties of thermoplastic polymers.
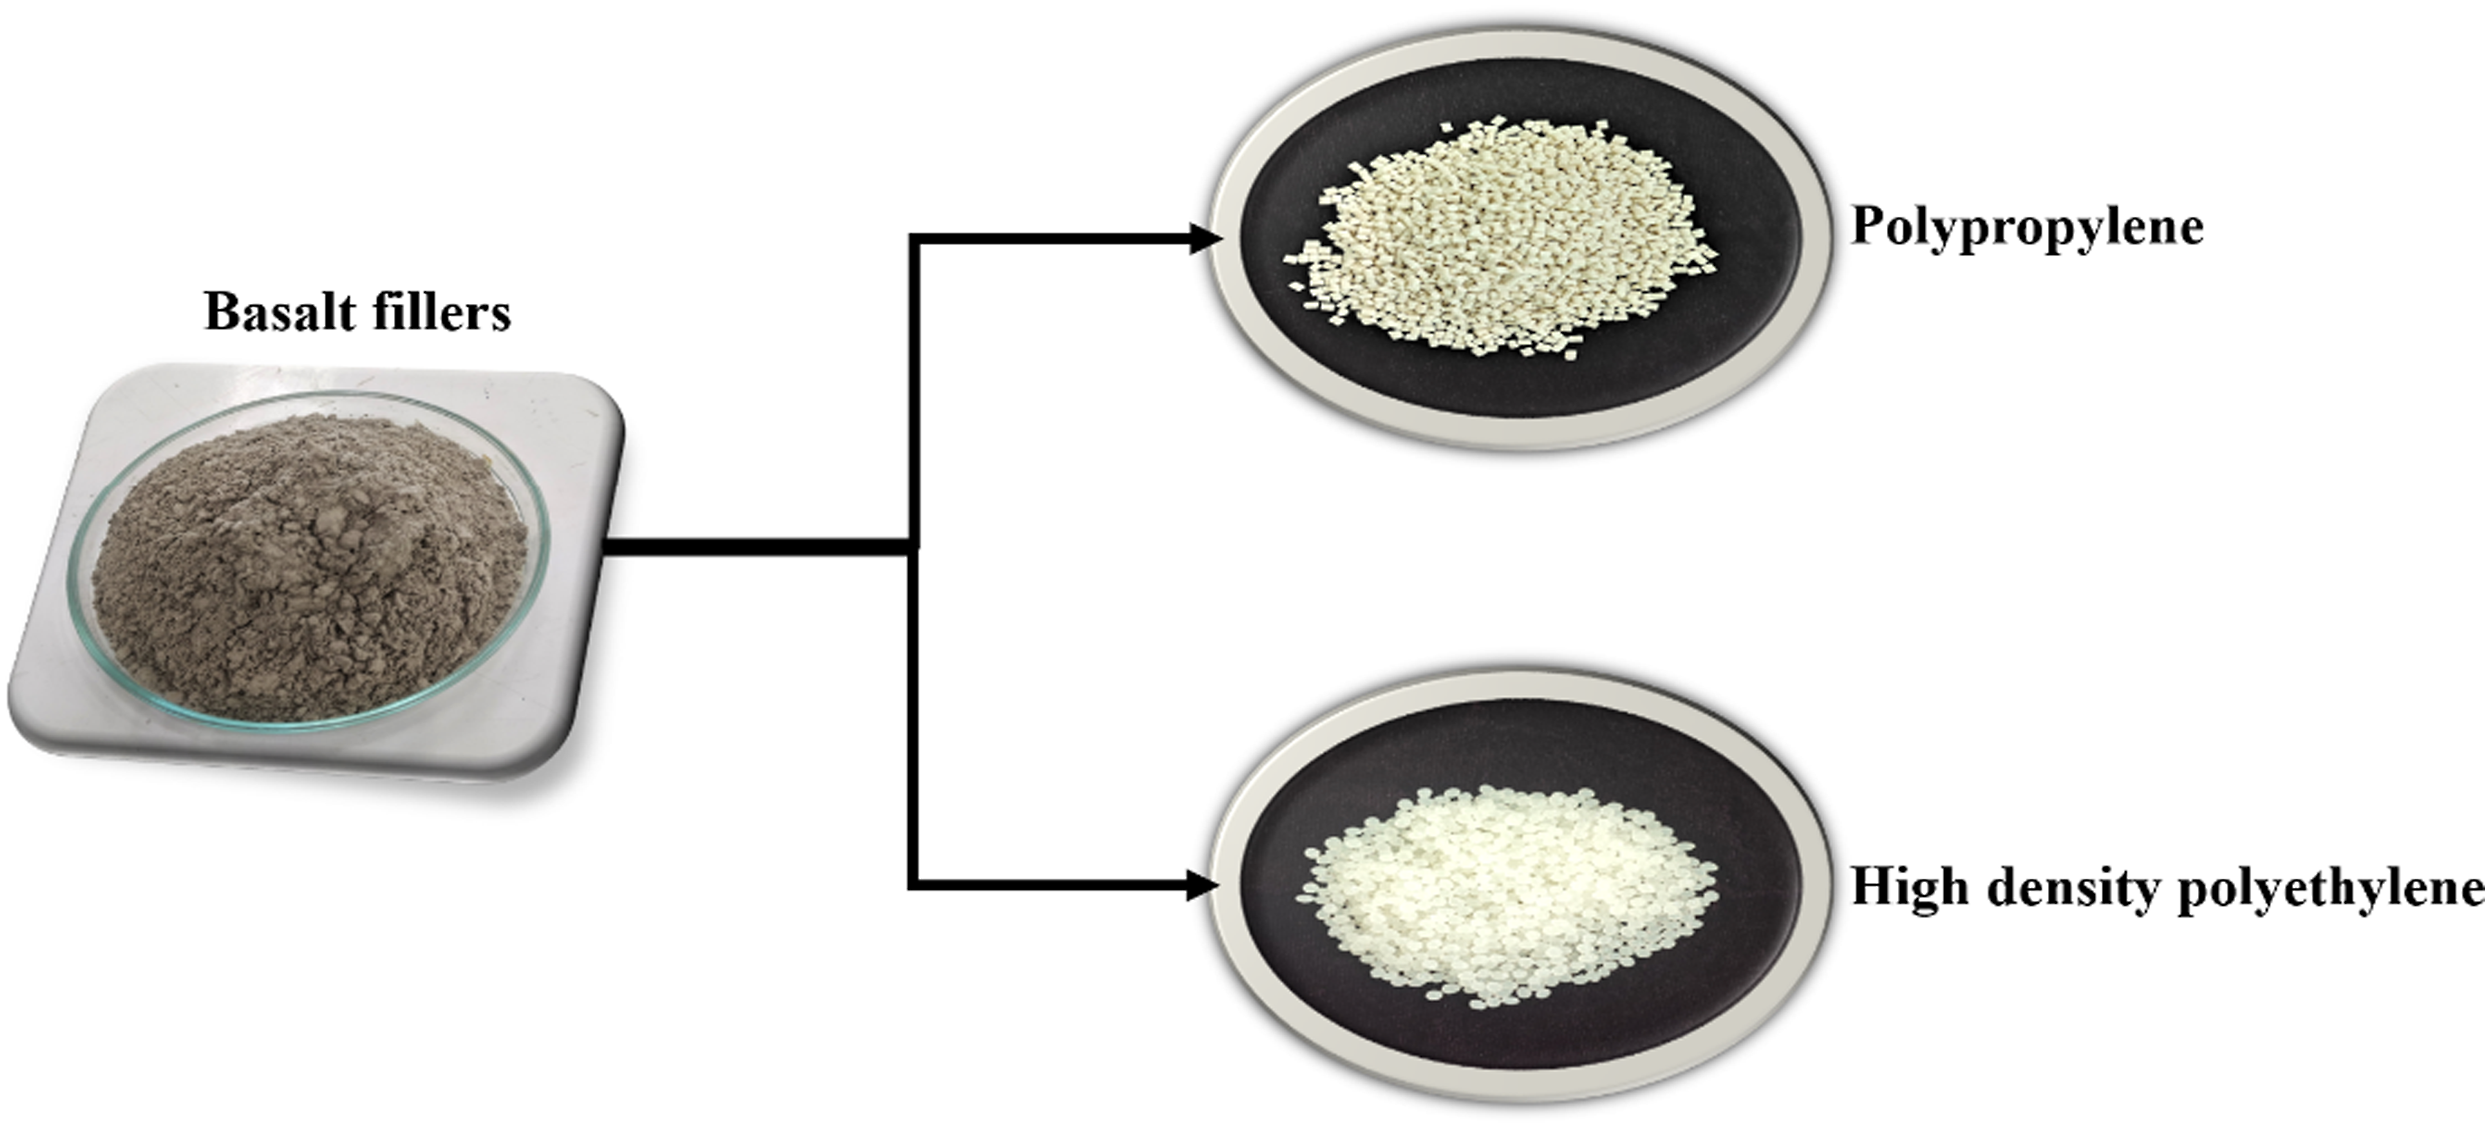
Presentation of reinforcement and matrix materials.
Fabrication process
The fabrication process flowchart for PP and HDPE composites fabrication is illustrated in Figure 2. The process has mainly five steps beginning from sieving to compression molding process. In the step 1, the fillers are sieved since it contains the basalt microfibers of maximum particle size. The lowest available mesh size of the siever is < 63 μm, and the sieving process is done for 15 min. The purchased PP and HDPE pellet polymers are dried at 50°C for overnight in the hot air oven to ensure the moisture free materials in the step 2.
24
Once the materials are ready for processig, they were subjected to internal mixing process (step 3) with their threshold temperature conditions. The PP and HDPE-based composites were internally mixed at 170°C and 150°C respectively at a speed of 50 r/min and a duration of 8 min. Before that the 200*200*3 mm mold is prepard with the application of PVC and silicone spray to ensure smooth and uniform laminate surface.
7
Once the composite granules were obtained from the internal mixing process, it was subjected compression molding process in the final step. The PP-based composites were pre-heated at 170°C (5 min), compressed at 170°C with 2500 lbf/in2 pressure (8–10 min), and cooled to room temperature. Whereas the HDPE-based composites were pre-heated at 150°C (5 min), compressed at 150°C with 2500 lbf/in2 pressure (8–10 min), and cooled to room temperature.
25
Further, the compressed laminates are subjected to hacksaw process for cutting the samples as per the ASTM dimensions. Fabrication process flow chart.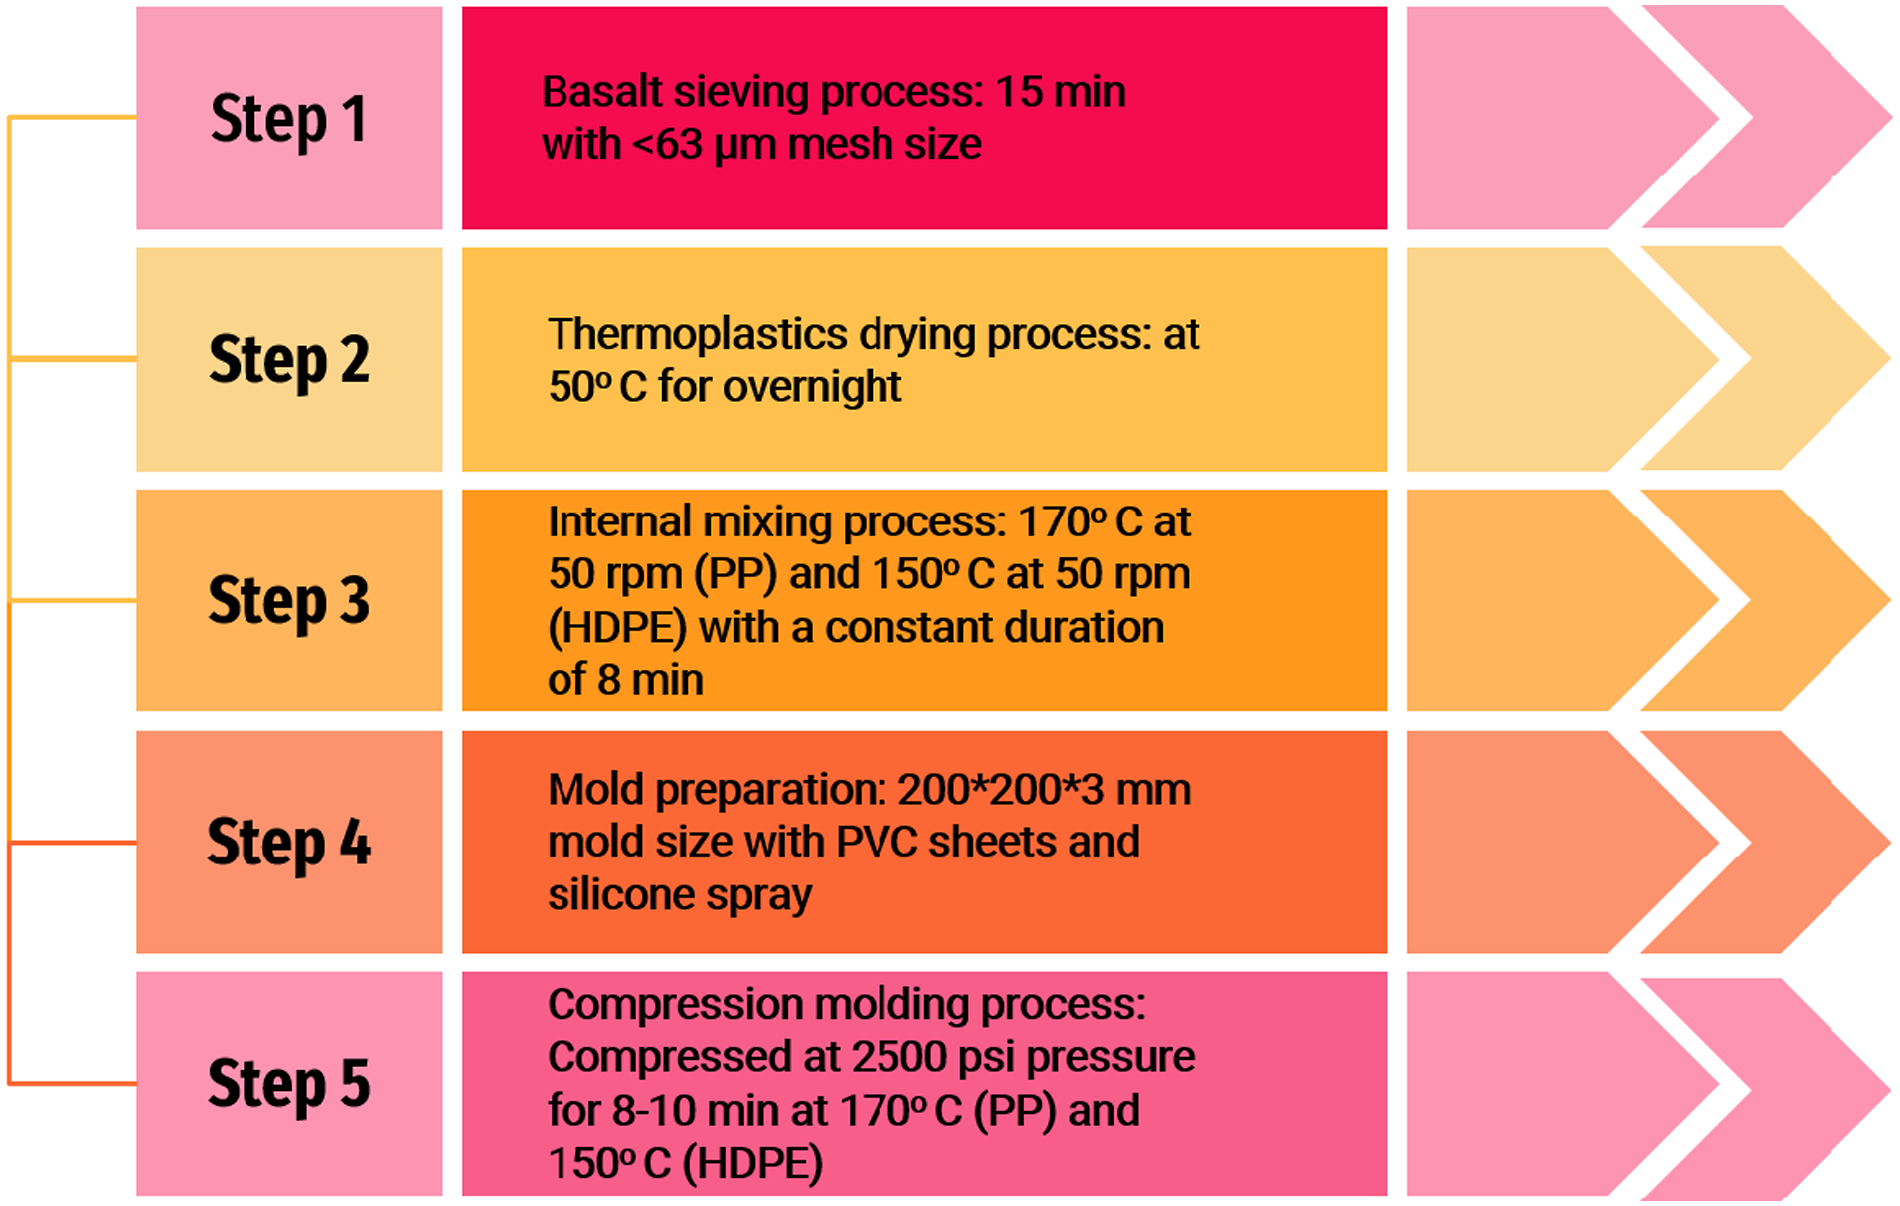
Experimental design
Density and void fraction analysis
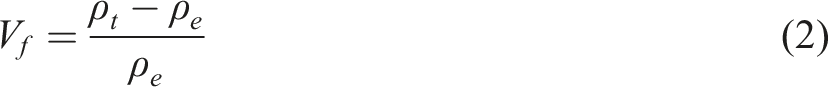
It is quite obvious to calculate the void % of fabricated neat and composite samples due to defects raised during the fabrication process. Since the composite has two phases, the theoretical density of the composite is calculated with the consideration of both basalt and polymer densities. It is anticipated that the composite density may increase due to the reinforcement of high density basalt filler with low-density polymers. The theoretical density (ρt) and void % (Vf) in the samples are calculated using the equation (1)
26
and (2)
27
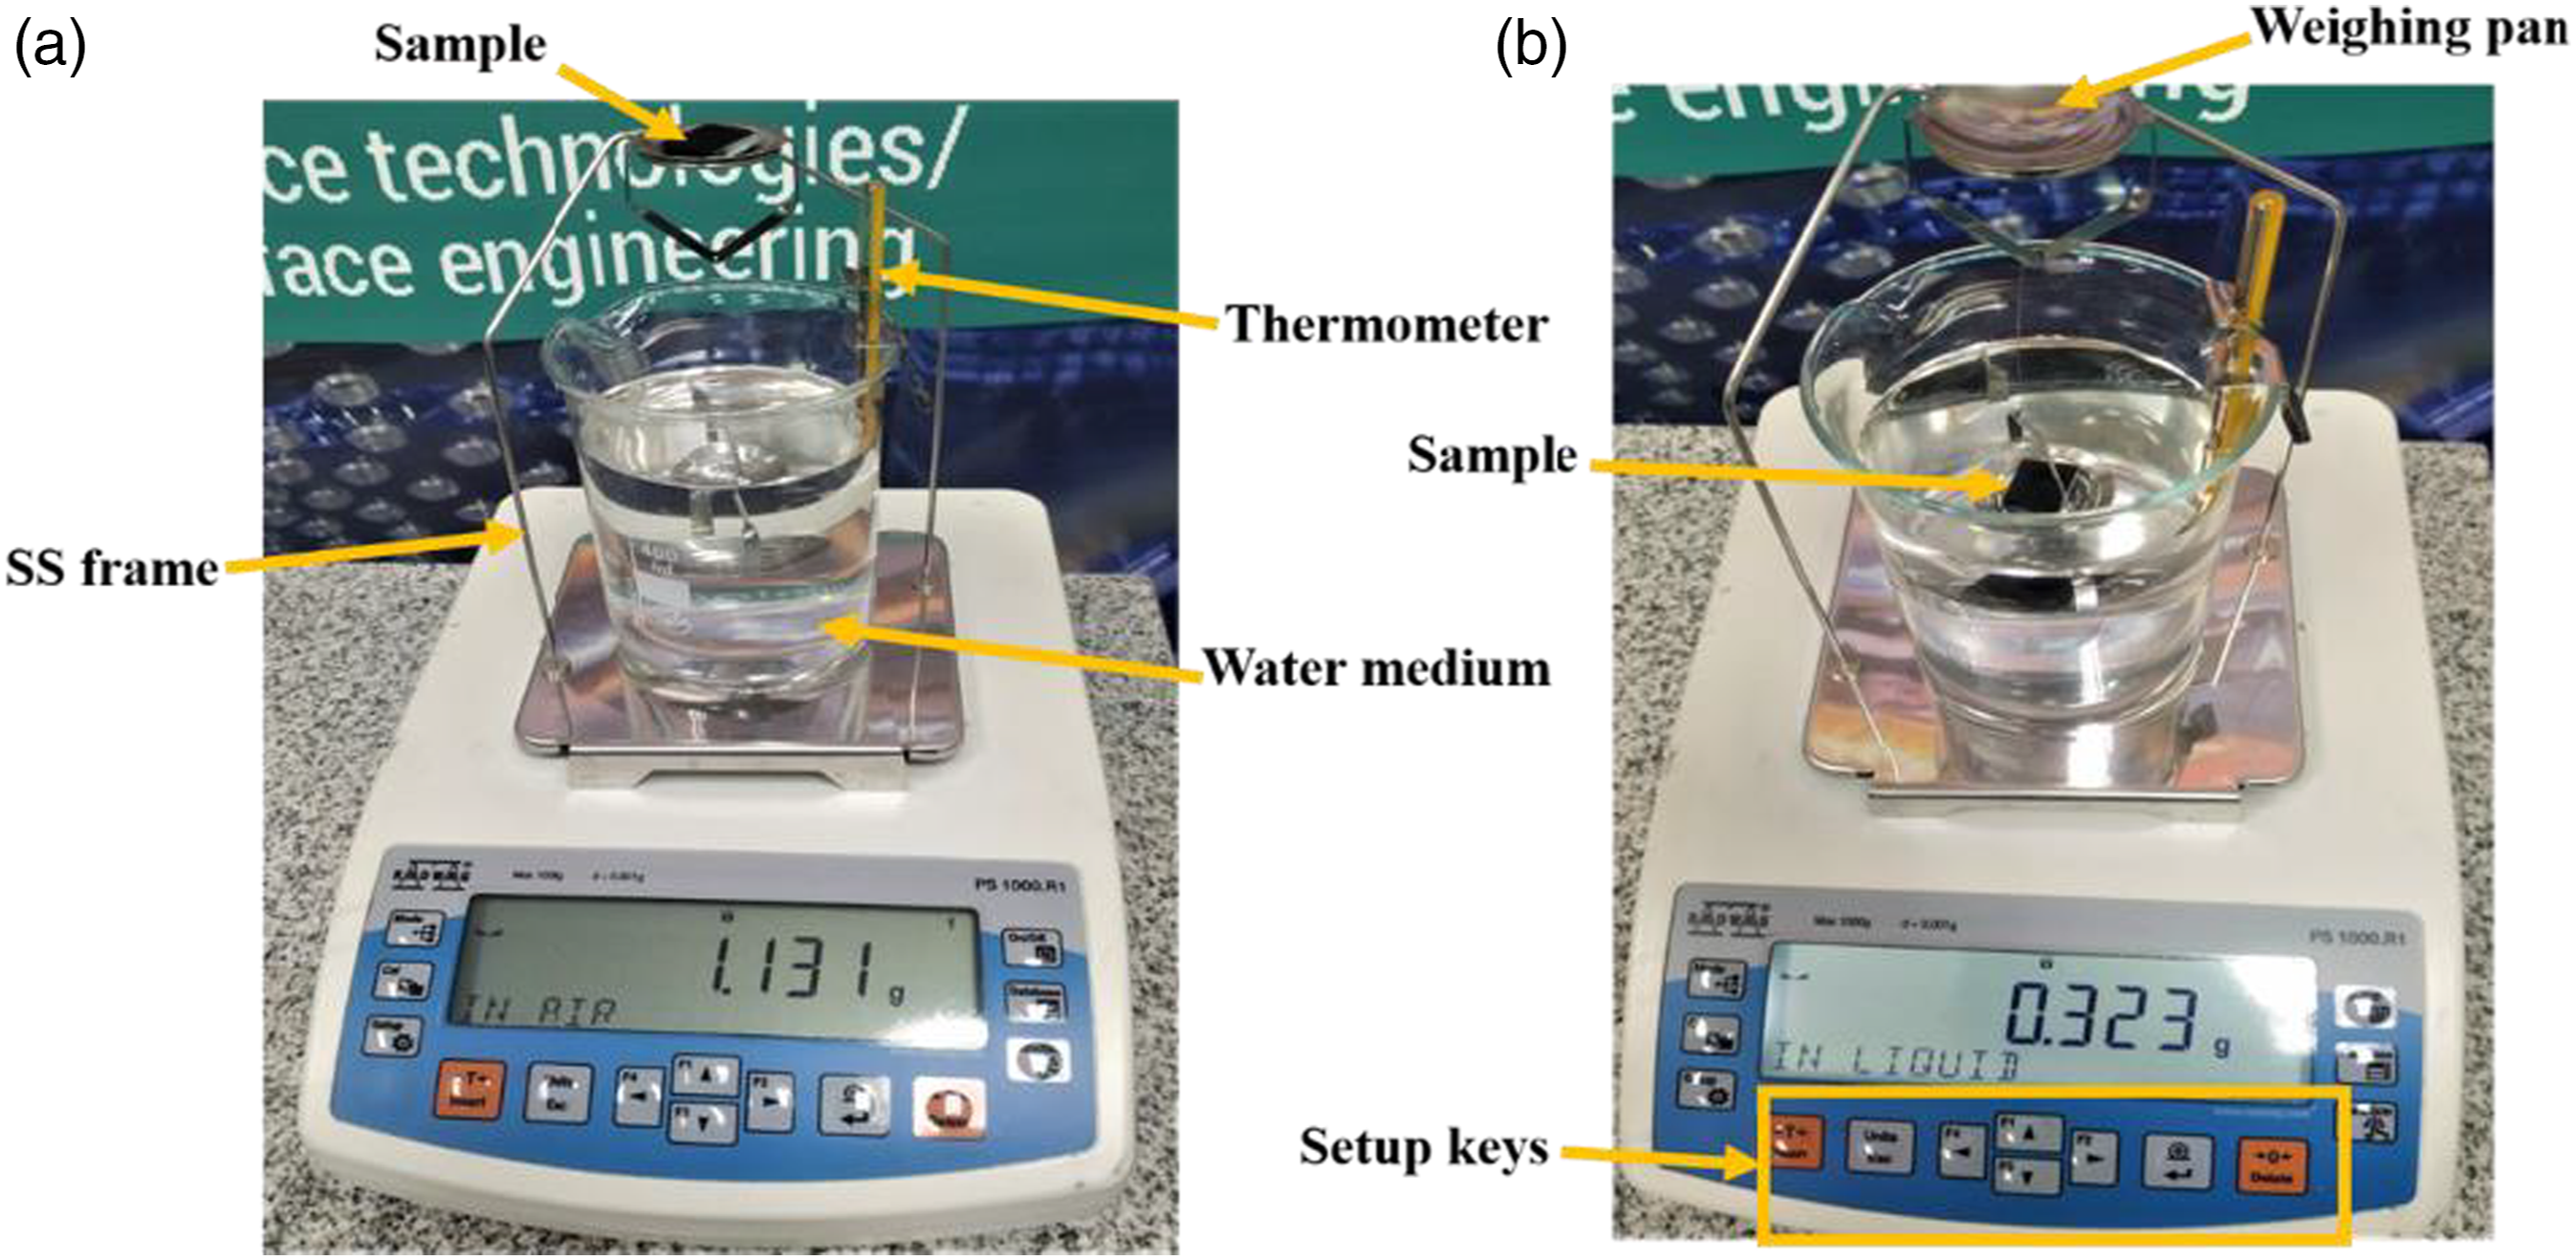
respectively. The experimental density (ρe) was measured using the Pycnometer method which obeys Archimedes principle, and the setup is shown in Figure 3. By weighing the sample across a liquid and a dry media, the experimental test was carried out. The densities were determined by doing five trials of each combination to obtain precise findings. Experimental density measurement setup: (a) weight measurement in air, and (b) weight measurement in liquid.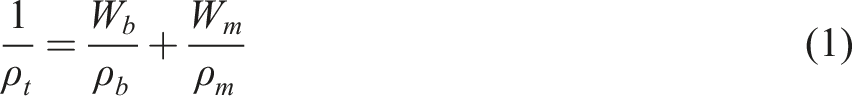
Hardness
The assessment of the relative hardness of all the neat and composite samples is done using a Shore-D hardness durometer according to the ASTM D2240 standard. 28 The load applied was 5 kg on the hardness tester (Rex Durometer, OS-1) to ensure the proper indentation. The durometer is designed for analysis of hardness in soft materials like rubber, plastics, elastomers, and roller materials. The Shore D hardness number has been recorded according to the resistance exhibited by the materials against the indentation force. The device included with sensor element with a dial accuracy of 0.5 units. To get the mean value, each sample is employed with 10 trails at the various locations on the sample surface.
Design of experiment
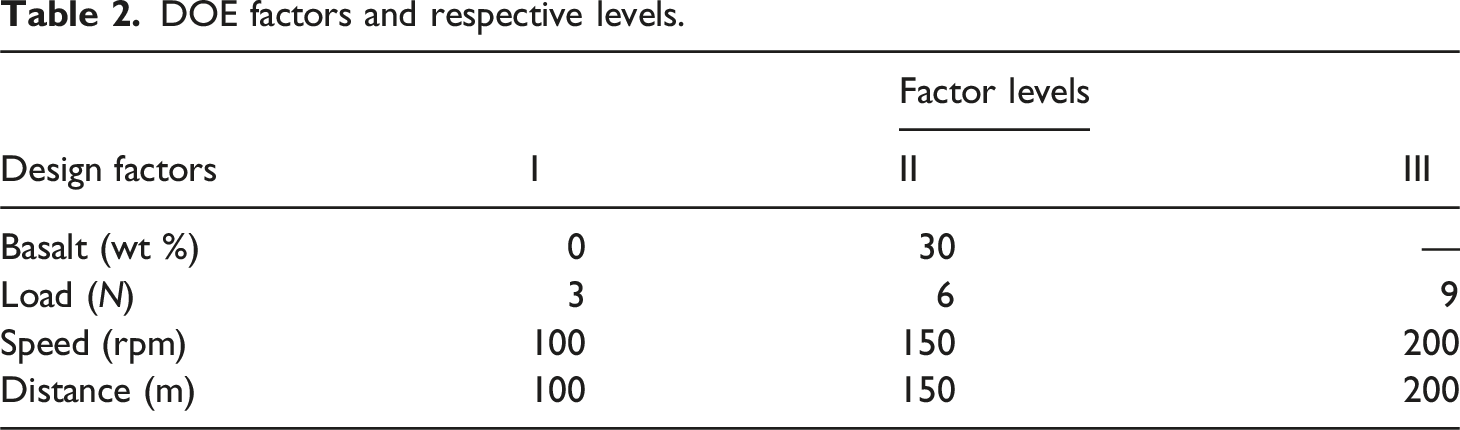
DOE factors and respective levels.
Tribology experiment
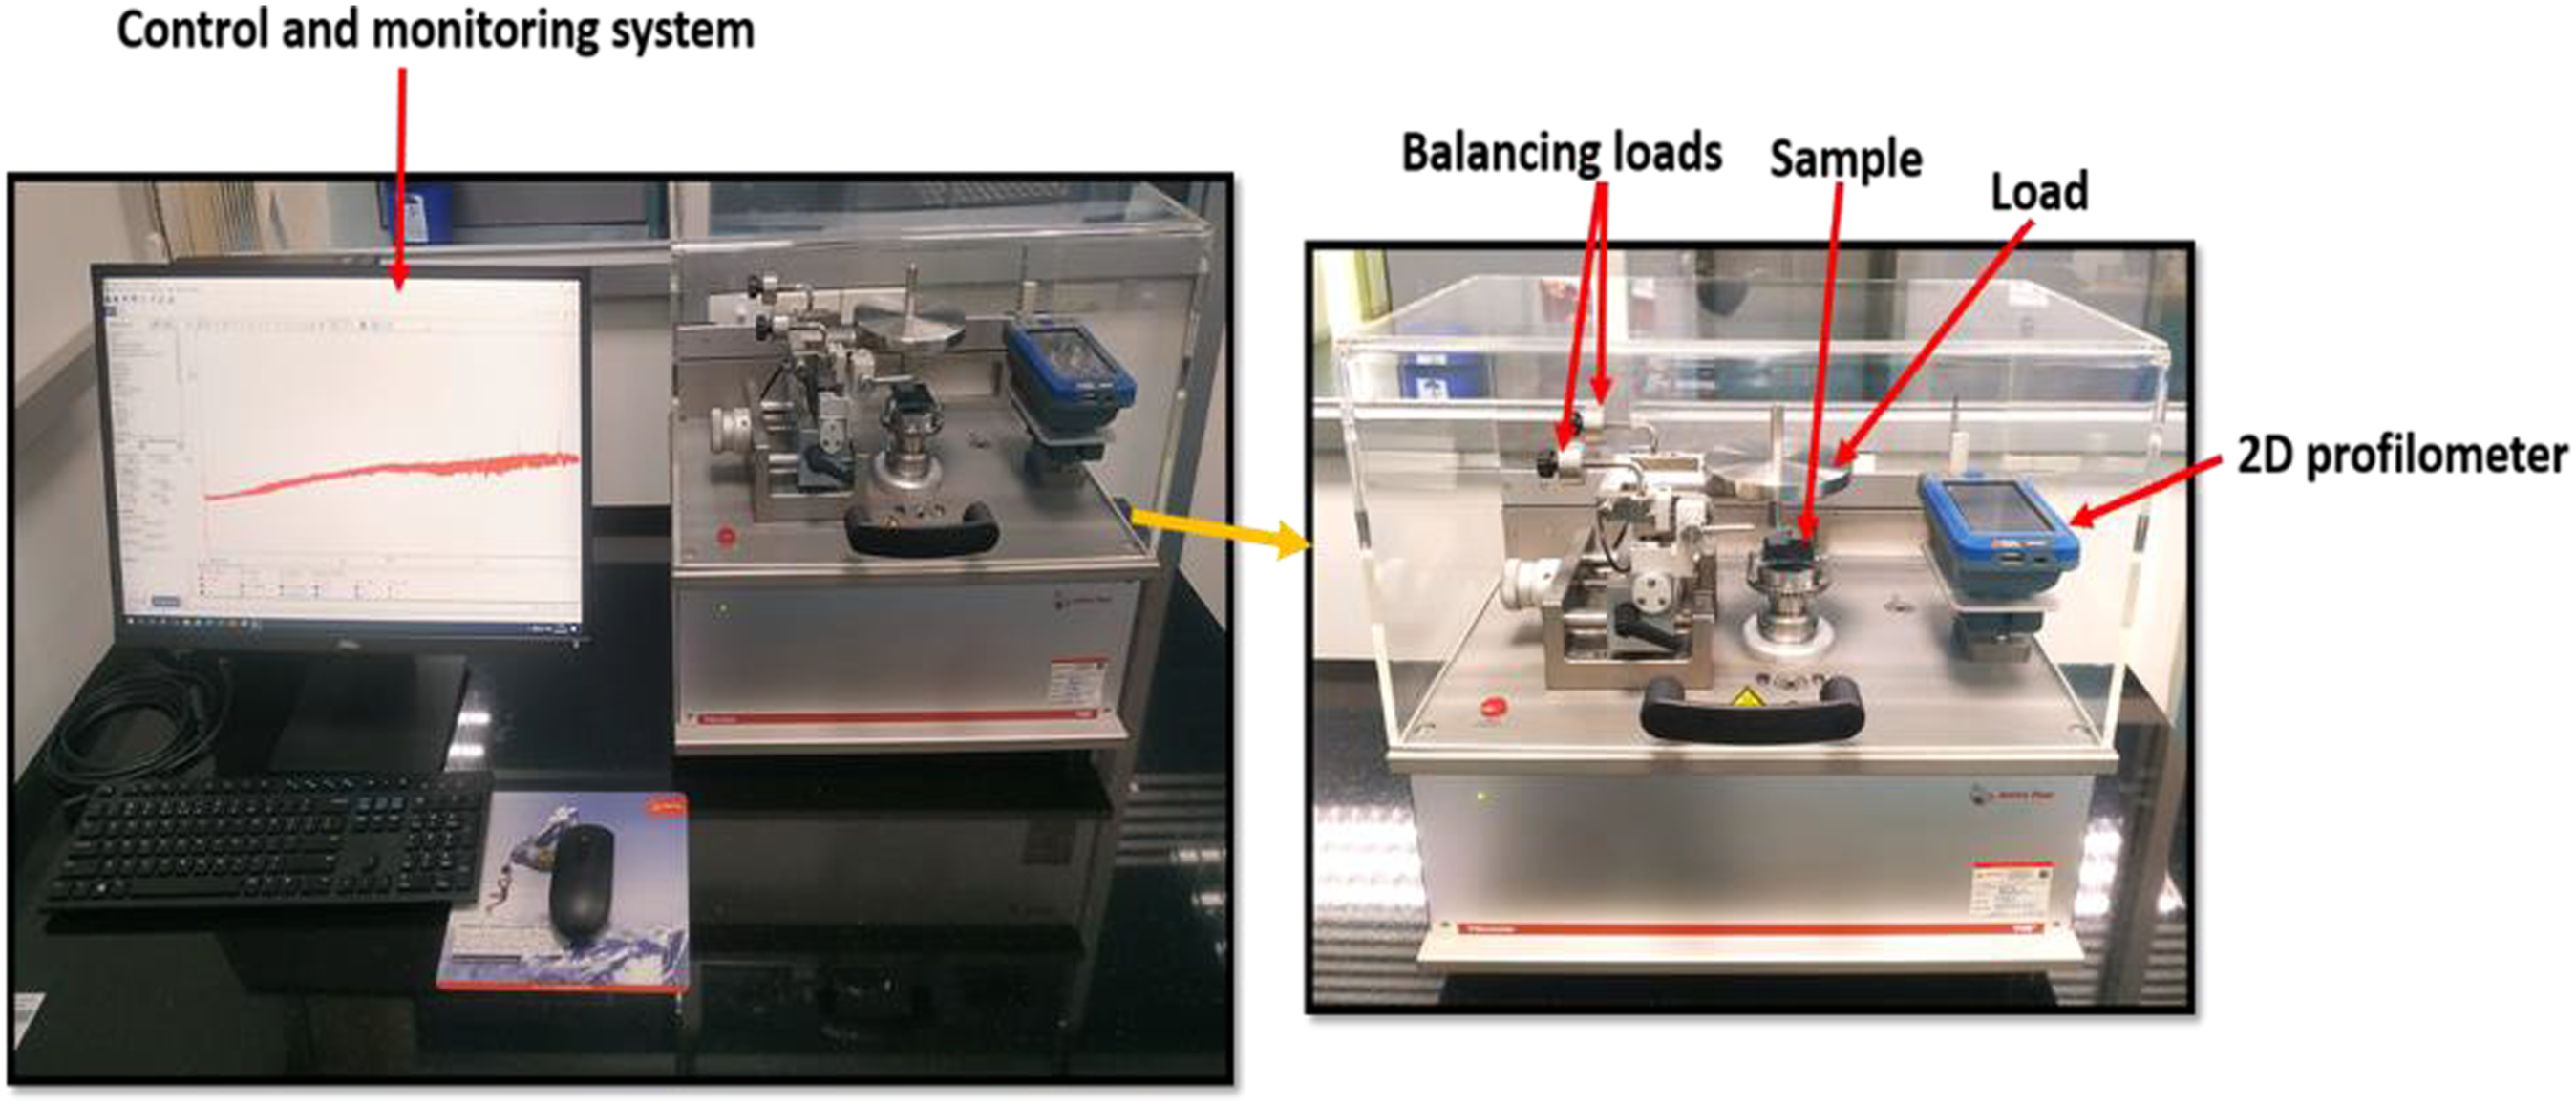
The Anton Paar TRB3 Pin-on-disk tribometer is used to conduct the tribology test on the PP and HDPE polymer samples in accordance with the G99 standard. To keep the samples’ surfaces uniformly rough throughout the experiment, they are first rubbed with 1500 grit paper, then with 2000 grit paper. The load, speed, and distance are the variables that change while performing the tribology testing. The COF results are directly obtained from the system, and the weight loss was recorded for each sample. In accordance with the orthogonal array design, the experiments are carried out in a comfortable environment. Figure 4 depicts the tribology setup for the experiment. For the particular wear rate calculation according to equation (3),
27
the sample weight loss is tracked after each experiment. Tribology experimentation setup.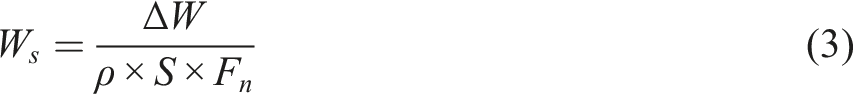
Taguchi and analysis of variance techniques
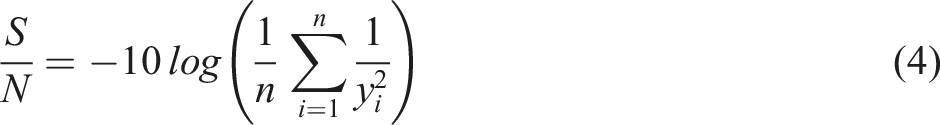
An effective method for analyzing the impact of control variables on the COF and SWR of samples is Taguchi optimization. To examine the quality characteristics, Taguchi uses the S/N ratio results from all the experimental runs. In this method, the terms “signal” and “noise” symbolize the output response’s intended value (mean) and undesirable value (standard variance), respectively. Equation (4)’s
27
signal-to-noise ratio is used in this method to discover quality parameters that differ from the desired value. In this study, the Taguchi method is used to reduce the COF and SWR values by choosing the best basalt weight percentage, load, speed, and distance variables. Since both replies must be reduced, the performance feature that is smaller is preferred. ANOVA may also be used to support the results of the Taguchi technique since it highlights the importance of the factors' order in influencing the answer.
28
Results and discussions
Density, void fraction, and hardness analysis
Experimental and theoretical densities of thermoplastic samples with voids %.
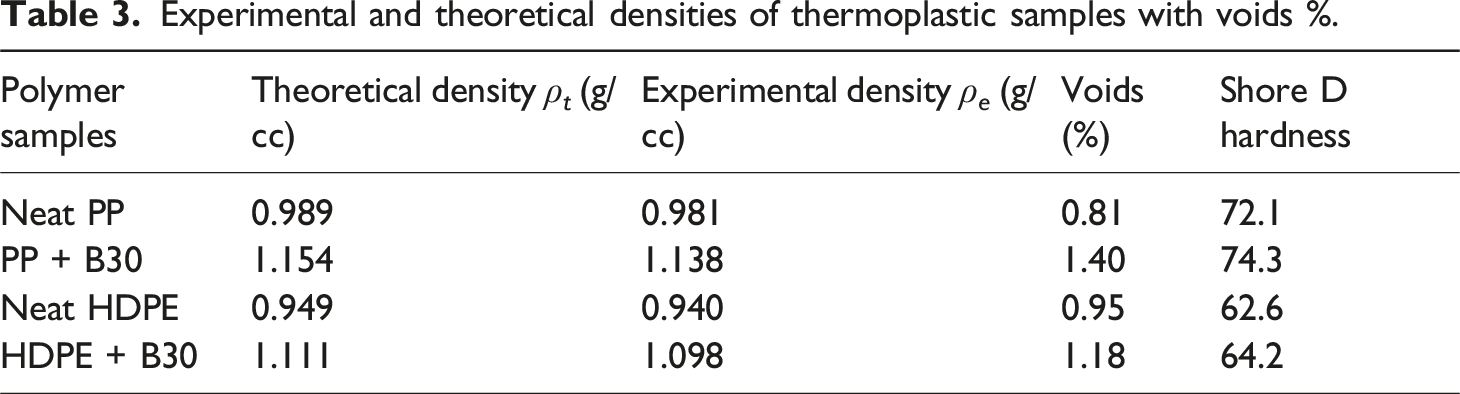
The Shore D hardness measurements of neat thermoplastic polymers and their basalt filler-loaded composites are provided in Table 3. These are the mean values of 10 average trails on the different locations of the surface. The material’s hardness dictates the extent to which it can withstand little local deformations. The kind of reinforcing element and the stiffness of that material have a significant role in determining the hardness values in the research of polymer composites. The maximum hardness is recorded for neat PP of 72.1 SD, and the filler addition to this PP improves the hardness value by 3.05%. The lowest hardness of 62.6 SD is found in neat HDPE polymer because of more deformation of the polymer under the application load. A significant increment in hardness value by 2.55% is observed with HDPE polymer with filler reinforcement. This increase may be explained by the fact that the basalt filler has substantially greater hardness levels than neat polymers, which increases the load-bearing capability. Additionally, the filler’s inclusion in the microscopic makeup of the matrices restricts the movement of dislocations under loading, increasing the strength of the composites. 32 The quantity of reinforcing distribution in the matrix also determines the hardness of the composites as indentation on thermoplastics causes plastic deformation in the indented zone. Fillers are made accessible for indentation by the dispersion, which also provides resilience to the indentation. 33 The homogeneous dispersion of the basalt micro-filler within the polymer matrices and subsequent tangling of the polymer chains could be the reason for the lower deviations in error bars. 34
Friction and wear analysis
Polypropylene samples
Taguchi design of experiments using L18 orthogonal array for PP samples.
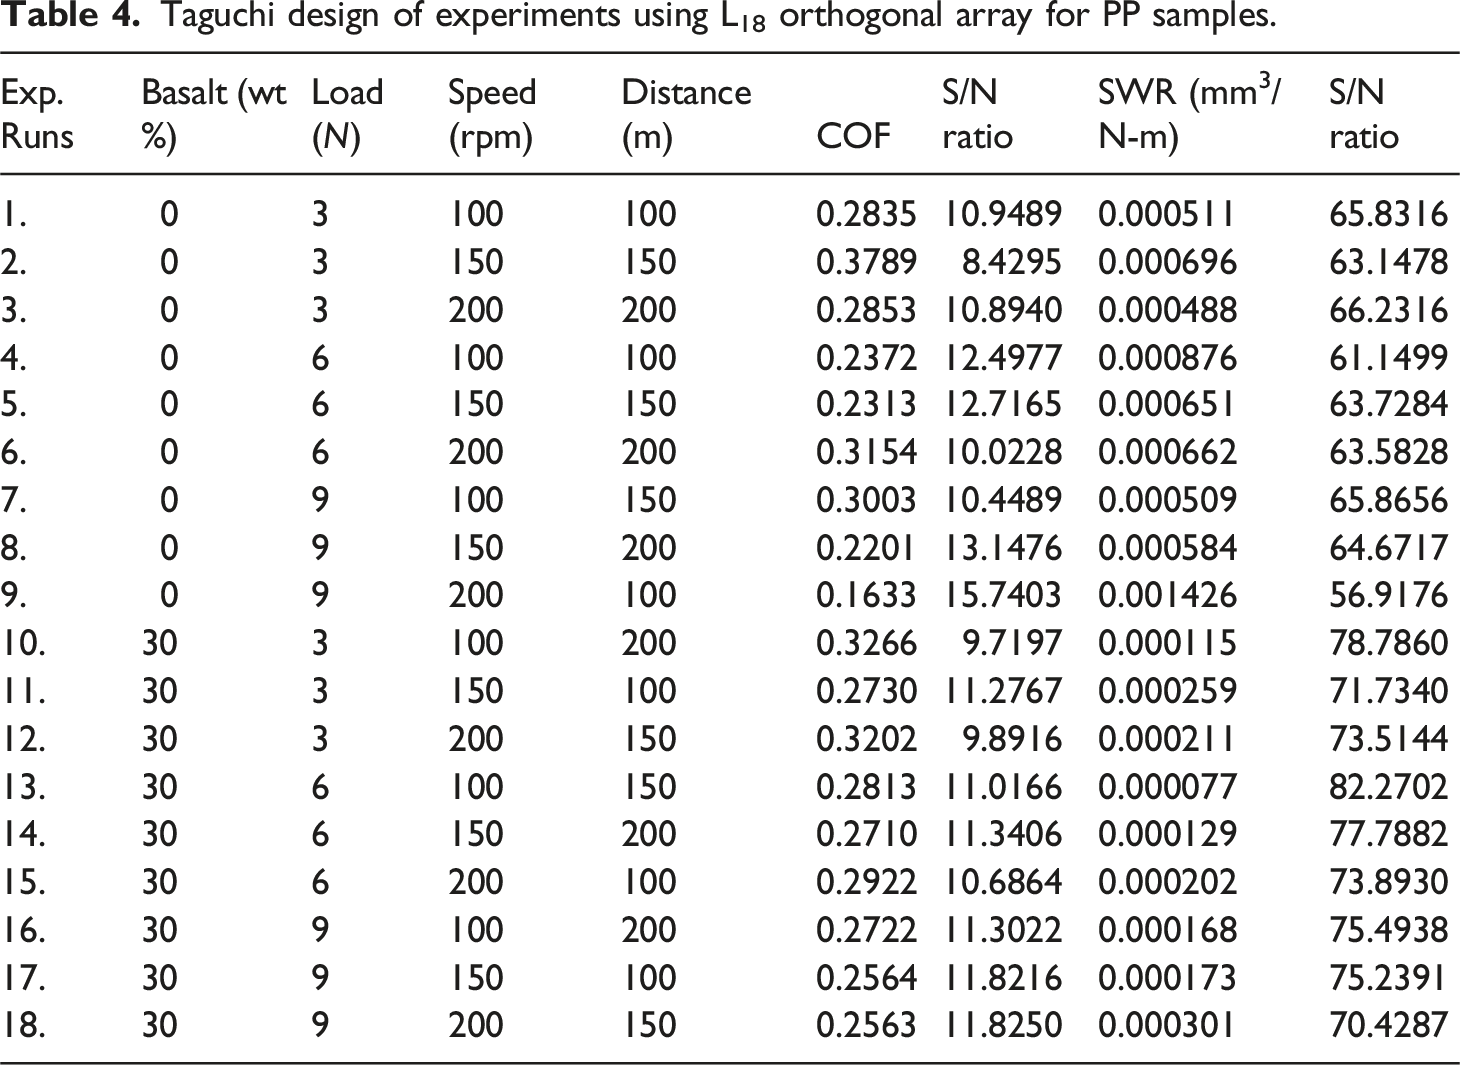
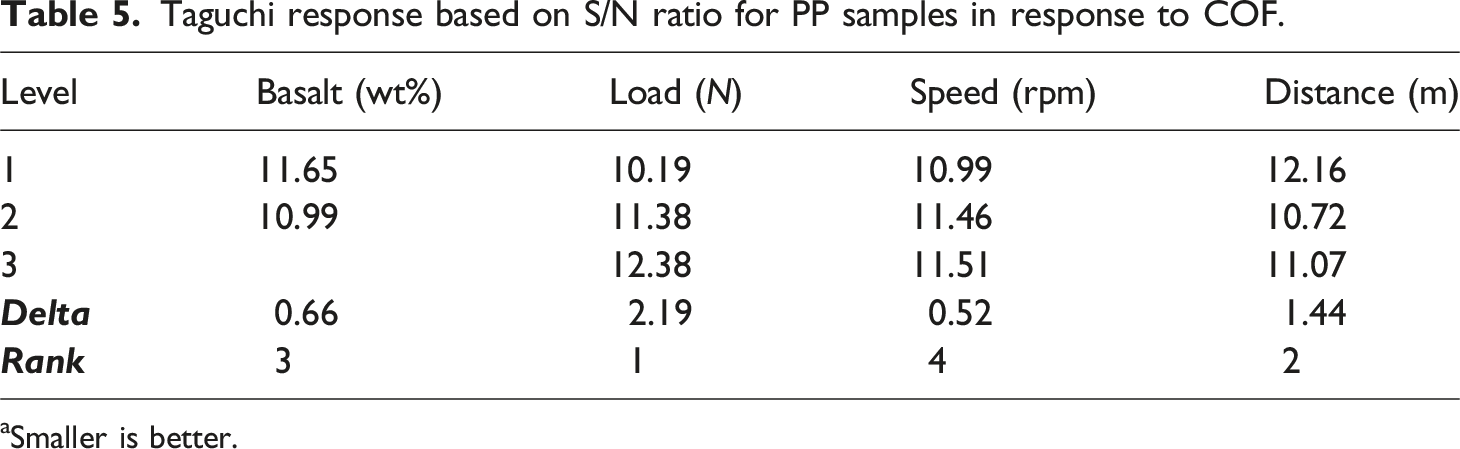
The effect of each parameter can be analyzed using the Taguchi technique with the main effect plots as illustrated in Figure 5(a). The influence of the response is shown by the slope of each variable. The difference between the various levels hints about the impact of the variable concerning other variables as well. About these criteria, the load parameter shows more slope and distance among the different levels. Hence, this parameter has more effect on the COF response. The second highest slope can be observed with the distance parameter where the difference between the first and second levels is significantly high compared to other parameters levels. The third and fourth impacting parameters are basalt wt% and speed respectively as appeared with lowest slope values. The optimum parameters in response to COF based on the Taguchi analysis are 0 wt% basalt, 9 N load, 200 r/min speed, and 100 m distance. It is crucial to consider any potential correlations between the control parameters before seeking to predict performance using this simple model. The correlations among the parameters are illustrated in Figure 5(b). The basalt wt% has strong interaction with all other variables and the unfilled samples exhibited minimized COF value as shown in the plot. Whereas the load parameter showed a correlation only with basalt wt% and speed with the optimum load value of 9 N. The establishment of this correlation is based on the interactions exhibited among the parameters with their significance level. Table 5 records the responses obtained by the Taguchi analysis by utilizing S/N ratios. As per the response data, the maximum delta value is indicated with the most significant factor in response to COF. The maximum delta is achieved by the load parameter of 2.19 with the rank 1. These values are obtained with smaller the better S/N ratios. This can be explained as the load parameter has given its maximum contribution in achieving the lowest COF value. The second significant parameter is distance having a delta value of 1.44 and achieving a rank of 2. The 3rd and 4th ranks are allotted to basalt wt% and speed according to their impact level. (a) Main effect plot, and (b) Interaction plots for PP samples in response to COF. Taguchi response based on S/N ratio for PP samples in response to COF. aSmaller is better.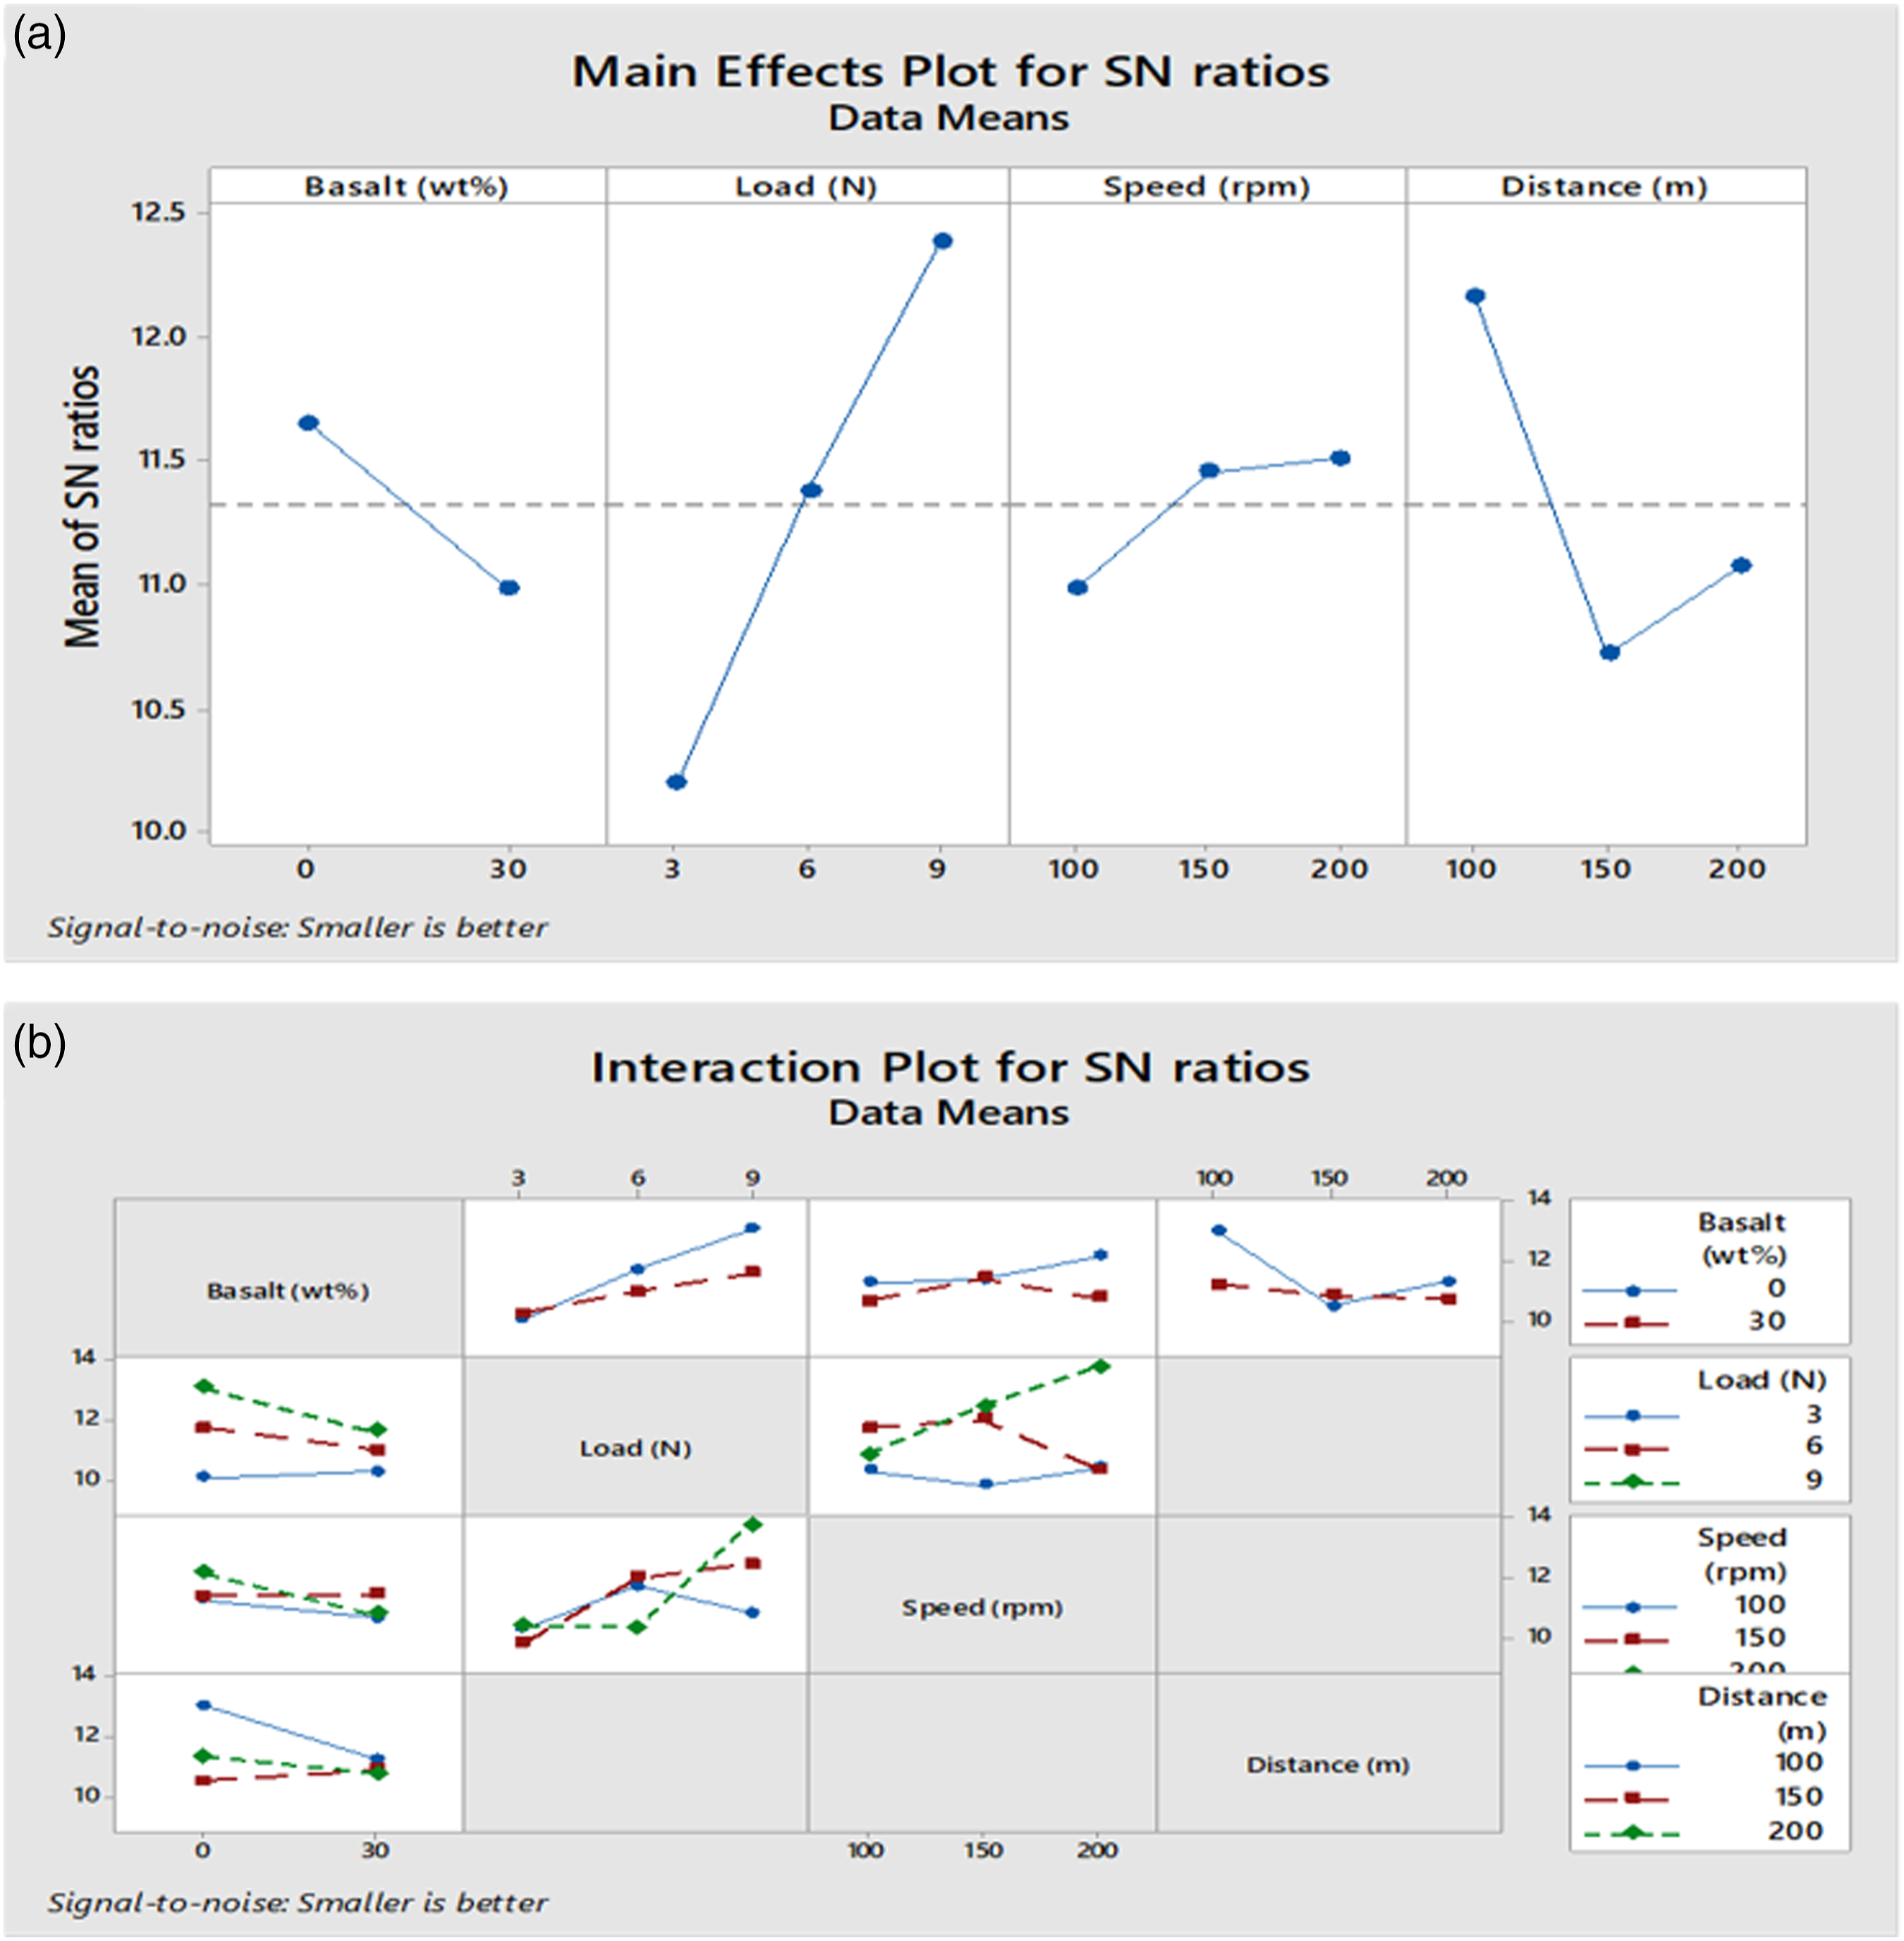
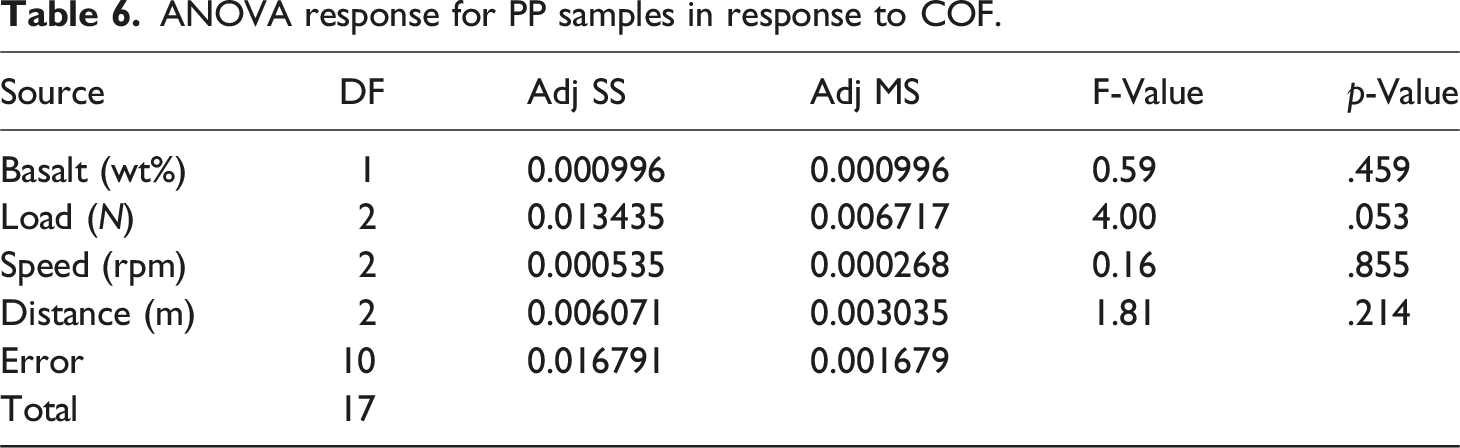
ANOVA response for PP samples in response to COF.
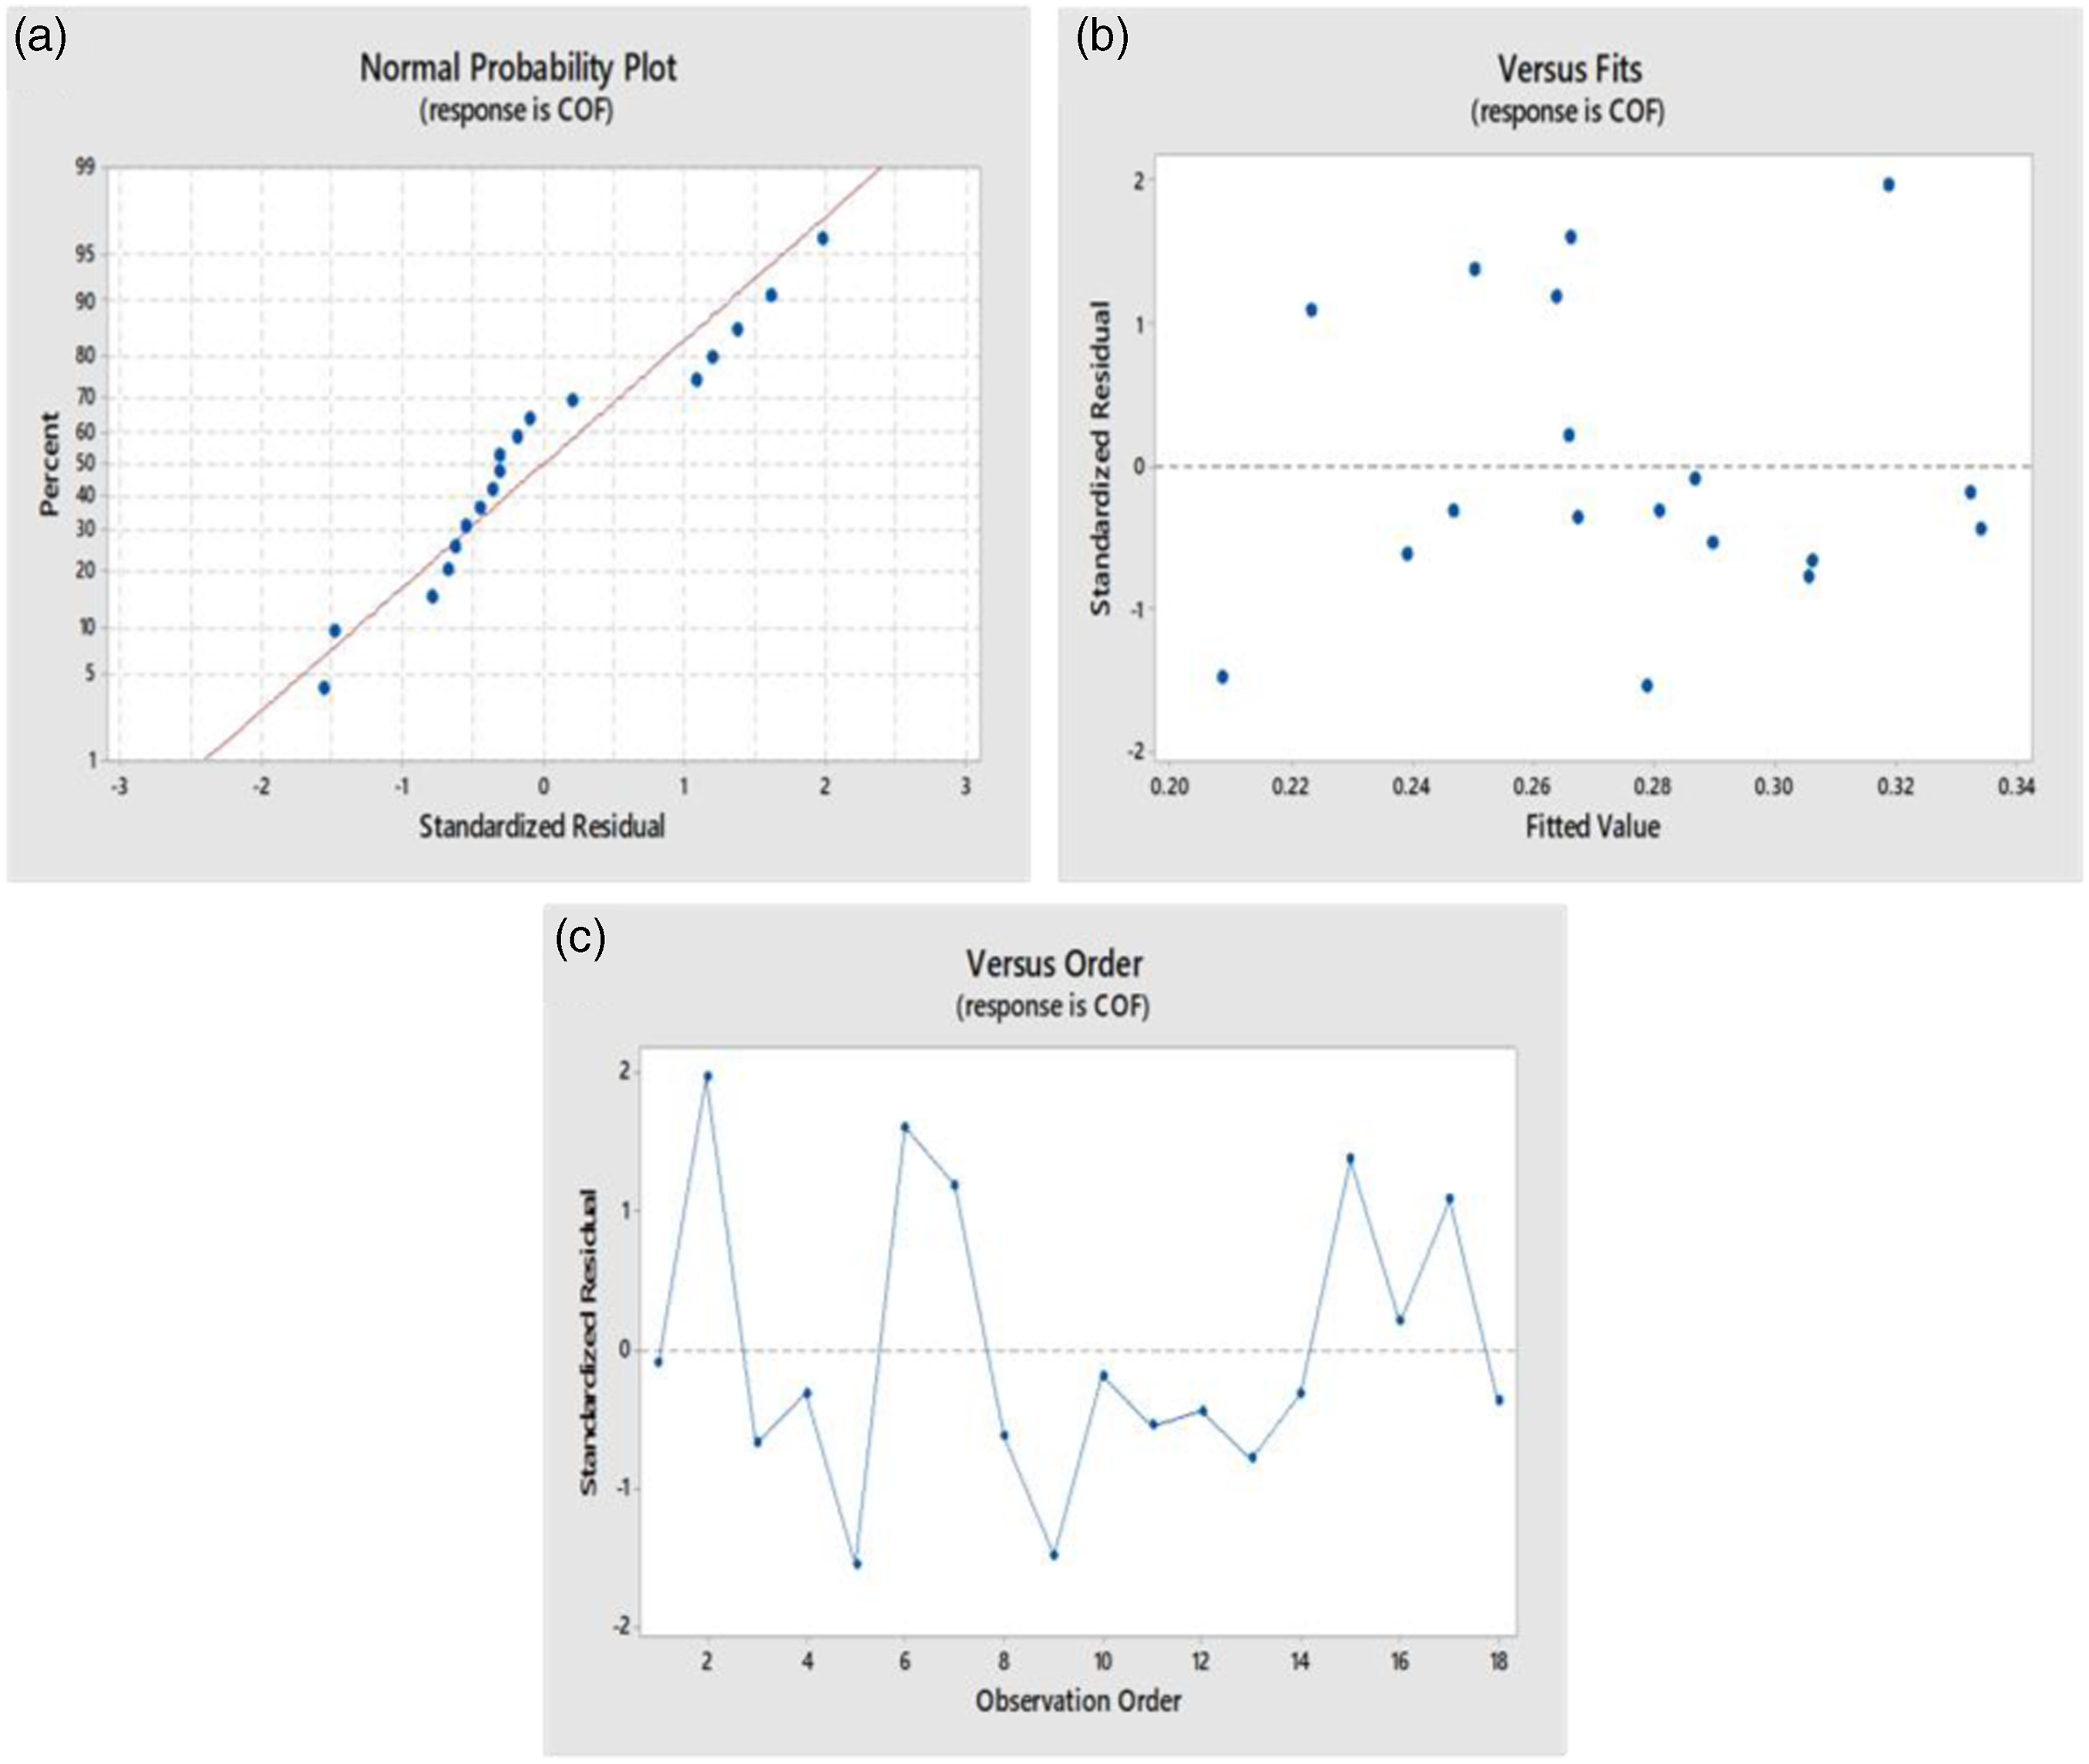
COF model plots for PP samples: (a) Probability, (b) Residuals versus fits, and (c) Residuals versus order.
Using 2D contour plots, as shown in Figure 7, the interaction between processing factors that affect the COF of PP samples is examined. Figure 7(a) reveals the strong interaction among load and basalt wt% regarding COF response. In this interaction, the minimum COF can be found at lower basalt filler contents and maximum loading conditions. Both the parameters vary inversely to each other in achieving COF values in vice versa. The maximum conditions for both the parameters are anticipated to be the lowest COF response, and it is indicated with a light green color region. The relation among speed and basalt wt% in response to COF is illustrated in Figure 7(b). In this plot, the lowest COF is shown to be at 0–5 wt% basalt reinforcement and 180–200 r/min speed indicated with a light green color region. Whereas the maximum COF is observed with higher basalt reinforcement and the lowest rotational speed. Since there is more interfacial contact at a lower speed, the sample experienced more friction. Similarly, the correlation between distance and basalt wt% is shown in plot Figure 7(c). The minimum distance travel and basalt wt% are indicated with the lowest COF value that is observed in the light green color region. Similarly, the maximum distance and basalt wt% records the highest COF of more than 0.38 as indicated in the dark green color region. Since it is a thermoplastic polymer, the travel distance is anticipated to be the minimum to get the lowest COF due to lower dissipation temperature. Contour plots for PP samples in response to COF: (a) COF versus load, basalt wt%, (b) COF versus speed, basalt wt%, and (c) COF versus distance, basalt wt%.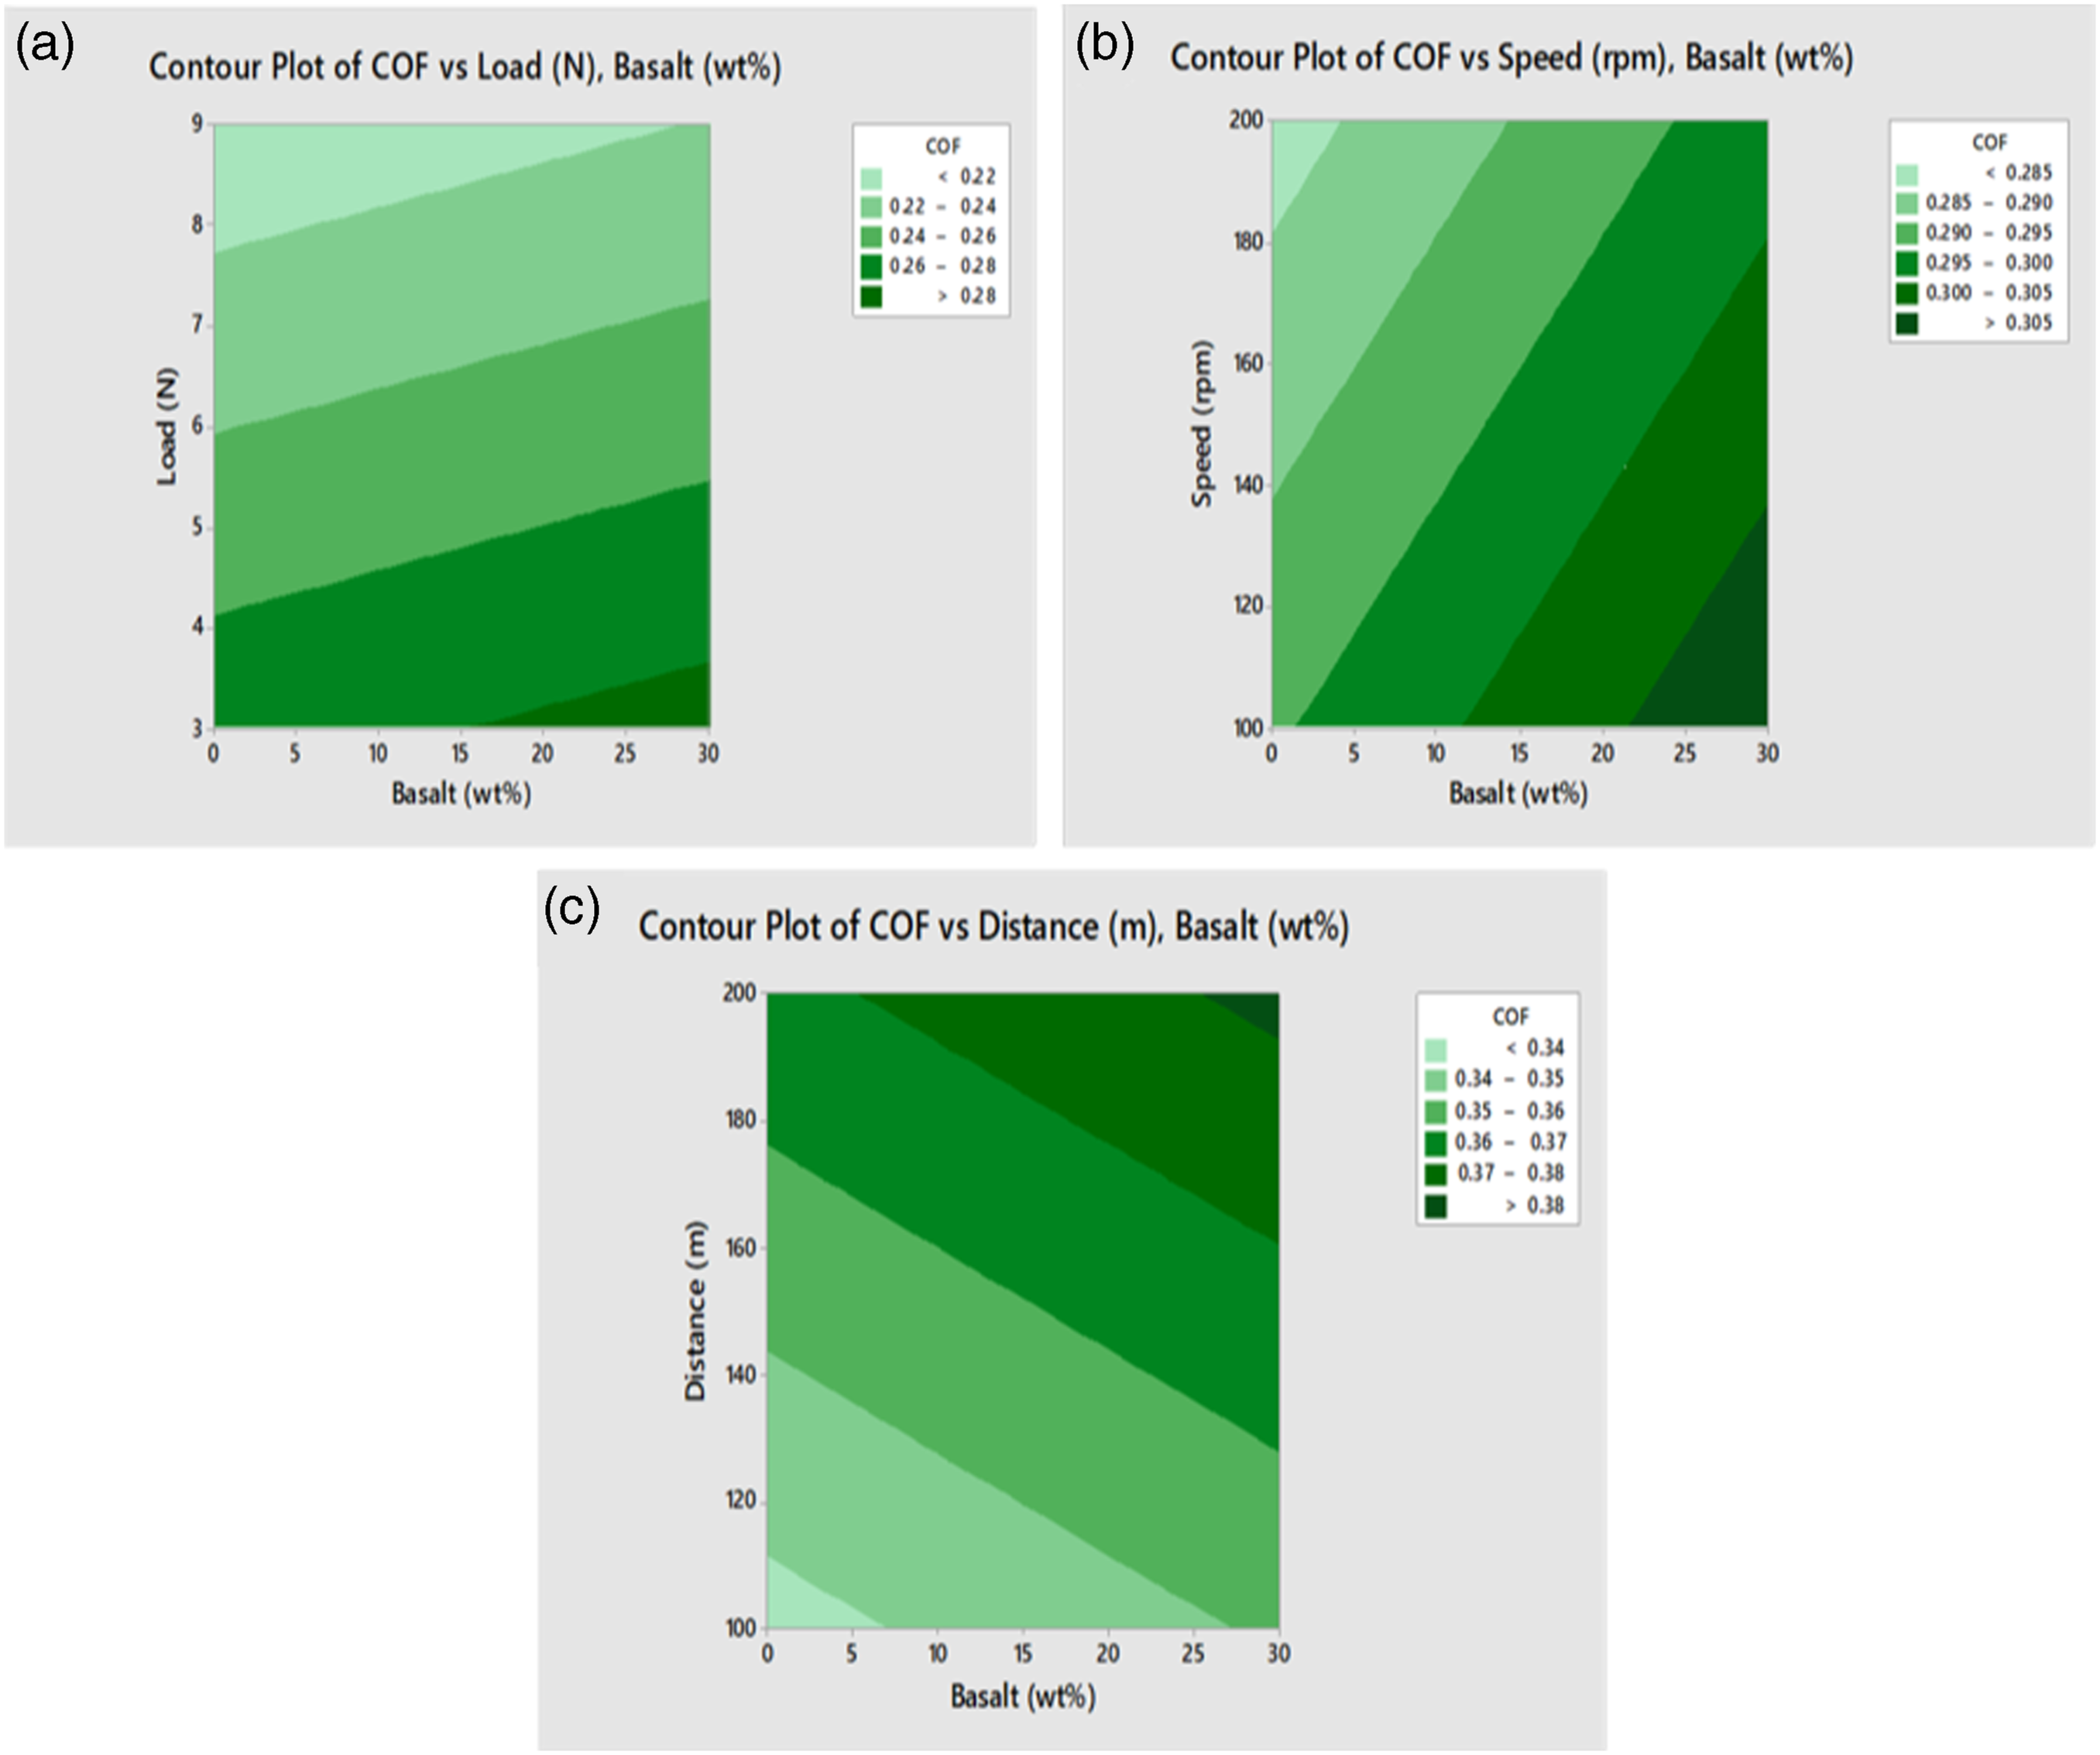
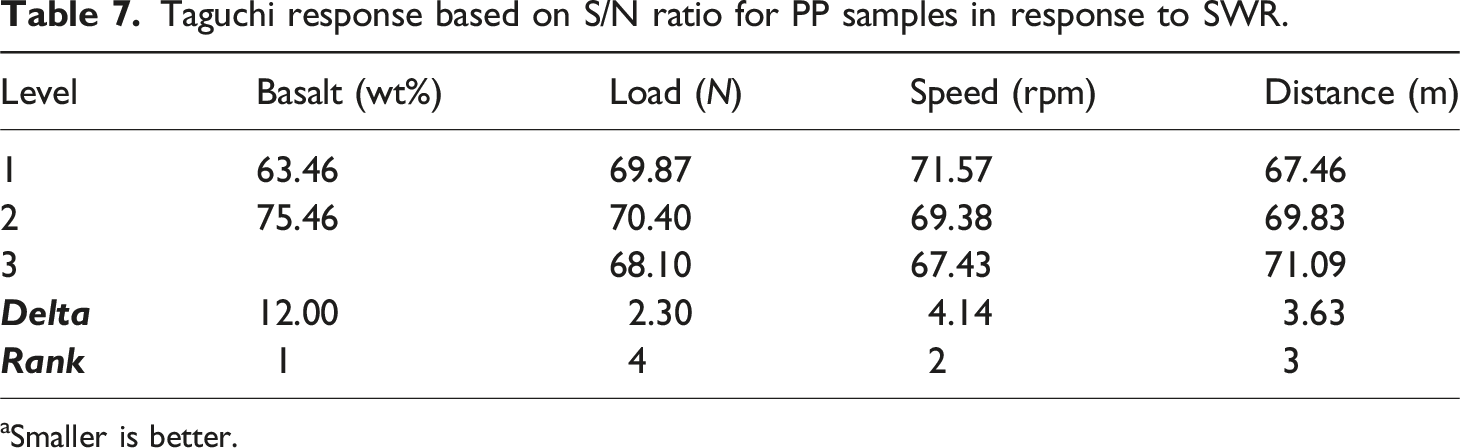
The main effects plots and interaction plots in response to SWR for PP samples are illustrated in Figure 8(a) and (b) respectively. The plots based on the S/N ratio utilized smaller is a better condition to predict the lowest SWR response. The major effect parameter is basalt wt% with a huge influential impact mainly responsible for SWR values. The slop of this plot among the two levels of reinforcement is found to be large as compared to other parameters. This basalt filler interfacial adhesion with the PP matrix reduced the material removal rate irrespective of the working parameters. The second and third highest impact parameters on the SWR are speed and distance respectively. Generally, the increase in speed coins the raise of temperature due to more frictional force development. This mechanism is more severe in polymers than in metals and alloys. The least impact parameter is a load on the SWR response as observed with low slope value and distance among their levels. The optimum parameters obtained are 30 wt% basalt, 6 N load, 100 r/min speed, and 200 m distance. In the interaction plots, the interacting lines are not aligned in a parallel manner which means there is strong interaction among them. The responses obtained from the Taguchi technique are tabulated in Table 7. These responses are recorded based on the maximum and minimum S/N ratios with respect to the individual parameters. The basalt wt% parameter is given the top ranking since it has a greater influence and a maximum delta value of 12.00. The second rank is allotted to the speed parameter which is having the second-highest delta value of 4.14. The difference in delta values among the variables clearly illustrates the amount of impact and significance level. The third and fourth ranks are allotted to the distance and load parameters which are having a delta value of 3.63 and 2.30 respectively. In comparison to all the parameters, the delta value of basalt wt% is nearly more than four times greater than the other parameters. Hence, both the effect plot and response table conclude that basalt is the major contributing factor in reducing the SWR of PP samples. (a) Main effect plot, and (b) Interaction plot for PP samples in response to SWR. Taguchi response based on S/N ratio for PP samples in response to SWR. aSmaller is better.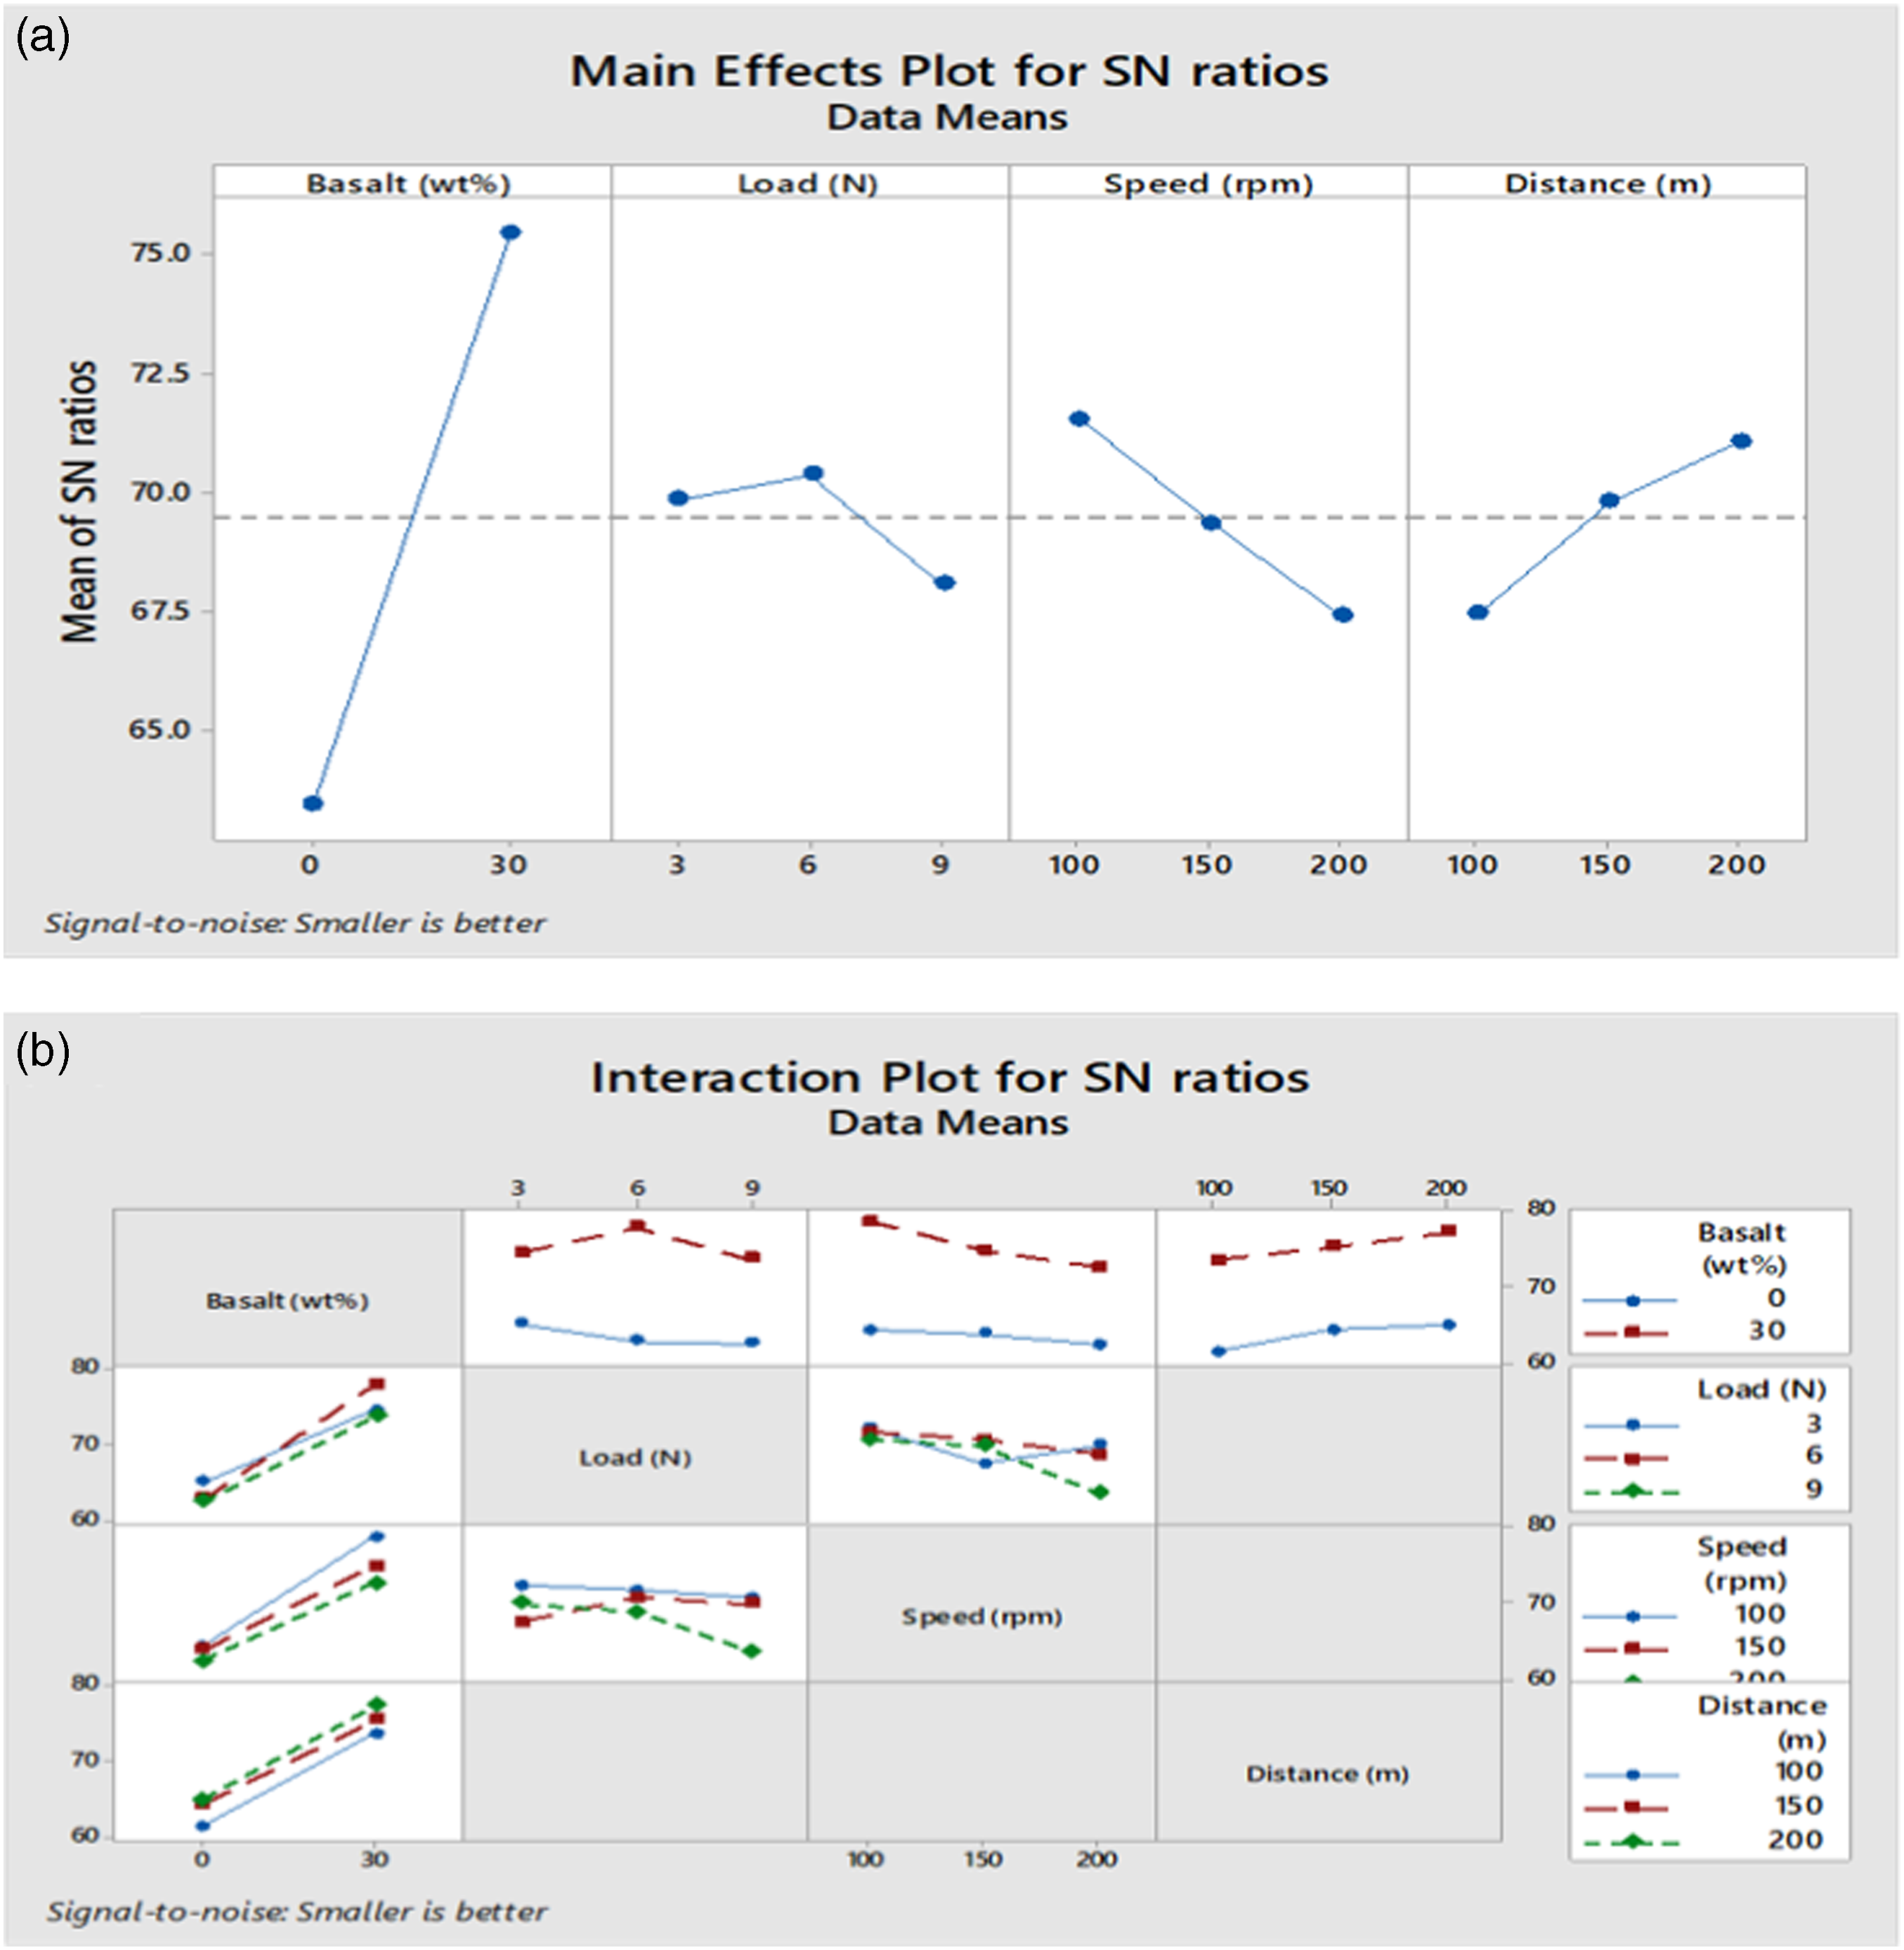
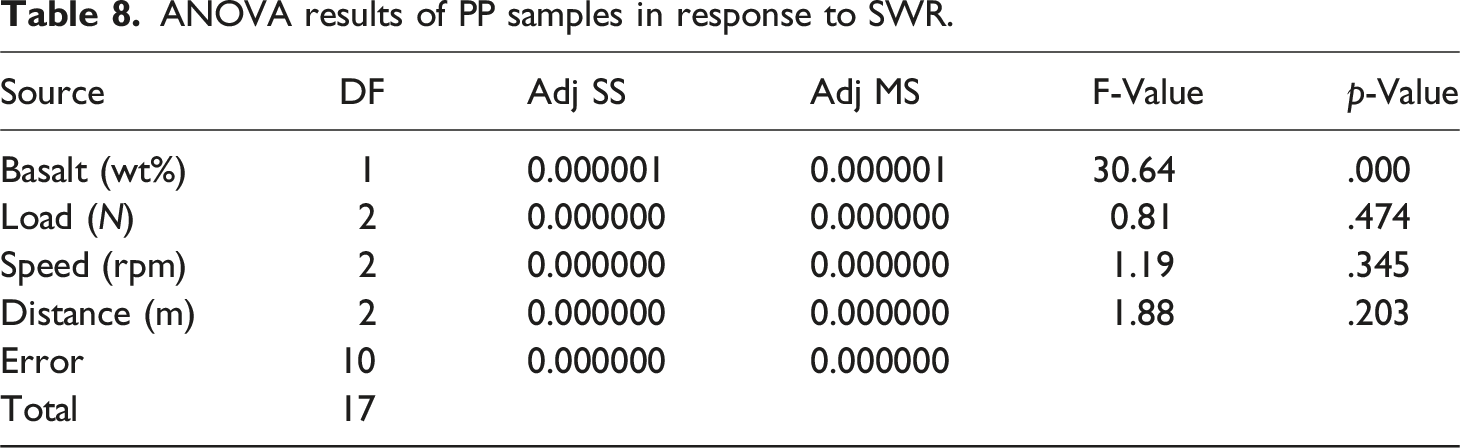
ANOVA results of PP samples in response to SWR.
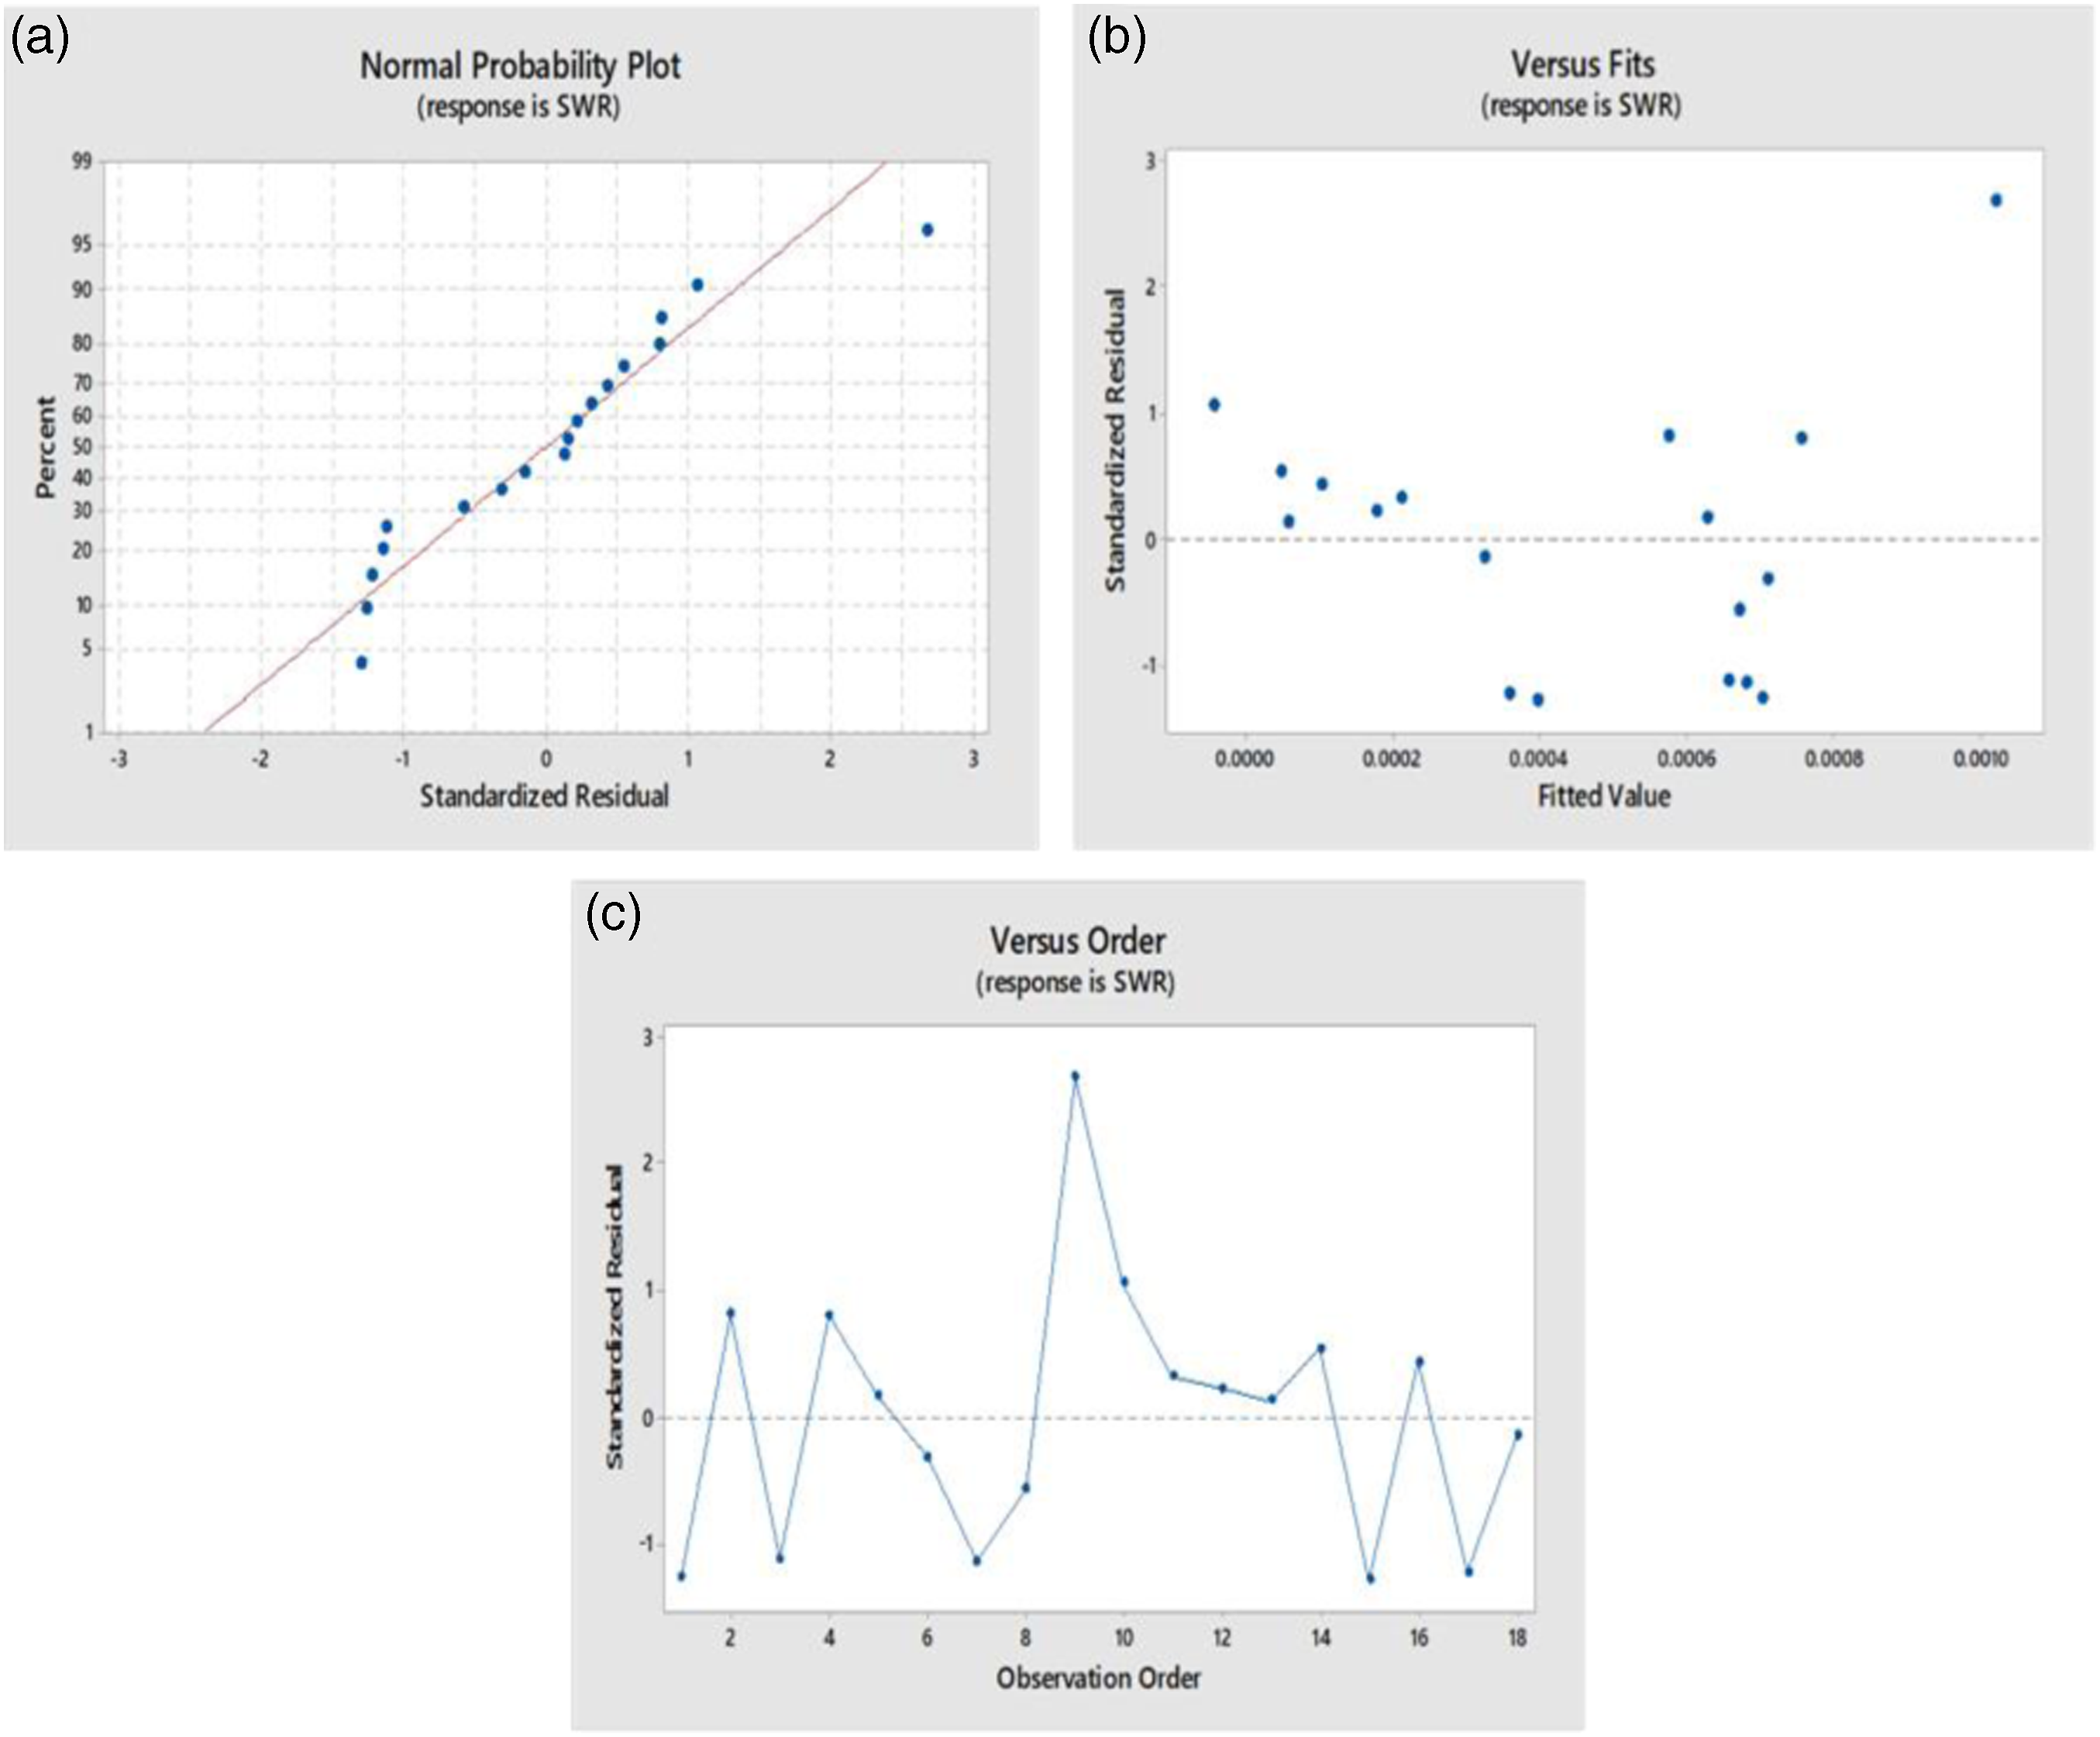
SWR model plots for PP samples: (a) Probability, (b) Residuals versus fits, and (c) Residuals versus order.
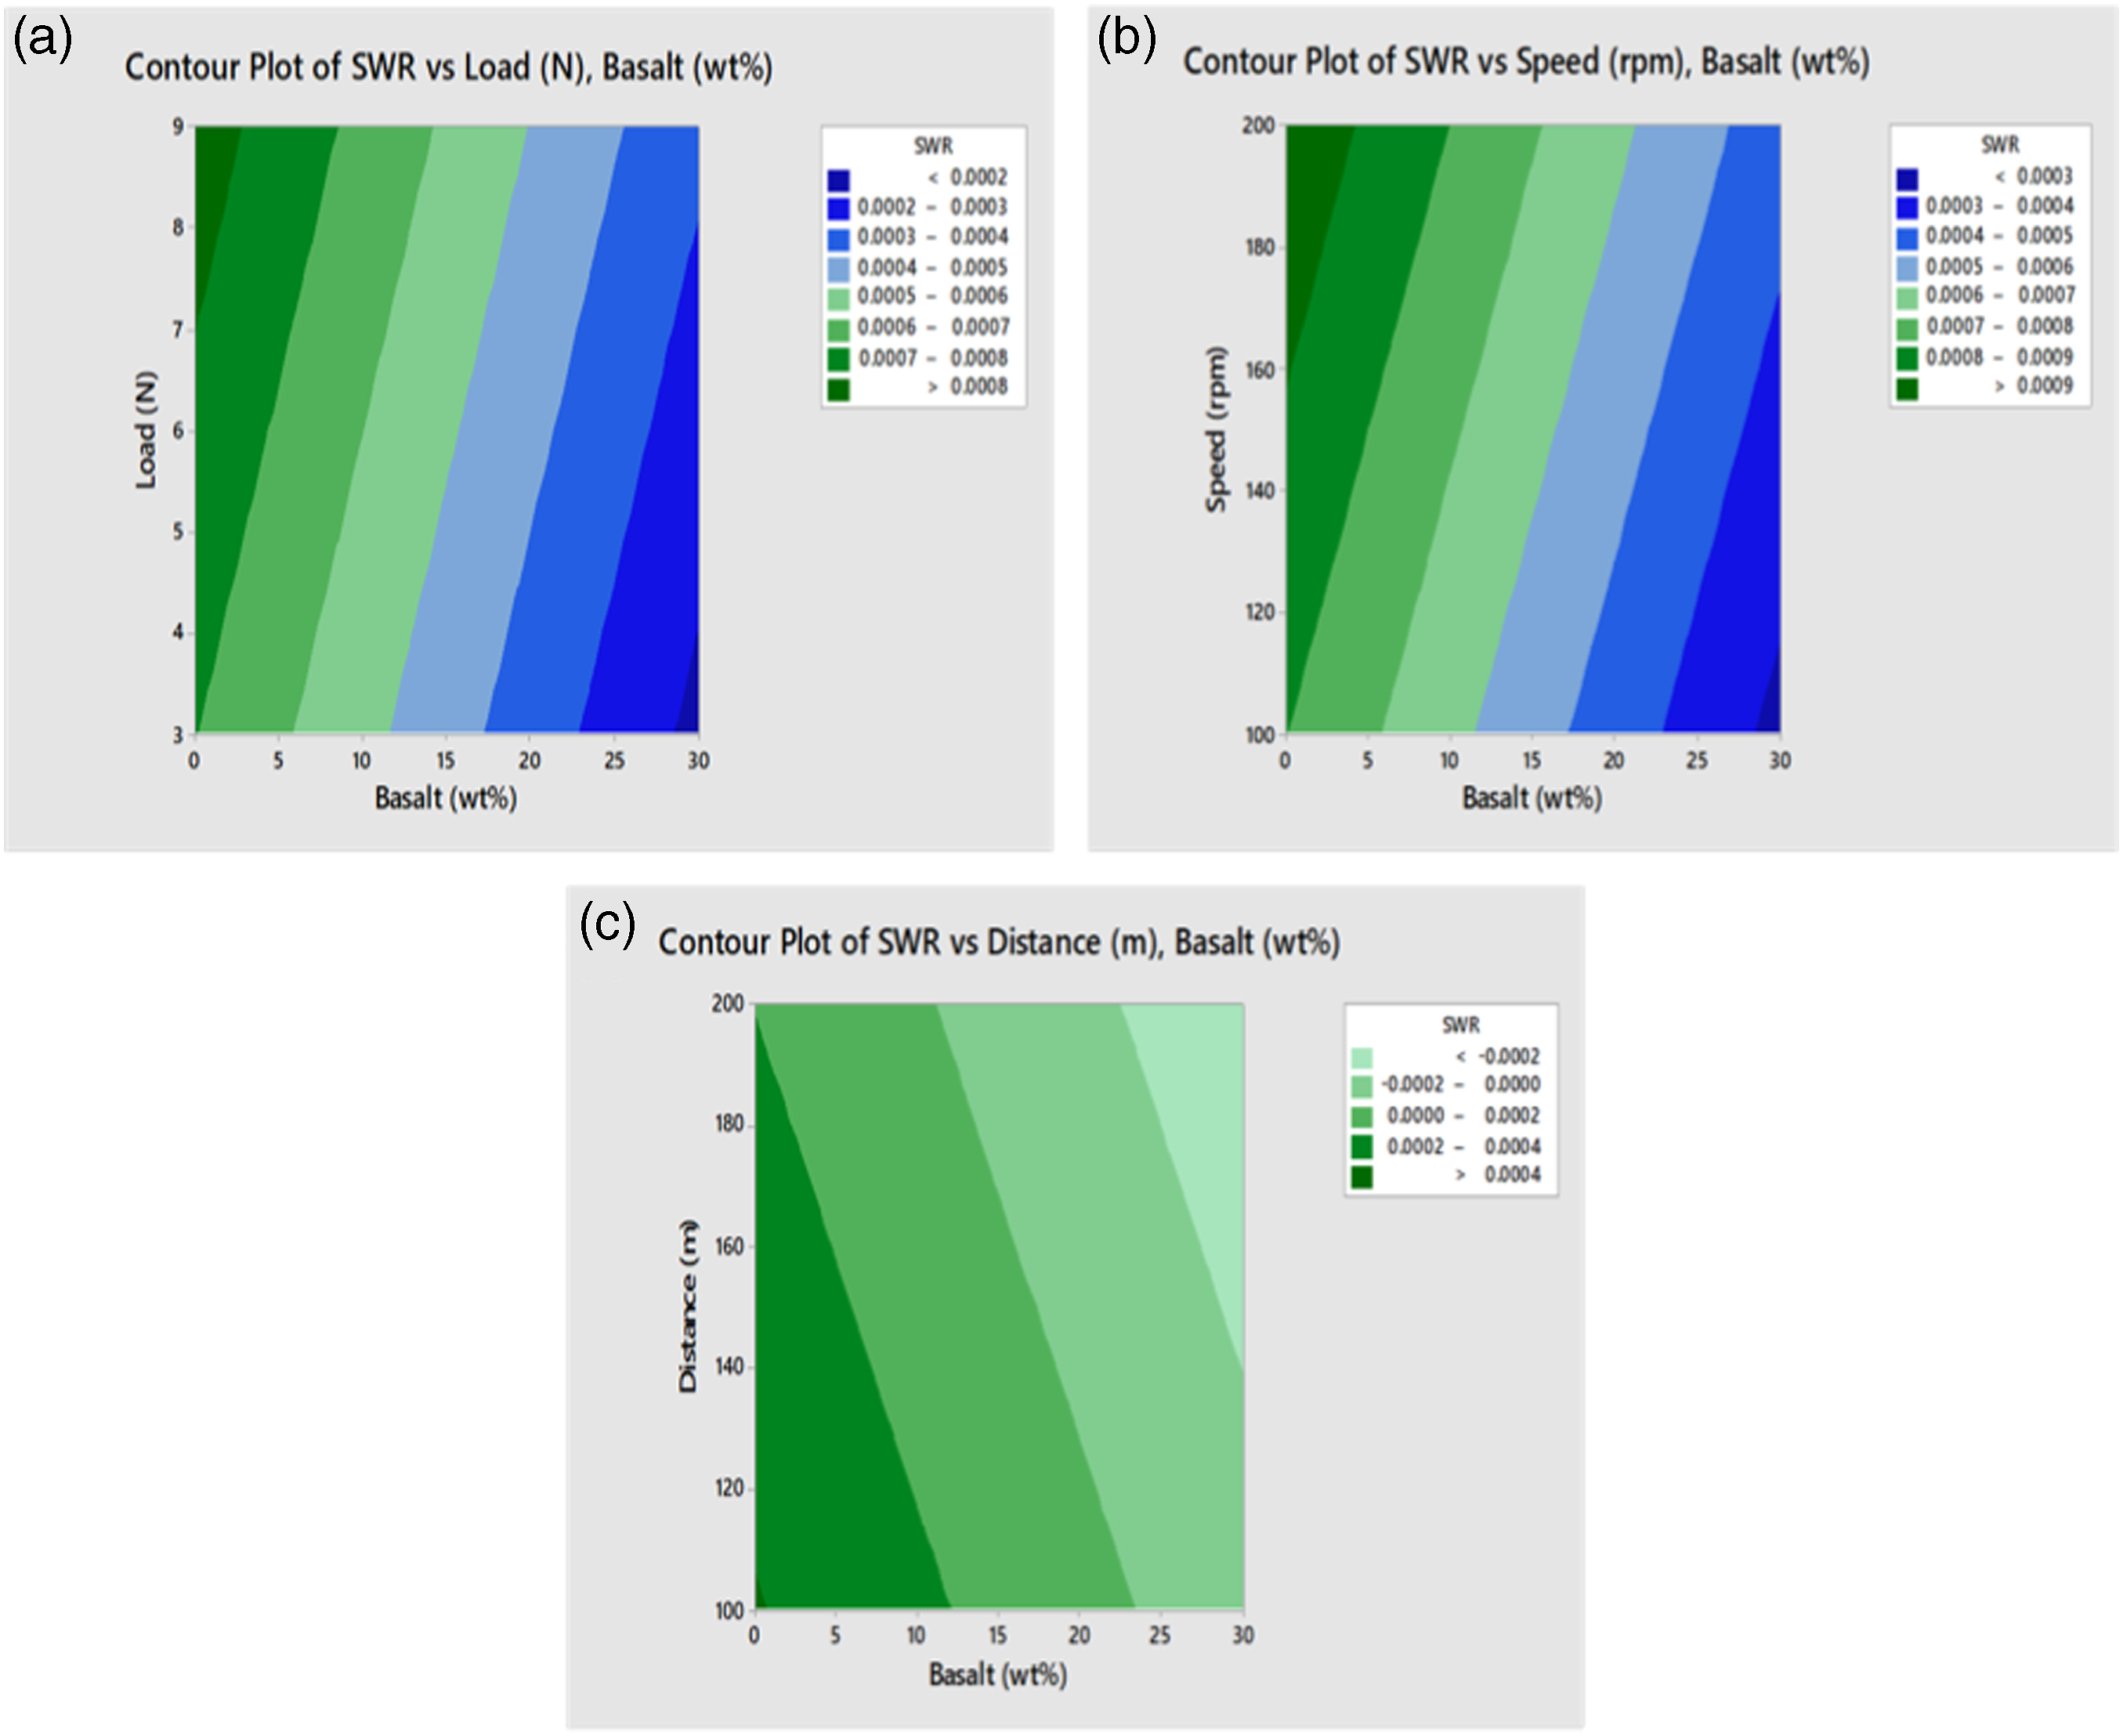
The contour plots provided in Figure 10 reveal the detailed distribution of SWR values over the interactions among the variables. Figure 10(a) illustrates the 2D contour plot of SWR versus load, basalt wt%, and revealed the appearance of parallel straight lines with different color illustrations in response to SWR. As per the illustration, the increase of basalt wt% from 0 to 30 wt% and decrement of load values gives the lowest SWR values as indicated in the dark blue region. To get a lower SWR response with a higher load, the basalt wt% has to be increased beyond 30 wt% as per the prediction. These similar observations are also found in the contour plot of SWR versus speed, basalt wt% in Figure 10(b). In both plots, the basalt wt% played a major role in determining the SWR values. In a quiet different case (Figure 10(c)), the maximum basalt reinforcement (30 wt%) and the intermediate distance values (140–200 m) are given the lowest SWR value indicated in the light green color region. The examination of intermediate SWR value is quiet easier with the 2D contour plots when there is a need for an intermediate response for different parametric values. The confirmation test, the last stage of the Taguchi method, compares experimental and predicted results using the best parameters. Equation (5) is used to determine the error percent with the difference between the experimental and anticipated values. Effective statistical analysis requires error levels of less than 20%.
36
The literature
37
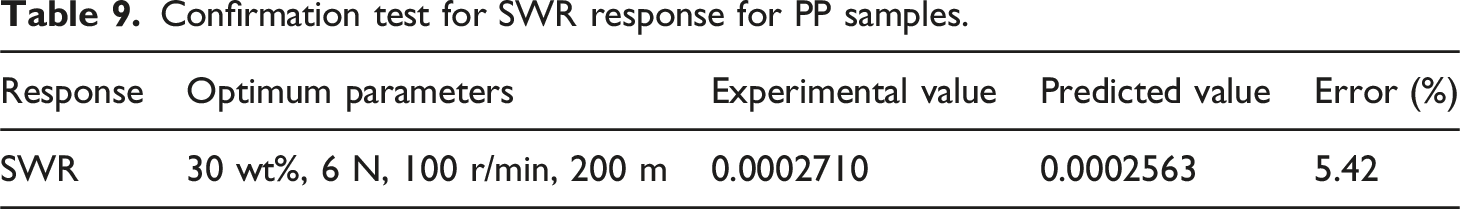
states that when the optimal set of parameters and their corresponding levels agree with one among the experimental runs in the designed array, the confirmation test is not necessary. For the PLA samples, the optimum parameters obtained for both COF and SWR responses are within the designed array. Whereas in the case of PP samples, the optimum parameters obtained for COF response are within the bound of an array, and the optimum parameters recorded for SWR response are not within the limit. Hence, the confirmation experiment was conducted for the optimum parameters in response to SWR. The experimental value obtained for SWR response is 0.0002710 after executing for optimum parameters. Whereas the model predicted an SWR value of 0.0002563 and obtained an error of 5.42% as tabulated in Table 9. Contour plots in response to SWR: (a) SWR versus load, basalt wt%, (b) SWR versus speed, basalt wt%, and (c) SWR versus distance, basalt wt%. Confirmation test for SWR response for PP samples.
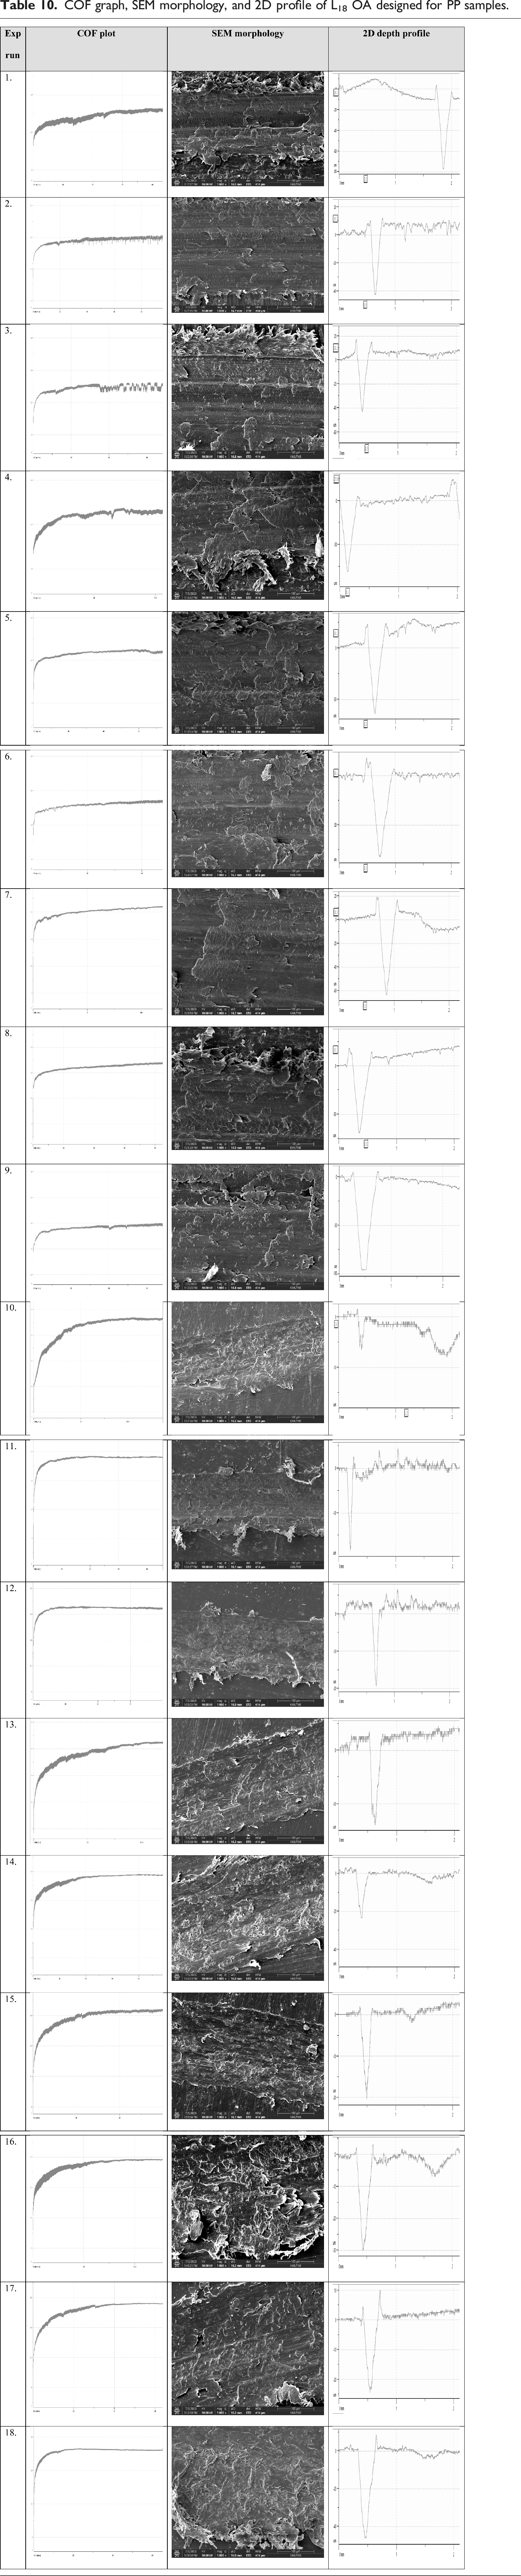
COF graph, SEM morphology, and 2D profile of L18 OA designed for PP samples.
High density polyethylene samples
Taguchi design of experiments using L18 orthogonal array for HDPE samples.
The parameter effect on the COF response and their illustration in provided in Figure 11(a). The influence on COF is found to be in the order of basalt wt% > distance > load > speed. The optimum parameters for COF response are neat HDPE sample, 6 N load, 100 r/min speed, and 100 m distance. Except for load, the remaining parameter’s low level is much contributed to a reduction in COF value. Since there is more slope and distance among the levels, the basalt wt% is pointed as a major impact parameter than the other variables. The least impact parameter is the speed where the level difference is quiet low among themselves. As seen in Figure 11(b), each of the parametric lines is exhibited with exceptional alignment, which implies that the parameters interact significantly with each other. Table 12 provides the Taguchi response based on the S/N ratio to confirm the significant factor. In this response, the significance is decided based on the calculation of the delta value by using the S/N ratio. According to the tabulated values, the basalt wt% gained the maximum delta value of 6.91 and was given rank one based on the impact. In the case of basalt-filled composites, heat is produced during sliding, which wears down the matrix, exposes the hard components to the worn surface, and scrapes the counterface, producing friction. This is correlated to the optimum level of basalt wt% obtained above the mean line in the main effect plot. The second highest delta value is found with a distance parameter of 5.89 which has a nearer value to that of basalt wt% and is allotted with the rank 2. The third highest impact parameter is a load which is having a delta value of 2.94 is given with rank 3. Finally, the least significant parameter is speed which is having a delta value of 1.99 and it is nearly three times less than the basalt wt% parameter. (a) Main effect plot, and (b) Interaction plots for HDPE samples in response to COF. Taguchi response based on S/N ratio for HDPE samples in response to COF. aSmaller is better.
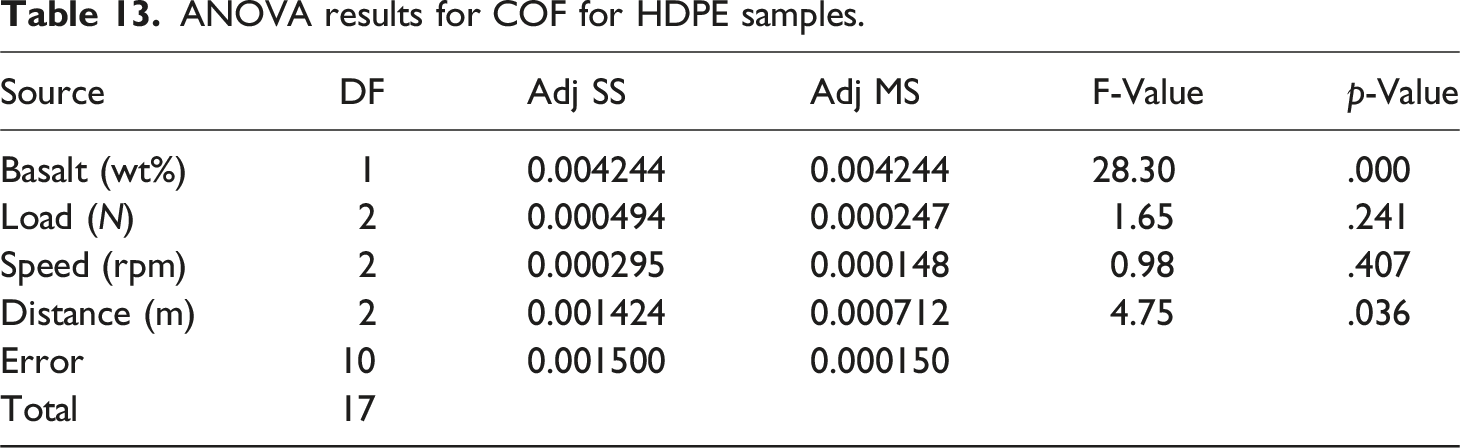
ANOVA results for COF for HDPE samples.
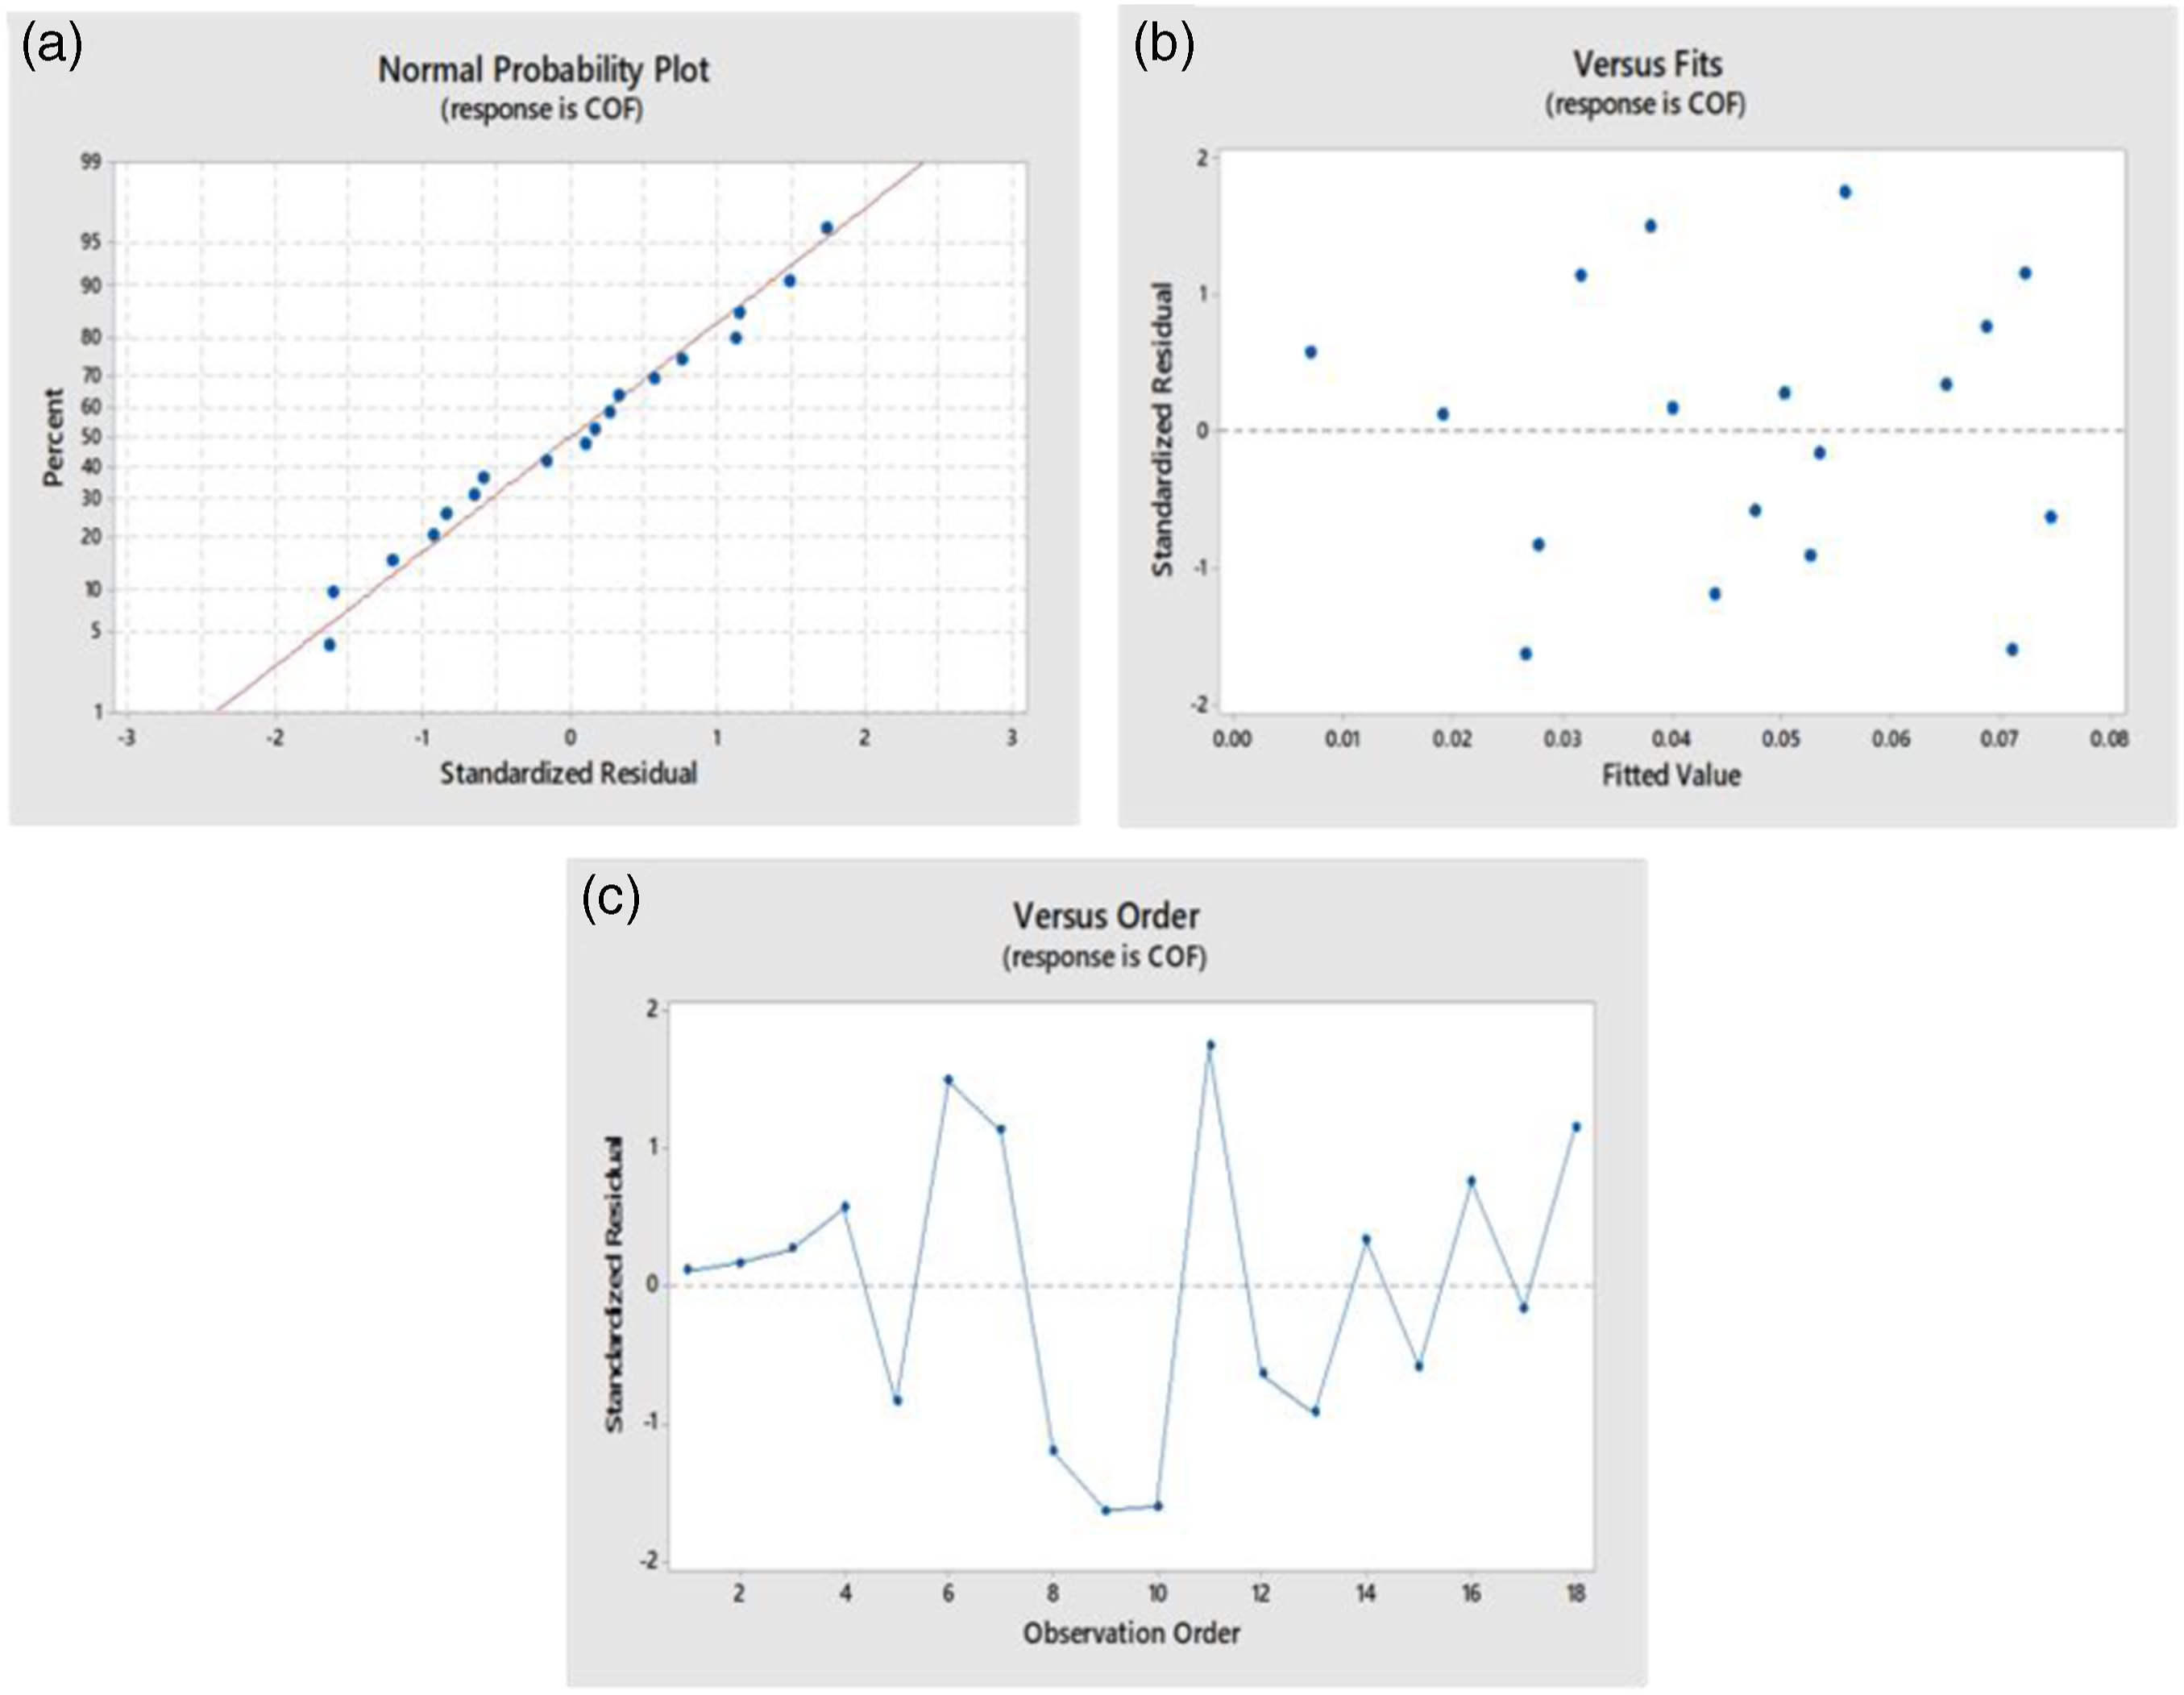
COF model plots for HDPE samples: (a) Probability, (b) Residuals versus fits, and (c) Residuals versus order.
The COF response contour maps (Figure 13) offered a workable approach for estimating the impact of various factors on the COF, which was extremely helpful for the designer to choose the best parameters as per the requirements. As illustrated in plot Figure 13(a), the COF values are increased with decreasing basalt fillers ratio and with the increment of the applied load. Probably, the scratching impact on the composite materials and increased COF of the basalt-reinforced HDPE composites were caused by the hard basalt filler particles that might be separated from the matrix during the wear test.
43
The contour diagram offers the flexibility to pick the proper operating parameters for the composite's ideal sliding circumstances and the potential to regulate the COF of this composite by choosing the proper filler ratio, applied load, and distance following the sliding speeds. Similarly in the plot Figure 13(b), the COF value is found to be reduced at the lowest filler contents and lowest speed parameters. The hard basalt particles are the sole reason for the rise in COF value along with the elevated temperature at the interface. Similar variations are also observed in the contour plot of distance versus basalt wt% in response to COF (Figure 13(c)). In all three cases, the maximum basalt filler reinforcement promotes the higher COF value irrespective of the other parametric values. Contour plots in response to COF: (a) COF versus load, basalt wt%, (b) COF versus speed, basalt wt%, and (c) COF versus distance, basalt wt%.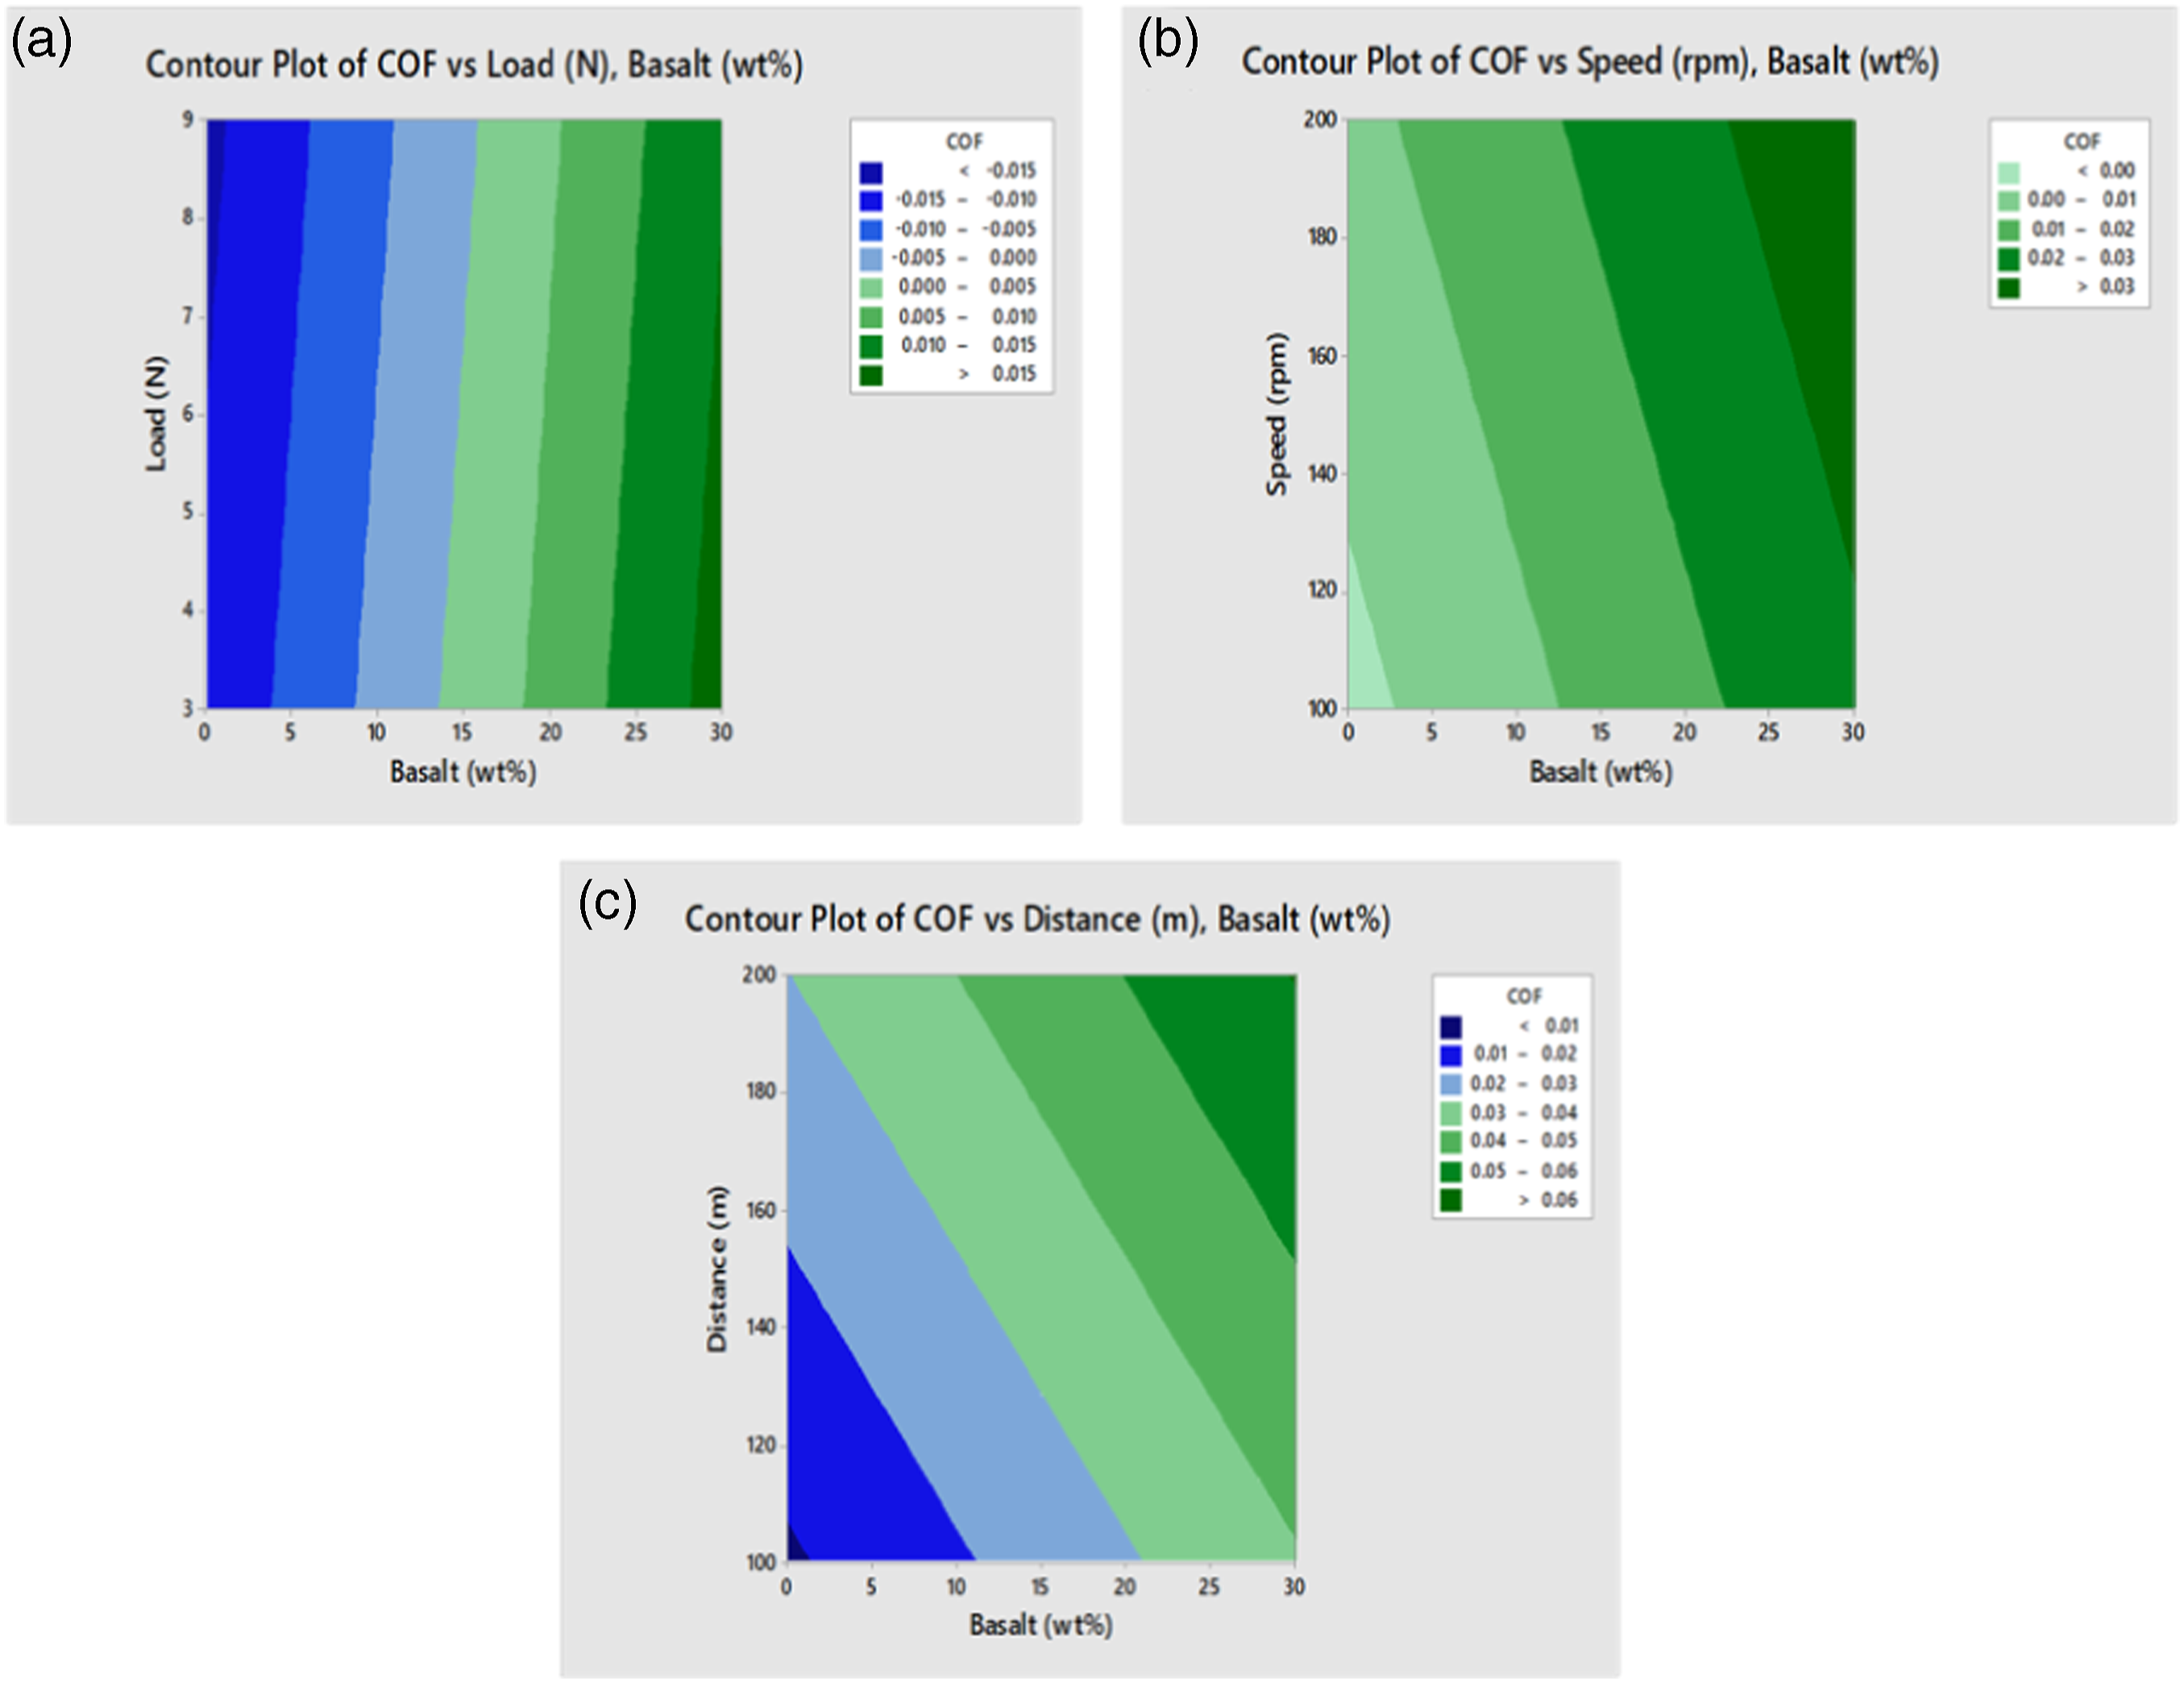
It was observed from Table 11 that the SWR values of HDPE samples got decreased with the addition of 30 wt% basalt fillers reinforcement even with the different processing variables. The effects plots of each parameter on SWR obtained from Taguchi analysis are provided in Figure 14(a). The maximum S/N ratio implies the lowest possible SWR values. The optimum parameters obtained are 30 wt% basalt, 6 N load, 100 r/min speed, and 150 m distance. Among these parameters, the basalt wt% is found to be with most impacting one by showing the maximum slope and distance among the levels. The least impact parameter on the SWR response is speed which exhibits a lower slope among the levels. The order of impact level as per the effect plot is basalt wt% > distance > load > speed. Figure 14(b) displays the plot of the interaction effect of the control parameters for the SN ratio. In interaction plots, interactions don’t happen while the lines exist in parallel, but when they cross, there are significant interactions among the control factors.
44
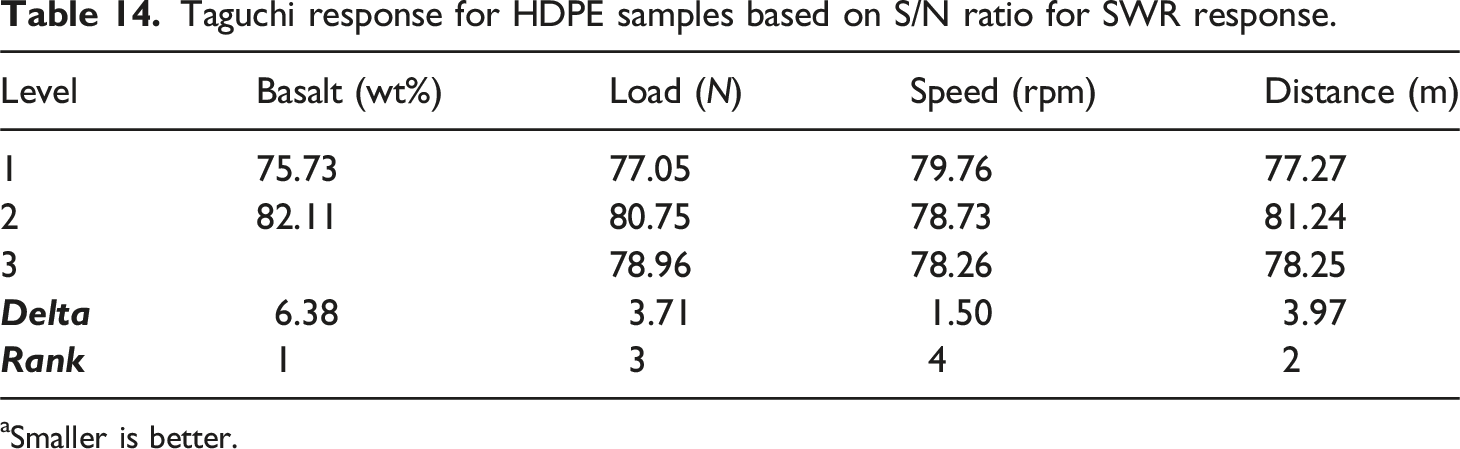
But in this case, most of the lines are cross-linked which indicates the strong interaction among the parameters. The response obtained from the Taguchi technique in determining the significant parameter is tabulated in Table 14. The basalt wt% parameter achieved a delta value of 6.38, it is a maximum one among the other parameters and given a rank of 1. Hence, it confirms that the filler particles paid a significant contribution to reducing the SWR of HDPE samples. The second highest delta value of 3.97 is found with the distance parameter indicating the second impact parameter and allotted to rank 2. The third and fourth impact parameters are load (rank 3) and speed (rank 4) which possess a delta value of 3.71 and 1.50 respectively. (a) Main effect plot, and (b) Interaction plot for HDPE samples in response to SWR. Taguchi response for HDPE samples based on S/N ratio for SWR response. aSmaller is better.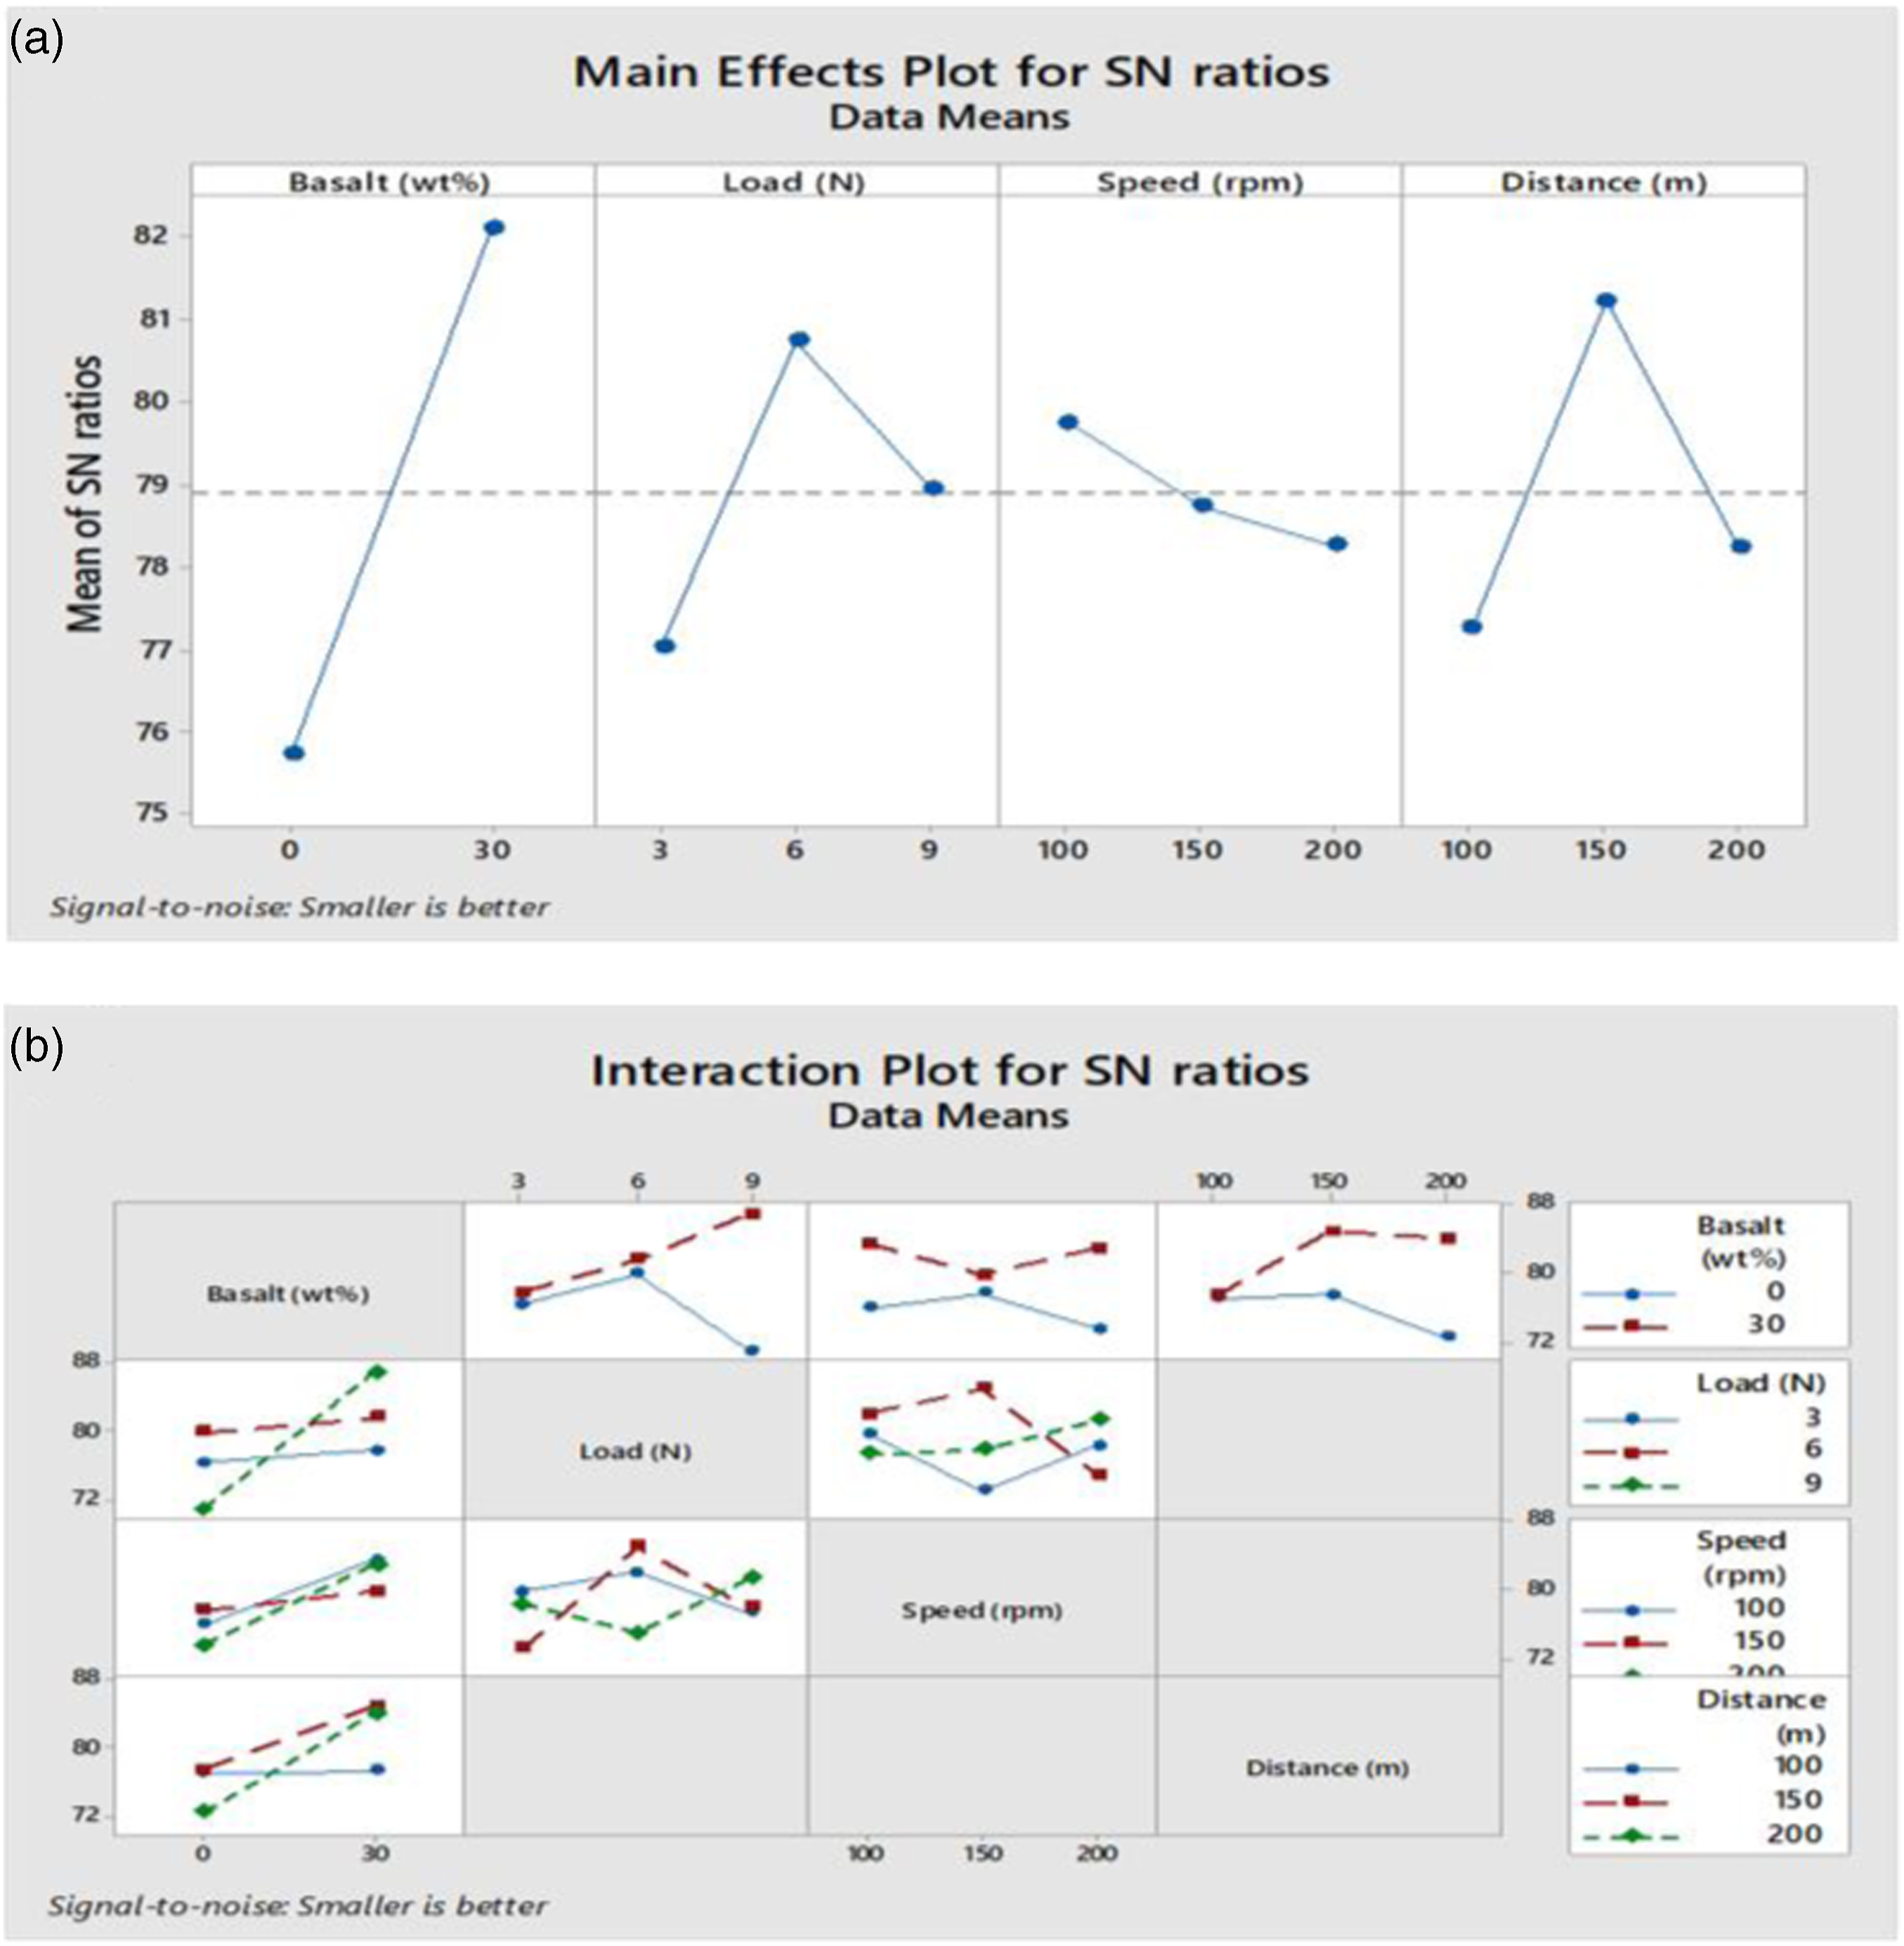
ANOVA results of HDPE samples in response to SWR.
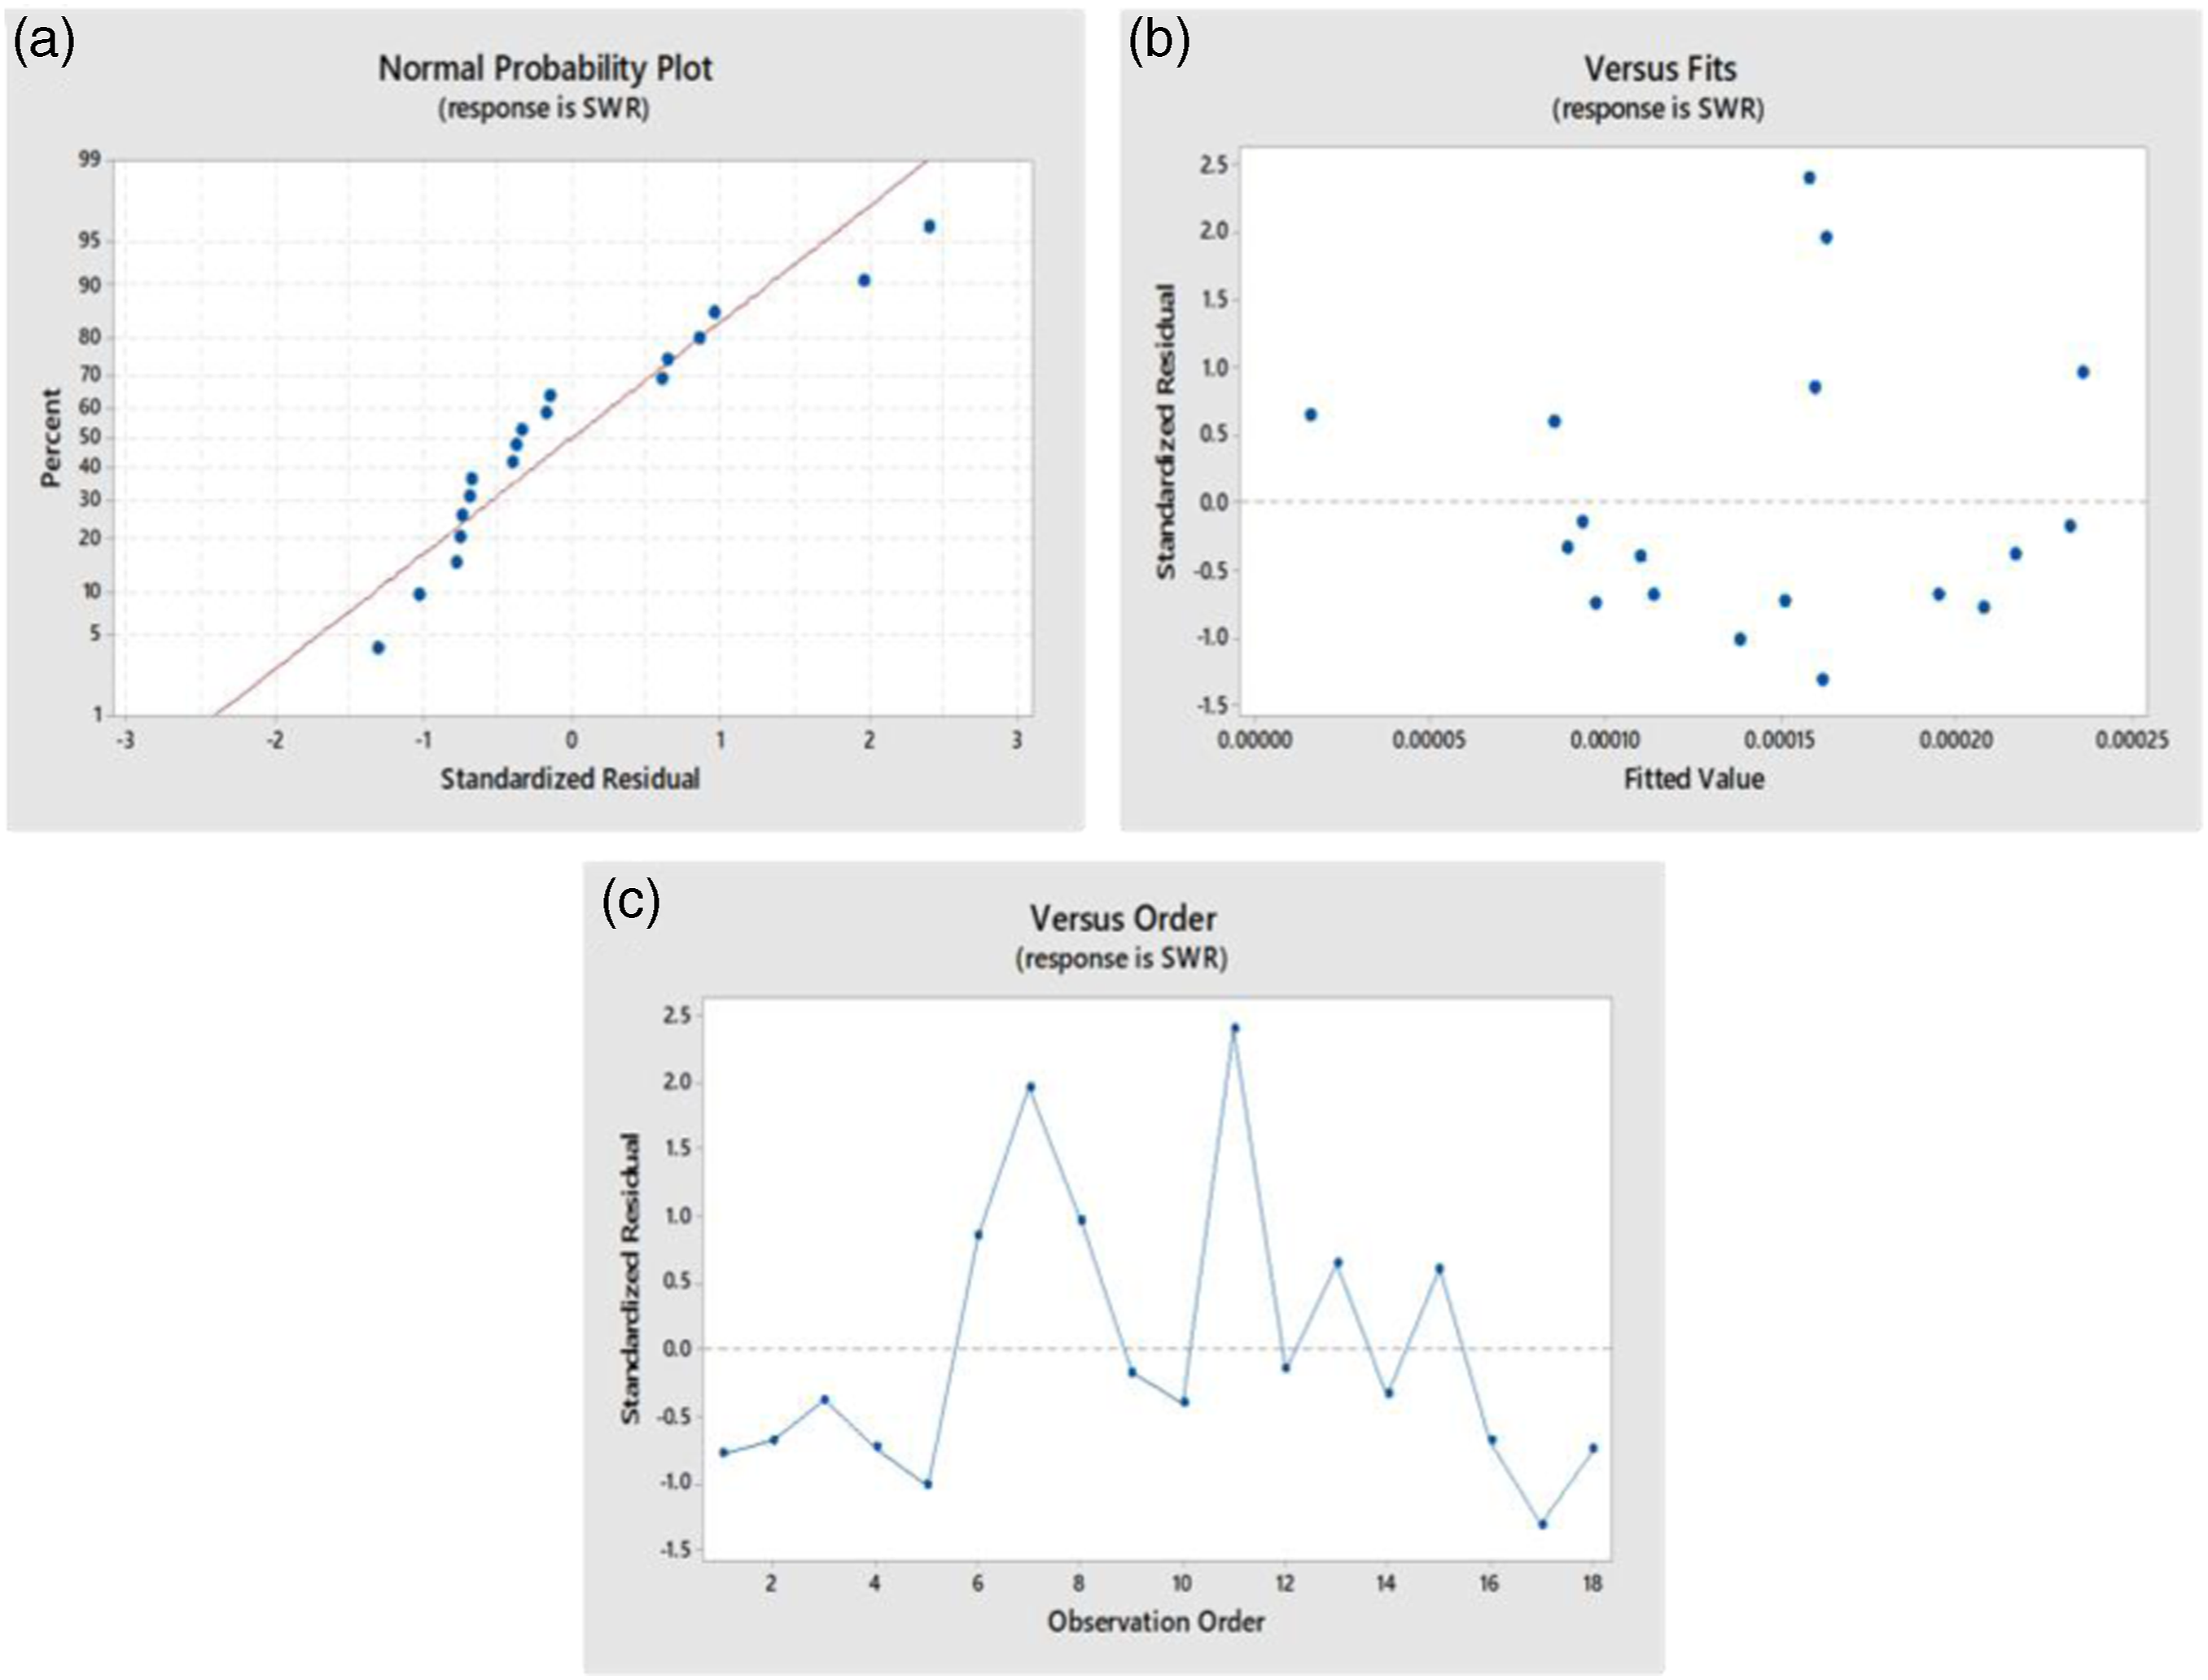
SWR model plots for HDPE samples: (a) Probability, (b) Residuals versus fits, and (c) Residuals versus order.
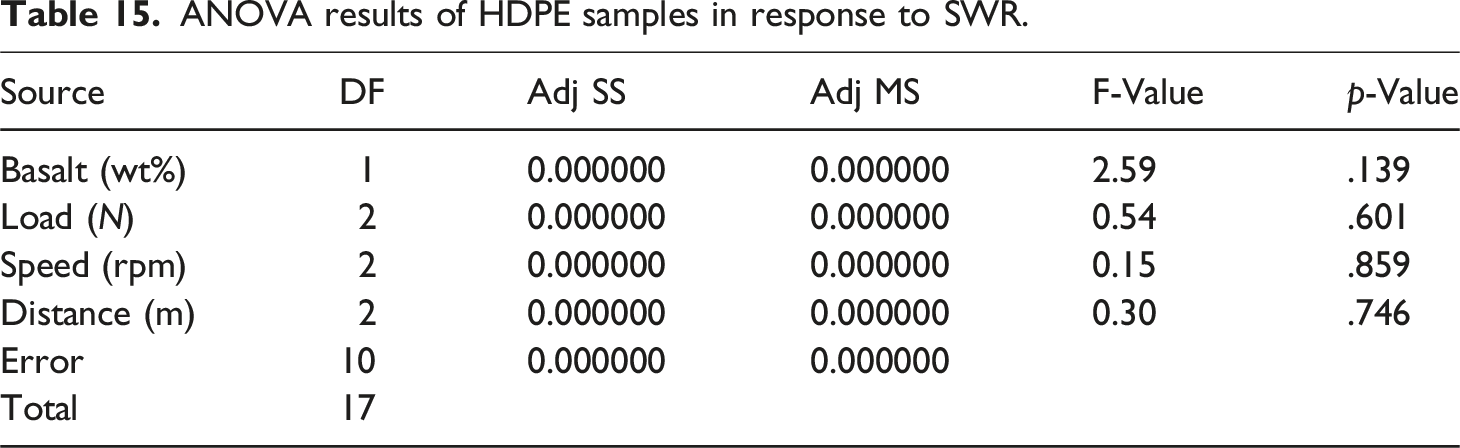
Figure 16 illustrates the 2D contour plots of basalt wt% concerning other parameters in response to SWR. Figure 16(a) reveals that the load parameter seems to be independent of the basalt wt% irrespective of the SWR values. There are two possibilities, either the load parameter is not significant or it is an independent variable. The minimum SWR is found with 30 wt% basalt filler reinforcement with all the levels of load parameter. The vertical light green color region is indicated with the lowest SWR. Whereas there is a strong interaction among the basalt wt% and speed parameters as indicated in Figure 16(b). The lowest COF is recorded above the 25 wt% filler reinforcement, and it is continued to be low with an increase of both speed and basalt wt%. As per the plot in Figure 16(c), the lowest SWR is also found with 30 wt% basalt and the lowest travel distance. With a decrease in basalt weight percentage and an increase in distance traveled it is observed that the vertical green color zone indicating lower SWR value becomes wider. In all three plots, the common observation is that the lowest and highest SWR value begins with the 30 wt% and 0 wt% basalt reinforcement respectively. The confirmation experiment is executed for SWR response because the optimum parameters are found in the designed array. The experimental and predicted values with the error% are tabulated in Table 16. The error of 7.19% is found with the difference between experimental and predicted values which is in the statistical limit. Contour plots in response to SWR: (a) SWR versus load, basalt wt%, (b) SWR versus speed, basalt wt%, and (c) SWR versus distance, basalt wt%. Confirmation test for SWR response to HDPE samples.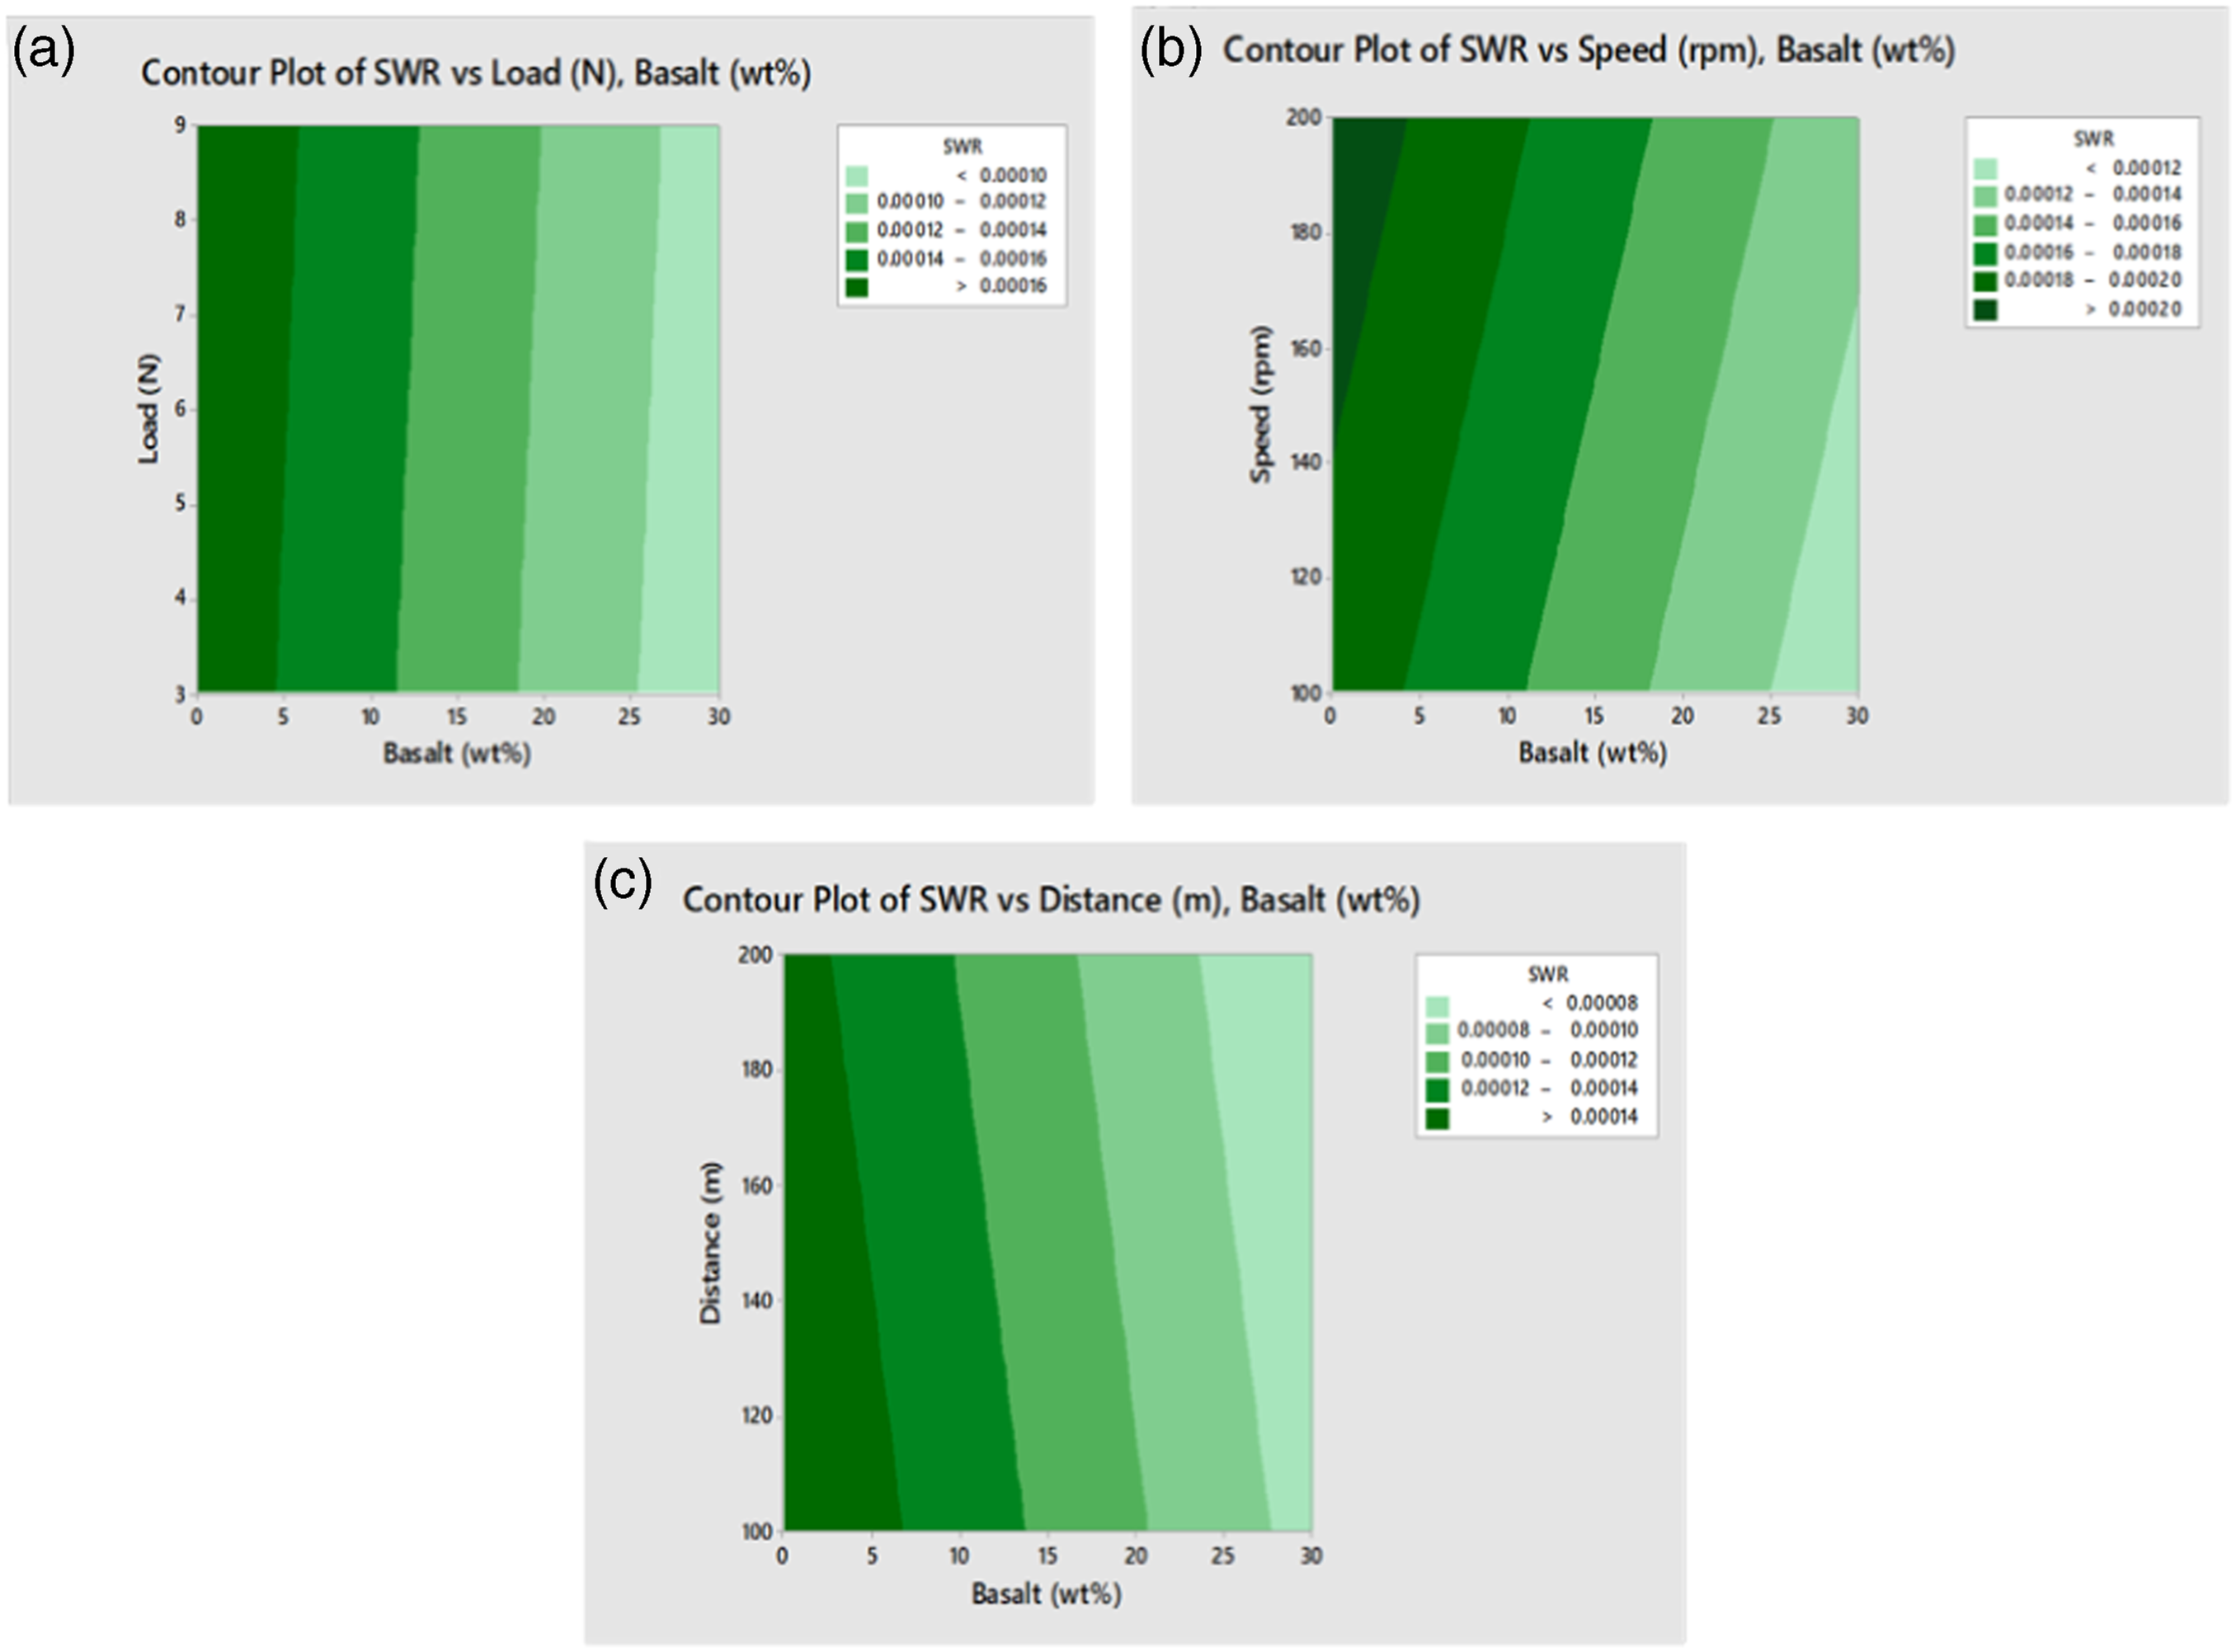
COF graph, SEM morphology, and 2D profile of L18 OA designed for HDPE samples.
According to the experimental data, the lowest COF is observed in run nine and the morphology of this run appeared with a smooth surface without any deeper grooves and the debris formation on the wear track. Whereas the morphologies with maximum COF in run 18 are observed with adhesive wear mechanism with moderate grooves and abrasive scratch appearance. Also, the SWR is found with this run due to basalt fillers resistance and the depth of profile is nearly −55 μm. Even though the depth of profile is less in run 11 (maximum SWR), the wear track width is found to be higher than in run 18, and also the pulled-out basalt particles are observed in the wear track edges. Moreover, particle aggregation can also be observed on the wear edges due to the higher speed and the erosive behavior on the polymer surface. In runs 2, 3, 5, 6, 7, and 8, the more polymeric transfer thin layers are observed with the appearance of sharp edges because of repeated softening action and multiple grooves over the same track. In contrast to pristine HDPE samples, the wear process for filler-loaded composites involves less micro-plowing and material loss. 45 As discussed in the density and void fraction analysis, the presence of the void is more in the composite samples and is observed with the morphologies in runs 9, 10, 13, 16, 17, and 18. The worn surfaces of the composites have plowed lines and cracks that are brought about by the micro-cutting and micro-plowing activity of the erosive asperities counterface. In addition to surface characteristics, the transfer films created during sliding also significantly influence the mode of sample wear. The basalt fillers present in the HDPE polymer were conveniently transported to the counterface and contacting zone of the composite during the sliding process and quickly disengaged from the composite surface. As a result, the fillers act as a solid lubricant between the meeting interfaces, preventing direct contact between them, which lowers the coefficient of friction and increases wear resistance. 46
Conclusion
The presented work describes the evaluation of the coefficient of friction and specific wear rate of two thermoplastic polymers (PP, HDPE) and their composites strengthened with 30 wt% consistent basalt filler reinforcement. The produced composites have higher densities and larger voids as a result of the basalt filler’s enhanced weight ratio. Basalt’s rigidity as well as stiffness have significantly aided in raising the hardness of composites by providing a barrier against indentation. The tribology test is executed on the pin-on-disc tribometer as per L18 configuration for both neat and composite samples. MINITAB-19 is helpful in designing, optimizing, and analyzing the obtained results. The optimum values were achieved for the PP samples at 0 wt% basalt, 9 N load, 200 r/min speed, and 100 m distance in reaction to COF. Whereas the optimum response for SWR is found at 30 wt% basalt, 6 N load, 100 r/min speed, and 200 m distance. For COF and SWR responses in PP samples, the most important variables are load and basalt wt%, respectively. For the SWR response, the optimal conditions are 30 wt% basalt, 6 N load, 200 r/min speed, and 150 m distance, whereas the COF response for the HDPE sample is optimum at 0 wt% basalt, 6 N load, 100 r/min speed, and 100 r/min distance. The parameter with the greatest influence for both the COF and SWR responses is basalt wt%. The applied load had a significant impact on the profile’s depth, as greater load values resulted in deeper wear tracks. The optimum variables that are not seen in the proposed orthogonal array were subjected to confirmation tests, which produced error rates that were lower than 10% and within the limits of statistical acceptability. The majority of PP morphologies show micro-deformation, ductile-yielding, and the capacity to peele off the soft PP matrix. It implies that sticky wear makes up a significant portion of the wear process. When polymer matrix composites spin over the pin surface, it is known that the two primary wear processes are adhesion in the contact zone and erosion by the asperities on the pin. The HDPE morphologies are present with smooth surfaces with little debris development because the HDPE polymer has a lower softening temperature and is sensitive to heat fluctuations. On the composite surfaces filled with filler, larger lumps of polymer wear debris may be seen in particular. These lumps most likely consist of worn material that has migrated into the pin-on-disc test’s contact site in patches.
Footnotes
Declaration of conflicting interests
The author(s) declared no potential conflicts of interest with respect to the research, authorship, and/or publication of this article.
Funding
The author(s) disclosed receipt of the following financial support for the research, authorship, and/or publication of this article: This work was supported by the King Mongkut’s University of Technology North Bangkok (KMUTNB), Thailand under Grant No. KMUTNB-PHD-65–02. This research budget was allocated by National Science, Research and Innovation Fund (NSRF), and King Mongkut’s University of Technology North Bangkok (Project no. KMUTNB-FF-67-A-01).