
Abstract
The main goal of this research is to utilize sustainable and eco-friendly basalt materials for the fabrication of bio-based thermoplastic composites. This will help to keep up with ecologically balanced factors. There have been several studies on natural fiber reinforced with different polymer matrices during the past 10 years. As a result, the academics and experts expressed concern about the environmental imbalance. By keeping these points, an attempt was made to fabricate basalt fillers reinforced polylactic acid composites with the maximum weight ratio (30 wt %), and the tribological study is conducted for the fabricated composites. In this study, the Taguchi and analysis of variance (ANOVA) approaches have been used to analyze the coefficient of friction (COF) and specific wear rate (SWR) of polylactic acid composite reinforced with constant 30 wt% basalt fillers. The morphology, particle size, and elemental composition of the basalt fillers are examined using scanning electron microscopy, a particle size distribution analyzer, and energy-dispersive X-ray analysis, respectively. The tribology tests are conducted with Pin-on-Disk Tribometer following the ASTM G99 standard, following the L18 orthogonal array design, which was developed using the statistical program MINITAB-19. The selected parameters for the analysis are basalt (wt %), load (N), speed (rpm), and distance (m) under dry conditions. For PLA samples, the optimum parameters in response to COF is found to be 0 wt% basalt, 3 N load, 100 rpm speed, and 100 m distance; for the SWR output, the optimum parameters are 30 wt% basalt, 6 N load, 100 rpm speed, and 150 m distance. The consistent observation is that adding basalt fillers has not significantly reduced COF but has contributed more to SWR reduction with PLA composite. The best COF value for PLA samples is obtained with low sliding distance. The typical observation across all COF graphs is that the COF value first seems to be lower due to a smoothened polymer surface, rises throughout an experiment, and then stabilizes with very little variance. Regardless of the processing parameters, the depth of wear steadily increases with increasing load as observed in 2D depth profiles. The neat PLA polymer morphology that gives the illusion of deep grooves and many tracks dispersed over a single worn surface shows how the maximum parameter influence is more obvious on the surface of the sample. Overall, the results suggest that thermoplastic composites are feasible for the manufacturing of paper mill rollers.
Introduction
In the technologically advanced era, there is an increasing need for polymer composite structures with beneficial characteristics due to the expanding use of plastic goods. Due to their effective characteristics and cost-effectiveness, polymer composites have seen a rapid expansion in use during the past few years. 1 The polymer composites are generally employed with two types of matrices, such as thermoplastics and thermosets. Since thermoplastic composites offer several benefits than thermoset composites, they have recently emerged as the most in-demand material. Thermoplastic composites are chosen because of their superior resonance damping, excellent shock resistance, efficiency, substantial damage compassion, recycling capabilities, reformability, and affordability compared to thermoset composites. These qualities intrigued its usage for advanced use, such as the manufacture of the fuselage and wing portions of an aircraft.2,3 Although thermoset composites continue to dominate the aerospace sector, thermoplastic composites are anticipated to become the go-to material for addressing the large-scale production requirements of passenger automobiles. 4 The physical link between the molecules in thermoplastics is transitory and may be broken by the application of temperatures, chemicals, or external forces. The polymer becomes softer, making thermoforming or fusion joining possible. In comparison to thermoset-based constructions, this feature permits an automated production chain and cheaper manufacturing expenses.5,6 Since thermoplastic composites are employed for many complex structural applications in place of metals, there is concern about the material’s frictional and wear properties. In comparison to metal, polymer tribology is more complicated and less known in terms of the processes causing friction and wear. Polymer/metal contacts typically do not adhere to the widely recognized “Laws of Friction” that govern the tribology of both ceramic and metal interfaces in relative movement. There could be multiple explanations for this, involving notably the relative softness of polymers in comparison to metals, respective substantially lower thermal conductivities related to heat production in interactions, and their melting temperatures.7,8 The operational factors, such as the force being applied, velocity, distance, temperature, and duration, affect the tribological properties of thermoplastic composites to achieve effective wear resistance and the lowest coefficient of friction. Moreover, the thermal and thermo-mechanical properties such as thermal elongation, heat deviation, and loss of weight, are significant in a variety of applications, including heating systems and friction components. 9 By the consideration of all these factors, the synergy of filler reinforcement in thermoplastic polymers has gained much importance to compensate for most of the raised concerns.
To achieve desired benefits, especially quality and actions in terms of tribological performance, researchers are investigating suitable tribe-fillers to be included in thermoplastic polymers. Researchers have also compiled a long list of organic and synthetic substances that might be used with thermoplastics to enhance their characterization.10,11 Conventional fillers are frequently employed to enhance their mechanical, thermal, and tribological qualities, particularly under severe working circumstances. These fillers include metallic powdered filler, mineral filler, carbon fiber, or natural fibers. Fillers have a large surface area to volume ratio, which allows them to have a substantial impact on the tuning of characteristics even at extremely low filler loadings. 12 Many research works have been reported on tribological properties study on fillers loaded thermoplastic composites. Suresha and team 13 studied the influence of graphite, short carbon fiber (SCF), and nanoclay (NC) micro/nano fillers on the tribological properties of polyamide66/polypropylene polymers. They claimed that the PA66/PP blend’s wear rate was decreased by the addition of micro and nanofillers. Moreover, the higher wear loss was accounted for by increased sliding velocity. Among these three fillers, SCF and NC fillers played a major role in reducing the wear rate of polymer blends. Syed and his colleagues 14 demonstrated that the use of turmeric spent (TS) fillers as reinforcement in engineering thermoplastic composites has promising wear properties and may be a helpful alternative to conventional fillers. The debonding of TS from the matrix was reported to be prevented at lower filler loadings due to greater filler and matrix adhesion. Even the asperities’ passage has been obstructed by a smaller filler loading, which has decreased material loss. In an intriguing investigation, 15 the biggest relative rise in crystallinity was induced by the inclusion of graphene oxide, which subsequently lowered the coefficient of friction by 50% when compared to pure polyamide polymer. The wear debris that developed into microfibers throughout this composite’s sliding test served as rollers to reduce friction by dividing the mating components. To get the optimized values within fewer experimental runs, Sudeepan and team 16 utilized Taguchi and ANOVA techniques to study tribological properties on clay fillers reinforced ABS thermoplastic composites. It has been found that the usual load, subsequently followed by filler ratio and sliding speed, has the greatest influence on tribological attributes. Additionally, examinations using scanning electron microscopy (SEM) disclose the wear processes for the worn surfaces of ideal parameters and demonstrate that micro-cutting and tiny grooves following the filler loading are potential causes for the reduction of COF and wear rate. The above researcher group also utilized the grey regression optimization technique for the tribological analysis of calcium carbonate fillers reinforced ABS thermoplastic composites. 17 Arul Jeya Kumar and team 18 also reported the tribological properties of basalt fiber reinforced PLA composites with chitosan filler materials. The findings demonstrated that raising the weight ratio of basalt and CS in PLA was crucial in boosting wear resistance. In the circumstances of extreme damage and ultra-severe wear, it is shown that fibers are predominantly damaged at higher levels of pressure and sliding velocities. Fibers-matrix breaking down and fiber breakage were the main effects of the ultra-severe regimes. Jenson Joseph and Panneerselvam 19 also utilized the Taguchi approach to study the effect of tungsten particulates on the high density polyethylene polymer. The L16 orthogonal array was utilized for the design of experiments, and ANOVA results revealed that the load was the most dominating factor followed by filler wt% and travel distance. The degree of wear diminishes with the increase of tungsten material, according to worn surface morphology.
The literature review on the tribological study revealed that most of the works were done with the reinforcement of inorganic and organic particles with limited thermoplastic polymers. With various thermoplastics, it is discovered that there is less work with mineral fillers. Moreover, the influence of basalt fillers on the tribological properties of thermoplastic composites is not yet explored completely. The growing practice of improving polymer composites during the past 10 years with the aid of natural fibers sourced from plants as well as animals has caused an ecological imbalance. Therefore, in order to reduce the amount of polymer ratio in products and increase their economic viability, academics and industry professionals are need to focus on the reinforcement of naturally occurring mineral materials in polymer products. This will help keep up with ecologically balanced factors. In reality, adding basalt material to various polymer matrices is an extremely original idea that may lead to some unexplored, highly intriguing areas. By lowering the polymeric ratio in the goods without significantly changing their fundamental features, basalt contributes to the creation of a pollution-free environment and the balancing of ecological concerns. Since basalt is a naturally occurring, environmentally beneficial material that is widely accessible, there is a chance to use it as a filler reinforcement with other thermoplastics to preserve ecological balance and create novel, lightweight products. Basalt is environmentally beneficial since it can be recycled far more effectively than glass fibers. Basalt is reasonably priced and possesses outstanding qualities like resistance to corrosion, rigidity, low water acceptance, and the capacity to tolerate high temperatures, offer thermal insulation, and attenuate sound. 20 Therefore, this innovative study explores the use of basalt as a filler reinforcement for the creation of polylactic acid composite, as well as the impact of this filler on the tribological properties of this polymer. This study also utilizes the Taguchi optimization technique to analyze the optimum parameters and the ANOVA technique to study the significance of each parameter. Moreover, the worn surface morphology of all the experimental runs is analyzed using scanning electron microscopy (SEM) images, and the depth profile of the worn surface will be analyzed using a 2D depth profile plot obtained from a profilometer.
Materials and fabrication method
Materials
The current tribological investigation is done on the bio-based thermoplastic polymer (polylactic acid (PLA)) reinforced with a constant 30 wt% basalt filler (PLA + B30). The basalt material in the form of fiber powder was purchased from Huabin General Machinery & Equipment Import & Export Co. Ltd., China. Basalt possesses a higher density of 2.6–2.8 g/cc, which is approximately two times more than the thermoplastic’s density. The major properties of basalt include extreme strength, exceptional stiffness, elevated strain rate, heat resistance up to rupture, excellent stability, beneficial resistance to chemicals, non-hazardous and environmentally friendly, as well as simplicity to manufacture in all sorts of matrix materials. 20 Nature Works, LLC provided the bio-based polylactic acid of grade 2003D in the pellet form. The PLA possesses a MFI of 6 g/10 min, a density of 1.24 g/cc, a glass transition temperature of 55°C, an elongation of 6%, the tensile and elastic modulus of 53–60 MPa and 3.5 GPa respectively.
Fabrication method
The PLA + B30 composite was fabricated via two major processes such as internal mixing and compression molding techniques as shown in Figure 1. Majorly, the whole process comprises approximately six steps as illustrated in the flowchart. The procured basalt was initially sieved to obtain the uniform particle size using a vibratory siever. To achieve full particle size filtering, the timeframe was set to 20 min. To filter in different stages, three levels of mesh sizes were used: <63 μm, 63–75 μm, and >75 μm. The obtained thermoplastic matrix was subsequently dried in a hot air oven to make sure that the materials were free of moisture because they contained more moisture-sensitive components. All three matrices were dried in an oven at 50°C before proceeding with the internal mixing process. The internal mixing of basalt with different polymer materials was done according to the melting temperature conditions as prescribed by the suppliers. The PLA-based composites were internally mixed at 180°C with 50 rpm speed for 8 min. Since the internally mixed composites are allowed to cool at room temperature, there may be a chance of moisture absorption by these matrices. Hence, these composite pellets are again dried in an oven at 50°C overnight before starting the compression molding process. The mold of 200*200*3 mm size was prepared with silicone spray and PVC sheets as illustrated in the third step. For all the types of polymer composites, the compression molding was done majorly with three steps (pre-heating, compression, and cooling). The PLA-based composites were pre-heated at 180°C (5 min), compressed at 180°C with 2500 psi pressure (8–10 min), and cooled to room temperatureFinally, the prepared composites were prepared as per the ASTM standard dimensions for testing purposes. Thermoplastic composites fabrication process.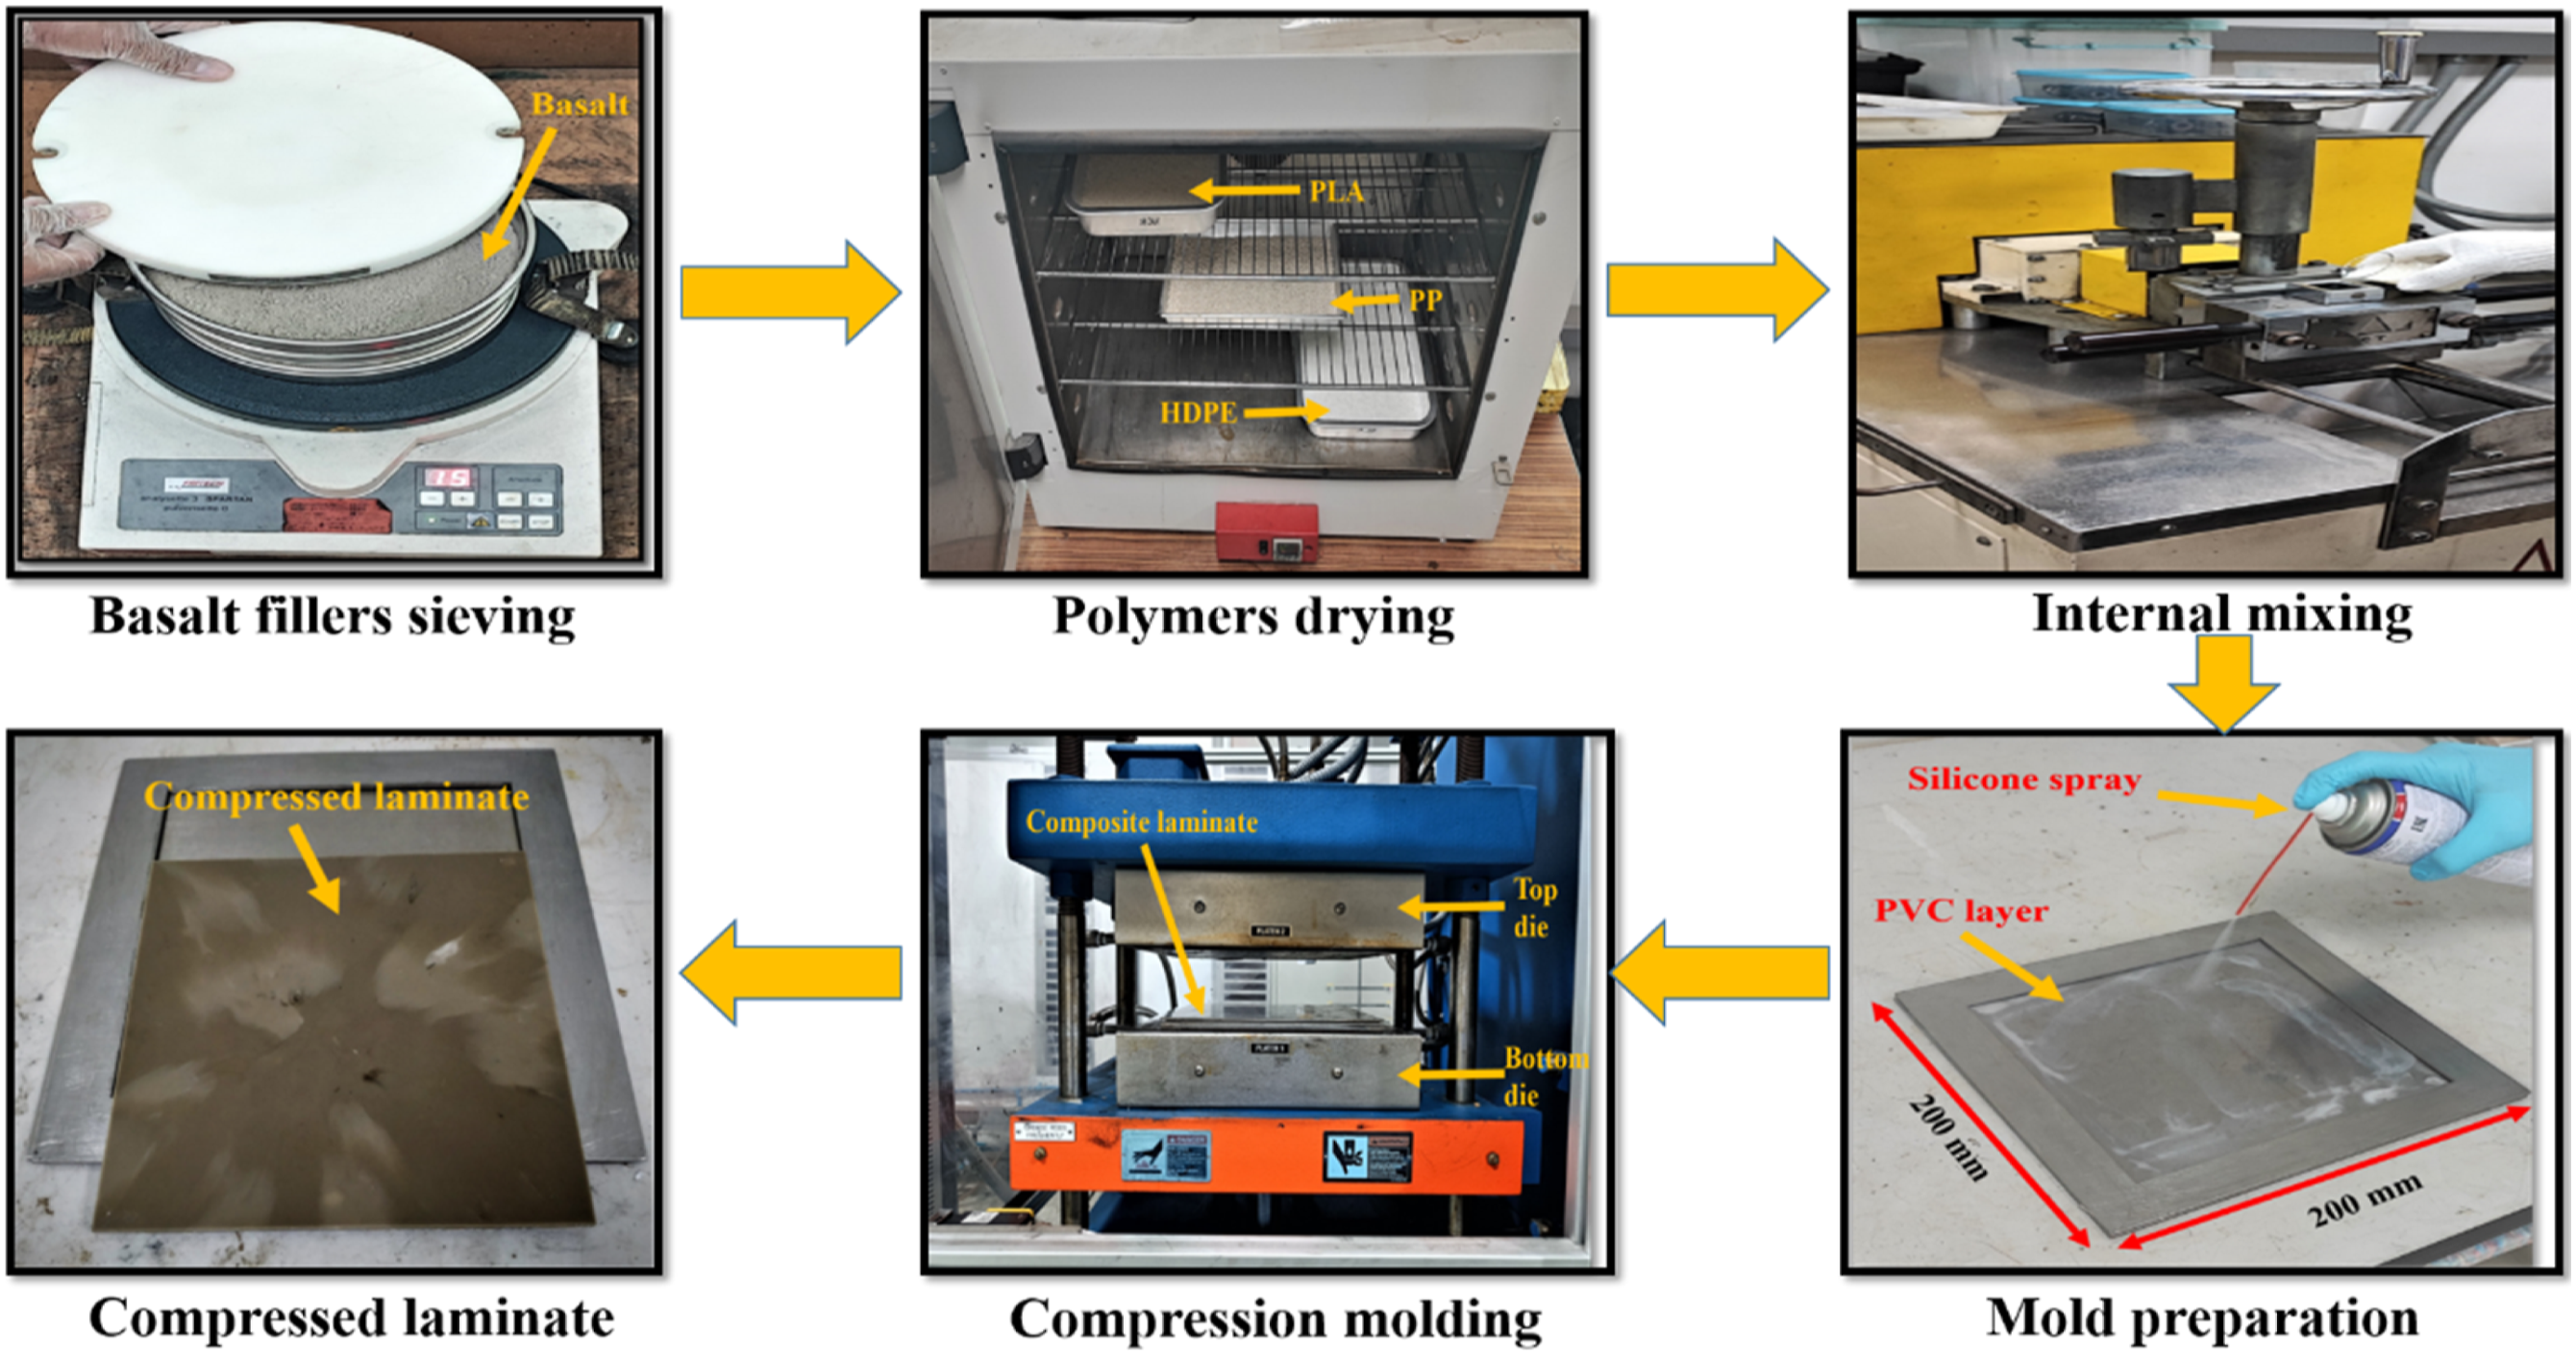
Design and experimentation
Filler characterization
The basic characterizations of the morphology of basalt filler are provided in Figure 2. The morphology of basalt filler is analyzed using Scanning Electron Microscopy (SEM- Quanta 450) with 20 kV voltage as shown in Figure 2(a). Most of the particles appeared to be in an irregular shape with dimensions less than 10 μm concerning magnification size. Moreover, particle aggregation can be seen in multiple locations. The particle edges are sharp and the surface texture is not uniform in most of the particles. The accurate particle size of this basalt filler is analyzed using a particle size distribution analyzer (LA-350), and the result is provided in Figure 2(b). The median and mean sizes obtained from the analyzer are 6.4765 μm and 8.1031 μm respectively. The differential % varies below 14% among the comparisons as shown in the plot. As per the analysis, the cumulative % is linearly varied up to 30 μm particle size and remains constant for further sizes. The elements present in this basalt filler are analyzed using Energy dispersive X-ray analysis by utilizing SEM equipment. Oxygen and silicon are the main constituents that are present in higher weight ratios of 43% and 19.9% respectively. The least amount of wt% (0.3%) is recorded for nickel elements with an atomic ratio of 0.1%. The intensity variation concerning different elements is shown in Figure 2(c). The remaining constituent elements are carbon, nitrogen, sodium, magnesium, potassium, calcium, titanium, iron, copper, and aluminum. Filler characterization: (a) SEM analysis, (b) particle size distribution analysis, and (c) energy dispersive X-ray analysis (EDX).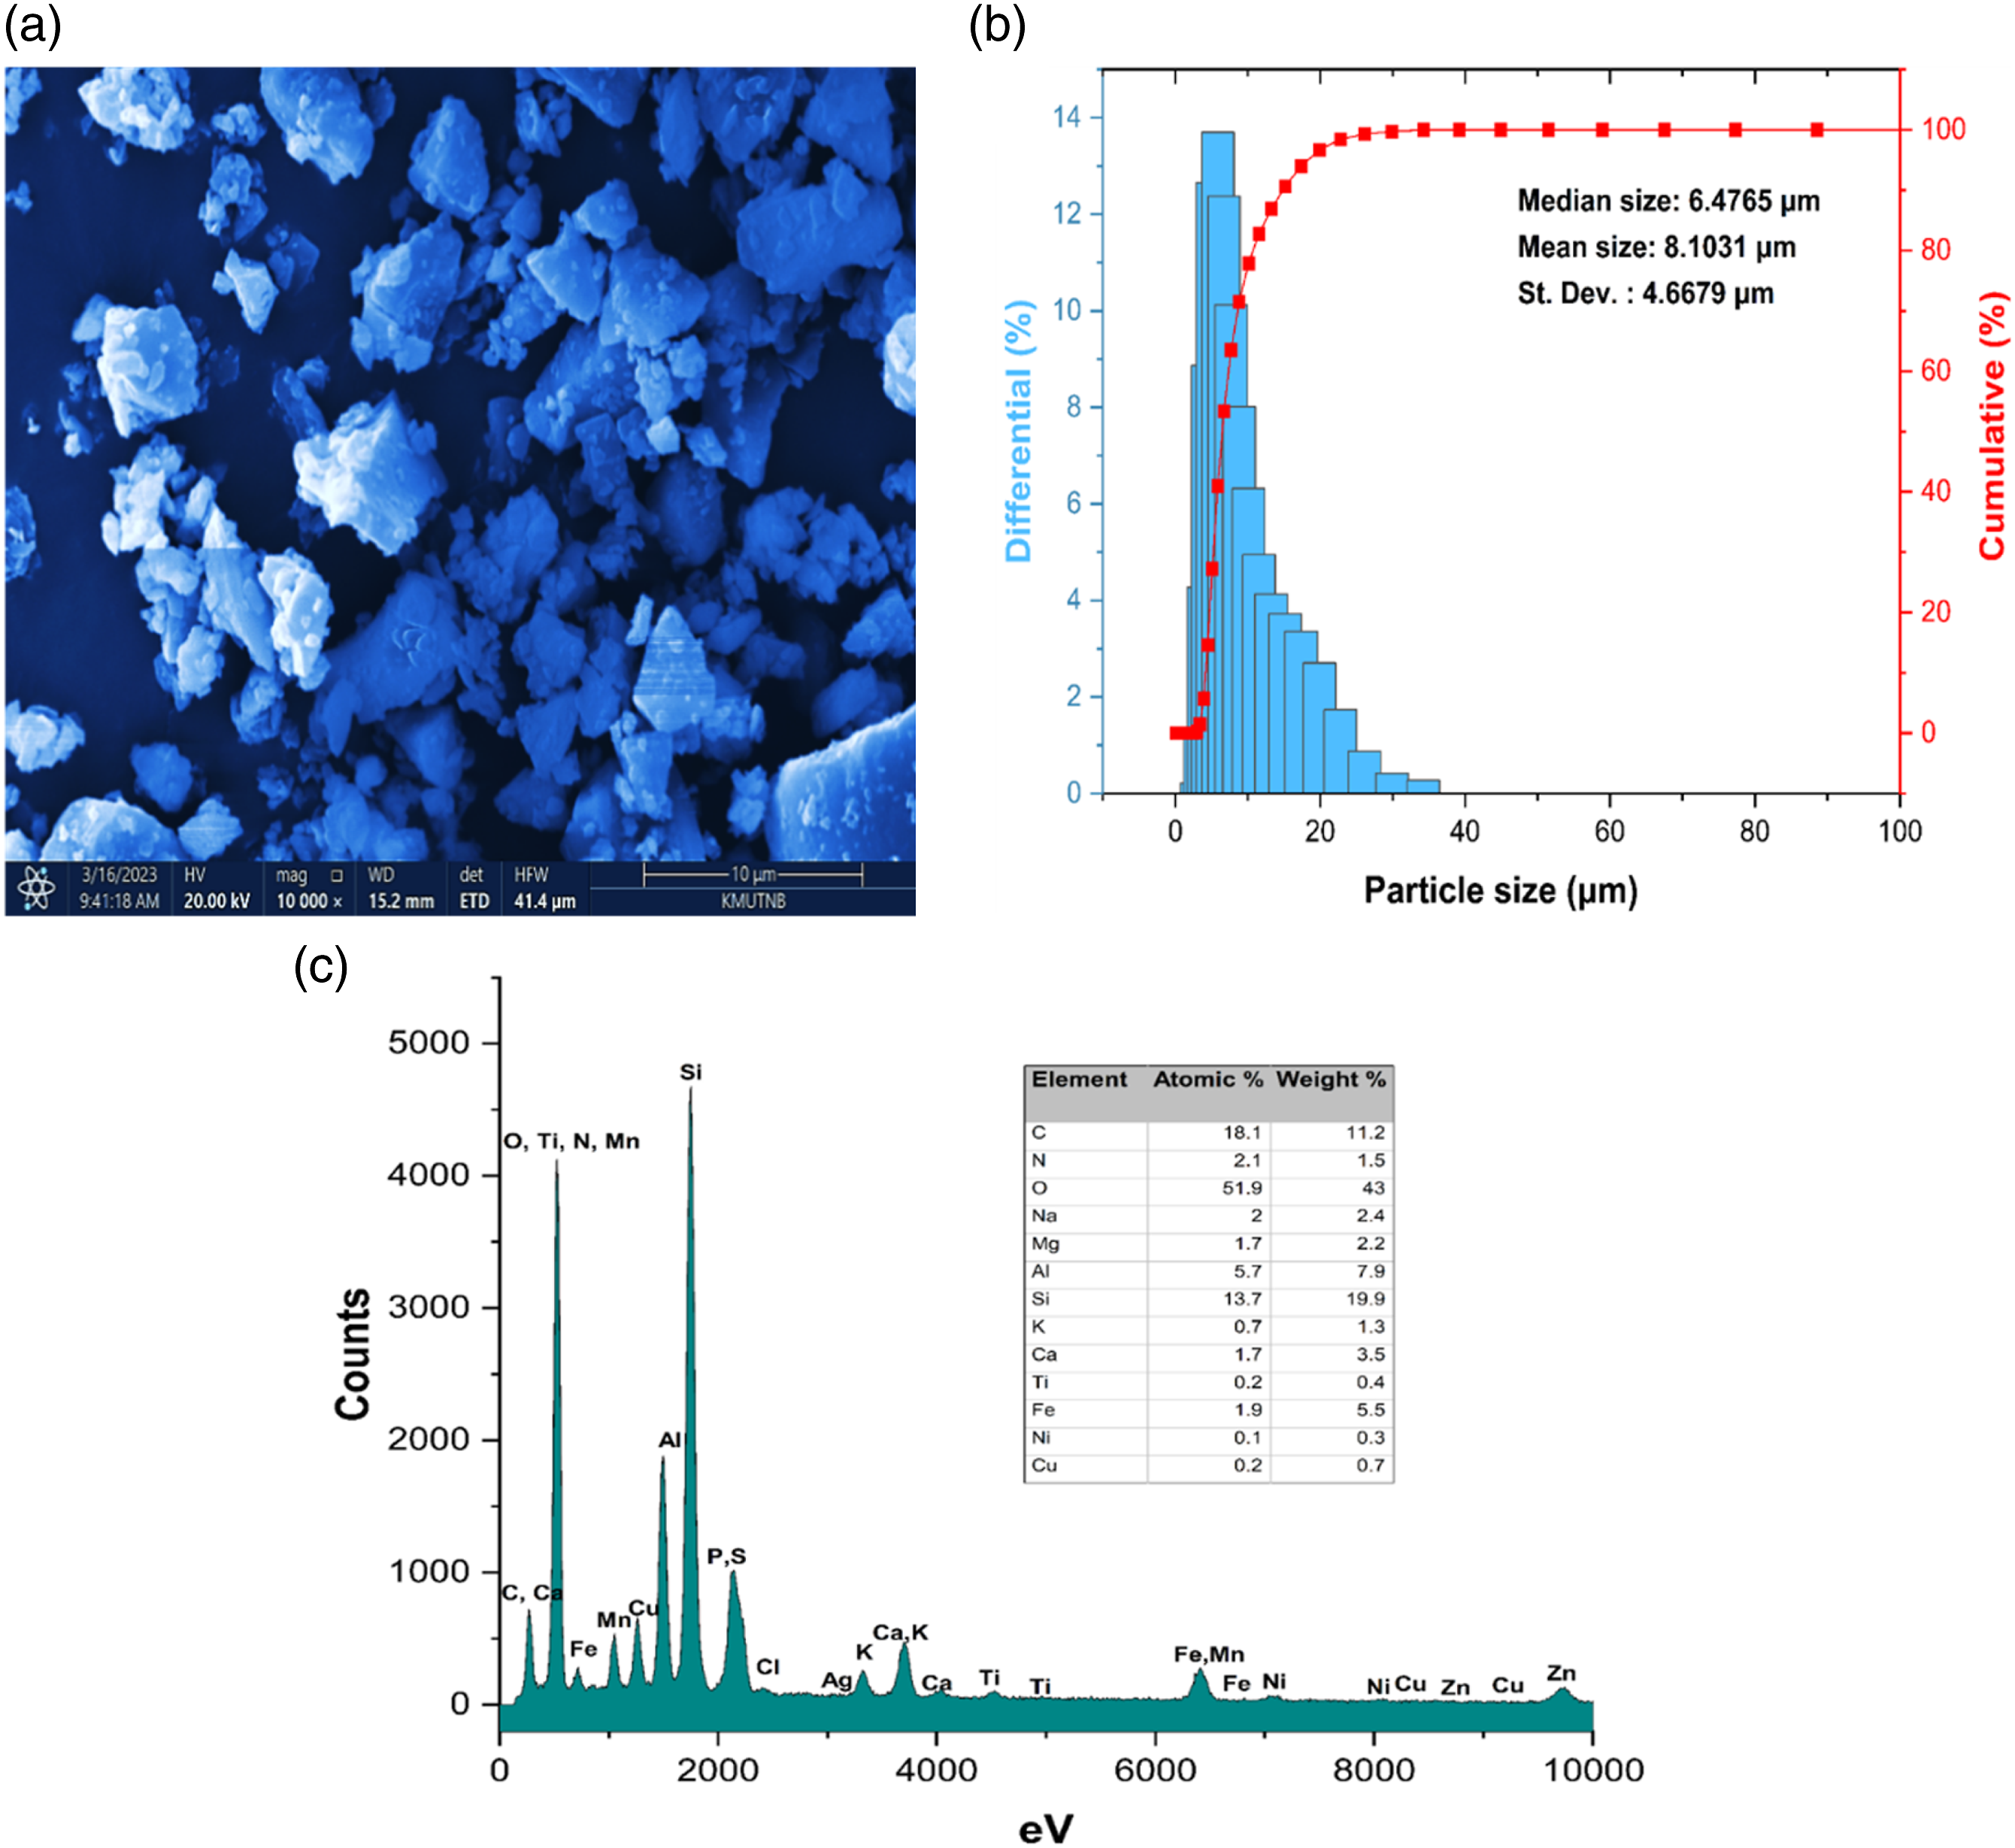
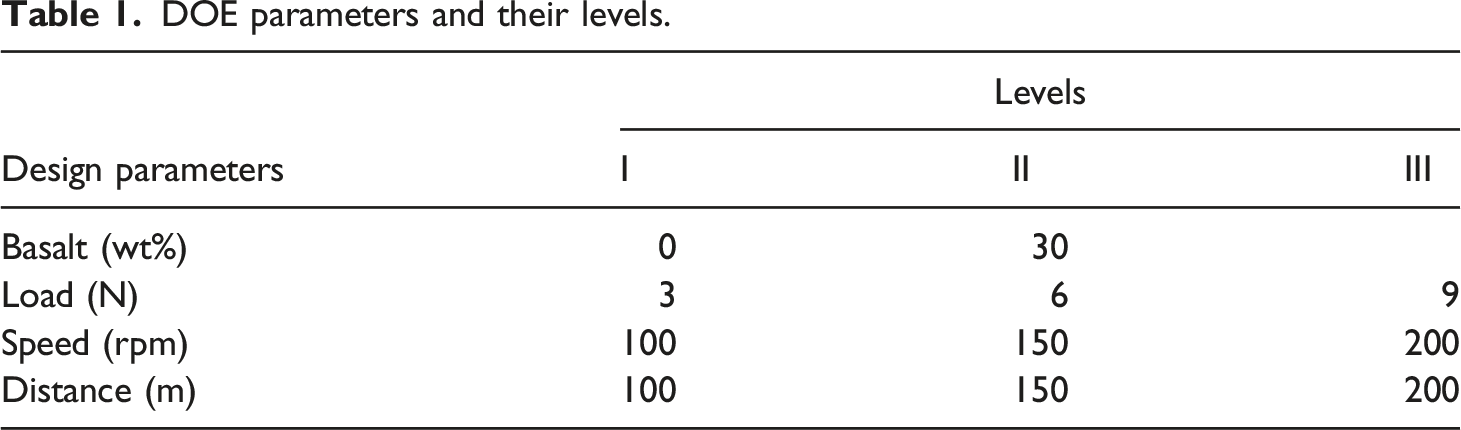
Design of experiment (DOE)
DOE parameters and their levels.
Tribology test
According to the G99 standard,
21
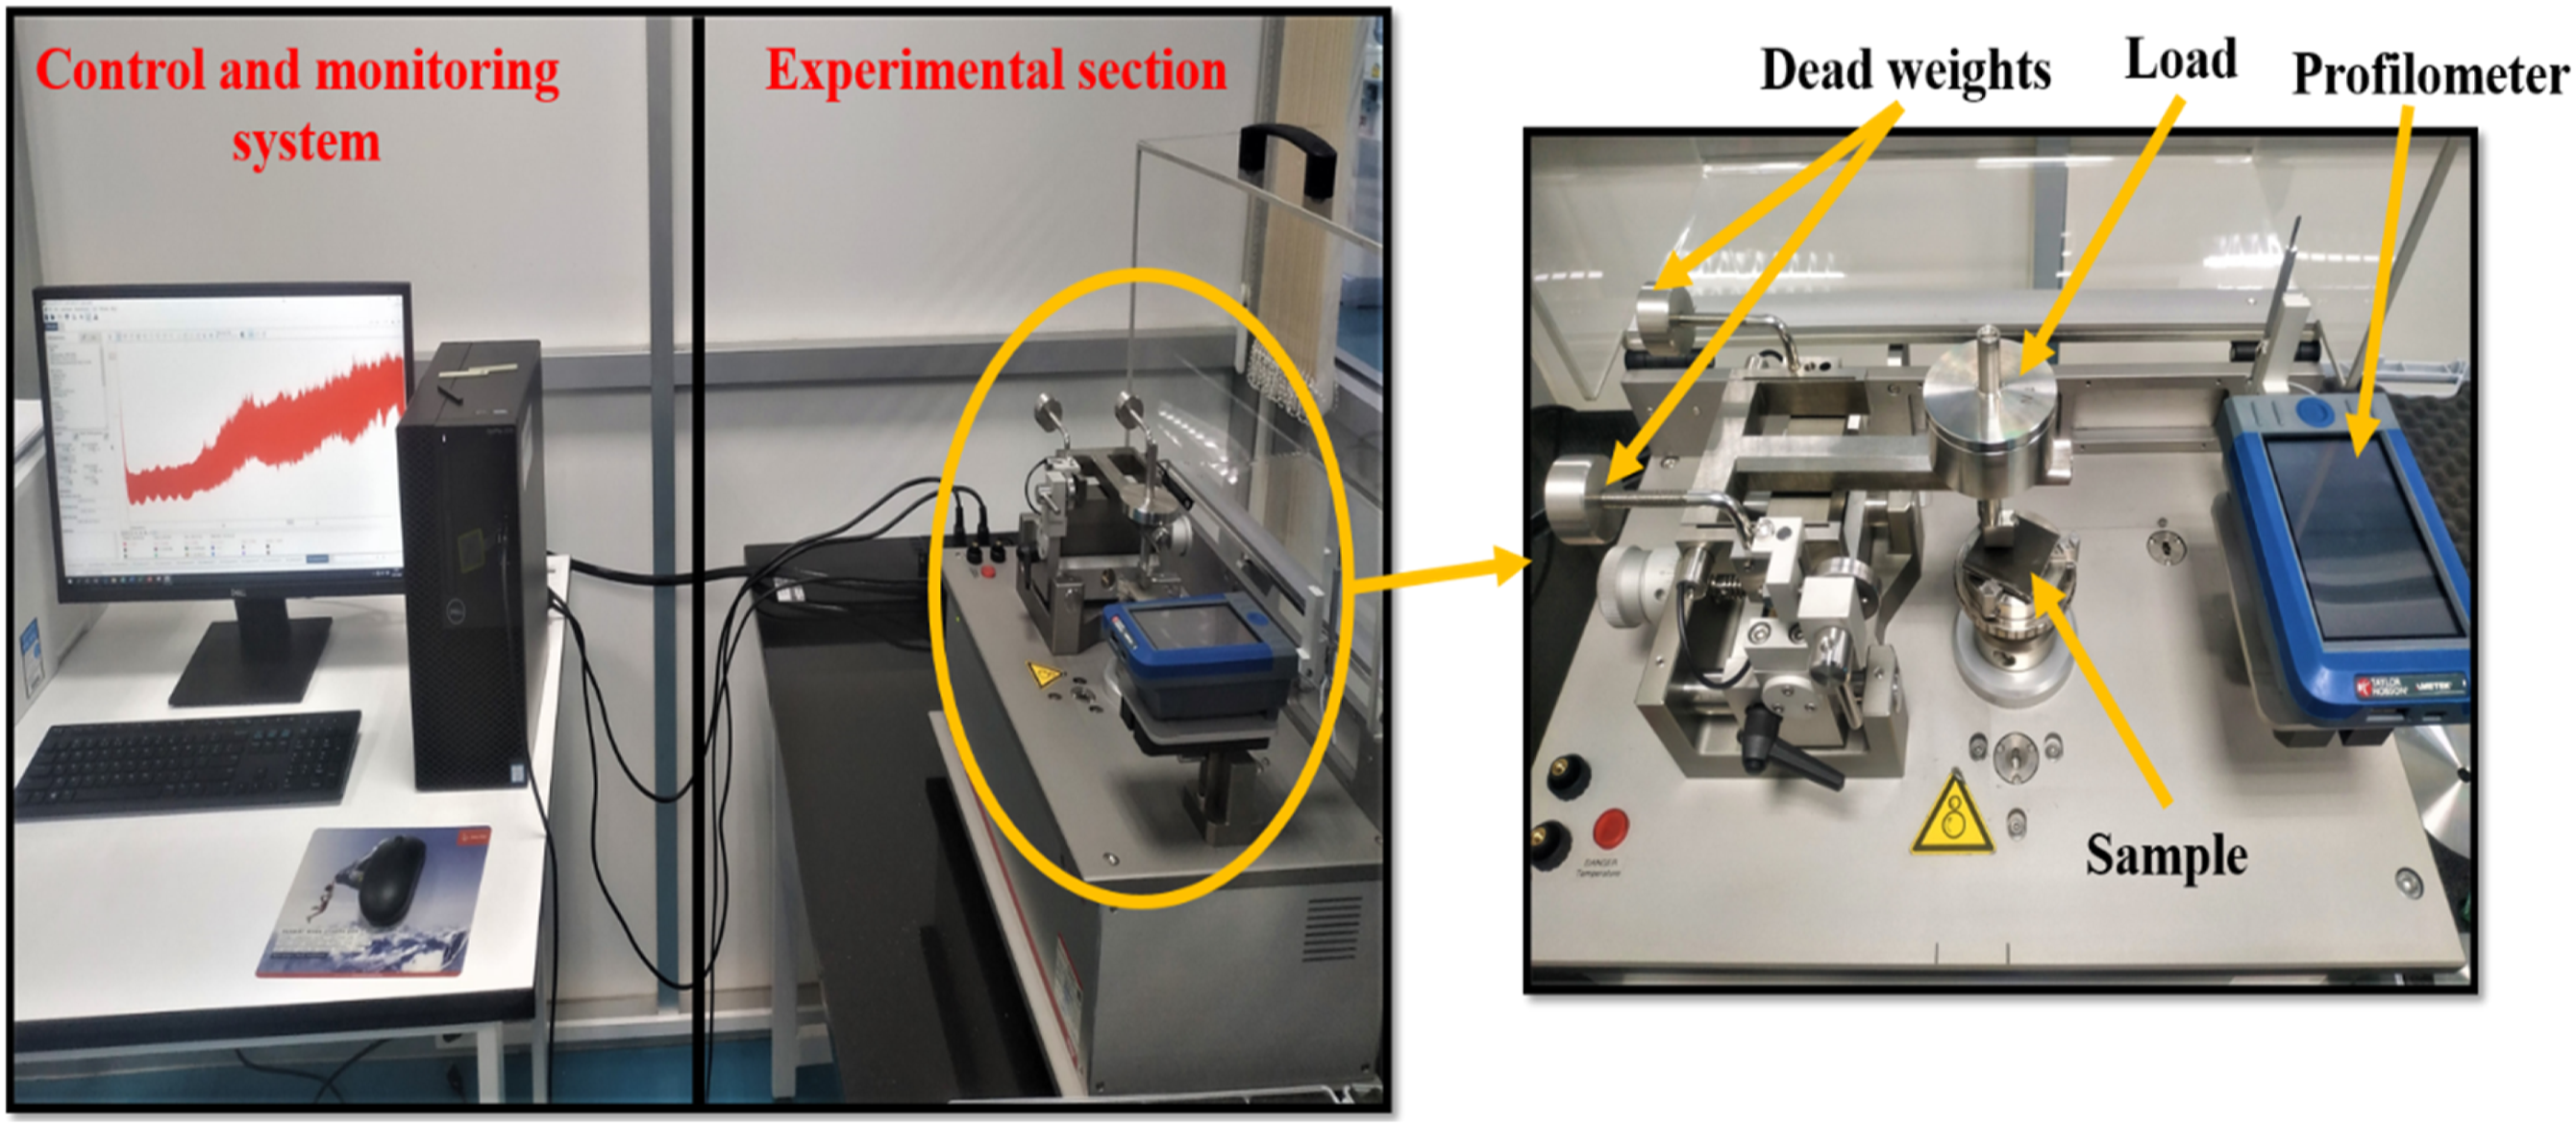
the tribology test is performed on the neat polymers and composite materials in the Anton Paar TRB3 Pin-on-disk tribometer. The responses obtained from the tribology test are coefficient of friction and specific wear rate. Before experimenting, the samples are rubbed initially with the 1500 grit size and then by 2000 grit size to maintain uniform roughness throughout the surface. The varying parameters during the tribology test are load, speed, and distance. The tribology experimental setup is shown in Figure 3. The experiments are performed as per the orthogonal array design at an ideal room temperature. The profilometer is attached with the inbuilt setup to analyze the 2D depth profile. Both the pin and disc are cleaned with ethanol to ensure the removal of eroded particles from the surface. The system records the mean COF value for each experimental run. The mass loss of the sample after each experiment is recorded for the specific wear rate calculation as per equation (1).
22
The density, distance traveled, and force applied are taken into consideration for the calculations. Tribology experimental setup.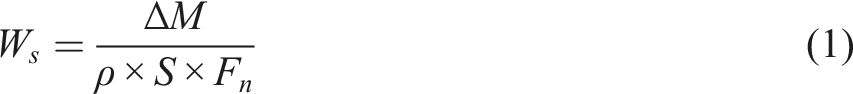
Taguchi and analysis of variance
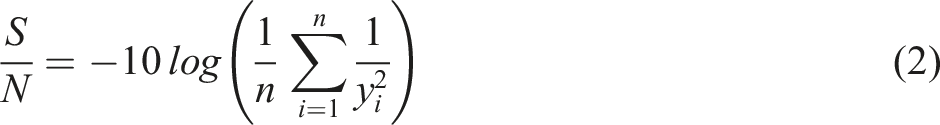
One of the most popular statistical techniques for determining the relative relevance of various parameters for the objective function is the Taguchi method, which Genichi Taguchi invented. The Taguchi technique uses a unique design of an orthogonal array interspersed with a limited number of tests to analyze all process parameters. In this approach, the phrases “signal” and “noise” refer to the desired value (mean) and the undesired value (standard variance), respectively, for the output response. This approach makes use of the signal-to-noise ratio (equation (2)) to identify quality characteristics that deviate from the target value.23,24 In this research, the Taguchi is applied to minimize the COF and SWR values by selecting the optimum parameters from basalt wt%, load, speed, and distance. Since both the responses need to be minimized, the smaller is better performance characteristic is utilized. Another statistical method is ANOVA, and its major objective is to ascertain the contributions of every variable to the overall response. ANOVA can be employed as well to confirm the Taguchi method findings since it shows the significance of the order of the parameters that influence the response.
24
This study reveals the effect of basalt wt%, load, speed, and distance parameters on the COF and SWR responses using the ANOVA technique. By evaluating the average squared error with a prediction of the experimental errors at particular confidence levels, ANOVA aids in formally assessing the importance of all major parameters and their interactions.
23
Results and discussions
Friction and wear analysis
Taguchi design of experiments using L18 orthogonal array for PLA samples.
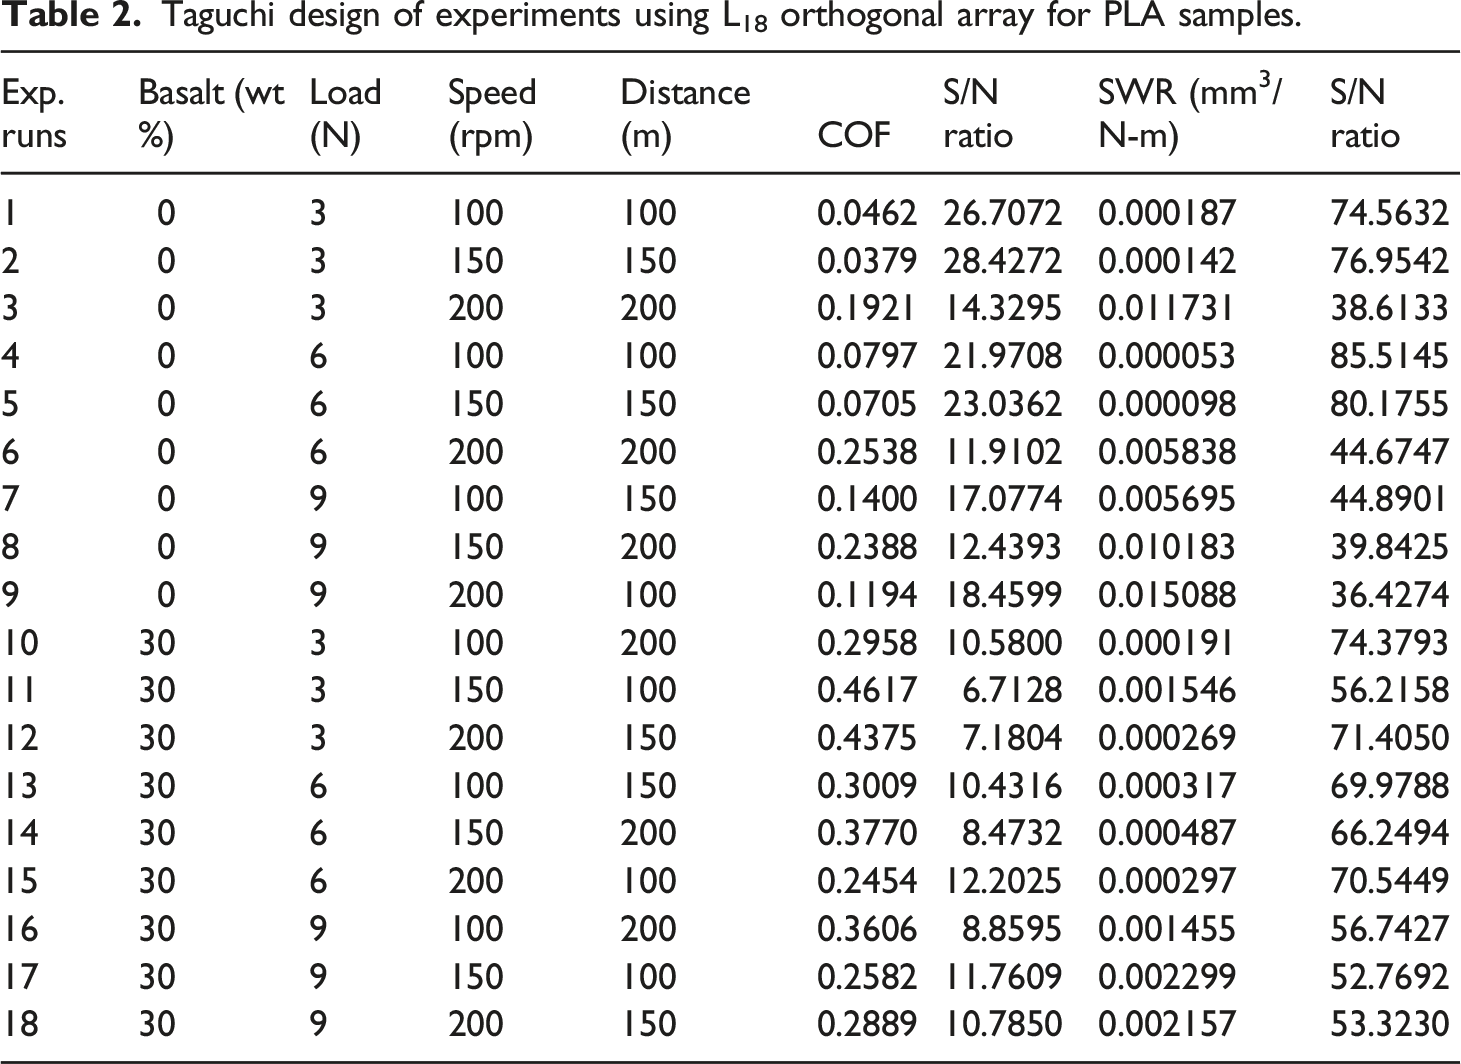
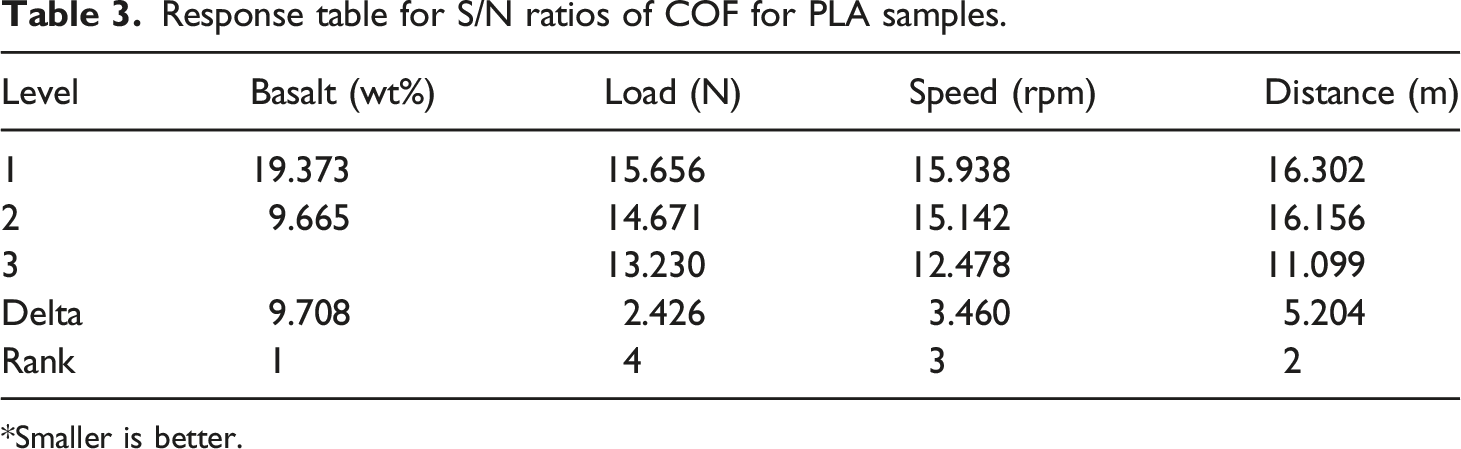
According to the Taguchi technique, the SN ratio should be investigated using a conceptual approach that includes diagramming effects and graphically highlighting the crucial variables. The obtained S/N ratios for COF are utilized to assess the optimum parameters and their impact level. The most effective factor configuration for improving this single response may be achieved with this Taguchi’s method. Figure 4(a) illustrates the optimum parameter values and their significance through the linear plots at different levels. As per the illustration, the optimum values are found to be 0 wt% basalt filler, 3 N load, 100 rpm speed, and 100 m distance. The significance of the parameter among the different levels can be analyzed using the distance between the various level points. The basalt wt% is found to exist with more distance among the two levels, which indicates that the COF response of PLA samples is strongly dependent on with and without the addition of basalt fillers. The second highest impacting parameter among their various levels is distance as indicated in the fourth plot. Furthermore, in addition to the various levels of a single parameter on the horizontal axis, the various levels of the remaining interacting parameters are displayed in the interaction plots as illustrated in Figure 4(b). Given the circumstances, the reality that the majority of the lines are not parallel suggests that the variables interact rather strongly. The response table obtained by utilizing S/N ratios suggests the high impacting parameter along with ranking which is based on the delta value. As per Table 3, the maximum impact parameter is basalt wt% which possesses a maximum delta value of 9.708 and is assigned rank 1. This is correlated to the effect plot of basalt wt% which is having higher slope than the other parameters. The 2nd rank is allotted to the distance parameter having a delta value of 5.204. Whereas the 3rd and 4th ranks are assigned to the speed and load parameters having a delta value of 3.460 and 2.426 respectively. (a) Main effect plot in response to COF, and (b) Interaction plots for PLA samples. Response table for S/N ratios of COF for PLA samples. *Smaller is better.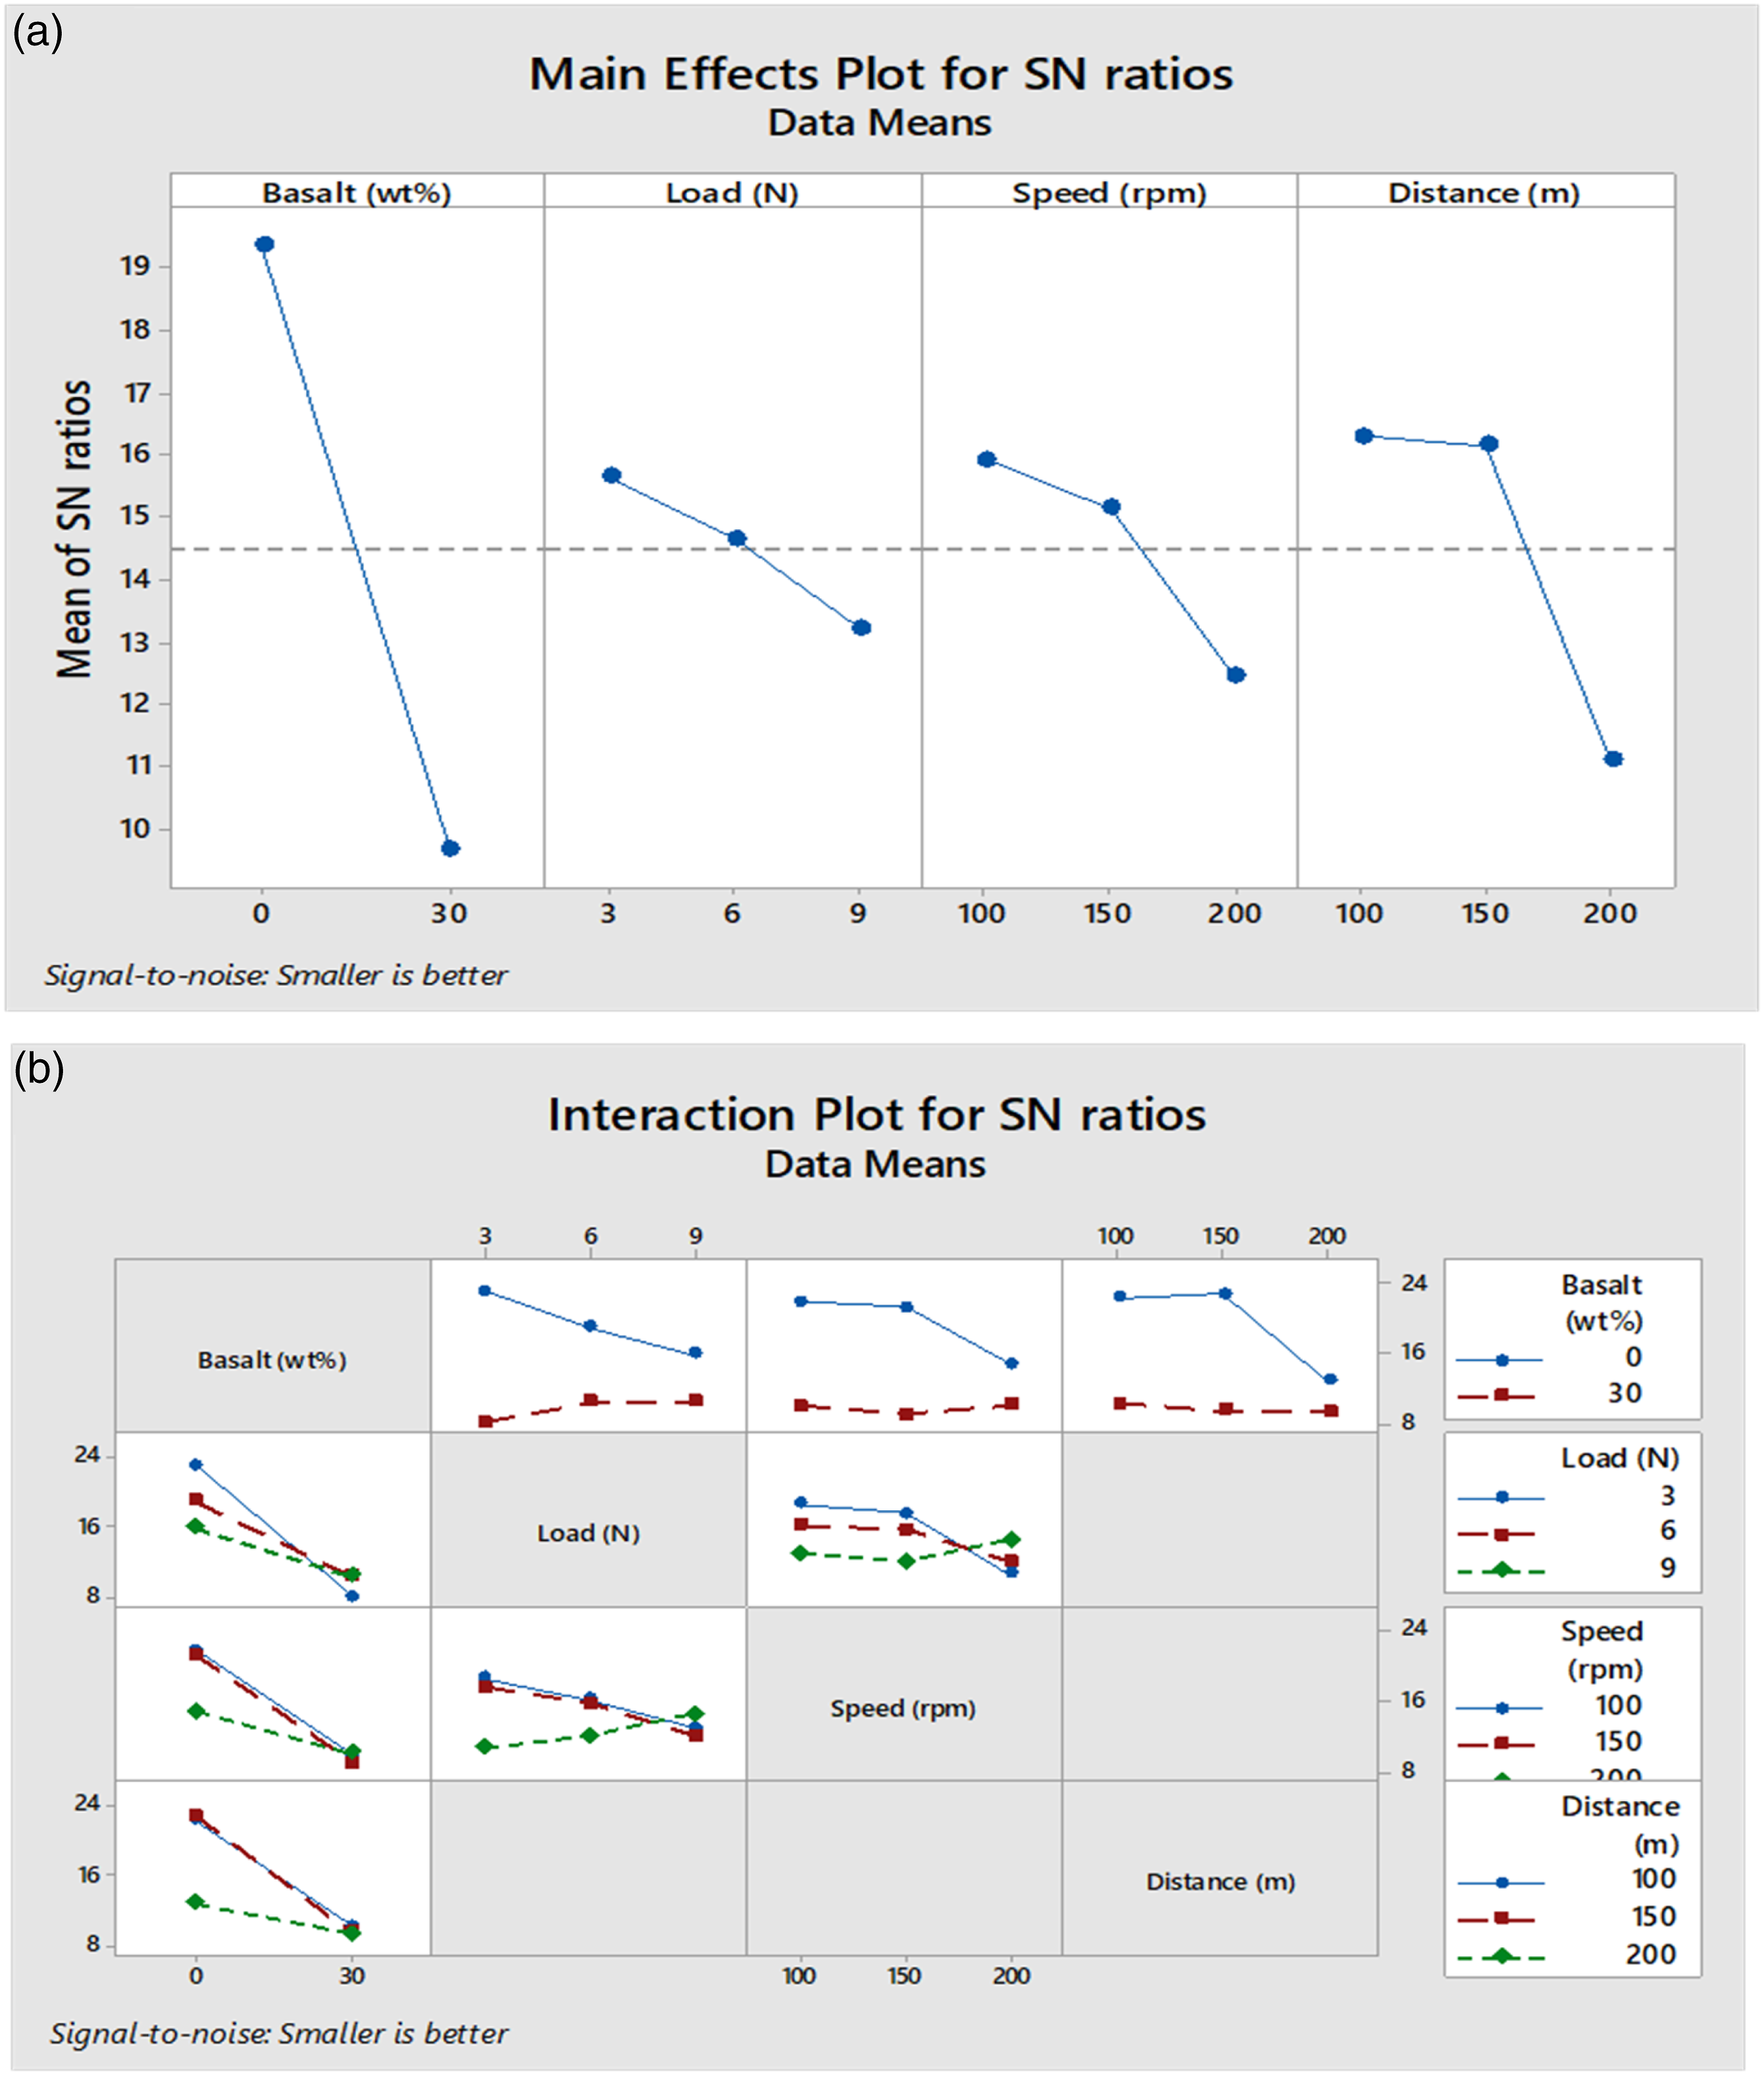
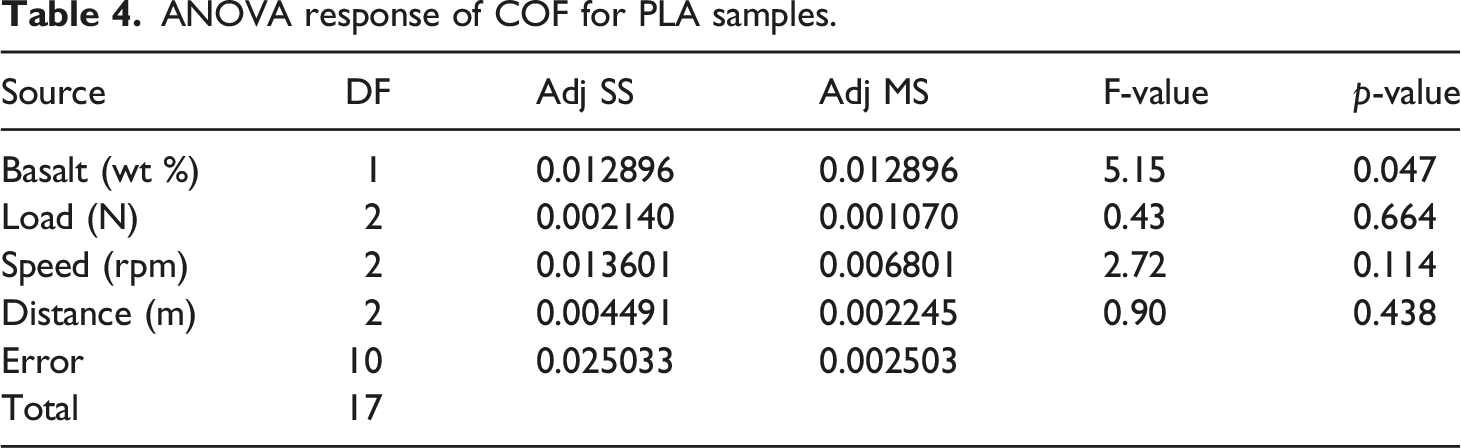
ANOVA response of COF for PLA samples.
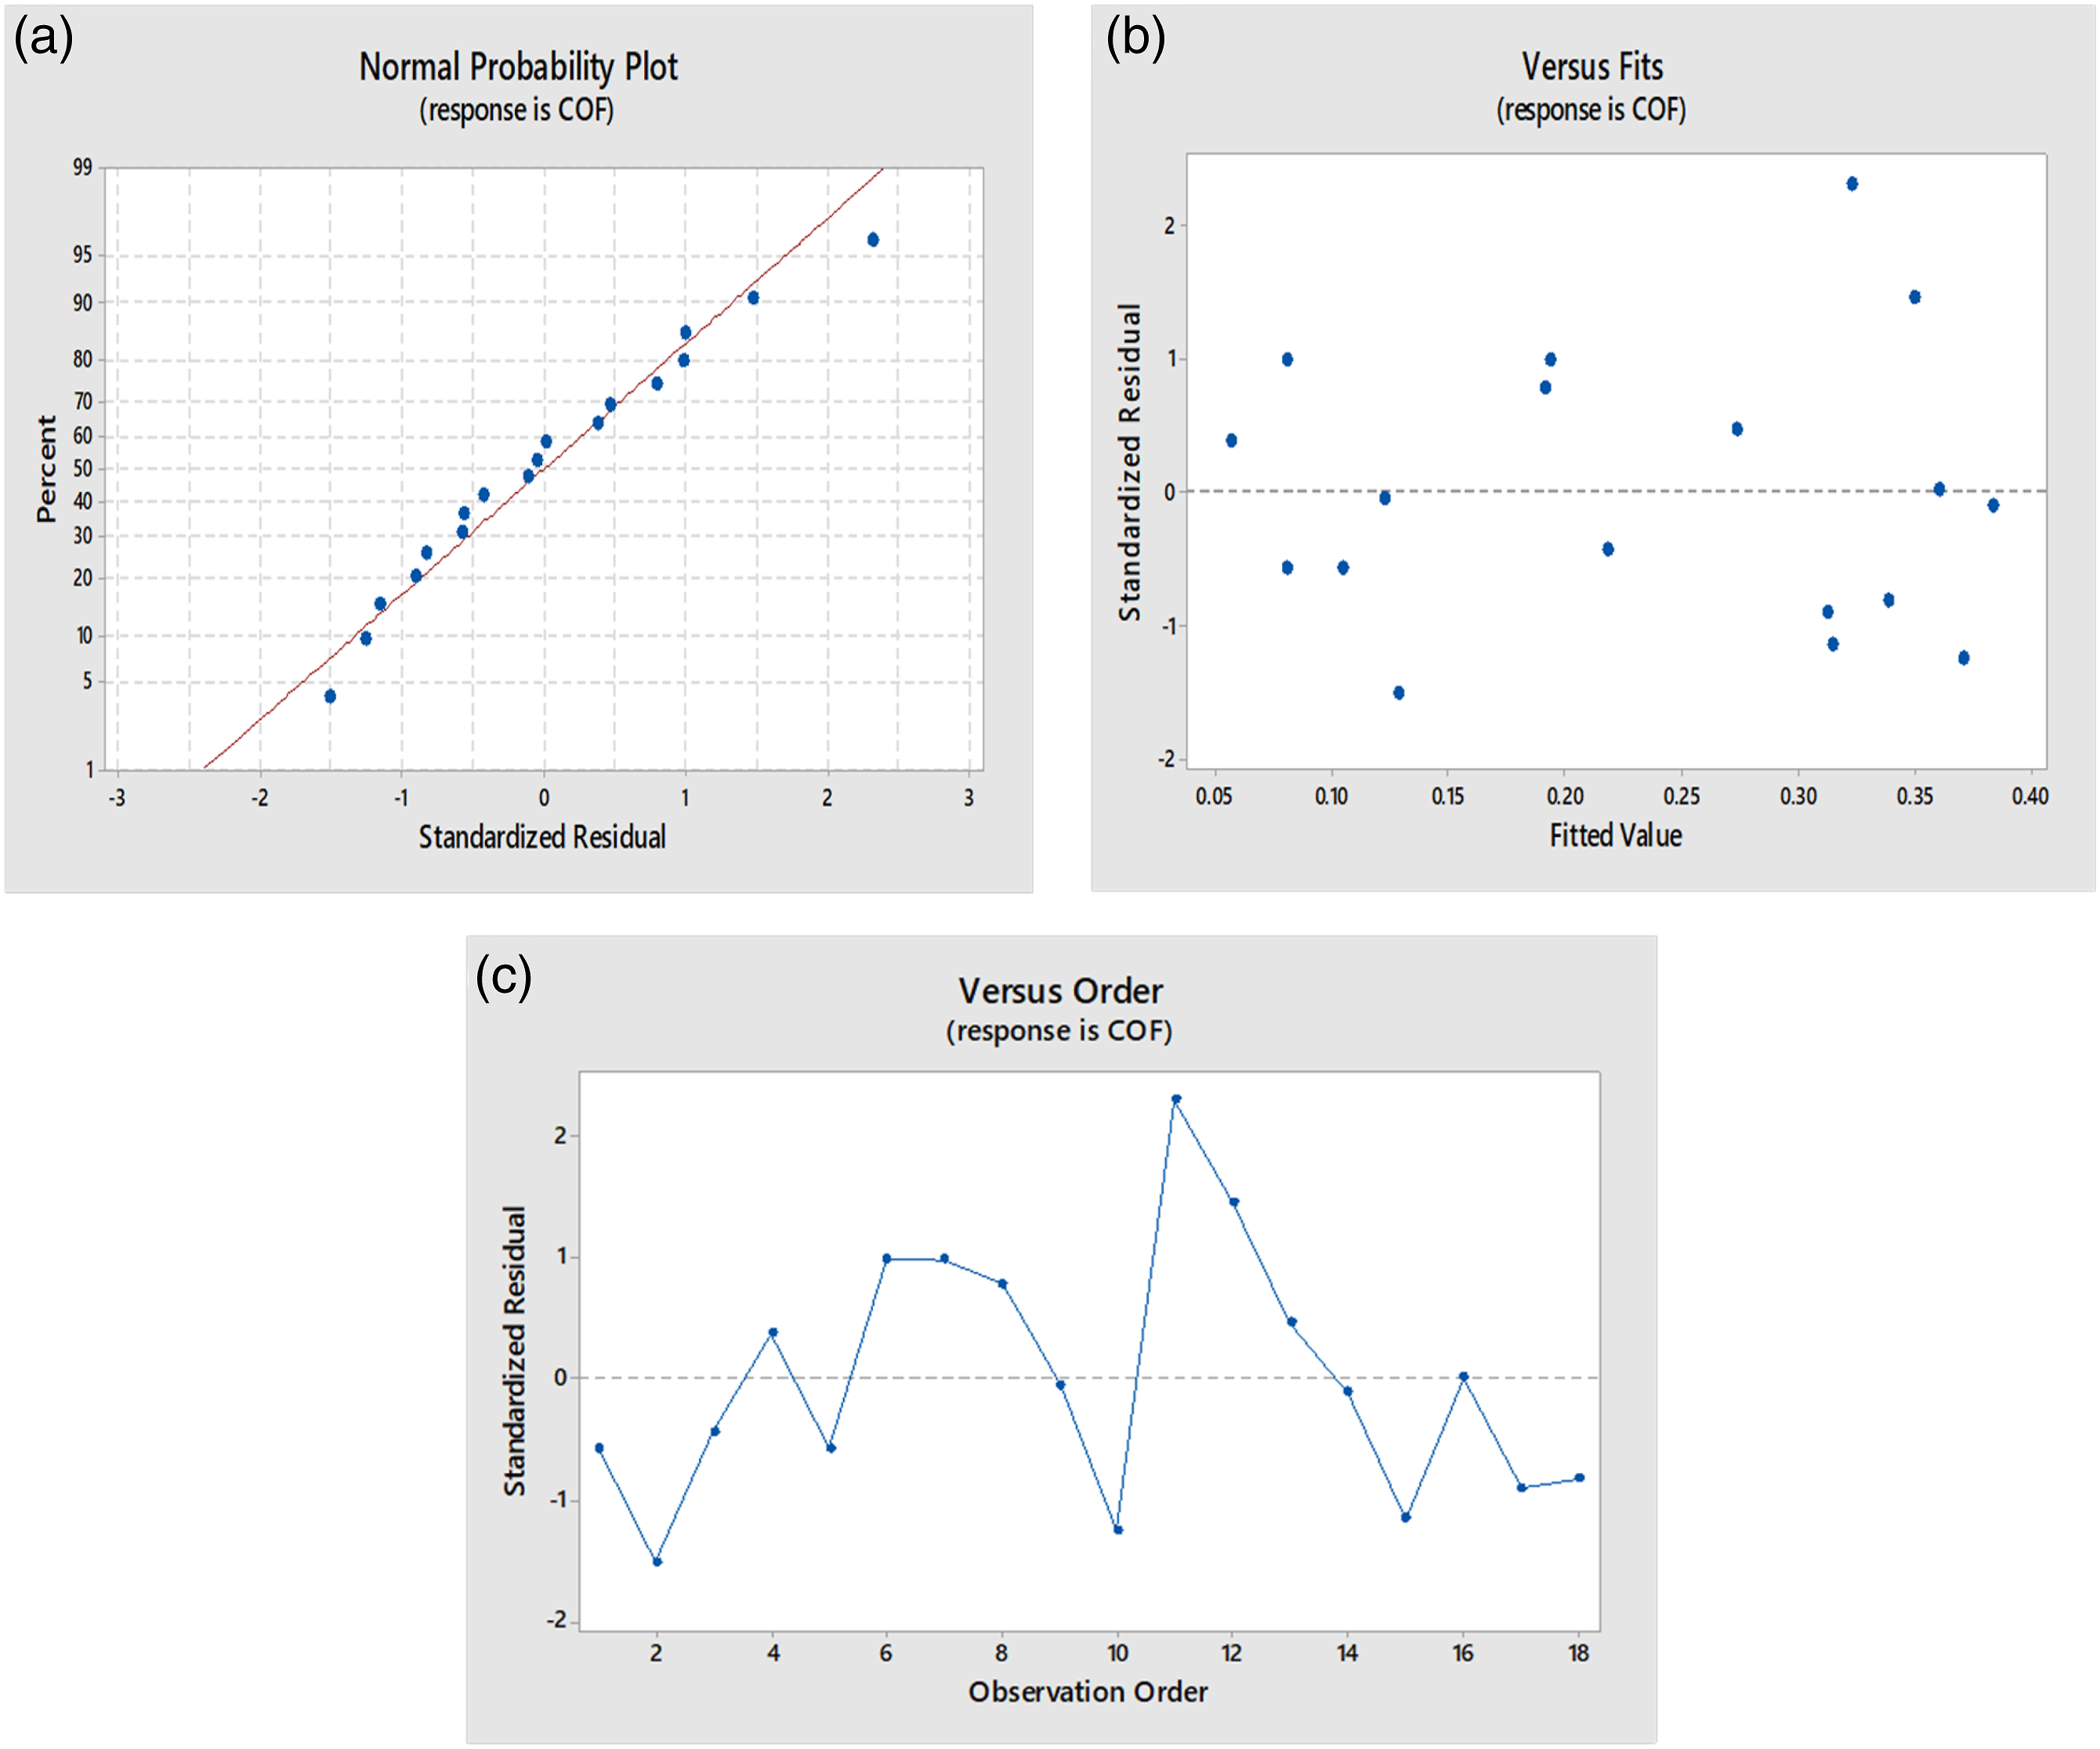
(a) Probability plot, (b) residuals versus fits plot, (c) residuals versus order plot for PLA samples in response to COF.
Figure 6 illustrates the relations established among the parameters via the contour plots. In Figure 6(a), the parameters load and basalt wt% seems to be independent and their interactions aligned parallel to the y-axis. The COF value is found to be reduced with the lower amount of basalt filler reinforcement. Whereas there is a strong correlation between speed and basalt wt% concerning COF output as shown in Figure 6(b). The lowest COF is indicated with light green color at lower basalt wt% and speed. The speed range from 100 to 120 rpm and basalt wt% of below 5% is anticipated to be the lowest COF response. A similar correlation between distance and basalt wt% concerning COF output is observed in Figure 6(c). The speed range from 100 to 130 rpm and the basalt wt% of less than 4% is marked with less than 0.05 COF with a dark blue region. The lower basalt filler loading in all three contour plots results in the lowest COF values relative to the other parameters. Contour plots in response to COF for PLA samples: (a) COF versus load, basalt wt%, (b) COF versus speed, basalt wt%, and (c) COF versus distance, basalt wt%.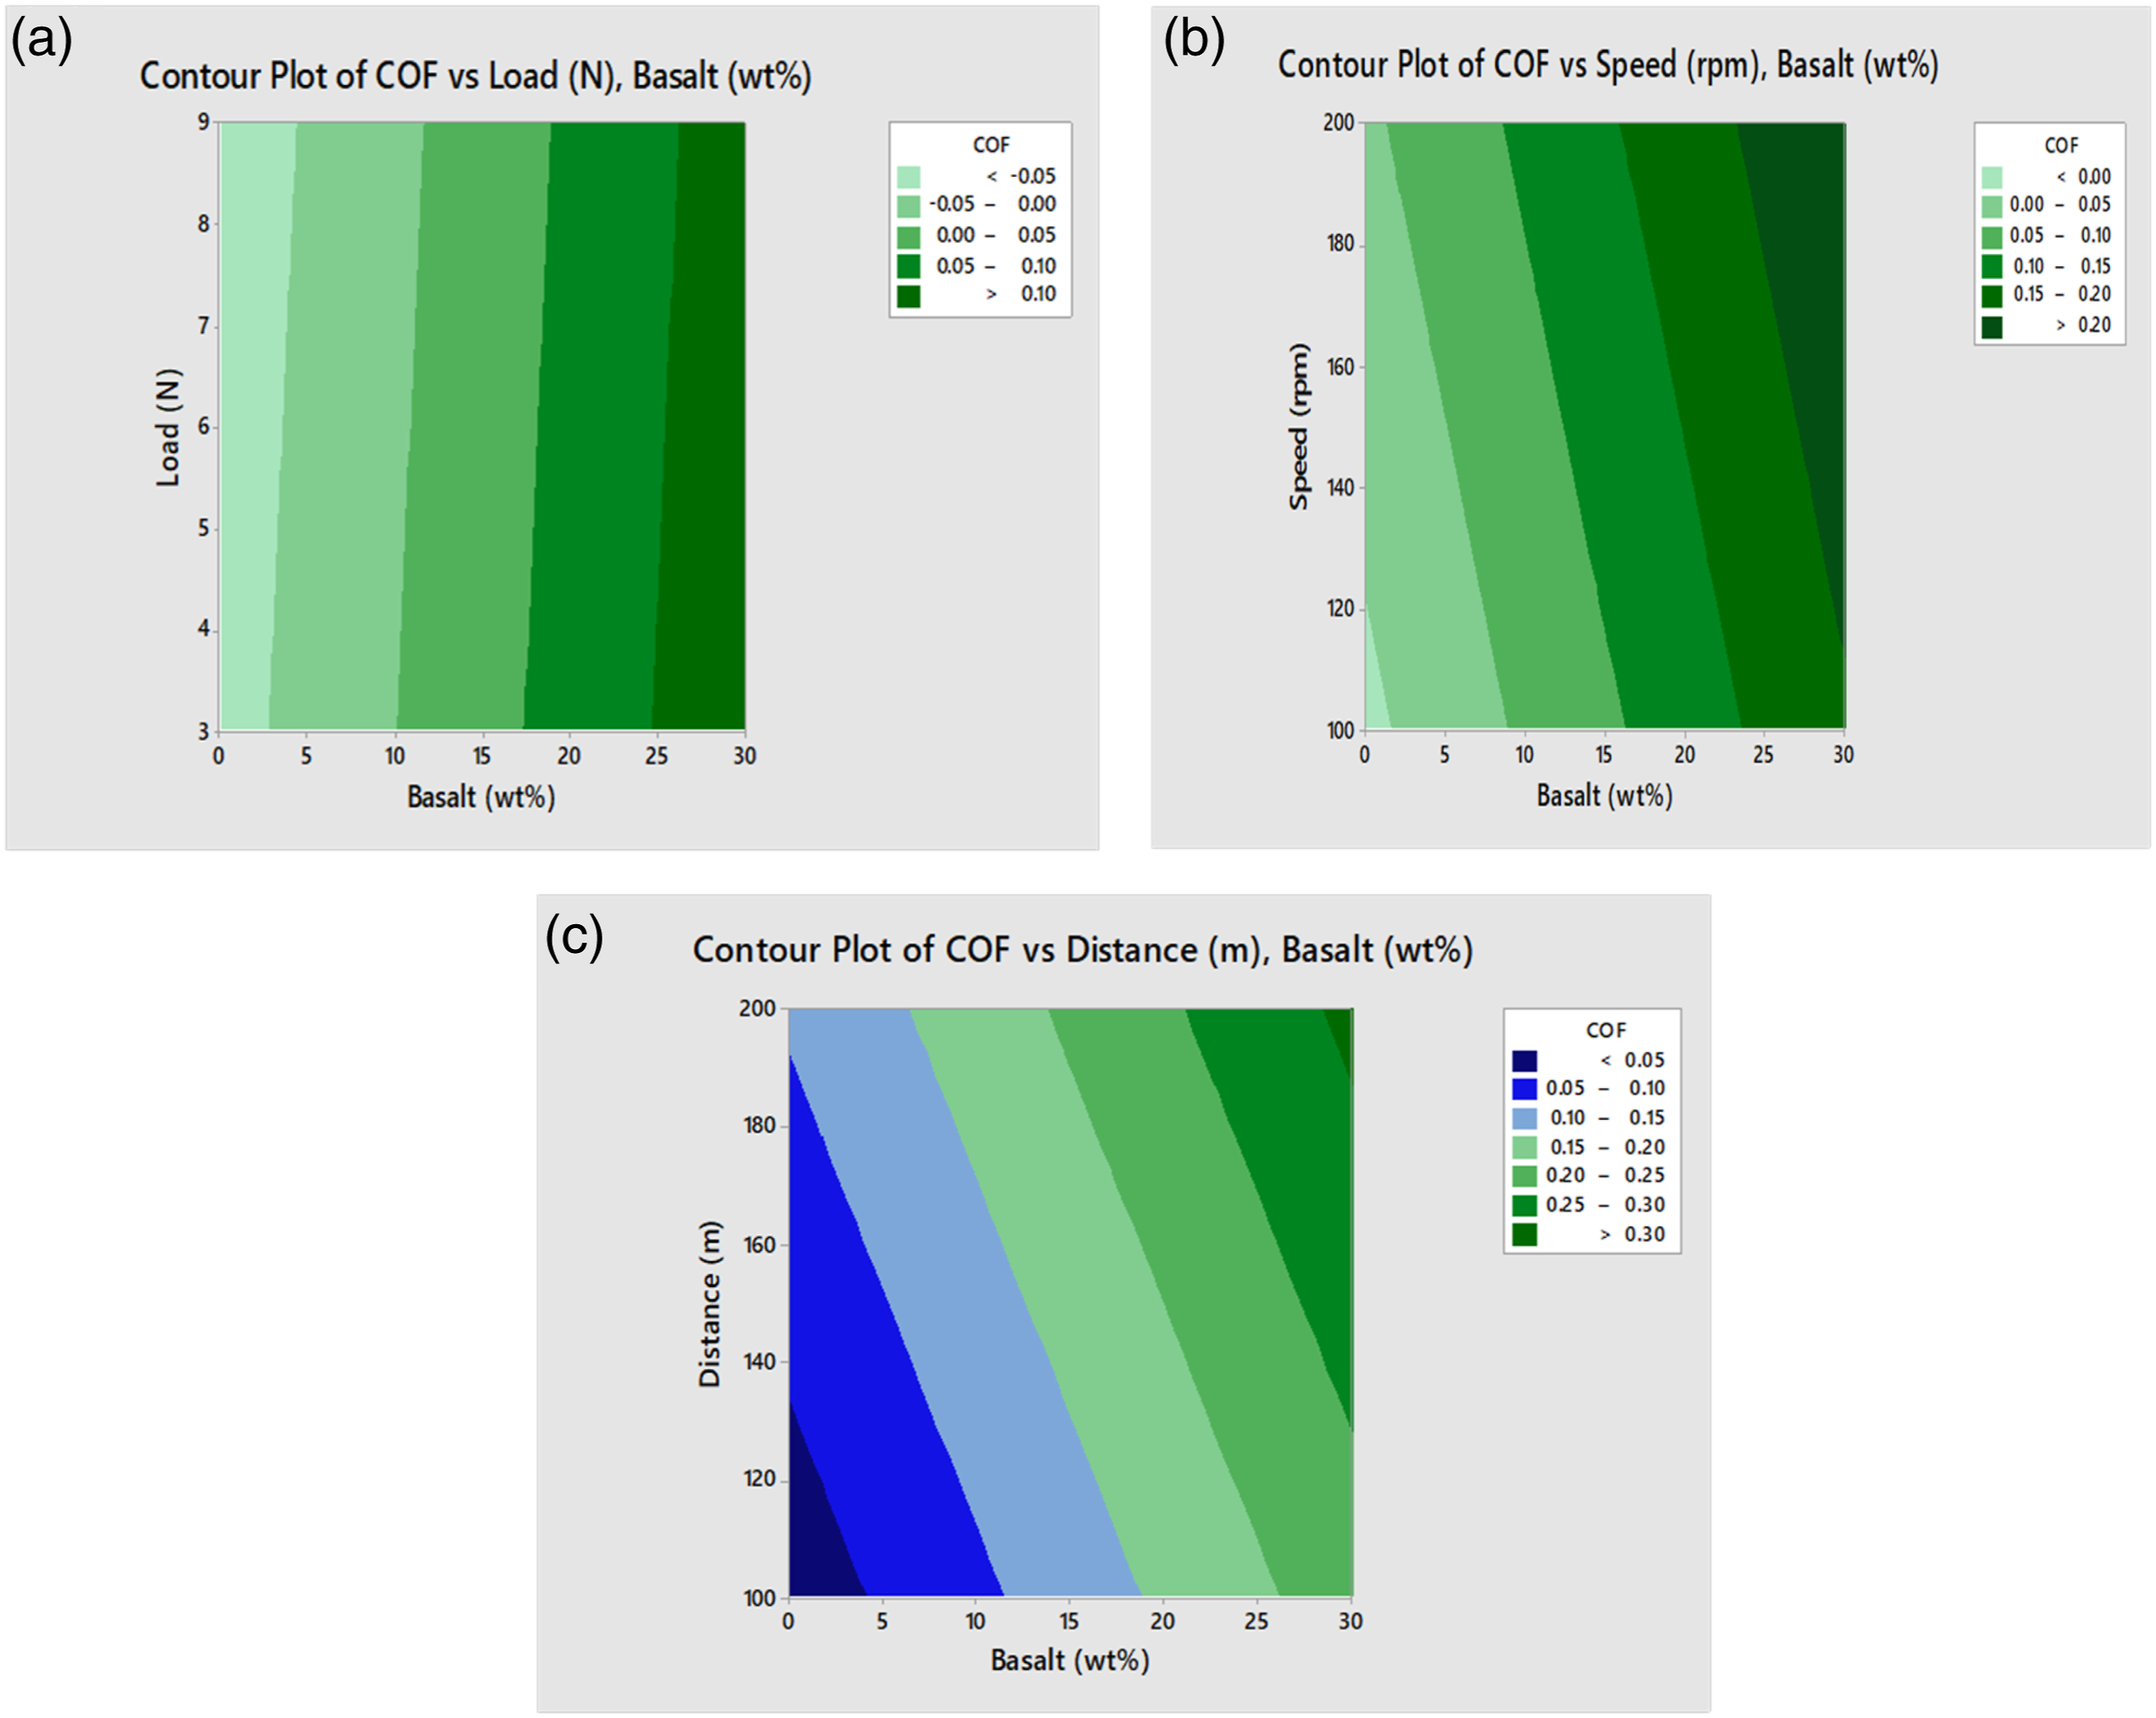
In response to SWR, the main effect plot and interaction plot for PLA samples are illustrated in Figure 7(a) and (b) respectively. As per the main effect plot based on the S/N ratio, the optimum parameters are found to be 30 wt% basalt, 6 N load, 100 rpm speed, and 150 m distance. Among the four parameters, the load possesses more slope and indicates a major effect parameter. Moreover, there is a large distance between the different levels of load parameters. The second highest impact parameter is speed where the good response is recordable with decreased levels. The third and fourth impacting parameters are distance and basalt wt% respectively. In concern to basalt filler wt%, there is a reverse trend with the COF response. In certain of the testing setups, basalt wt% addition dramatically decreased the SWR of PLA samples. This may be due to the basalt fillers’ ability to interfacially attach to the PLA surface and withstand abrasion.
29
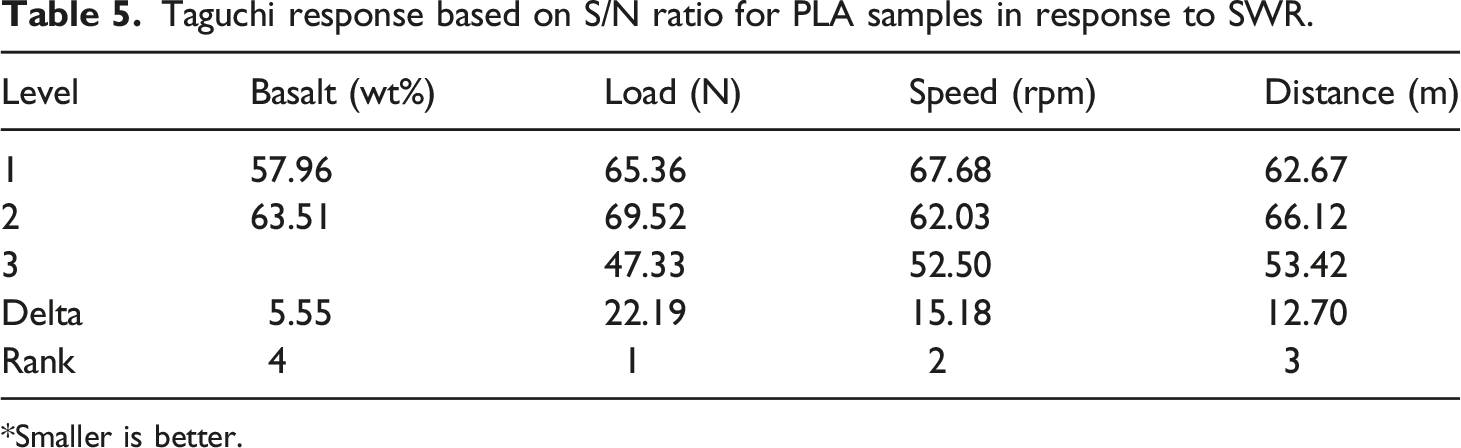
Every parametric line is seen to be completely coordinated in the interaction plot in Figure 7(b), demonstrating the considerable dependency between the parameters. The SWR response based on the S/N ratio is tabulated in Table 5. The load parameter is employed with a maximum delta value of 22.19 indicating the most impact parameter and assigned with rank 1. The second highest delta value of 15.18 is observed with the speed parameter indicating the second most impact parameter (rank 2). Similarly, the 3rd and 4th ranks are given to the distance and basalt wt% which possess delta values of 12.70 and 5.55 respectively. Among the four variables, the basalt wt% is the least significant variable and is correlated to the lowest slope in the effect plot. (a) Main effect plot, and (b) interaction plots for SWR response for PLA samples. Taguchi response based on S/N ratio for PLA samples in response to SWR. *Smaller is better.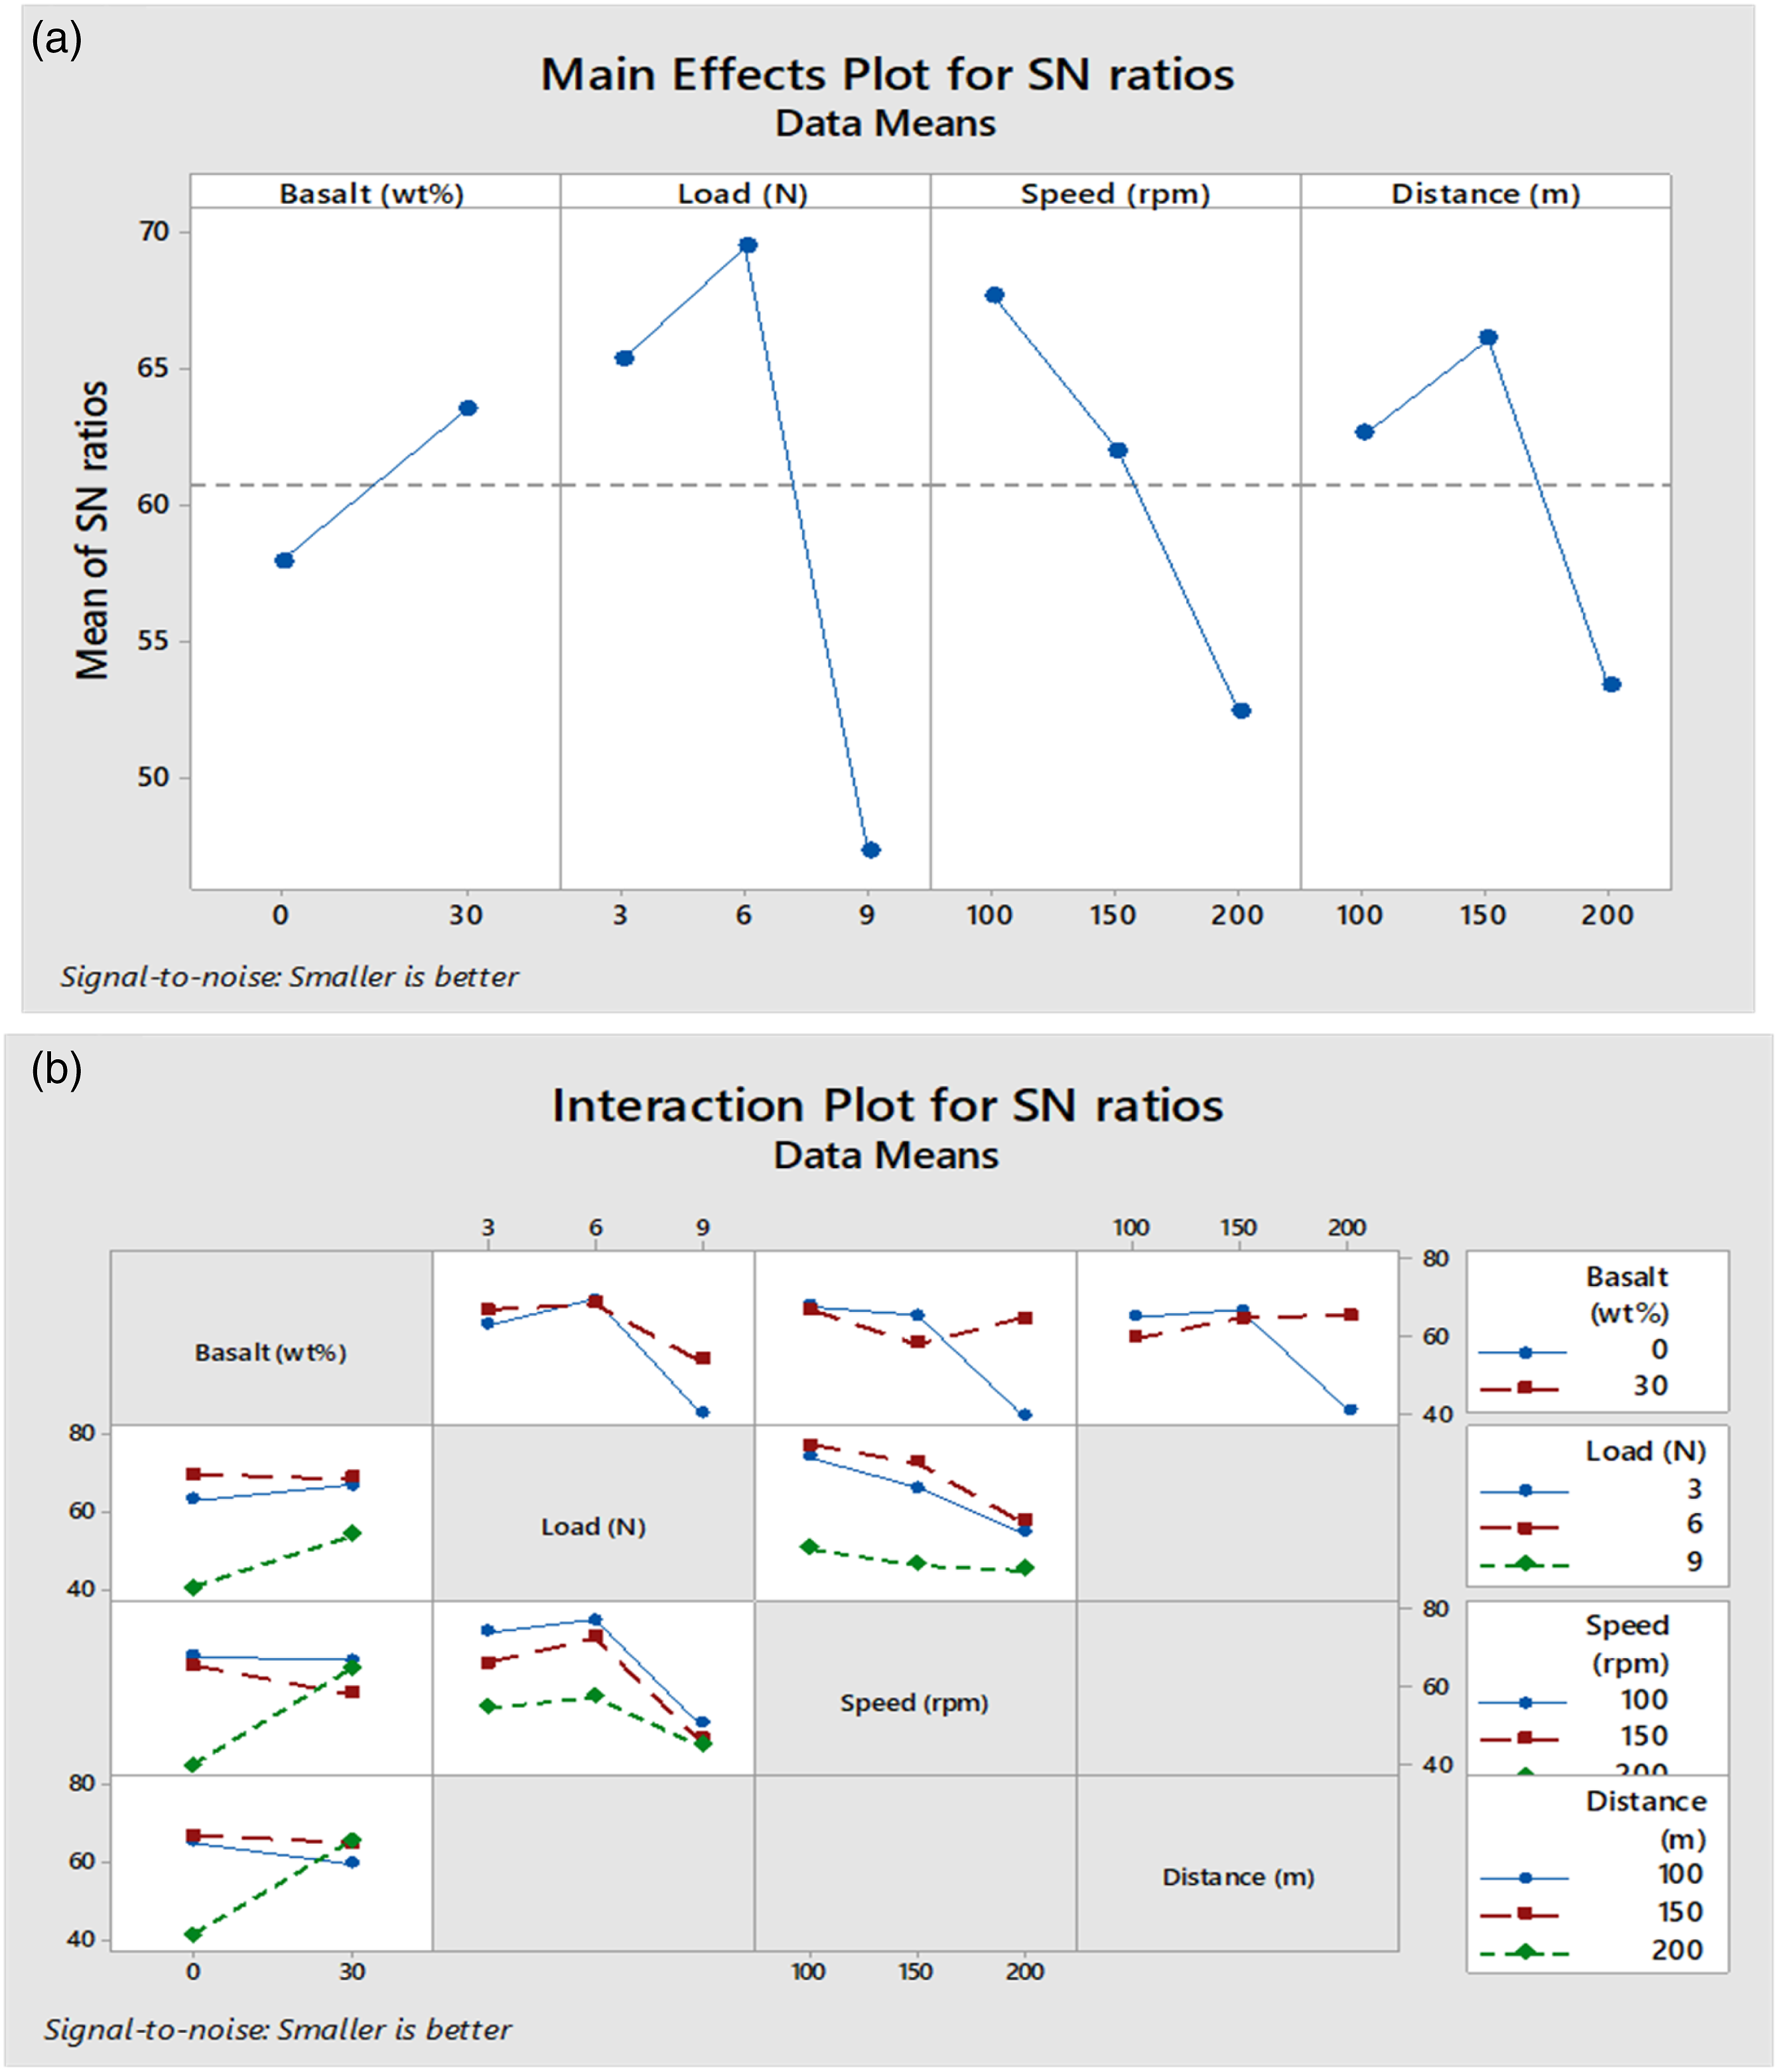
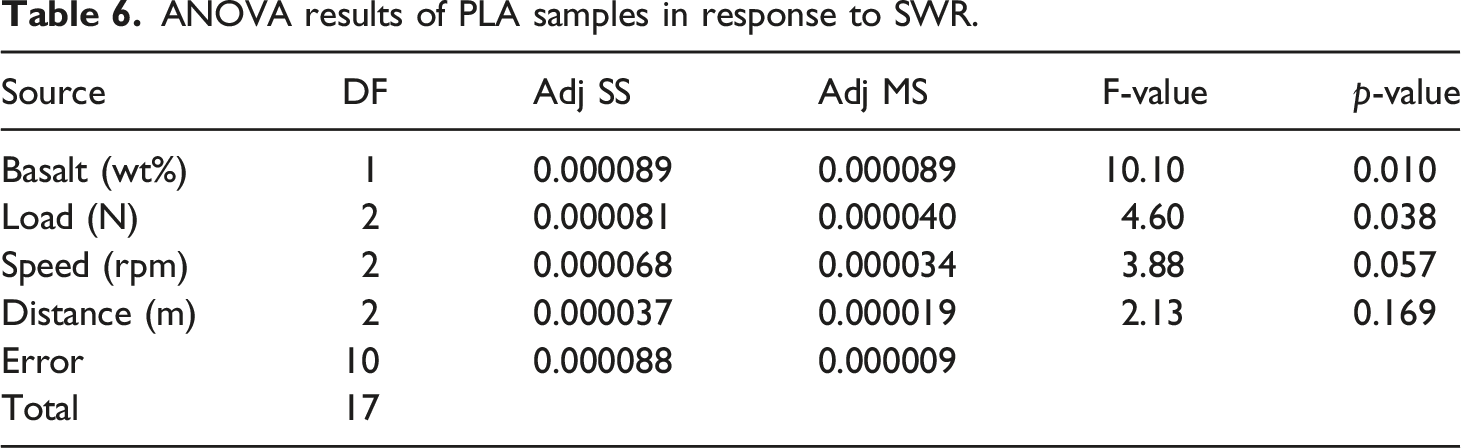
ANOVA results of PLA samples in response to SWR.
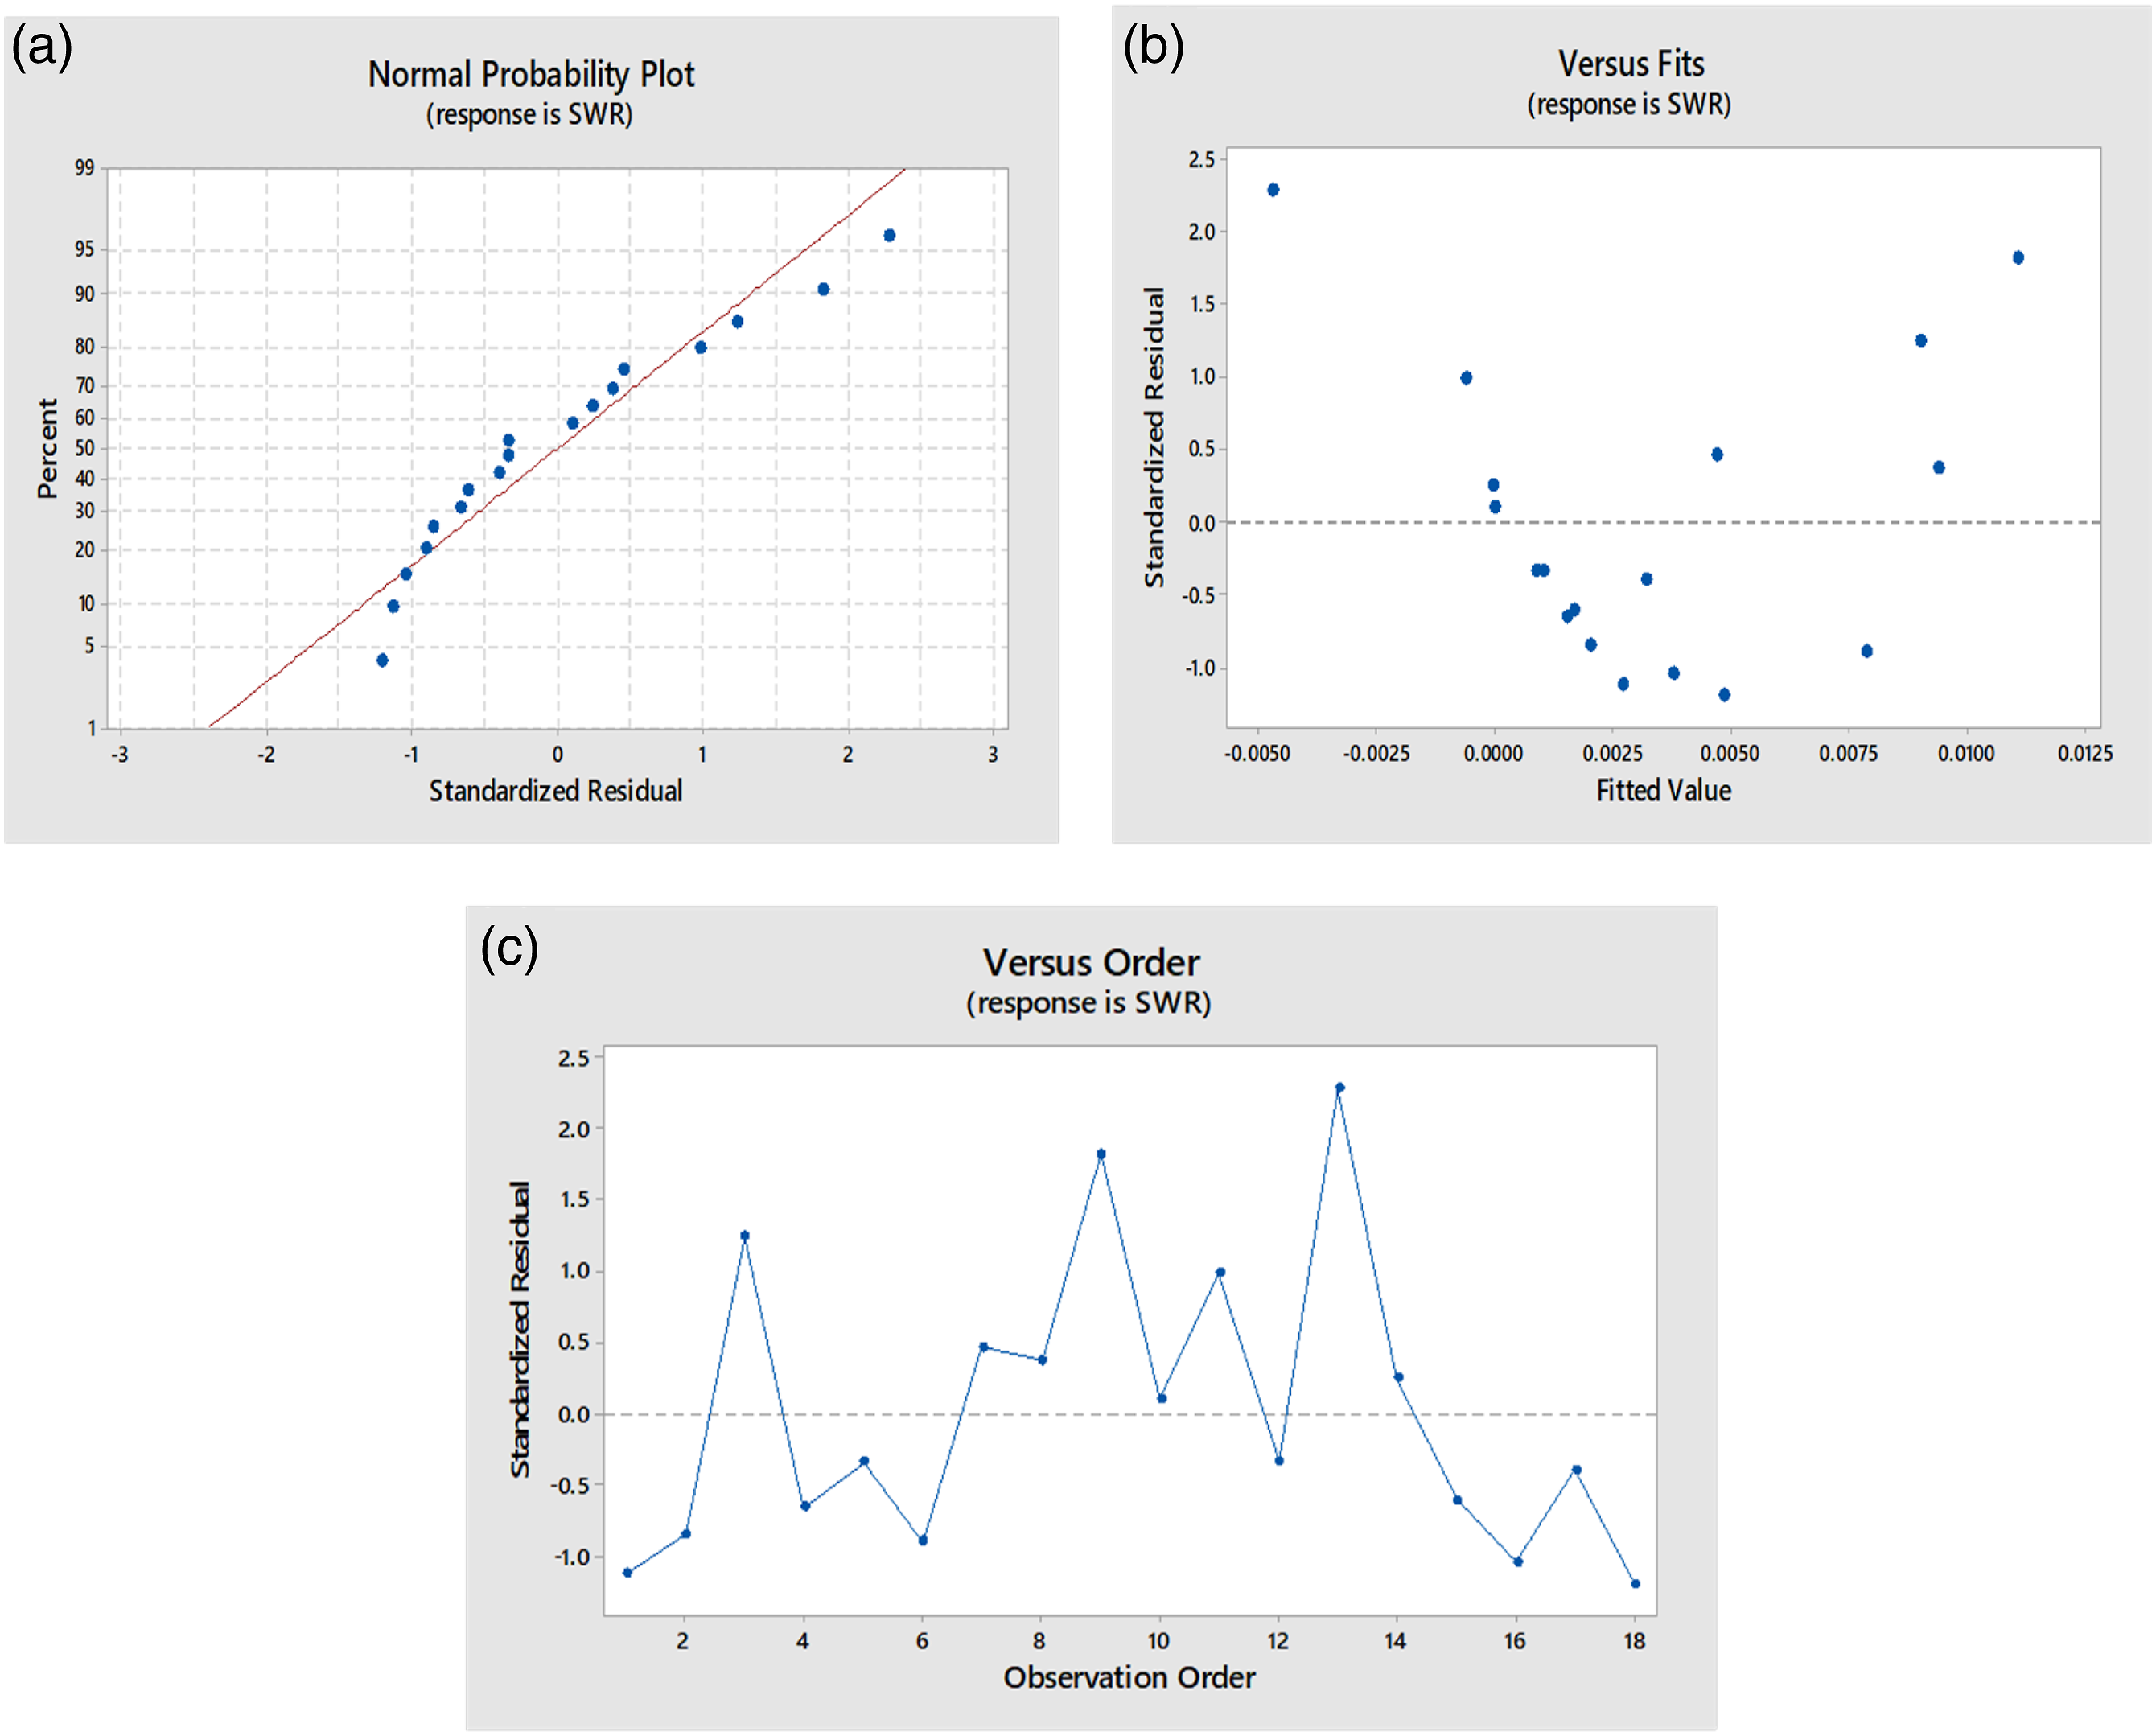
(a) Probability plot, (b) residuals versus fits plot, and (c) residuals versus order plot for PLA samples.
As seen in Figure 9, a contour plot illustrates the range of responses among the parametric interactions. In the case of plot Figure 9(a), the lowest SWR response is observed at a light green color region which is beyond 27% basalt and below 4 N load. The SWR response is maximum when there is an inverse relation exists between basalt and load parameters. The same correlation can be found in Figure 9(b) between speed and basalt wt%. There is a specific lowest value of SWR at 30 wt% basalt and 100 rpm speed as indicated in the dark blue region. Similarly, Figure 9(c) revealed that the lowest SWR among the interaction is observed beyond 26 wt% basalt and below 130 rpm speed as represented in the dark blue region. The SWR reduces substantially as basalt wt% increases concerning other processing factors, as can be seen in each of these contour graphs. Since both the optimum parameters in response to both COF and SWR are within the Taguchi-designed L18 array, there is no need to run a confirmation test for the optimum parameters.
30
Contour plots in response to SWR: (a) SWR versus load, basalt wt%, (b) SWR versus speed, basalt wt%, and (c) SWR versus distance, basalt wt%.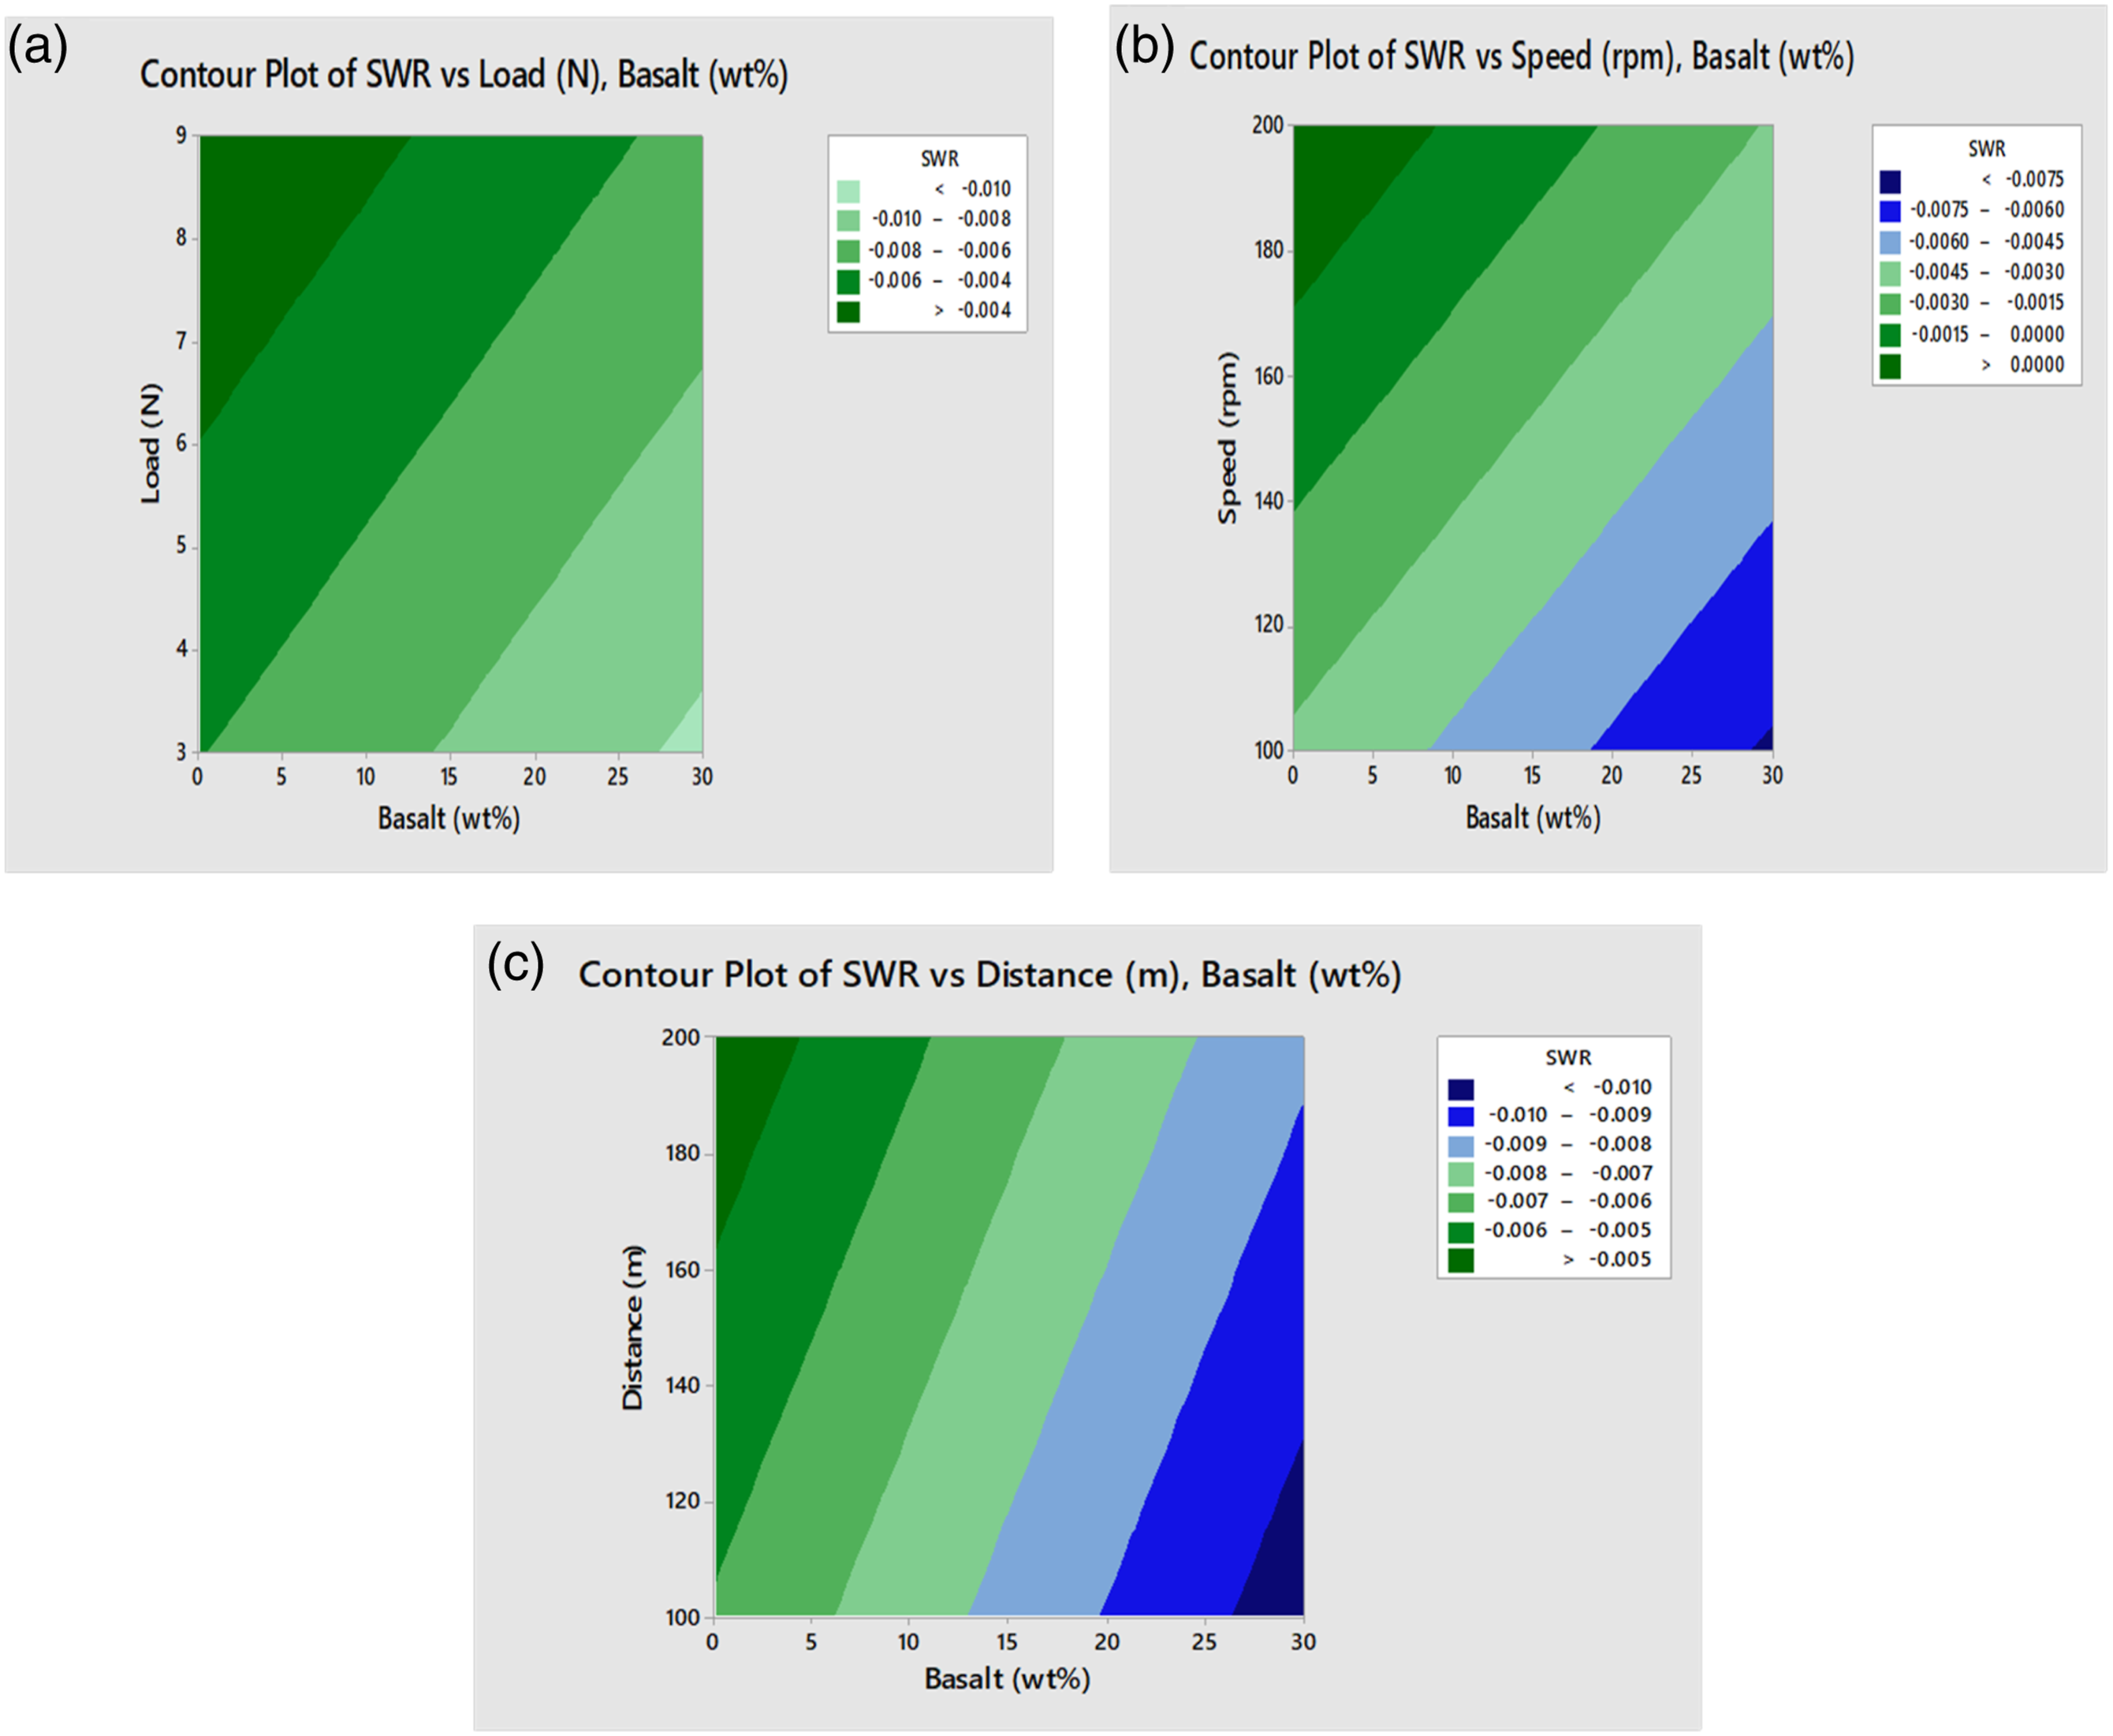
COF graph, SEM morphology, and 2D profile of L18 OA designed for PLA samples.
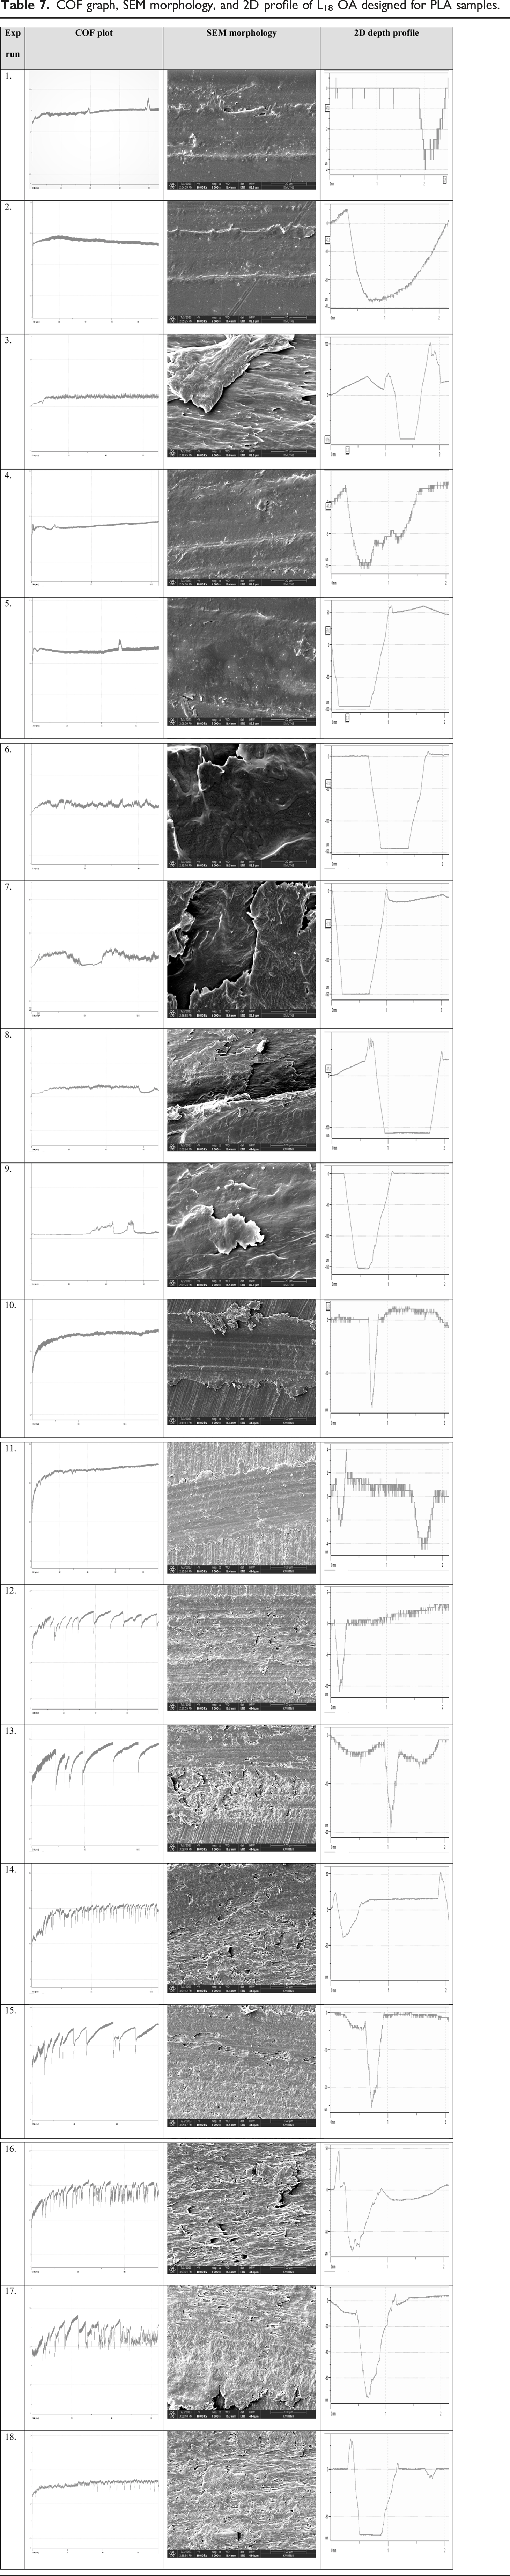
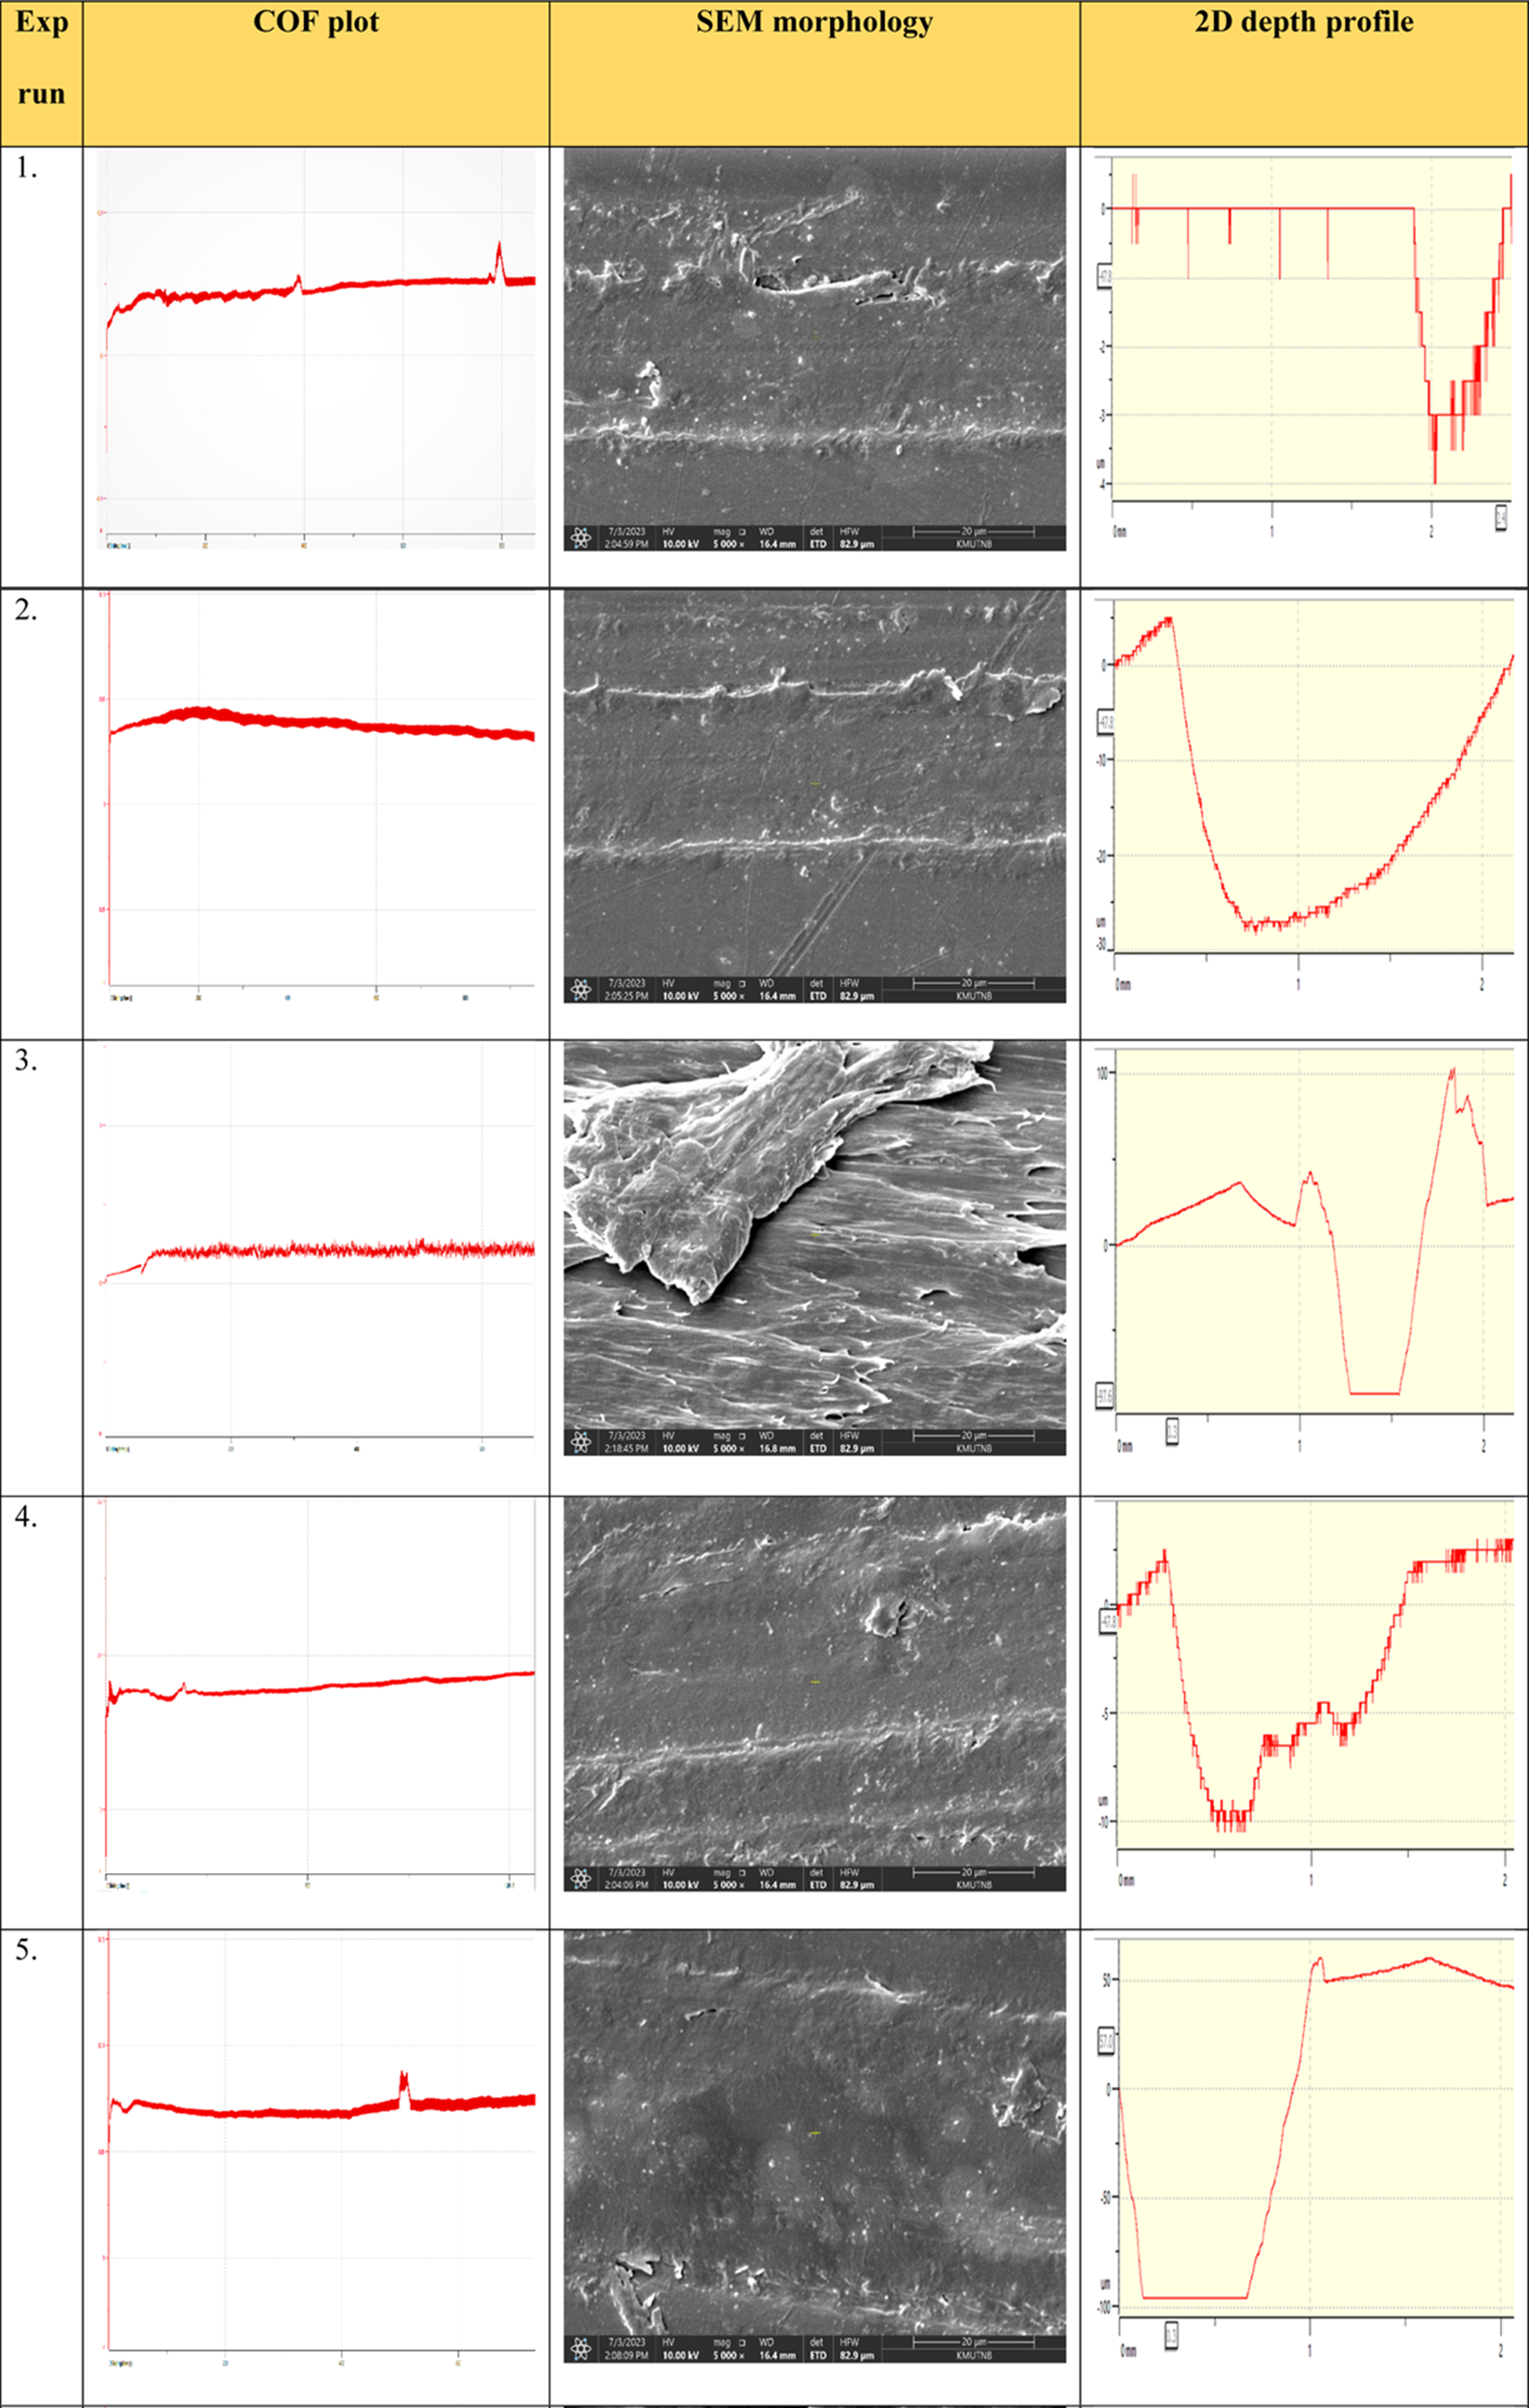
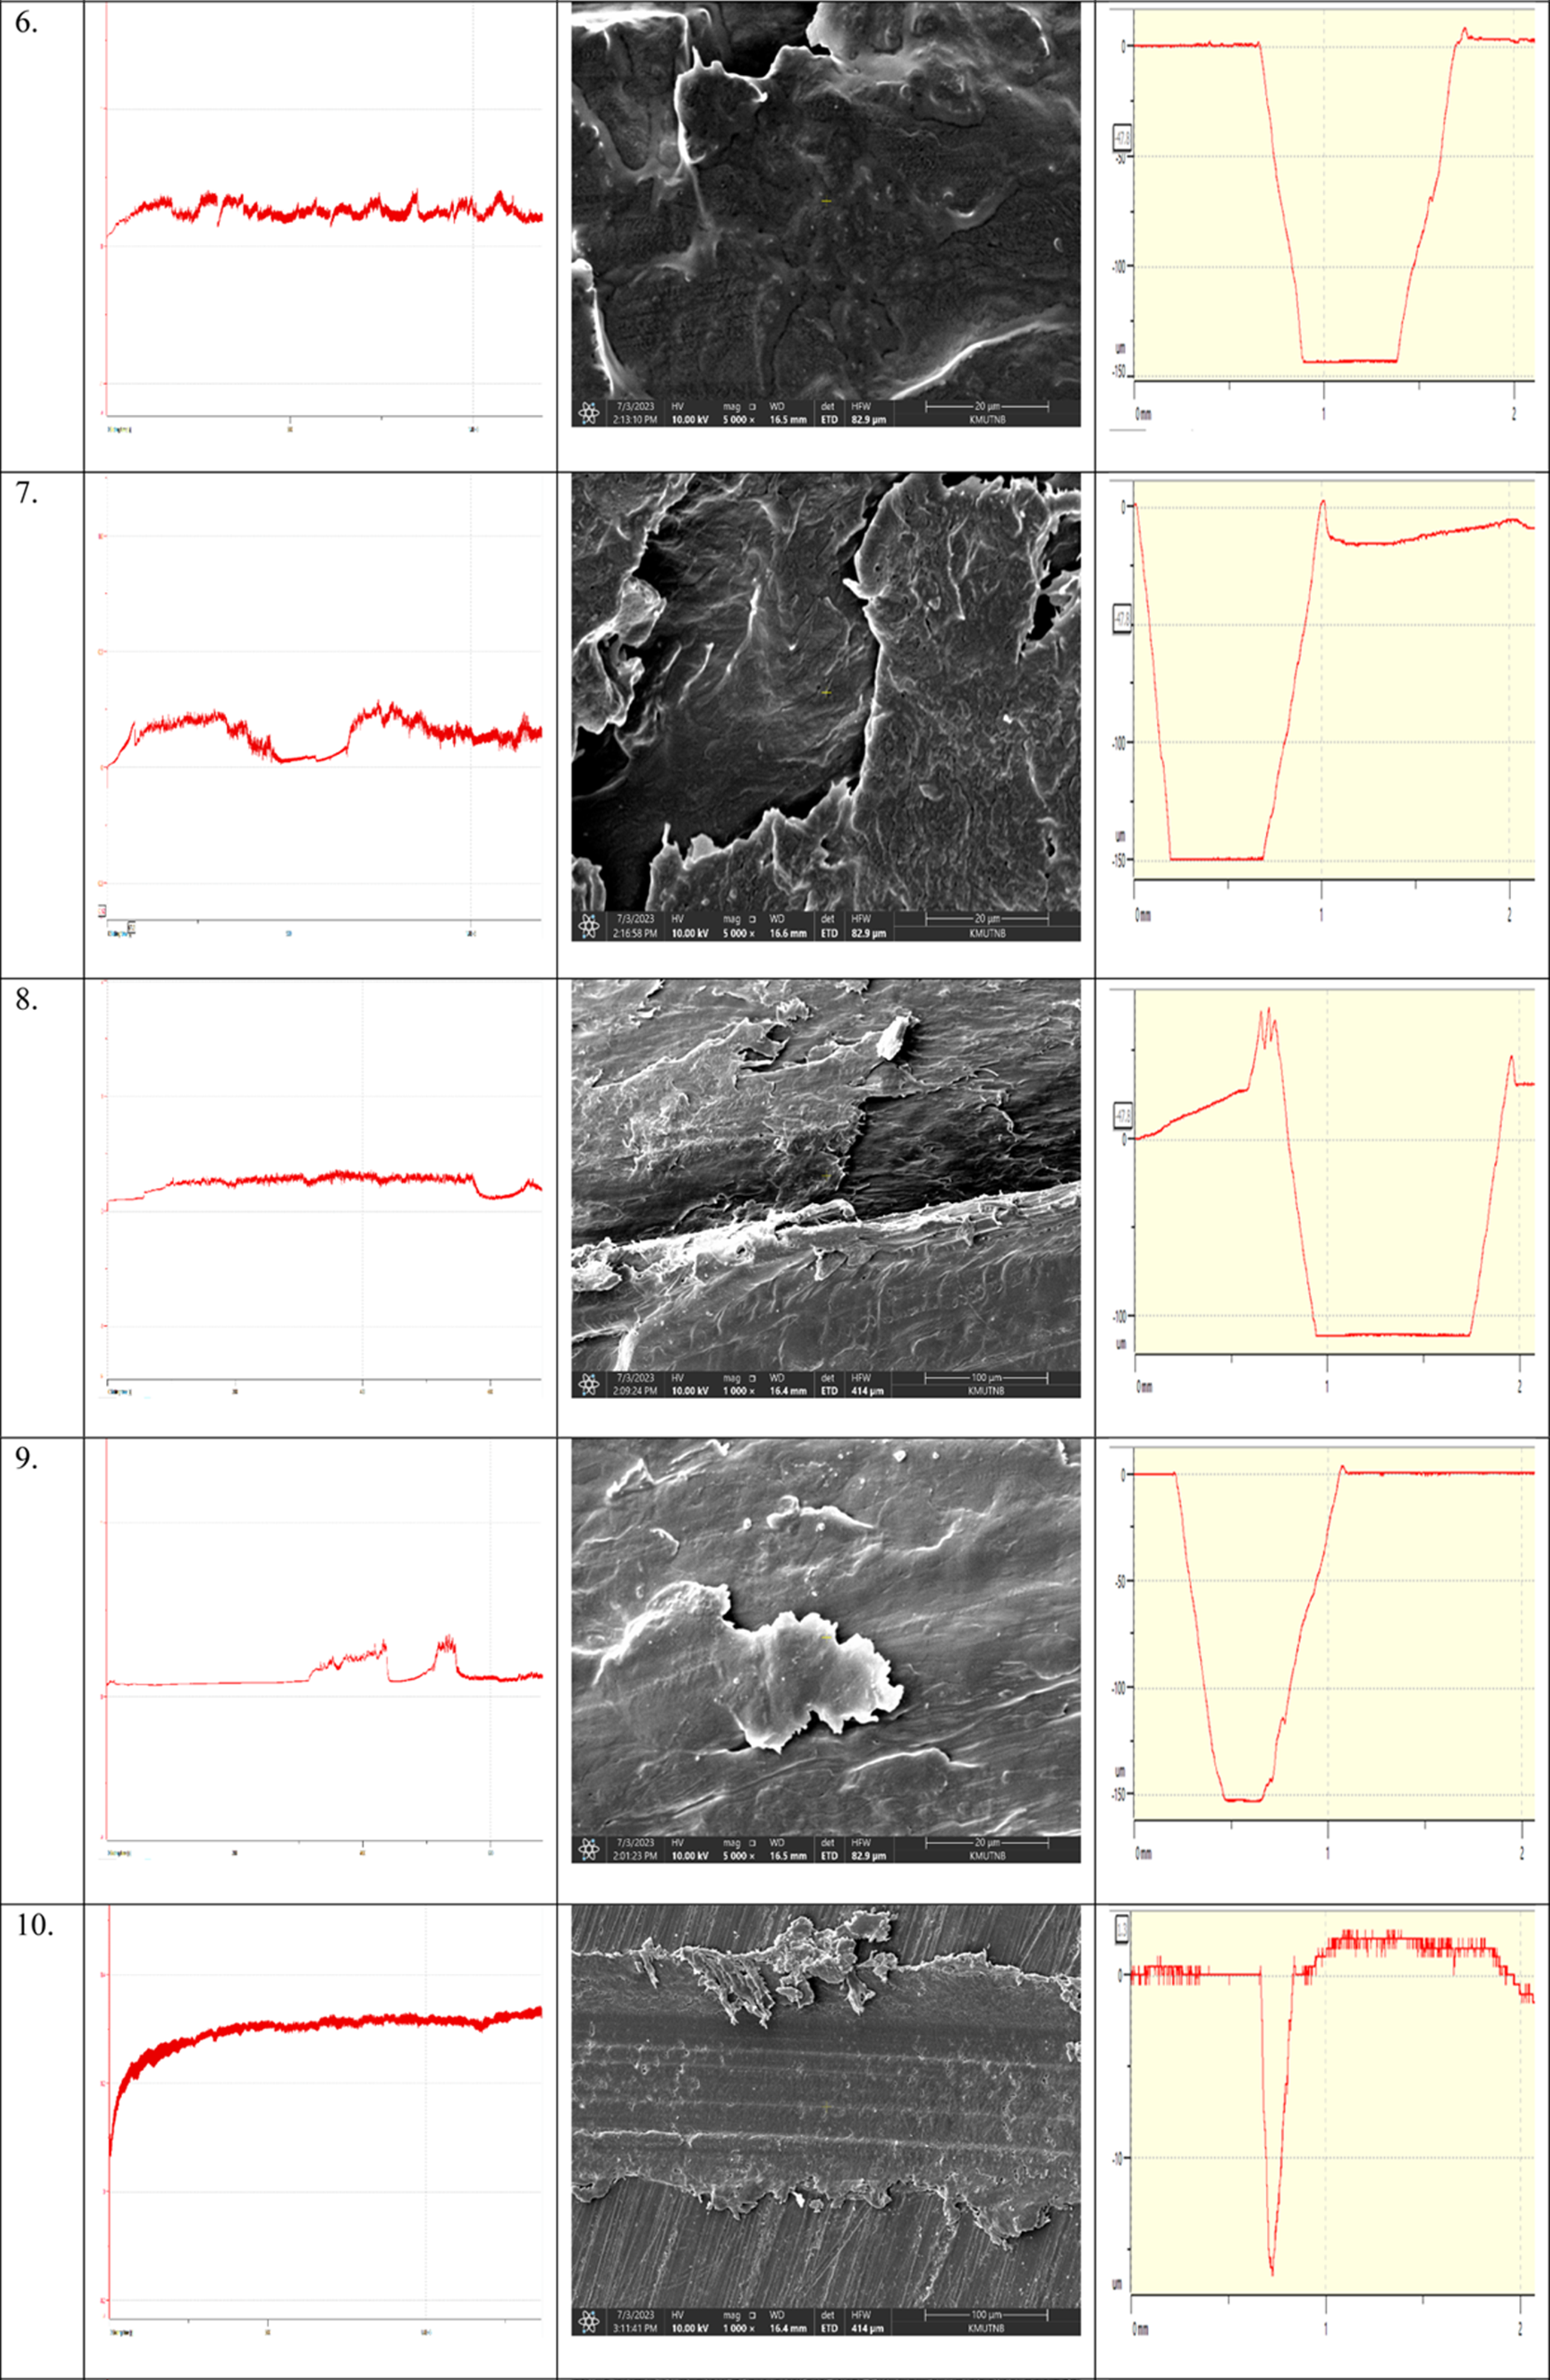
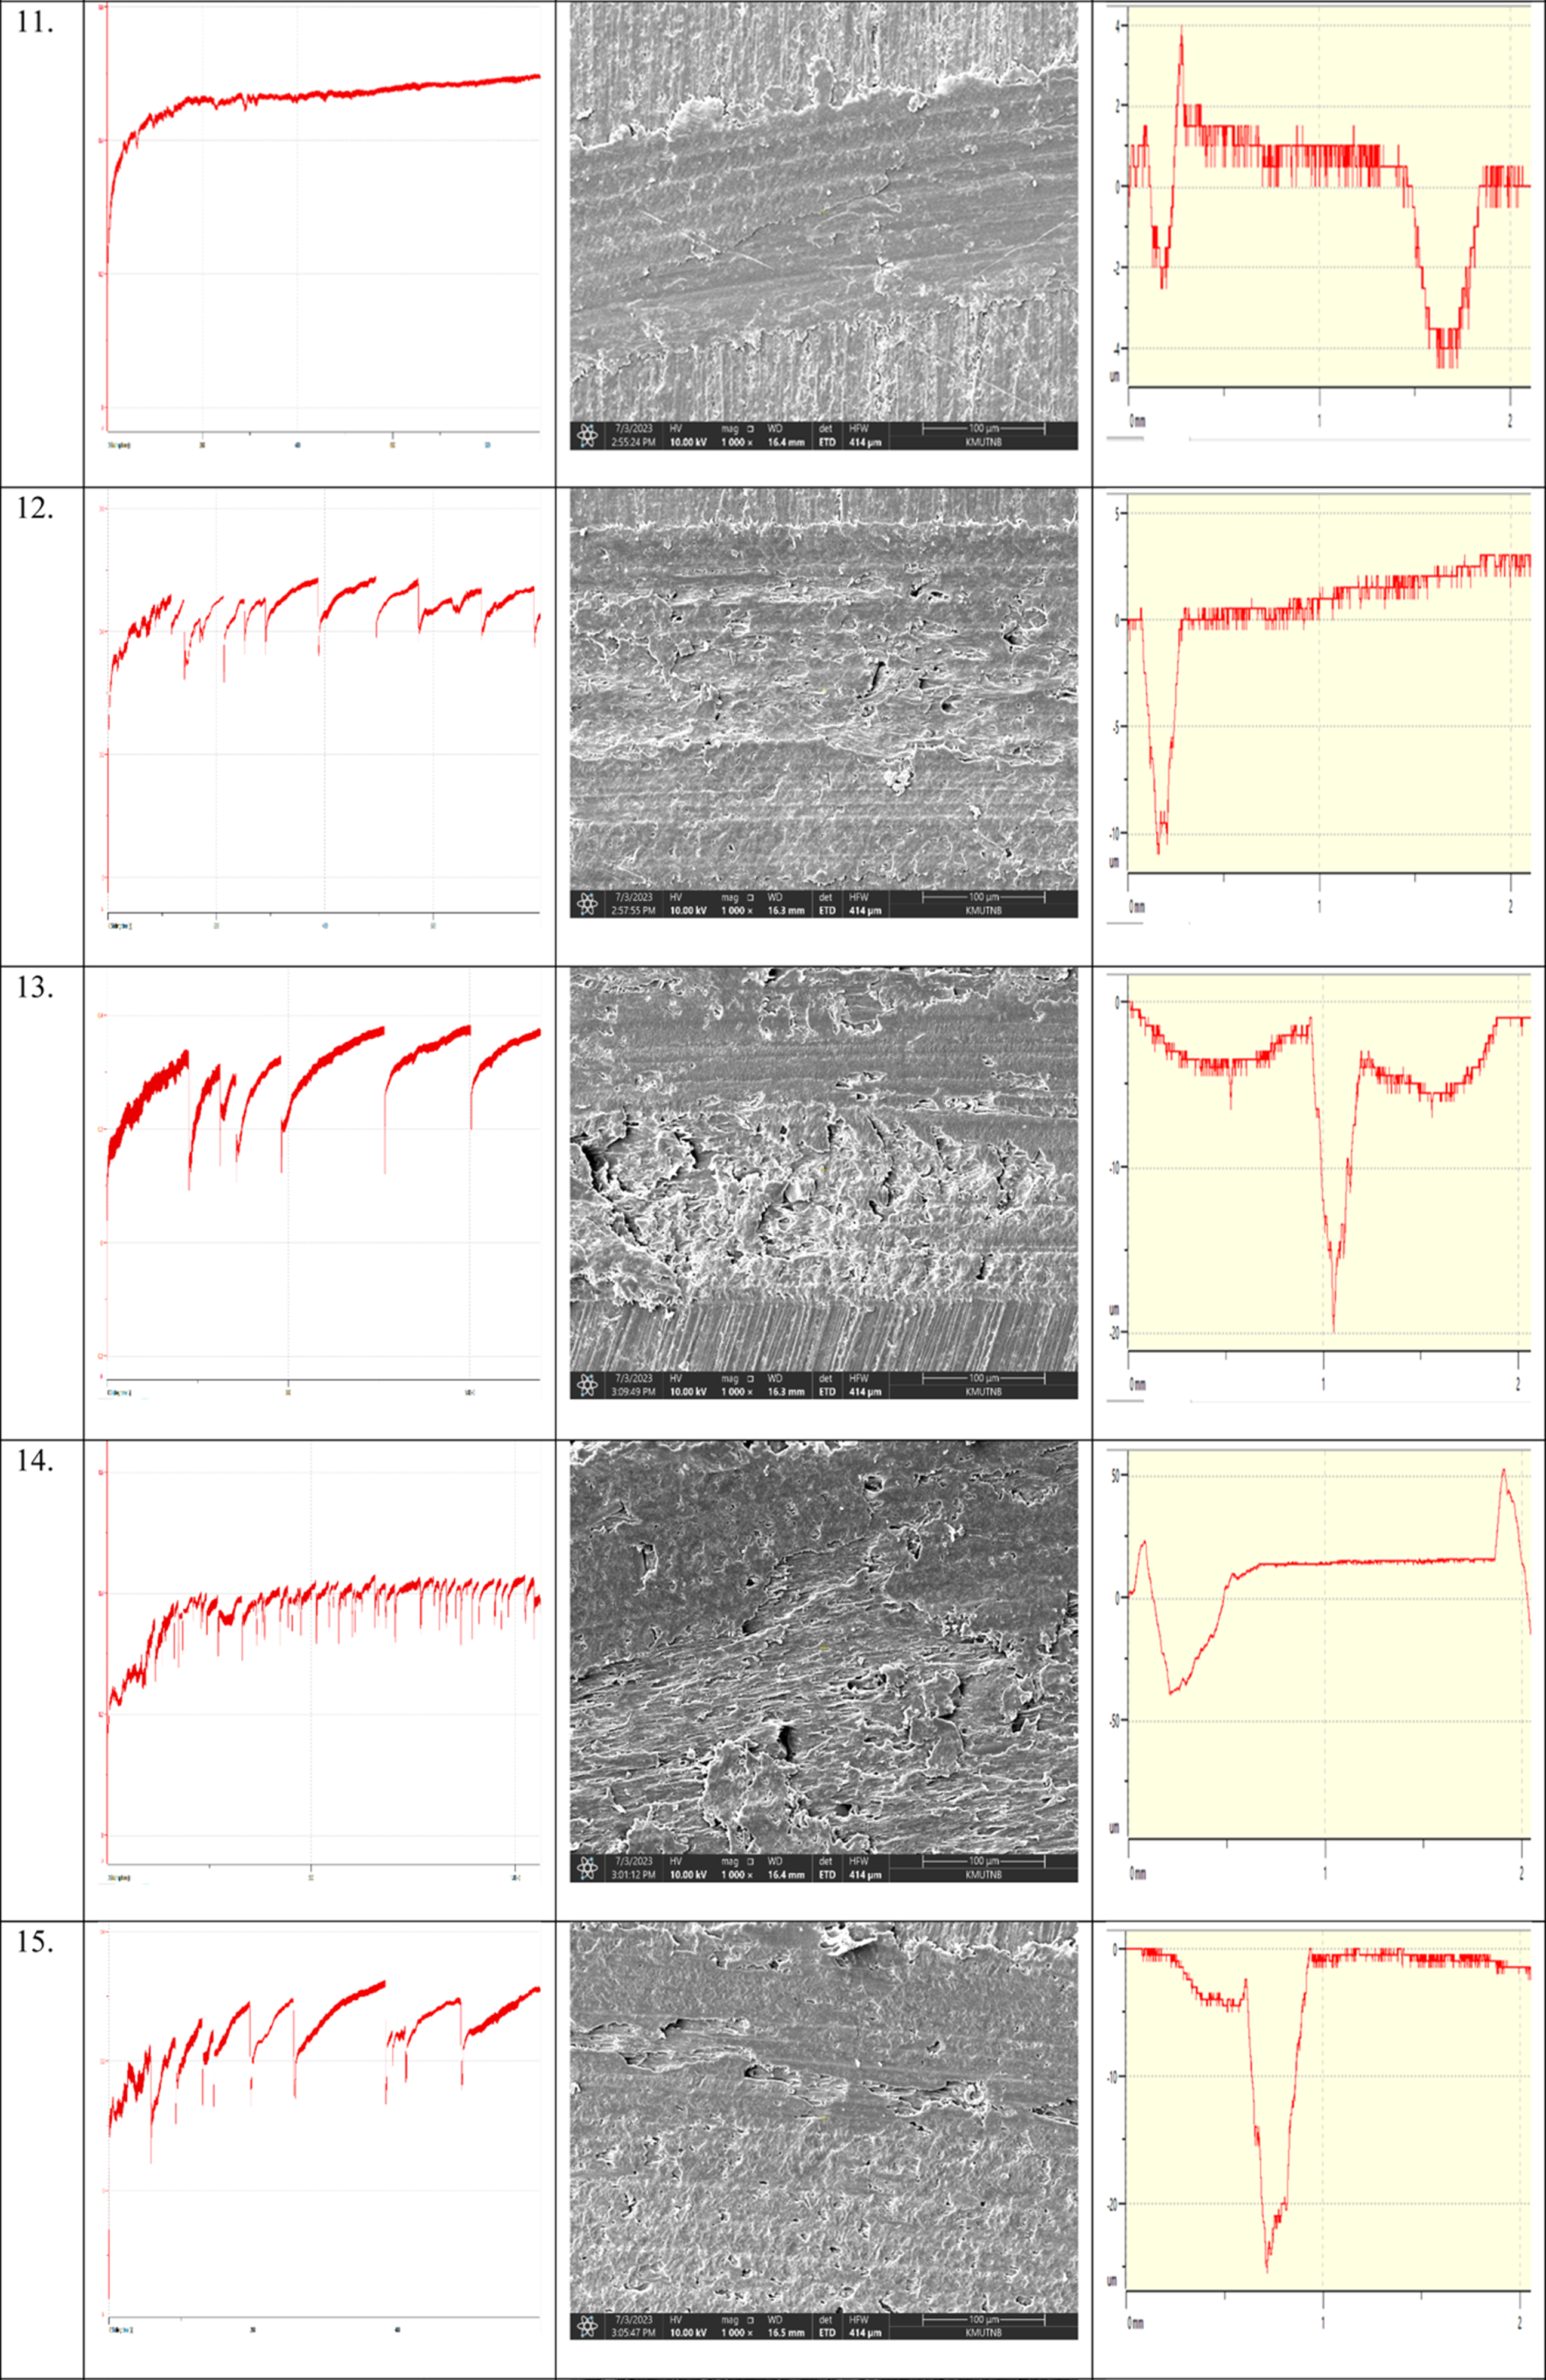
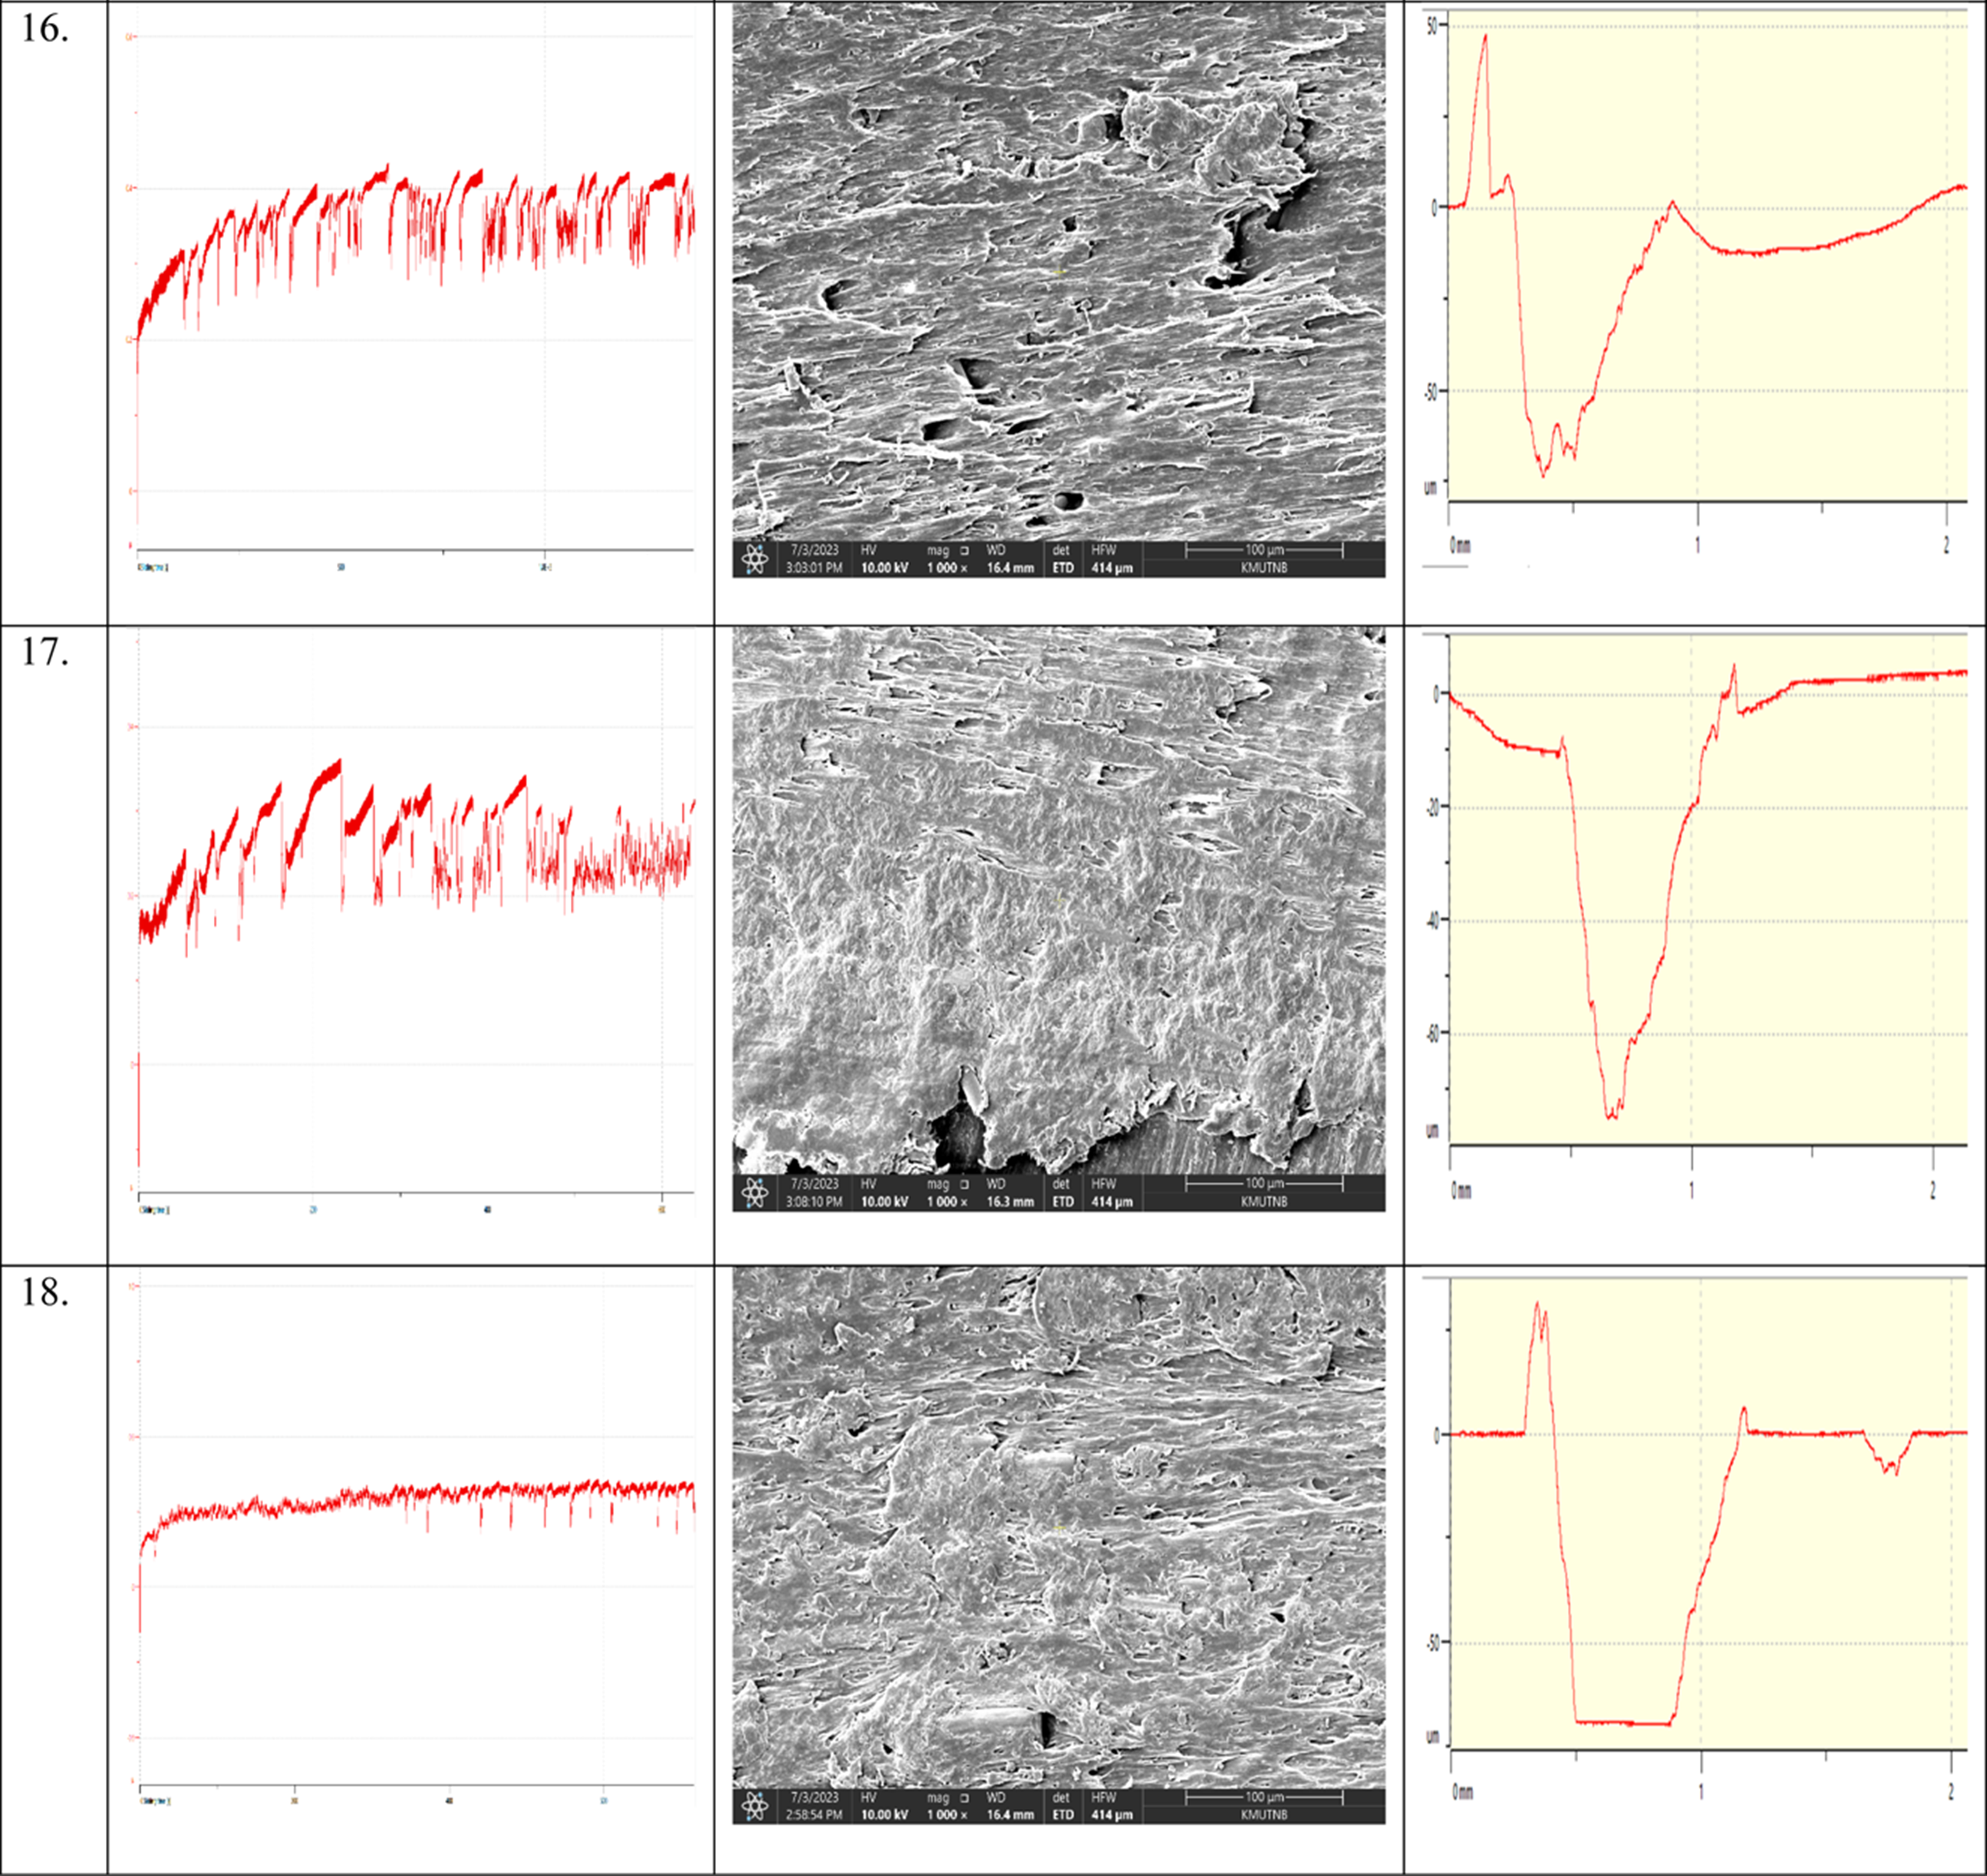
The surface morphologies as shown from 1st to 3rd is appeared with smooth surfaces without much damages and significant cracks. Moreover, the COF plots in these three is exist with minor variations of COF results and the depth of is found to be below −30 μm. With the increase of load from 3 to 6 N resulted in multiple tracks over the worn surface and the depth of profile increased above −50 μm. This is owing to an increase of wear penetration over the surface under maximum parametric conditions. The 2D profiles from the runs four to six reveal that there is generation of peak debris on the sides of the wear track because of deeper depth and material flow from inside. The polymer thermally softens when sliding speed and load rises as a result of increasing heat production. By using plastic deformation, contaminants from wear at the junction may be compressed into the polymer and create a layer of protection over the same surface. This can be observed in the morphologies shown from the runs seven to 9. According to the morphologies, the majority of the wear debris from plain PLA and its blends takes the shape of lumps of polymer. The lubricating action of these lumps of polymers transported to the counterface may result in a reduction in the wear rate of PLA composites under the most extreme parametric settings. It was proposed that the lumps of PLA were taken out of the asperity spikes and remained clinging on the counterbody in the lumpy transmission process. 32 According to the SEM morphologies of runs from 7 to 9 and 16–18, larger loads cause both filled and unfilled samples to suffer more damages. According to SEM morphologies from run 10–18, the worn surfaces of filler-loaded samples are not considerably smoother, and the addition of filler particles significantly decreased matrix detachments. Instead of being a smooth surface, the surface is observed with more cracks and voids due to more concentration of basalt fillers and fabrication defects. More detachments in filler-loaded PLA samples are observed at resin-rich zones. Consequently, the small debris formation can be found on the wear track along with particle attachment. The filler-loaded PLA composite underwent a minimal amount of wear due to the uniformly worn surface with reduced surface-plowing and groove development. In some critical areas, the poor bonding of basalt particles with the PLA matrix resulted in more wear as compared to the unfilled PLA samples. At maximum load, the morphologies in the runs from 16 to 18 are experienced with multiple softened layers due to repeated processes of softening and hardening action. The COF plots for the filler-loaded samples revealed more variations in the plotted line due to the reinforcement effect. Whereas the smooth plots are observed in the unfilled sample that shows less deviation of COF over the same surface. The formation of debris and detachments are also the reasons for more deviations in the COF of PLA-based samples.
Conclusions
In this work, the frictional and wear behavior of basalt fillers reinforced polylactic acid composites are analyzed. The 30 wt% basalt fillers with PLA polymer were subjected to internal mixing and compression molding processes to fabricate the composite materials. The irregularly shaped basalt particles with sharp edges were observed with the morphological analysis. The reinforced basalt fillers that were examined utilizing a particle size distribution analyzer had median and mean sizes of 6.4765 μm and 8.1031 μm respectively. Energy dispersive X-ray examination employing SEM equipment was used to examine the components contained in this basalt filler, and it was discovered that silicon is the main constituent element. The tribology experiment was carried out utilizing the L18 orthogonal array and the pin-on-disc configuration, and MINITAB-19 software was used for the design, optimization, and statistical analysis. The Taguchi effects plot for PLA-based samples showed that the neat PLA sample at 3 N load, 100 rpm speed, and 100 m distance is determined to have the optimum parameters in response to COF. While 30 wt% basalt, a load of 6 N, a speed of 100 rpm, and a distance of 150 m are the SWR response’s ideal conditions. According to the ANOVA response, the basalt wt% is the most significant parameter as compared to other parameters. The consistent observation is that adding basalt fillers has not significantly reduced COF, but has contributed more to SWR reduction with all different kinds of thermoplastic polymers. There is a result with the issue of maximum concentrations, where the potential for basalt particles to aggregate increased the composites and counter surfaces space. A significant amount of weight was lost and SWR occurred primarily as a result of the decreasing adhesion between the sliding surfaces due to the increase in spacing. At higher concentrations, more basalt particles can be found on the composite surfaces. With the increment of applied load, the temperature continues to raise and results in heat generation at the interfaces. Additionally, shorter travel distances are frequently associated with the best COF value. Due to the reinforcing effect, the COF plots for the filler-loaded samples showed the most fluctuations in the plotted line. In contrast, the unfilled sample exhibits smooth graphs that demonstrate less COF variation across the same surface. The depth of the profile is majorly affected by the applied load, where the wear track depth was increased with increasing load values. As revealed in the neat polymer sample’s morphology, the maximum parameters effect is more pronounced, creating the illusion of deep grooves and many tracks across a single worn surface. There was a significant rise in the COF and SWR in some of the regime, which may have been caused by the elastic contraction of surface defects brought on by rising contact temperature. In an extreme wear regimes with larger loads and a slower sliding velocity, this mechanism predominated. A tiny piece of the displaced material that was removed from the outermost layer experienced surface fatigue due to repetitive ploughing and matrix fracture. By inhibiting polymer detachment and protecting the surface from polymer peeling, basalt filler particles in composites were able to reduce this impact. Overall, the findings point to the viability of thermoplastic composite for the production of rollers for paper mills.
Footnotes
Declaration of conflicting interests
The author(s) declared no potential conflicts of interest with respect to the research, authorship, and/or publication of this article.
Funding
The author(s) disclosed receipt of the following financial support for the research, authorship, and/or publication of this article: This research was funded by National Science, Research and Innovation Fund (NSRF), and King Mongkut’s University of Technology North Bangkok with Contract no. KMUTNB-FF-67-A-01.