
Abstract
Although the number of implants has increased gradually and consistently over the years to around one million per year globally, there is still far more potential for advancement in the field of dental implantology which is typically growing quickly. This study investigates the effect of nanofiller reinforcement high-performance polymer matrix to enhance mechanical and physical characteristics. Calcium silicate (CS)/Polyetherketoneketone (PEKK) biomedical composite (G0 as a control group) is reinforced with different weight percentages (G1-G4) of tellurium dioxide nanoparticles (TeO2 NPs) (n = 5). This research uses ethanol as a binder for mixing various weight percentages (wt%) of TeO2 NPs with CS/PEKK biomedical composite. The combination is then dried at 120°C in a forced convection oven before being put into special molds and compressed for 20 min Holding period at 310°C and 15 MPa. The composites were prepared via the compression molding technique. Morphological, mechanical, and physical characteristics were studied. The findings of this study suggested improvement in the interfacial interaction between TeO2 NPs (G1 and G2) and CS/PEKK bioactive composite resulting in better mechanical and physical properties, especially at 1 w% of TeO2 NPs (G2).
Introduction
This research is an extension of our previously published work. 1 To support a replacement tooth or teeth, partial or complete dentures, or a maxillofacial prosthesis, a dental implant is surgically implanted into the ostium to mimic the radicular area of the tooth. 2 Dental implant procedures are growing in popularity because of the aging population living longer, and the facts of failing fixed dental bridges and removable prostheses. 3 Chemically, dental implants might be constructed of metals, ceramics, or polymers. 4 The polyaryletherketon (PAEK) family of thermoplastic polymers has a unique mix of remarkable mechanical, chemical, and thermal characteristics. 5 PEKK polymers; members of the PAEK family with aromatic rings in their structures exhibit tremendous strength, and are similar to the bone in strength and compliance.6,7 They are radiolucent, biocompatible, and bioinert. The fact that they are neither osteogenic nor bioactive when administered alone, conversely, maybe a disadvantage. 8 Recently, both the industrial and academic sectors have shown a great deal of interest in polymer blends and polymer composites. It is generally known that by altering the type and quantity of each component, a multi-component composite system may be extremely beneficial for enhancing the characteristics, processability, and cost of polymeric materials. 9 The addition of ceramic material is a reported technique for creating a bioactive composite material because of its ability to stimulate osteogenesis. 5
Calcium silicate (CS) is one of the bioactive dental glass ceramics that can solidly link with hard tissue when it comes into contact with the tissue. It may encourage osteoblast proliferation and osteogenic differentiation. It is biodegradable, bioactive, and biocompatible. 10 Conversely, the usage of bioactive ceramics is constrained due to their brittleness and higher elastic moduli than human bone.
Because of their distinctive designs and characteristics, breakthroughs in nanomaterials and technology have recently attracted more attention. Nanofiller-filled polymers have drawn a lot of attention in several disciplines. Their exceptional mechanical, electrical, and thermal characteristics aid in achieving desired outcomes. Numerous applications in medicine and dentistry have been strengthened by the development of nanomaterials. 11 Tellurium dioxide; a semimetal oxide, is a component of materials with unique properties that make it useful in a variety of fields. 12 White, crystalline, glassy tellurium dioxide is a practically water-insoluble, chemically inert compound. 13 Tellurium materials can be employed as antibacterial agents, making them comparable to titanium dioxide (TiO2) and zinc oxide (ZnO) nanomaterials. 14
To attain optimum biological characteristics and biocompatibility, several processing and materials for altering dental implants’ surfaces have been created in recent decades. 15 By obtaining optimal implant features, such as their biomechanical and surface characteristics, the clinical success of dental implants can be increased. 16
In our previous study, 1 the idea of employing bioactive CS as reinforcement in a PEKK matrix has been used. The primary goal was to create a composite material that is physiologically and mechanically compatible and can be used as a bone implant material. The bioactive composite was manufactured by combining organic polymer (PEKK) having a 33 m average particle size with 15 wt% of bioactive calcium silicate micro-particles with 0.7 µm particle size.
Previous investigations focused on the impact of using various fillers to improve the bioactivity and mechanical characteristics of members of the PAEK family. The PEEK and PEKK contain several inorganic components incorporated. According to the findings of Kim et al. (2009),
17
the mechanical characteristics of the PEEK matrix were enhanced by 20 vol% CS particles. PEEK's bioactivity is demonstrably enhanced by n-TiO2 according to a study conducted by Wu et al. (2020).
18
According to the study of Wang et al. (2014),
19
PEEK/nano-FHA biomaterial had improved in vitro biocompatibility and antibacterial activity and promoted osseointegration in vivo. As reported by Hu et al. (2016),
20
the 24-weight percent of m-CS integrated into PEEK exhibited excellent biocompatibility, appropriate hydrophilicity, and bioactivity. In their comparison of n-HA/PEEK and n-CS/PEEK composites, Ma et al. (2016)
21
concluded that n-CS/PEEK showed a greater bone contact ratio and more new bone development. In comparison to unmodified PEKK, the results of Jani and Fatalla (2022)
22
demonstrated an improvement in the mechanical characteristics of nSr-HA/PEKK with no change to the chemical structure. Furthermore, Mazur et al. (2016) fabricate a carbon fiber PEKK composite and reported an excellent thermoplastic composite impregnation produced by hot compression molding.
23
In this study, a second different wt% of TeO2 NPs were added to the previously determined bioactive composite via compression molding technique to select the optimum concentrations of TeO2 NPs that should be incorporated within the CS/PEKK matrix after taking into account the following study hypotheses where; 1. The null hypothesis (H0) asserts that the inclusion of tellurium dioxide into the CS/PEKK matrix will not affect the matrix’s mechanical or physical characteristics. 2. The alternative hypothesis (H1) postulated that tellurium dioxide would improve the mechanical and physical characteristics of the CS/PEKK matrix.
Methods
Composite preparation
The CS/PEEK composites were produced by compression molding per our previously discussed methodology. 1 Briefly, samples were fabricated by mixing various weight ratios of the CS powder with an average particle size of 0.7 μm purchased from (Sigma-Aldrich, Inc., St Louis, MO), with 95% ethanol in an ultrasonic processor (MSK-USP-3N-LD, MTI Corporation, USA) to appropriately blend the powder particles. The procedure proceeds after the addition of PEKK powder with an average particle size of 33 μm purchased from (KSTONE®, Shandong Kaisheng New Materials Co., Ltd, China). To achieve a consistent powder mixture, the resultant mixture was then co-dispersed for a further 10 min2 24 To eliminate moisture, this powder combination was then dried overnight at 120°C for 10 h before being placed in a specially designed mold to produce test samples. 25 After preheating the die to 150°C, the powder was compacted at a pressure of 15 MPa. At a maximum temperature of 310°C, the mixture was held in situ between heated platens for 10 min to ensure sufficient CS particle mixing in molten PEKK. The pressure was then kept at 15 MPa despite switching off the heaters. Using a turning lathe, solidify compression-molded sheet disk samples with dimensions of 15 mm in diameter and 2 mm in thickness were cut for material assessment. 26 A vernier caliper was used to measure each sheet at six different locations before cutting; five measurements were taken along the boundaries of any two adjacent sides, and one measurement was taken in the center. 27 A specimen for flexural strength was fabricated in compliance with ASTM D790. 28
All samples were sterilized for 2 hours in an ultrasonic oscillator with deionized water before being sealed and placed in sterile containers. 29
The extra step in this investigation is to co-disperse (0.5, 1, 1.5, and (2) wt% of TeO2 NPs with an average particle size of 57.9 nm purchased from (Nanochemazone, Chemazone Inc., Canada), with the ethanol followed by the addition of previously determined CS load and PEKK with 10 min of mixing after each addition.
Characterization and testing
Powders
Various characterization approaches were used to analyze PEKK and CS MPs powders. 1 TeO2 NPs were also subjected to several characterization techniques. The average particle size was established using a particle size analyzer (PSA) (90 plus, Brookhaven Instruments Corporation, USA). An X-ray fluorescence (XRF) was used for multi-element analysis of major, minor, and trace element concentrations (XEPOS, Spectro analytical instruments GmbH, Germany). To excite the samples, compressed powder discs were used. The X-ray radiation was generated by an X-ray tube that ran at a voltage of between 10 and 100 kV. Powder morphology employing X-ray diffraction (XRD) technology (Lab. X, XRD 6000, Shimadzu, Japan) with CuK radiation and a detector running at 40 kV and 40 mA voltage and current respectively; scan speed/duration time 1° deg./min. The data collection process used a fixed time mode of 1.2 s. Scan angles ranged 2θ = 10° to 80°, 30 while chemical functions utilizing Fourier transform infrared spectroscopy (FTIR) (Alpha II, Bruker, Germany) with an average scanning range of 400–4000 cm−1 at 25 ± 1°C. Origin 9SE version 2018 was used to draw the diffraction data (OriginLab, Northampton, USA) for XRD and FTIR analyses.
TeO2/CS/PEKK composite prepared samples
Numerous analytical techniques were used to characterize the un-modified PEKK, CS/PEKK composite prepared samples, and (0.5, 1, 1.5, and (2) weight percent TeO2/CS/PEKK composite prepared samples. Energy-dispersive X-ray spectroscopy (EDS) in conjunction with field emission scanning electron microscopy (FE-SEM) equipment was used to evaluate the microstructure, morphology, and chemical contents of the produced sample (Inspect F50, FEI Technologies Inc., United States). Following flexural strength testing, the fracture morphology of samples manufactured using (0.5, 1, 1.5, and (2) wt% of TeO2/CS/PEKK composite was further studied. Additionally, a computer-controlled electronic universal testing machine (Laryee Technology Co., Ltd, China) was used for mechanical characterization, with the cross-head speed set to 1 mm/min. 31 Concurrently, the stress-strain curve was used to determine the elastic modulus. Finally, using contact angle measurement equipment (Creating Nano Technologies Inc., Taiwan), the sessile drop technique was used to calculate the hydrophilicity. At 25°C, a drop of normal saline was placed on the samples’ surface. Immediately after the drop was let to free fall onto the flat sample’s surfaces, the contact angle was measured. The average of three measurements taken at various points on the specimen's surface was reported. 7
In vitro study
Following the pilot study that was conducted to determine the ideal amount of TeO2 to add to the CS/PEKK composite, several in vitro tests were carried out for the 1 wt% TeO2 incorporated within CS/PEKK. Chemical functionalities employing FTIR machine (Alpha II, Bruker, Germany) with a scanning range of 400–4000 cm−1 at 25°C in the average infrared area. 32 While atomic force microscopy (AFM) (NaioAFM 2022, Nanosurf AG, Switzerland) was used to analyze the surface morphology, roughness, and topography in comparison to the un-modified PEKK and G0. The AFM probe (Tap190GD-G) was used for measurements with tapping mode over a 15 µm x 15 µm scan area. The force constant was 26 N/m. 33 Each sample was measured in four separate locations perpendicular to the surface. The final roughness average score for each sample was calculated using a statistically analyzed mean Ra value. 34 Furthermore, a digital Vickers micro-hardness tester (HVS-1000, Laryee testing machines. Beijing, China) using a standard 136° Vickers diamond pyramid indenter combined with optical microscopy was used to record the hardness of the composite and compare it with the hardness of un-modified PEKK and G0. A 500 g load applied to the surface of the disk samples for 15 s was employed. An average of 3 different readings was measured for each sample. 35
Statistical analysis
The variations between the study groups were examined using a one-way analysis of variance (ANOVA). Furthermore, the least significant difference (LSD) post hoc test was used to compare the mean value of each experimental group. Statistically high significance (HS) was considered when the probability p value was equal to or less than 0.01. p values equal to or less than 0.05 were considered significant (S), whereas p values more than 0.05 were considered non-significant (NS). SPSS software (Statistical Package for Social Sciences, version 23.0) was used to examine the electronic data.
Results
X-ray fluorescence
XRF multi-elemental analysis of TeO2 powder.
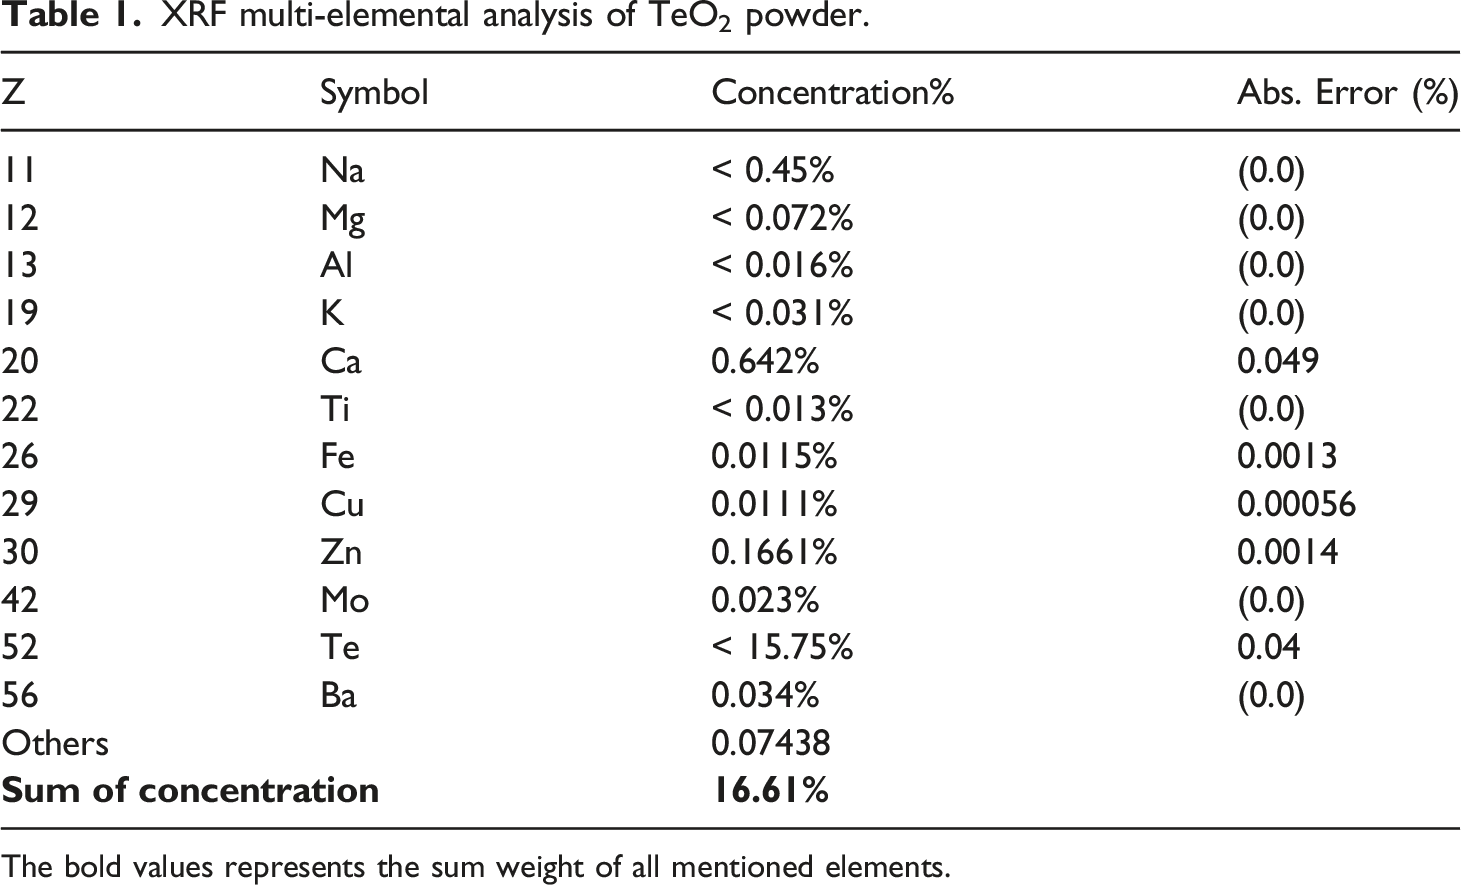
The bold values represents the sum weight of all mentioned elements.
Particle size analyzer
TeO2 powder’s particle size analysis tool reveals a restricted distribution with an average particle size of 57.9 nm. (Figure 1). PSA of TeO2 powder.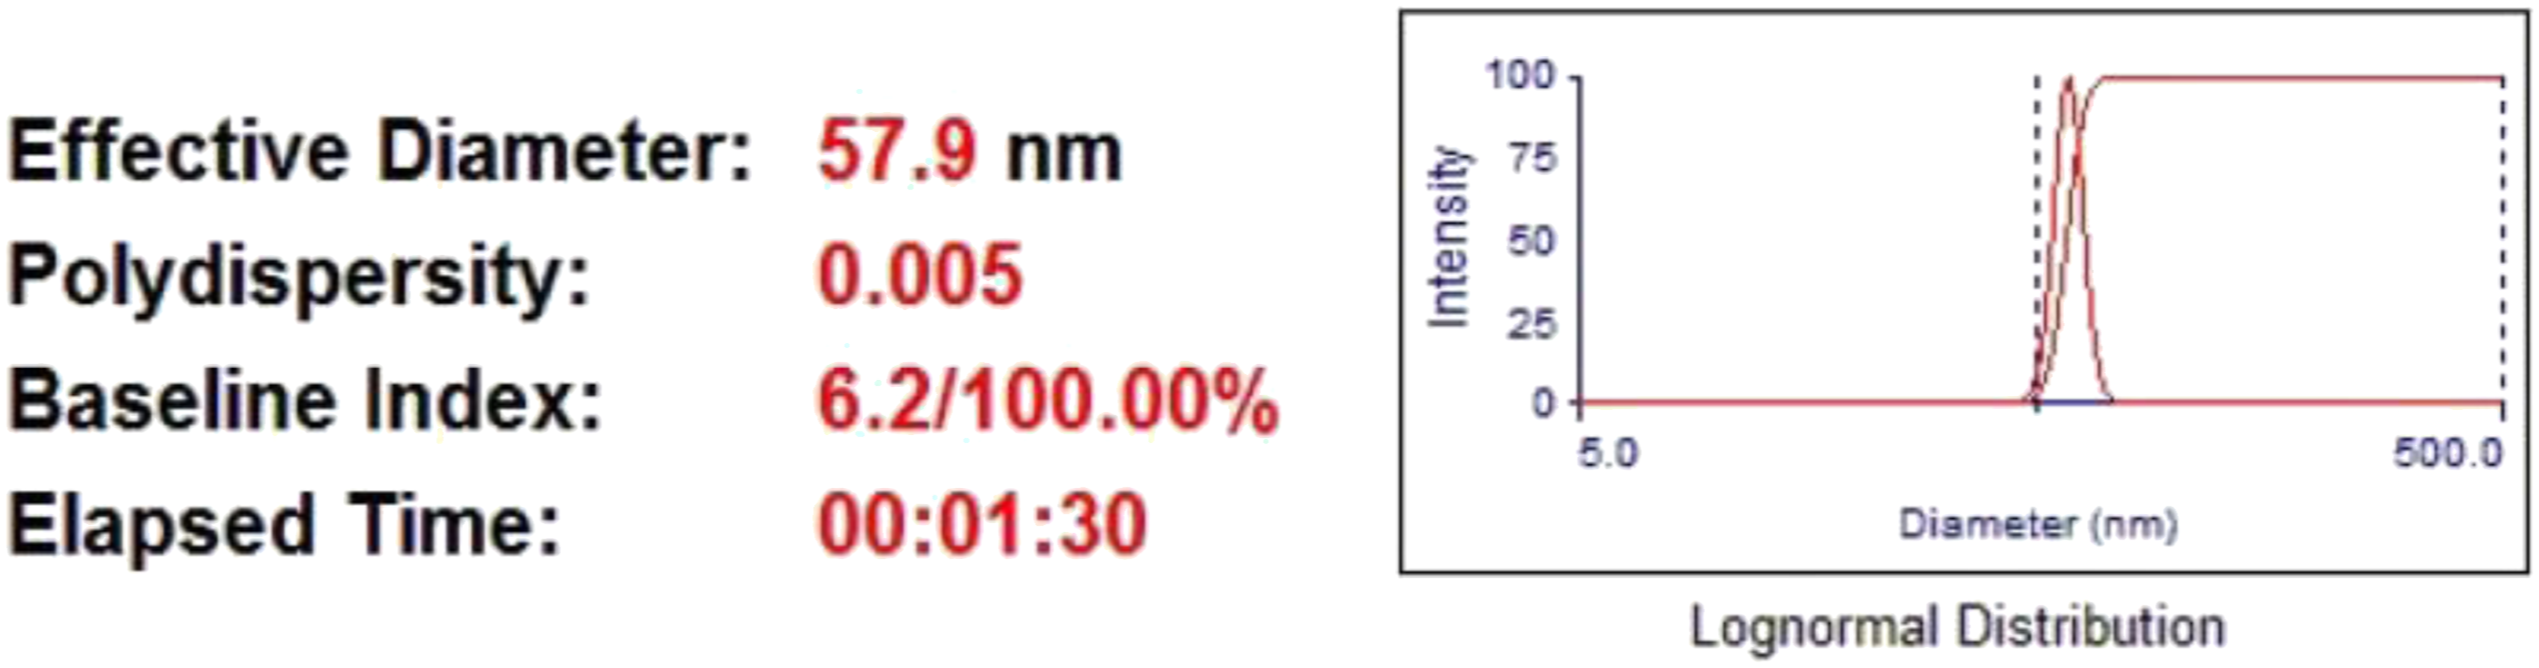
X-ray diffraction
The diffraction peaks are parallel to the tetragonal phase of TeO2 and are located at about 2θ= 21.5° at [101], 25.8° at [110], 28.4° at [111], 29.6° at [102], 37.04° at [201], 43.3° at [211], 47.4° at [004], 48.2° at [212], 53.5° at [220], 54.8° at [114], 58.4° at [310], 61.8° at [204], 57.2° at [322] and 77.5° at [106].
12
The obtained X-ray peaks do not contain any peaks parallel to any impurities that would suggest TeO2 is in its single-crystalline phase (Figure 2). XRD peaks of TeO2 powder.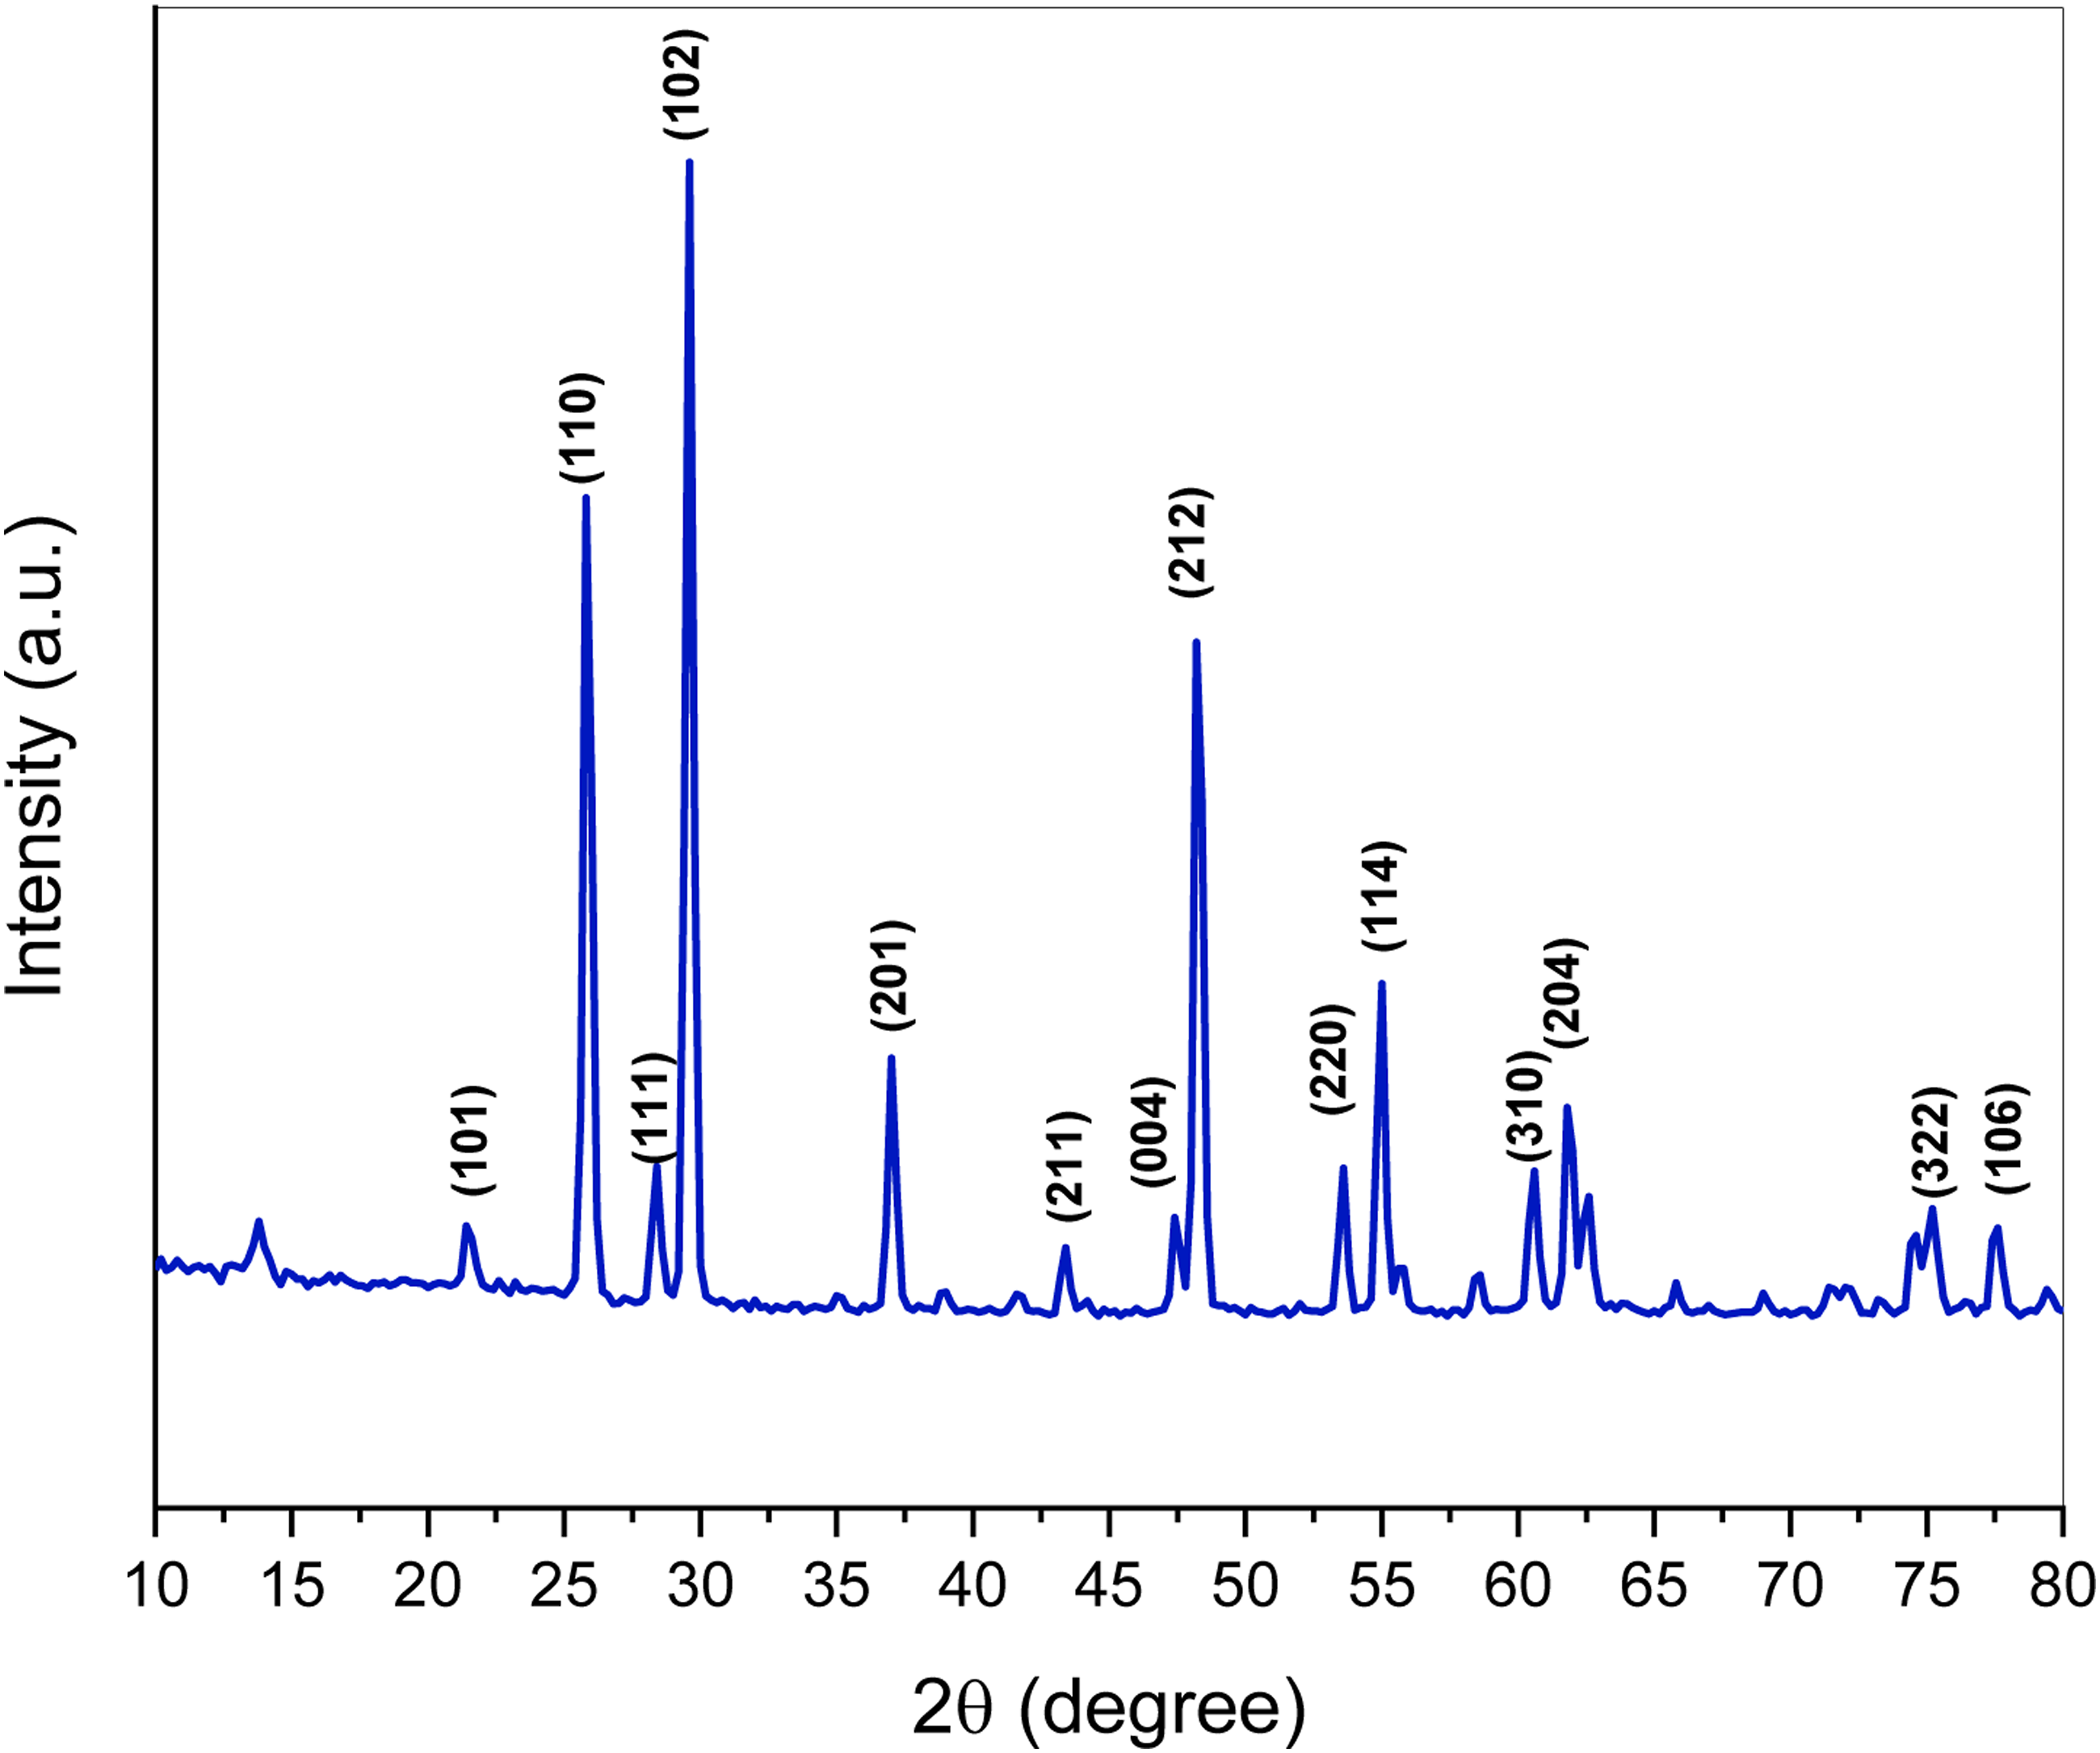
Fourier transform infrared spectroscopy
All of PEKK's distinguishing bands—benzene, ketone, and ether bond—are seen. The benzene ring extension vibration's wave number of (=C-H) is discovered at 3061 cm−1 and 3094 cm−1. The C=C stretching vibration in the benzene ring is related to the peak at 1584 cm−1. The C-O-C aromatic ether structure stretches at 1112 cm−1, 1155 cm−1, and 1231 cm−1. Bands at 1648 m−1 are connected to the ketone linkage’s C=O group.5,36 PEKK crystallinity after compression molding was reported at 1305 cm−1, 1272 cm−1, 985 cm−1, and 920 cm−15,37
The IR absorption band in the range of 850–1100 cm−1 represented by peaks at 856 cm−1, 876 cm−1, 954 cm−1, and 1063 cm−1 correspond to antisymmetric stretching of Si–O–Si bonds as well as asymmetric and symmetric stretching of Si–O terminal bonds.38,39 The peak at 700 cm−1 represents the symmetric stretching of Si–O–Si bonds while the peaks at 448 cm−1 and 542 cm−1 represent CaO stretching vibration. 40
The main infrared bands at 583 cm−1 and 766 cm−1 represent symmetrical stretching vibration of Te-O bonds.41,42
After the addition of CS, the PEKK characteristic bands were reported without the detection of new peaks suggesting the absence of any chemical bond. The same result was detected after tellurium dioxide addition (Figure 3). FTIR spectra of PEKK, G0, and G2.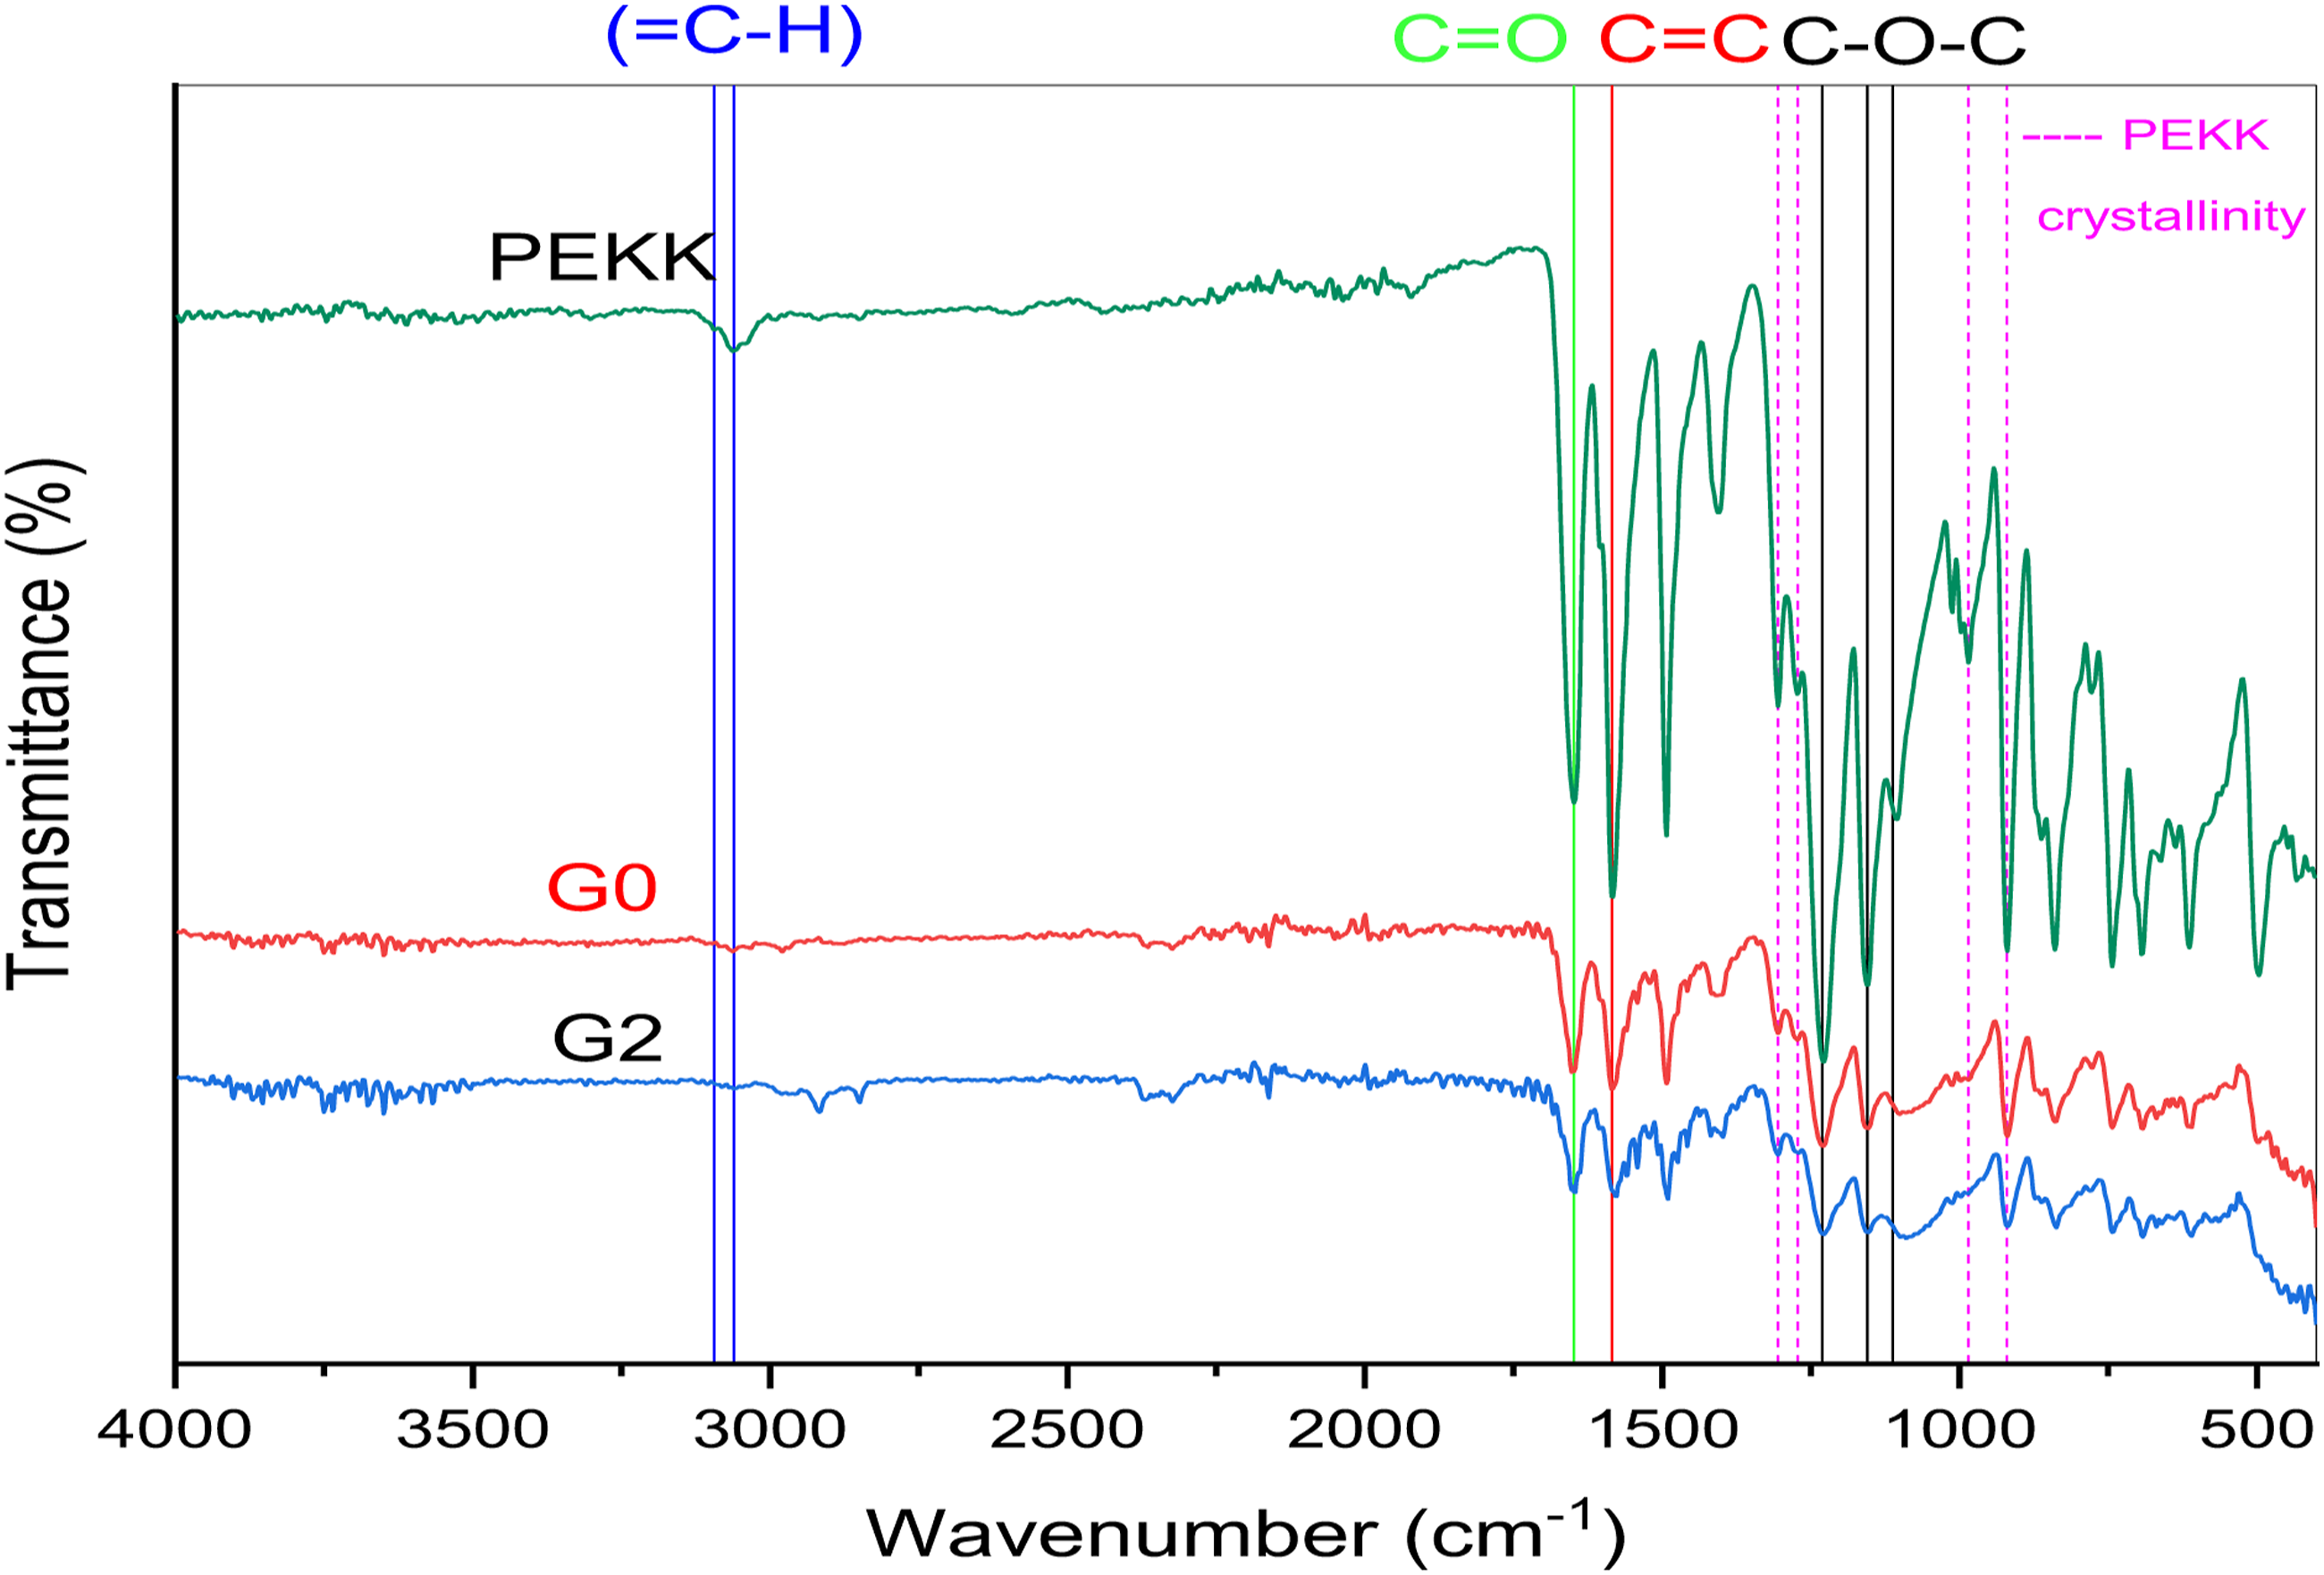
Field emission scanning electron microscopy and energy-dispersive spectrometry
The FE-SEM picture of various TeO2 incorporating onto 15% of weight CS/PEKK biocomposites was shown in Figure 4. Since no particles were found on the surface of the G0 and G1 sample, it seems dense, compact, and smooth. The surface of the G2 group gets rougher. The white particles that were randomly dispersed on the surface with increasing filler load in G3 and G4 might be explained by the presence of numerous agglomerates and voids inside the PEKK matrix. SEM images at 500 X showing surface of; (A)-PEKK, (B)-G0, (C)-G1, (D)-G2, (E)-G3, and (F)-G4.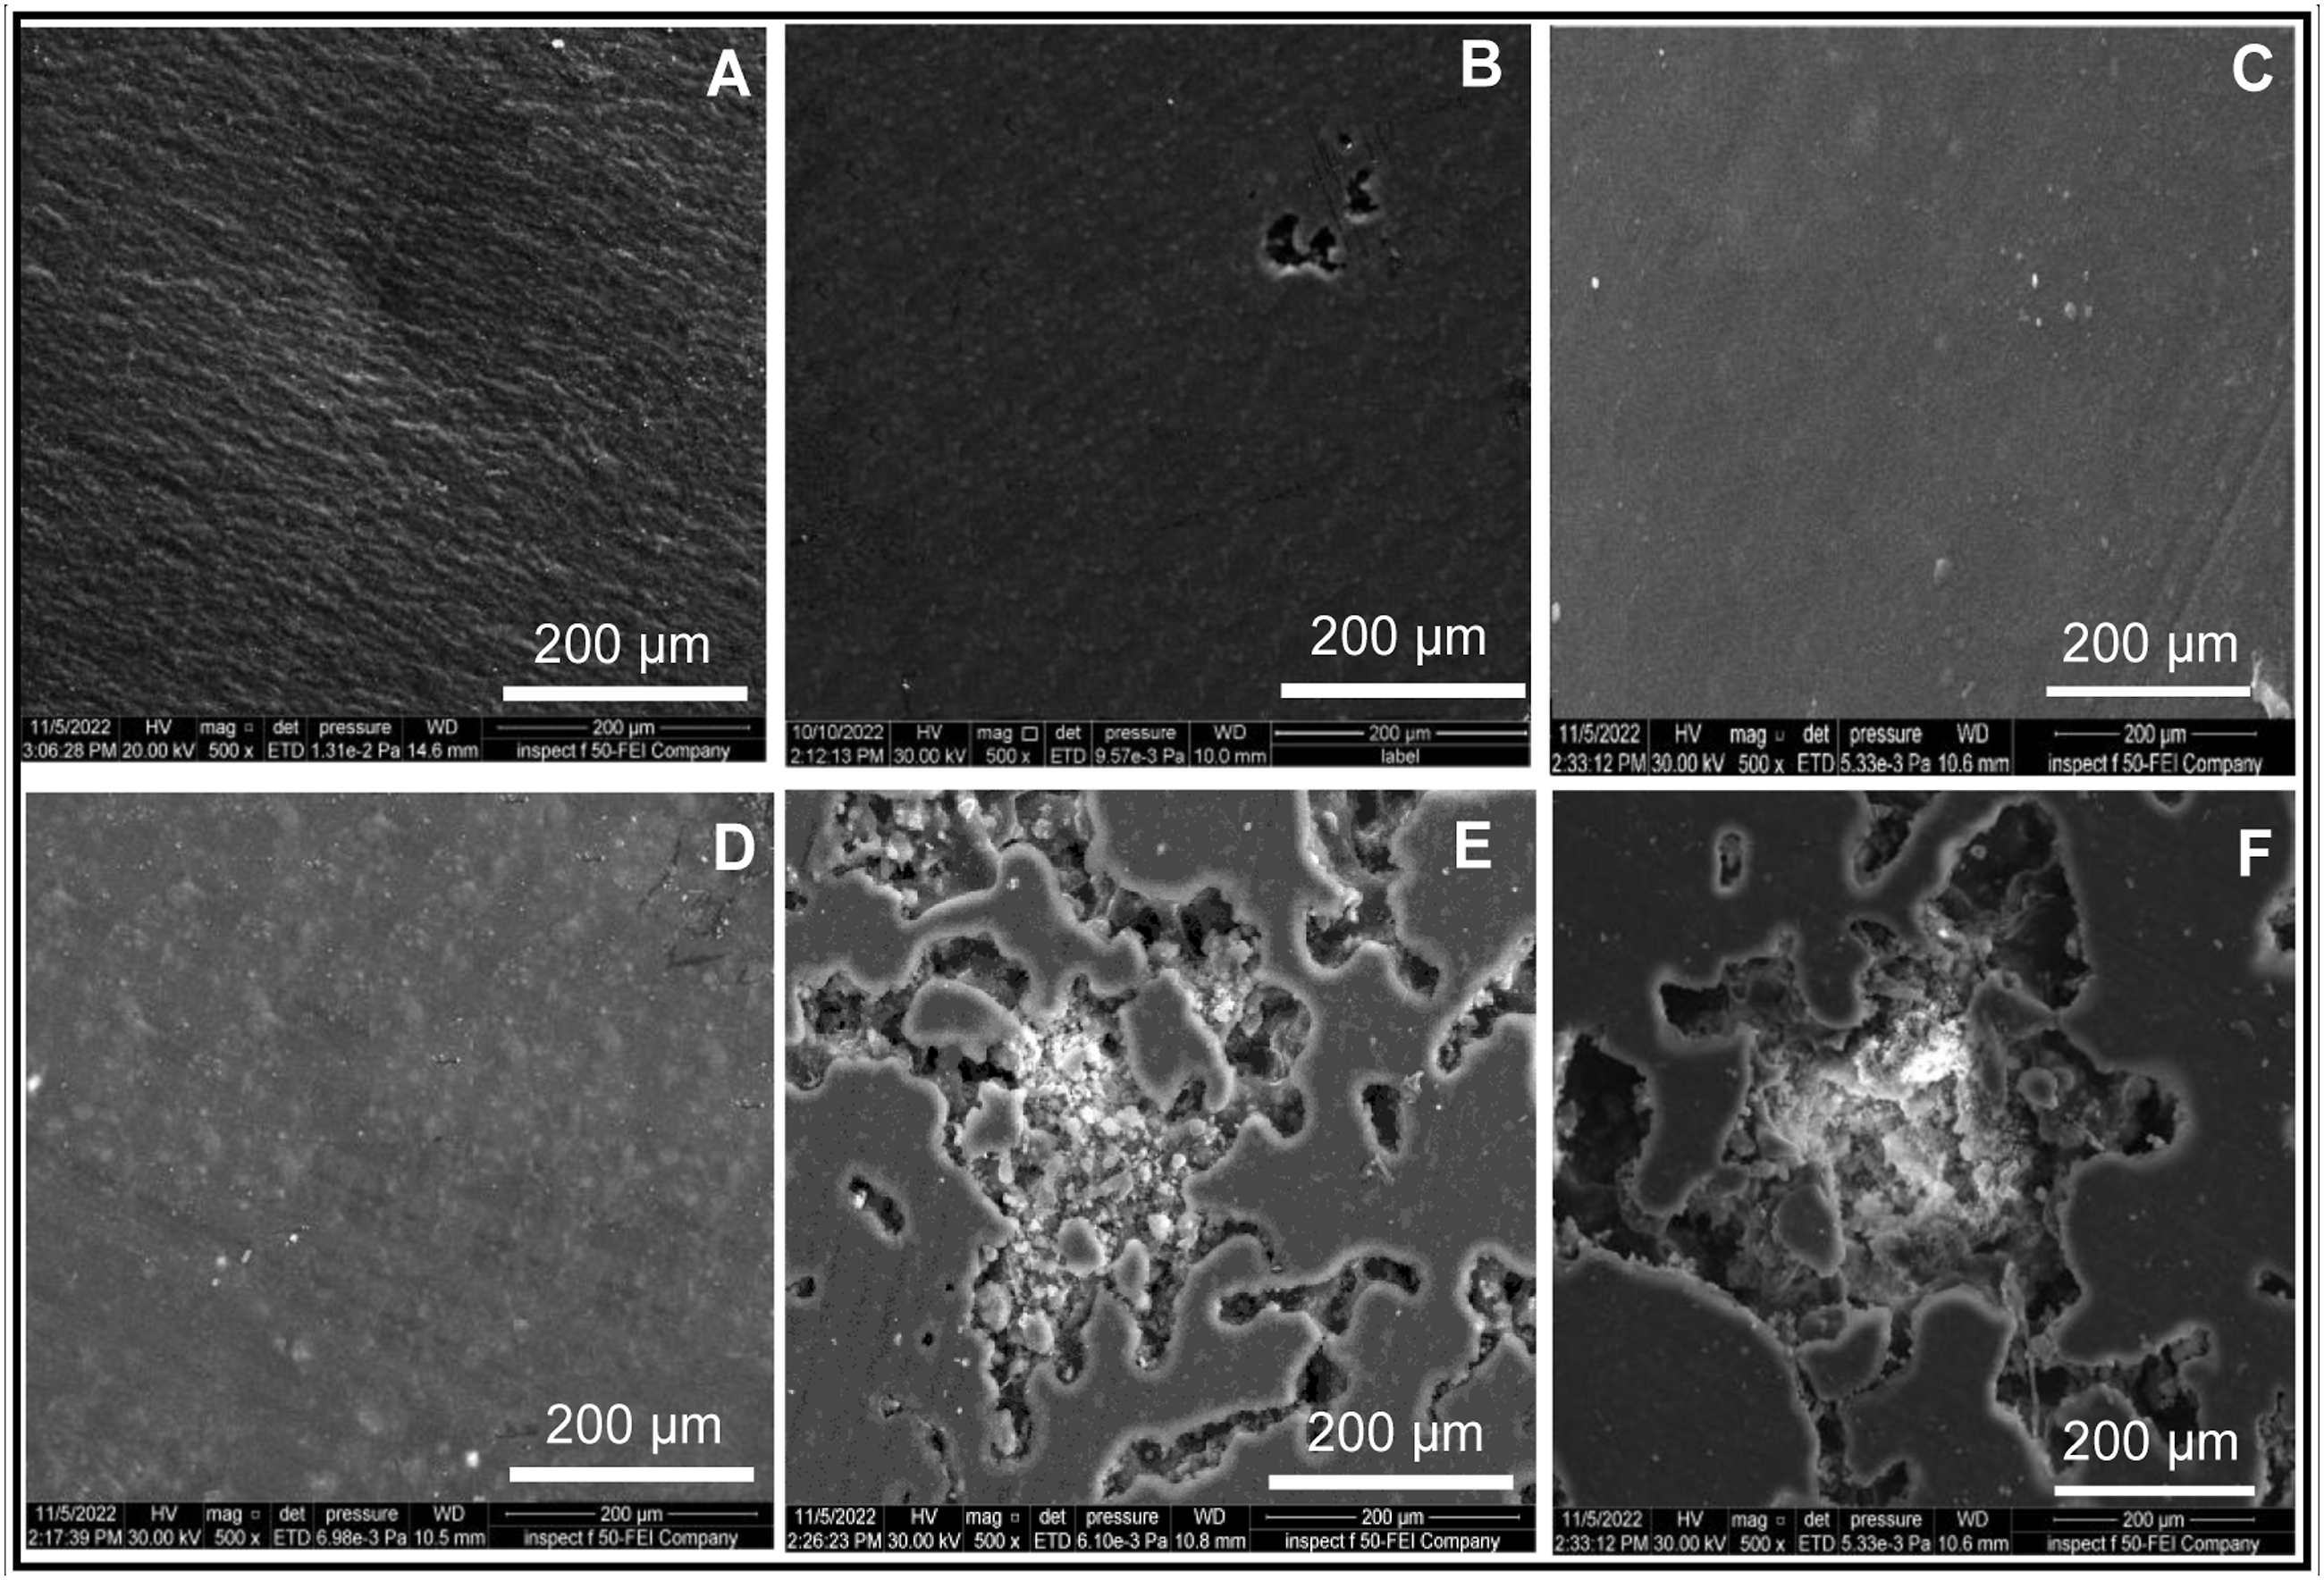
The EDS analysis showed that CS/PEKK biocomposites samples were mainly composed of Carbonium (C) and Oxygen (O), Calcium (Ca), and silicon (Si). After the addition of nanofillers, Tellurium (Te) was also detected on the surface of the samples in addition to C, O, Ca, and Si as shown in the EDS analysis (Figure 5). EDS peaks: (A)-PEKK, (B)-G0, (C)-G1, (D)-G2, (E)-G3, and (F)-G4.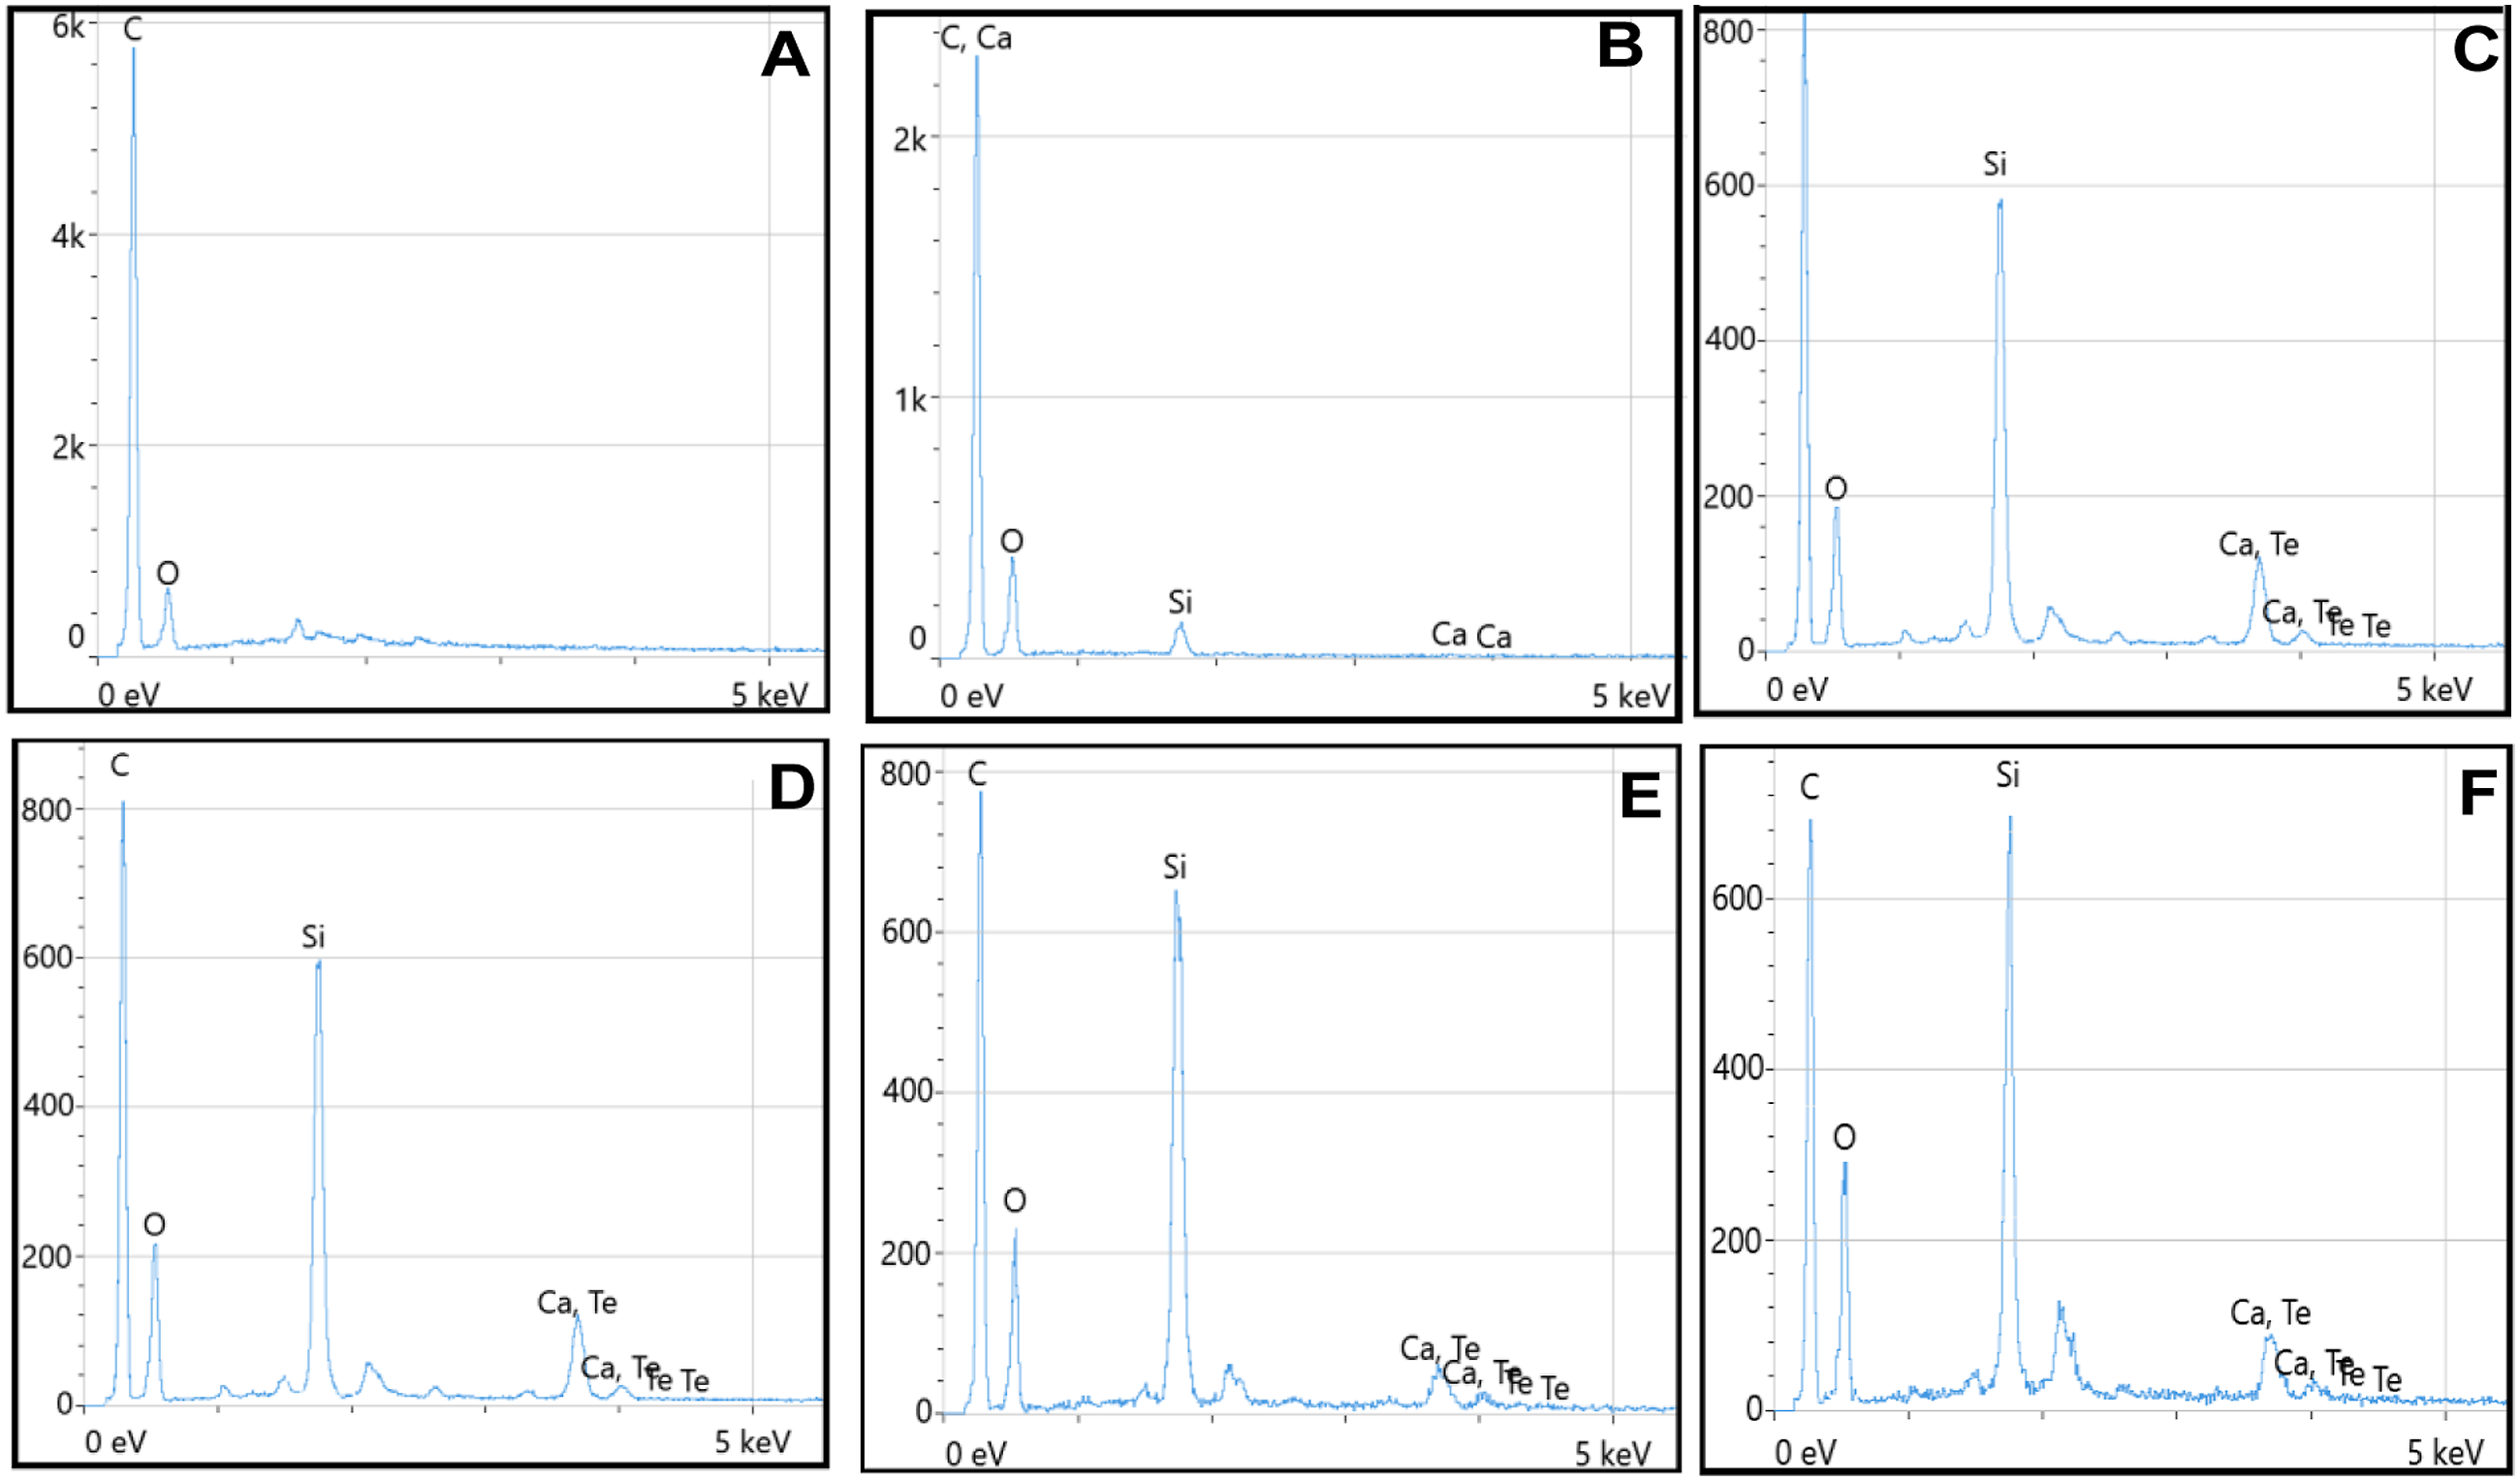
SEM photographs of the three-point bending tested fracture surfaces of the composites are present in Figure 6. SEM images of the tested fracture surfaces showing the fracture morphology of: (A)-PEKK, (B)-G0, (C)-G1, (D)-G2, (E)-G3, and (F)-G4.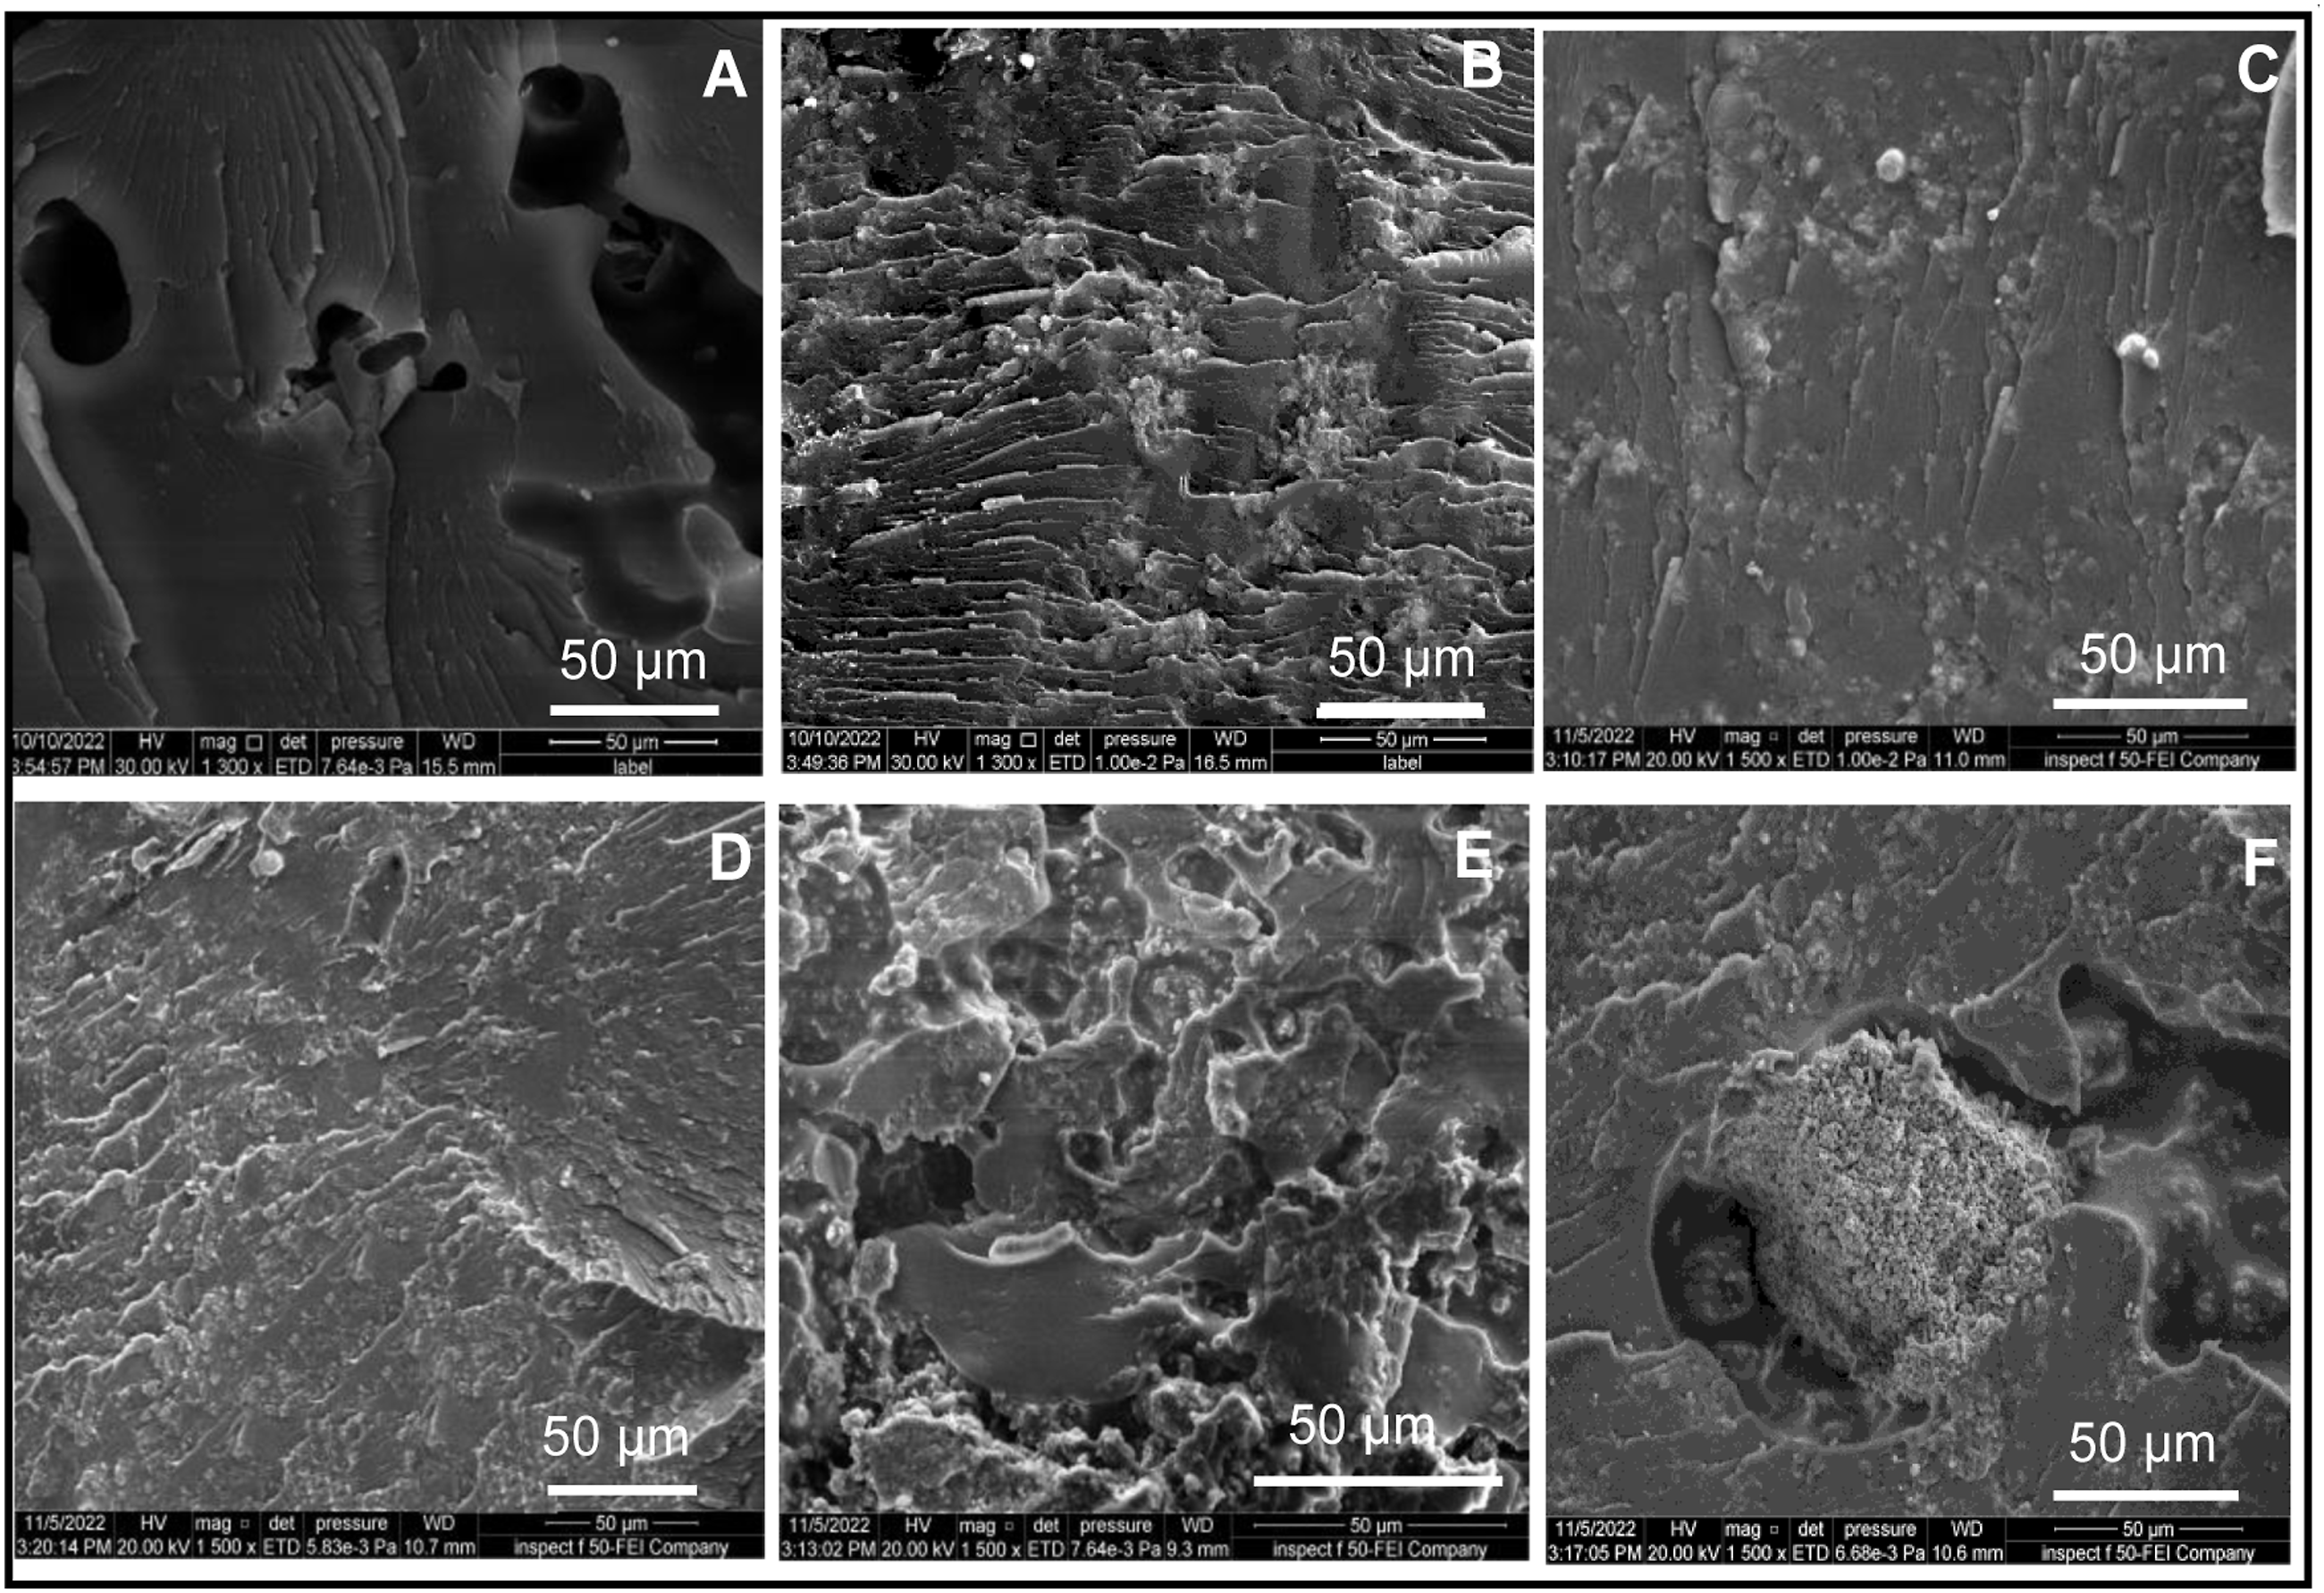
Mechanical and physical properties of the composites
Flexural strength
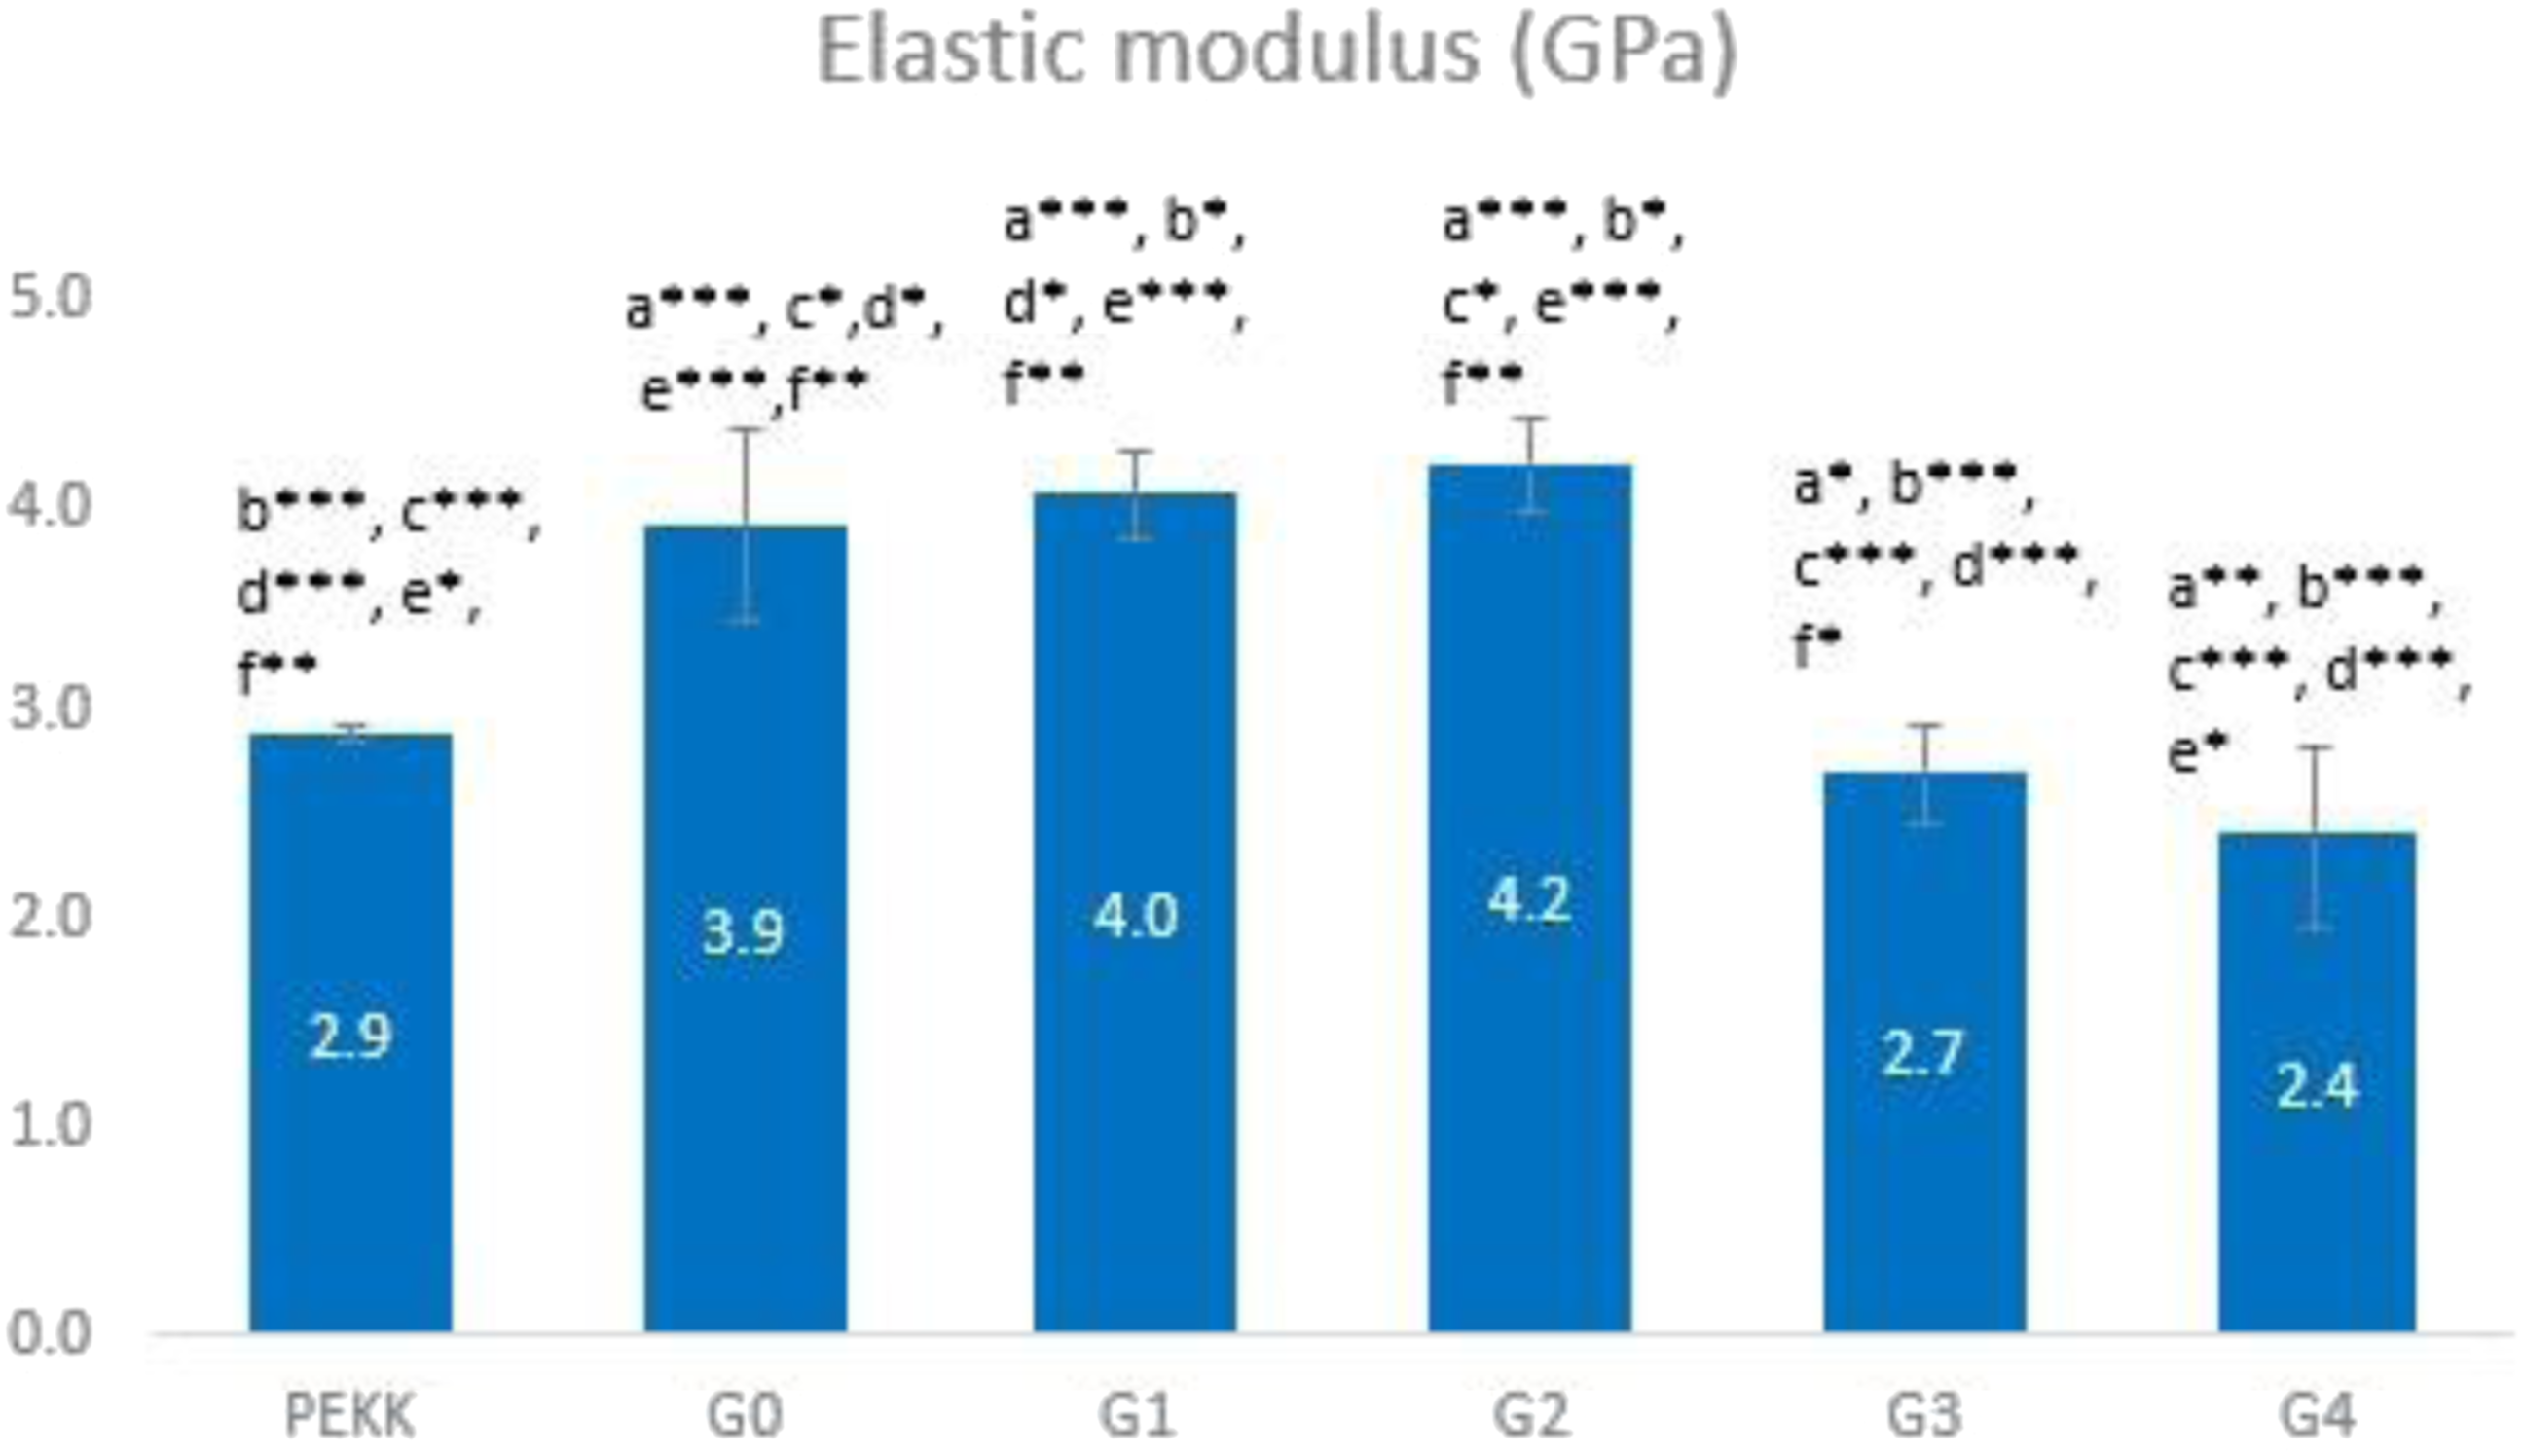
The mechanical characteristics (flexural strength and elastic modulus) of the control group (G0) loaded with various concentrations of TeO2 (G1-G4) are presented in Figures 7 and 8. There is a highly significant difference between all study groups (p ≤ .01) for both tests. The bending strength of G0 is 123.15 MPa. Up to 1 wt% (G1 and G2), the bending strength somewhat rose with increasing TeO2 content before sharply decreasing in G3 and G4 (Figure 7). The Young’s modulus of G0 is 3.9 GPa; it is also increased up to 1 wt% of TeO2 in G1 and G2; conversely, it then degrades as the content of nanofillers increases in G3 and G4 (Figure 8). The G2 composite had the maximum elastic modulus of 4.2 GPa and the highest flexural strength of 128.47 MPa, demonstrating that the mechanical properties of the composite were improved by adding 1 wt% n-TeO2 to CS/PEKK. Bar chart representing the flexural strength of the experimental group. (a): significant difference compared with PEKK (***: p ≤ 0.01, ** p ≤ 0.05), a* non-significant difference compared with PEKK (p > 0.05)/(b): significant difference compared with G0 (***: p ≤ 0.01,**:p ≤ 0.05), b* Non-significant difference compared with G0 (p ˃ 0.05)/(c): significant difference compared with G1 (***: p ≤ 0.01, **:p ≤ 0.05), c* non-significant difference compared with G1 (p > 0.05)/(d): significant difference compared with G2 (***: p ≤ 0.01, **:p ≤ 0.05), d* non-significant difference compared with G2 (p > 0.05)/(e): significant difference compared with G3 (***: p ≤ 0.01,**: p ≤ 0.05), e* non-significant difference compared with G3 (p > 0.05), (f): significant difference compared with G4 (***: p ≤ 0.01, **: p ≤ 0.05), f* non-significant difference compared with G4 (p > 0.05). Bar chart representing the elastic modulus of the experimental group. (a): significant difference compared with PEKK (***: p ≤ 0.01, ** p ≤ 0.05), a* non-significant difference compared with PEKK (p > 0.05)/(b): significant difference compared with G0 (***: p ≤ 0.01,**:p ≤ 0.05), b* Non-significant difference compared with G0 (p > 0.05)/ c: significant difference compared with G1 (***: p ≤ 0.01, **: p ≤ 0.05), c* non-significant difference compared with G1 (p > 0.05)/(d): significant difference compared with G2 (***: p ≤ 0.01, **:p ≤ 0.05), d* non-significant difference compared with G2 (p > 0.05)/(e): significant difference compared with G3 (***: p ≤ 0.01,**: p ≤ 0.05), e* non-significant difference compared with G3 (p > 0.05), (f): significant difference compared with G4 (***: p ≤ 0.01, **: p ≤ 0.05), f* non-significant difference compared with G4 (p > 0.05).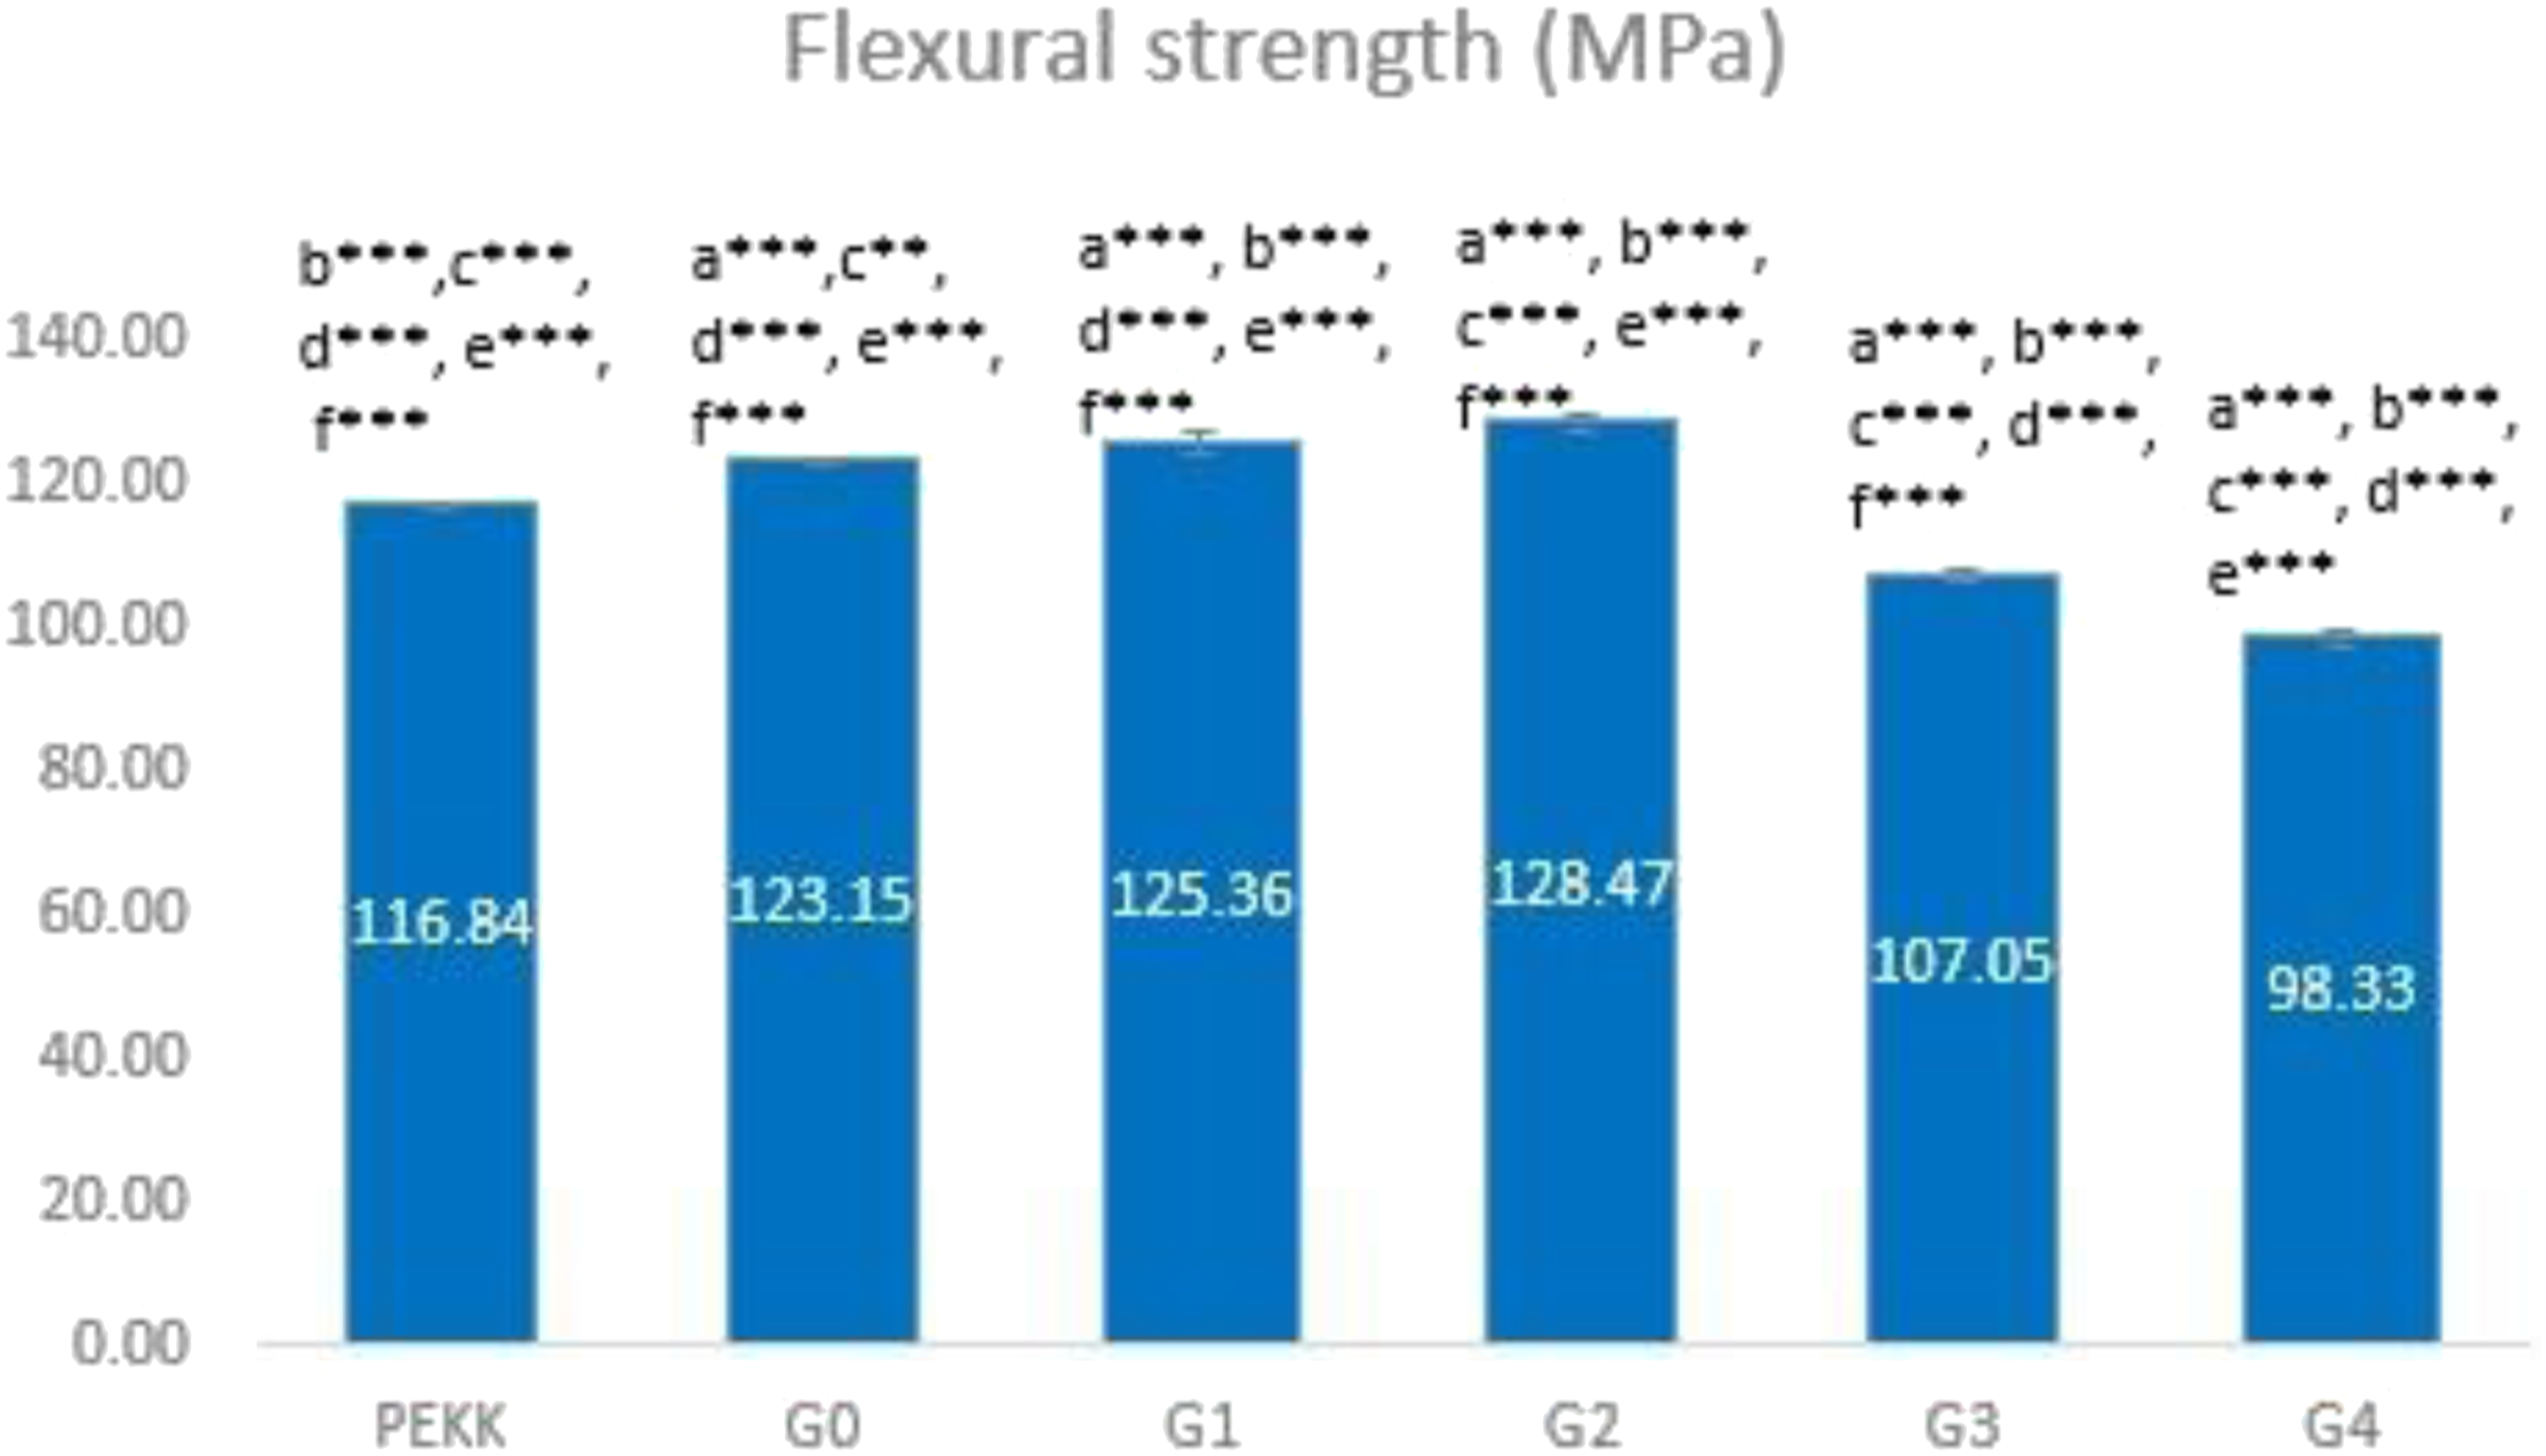
Water contact angle
The PEKK and G0-G4 water contact angles are provided in Figure 9. There is a highly significant difference between all study groups (p ≤ .01). The wetting analysis of G1-G4 is substantially lower than un-modified PEKK and G0. The highest contact angle 90° corresponds to the hydrophobic pure PEKK. After the addition of CS, and later on TeO2 the hydrophilicity was increased as water contact angles were always less than 90°. This increase occurs in a manner that corresponds to the increase in filler load. Bar chart representing the contact angle of the experimental group. (a): significant difference compared with PEKK (***: p ≤ 0.01, ** p ≤ 0.05), a* non-significant difference compared with PEKK (P > 0.05)/ (b): significant difference compared with G0 (***: p ≤ 0.01,**:p ≤ 0.05), b* Non-significant difference compared with G0 (p ˃ 0.05)/ (c): significant difference compared with G1 (***: p ≤ 0.01, **:p ≤ 0.05), c* non-significant difference compared with G1 (p > 0.05)/ (d): significant difference compared with G2 (***: p ≤ 0.01, **:p ≤ 0.05), d* non-significant difference compared with G2 (p > 0.05)/(e): significant difference compared with G3 (***: p ≤ 0.01,**: p ≤ 0.05), e* non-significant difference compared with G3 (p ˃ 0.05), (f): significant difference compared with G4 (***: p ≤ 0.01, **: p ≤ 0.05), f* non-significant difference compared with G4 (p > 0.05).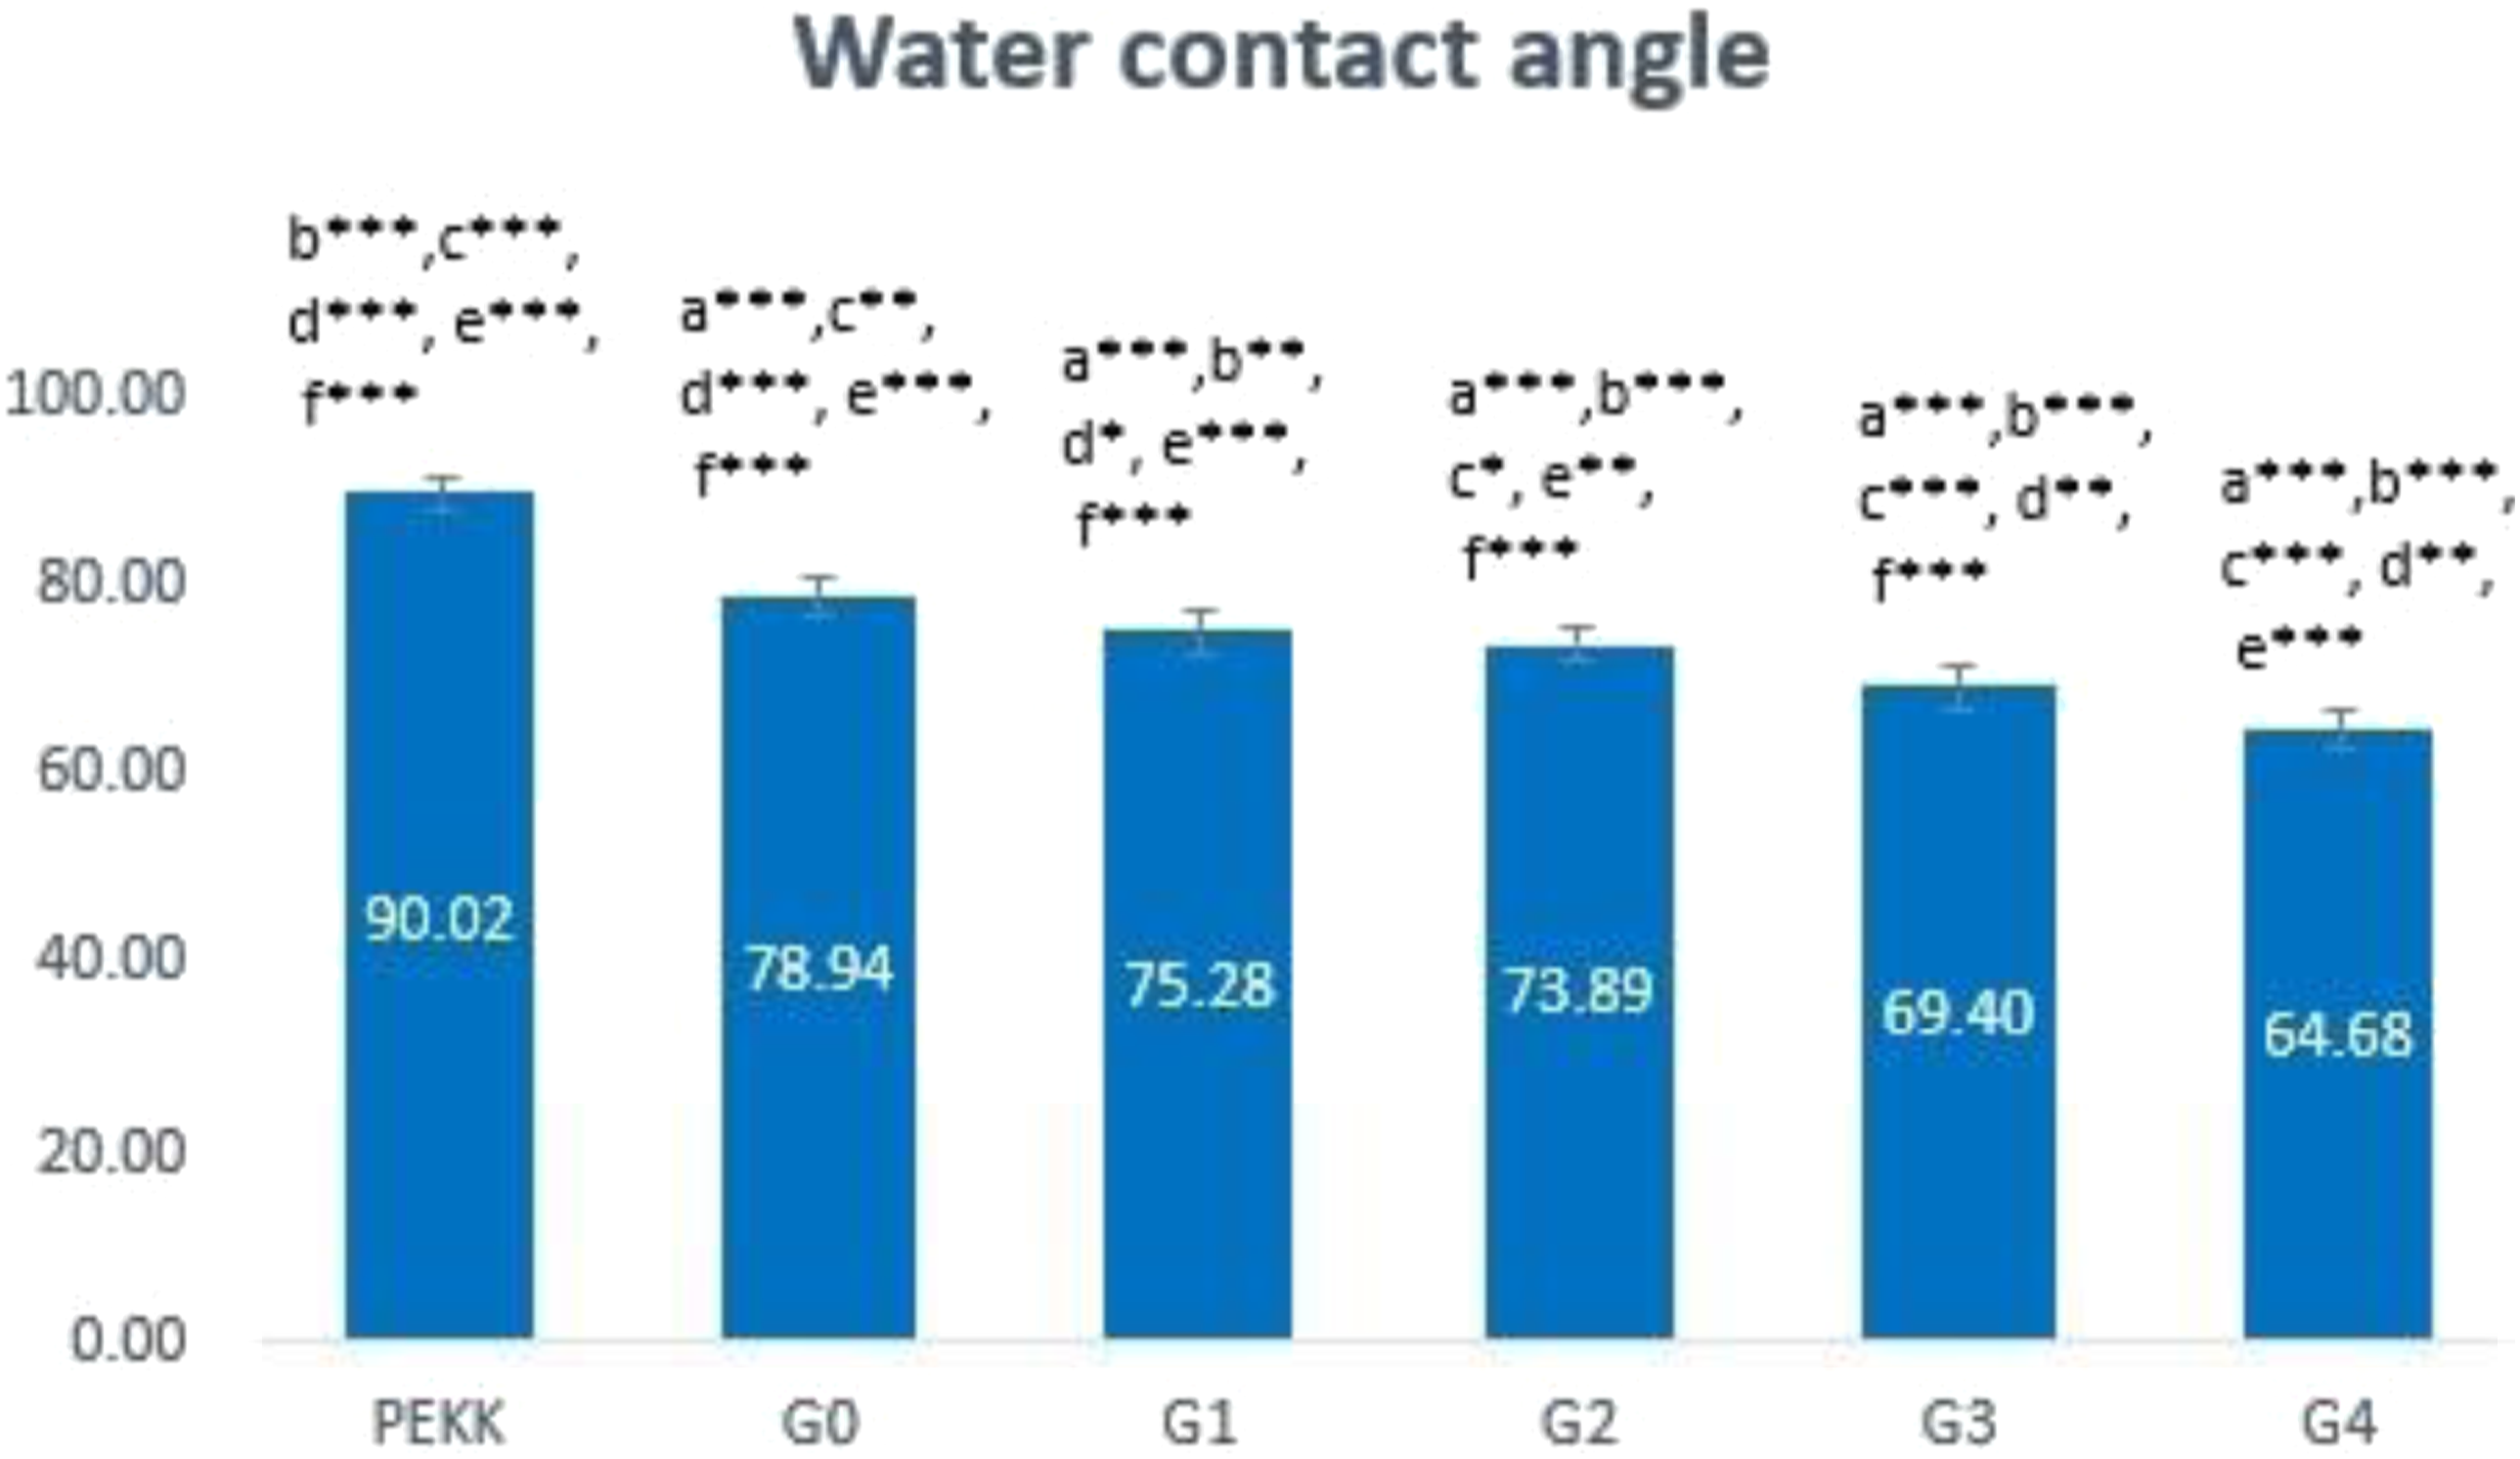
Surface roughness
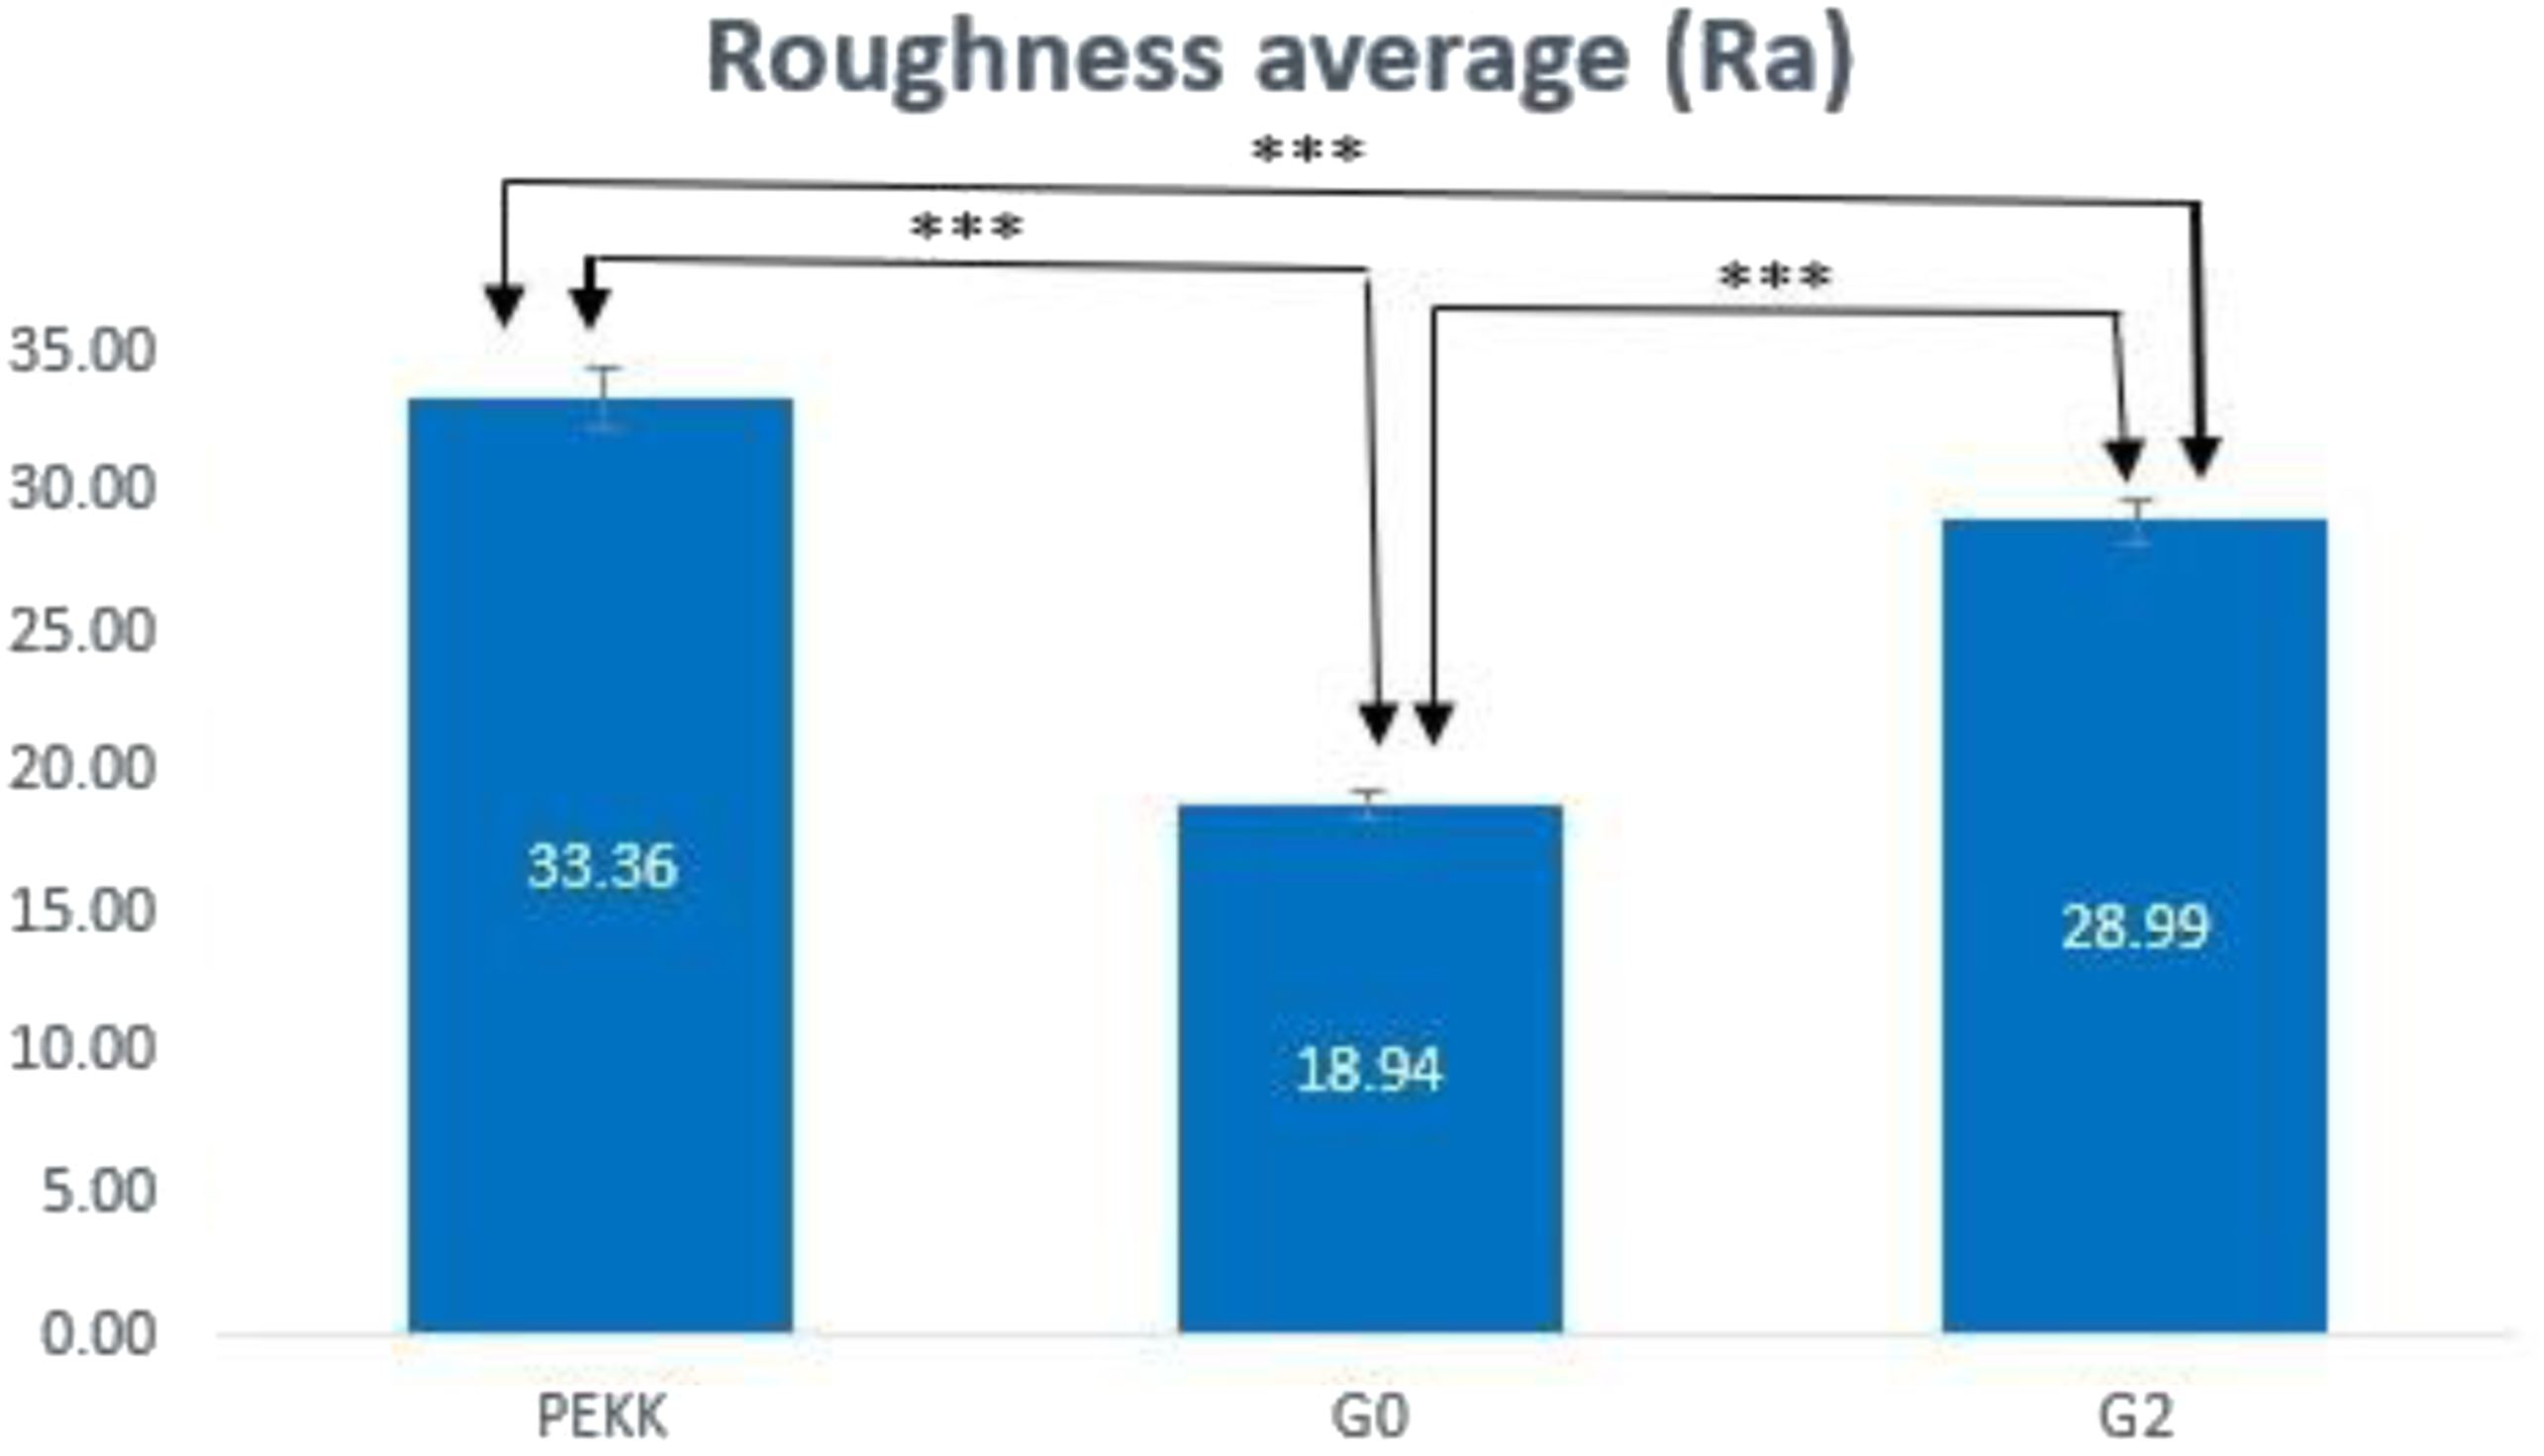
The roughness of the specimens was evaluated via average roughness (Ra). There is a highly significant difference between all study groups (p ≤ .01). The surface of PEKK possessed a high degree of micrometer surface features. In contrast, G0 was relatively flat and smooth, and G2 showed an uneven surface with pin-like patterns; thus, creating a more micrometer-rough surface topography and increasing the surface area in comparison to G0 (Figure 10). The PEKK surface roughness decreased with the increased concentration of micro fillers and increased again when the nano fillers were added (Figure 11). AFM images showing the surface morphology of: (a)-PEKK, (b)-G0, (c)-G2. Surface roughness of PEKK, G0, G2. ***: highly significant difference (p ≤ 0.01).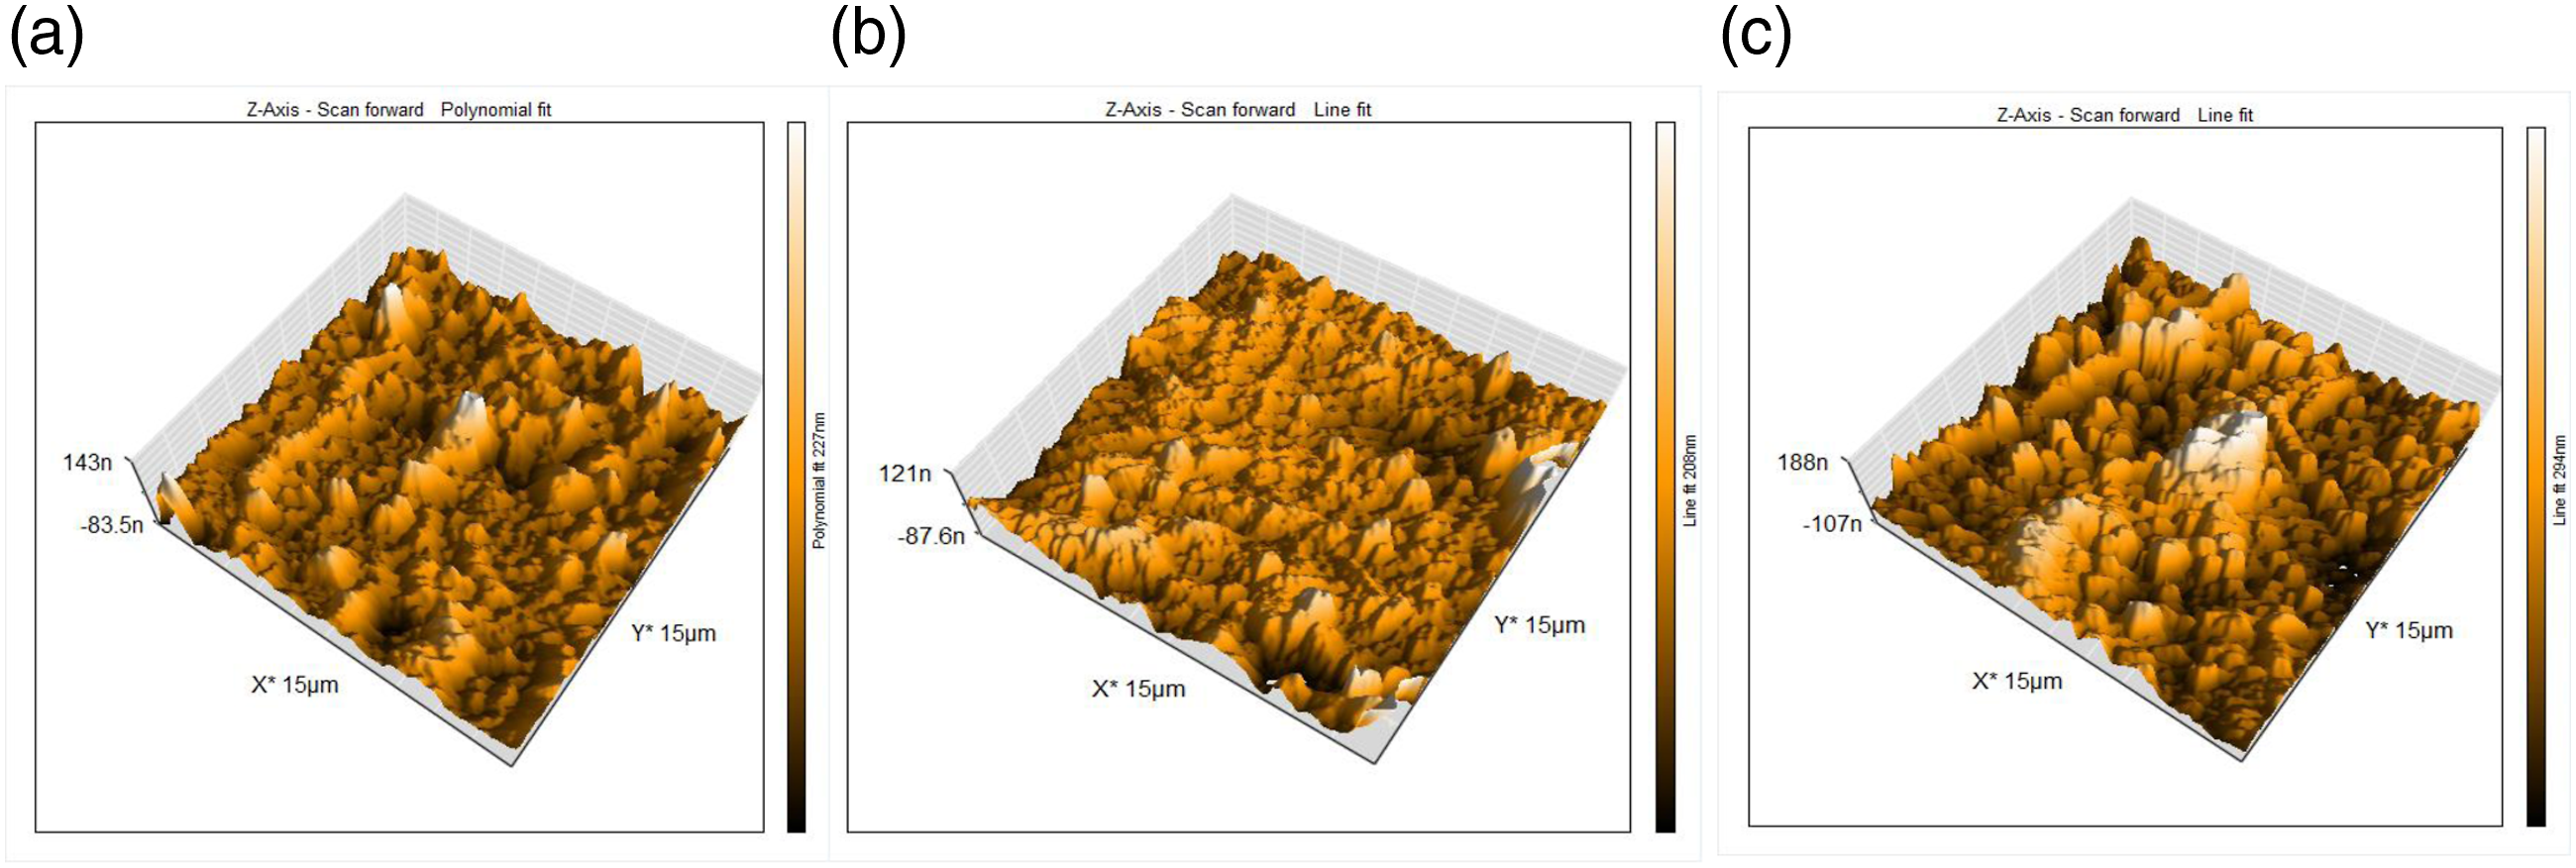
Hardness
The micro-hardness test of the un-modified PEKK, G0, and G2 groups is shown in Figure 12. The results showed a statistically significant difference between the hardness of PEKK, G0, and G2. The microhardness value of PEKK is 73.21 MPa. This value decreased significantly to 63.86 MPa when CS was incorporated into the composite formulation. Furthermore, the microhardness value was significantly increased to 69.78 MPa when the nanofillers were added. Vickers micro-hardness of PEKK, G0, G2. ***: highly significant difference (p ≤ 0.01).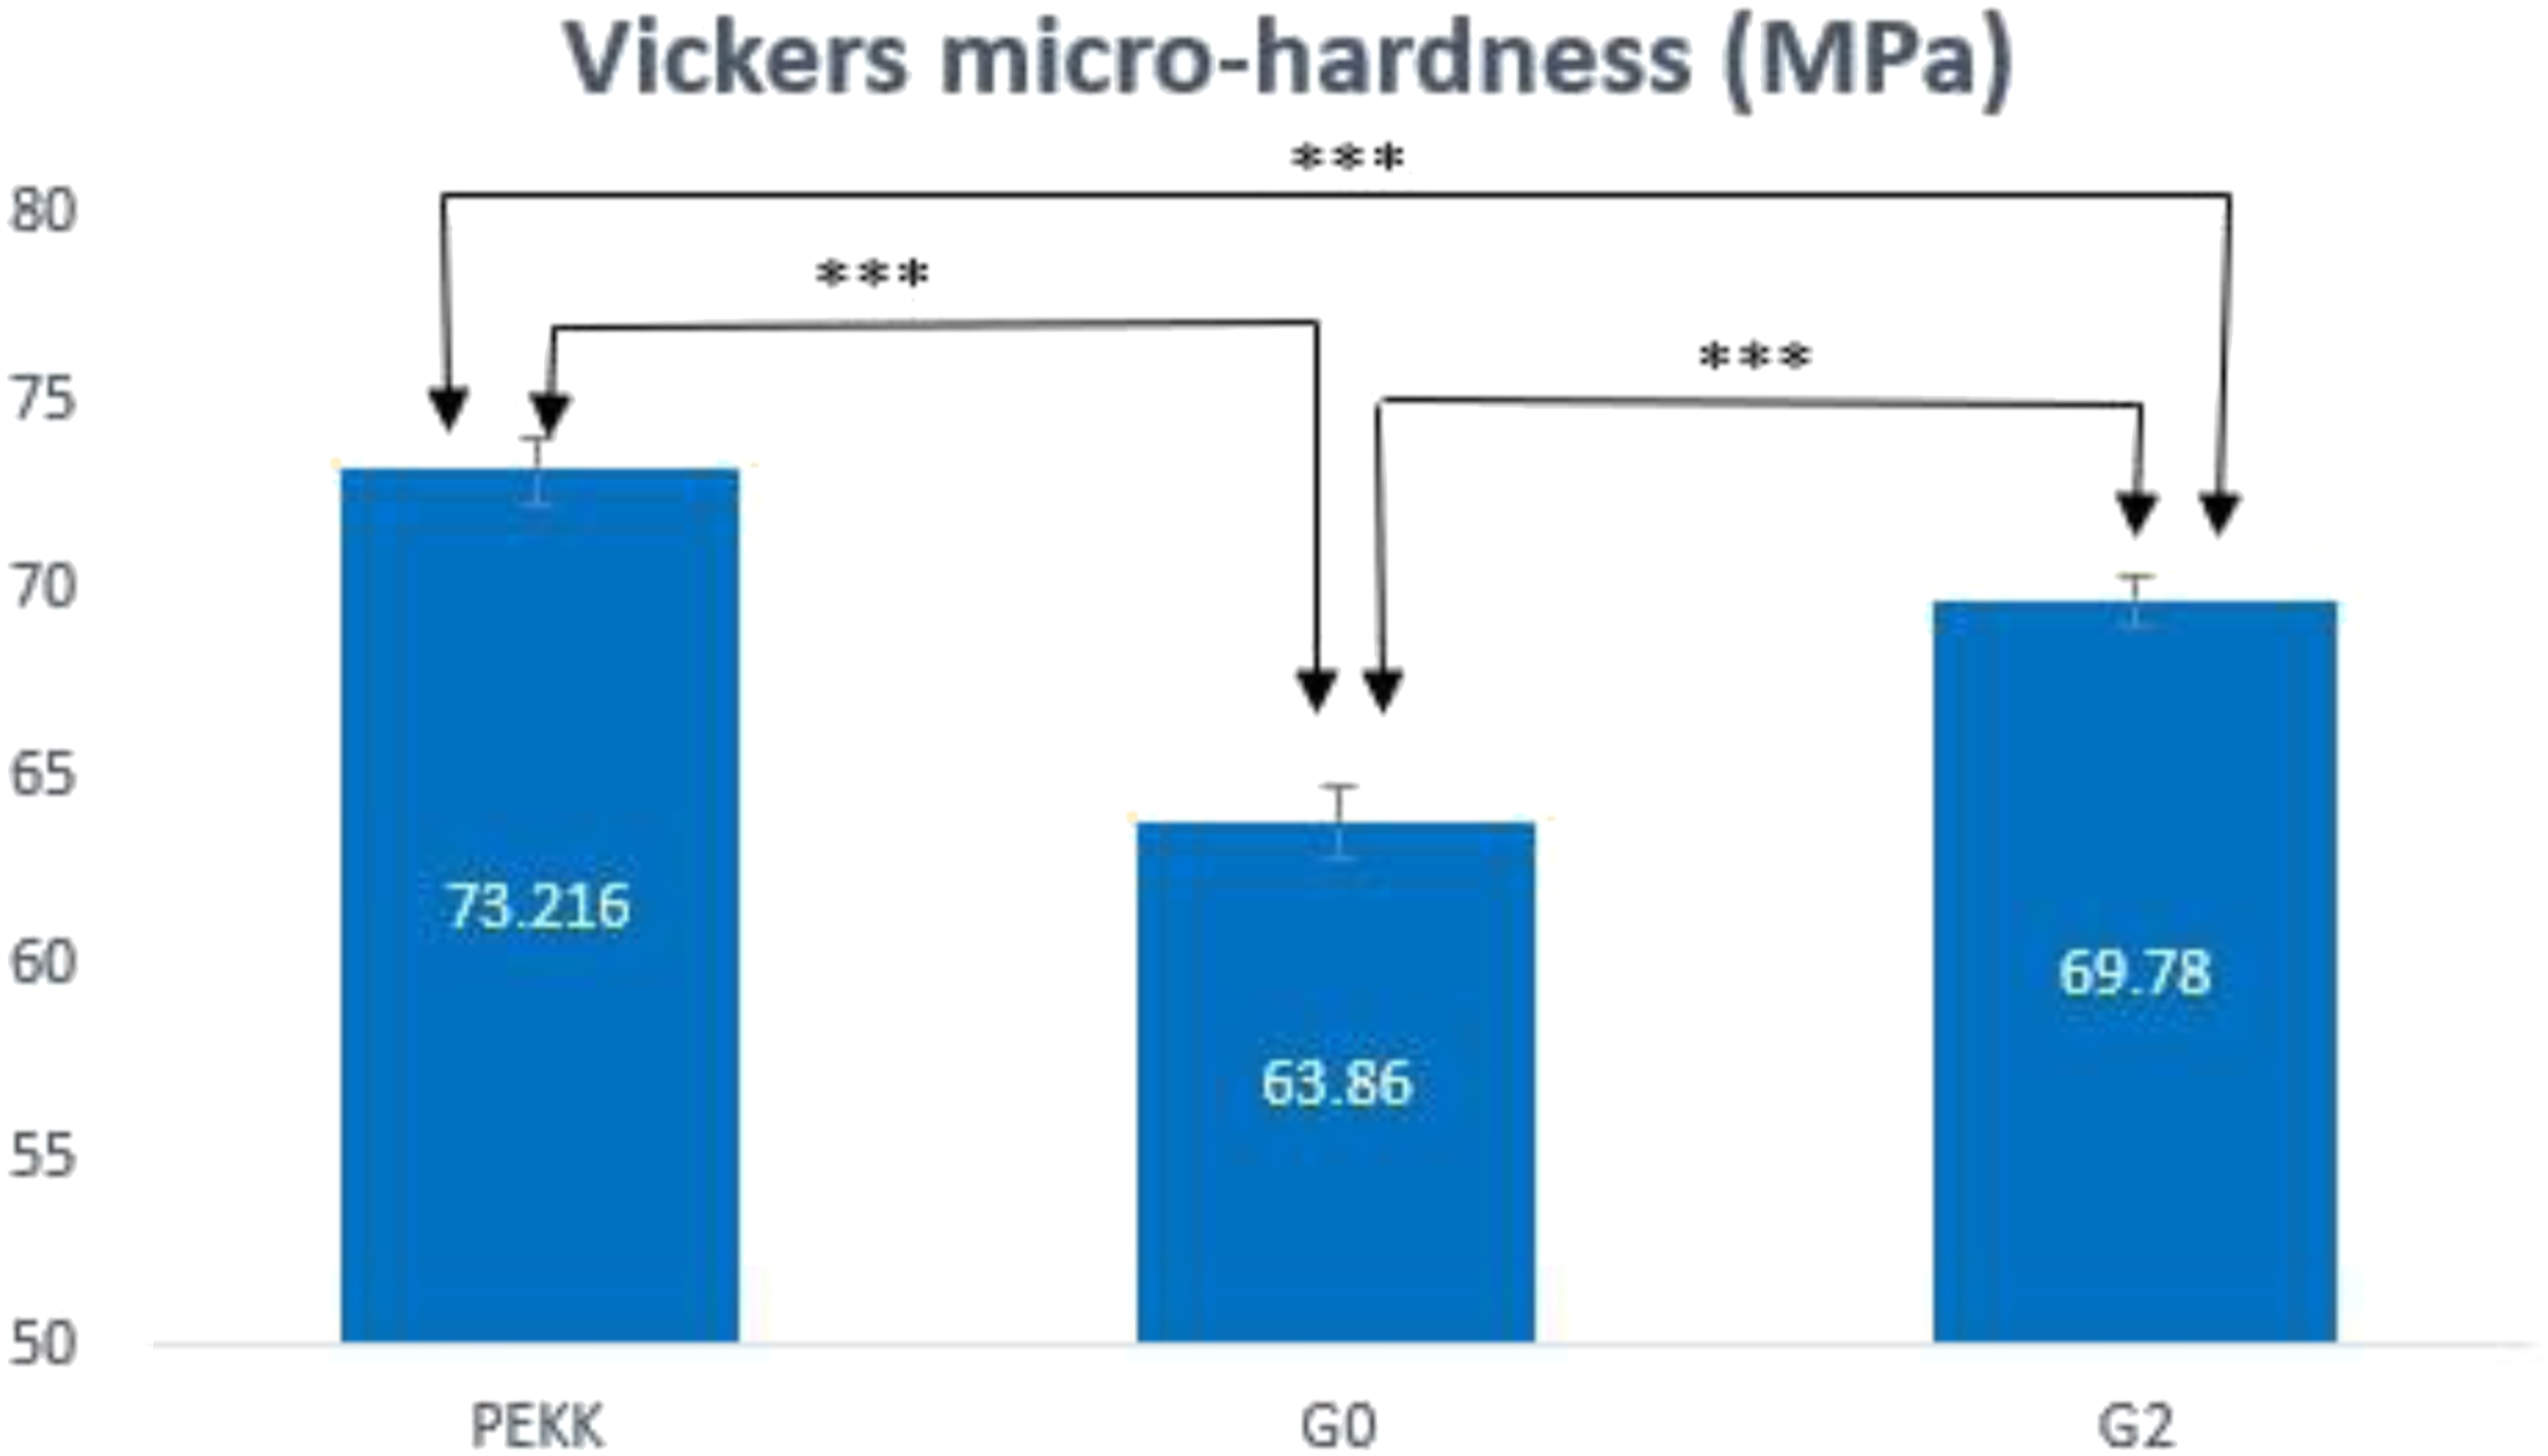
Discussion
PEKK is a biomaterial that may be utilized for cranial and orthopedic implants and dental implants. Conversely, the fact that it lacks cellular adhesion and with inadequate integration with bone tissue, is neither osteogenic nor bioactive, and hydrophobic in nature may be a drawback. 43 The PEKK may be modified to enhance its functionality by adding bioactive ceramic. 8 Nanocomposites are novel materials that have a minimum of one-dimensional filler dispersed at the micron scale of an eternal matrix. 44 This study is concentrating on high-performance thermoplastic polymer reinforced with nanofiller to produce a nanocomposite.
The chemical composition of TeO2 was ascertained using the XRF analysis. The result of the analysis shows that the Te NPs contain around 94.8% TeO2 (Table 1). It is very interesting to use FTIR spectroscopy to determine the chemical functionalities of a substance. It depends on how infrared radiation reacts with a sample’s chemical properties. Figure 2 indicated that following compression molding, the PEKK absorption bands remained the same when the filler was added, indicating the lack of any chemical bond.
High-resolution field emission scanning electron microscopy was used to examine the morphology of the polymer composite. Nearly smooth surfaces with linear lines that result from manufacturing and processing were seen in the FE-SEM of G1 and G2 (Figure 4).
The O and C components are identified by the EDX analysis of the G0-G4 as PEKK material, whereas the Ca and Si elements are identified as CS. When TeO2 was added, and as the filler load increased, the carbon content decreased (Figure 5).
For unmodified PEKK, the measurements for the bending strength and young's modulus are 116.84 MPa and 2.9 GPa, respectively. The G0 has a 123.15 MPa elastic modulus and a 3.9 GPa flexural strength, respectively. Elastic modulus and flexural strength both enhanced with the addition of 0.5 and 1 wt% TeO2, which might be attributed to the nanofillers’ dispersion having more homogeneity and uniformity.45,46 The fillers’ particle size (Figure 1), which provides increased surface area for bonding with the polymer and better reinforcing, is another cause. 47
The elastic modulus and flexural strength of the composite with 1.5 wt% and 2 wt% of TeO2 concentration significantly decreased as the strain to failure increased (Figures 7 and 8). This is because the fillers are more agglomerated, which causes stress concentration to occur at the agglomeration site. 46 Moreover, when the filler load grows, the lack of polymer to bind to the nanofillers may be the reason for this decrease in mechanical qualities. 48 Another argument is that the fillers have a high tendency to aggregate and form micron- or pack-sized clusters due to their huge specific surface area, which has a negative impact on the mechanical properties of the composites. 49
According to SEM images (Figure 6), greater interfacial adhesion between the components of the composite sample is indicated by samples with fewer patches of smoother fracture surface.50,51 The broken surfaces of the composites showed that PEKK, CS, and TeO2 particles fused at reinforcement levels between 1.5 and 2 wt%. The fracture surfaces of the composites with 1.5 wt% and 2 wt% reinforcement of TeO2 NPs were TeO2 particle aggregation. At low fillers load, there is enough space for the particles to spread throughout the matrix and the nano-particles can resist the powerful physical force of attraction. As the particle-to-particle distance tends to diminish, the particles are unable to repel one another under a powerful physical force. This situation leads to the particles aggregating and forming a cluster. The collection of filler particles might hinder the PEKK particles from fusing. As a result, the composites become more fragile affecting the characteristics of polymer composites. 52
Surface hydrophilicity has an impact on how well dental implants operate biologically because it encourages contact between the implant material and the surrounding tissue. 53 Calculating the water contact angle of the composite’s surface aid to compare the G0-G4 and unmodified PEKK materials' hydrophilic and hydrophobic properties. The change in contact angle of various un-modified PEKK and G0 composites loaded with varied amounts of TeO2 nanofillers is shown in Figure 9. The hydrophobic pure PEKK has the maximum contact angle, which is 90°. As compared to pure PEKK, the contact angle considerably drops to 78.49° when 15% CS is added to the PEKK matrix, indicating greater hydrophilicity due to the hydrophilic nature of the CS. 54 The contact angle decreased when the nanofillers were added, indicating a more hydrophilic composite as the filler load was raised. This might be a result of the composite's surface topography changing, as shown in Figure 9.
Surface roughness is thought to be beneficial for the bioactivity of dental implants since it will improve the wettability or hydrophilicity of dental implants, which in turn may cause osteogenic differentiation. 51 The roughness average (Ra) measured by the AFM analysis showed that un-modified PEKK discs were characterized by a higher roughness value of 33.36. G0 has a roughness average of 18.95 while G2 roughness average is 23.4. The reduction in the surface roughness after the incorporation of the CS may be attributed to the fact that the incorporated particles are embedded inside polymeric blends matrix material, which acts as an integral part of the composite structure indicating a better interfacial adhesion between constituents of the composite material. 24 Generally speaking, smoother surfaces on a material better prevent bacterial adhesion and growth over its surface. 18 After the addition of TeO2, a raise in the surface roughness of G2 was reported in comparison to G0 which may be related to the incorporation of the nanofiller. Yet, this increase is still less than the un-modified PEKK (Figure 11).
When evaluating and contrasting various dental implant materials, the measurement of surface microhardness may be regarded as an important characteristic. This is primarily because different dental implants are urgently needed for different surface treatments to ensure sufficient osseointegration and long-term success. 55 A highly significant difference was found between the tested groups. The PEKK’s hardness is 73.21 MPa. After CS is incorporated, there is a notable reduction in hardness value to 63.86 MPa (Figure 12). This reduction could be attributed to the bioglass fillers’ inherent brittleness, which has a negative impact on the composite characteristics. 56 On the other hand, the addition of nanofillers to the CS/PEKK matrix dramatically enhanced the microhardness to 69.78 MPa. This might be because the nanoparticles are distributed rather uniformly, as observed in the SEM image (Figure 6), and because increasing the particle loading in the matrix reduces the interparticle distance, which increases the PEKK matrix’s resistance to indentation. 34 The main factor in TeO2 nanofiller’s disentanglement and improved integration with the matrix PEKK is good interfacial adhesion. It appears that tiny fillers work better at boosting hardness than larger ones do. 57
Finally, the materials’ longer processing durations to reach the cured state, the bioglass’ innate brittleness that affects the cured polymeric composite sheet, and the cutting method utilized to get the test samples were some of the limitations mentioned.
Conclusions
The chemical composition of the CS/PEKK composite is not altered by the addition of TeO2 nanoparticles. Contrary to the CS/PEKK composite, the flexural strength, elastic modulus, wettability, surface hardness, and roughness of the nanocomposite were all improved by the increasing weight fraction of TeO2 up to 1 wt%. These results indicate that a dental implant consisting of 1 wt% TeO2/15 wt% CS/PEKK has the potential to emerge as a promising dental implant material.
Footnotes
Acknowledgements
The authors would like to thank Mustansiriyah University (https://www.uomustansiriyah.edu.iq), Baghdad, Iraq and College of Dentistry, University of Baghdad, Baghdad 1417, Iraq. (![]() ), for their support in the present work.
), for their support in the present work.
Declaration of conflicting interests
The authors declared no potential conflicts of interest concerning the research, authorship, and/or publication of this article.
Funding
The authors received no financial support for the research, authorship, and/or publication of this article.
Data Availability Statement
The ![]() used to support the findings of this study are available from the corresponding author upon request.
58
used to support the findings of this study are available from the corresponding author upon request.
58