
Abstract
The objective of this study is to manufacture composite filaments to be used in three-dimensional (3D) printing of fabrics using fused deposition modeling (FDM) method. The primary properties of a fabric are flexibility and strength which are lacking in the available 3D printed materials. Polylactic acid (PLA), thermoplastic polyurethane (TPU) and poly(ethylene) glycol (PEG) were blended in different proportions and extruded using twin-screw extruder to obtain composite filaments. The properties of the filaments were studied using various material characterization methods such as uniaxial tensile test, differential scanning calorimetry (DSC), thermogravimetric analysis (TGA), dynamic mechanical analysis (DMA), Fourier transform infrared spectroscopy (FTIR), and scanning electron microscope (SEM). With the addition of PEG in the PLA/TPU composition, it was found that the yield stress and Young’s modulus of the composite filaments have significantly decreased compared to that of pure PLA filament. It was also noted that there was no significant difference in ultimate tensile strength whereas the elongation at break was increased by more than 500%. Using the composite filament, a plain weave fabric structure was 3D printed to investigate the printing ability of a complex structure. It is concluded that the composite filaments developed are suitable for 3D printing but non-uniformity in diameter affects the print quality and hence the overall properties of fabrics.
Keywords
Introduction
Additive manufacturing (AM) (also known as three-dimensional (3D) printing) is the process of producing 3D objects by adding materials layer upon layer using the computer-aided design (CAD) models. The first patent related to additive manufacturing was granted in the United States in 1984, 1 entitled “Apparatus for production of three-dimensional objects by Stereolithography”. However, this technology was commercialized after the expiration of the patent. 2 Hence this technology is quite new, but its use has been skyrocketed in recent years. AM has been used in almost all industries including automotives, aerospace, defense, military, fashion, textiles, medicine, and many others.
The application of polymer-based additive manufacturing in fabric industry has fascinated the researchers.3–10 Different polymers such as polylactic acid (PLA), acrylonitrile butadiene styrene (ABS) and thermoplastic polyurethane (TPU) have been tried. 11 Among all the 3D printing methods, fused deposition modeling (FDM) is probably the most popular method. With the FDM method, various products can be manufactured within a limited time frame with minimal waste. It holds a potential to produce complex geometries.12–14 Although it has several advantages, the parts produced with FDM do not have high mechanical strength, high flexibility, and tear resistance. 15 The reasons might be the presence of voids, weaker bonding between the layers, process parameters and the polymer used itself.16,17 Most of the polymers which are readily available for FDM 3D printing do not have high mechanical strength, and high flexibility together. To compensate for these drawbacks of the materials, a material having high mechanical strength (e.g., PLA) and another polymer having high flexibility (e.g., TPU) are blended together in different weight percentages (wt %) in this work. Poly(ethylene) glycol (PEG) is used as a plasticizer in varying proportions to enhance the properties of the composite filaments.
Composite materials affect the mechanical and chemical properties of the final product.17–19 They either improve or degrade the mechanical properties depending on the compatibility between the polymers.20,21 Depending on the quantity and type of materials used, the mechanical properties of the final product can be customized.22–25 PLA is a biodegradable and renewable thermoplastic polymer that is obtained from renewable resources such as corn, wheat, rice, and sugarcane.26,27 The properties such as low thermal stability, high degradation rate during processing, brittleness in nature with less than 10% elongation at break,28,29 low toughness and moisture sensitivity limit its applications.30,31 TPU is a biocompatible, and linear segmented block copolymer,32,33 and is synthesized by the reaction of polyols with aliphatic or aromatic diisocyanates. The polyols may be ether-, ester-, and carbonate-based diols. These polyols form the soft segments of the material whereas the diisocyanates such as diphenylmethane-4.4-diisocyanate (MDI) make the hard segments of TPU by addition of a chain extender such as butanediol. The soft segment (SS) interconnects two hard segments (HS) and the hard segments are bonded together with the presence of hydrogen bonds to form physical crosslinks.34–36 PEG is biocompatible, yields non-immunogenicity, non-antigenicity, protein rejection, and non-toxic.37,38 PEGs having molecular weight (MW) less than 1000 are viscous, colorless, water soluble and hygroscopic liquids at room temperature. The higher MW PEGs are waxy white solids. Its melting point is dependent on its MW and exhibits a plateau at about 67°C.39,40
Several researchers have worked on PLA/TPU composition for various applications, but the work related to FDM 3D printing of fabrics is not found in the literature. Zhou et al., 41 studied PC/PLA/TPU blend and found improvement in toughness, increase in flexibility, but decrease in tensile strength and fracture response of the composite. Jaso et al., 42 investigated the PLA/TPU composition having varying weight percentages (wt%) of poly(lactic) acid (PLA) in TPU matrix and observed improvement in tensile strength, and elongation but decrease in elastic recovery. Mi et al., produced scaffolds for medical and tissue engineering applications using the PLA/TPU composition. They demonstrated increase in tensile and compressive strength, flexibility and larger pores with the addition of TPU content in the blends. 33 Feng and Ye fabricated tensile and impact specimens using hot-press-molding process with PLA/TPU polymers. They observed yield and neck formation which signifies the improvement of ductile behavior of the composite. They argued the presence of hydrogen bonding between PLA and TPU molecules which caused their partial miscibility. 43 Xu et al., 44 studied PLA/TPU composites and found the increase in crystallinity and melt strength and confirmed the immiscibility of these polymers. Kaynak et al., 45 studied the mechanical performance of neat PLA, glass fiber (GF)-reinforced PLA, and TPU-blended PLA composites using injection molding and 3D printing methods. They used twin-screw extruders to obtain filaments for 3D printing using 10 wt% of TPU/15 wt% of GF, 3D printed dog-bone specimens and compared their performance with the dog-bone samples obtained from injection molding.
It should be noted that no information related to manufacturing of PLA/TPU/PEG composite filaments mixed in different proportions has been found in the literature. The mechanical, thermo-mechanical and morphological characterization of these filaments are missing in the literature as well. In the present work, PLA is blended with TPU and PEG in varying weights to obtain composite filaments with optimal strength and flexibility which can be used for 3D printing of flexible structures. The microstructure, mechanical and thermo-mechanical properties of the composite filaments obtained are investigated and used for 3D printing of plain weave fabric structures in this work.
Materials and methods
Materials
PLA pellets were purchased from Filabot (Barre VT, USA) having a melt flow index (MFI) of 3 g/10 min at 190°C, density of 1.24 g/cm3, and the glass transition temperature (
Sample preparation and filament manufacturing
Composition and diameters of the filaments manufactured.
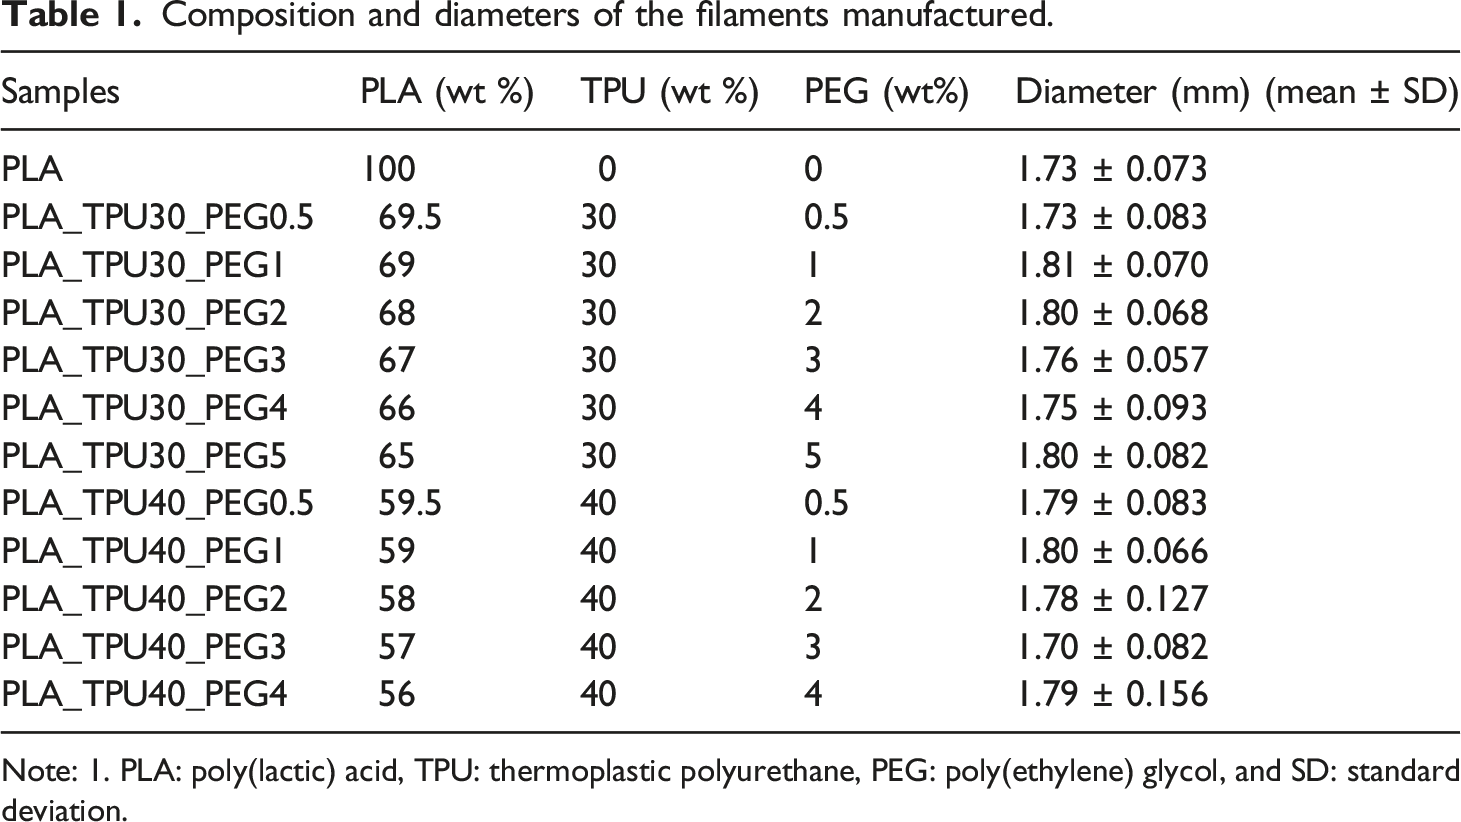
Note: 1. PLA: poly(lactic) acid, TPU: thermoplastic polyurethane, PEG: poly(ethylene) glycol, and SD: standard deviation.
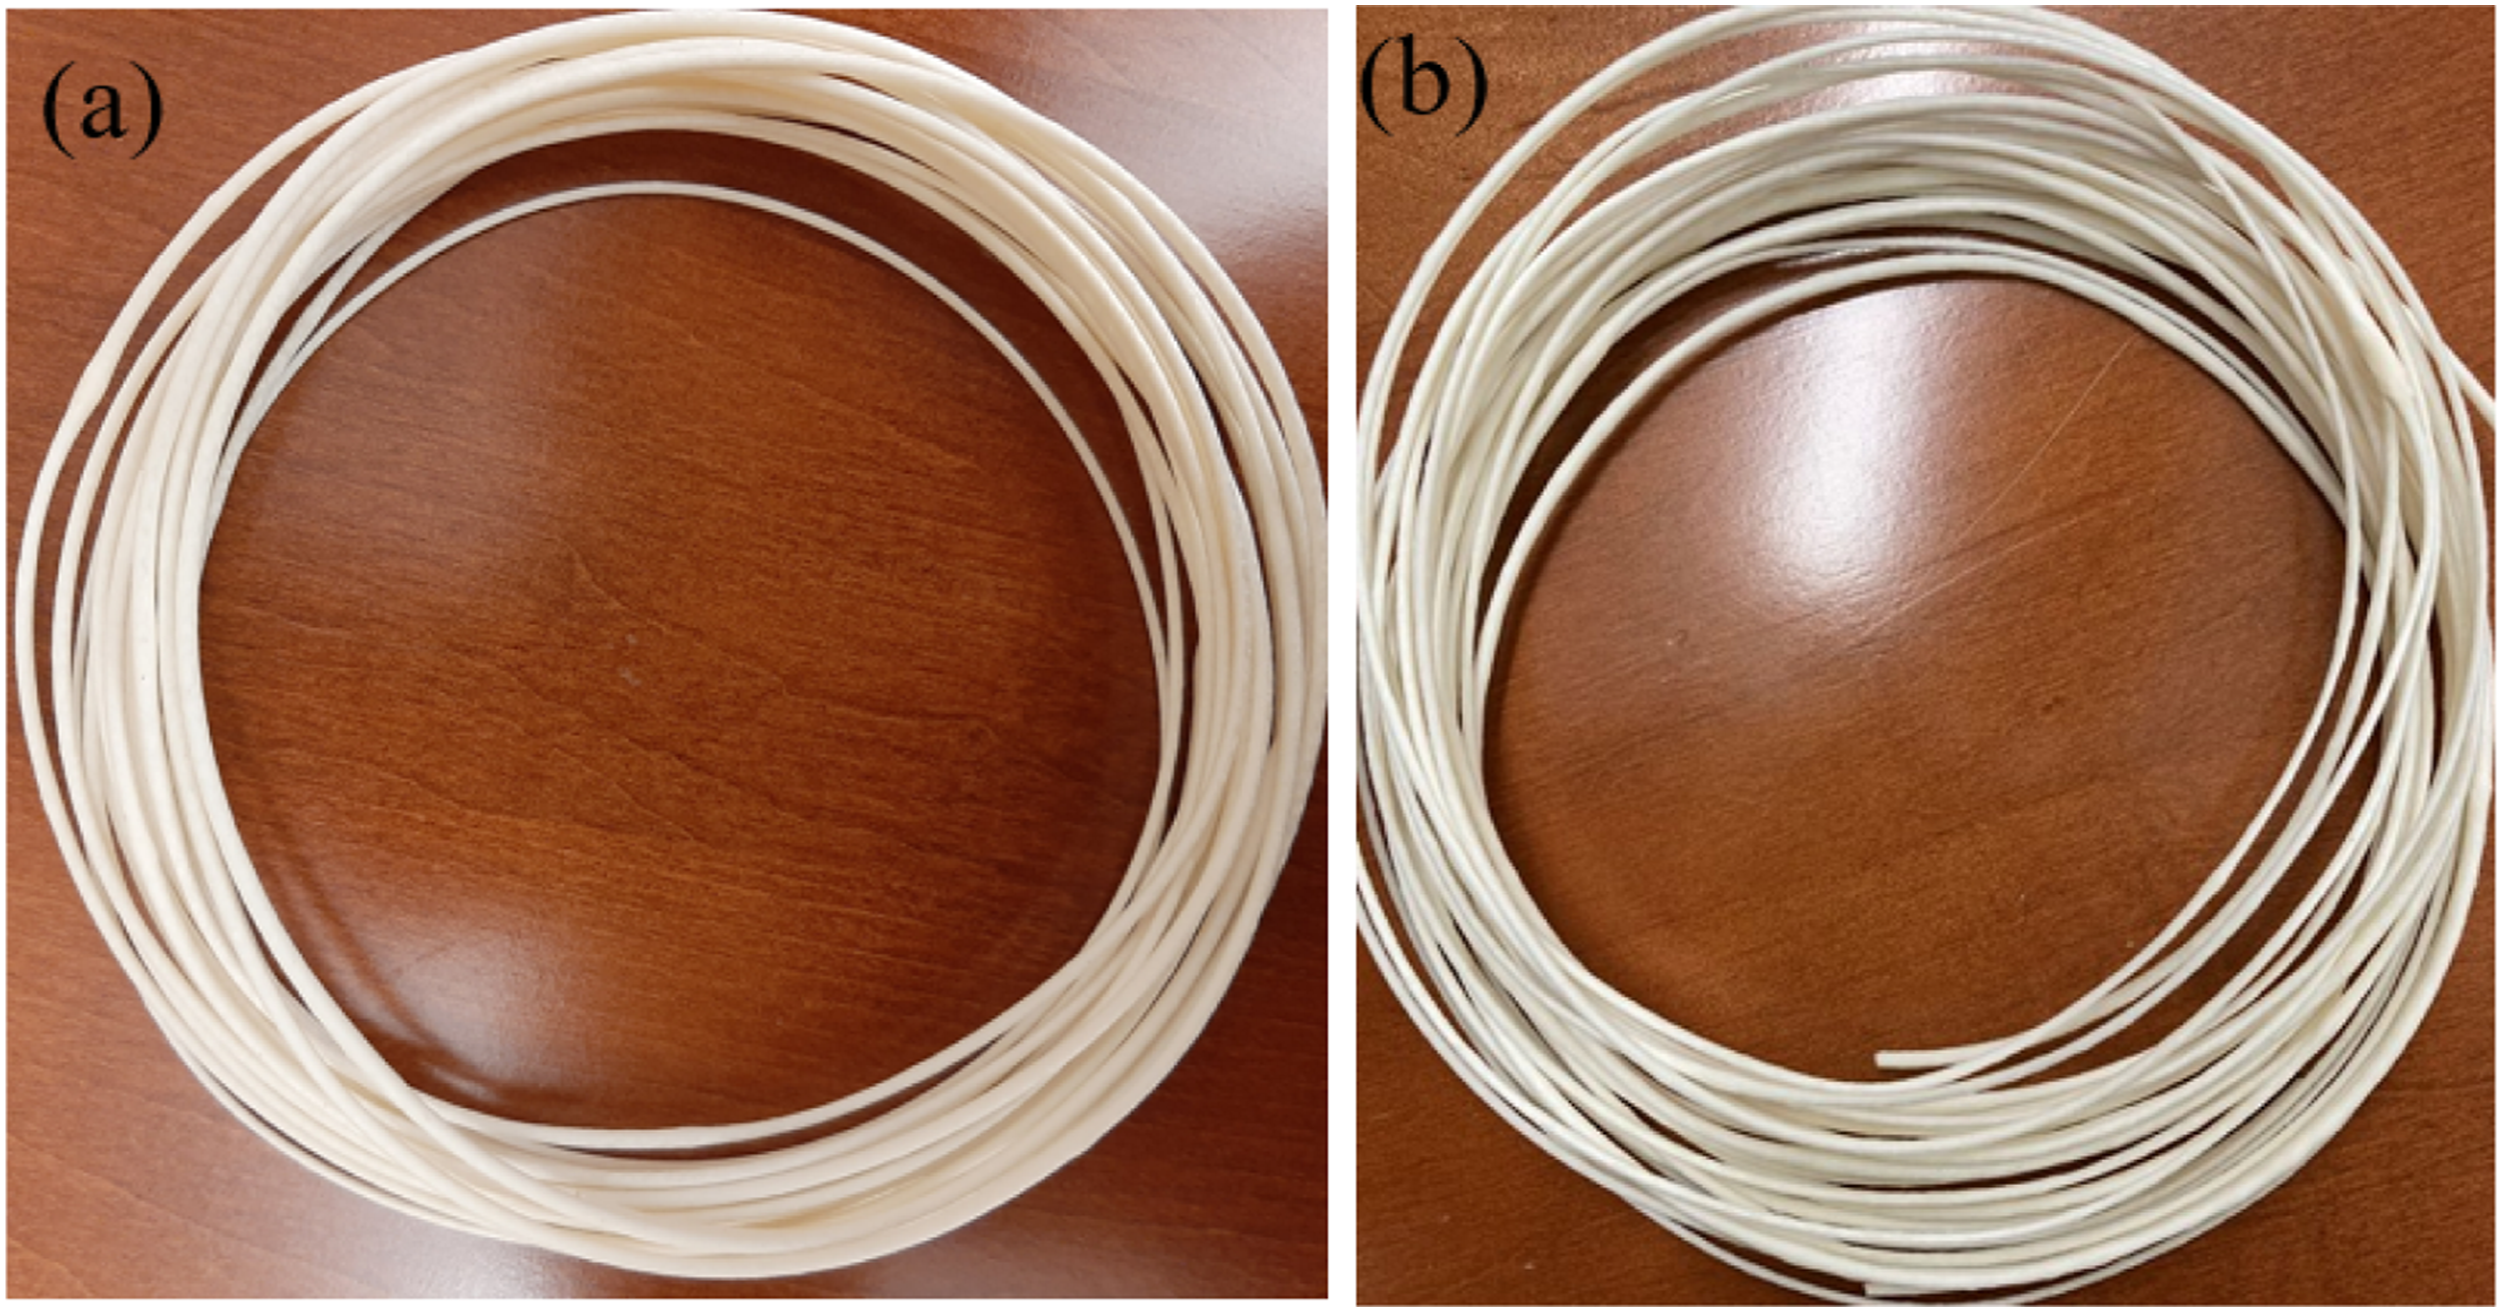
Representative composite filaments manufactured: (a) PLA_T40_P3, (b) PLA_T40_P0.5.
Material characterization methods
Uniaxial tensile tests of composite filaments
Proper selection of filaments is necessary to precisely predict the mechanical properties of the produced composite filaments. For this purpose, the filaments having diameter as shown in Table 1 were considered for the uniaxial tensile tests. Instron 5565 (Norwood, MA, USA) was employed to test the mechanical properties with a load cell of 1 kN, gage length of 50 mm, and crosshead speed of 25 mm/min (Figure 2). Five specimens were tested for each composition and the average values were reported. Uniaxial tensile testing of composite filaments manufactured. (a) Before extension on the Instron 5565 machine, and (b) After the extension.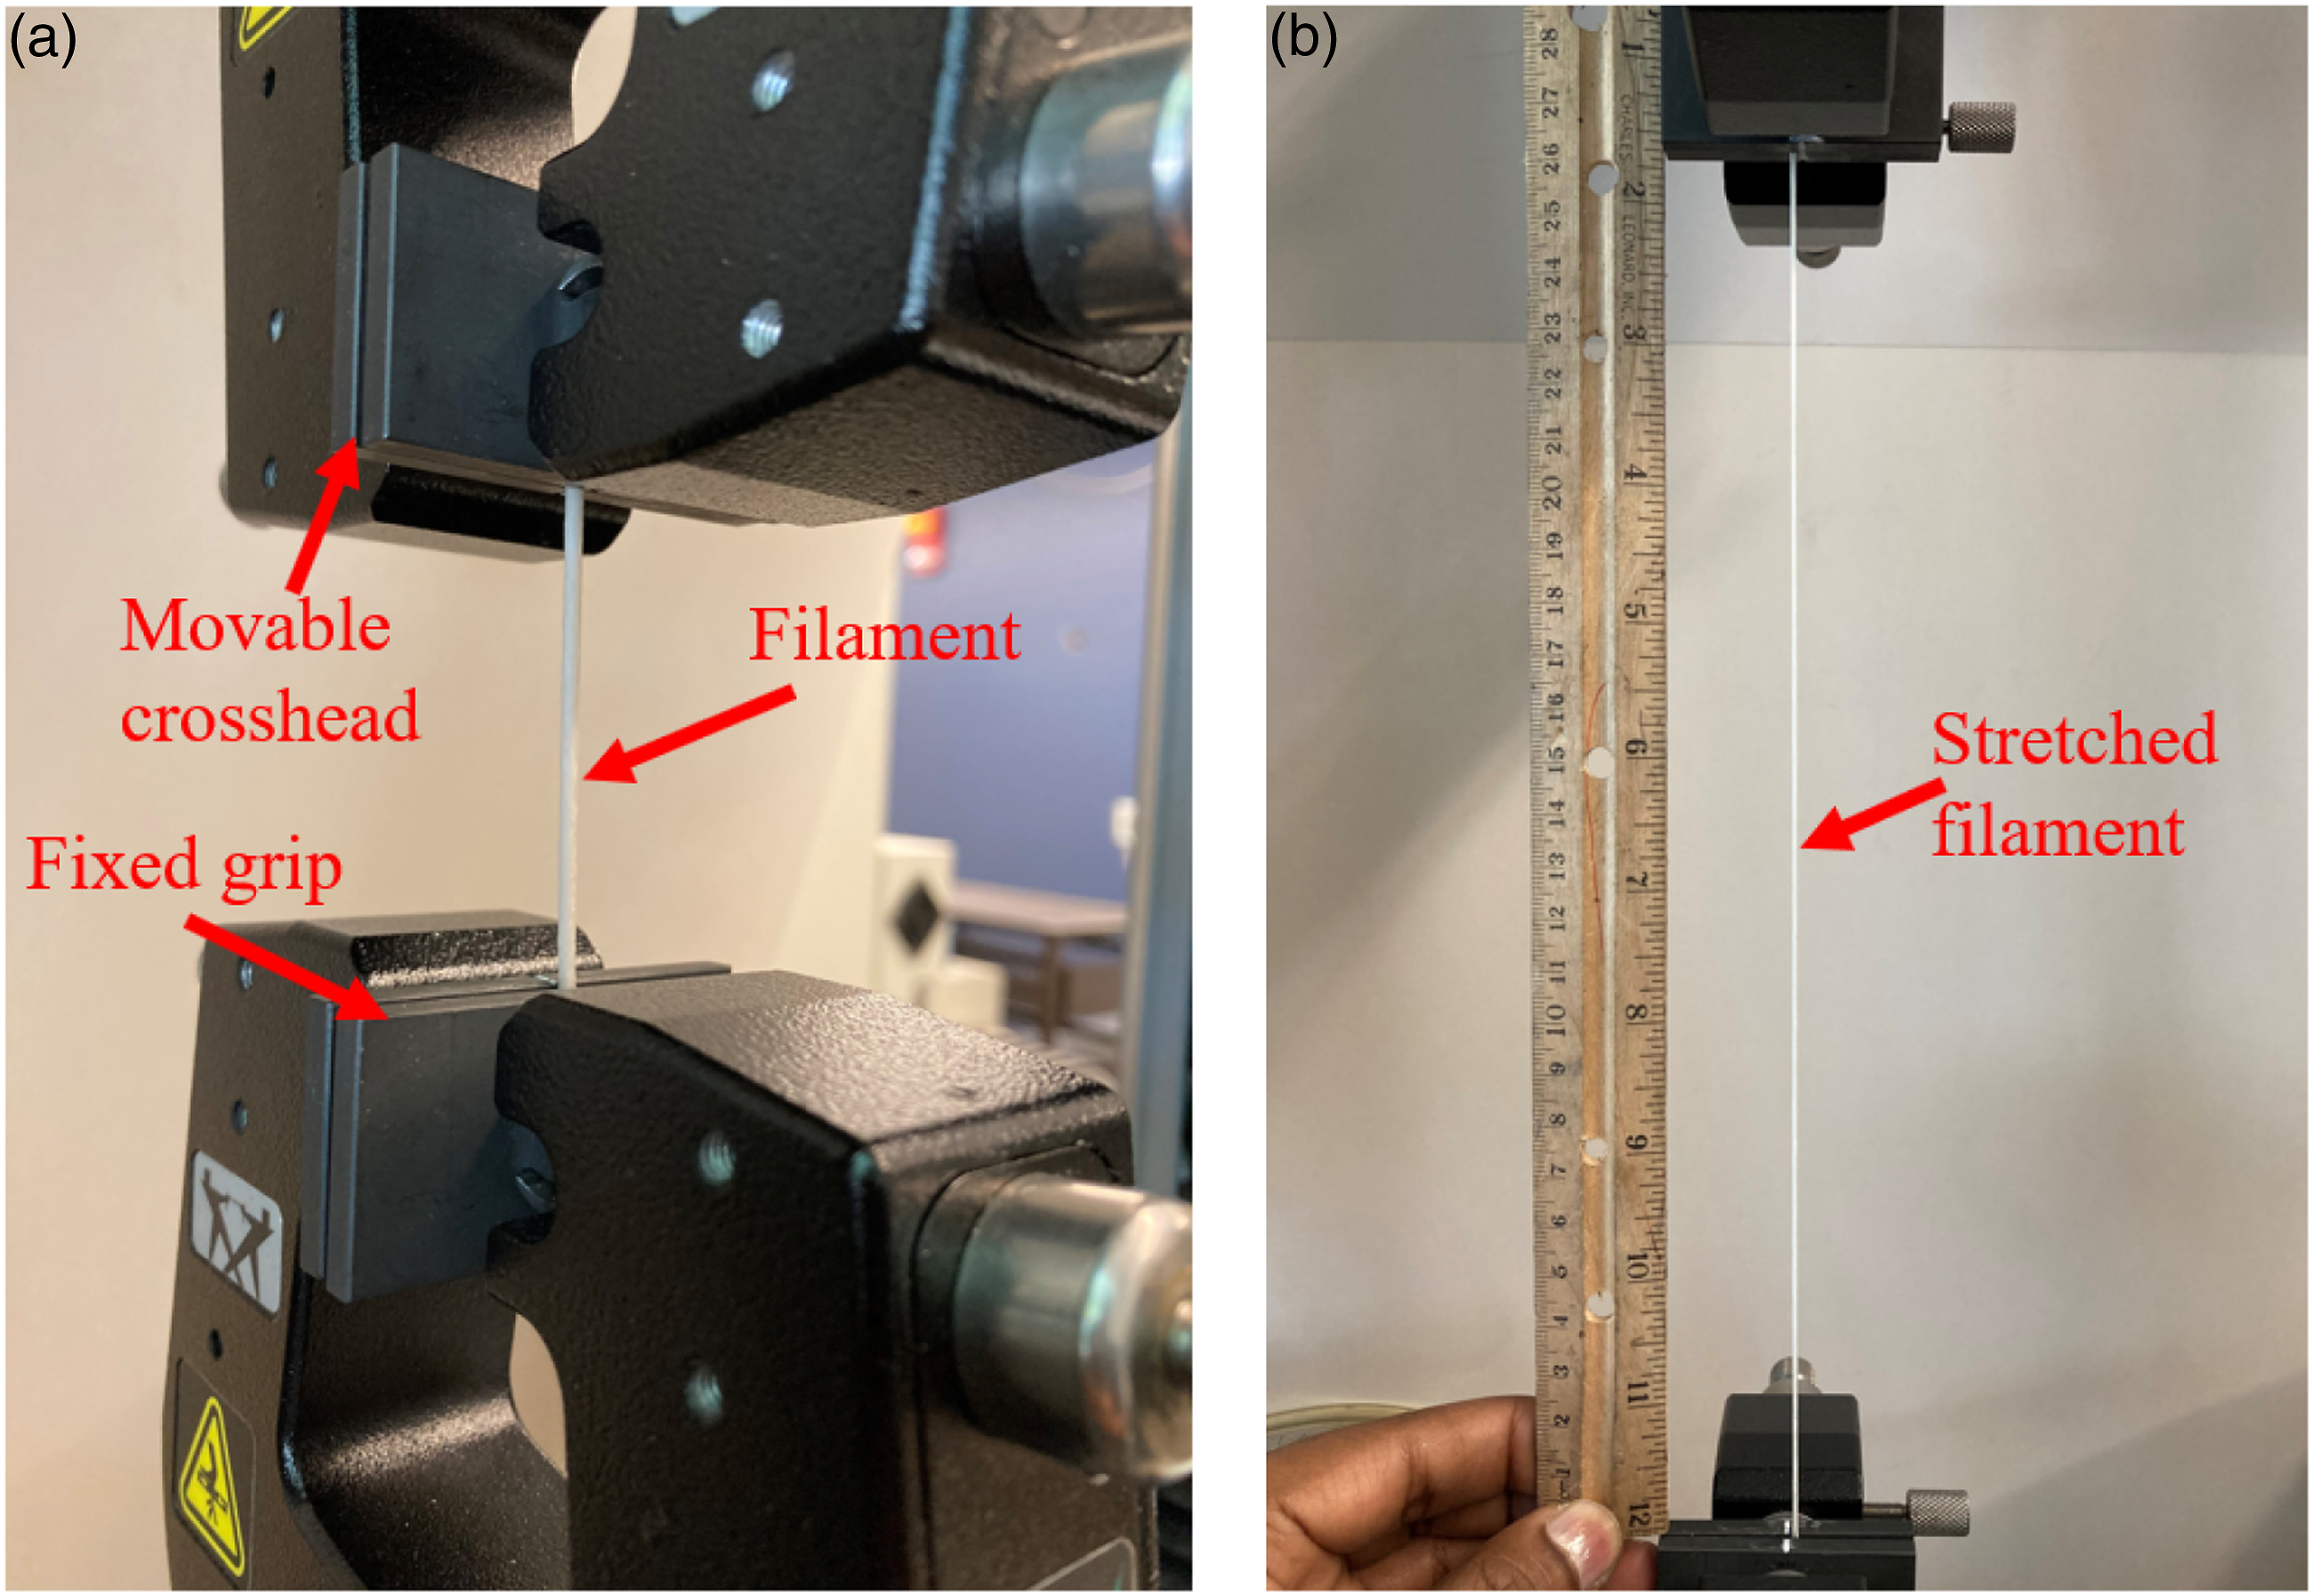
Differential scanning calorimetry analysis
Differential scanning calorimetry (DSC) analysis was conducted using a Q2000 TA instrument. All the experiments were operated under a nitrogen atmosphere at the flow rate of 50 mL/min. The samples, weighing from 5 to 10 mg, were first heated from −70°C to 220°C and then were cooled from 220°C to −70°C and again heated to 220°C at a heating and cooling rate of 10°C/min. The parameters such as glass transition temperature (
Thermogravimetric analysis
Thermogravimetric analysis (TGA) was conducted using Q500 TA instrument under a nitrogen atmosphere at a flow rate of 60 mL/min. The samples, weighing from 6 mg to 10 mg, were kept in the platinum pan and were heated from room temperature to 700°C at a heating rate of 10°C/min.
Dynamic mechanical analysis
The thermomechanical properties of the samples were evaluated by performing the dynamic mechanical analysis (DMA) using an RSA3 TA instruments. The dynamic temperature ramp test was conducted from −50°C to 80°C using the three-point bending fixture (flexural mode) at a ramp rate of 3°C/min, frequency of 1 Hz, and strain of 0.5%. Liquid nitrogen was used during the tests to regulate the heating and cooling process. Before conducting the tests, specimens with dimensions 40 mm × 10 mm × 1 mm were manufactured for each composition using the hot press with the temperature set at 200°C.
Fourier transform infrared spectroscopy
Fourier transform infrared spectroscopy (FTIR) analysis of the composite filaments was performed using a Nicolet 6700 FTIR (ThermoFisher Scientific, Madison, WI, USA). It was conducted for a total of 64 scans with a resolution of 4 cm−1 and having the wavenumbers in the range of 400–4000 cm−1.
Scanning electron microscope
Scanning electron microscope (SEM) was used to study the cross-section and surfaces of the composite filaments. The filaments were cryogenically fractured by immersing them in liquid nitrogen to prevent any alteration in the surface morphology. The specimens were gold-sputtered using EMS Q150R sputter coating device since they were non-conductive. The study was performed at different magnifications at an accelerating voltage of 20 kV and a working distance of approximately 10 mm–15 mm.
3D printing of fabric using composite filament
A 3D model of plain weave fabric structure was constructed using computer aided design (CAD) software, Solidworks® as shown in Figure 3. The details of design and construction can be found in ref [12]. The print settings used were infill density of 100%, printing temperature of 225°C, and print speed of 10 mm/s. CAD model of plain weave fabric for 3D printing.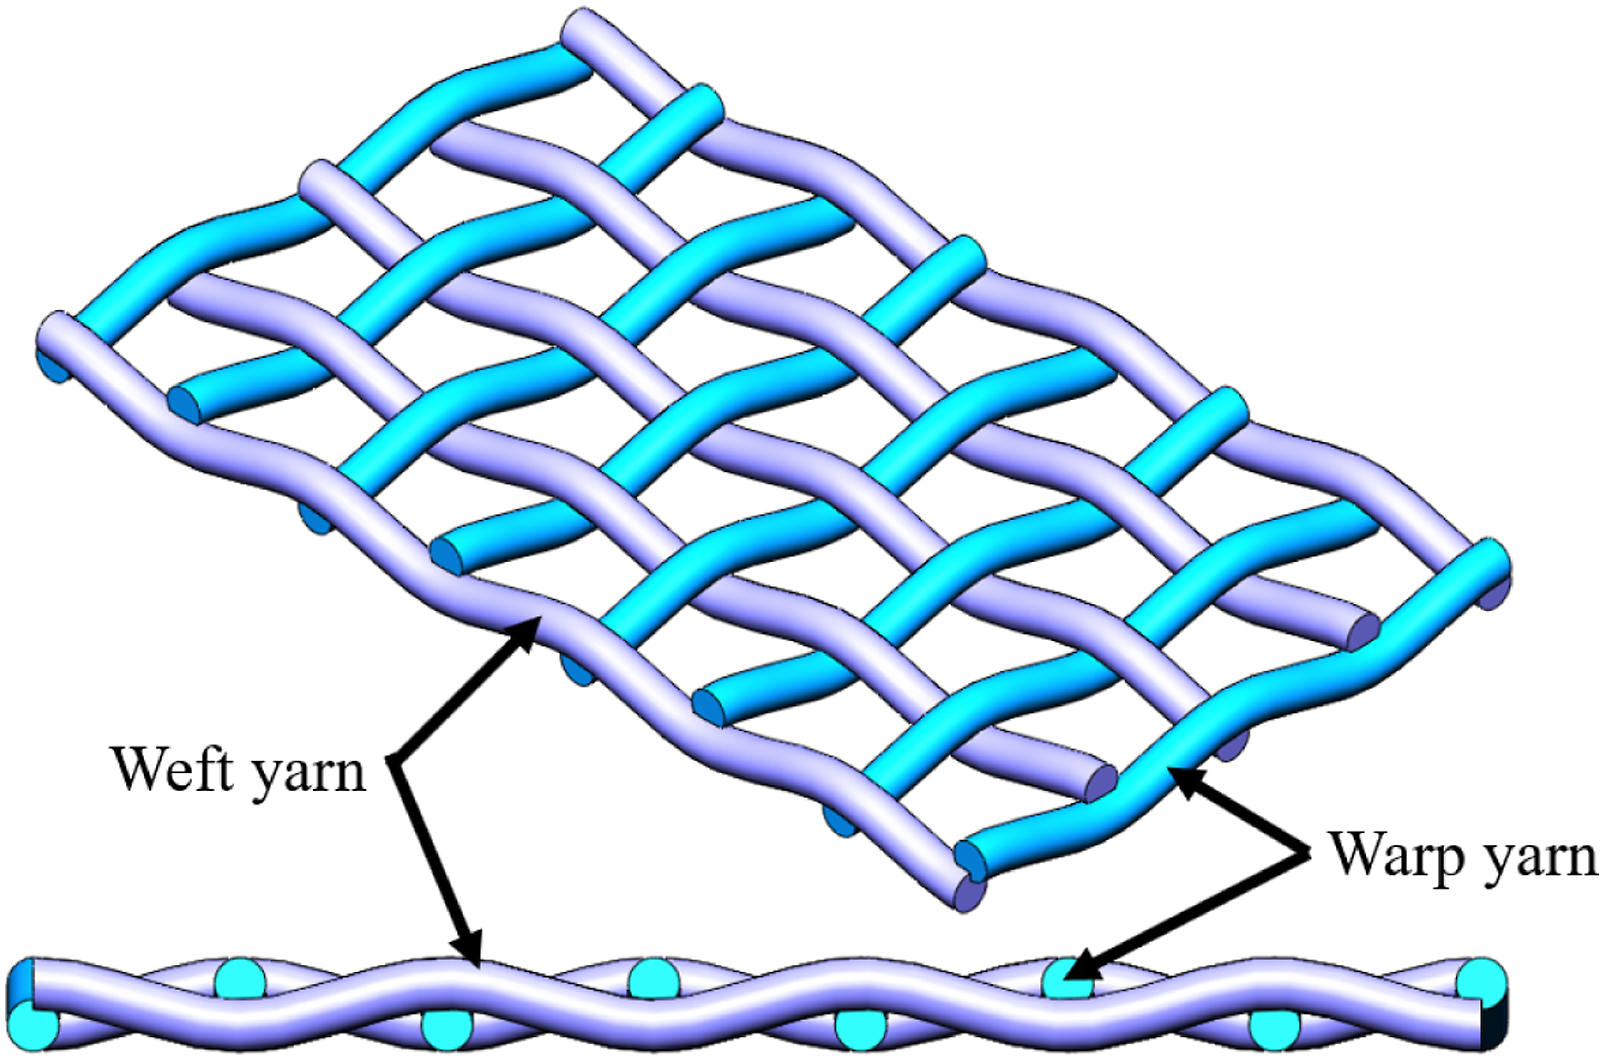
Statistical analysis
Analysis of variance (ANOVA) test was done for tensile test results by using OriginPro Statistical Software to evaluate the effect of fillers and plasticizers on the composite filaments. All analyses were carried out at 0.05 significance level (i.e., α = 0.05). To determine exactly which group means are significantly different, a Tukey test was performed.
Results and discussion
Tensile test results
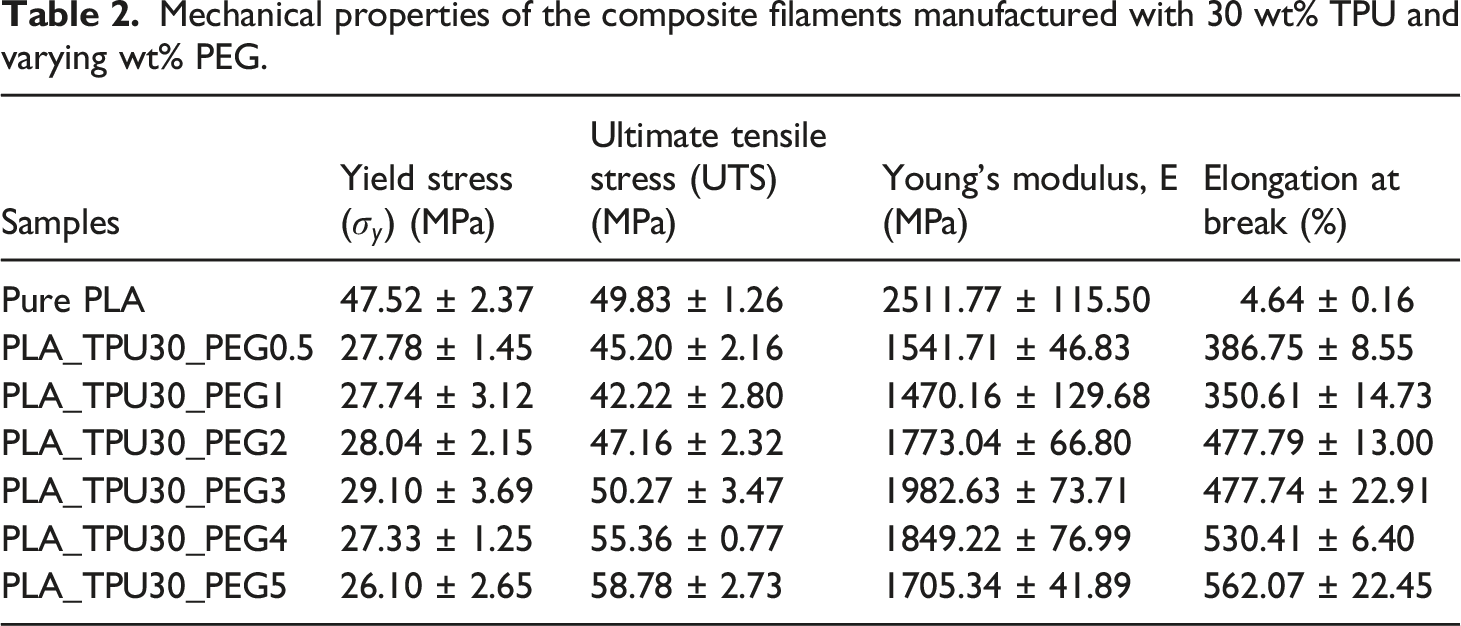
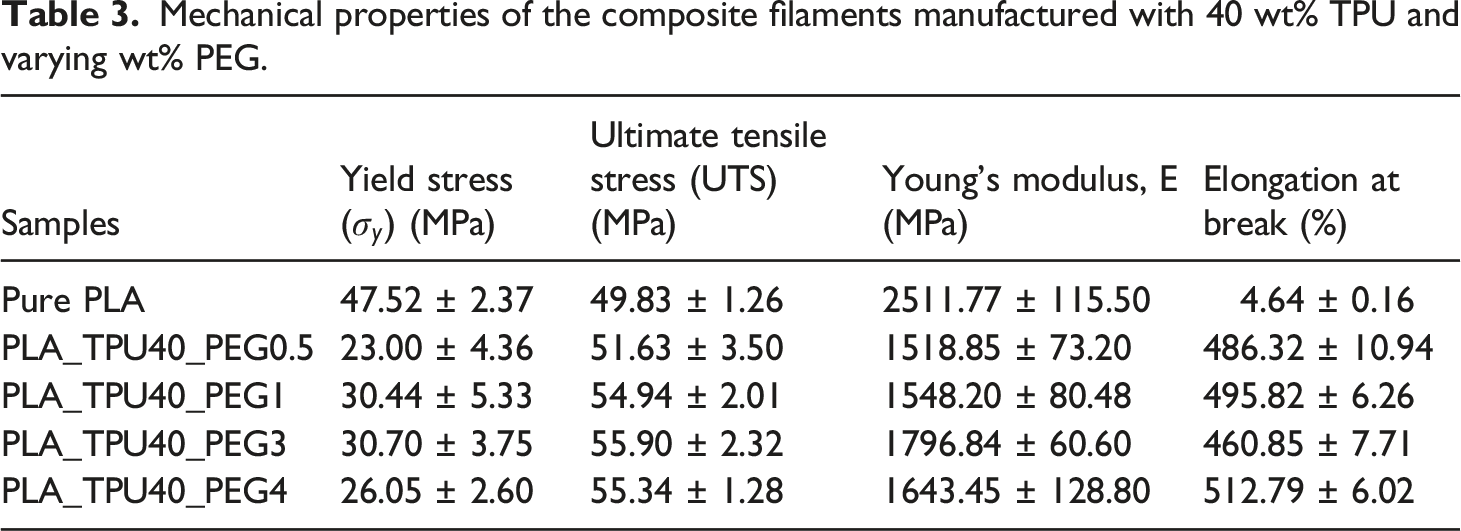
The tensile tests on pure PLA filaments and composite filaments were conducted, and the results are presented in Figure 4, Tables 2 and 3. This data show that the yield stress ( Engineering stress – strain curves of pure PLA filaments and composite filaments. (a) Stress-strain curves of PLA and composite filaments up to 10% of their elongation, and (b) Stress-strain curves of PLA and composite filaments up to their elongation at break. Mechanical properties of the composite filaments manufactured with 30 wt% TPU and varying wt% PEG. Mechanical properties of the composite filaments manufactured with 40 wt% TPU and varying wt% PEG.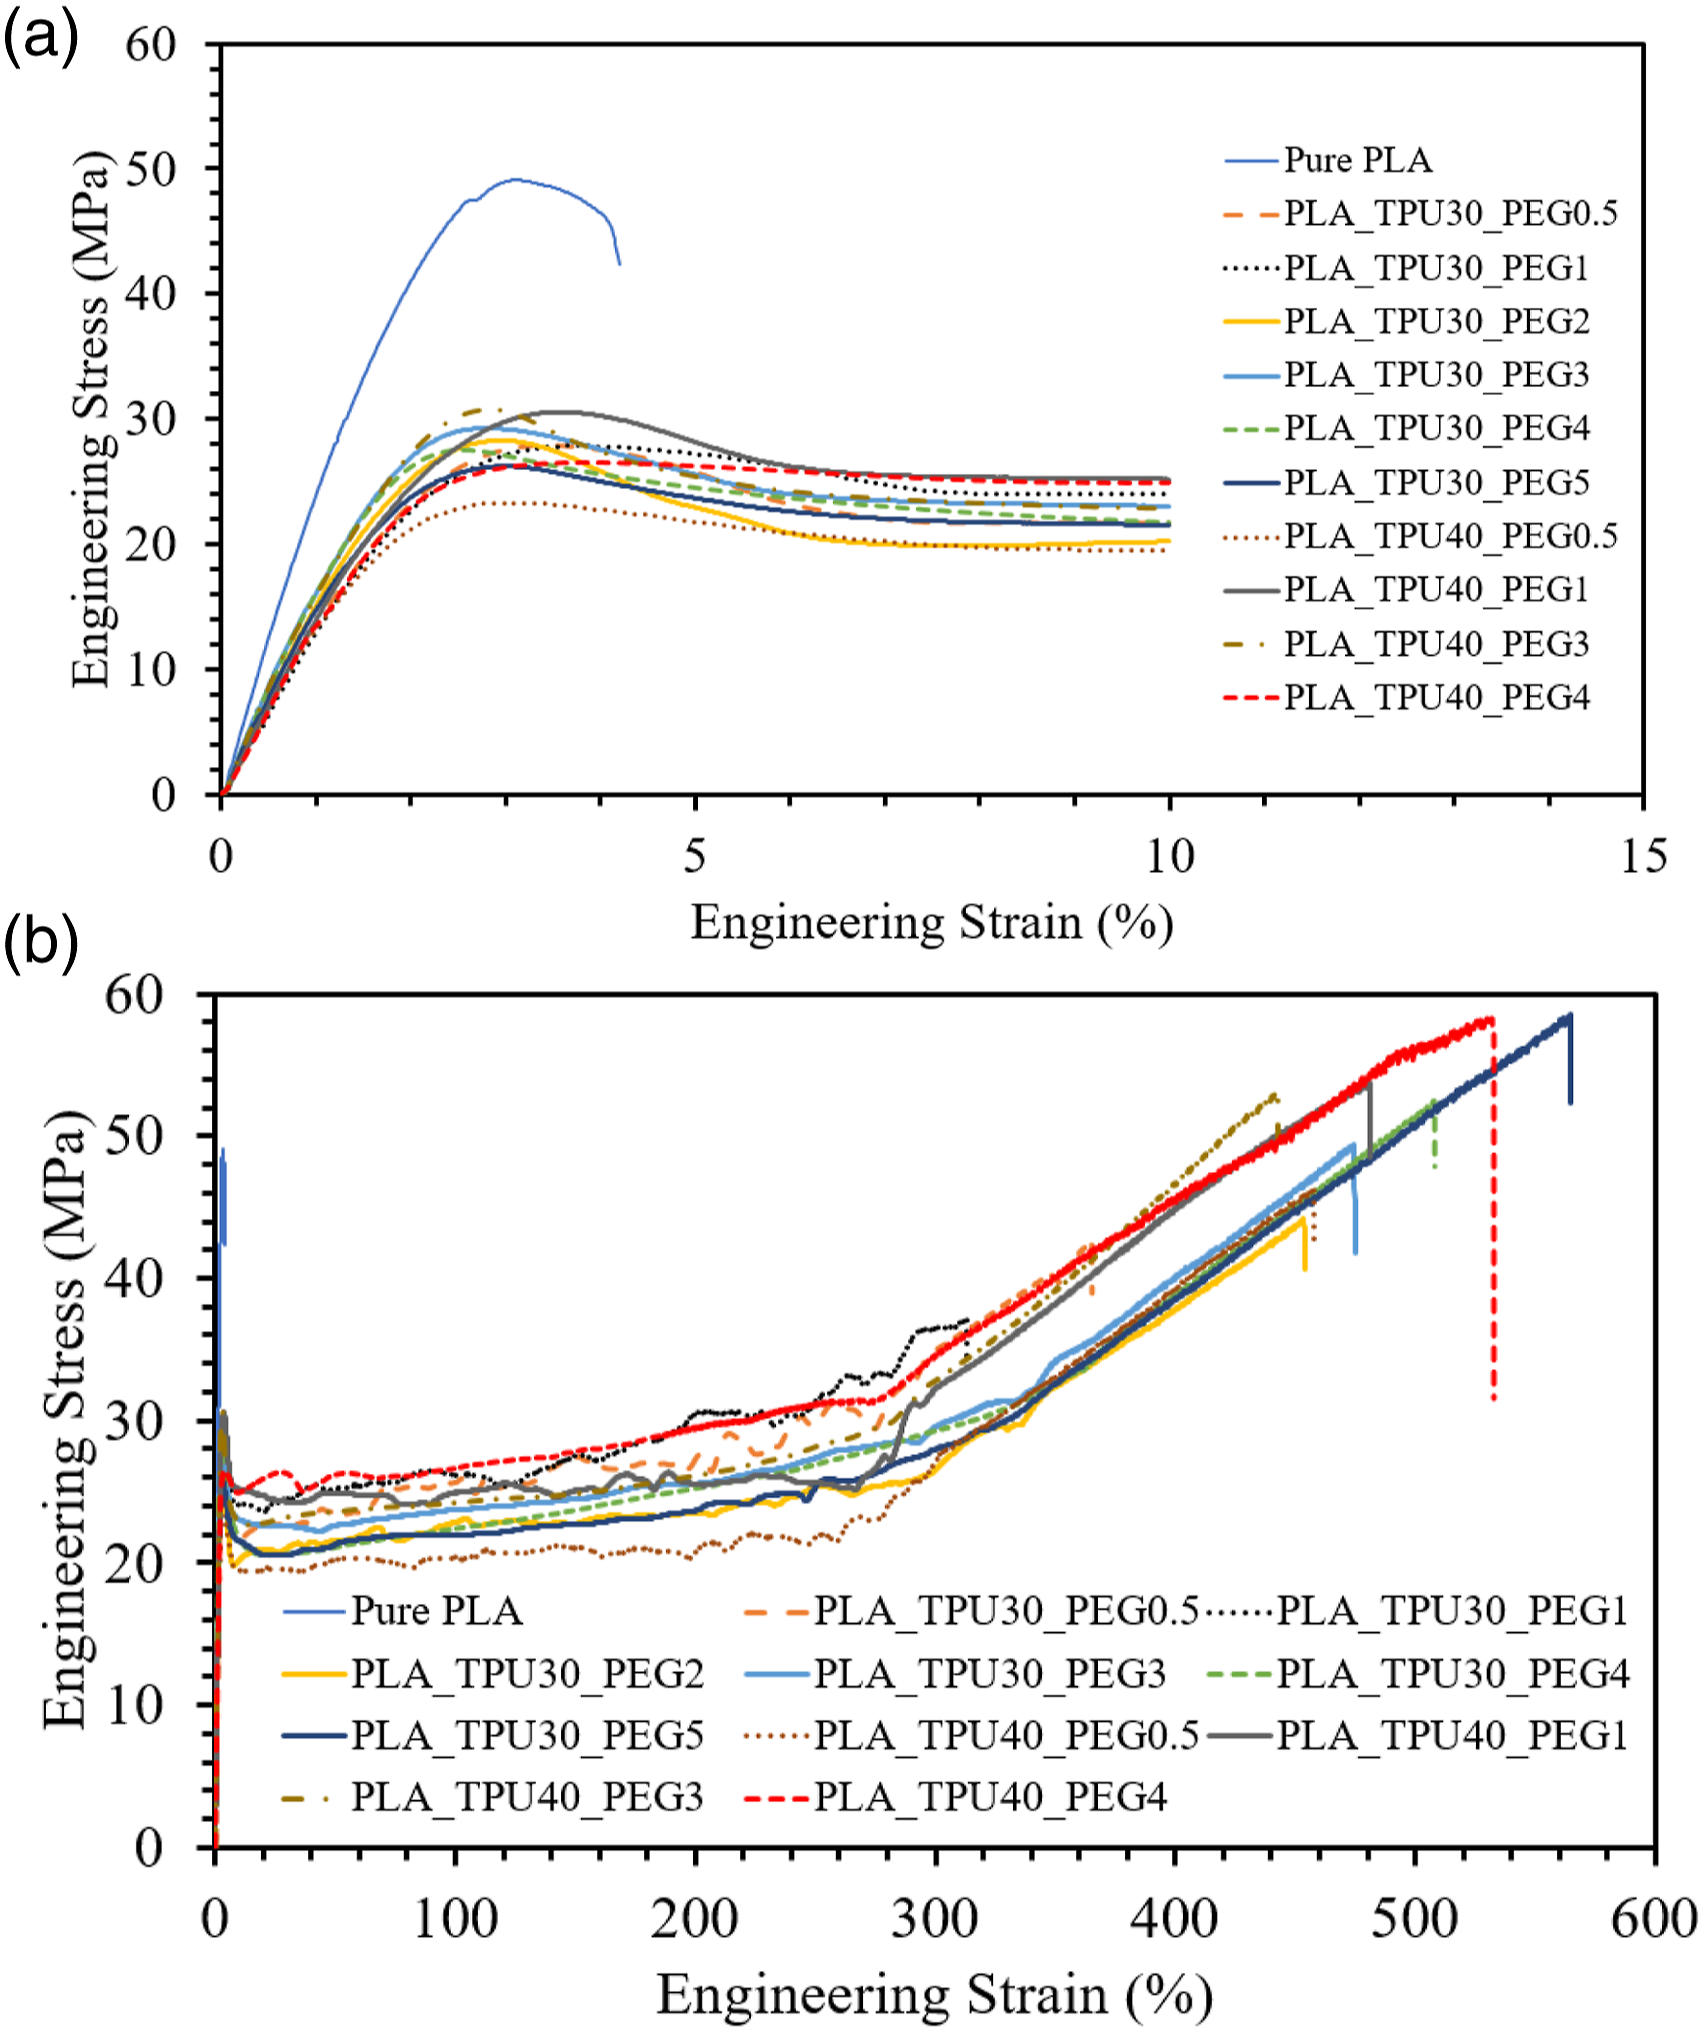
DSC results
The study of thermal properties of materials becomes crucial for applications in thermal environments and for this purpose, DSC was used in this research. The DSC curves showing the heat/cool/heat cycles of neat PLA is shown in Figure 5 and the properties obtained from the cooling and second heating cycle are presented in Table 4. The important phases such as glass transition temperature ( Heat/cool/heat cycle of PLA. Summary of DSC results of the composite filaments. Note: 2. 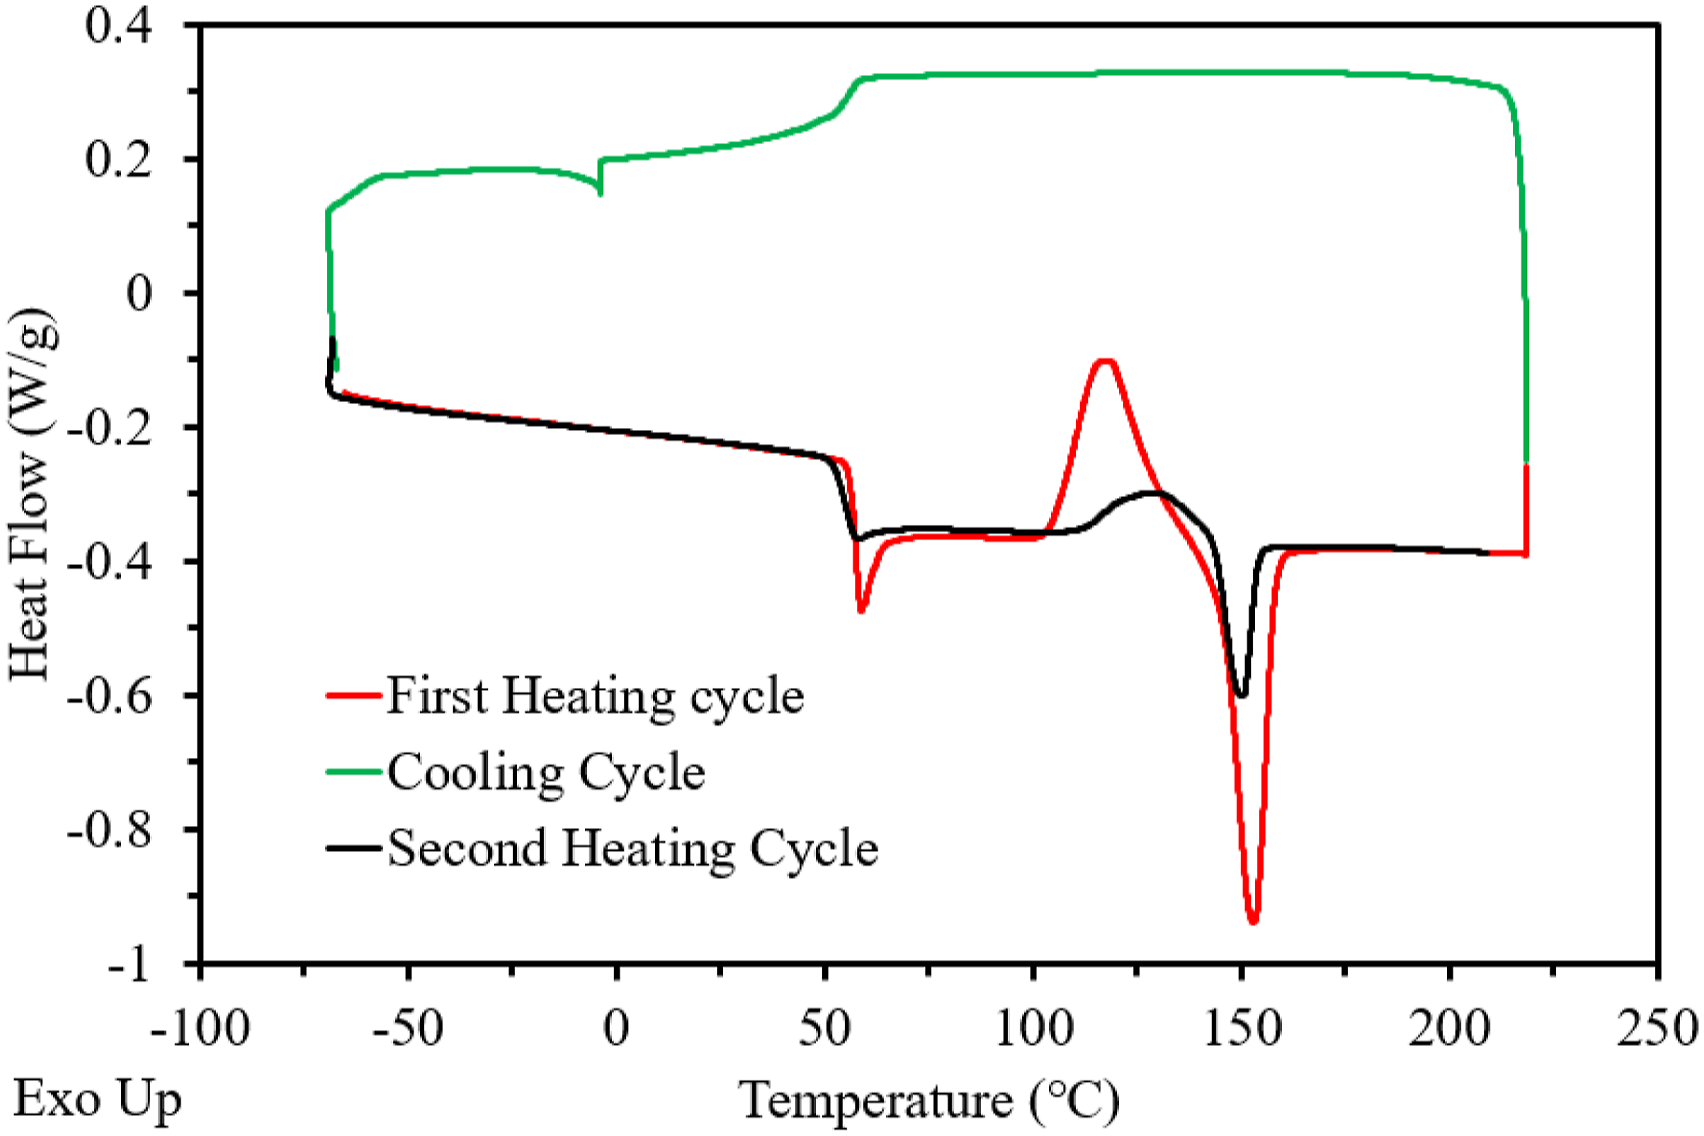
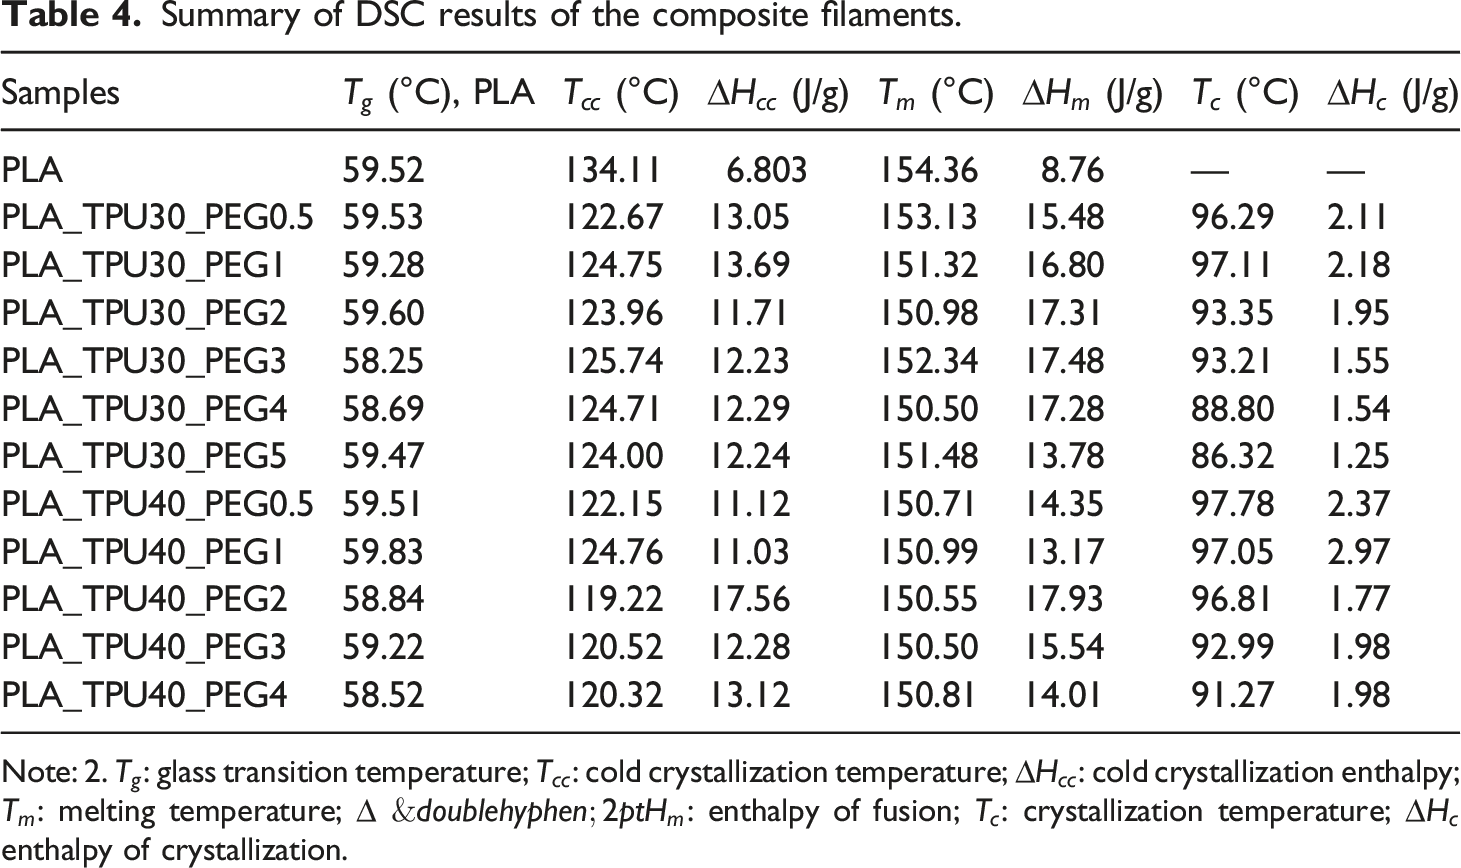
The
The cold crystallization peaks are visible for all the samples, and these are exothermic in nature. The
The endothermic melting peaks appear after the exothermic cold crystallization peaks. The melting temperature of neat PLA is 154°C and the enthalpy of fusion is 8.76 J/g. The melting temperatures found to be decreased slightly whereas the enthalpy of fusion (∆
DMA results
The thermo-mechanical behavior of PLA and the composite filaments were studied using DMA test method. The storage modulus ( Thermo-mechanical analysis of composite filaments. (a) 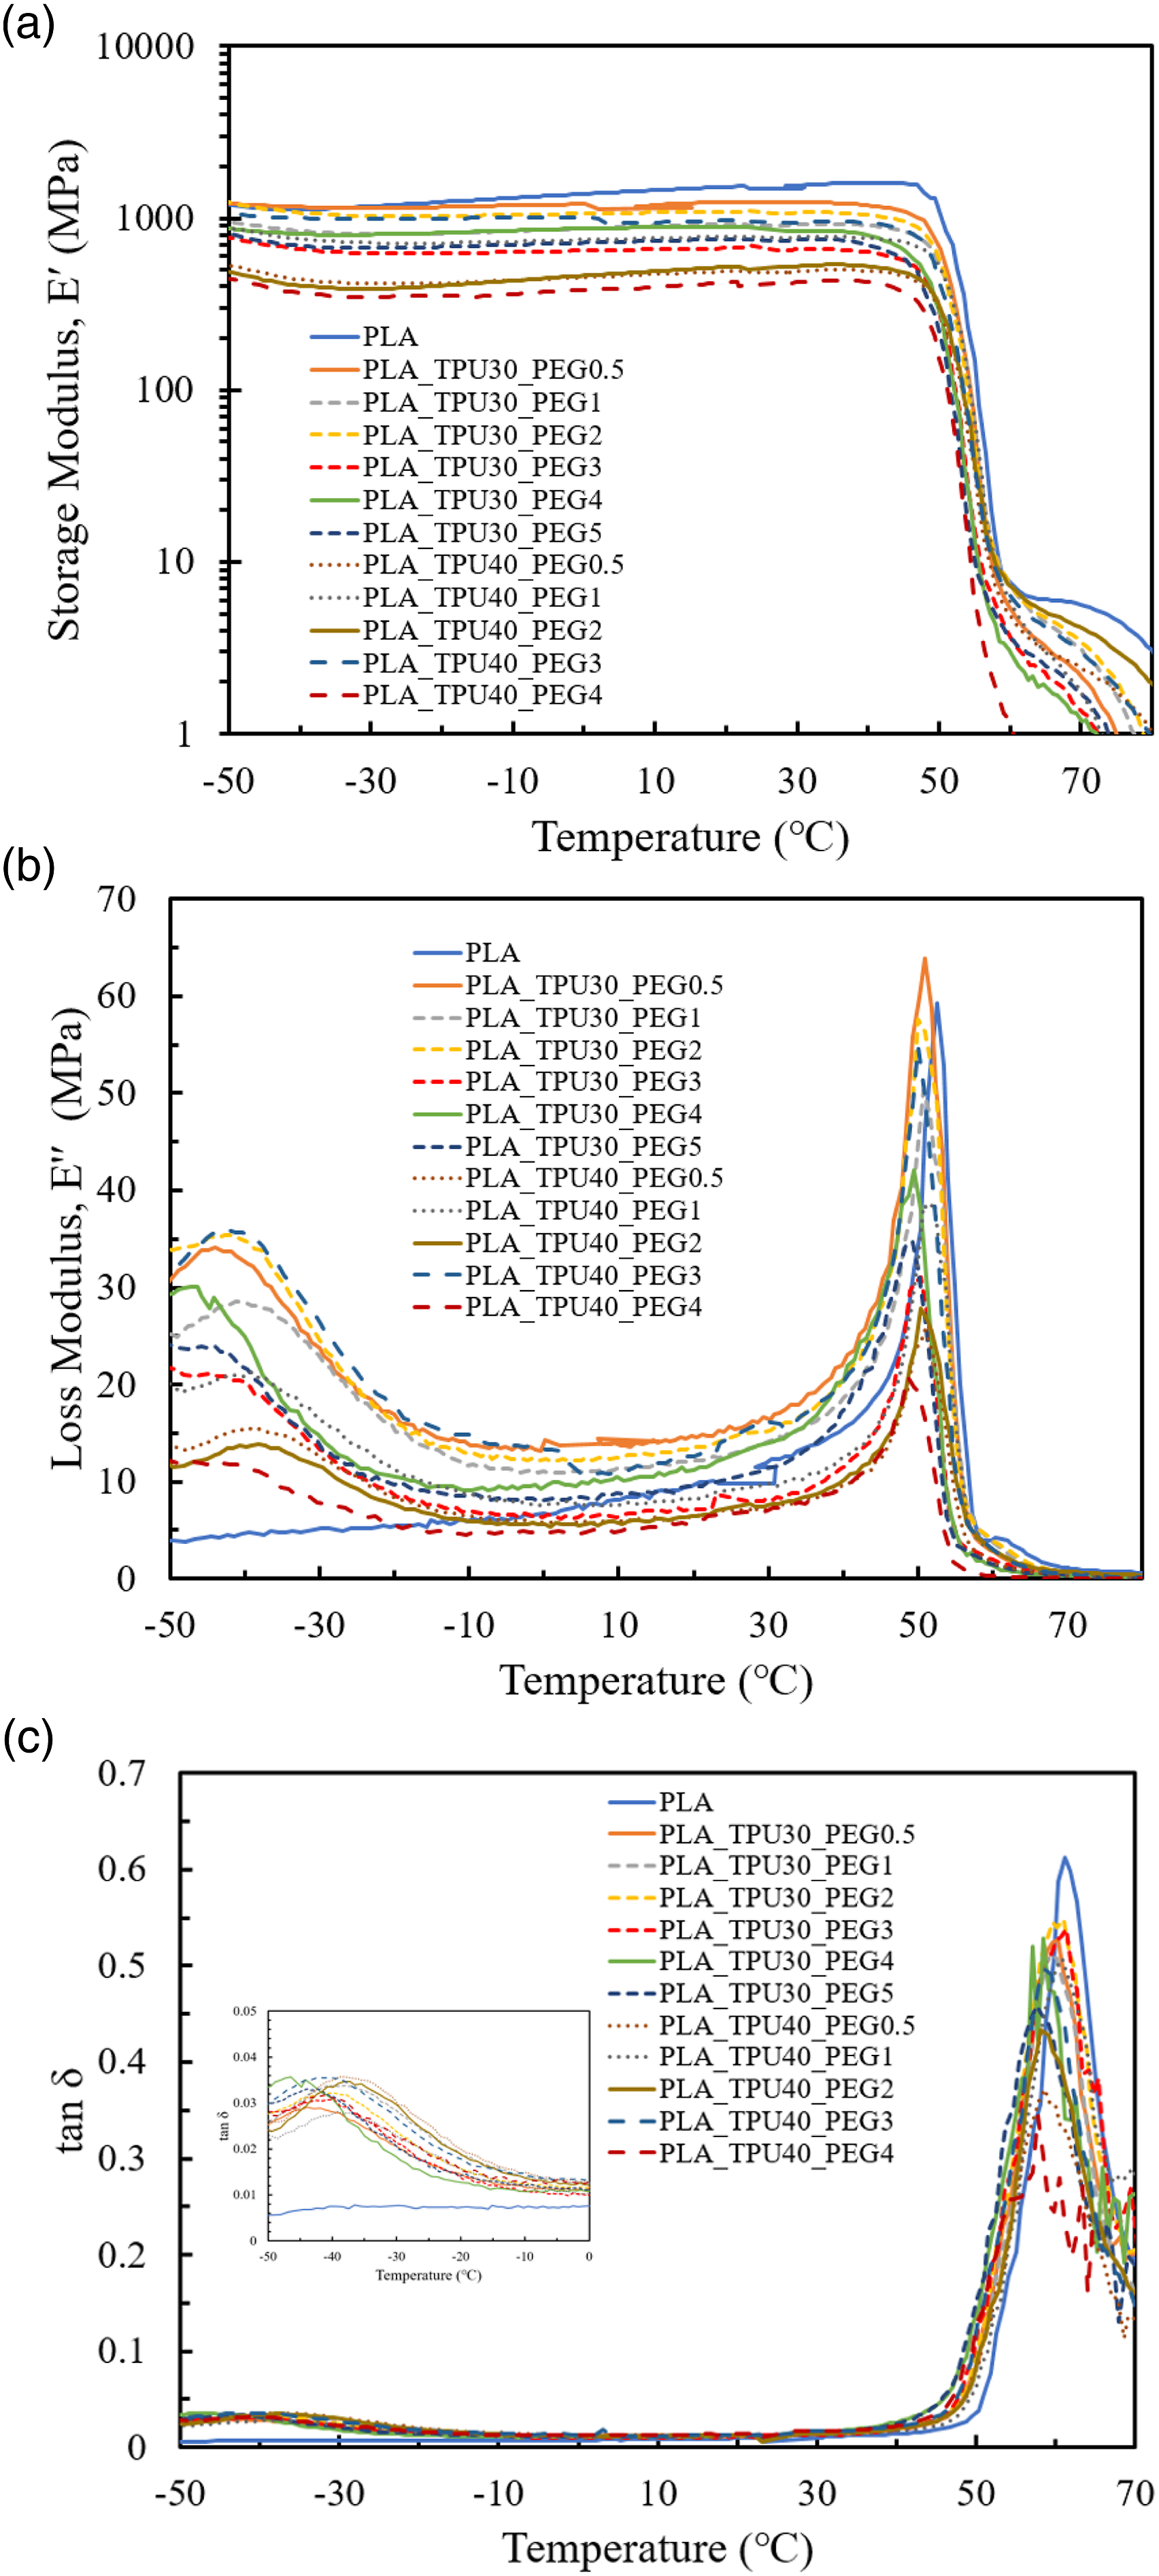
Loss modulus represents the viscous behavior of a material and its tendency to dissipate energy applied to it.
51
The initial loss modulus is lower for PLA filaments than other composites. This result represented that there was a change in polymer motion
52
and an increase in TPU and PEG content increased the molecular friction which might be the reason for higher loss modulus of the composite filaments. It should be noted that
Tanδ denotes the damping factor of the materials and is defined as the ratio of loss modulus to storage modulus (tanδ =
TGA results
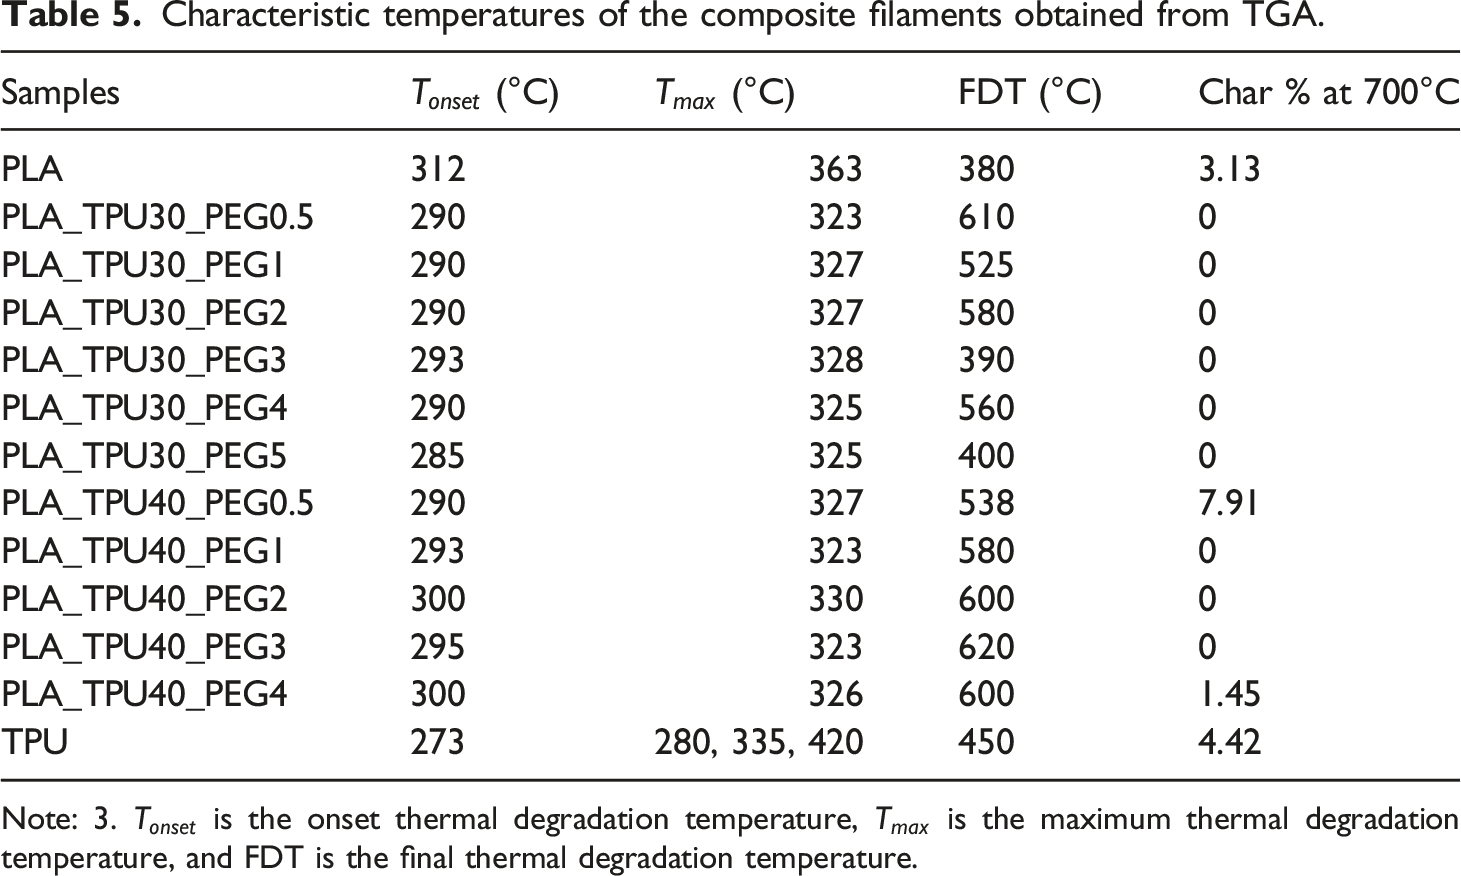
TGA is a useful method to understand the thermal degradation behavior of the substances.
55
The loss of mass and rate of loss at different temperatures help to determine the application of substances in thermal environments. The thermogravimetric (TG) and derivative thermogravimetric (DTG) curves of pure PLA filaments and composite filaments are shown in Figure 7. Effects of fillers and plasticizers in PLA matrix on the thermal degradation was studied. Neat PLA is observed to be more stable than all the composite materials. The onset thermal degradation temperature ( TGA thermograms of PLA filament, and the composite filaments manufactured. (a) TG curves showing the percentage weight loss of the composition at different temperatures, and (b) DTG curves showing the rate of weight loss. Characteristic temperatures of the composite filaments obtained from TGA. Note: 3. 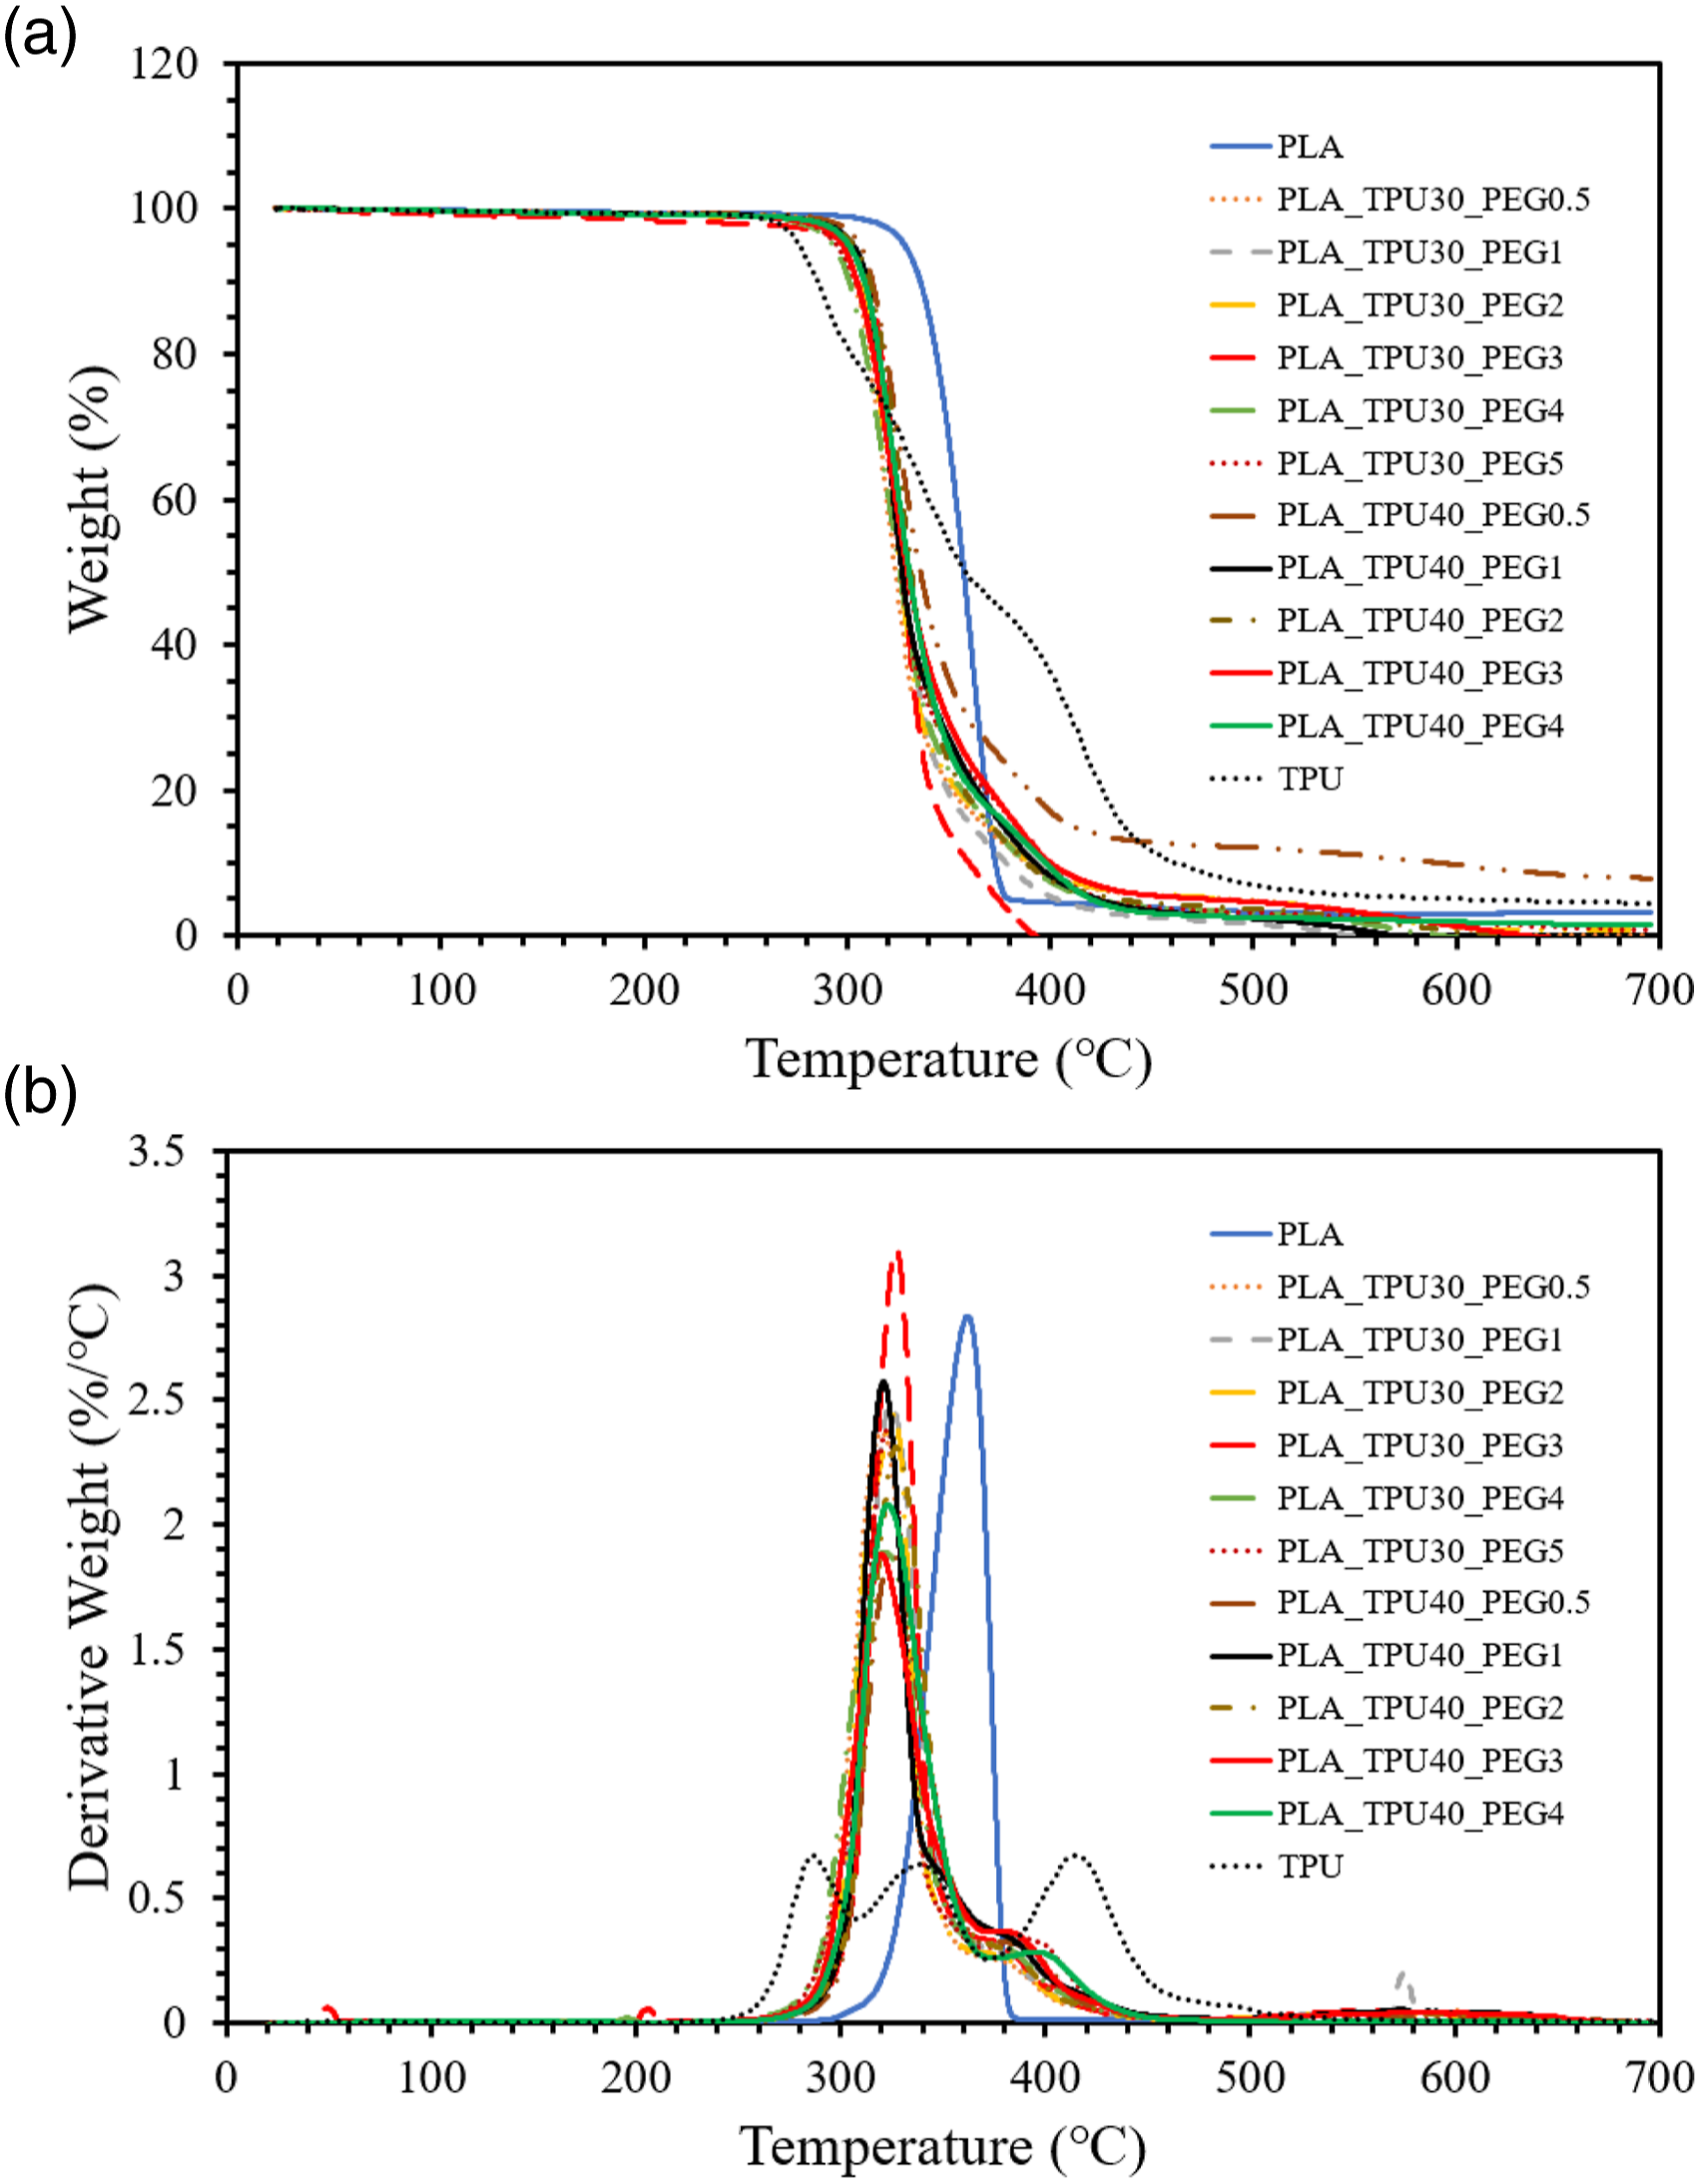
FTIR results
To determine the functional groups of the polymers in the composites, FTIR spectroscopy was performed, and the results are shown in Figure 8. The spectra of the composite filaments having 30 wt% TPU, and varying wt% of PLA and PEG is shown in Figure 8(a) whereas the spectra of the composite filaments having 40 wt% TPU and varying wt% of PLA and PEG is shown in Figure 8(b). The functional groups associated with their wavenumber and intensity of PLA and TPU are listed in Table 6. FTIR spectra of PLA, TPU and composite filaments. (a) The composite filaments have 30 wt% TPU and varying wt% of PLA and PEG, (b) The composite filaments have 40 wt% TPU and varying wt% of PLA and PEG.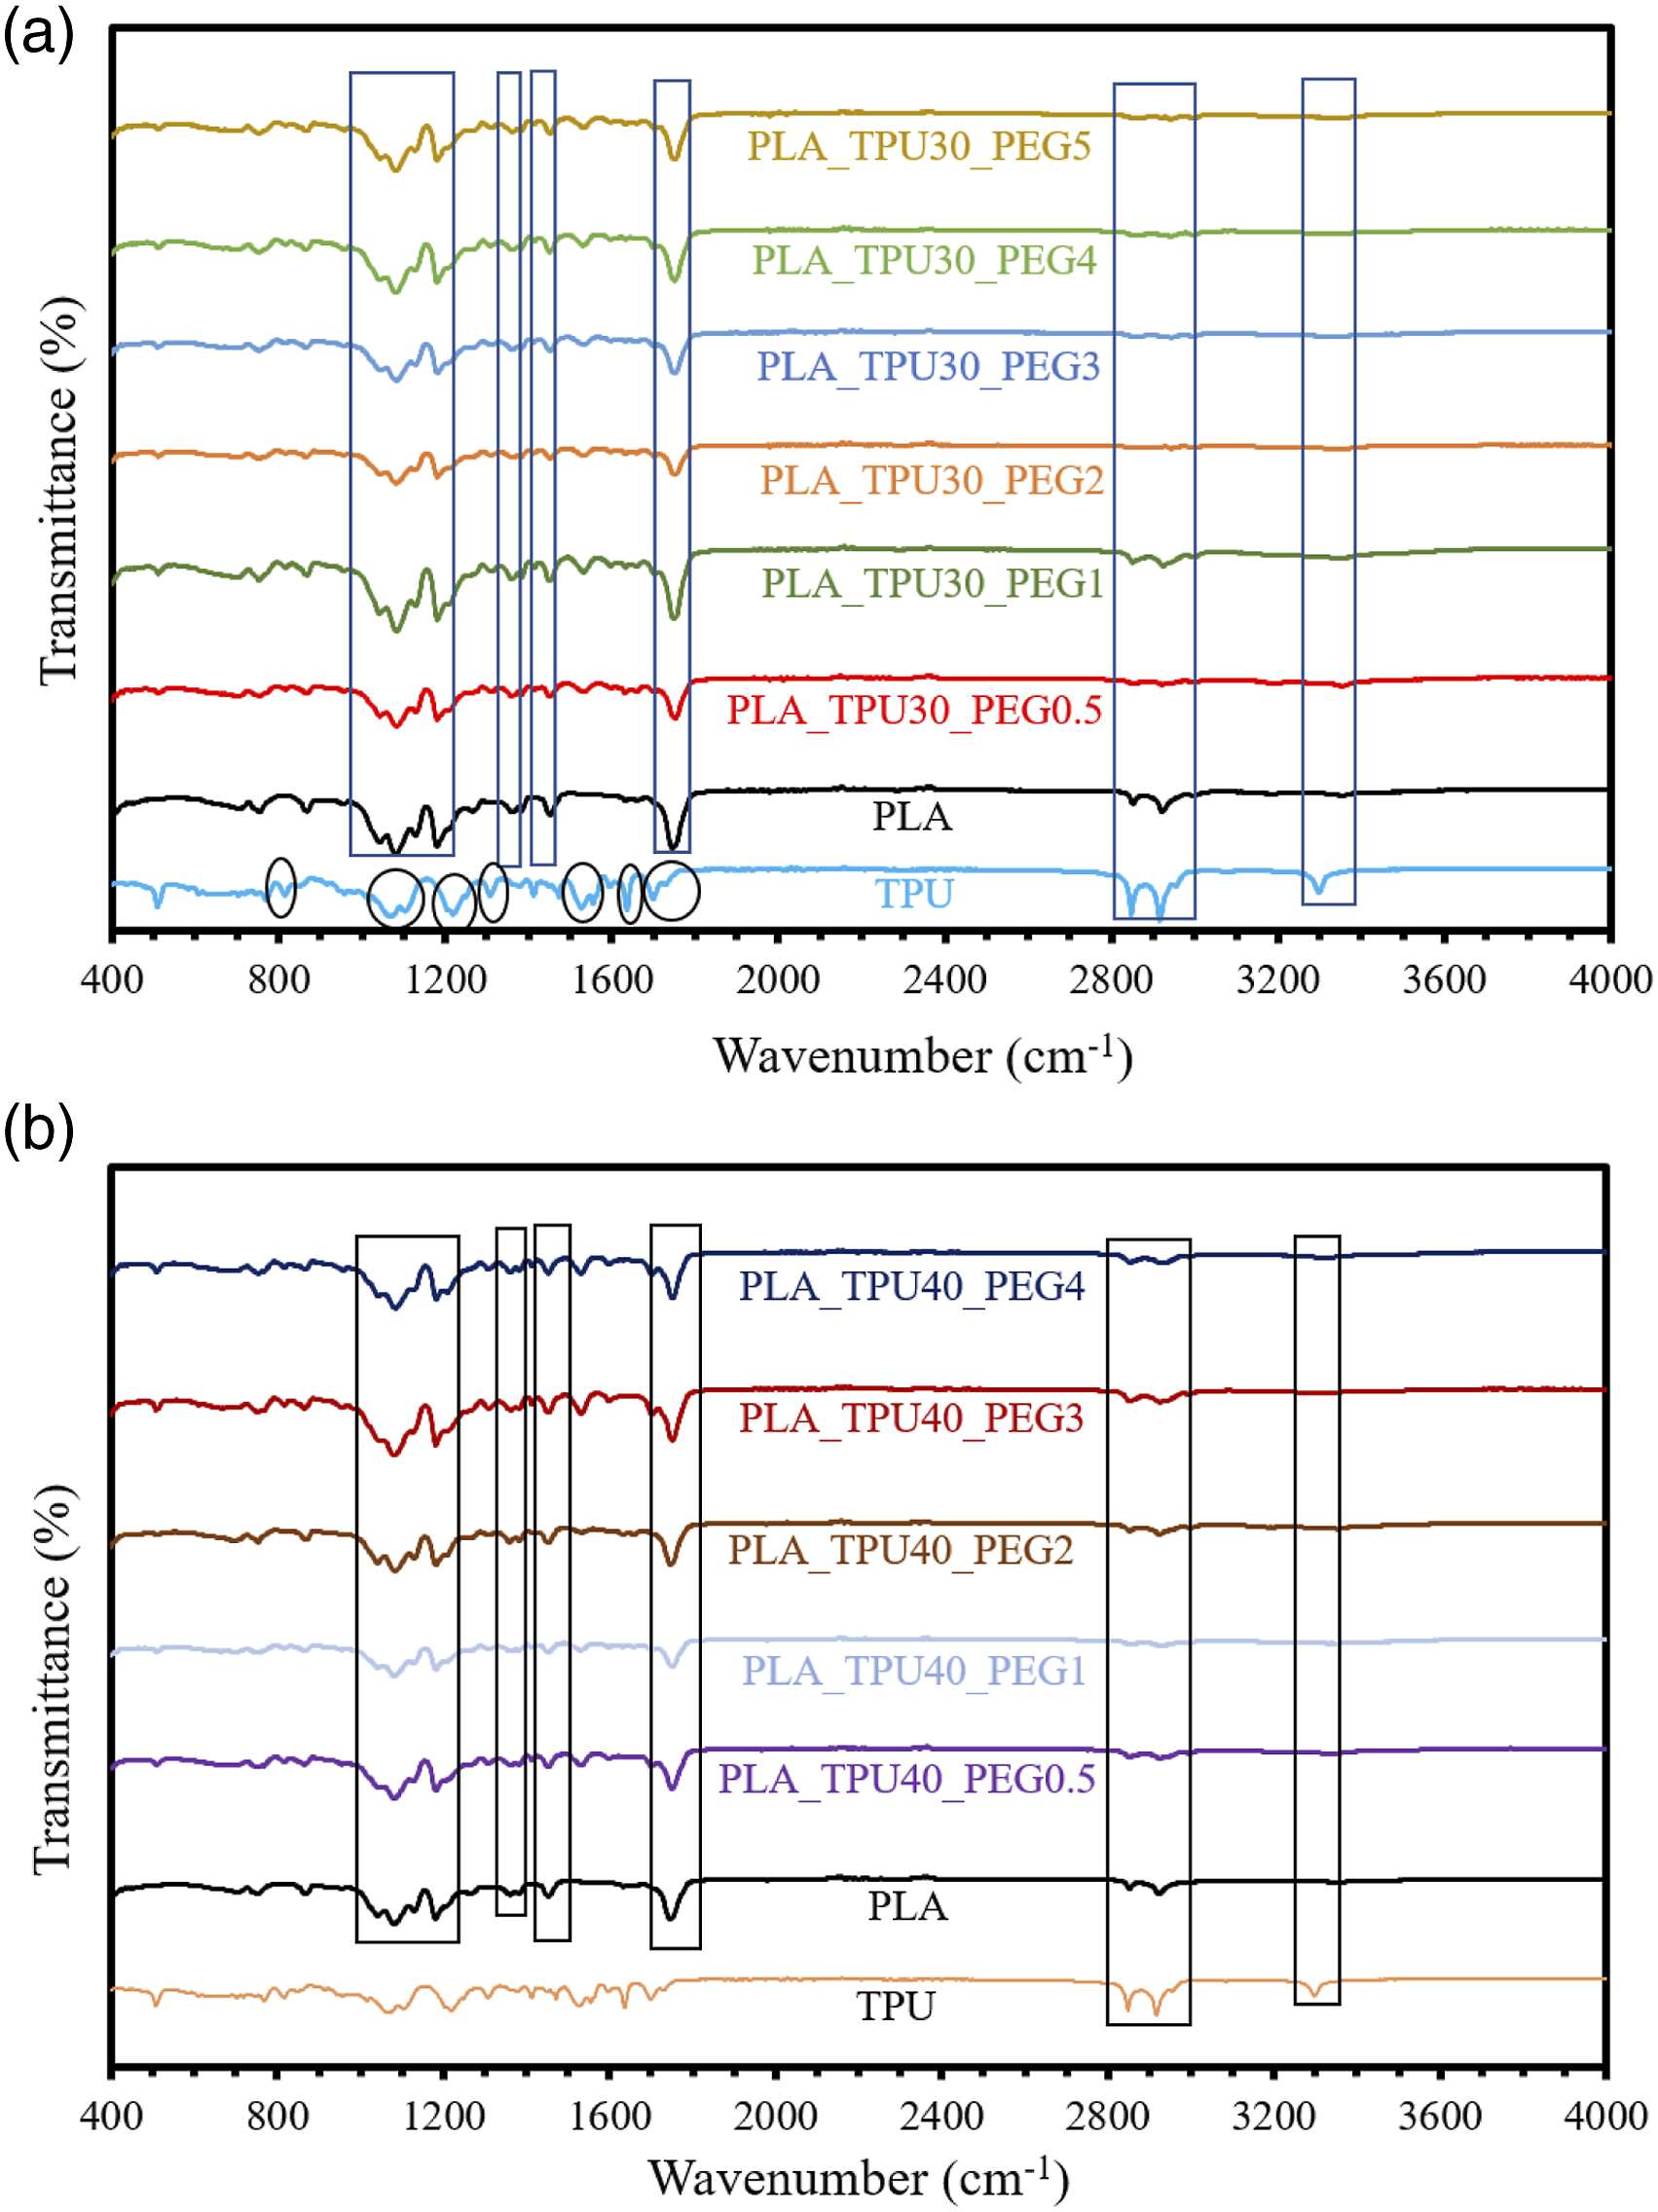
For pure TPU, a medium peak at 3298 cm−1 corresponds to the stretching vibration of NH in urethane group. The spectrum also exhibits characteristic bands at 2848 cm−1 and 2921 cm−1, attributed to the presence of Poly(tetramethylene glycol) (PTMG). 56 PTMG forms the SS of the material. Soft segments provide the flexibility and elastomeric behavior. They may be either polyester or polyether and interconnect two HS of the material. They are bonded together with the presence of hydrogen bonds and form physical crosslinks.34,35,57 The bands at 1700 cm−1 and 1733 cm−1 are due to the stretching vibration (amide I band) of C = O carbonyl compound. The peak at 1637 cm−1 resembles the presence of stretching vibration of C = C bonds in the aromatic ring, whereas the peak at 815 cm−1 shows the presence of C–H out-of-plane bending in aromatic ring. The peaks at 1530 cm−1 and 1560 cm−1 show the N–H bending vibration (amide II band). The presence of peak at 1311 cm−1 was due to C–N (amide III band) stretching vibration. The bands at 1218 cm−1 and 1106 cm−1 were due to C−O−C stretching vibration in esters and ethers, respectively.
For neat PLA, two peaks of medium intensity at 2852 cm−1 and 2925 cm−1 can be seen which is due to the presence of asymmetric and symmetric stretching vibration of
In the composite filaments, the intensity of peaks in the range of 2850–2950 cm−1 has decreased. This might be because of the lower weight percentages of TPU in the composition. This is the range for PTMG which provides the flexibility and elastomeric behavior to the materials. Due to lower weight percentages, the flexibility will be lower than that of pure TPU. There are not any notable changes observed at around 3300 cm−1. Almost similar intensity of peaks is seen at around 1750 cm−1, which might be due to the presence of C = O stretching vibration in both TPU and PLA. Since the amount of PEG added is very low compared to the other two polymers, its effect has not been noted significantly on the spectra. From these spectra, it can be said that the composite samples contain all polymer properties.
Scanning electron microscopy
The SEM images of the cross-section of cryogenically fractured PLA and composite filaments are shown in Figure 9. The cross-section of PLA filaments appears flat with little roughness and showed brittle failure (Figure 9(a)). The addition of 30 wt% TPU and 2 wt% PEG caused an increase in spherical aggregates and voids in the cross-section (Figure 9(b)). Mi et al.,
33
also observed similar surface morphology in the PLA/TPU blend. The aggregates are shown by arrows and voids by dotted circles. The aggregates are uniformly distributed on the cross-section, which have been appeared due to the coalescence of TPU particles. The increase in TPU particles increases the flexibility of the filaments, which is seen in tensile tests. However, the formation of TPU aggregates is the indication of phase separation between PLA matrix and TPU additives, which is also seen in tanδ curves during DMA tests. The voids are present on the fractured surface, which might have occurred due to poor adhesion between the PLA matrix, TPU additive and PEG plasticizer. This further provides evidence of phase separation and immiscibility of these polymers. On further increasing the PEG content to 5 wt%, the TPU aggregates and void formation was reduced (Figure 9(c)). This might have happened due to the bonding between the polymers. As a result, the elongation has increased during tensile tests. With the addition of 40 wt% TPU, the flexibility of the composite filaments increased. This is due to the hydrogen bond formation between PLA and TPU.
43
The uniform dispersion of TPU aggregates and voids are seen in Figure 9(d), which are reduced with the addition of 4 wt % PEG. SEM images showing cross-sections of (a) PLA, (b) PLA_PU30_PEG2, (c) PLA_TPU30_PEG5, (d) PLA_PU40_PEG1, (e) PLA_TPU40_PEG4. The aggregates are shown by arrows and voids by dotted circles.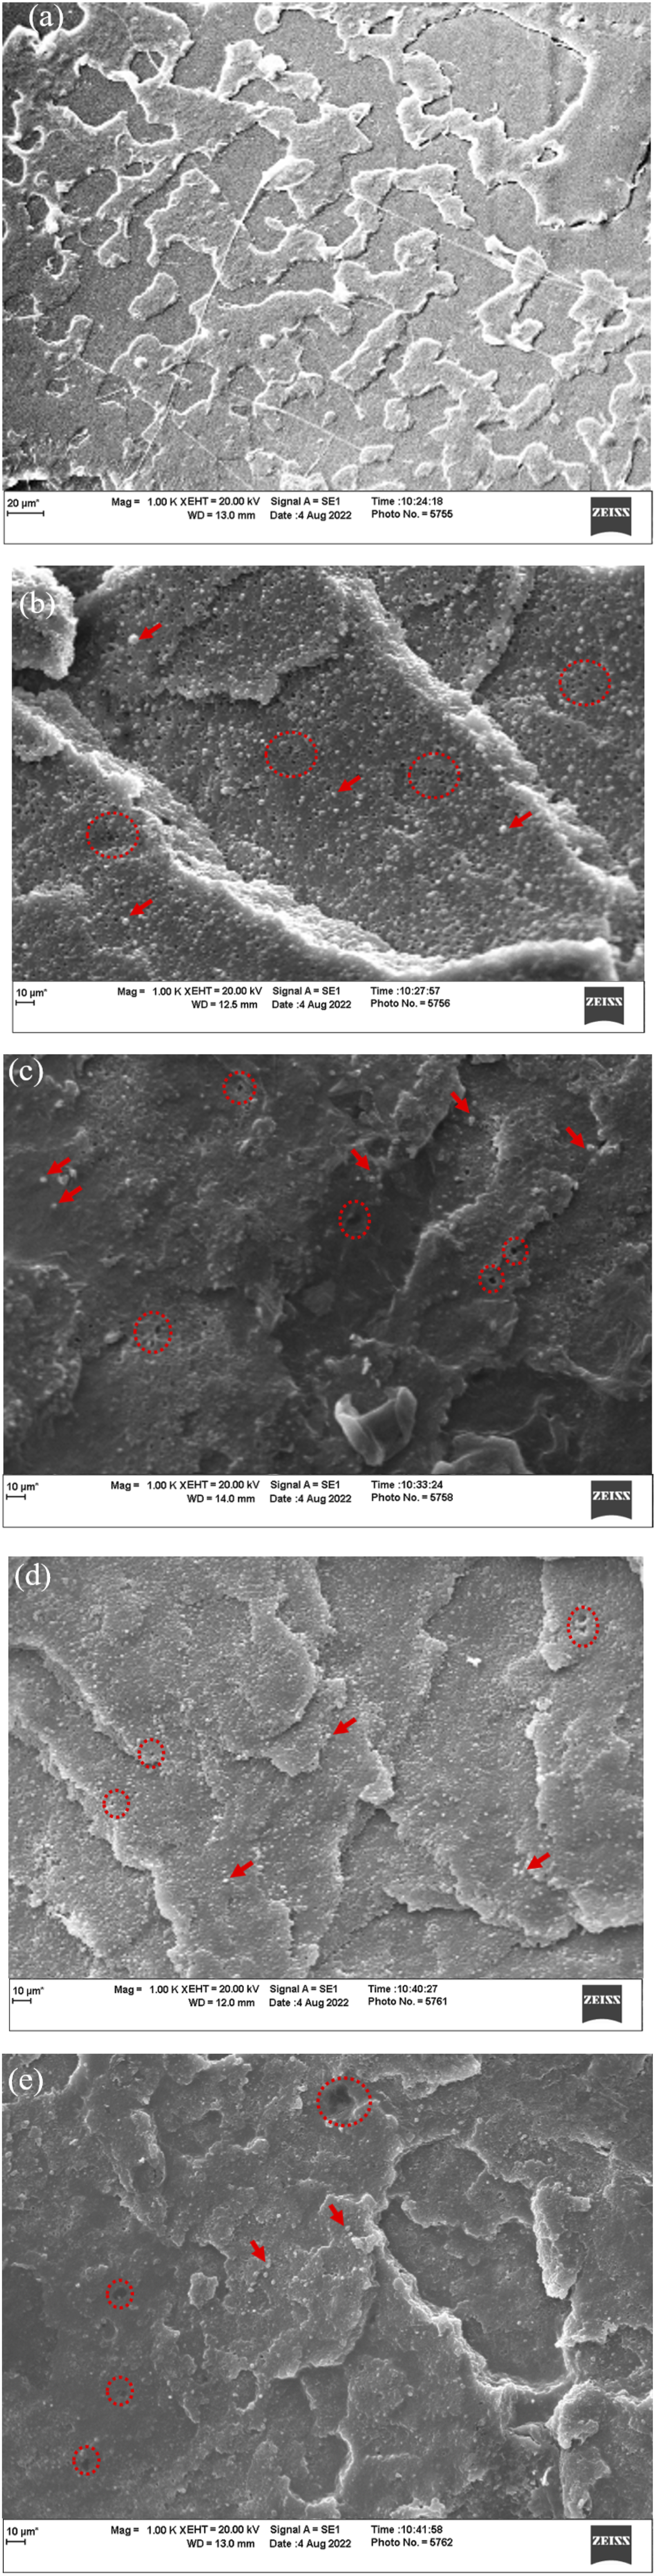
Figure 10 a shows a smooth surface with little roughness of PLA filament. The roughness might have occurred by stretching during the extrusion process. On the other hand, the composite filaments (Figure 10(b)–(e)) exhibit rough surfaces and fine chiplets can be seen clearly. This happened due to the presence of PEG and TPU in the PLA matrix, which are immiscible. This also proves that they have poor compatibility and possess phase separation. SEM images showing the surfaces of (a) PLA, (b) PLA_TPU30_PEG2, (c) PLA_TPU30_PEG5, (d) PLA_TPU40_PEG1, and (e) PLA_TPU40_PEG4.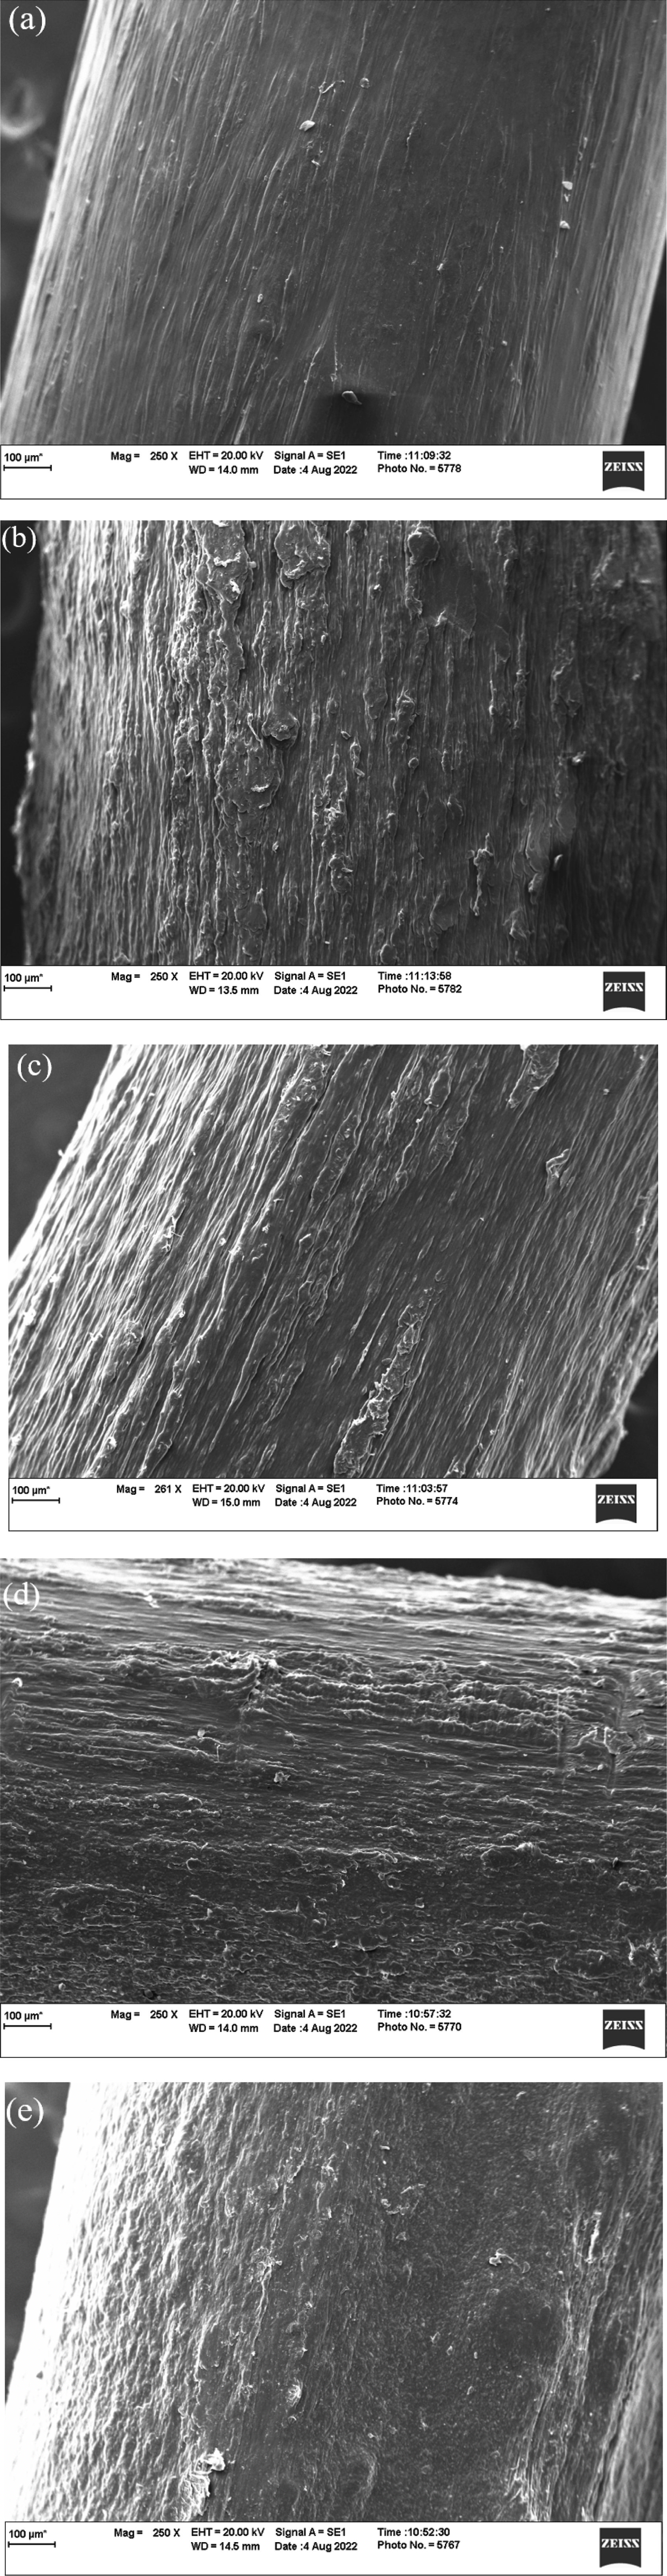
3D printed fabric structure
A plain weave fabric structure (Figure 11) having eight warp yarns and five weft yarns was 3D printed in horizontal orientation using the PLA_TPU_30_PEG5 composite filament. The spacing between the yarns is 10 mm. The width of the 3D printed fabric is 70 mm along weft direction whereas the length is 40 mm along the warp direction. Several fibrils can be seen in the printed part. A weft yarn as indicated by an ellipse is broken while 3D printing. The inconsistency in warp yarns is clearly visible indicated by the arrows. The reason for this is the non-uniform extrusion of filament during the printing process, which happened due to the inconsistent diameter of filament that was produced using the extruder. This defect in the filament affected the print quality, dimensional accuracy, and the overall properties of the printed parts. The work related to improving the print quality and fabric properties will be considered in our future research. 3D printed plain weave fabric structure using PLA_TPU30_PEG5 composite filament.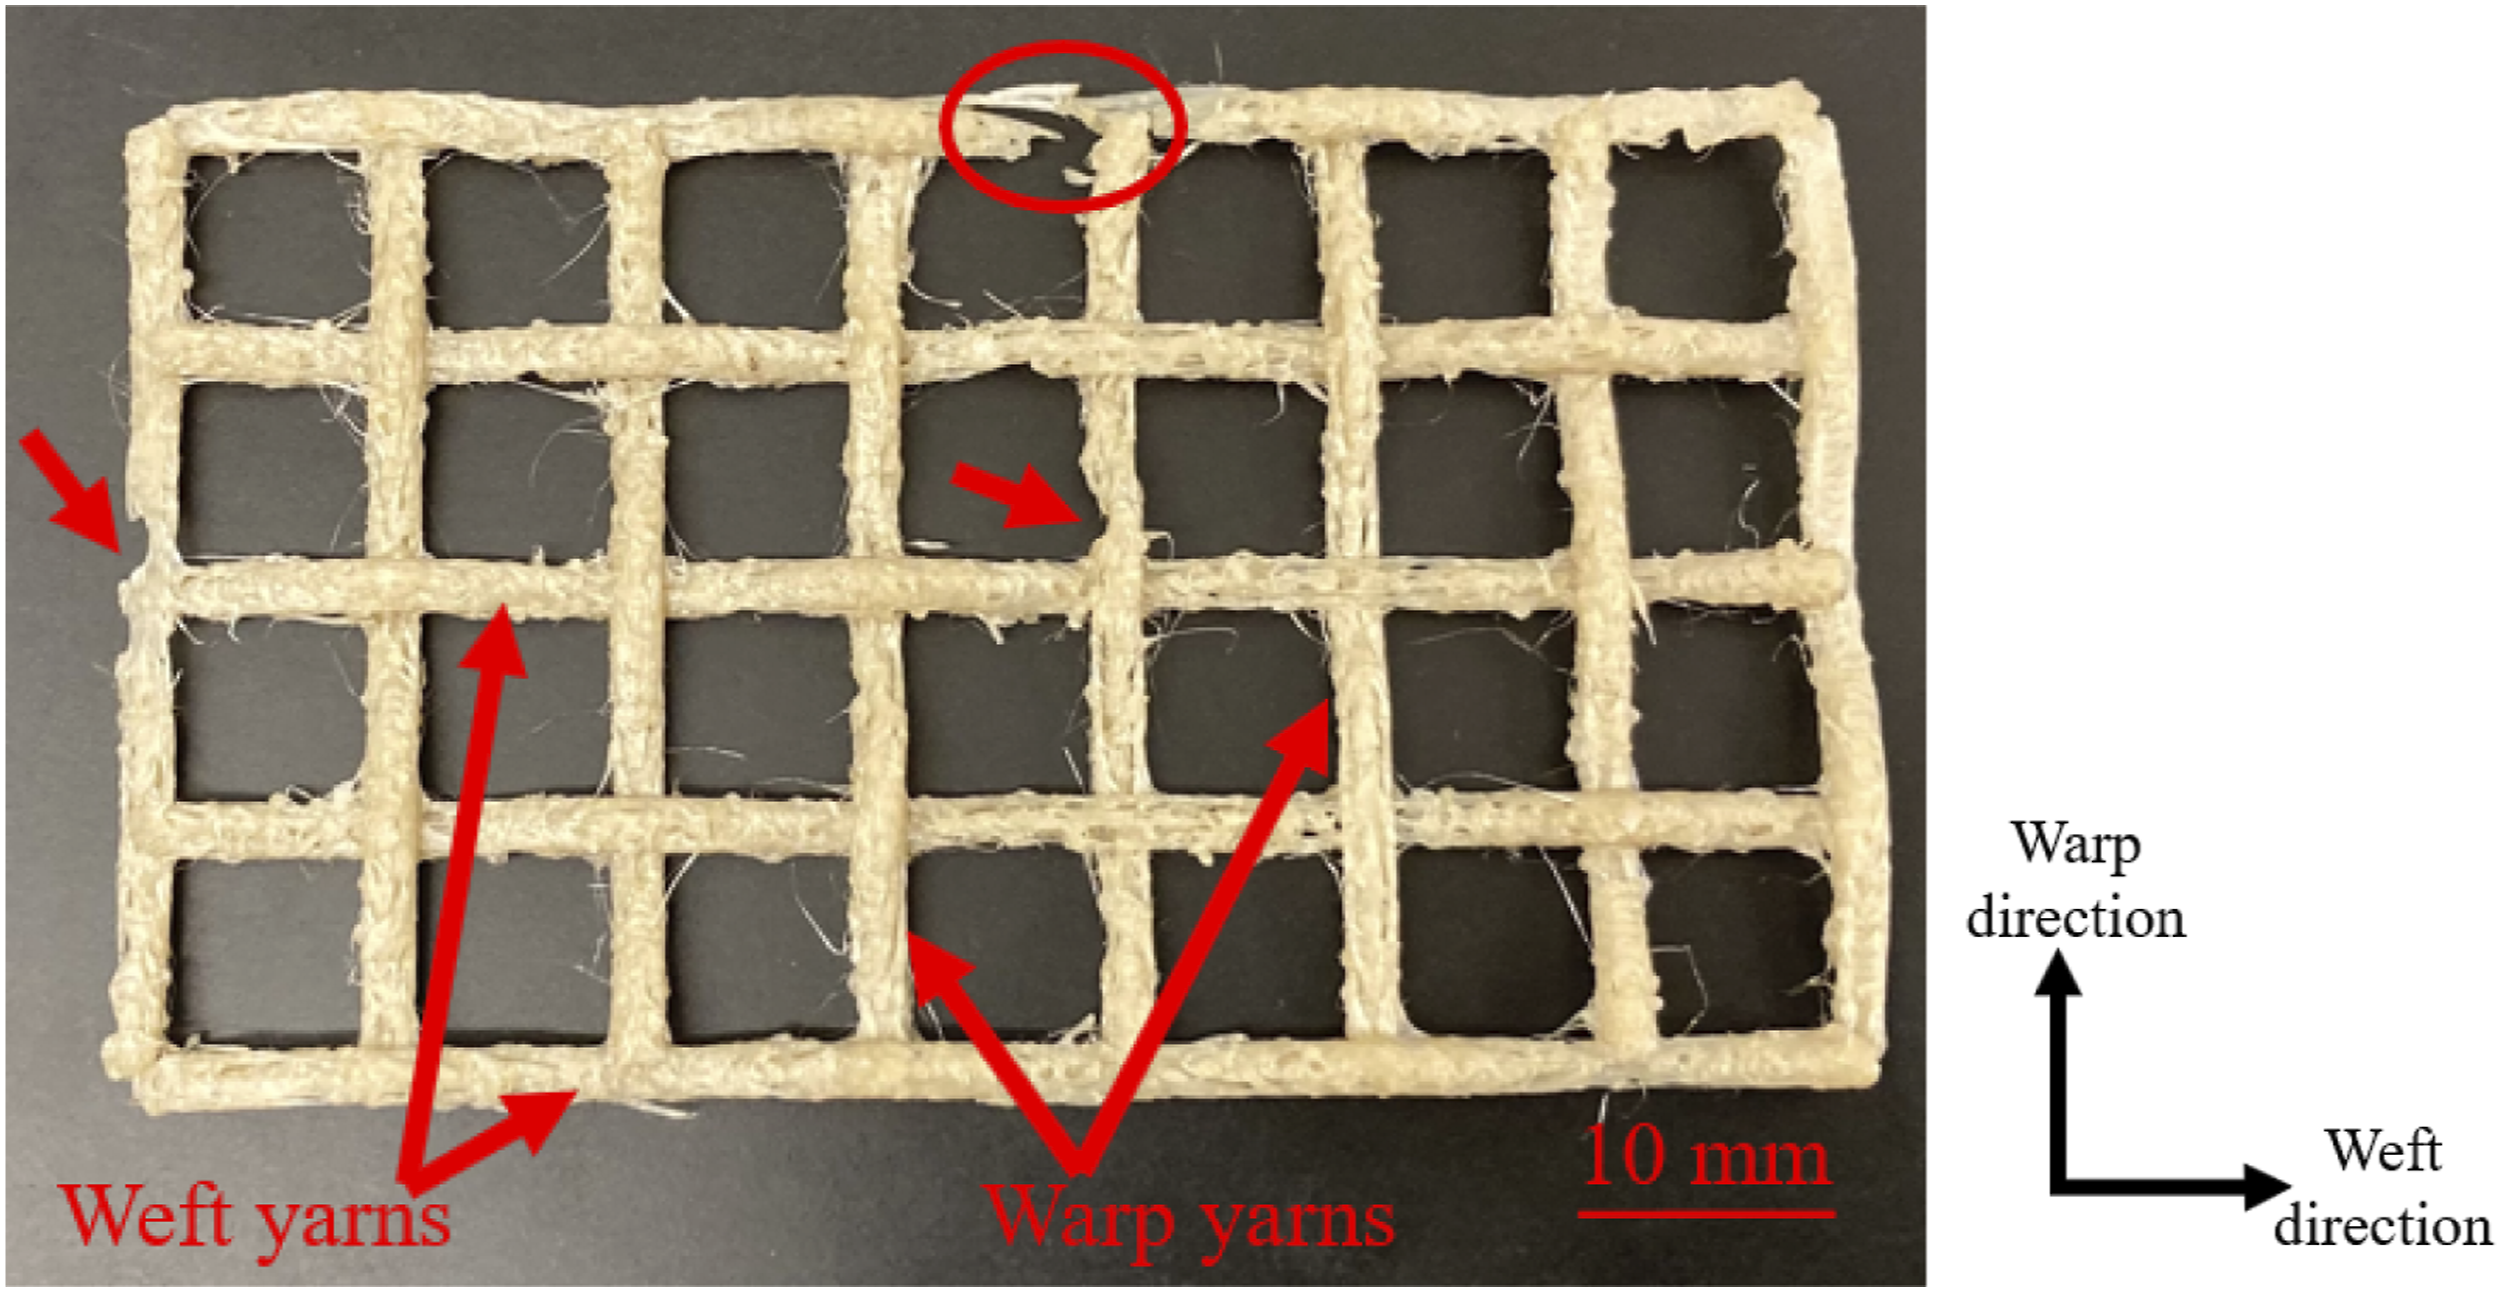
Conclusions
Different polymers such as PLA, TPU and PEG are blended in different proportions and extruded to obtain composite filaments. The amount of TPU content in the composition is kept constant either being 30% or 40%. PLA and PEG are added in varying weight percentages. The filaments produced had varying diameters, but the optimal range was considered for this study. The following conclusions can be drawn from this work: 1. The tensile test results showed that the yield stress of the composite filaments decreased significantly but the ultimate tensile stress was in the same range compared to pure PLA filament. Moreover, the Young’s modulus of composite filaments also decreased compared to pure PLA filament whereas the elongation at break increased by more than 550%. This reveals the fact that the flexibility and ductility of composites increased which might be due to the presence of soft segments in TPU. 2. The thermal analysis showed that the glass transition temperature of PLA filament is almost the same in all the composites, which was observed using DSC. TGA results revealed that the onset thermal degradation temperature of composite filaments was around 285°C which is slightly lower than that of pure PLA filament. It can be said that these composites can be used in applications where the temperature does not rise over 285°C. 3. The thermo-mechanical tests demonstrated that pure PLA filaments hold higher storage modulus than the composite filaments. This implies that pure PLA filament is stiffer than the composite filaments. The increase in TPU and PEG content make the filaments flexible and results in lower storage modulus. On the other hand, the initial loss modulus of the pure PLA filament is the lowest. The increase in TPU and PEG content enhanced the molecular friction which might have caused higher loss modulus of the composite filaments. 4. The FTIR spectroscopy revealed that there is not any additional chemical bonding between the polymers which can affect their properties. 5. The 3D printed plain weave fabric structure using the FDM method with PLA_TPU30_PEG5 composite filament demonstrated the feasibility of these filaments in the 3D printing of complex structures.
Footnotes
Acknowledgements
The authors would like to thank Dr Ramsis Farag and John Osho for their help during this project. SEM imaging were done at the AU Research Instrumentation Facility in Biological Sciences Department at Auburn University.
Declaration of conflicting interests
The authors declare no potential conflict of interest with respect to the research, authorship and/or publication of this article.
Funding
The author(s) disclosed receipt of the following financial support for the research, authorship, and/or publication of this article: This work was partially supported by the Department of Mechanical Engineering, Auburn University and partially by the Interdisciplinary Center for Advanced Manufacturing Systems (ICAMS) with funding from the Industrial Base Analysis & Sustainment Program of the Industrial Base Policy Office of the Office of the Secretary of Defense, awarded by US Army Contract W52PLJ-20–9-3045.