
Abstract
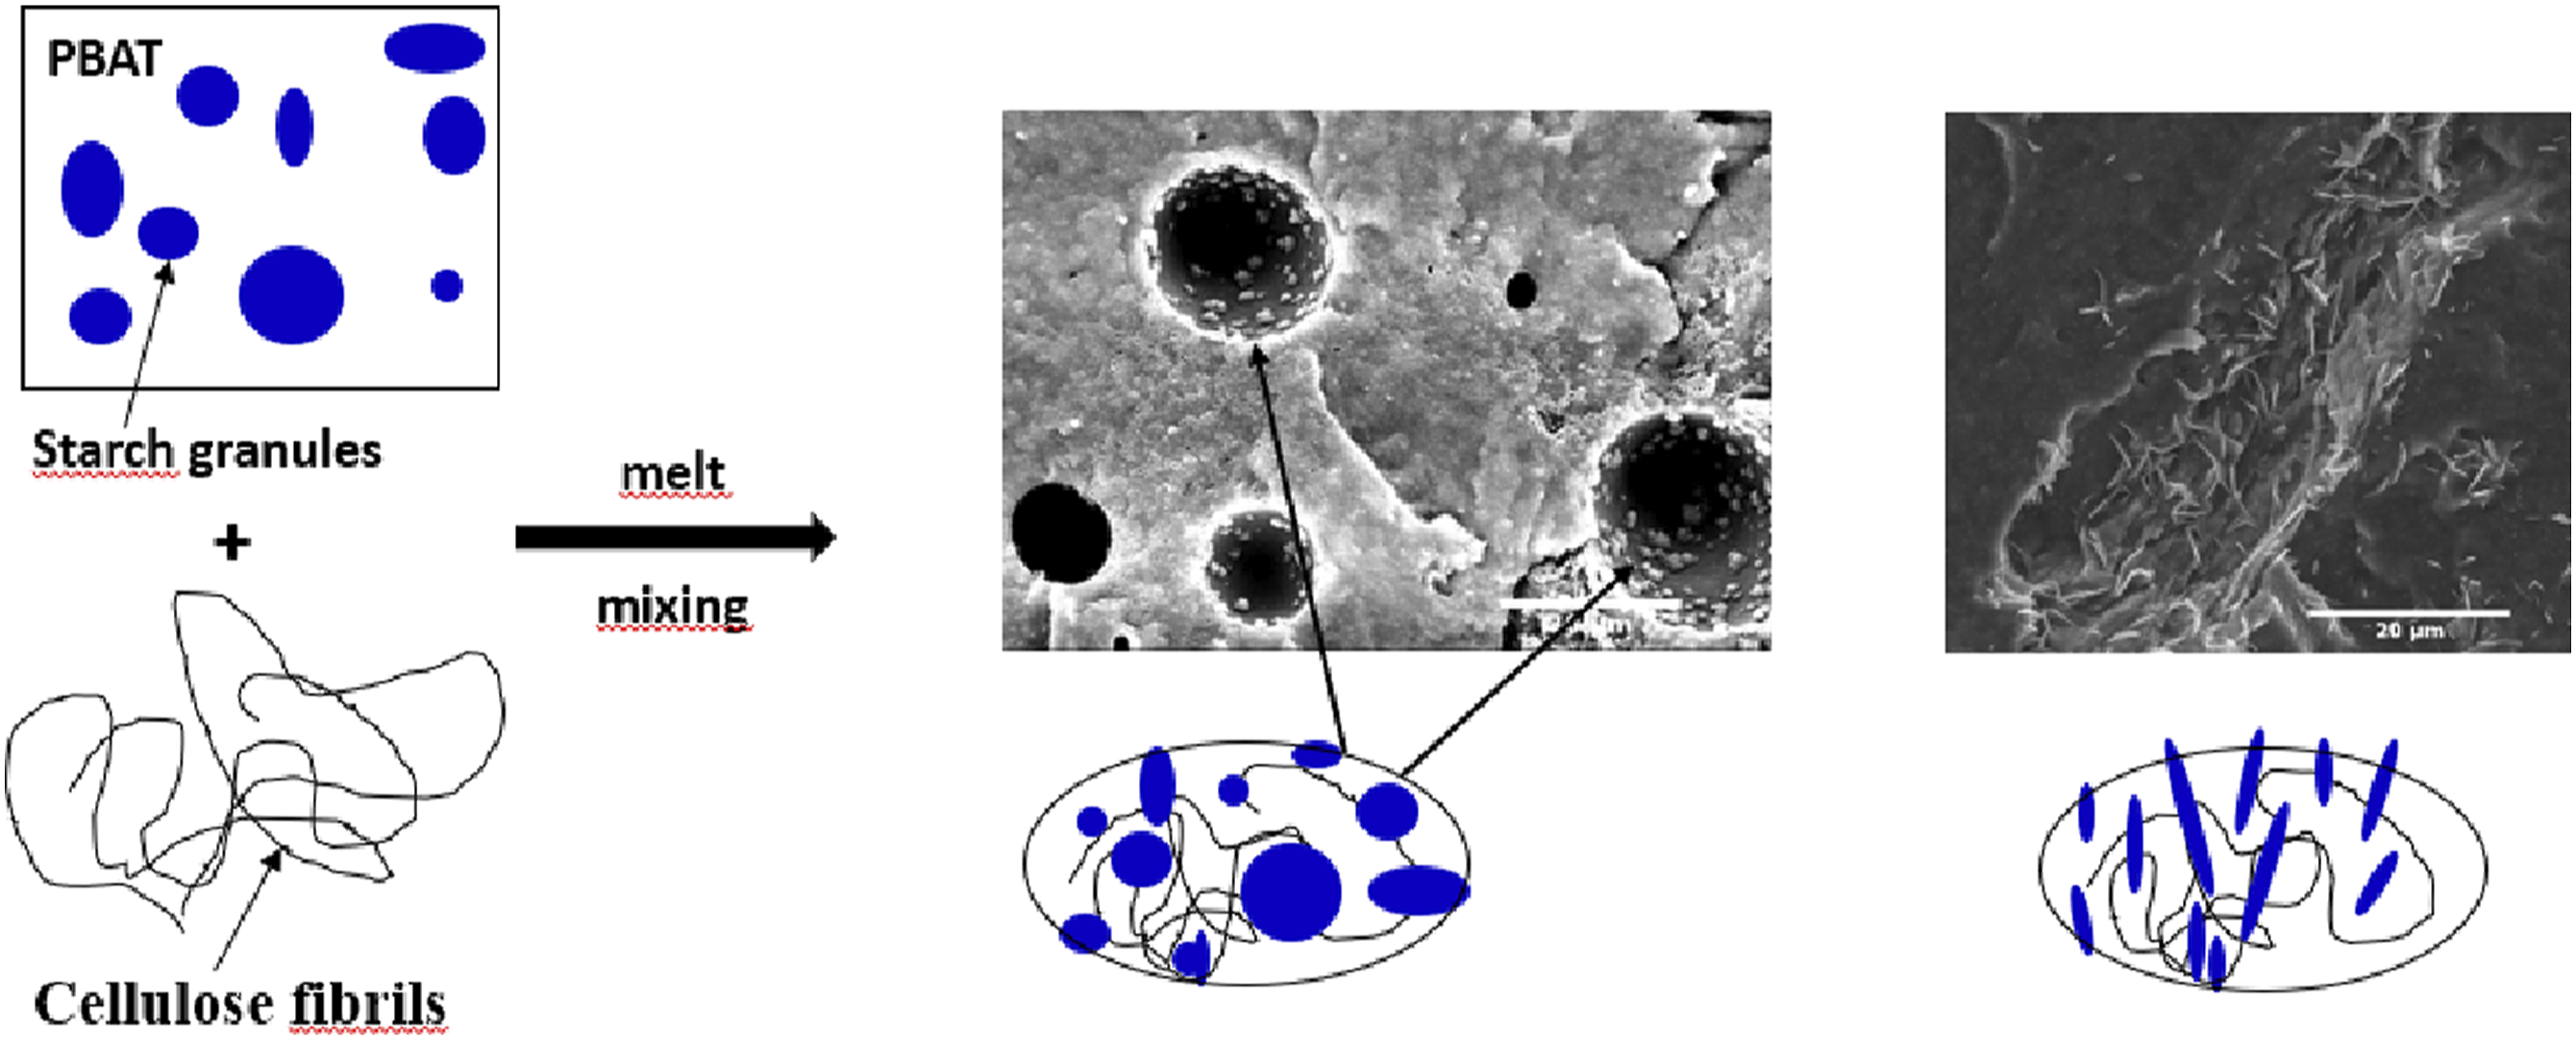
Starch and cellulose being both carbohydrate polymers, thermoplastic starch (TPS) is expected to be a suitable compatibilizer for materials made of cellulosic fillers and polyesters. This paper investigates the interactions between TPS and cellulose in Poly(butylene adipate-co-terephthalate) (PBAT), melt-blended composites. For this, microfibrillated cellulose (MFC) were dispersed in a commercially available polymer (Mater-Bi, MB), containing TPS already dispersed in PBAT. Microscopic observations were performed on composites based on either MB or neat PBAT reinforced with microfibrillated cellulose (MFC). Tensile tests and dynamic mechanical analysis in solid and in the molten state revealed a percolating network of fillers. Results indicated interaction between TPS and cellulose as the origin of the adhesion of the components but also of biphasic agglomerates.
Introduction
Recently, there has been a soaring interest in using renewable resources for the preparation of different kinds of materials in order to reduce the amount of petroleum-based plastics and resolve an environmental issue. Starch and cellulose are two polymers belonging to the polysaccharide family and among the most promising biomaterials due to attractive properties such as low cost, biodegradability, renewability and abundancy 1–8 which make these materials the subject of many research studies especially with the growing environmental issues.
Cellulose is a linear homopolymer composed of successive units of β-D-anhydroglucopyranose linked by β-1,4 ether bonds called glycosidic links, and containing three hydroxyl groups. 9 Among investigations in the development of cellulose as an important resource, its use in either its native form as cellulose microfibrils (MFC) or after an acid hydrolysis treatment as cellulose nanocrystals (CNC) has been of growing interest. Their appealing mechanical properties make them a perfect choice in the reinforcement of thermoplastic polymers for many applications such as packaging.10–13
Starch is produced by agricultural plants in the form of hydrophilic grains. It is mainly extracted from many botanical varieties like potato, corn, rice…etc. Chemically, it is mainly composed of two different macromolecules presenting different chemical structures, amylose and amylopectin. Their content is different depending on the botanical source; for example, corn starch contains between 21 and 27% of amylose 14–17 whereas rice starch contains 15 to 35%. 18 Amylose is a linear homopolymer composed of linear long chains of α-1, 4 linked D-glucose units with few branches and localized mainly in the amorphous parts of the starch grains. Amylopectin is a highly branched and semi-crystalline homopolymer composed of much shorter chains of α-1, 4 -linked D-glucan, highly branched through additional α-1, 6 - D-glucose linkages.15, 19 Starch granules can undergo a specific thermomechanical process (for example extrusion) in an excess of water with the aid of plasticizers to obtain thermoplastic starch (TPS) 20 which can replace polymers or can be used as loose fillers in many applications such as food packaging, 21 compostable foams, 22 disposable diapers 23 or even coatings. 24
In this context, addition of cellulose to polyester matrices is a subject of importance, 46 but the production of a composite material with good mechanical and physico-chemical properties strongly depends on the interphase. 47 In fact, the interaction between the matrix and the filler creates an interphase with chemical and mechanical characteristics different from those of the composite components. The chemical nature of hydrophobic polymers, such as PBAT (poly (butylene adipate-co-terephthalate)), and hydrophilic fillers, such as cellulose, makes it problematic to obtain an interphase with good properties, which can significantly reduce the properties of the resulting composite material. Many studies have investigated the effect of the addition of a compatibilizer which can interact with both the polymer and the filler as a way to improve the lack of interaction between the two components. In this context, polyethylene glycol (PEG) has been widely investigated as a compatibilizer in PBAT/cellulose based composites. Souza et al. 25 reinforced PBAT with pegylated nanocellulose (pegylated-NC) by melt-mixing process. The nanocomposites presented improved mechanical properties attributed to good interaction and improved adhesion between pegylated-NC and the polymer matrix. This resulted in a higher thermal stability and a lower tendency to absorb water. Moustafa et al. 26 also used PEG as compatibilizer for coffee grounds (cellulose)/PBAT composites prepared by extrusion. Coffee ground fillers showed good interaction with the PEG due to chemical interaction between hydroxyl groups of the fillers and PEG which acted as a plasticizer phase. Better dispersion, tensile properties, and thermal stability were obtained.
In previous work, 45 the compatibilizing effect of corn starch in PBAT/cellulose based composites has been demonstrated. In the current study, the effect of the addition of TPS as a compatibilizer on composite properties is investigated. As opposed to our former study, we used a PBAT compound in which plasticized starch is previously dispersed and where the granules have lost their integrity. It also aims at completing existing research that has studied cellulose/PBAT/TPS composites.27–29 Indeed most of the previous papers did not focus on the potential compatibilizing effect of starch considering the chemical similarity and compatibility with cellulose. Therefore, the effect of the presence of dispersed TPS in PBAT, whether or not it can improve compatibility with the polymer, is studied. For this, a commercial polymer, based on PBAT containing TPS30–32 is used as polymer matrix and microfibrillated cellulose MFC as cellulosic fillers. Comparison with neat PBAT/cellulose composites was performed.
Materials and methods
Materials
The PBAT polymer matrix used in this study contains 44 mol-% of butylene terephthalate, 56 mol-% butylene adipate (Ecoflex® BASF, Germany). Its density at room temperature is 1.25–1.27 g/cm3 and the melting temperature is 119°C. A commercial blend of biodegradable polyesters with corn starch and biodegradable polyol as starch plasticizer 33 (Mater-Bi® EF04P, Novamont, Italy), was also used. The melting point is 119°C and the density is 1.27 g/cm3. These properties confirm that the biodegradable polymer is also PBAT. According to the producer, the plasticizer used in Mater-Bi is glycerol. In this work, we will refer to this blend as MB for simplification purposes.
Microfibrillated cellulose (MFC) was purchased from INOFIB, France. They are referred to as enzymatic freeze-dried CNF by the producer and used as the cellulosic reinforcement in PBAT composites. Average length of MFC fibrils is from 5 to 15 μm and average diameter ranges from 50 to 400 nm. This filler presents a density of about 1.3 g/cm3 and an aspect ratio between 30 and 100.
Composite preparation
All composites were prepared in the melt using a PolyLab HaakeTM OS Rheomix above the melting temperature of both polymers (120°C) and under the degradation temperature of cellulosic filler (beyond 330°C for cellulose nanofibers, 34 ). The processing temperature was fixed at 150°C. Preliminary tests were done to determine the best processing conditions leading to the best mechanical properties of the composite materials. Rotation speed of 120 rpm, equivalent to a shear rate of 60 s−1, and mixing time of 600 s were chosen for most of the produced composite materials. To further understand what happens during the processing, the mixing time was extended to 1200 s or reduced to 400 s for two blends.
The mix was then compression molded at 150°C and 100 bars during 3 to 5 minutes to obtain plates or films with various thicknesses depending on the intended characterization: 2 mm for mechanical and morphology analysis or 0.5 mm–1 mm for rheological characterization.
Thermogravimetic analysis – TGA
The neat polymers (PBAT or MB) were characterized by thermogravimetric analysis (TGA). TGA was conducted in a Mettler Toledo analyzer. A heating rate of 10°C/min and a sample weight of 20 mg in an alumina crucible were used. Thermograms were recorded over a temperature range of 30–700°C in the presence of nitrogen atmosphere with a flow rate of 80 ml/min.
FT-IR spectroscopy
Infrared spectra of the neat polymers (PBAT or MB) were obtained in a Nicolet Nexux FT-IR in ATR mode (attenuated total reflectance) within the range of 4000-700 cm−1, with a resolution of 4 cm−1 and 32 scans. The tested samples were films with a thickness of about 150 μm. They were obtained by compression under a pressure of 150 bars and at a temperature of 150°C.
Scanning electron microscopy – SEM
The morphology of the composite samples was observed using either a mini scanning electron microscope HIROX SH-4000 M in high vacuum operated at 15–20 kV or an environmental scanning electron microscope ESEM-FEG XL30 in a pressure of 0.1–1 m.Pa operated at 10 kV and a working distance between 10 and 12 mm. The specimens obtained before and after compression molding were frozen in liquid nitrogen, fractured and gold-coated by sputtering during 60–70 s.
Transmission electron microscopy – TEM
The cellulosic filler was dispersed in water (1%-wt diluted three times). An ultrasound treatment was applied to separate the fibrils as much as possible. This was carried at 60°C with ultrasound energy input of about 160 kJ/kg of liquid during 10 minutes by intervals of 30 s followed by 10 s of cooling in an ice bath to avoid overheating.
For TEM observation, a drop (10 μL) of the treated cellulose suspension was deposited onto a 200 mesh copper grid with a waiting time of 20 minutes to sediment the filler particles and then stained with a Uranyless (ready-to-use mix of lanthanides aqueous solution) for one minute to create a better contrast.
Hitachi H800 TEM was used at an accelerated voltage of 100 kV. The obtained micrographs were processed using Image J software. A minimum of 5 images were observed, binarized and the aspect ratio of the filler (f = L/D) was calculated by taking an average value of at least 20 values of lengths and diameters of the fibrils.
Tensile tests
Tensile tests were performed using a Shimadzu tensile device with specimens obtained by compression molding and cut to dumbbell shape according to ISO 527-2 standards (58 × 5 × 2 mm3). Specimens were dried under vacuum for 10 hours at 80°C to homogenize the crystallization history and to evacuate humidity. For each composition, at least 5 specimens were tested with 10 mm/min crosshead speed at 23°C.
Dynamical mechanical analysis
The measurement of the variation of the dynamic modulus with temperature at constant frequency was performed using a dynamical mechanical thermal analyser Q800 (TA instruments) on films (0.1 to 0.3 mm thickness). Experiments were performed with the film under tension. A static pre-load force (0.1 N) was applied to the sample prior to the dynamic oscillation to prevent film buckling. During the measurement, the instrument was programmed to maintain the static load at 140% of the force required to oscillate the sample. First, strain sweeps were made on each sample composition to determine the linear viscoelastic domain, and to define the composition dependent constant strain to be applied for further experiments. A wide range of temperatures (−50°C to +150°C) was investigated during temperature sweeps at a constant heating rate of 3°C/min and an oscillating frequency of 1 Hz.
Shear rheology
Dynamic frequency sweep tests in the melt were conducted using ARES G2 Rheometer (TA instrument). The shear storage modulus G′ and the shear loss modulus G″ were measured as a function of angular frequency (between 0.01 and 100 rad/s) at 150°C, using parallel plates of 25 mm of diameter and a gap between 0.5–1 mm. Dynamic strain sweep tests were conducted between 0.01% and 100% at two different angular frequency (1 and 100 rad/s) in all samples to select the strain amplitude within the linear viscoelastic region of the material.
Results and discussion
Evidence of the presence of starch in MB matrix
Thermogravimetric analysis and FT-IR spectroscopy were performed to confirm the main components of MB which were also confirmed by other studies.30–32 The TGA curve and the derivative (TGD) of PBAT and MB are presented in Figure 1. The thermal degradation of the MB matrix is a cumulative phenomenon of the degradation of its components (PBAT, starch and additives). Actually, the derivative curve (Figure 1(b)) shows three peaks corresponding to three stages of degradation. The first peak (1) is attributed to the degradation of starch (Tmax = 310°C).35–36 The second peak (2) at Tmax = 356°C corresponds to the degradation of additives. The third peak (3) is associated with the degradation of PBAT (Tmax = 408°C) according to the values reported in the literature and determined under the same conditions for neat PBAT.
37
By comparison, the derivative curve of PBAT (Figure 1(a)) shows only the third peak at 408°C corresponding to the degradation of PBAT and a small shoulder associated to the degradation of additives at the same temperature of degradation than that of the additives (around 350°C). The analysis of the TGD curve gives the approximative weight contents for each component in MB; 20%-wt starch, 10%-wt additives and 70%-wt PBAT. Under nitrogen atmosphere, the TGA curve of MB shows a larger amount of residue at 700°C (about 20%) than for PBAT. This is due to the effect of the char formed by degraded starch. TGA and TGD Curves of (a) neat PBAT and (b) Mater-Bi ® (EF04P) under nitrogen flow.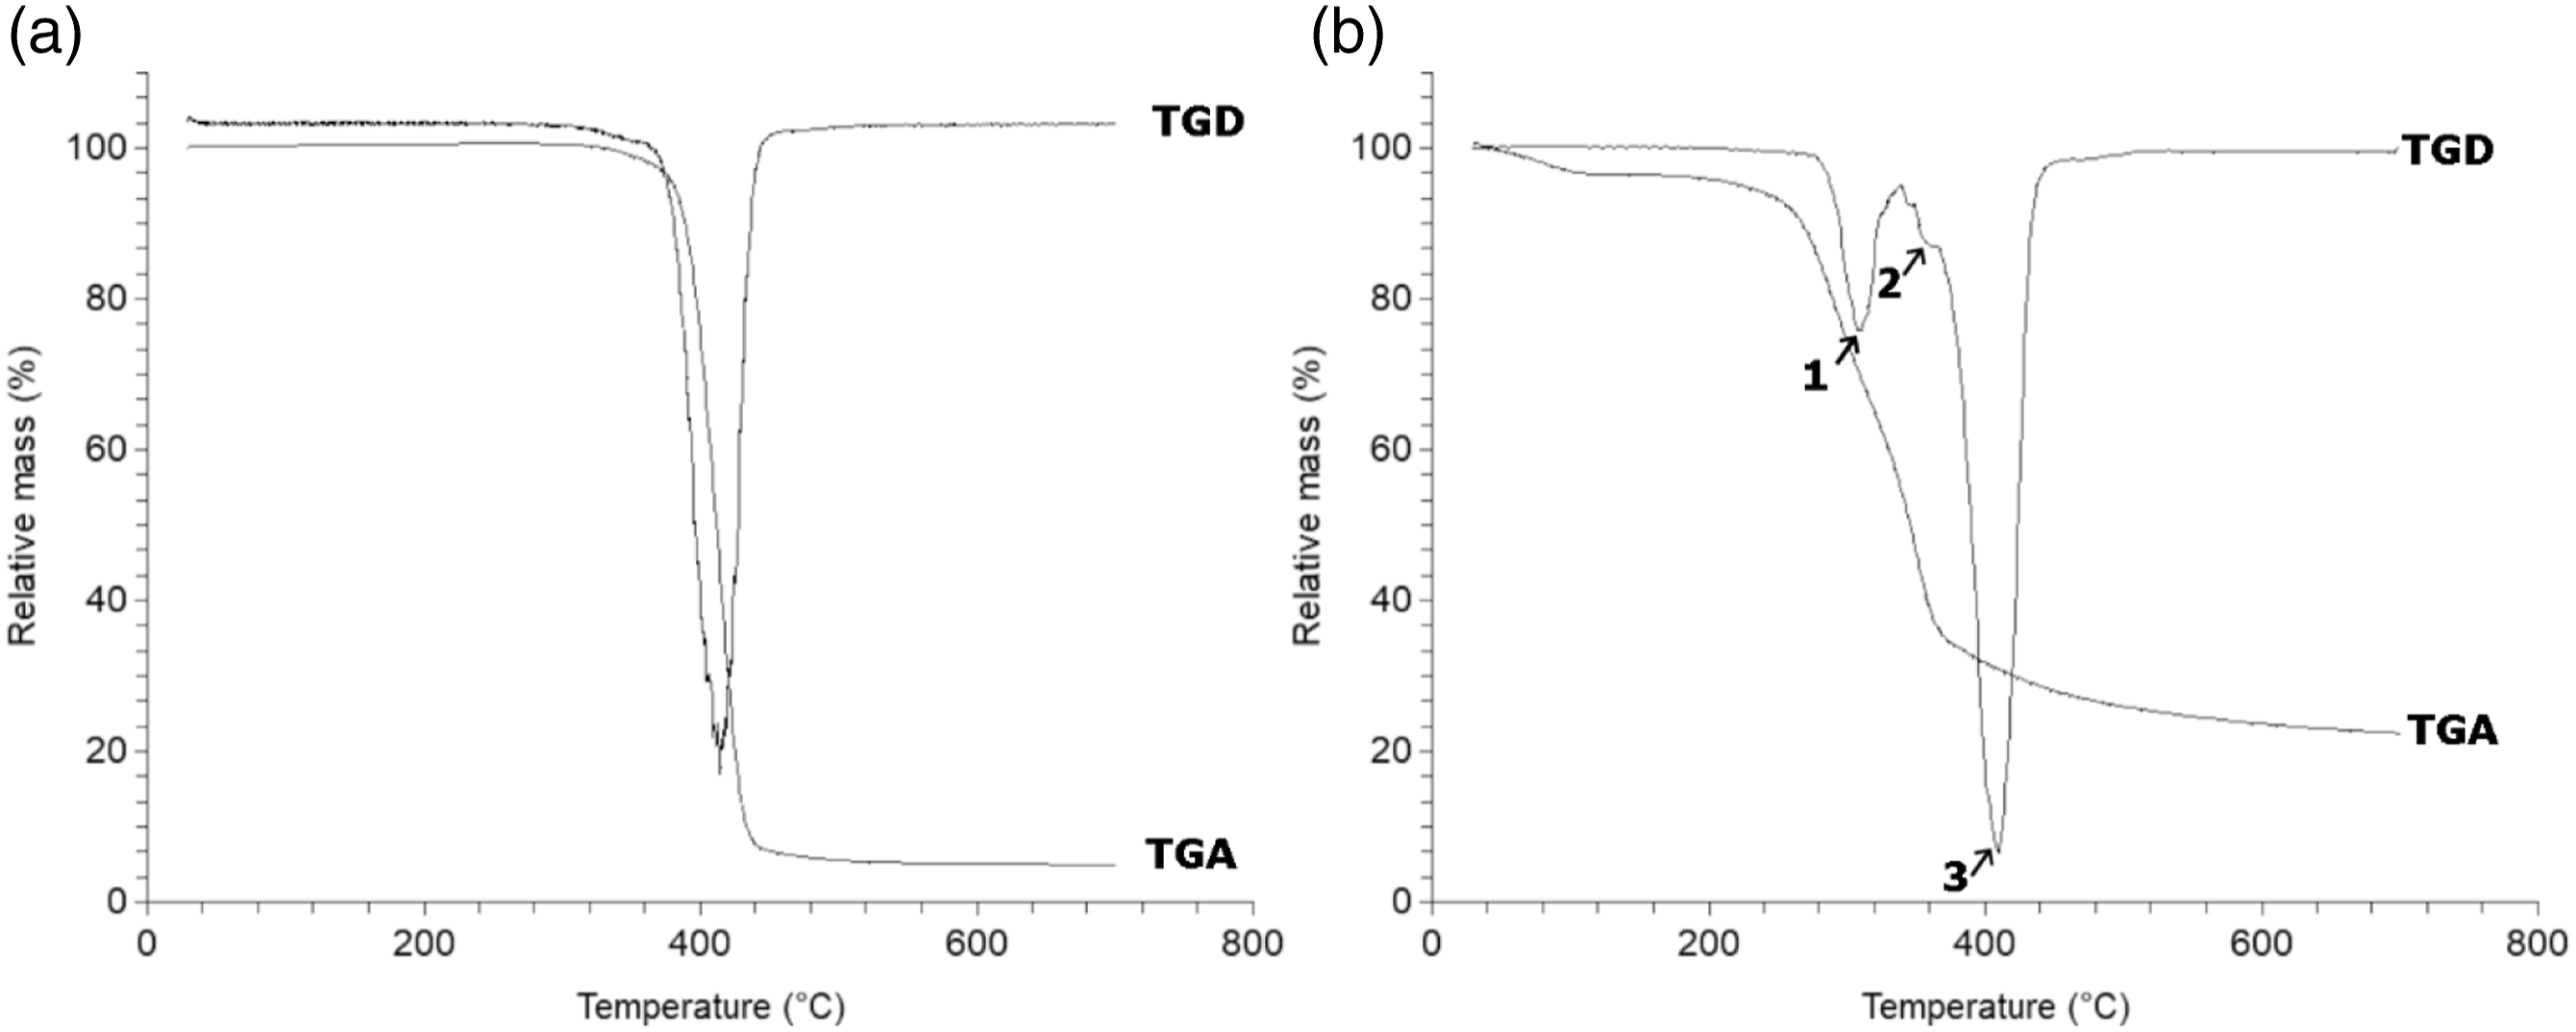
Figure 2 presents the FTIR spectrum of MB. In comparison with previous work,38–40 the absorption bands that characterize different groups of PBAT are observed on the spectrum. Peaks around 3000 cm−1 are associated with the (C-H) stretching in the aliphatic and aromatic parts. The band at 1720 cm−1 is associated with the vibration of the double-bonded carbonyl (C = O) in the ester functions. The band at 1274 cm−1 is associated with the vibration of the single bonds (C-O) of the same ester functions. The absorption bands at 1019, 1456, 1495 and 1577 cm−1 are characteristic of the vibrations of the phenylene groups. The thin band at 725 cm−1 is associated with the C-C covalent bonds of the four adjacent methylenes (-CH2-). The absorption bands corresponding to the aromatic rings are located at wave numbers between 700 and 900 cm−1. All the other bands (between 3900–3300, 1445–1325, 1250 and 900 cm−1) are mainly associated with the starch present in the polymer. These results along with thermogravimetric analysis results confirm that the MB polymer used is based on polybutylene adipate-co-terephthalate (PBAT), starch and additives. FT-IR spectrum of MB (a), and neat PBAT (b).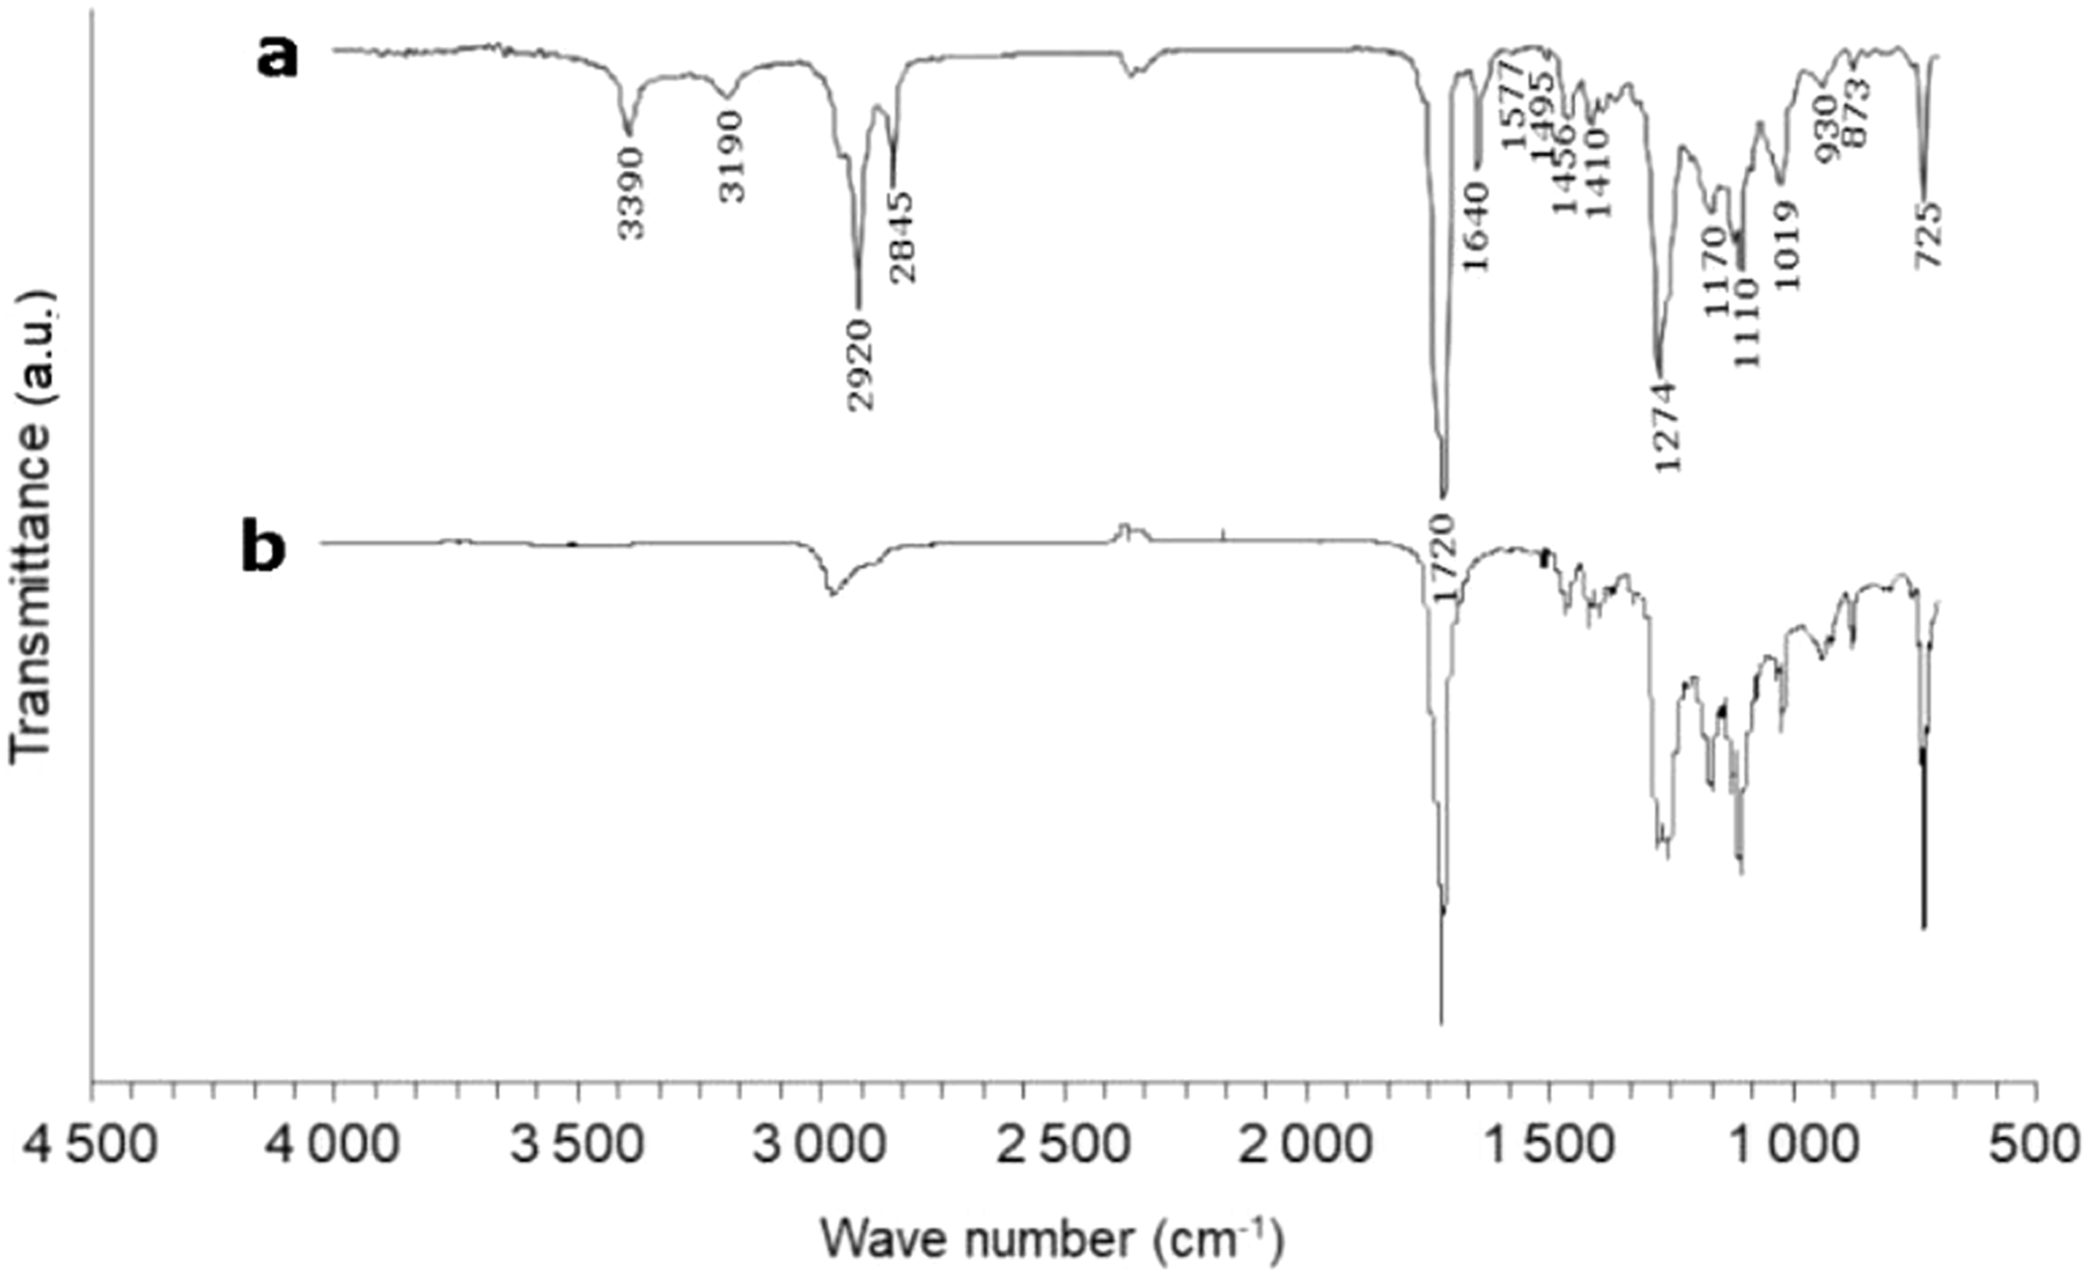
Interaction of starch with cellulose
MFC are long entangled fibrils with a large range of dimensions which have been characterized using TEM observations. Figure 3 illustrates the shape and the arrangement of MFCs. The diameter appears to be in the range of 50 to 400 nm and the length is of several micrometers (5–15 μm). MFCs present a high aspect ratio (30–100) which makes them interesting for composite reinforcement. Microscopic observations of MFC with TEM.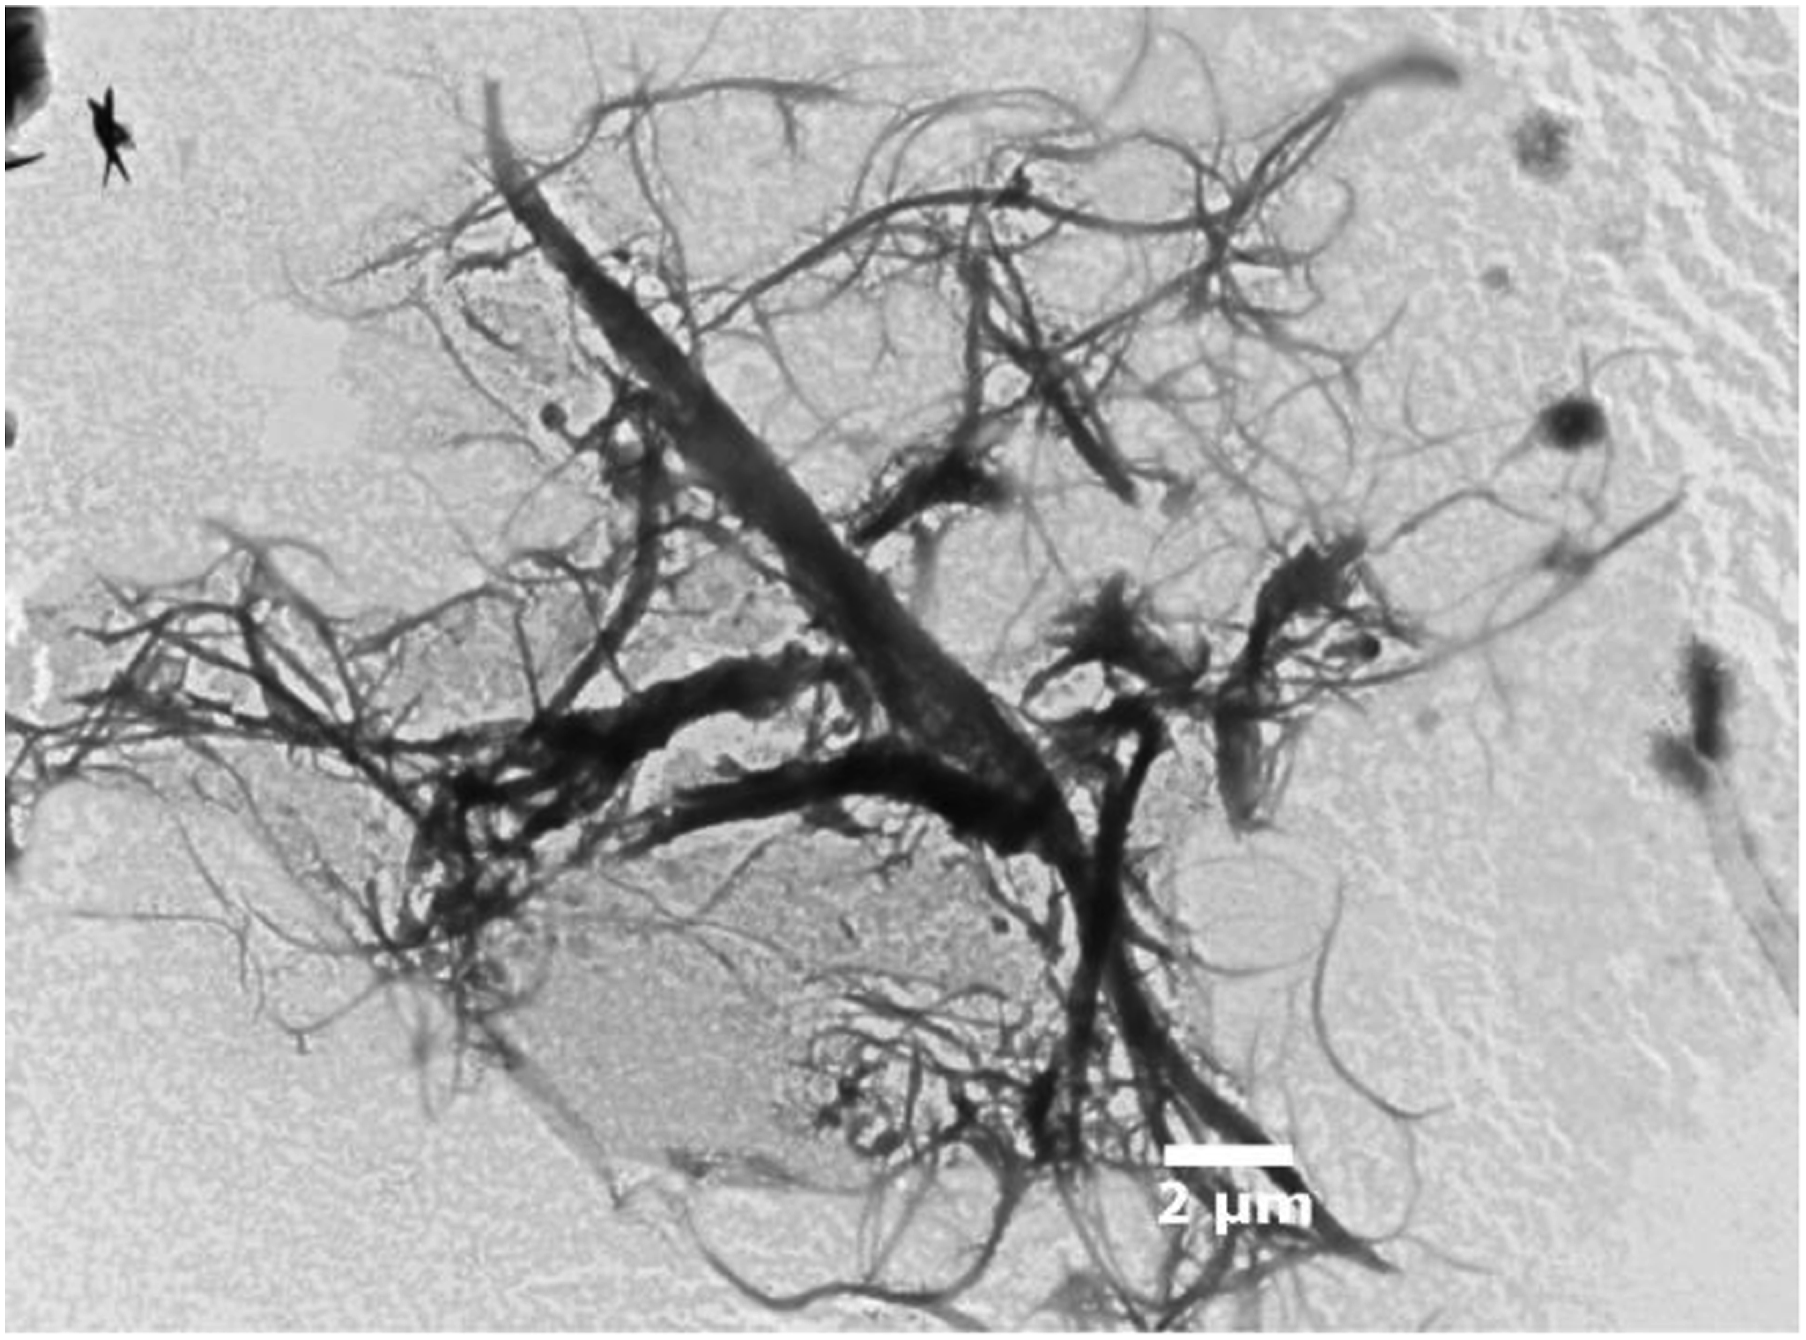
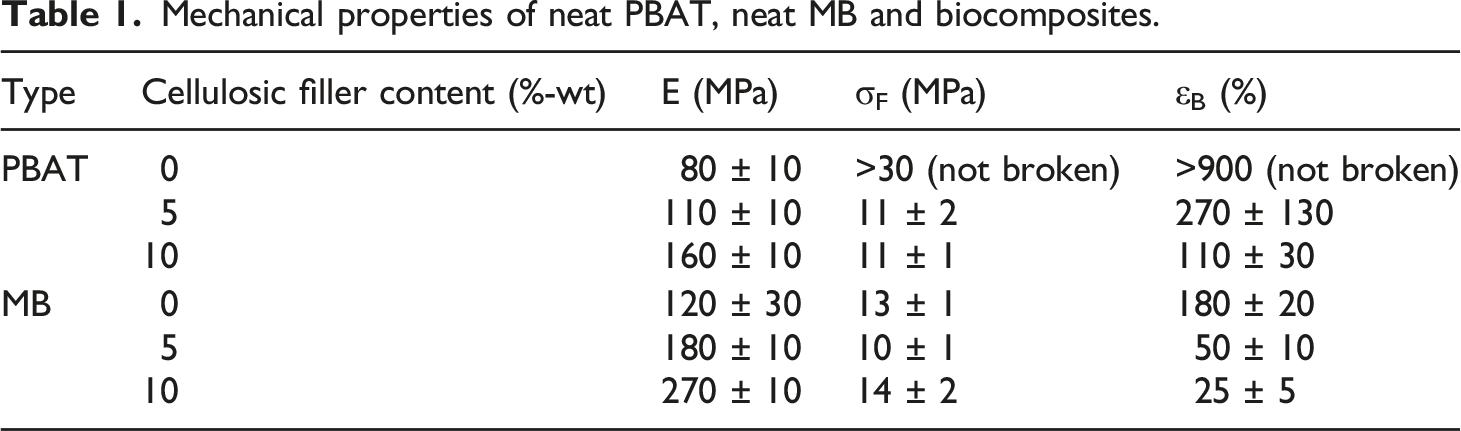
Mechanical properties of neat PBAT, neat MB and biocomposites.
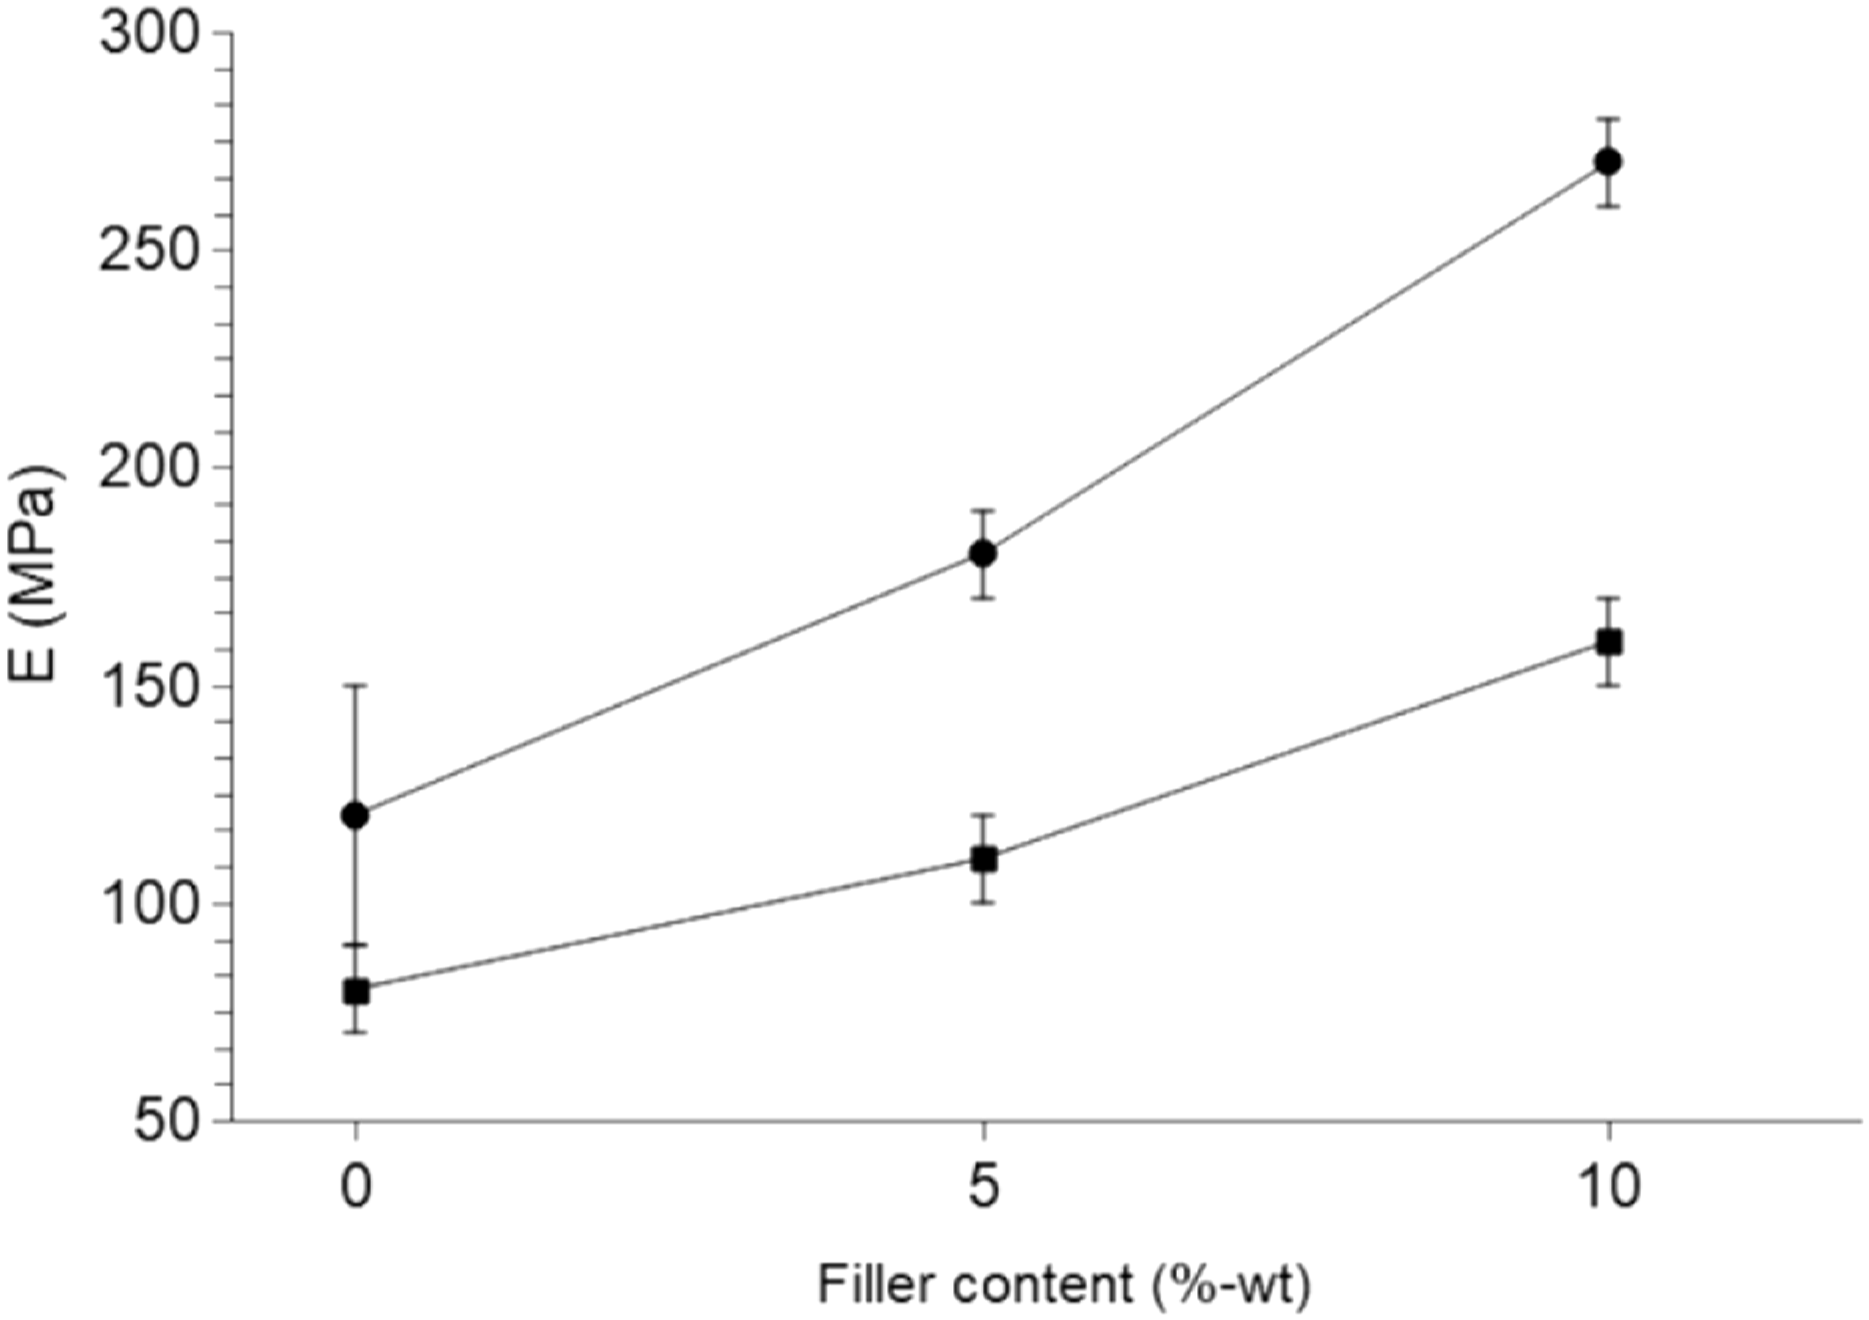
Young’s modulus versus filler content for composites made with MFC filler in: MB (•), PBAT (■) (lines are guides for the eye).
First of all, a reinforcing effect of starch can be noticed since neat MB is slightly more rigid than neat PBAT. The difference becomes more obvious when the MFC are added since the error bars are much smaller in this case. Furthermore, the variation of the Young’s modulus with the filler content is steeper for composites based on MB than for those based on PBAT.
The improvement of the Young’s modulus by adding equal contents of cellulosic filler, either 5 to 10%-wt, is always more important in MB than in PBAT. Adding 5%-wt of MFC improved the Young’s modulus by 50% in MB and only 35% in PBAT, similarly adding 10%-wt of MFC improved the Young’s modulus by 125% in MB while it’s only 100% in PBAT. These values are calculated with regards to the neat polymer, PBAT or MB, and did not take into account the reinforcing effect of starch itself as a filler. Adding 10%-wt of MFC decreased the elongation at break by about 87% in MB composites. This loss of extension at break is much higher in PBAT composites in relative value since neat PBAT has a larger elongation at break (more than 900%). Therefore, in this case, the loss of elongation at break after adding 10%-wt of MFC is almost 90% (from more than 900% to 110%). Adding 10%-wt of MFC decreased the stress at break by more than 63% in PBAT and it remains constant in MB within uncertainties.
This indicates an improved dispersion of cellulose in MB in comparison with PBAT. This can be attributed to the higher density of interactions between starch and cellulose, especially of hydrogen bonds occurring between the hydroxyl groups present at the surface of both polysaccharides.
To highlight the interaction between cellulose and starch during the melt mixing at high temperature, three blends were prepared varying the mixing time: 400 s, 600 s and 1200 s and observed with SEM without compression. Microscopic observations of neat MB (a) and composites with 5%-wt MFC blends at different mixing times: b (400 s), c (600 s) and d (1200 s) are presented in Figure 5. Figure 5(a) shows the presence of white dots corresponding to TPS (starch) which looks well dispersed in PBAT. Micrographs of the composite material (Figure 5(b), (c) and (d)) show an arrangement of spherical white agglomerates on porosities. In fact, the hollow spheres in Figures 5(b) and (c) are pores generated during mixing. White dots on the surface are composed of cellulose mixed with starch due to the preferential interaction between both polysaccharides. It can be seen from the comparison of Figure 5(b), (c) and (d) that the increase of the mixing time from 400 s to 1200 s increases the number of cellulose/starch agglomerates at the surface of the pores (Figure 5(d)), suggesting a kinetic aspect of the phenomenon. Microscopic observations with SEM of: (a) neat MB and composites with 5%-wt MFC prepared in an internal mixer at 150°C with different mixing time: (b) 400 s, (c) 600 s and (d) 1200 s.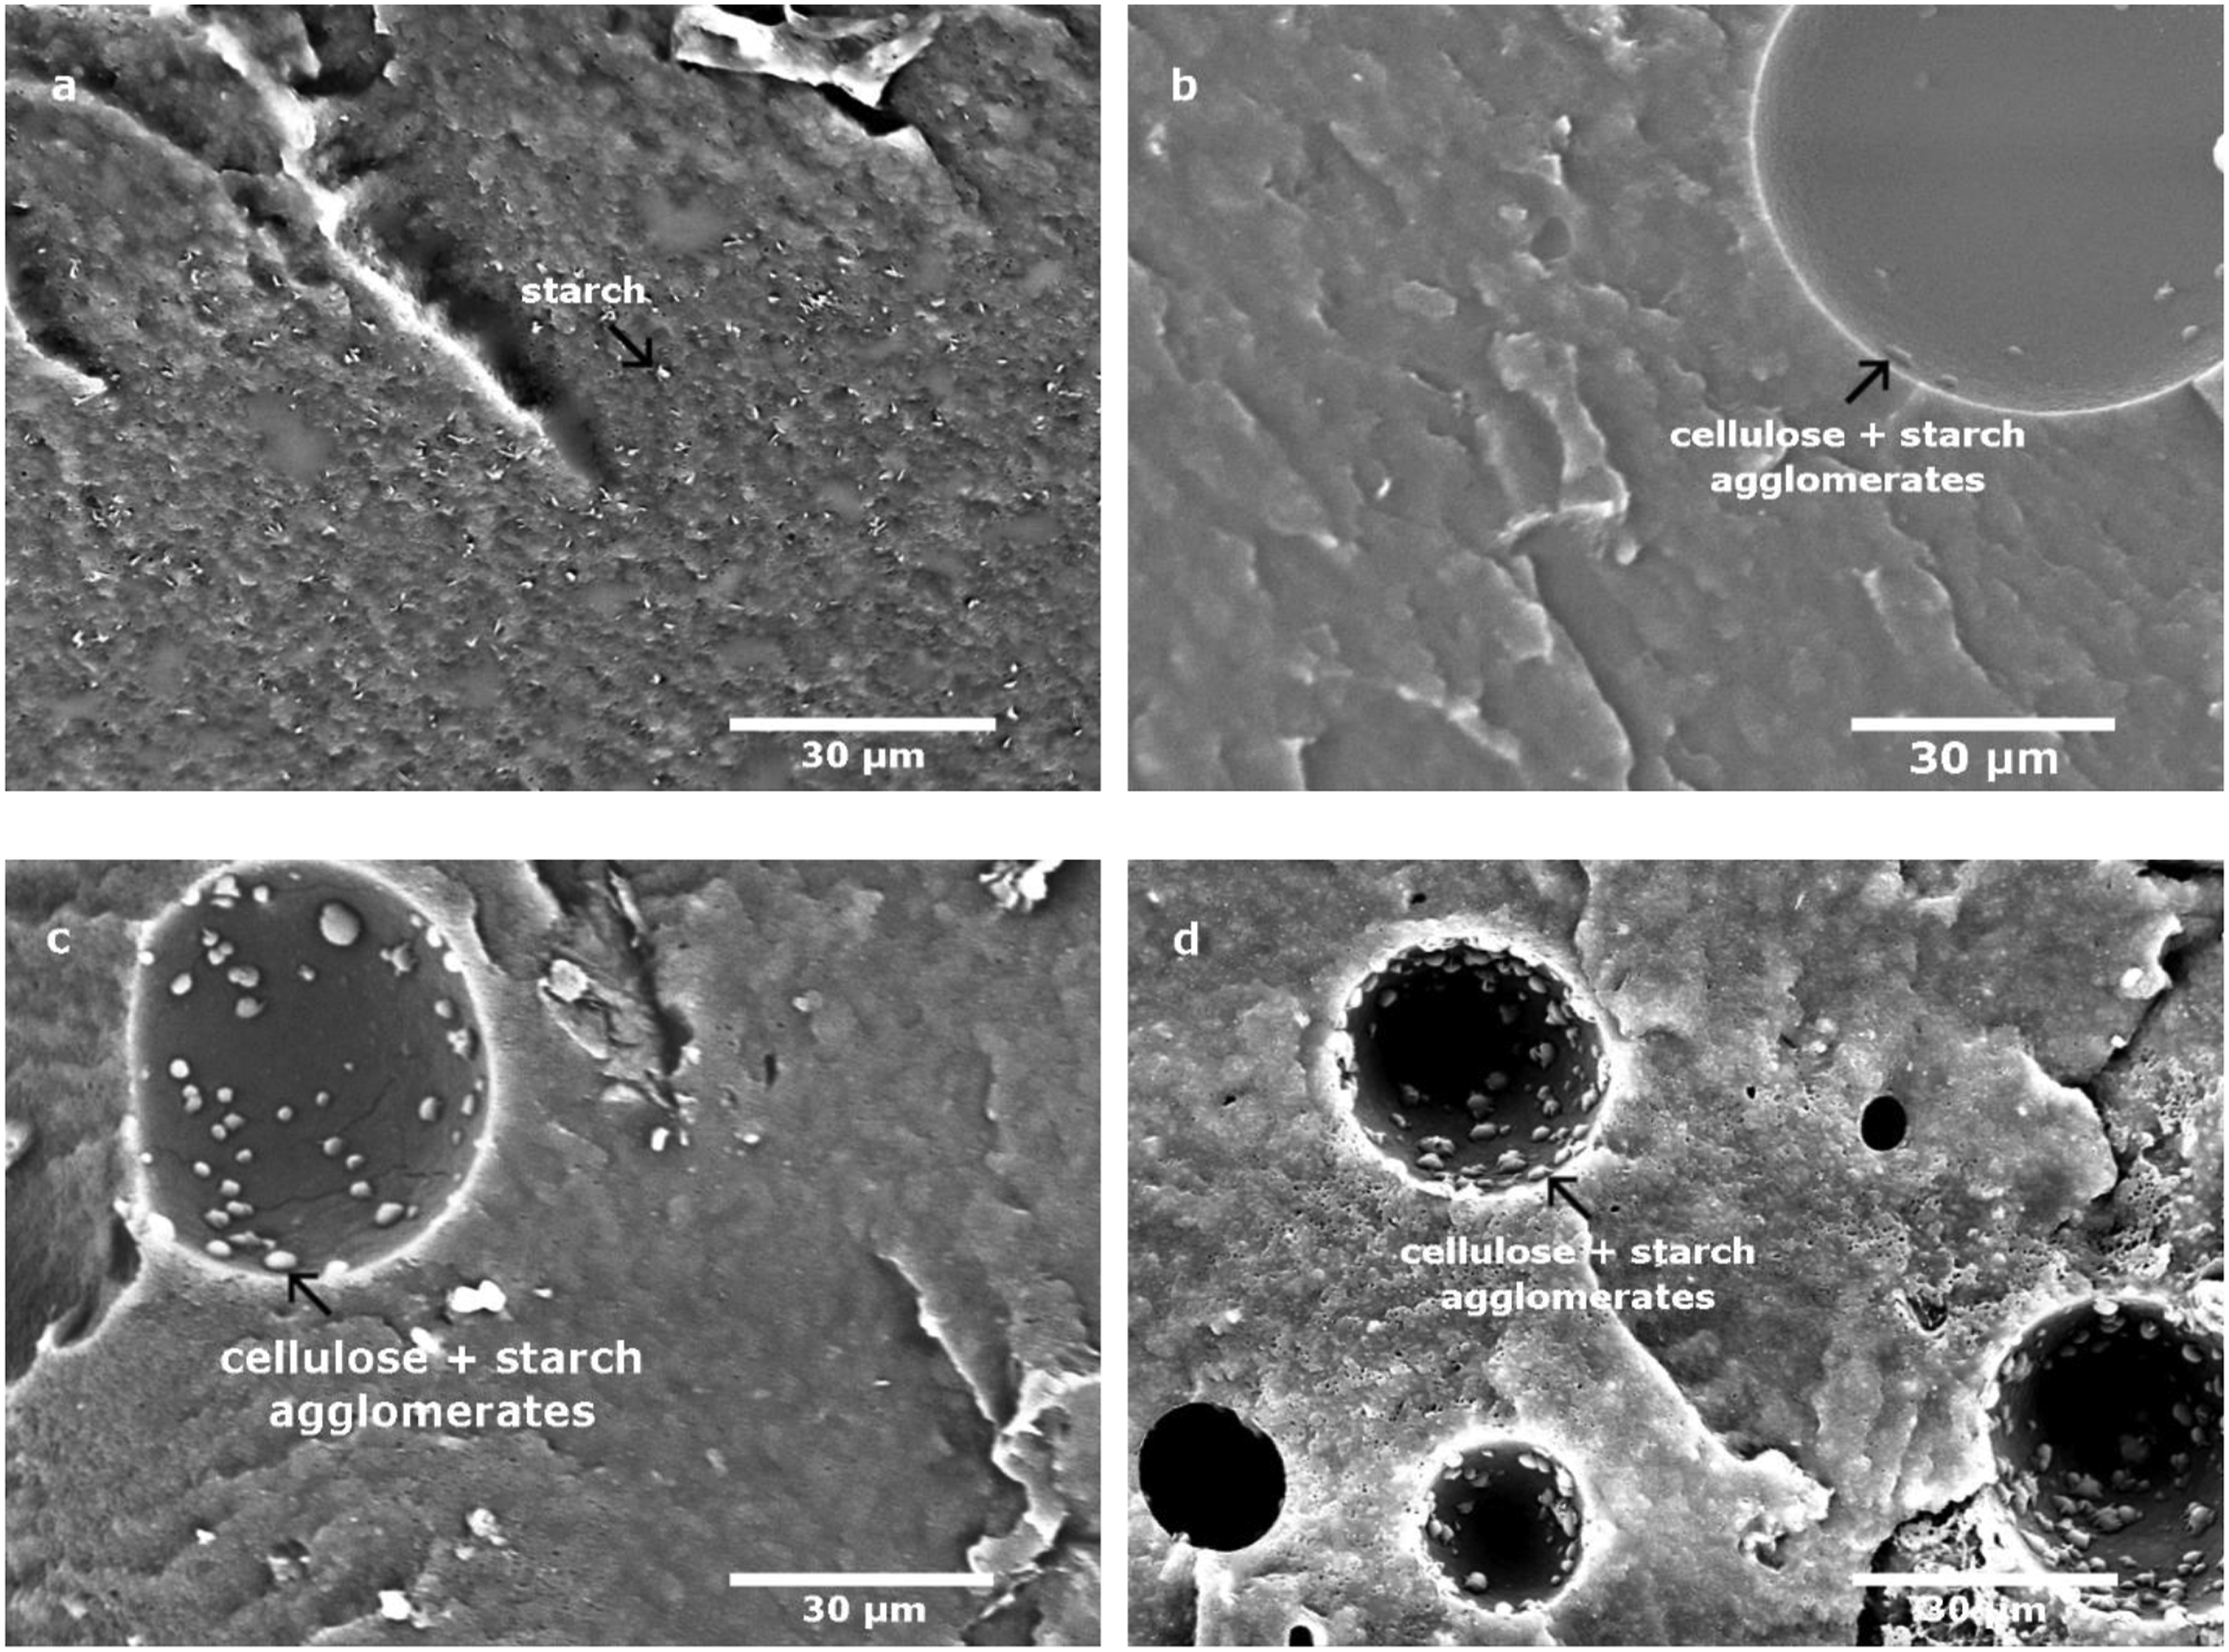
Figure 6 presents micrographs of cryo-fractured surfaces of neat MB (a) samples after compression and composites with 5%-wt MFC (b, c, d) at different magnifications. Figure 6(a) shows a smooth surface with the presence of spherical starch grains well dispersed in PBAT and empty cavities as well, corresponding to starch grains that have been pulled out of the matrix during the cryo-fracture. Figure 6(d) of the composite material reinforced with 5%-wt MFC shows elongated starch grains looking like needles surrounded by MFC agglomerates. The interaction of the two polysaccharides induces a pronounced stretching of the starch embedded in agglomerates with MFC. This occurs at the cryo-fracture step during the preparation of samples and gives the starch grains this characteristic shape of needles. Generally, agglomerated MFC are hard to locate and to observe in the blends and composites, however the presence of deformed starch makes it easier to locate MFC agglomerates as it can be observed in Figure 6(b) and (c). Big white threads with a complex geometry are cellulose fibrils and small needle-shaped particles on their surface are elongated starch grains, both polysaccharides creating agglomerates. This enhances the contrast between fillers and polymer matrix, making the observation of the agglomerate distribution more obvious. All these results confirm the compatibilizing effect of starch in PBAT/cellulose composites. Microscopic observations with SEM of: (a) neat MB and (b, c, d) composites made with 5%-wt MFC.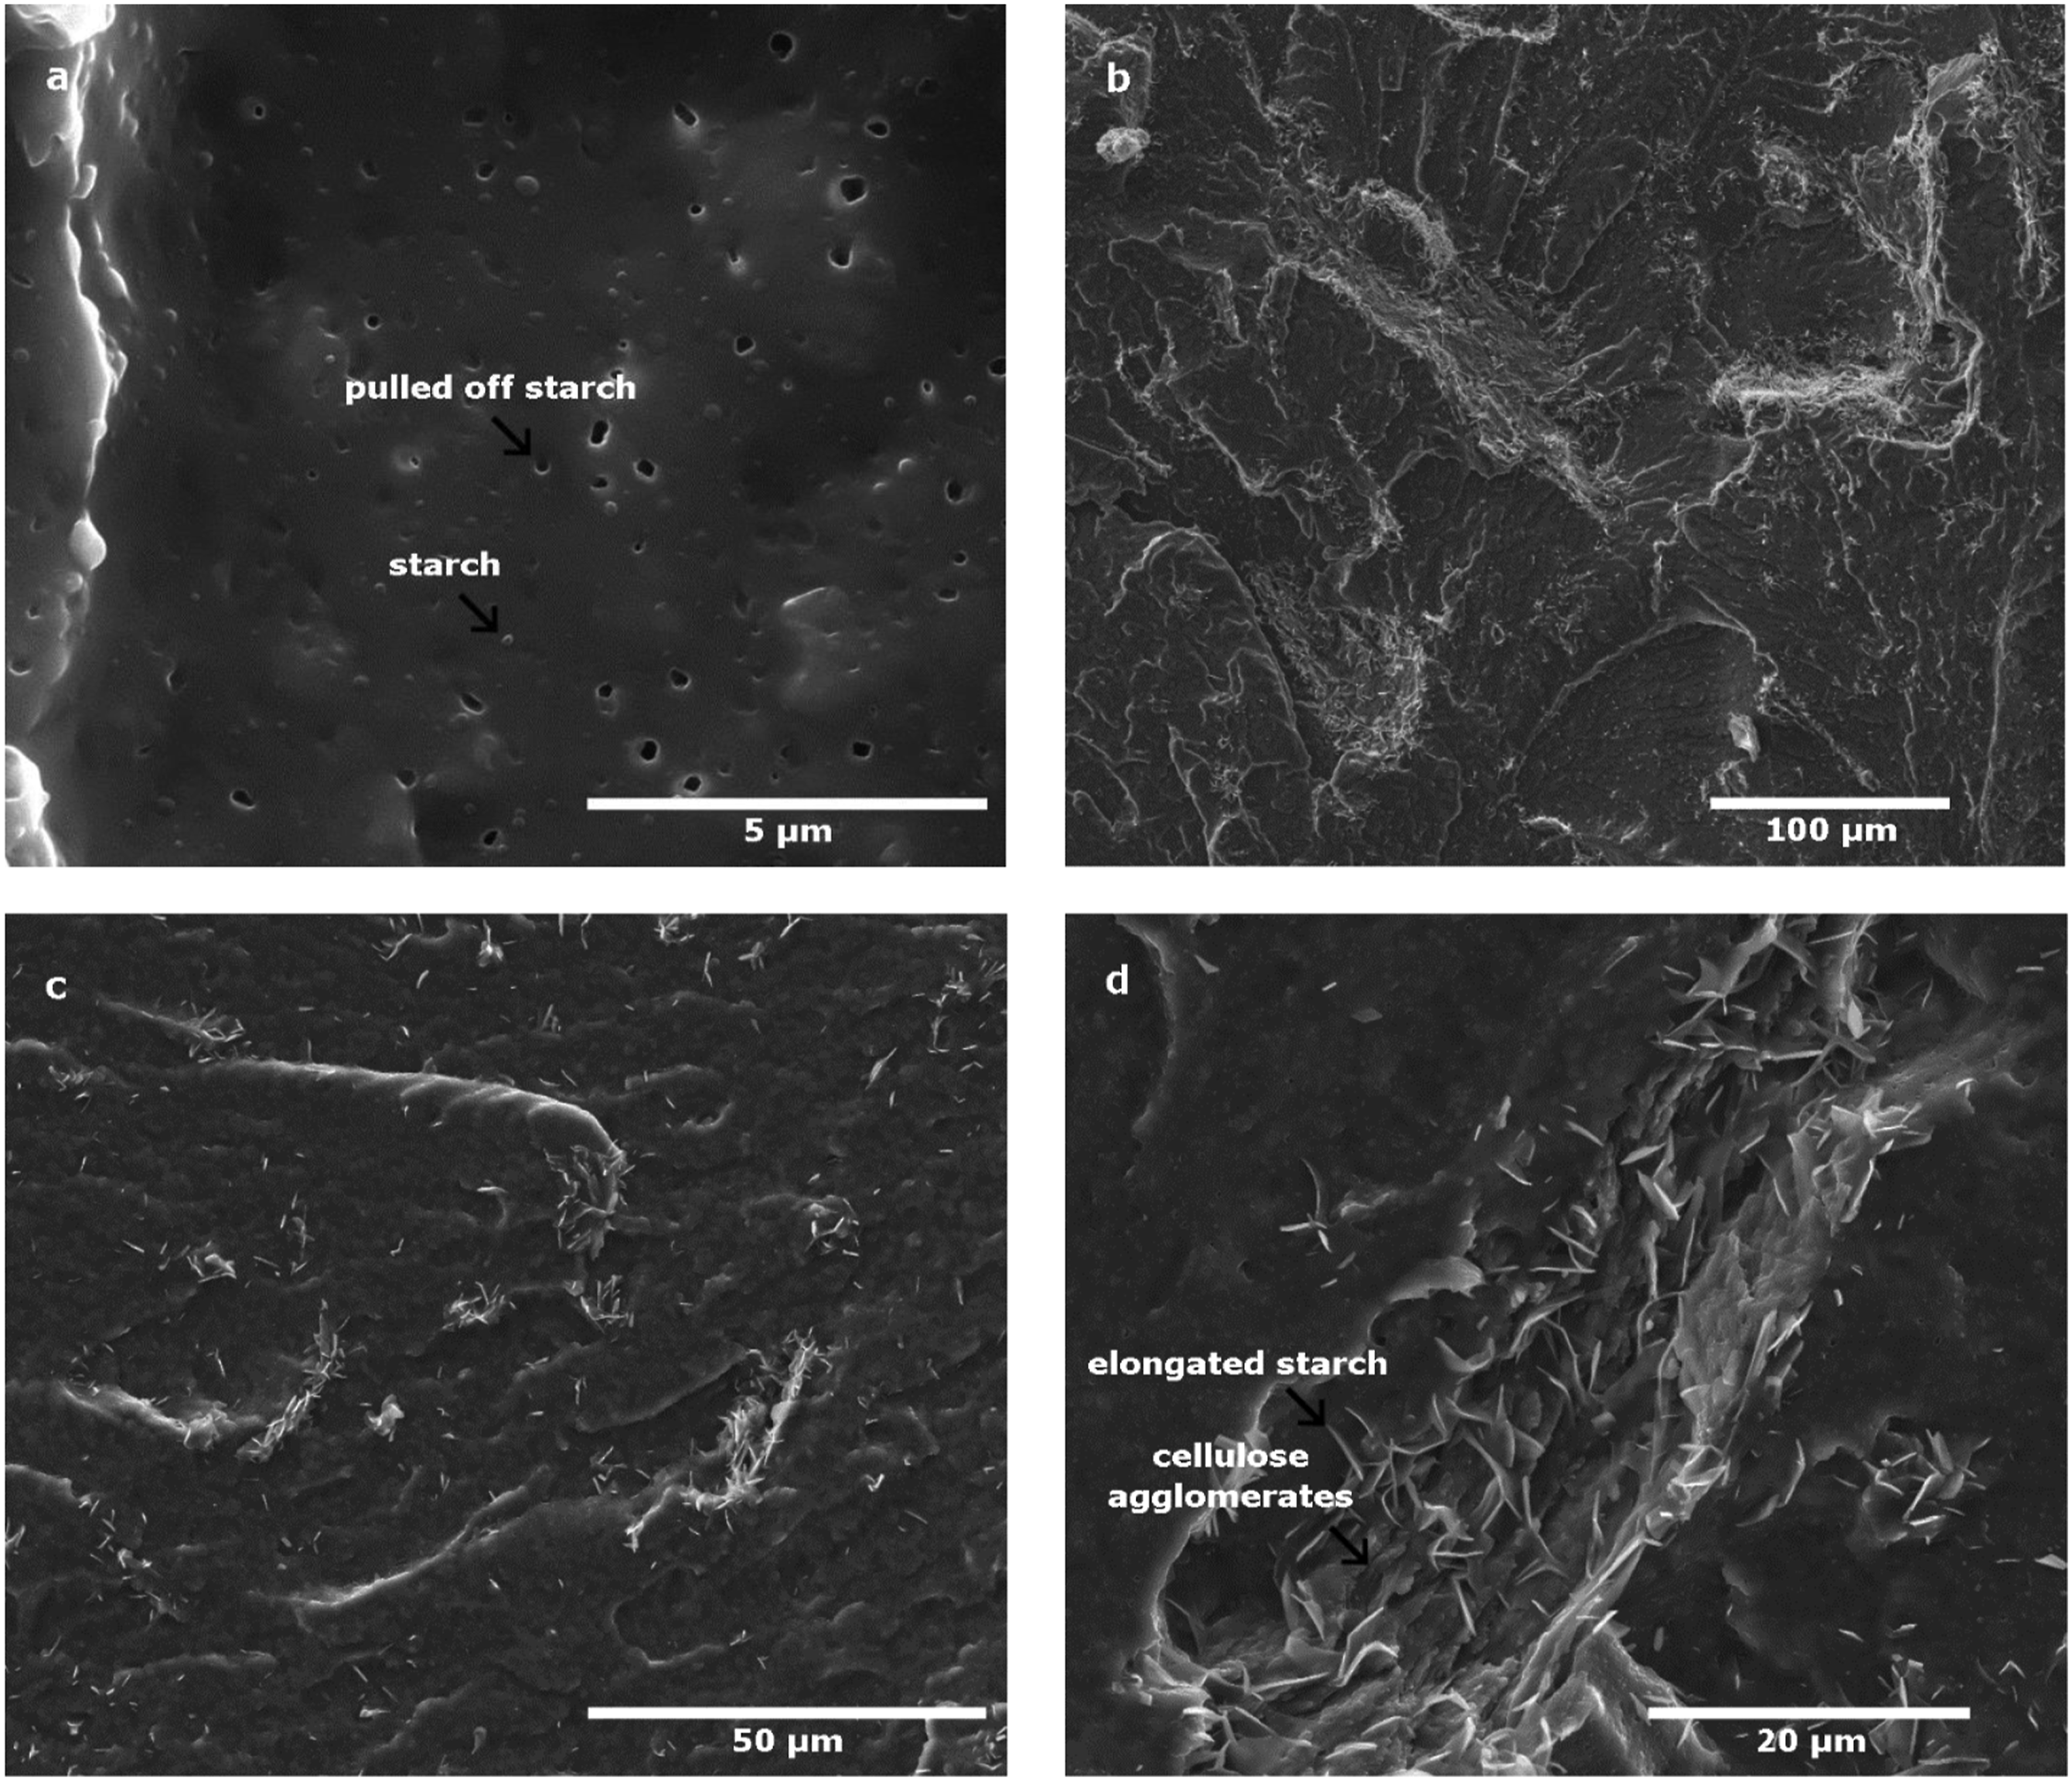
Percolating network of MFC
Figure 7 presents results of dynamic mechanical analysis in solid for MB and composites with 5 and 10%-wt MFC. The results of storage modulus and loss modulus in Figures 7(a) and (b) show that neat MB breaks at the melting temperature (119°C) of PBAT. Meanwhile, composites containing MFC keep a substantial modulus above the melting temperature and a secondary plateau of modulus is observed at 0.1 MPa. In addition, the modulus is higher on the overall temperature range. At the melting temperature of PBAT, the modulus of the composite with 10%-wt MFC is 3 MPa. (a) Storage and (b) loss modulus measured during dynamic mechanical analysis in solid state at 1 rad/s of: (i) neat MB, (ii) MB + 5%-wt MFC, (iii) MB + 10%-wt MFC.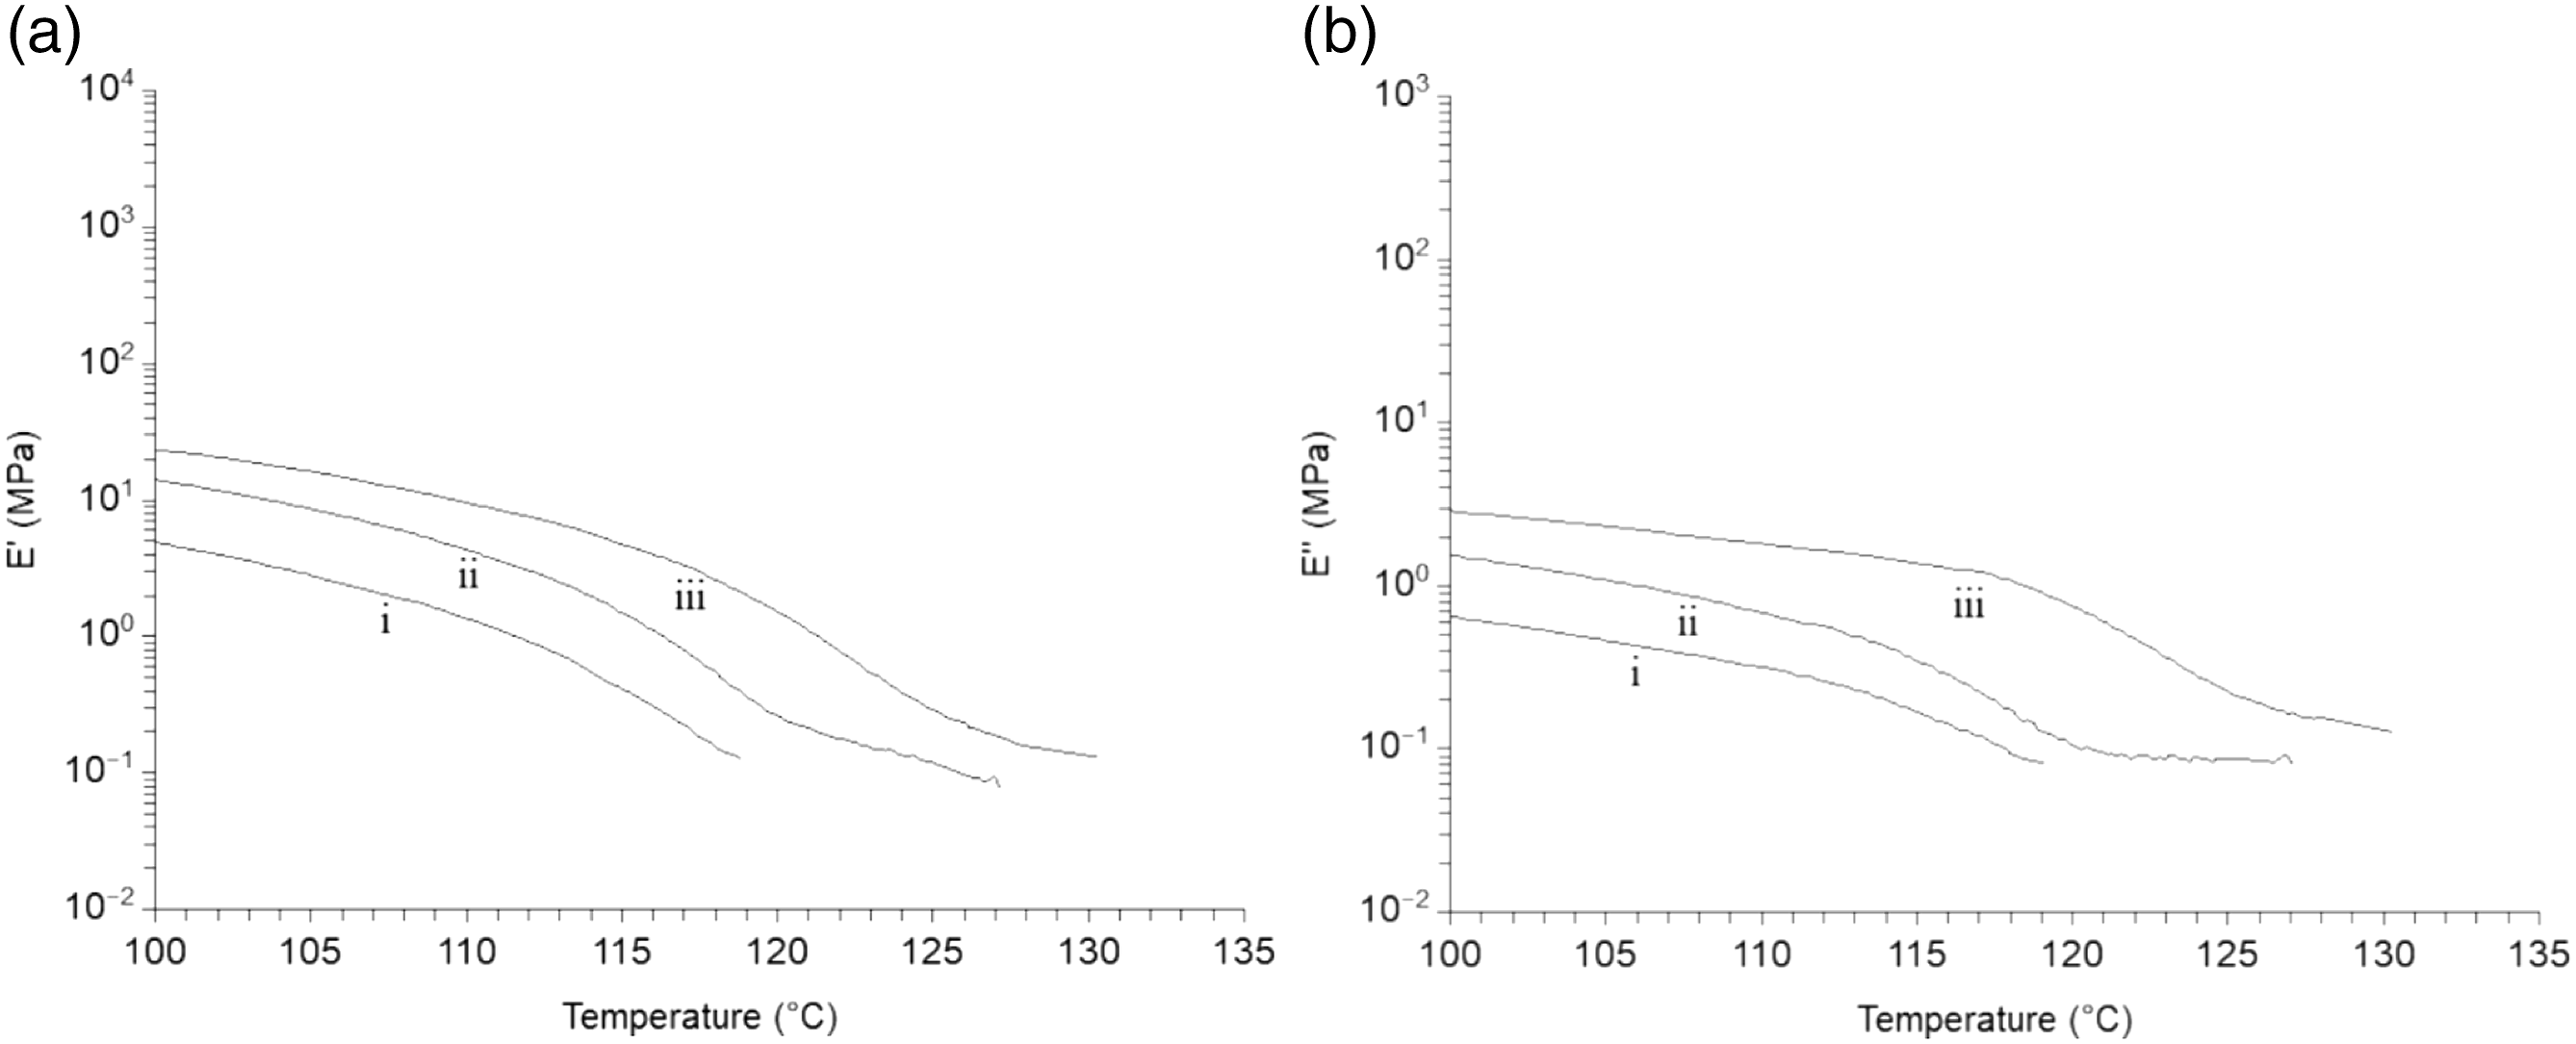
Results of dynamic mechanical analysis in solid state were confirmed by experiments carried out in the melt. Figure 8 presents results of dynamic mechanical analysis in the melt for MB and composites with 5 and 10%-wt MFC and for PBAT composite with 10%-wt MFC. The secondary plateau observed at high temperature in Figure 8(a), presenting the storage modulus versus frequency, reflects in a long relaxation time at low frequency, even at 150°C. Figure 7 and the low frequency relaxation in Figure 8 indicate a strong network of MFC for composites with 10%-wt MFC. The network is weaker at 5%-wt MFC. A slight effect can also be observed at 150°C for composites made with neat PBAT matrix and 10%-wt MFC in the melt. Nevertheless, the effect is minor in comparison to MB confirming the compatibilizing effect of starch in PBAT/cellulose composites. Dynamic mechanical analysis in the melt of: (•) neat MB, (▴) MB + 5%-wt MFC, (■) MB + 10%-wt MFC, (✳) PBAT+10%-wt MFC.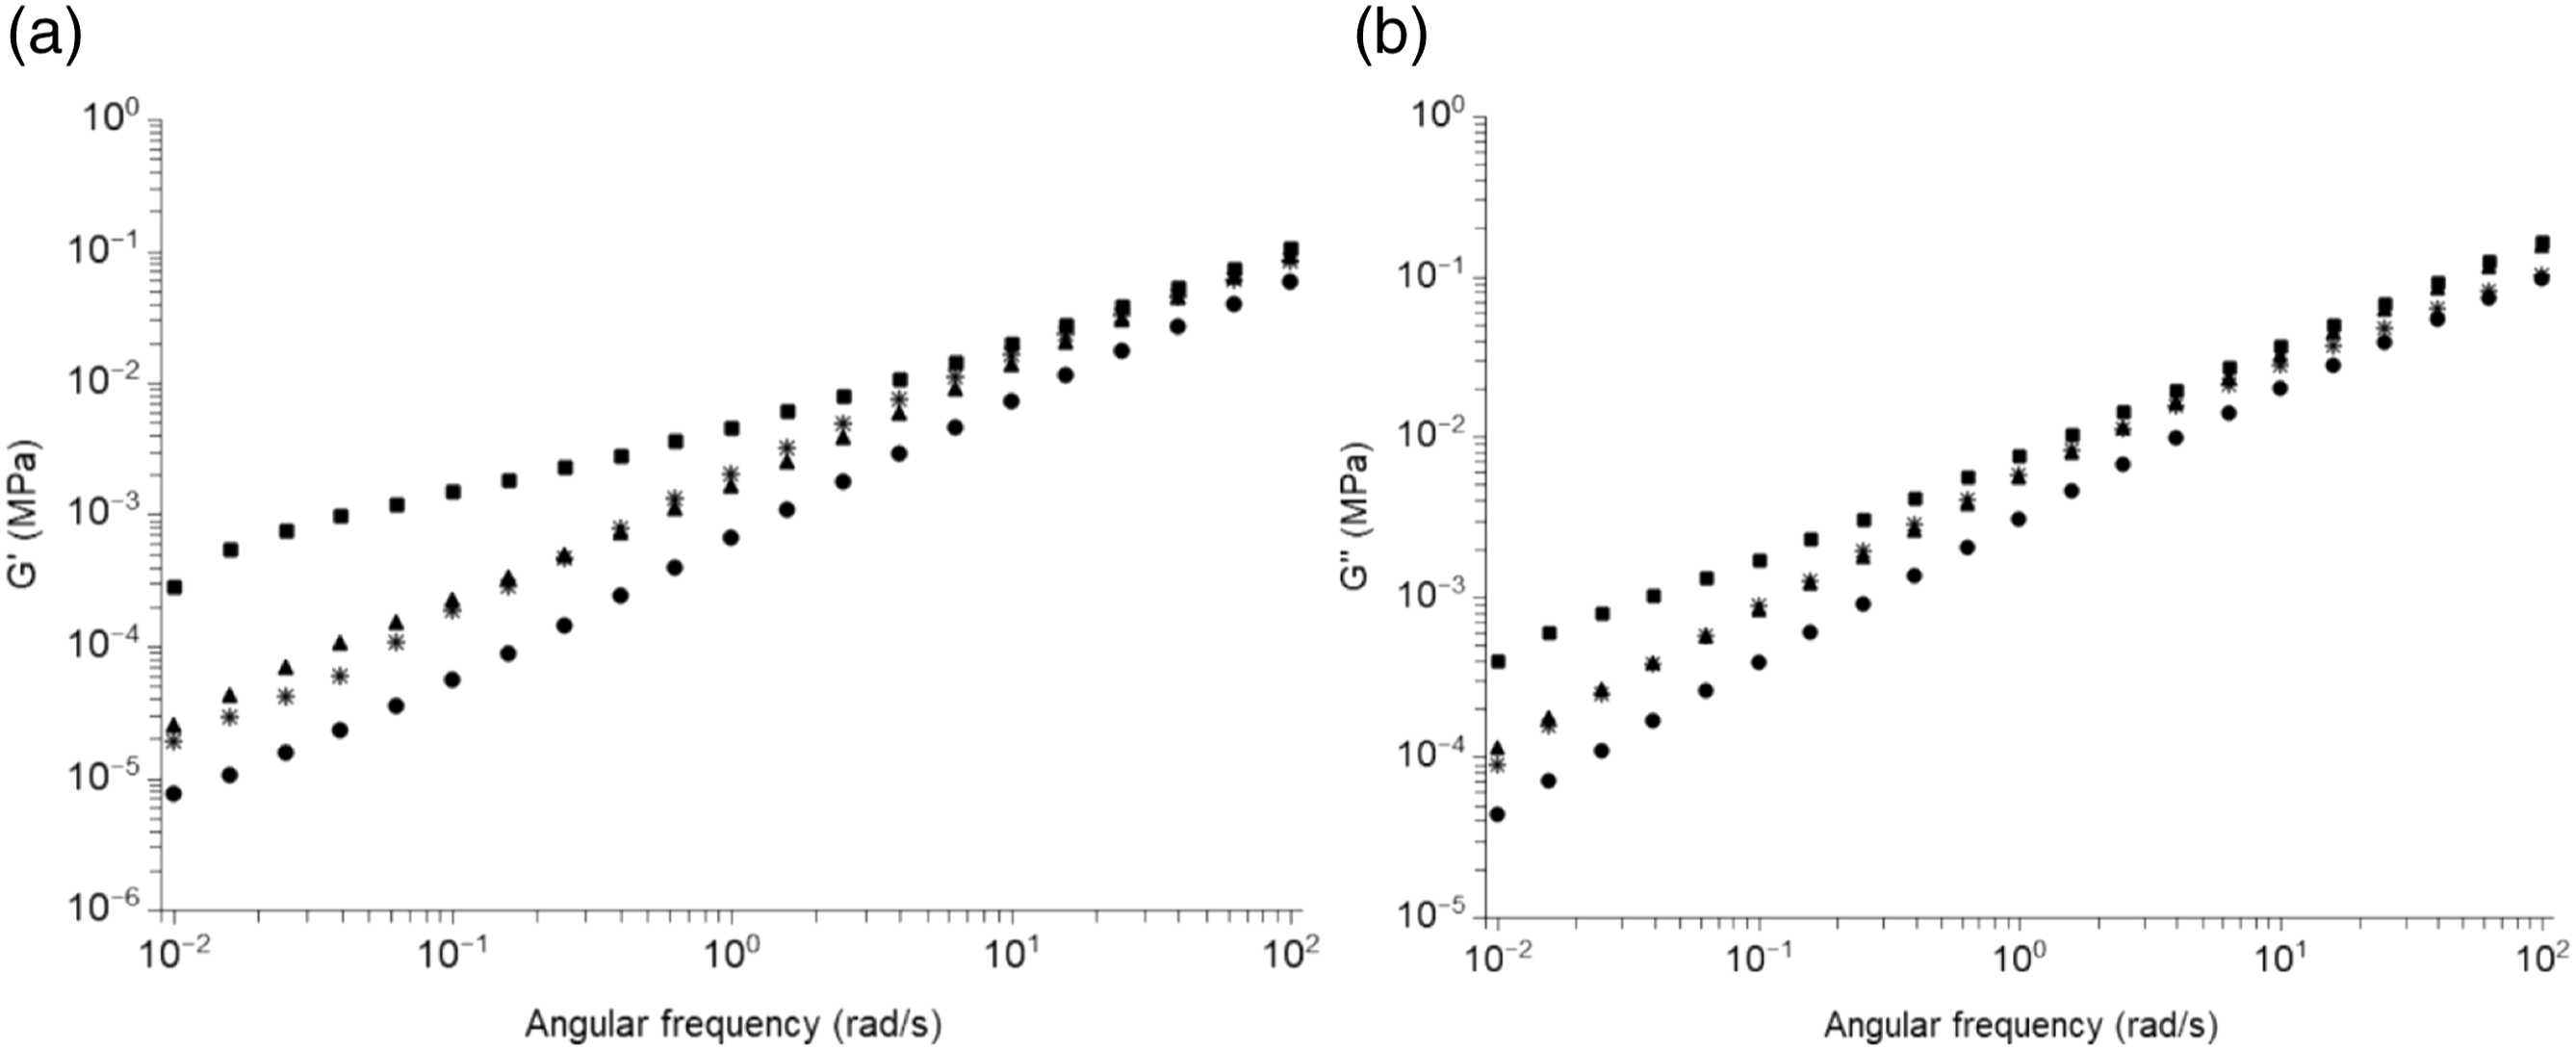
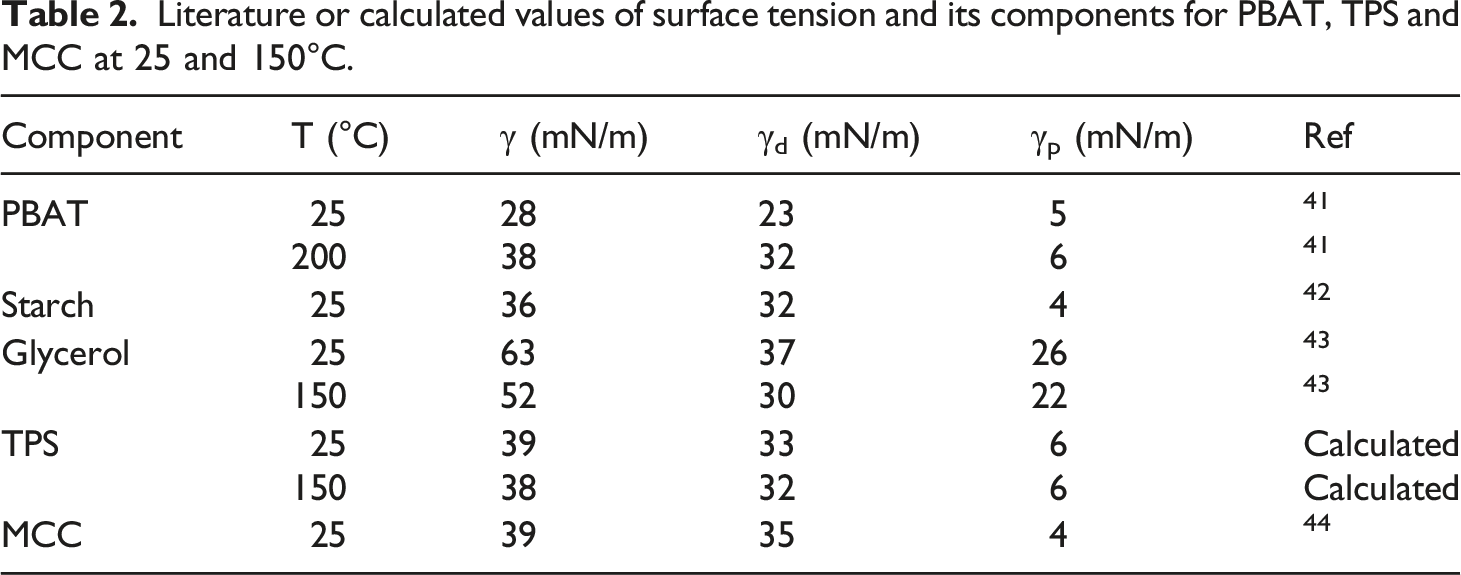
Literature or calculated values of surface tension and its components for PBAT, TPS and MCC at 25 and 150°C.
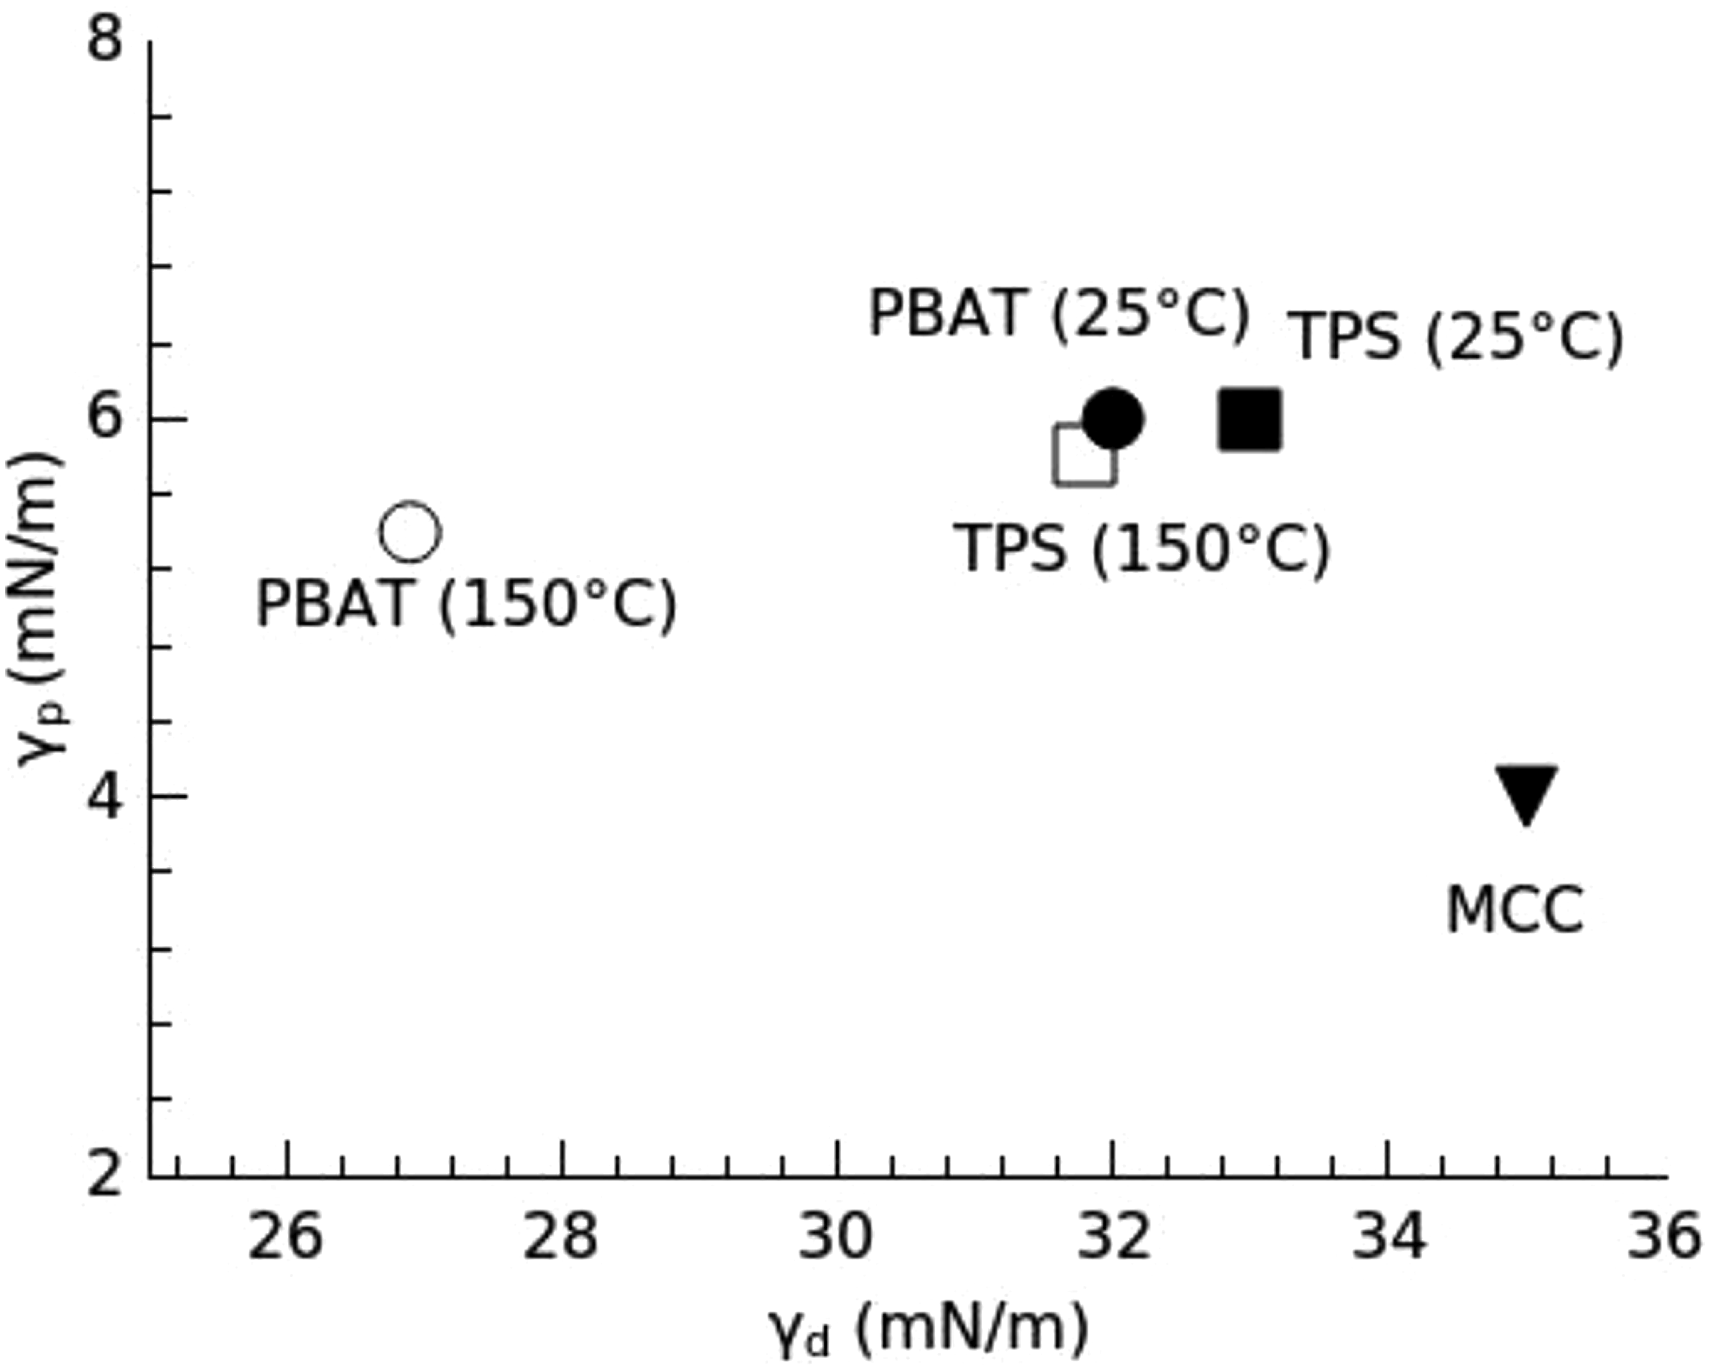
Location of the composite ingredients according to their surface tension at 25°C and 150°C (processing temperature), presented in the polar and dispersive components space.
Conclusion
In this study, we have investigated composites based on MB, a commercial blend of biodegradable polyester which is composed of PBAT and thermoplastic starch (TPS), filled with well-known cellulosic fillers, micro/nano-fibrillated cellulose (MFC). As we tested composites reinforced with 5 and 10%-wt of the cellulosic filler based on either MB or PBAT, strong interaction was noticed between TPS and cellulose. SEM micrographs of composite materials before compression have shown white agglomerates composed of starch and cellulose. The amount of these agglomerates increases as the mixing time of the composites increases from 400 s to 1200 s. Phase separation took place during the processing of the composite materials due to a greater affinity between starch and cellulose components. This interaction induces a pronounced deformation of starch in areas where MFC are present and makes them take the shape of needles. The same phenomenon was observed in SEM micrographs of the surface of cryo-fractured composites, the cryo-fracture being responsible for the deformation of starch grains in this case. Mechanical properties of MB based composites compared with PBAT based composites also evidenced the effect of starch. The increase of the Young’s modulus due to cellulose fibrils is always more important in MB based composites than in PBAT, for example, by 25% for composites with 10%-wt MFC. This indicates that the interaction between starch and cellulose leads to better compatibility with the polymer matrix. Dynamic mechanical analysis results in solid and in the melt indicated the presence of a percolating network of fibrils for composites made with 10%-wt of the filler. This was responsible for the plateau obtained at low frequencies in DMA tests in the melt or by the substantial modulus above the melting temperature for DMA test in solid. This effect was systematically much more obvious for composites based on MB. Moreover, SEM images have shown migration of starch toward cellulose fillers indicating affinity between both polysaccharides. All these results show the compatibilizing effect of starch in PBAT/cellulose composites and the interesting interaction between starch and cellulose. This interaction is responsible for an increase of the mechanical properties in the elastic domain and lower damage of the ductility of the material in the plastic domain.
Footnotes
Acknowledgements
This work is carried out in part under the Mobidoc Scheme, funded by the EU through the EMORI program and managed by the ANPR, in part by the action Eiffel scholarship of excellence. The authors thank Pierre Alcouffe for the SEM observations with ESEM-FEG XL30.
Declaration of conflicting interests
The author(s) declared no potential conflicts of interest with respect to the research, authorship, and/or publication of this article.
Funding
The author(s) disclosed receipt of the following financial support for the research, authorship, and/or publication of this article: This work was supported by EMORI program and Campus France.