
Abstract
The goals of this work are to obtain thermoplastic starch (TPS) with different glycerol/water ratios, verify its characterization by different techniques, and study the influence of addition of cellulose nanofibers in the matrix of TPS. The general procedure for processing starchy materials involves granular alteration with the combination of temperature, shear, and plasticizers. Distilled water and glycerol are used as plasticizers, and the influence of both of them has been studied in tensile properties. By infrared spectroscopy analysis, the addition of plasticizers created new physical links (hydrogen bonds) with starch molecules thereby shifting the characteristic peaks of native corn starch to higher wave number. The most suitable composition for the elaboration of bionanocomposites has been determined and bionanocomposites with different content of cellulose nanofibers have been obtained and their mechanical properties have been studied.
Introduction
Environmental awareness has created an urgent necessity to develop biodegradable materials derived from renewable sources with properties comparable to synthetic polymers with low price. For this purpose, natural biopolymers and green composites derived from renewable sources can be an effective alternative. 1 For example, starch, a natural biopolymer that is found abundantly and at a very low price, is a material that is considered as a promising alternative to some synthetic polymers. The general procedure for processing starchy materials involves the granular alteration with the combination of temperature, shear, and plasticizers. As plasticizer usually distilled water and glycerol or a mixture of different polyols are used, while other compounds containing nitrogen (urea, ammonium derived, amines, etc.) can also be used. 2 Most of the works focused on making films for food packaging application. For a food packaging material, mechanical and barrier properties should be satisfiable. However, starch has certain limitations for using it in a wide range of applications such as fragility, water sensitivity, high gas permeability, and high viscosity. To overcome some of these limitations, the modification of starch as a biodegradable polymer is a challenge for researchers. Reinforcements could be added to thermoplastic starch (TPS) manufacturing composites. 2,3 The use of natural fibers and nanoreinforcements for the elaboration of composites and nanocomposites is an effective way to improve mechanical and barrier properties. 4 –6 Cyras et al. 5 observed that the addition of sisal fibers to polycaprolactone–starch matrix improved the creep resistance. Torres et al. 4 studied the mechanical properties of natural fiber (sisal, jute, and cabuya)-reinforced TPS biocomposites. They observed that mechanical properties improved after the addition of natural fibers. Montoya et al. 6 studied composite films based on TPS polymer and cellulose microfibrils. They observed that after adding microfibrils to TPS matrix, tensile strength and Young’s modulus significantly increased. To improve the mechanical properties of biopolymers and preserve their biodegradability, cellulose nanofibers that are isolated from lignocellulosic plants by chemical and mechanical treatments are used as reinforcements. Cellulose nanofibers have good properties, such as high Young’s modulus, high tensile strength, and low thermal expansion coefficient, which make them interesting candidate for bionanocomposites based on TPS. 3,7 –9
The main goal of this work is to obtain TPS films and verify its characterization by different techniques such as Fourier transform infrared (FTIR) spectroscopy, optical microscopy (OM), differential scanning calorimetry (DSC), thermogravimetric analysis (TGA), X-ray diffraction (XRD), dynamic mechanical analysis (DMA), and mechanical properties. Finally, the influence of addition of cellulose nanofibers to TPS matrix was studied.
Experimental
Materials
The corn starch used in this work is produced by Unilever Foods Industrial España S.L. (Leioa, Spain) under the trade name Maizena. The corn starch was plasticized using two different plasticizers, namely glycerol, which was produced by Panreac (Spain), and distilled water. For the elaboration of bionanocomposites, cellulose nanofibers isolated by chemical treatments from sisal fibers have been used. 10
Preparation of TPS films and bionanocomposites
Different compositions of corn starch, glycerol, and water mixtures were prepared (Table 1). For the elaboration of TPS, first, the corn starch, distilled water, and glycerol were mixed manually in a polyethylene bag. The mixture was introduced into an internal mixer (Haake Rheomix 600 (Thermo Scientific, Karlsruhe, Germany) with two banbury rotors) at 90°C and mixed for 40 min at 100 revolutions per minute. For the preparation of bionanocomposites, the cellulose nanofibers were stirred in distilled water at room temperature for at least 12 h, and after 12 h, the procedure used for TPS preparation was followed. Table 1 shows the different compositions of bionanocomposites obtained in this work. TPS and bionanocomposite films were produced by compression molding technique using a mini-press (Atlas Series Manual Hydraulic Press, Specac, UK). The films were fabricated by pressing the mixtures at 90°C under a pressure of 2 tons for 5 min. After that, the films were cooled under pressure to 40°C. Finally, the tensile bars according to ASTM D1708-93 standard were obtained with the aid of a pneumatic die for further characterization of the films.
Compositions of TPS and bionanocomposites.
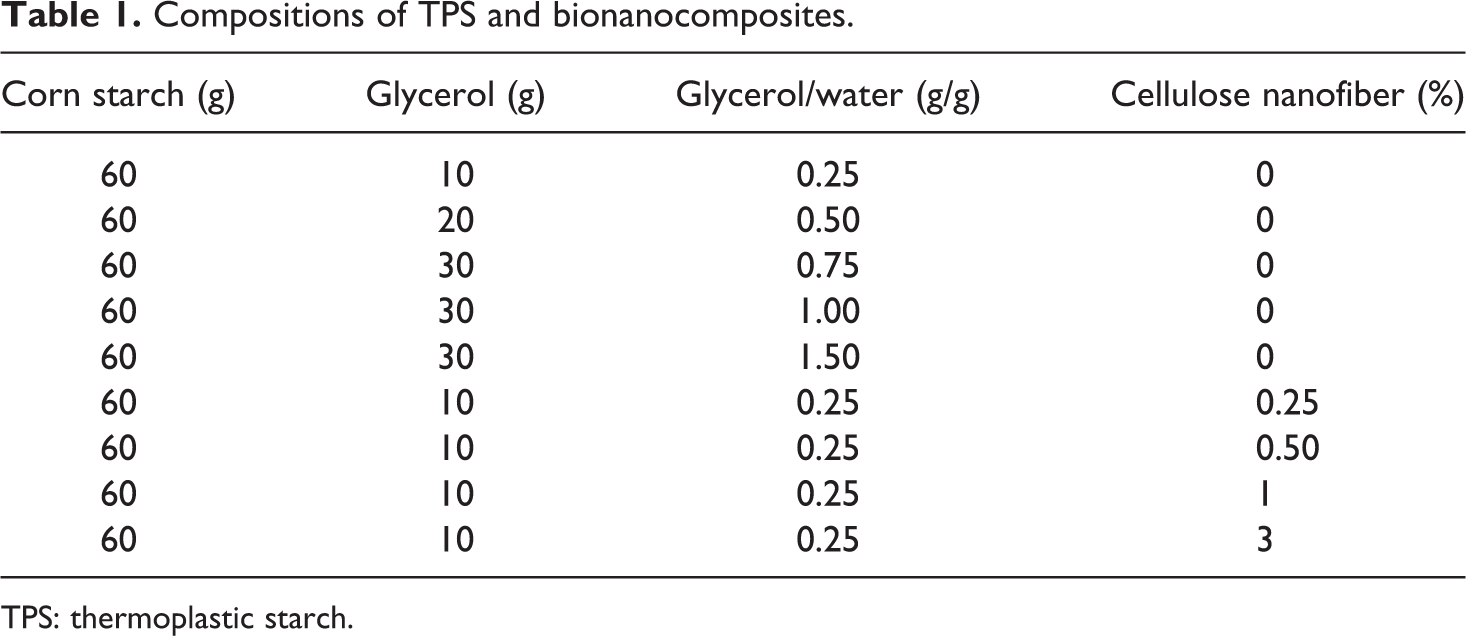
TPS: thermoplastic starch.
Characterization of TPS films and bionanocomposites
FTIR spectroscopy
Measurements were performed with a Nexus spectrometer (Nicolet, Madison, Wisconsin, USA) equipped with a MKII Golden Gate accessory (Specac, UK), which uses diamond crystal at a nominal incident angle of 45° with a zinc selenide lens. The native corn starch was ground and mixed with potassium bromide in order to achieve a pellet. Single-beam spectra of the samples were obtained after averaging 32 scans in the range from 4000 to 400 cm−1 with a resolution of 4 cm−1. All spectra were obtained in the transmittance mode.
OM and SEM
Morphological studies and the size of starch granules were studied by an Eclipse 600 (Nikon, Tokyo, Japan) using polarized light. Scanning electron microscopy (SEM) was used to analyze the fracture surfaces of nanocomposites. SEM experiments were performed by a JSM-6400 (JEOL, Tokyo, Japan) equipment with a wolframium filament operating at an accelerated voltage of 10 kV, and the samples were coated with chromium using a Quorum Q150 TES metallizer (Ashford, England).
Differential scanning calorimetry
DSC measurements were carried out using a differential scanning calorimeter (Mettler Toledo DSC 822e (L'Hospitales de Llobregat, Barcelona, Spain), equipped with an intracooler). The samples between 5 mg and 10 mg were heated from −30°C to 220°C at a rate of 10°C min−1 under nitrogen atmosphere.
Thermogravimetric analysis
To study the thermal stability of native starch and TPS polymer, TGA has been carried out on a Mettler Toledo TGA/SDTA 851 (L'Hospitales de Llobregat, Barcelona, Spain). Samples weighing 10–20 mg were placed in ceramic crucibles, and tests were carried out under nitrogen atmosphere between 25°C and 600°C at a rate of 15°C min−1.
X-Ray diffraction
XRD patterns of each material were collected using a X’PERT PRO automatic diffractometer (Philips, Amsterdan, The Netherlands) operating at 40 kV and 40 mA, in theta–theta configuration, secondary monochromator with copper Kα radiation (λ = 1.5418 Å) and a PIXcel solid state detector (PANalytical (Almelo, The Netherlands)). Data were collected at 2θ from 5° to 30°.
Dynamic mechanical analysis
DMA measurements were carried out on an Explexor 100N (Gabo, Ahlden, Germany) using the tensile geometry. The storage modulus (E′), the loss modulus (E″), and the relationship between them (tan δ) were measured from −100°C to 200°C at a rate of 2°C min−1. The static deformation was 0.005%, whereas the dynamic deformation was 0.01% with 1 Hz of frequency.
Tensile tests
The tensile tests for TPS and bionanocomposites were carried out using Insight 10 (MTS Company, Eden Prairie, Minnesota, USA) following ASTM D1708-93 standard, and the rate of deformation was 5 mm min−1. The thickness of the samples was determined using a micrometer, while the length and the width were the same in all cases (16 mm and 4.9 mm, respectively). Tensile strength, strain at break, and Young’s modulus (using the video extensometer) values were measured. For each test, a minimum of six samples were tested.
Results and discussion
Corn starch and TPS
FTIR spectroscopy
FTIR was used to analyze changes in the characteristic peaks of native corn starch because of the addition of plasticizers. The FTIR spectra of native corn starch and TPS films with different ratios of glycerol to water are shown in Figure 1. The corn starch has three characteristic peaks at 1147, 1076, and 991 cm−1. The first two peaks are ascribed to the stretching of C–O group of C–O–H, whereas the last peak is due to stretching of C–O group of C–O–C groups. 11,12 Other peaks that can be seen are at 1413 cm−1 due to the symmetrical deformation of –CH3, 13 at 1452 and 1641 cm−1 bending of methyl group and the O–H group of water, respectively. 13 The peak at 2927 cm−1 is characteristic of the stretching of C–H bond and the broad band that appears with maximum intensity at 3257 cm−1 is related with the hydroxyl group linked by hydrogen bonds. 13
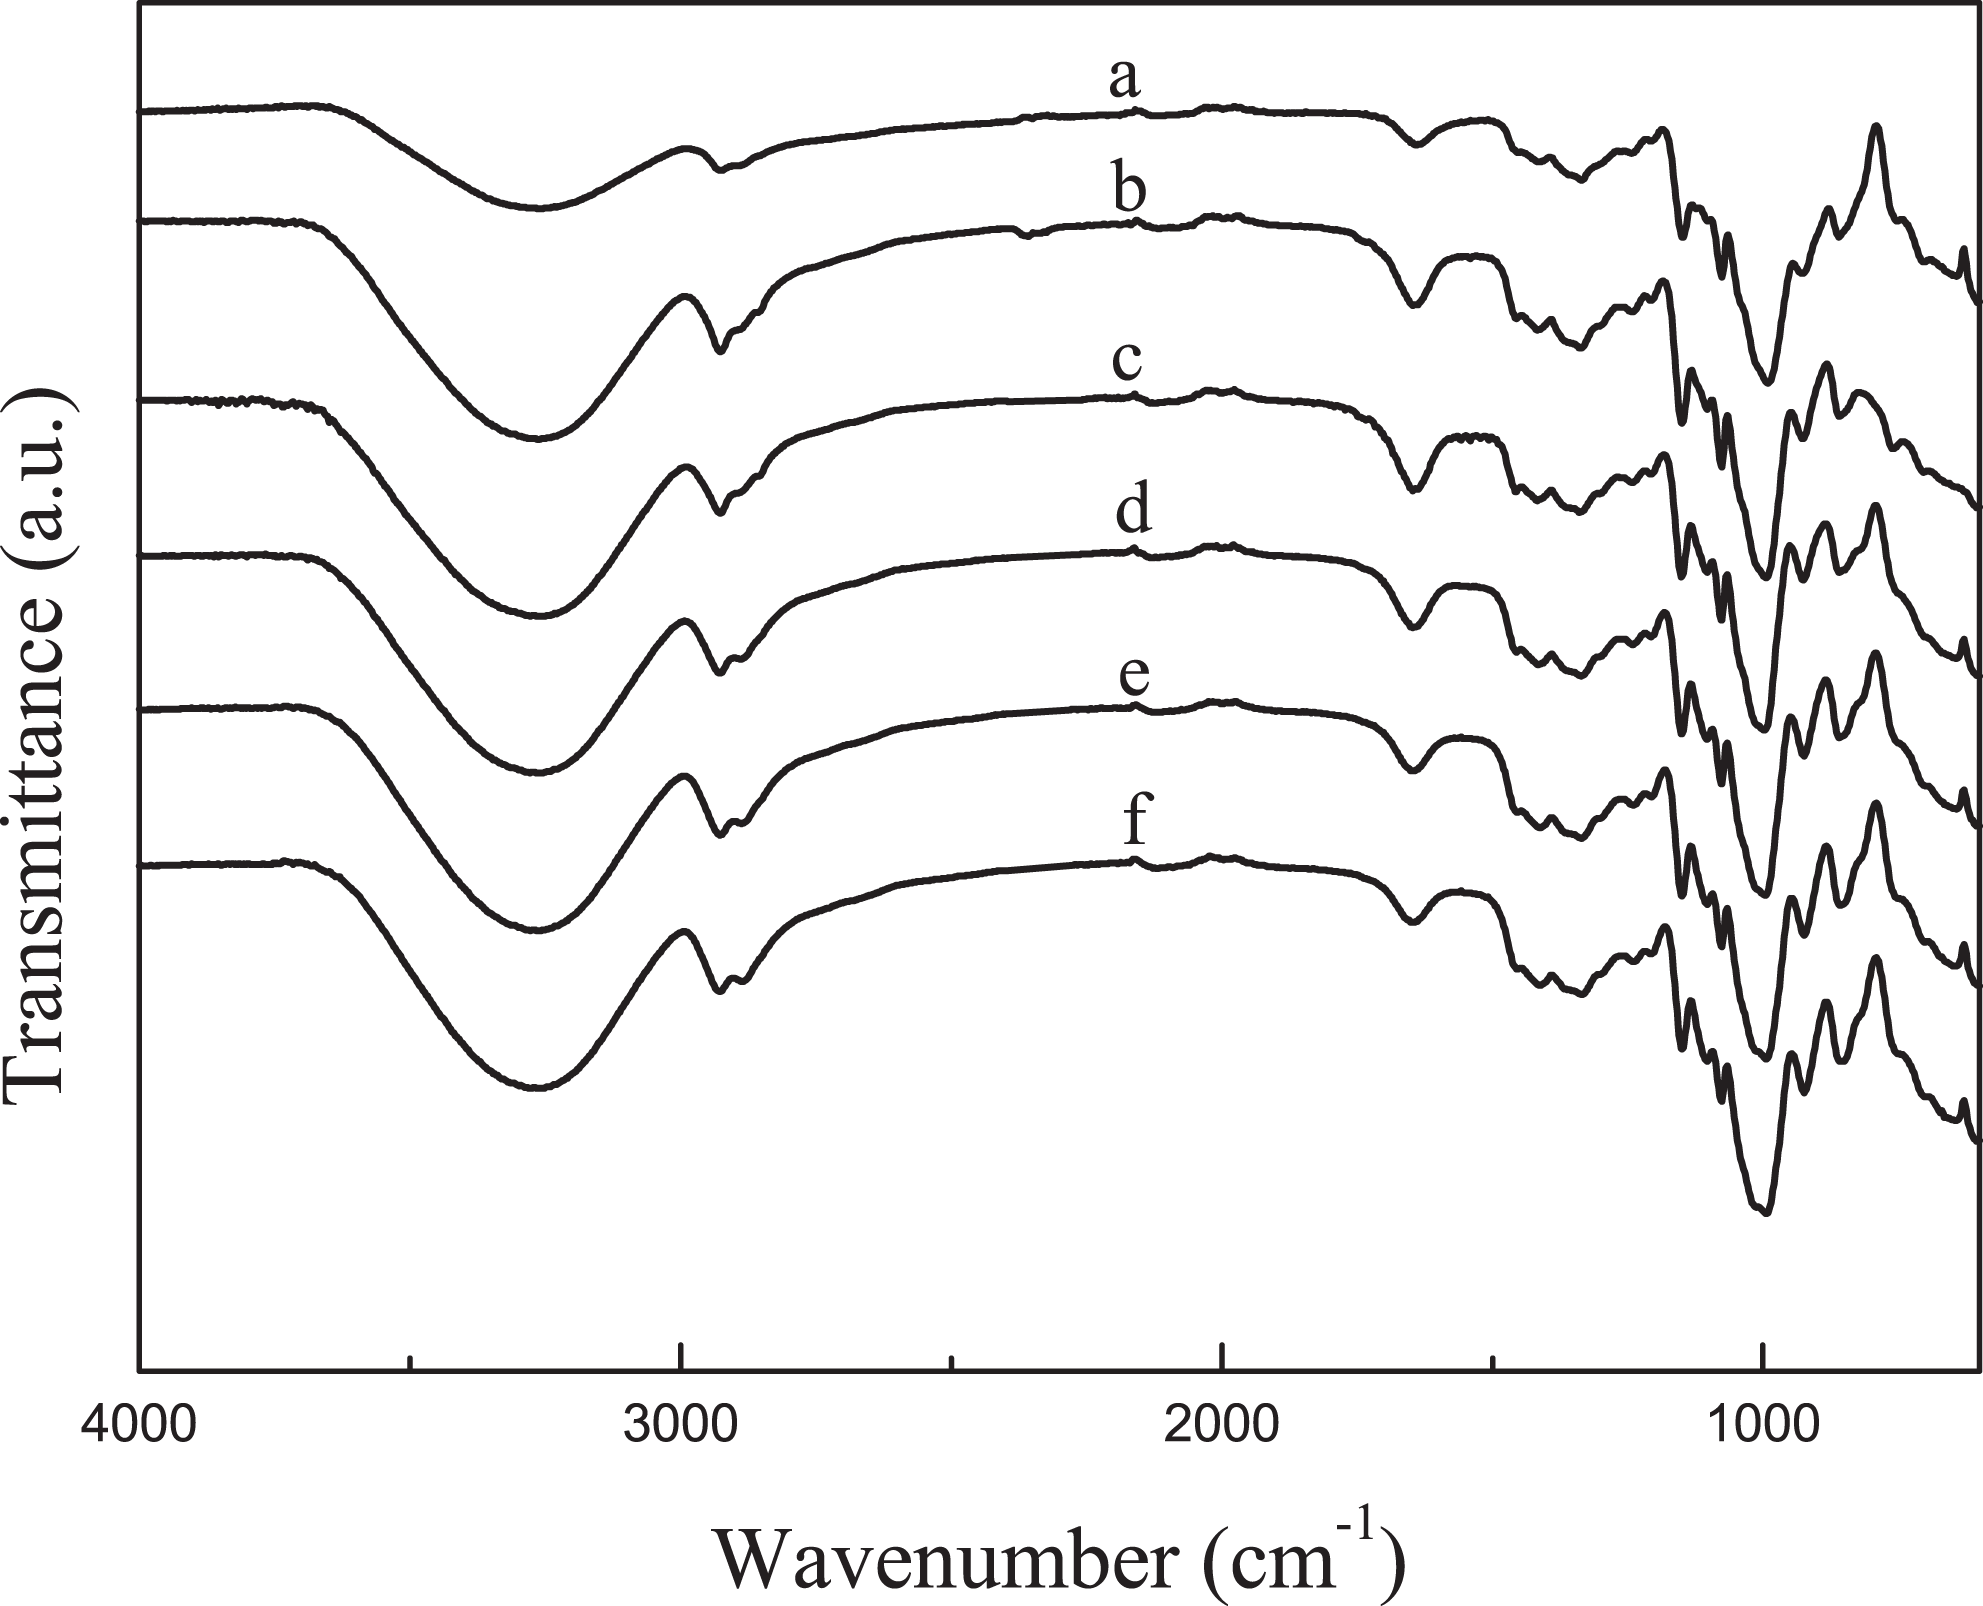
FTIR spectra of native corn starch and TPS blends with different ratios of glycerol to water. (a) Native corn starch, (b) 0.25, (c) 0.5, (d) 0.75, (e) 1, and (f) 1.5. FTIR: Fourier transform infrared; TPS: thermoplastic starch.
Small differences are observed in the FTIR spectra of the TPS films after adding the plasticizers. The three characteristic peaks of native corn starch shifted to higher wave numbers. This may be because glycerol can create new hydrogen bonds with C–OH and C–O–C groups of native corn starch, hence, the peaks appear at higher wave numbers. 12,13 On the other hand, the peak located at 3278 cm−1 turned out to be wider for the TPS films because there are a great number of hydroxyl groups, which come from water and glycerol. These hydroxyl groups could form many hydrogen bonds with native starch molecules.
Mechanical properties
Figure 2(a) to (c) shows the effect of the glycerol to water ratio on mechanical properties of TPS films. The obtained strength, modulus, and deformation at break values are similar to those reported in literature for TPS polymers. 14 –16 Tensile properties decreased with increasing the ratio of glycerol to water. Glycerol can create interactions with starch chains and weaken the hydrogen bonding interaction between starch molecules facilitating the slippage among starch molecules and consequently producing a material with a lower stiffness. The TPS film, which contains the glycerol to water ratio of 0.25, showed the best mechanical properties, so that the following results correspond to this TPS composition.
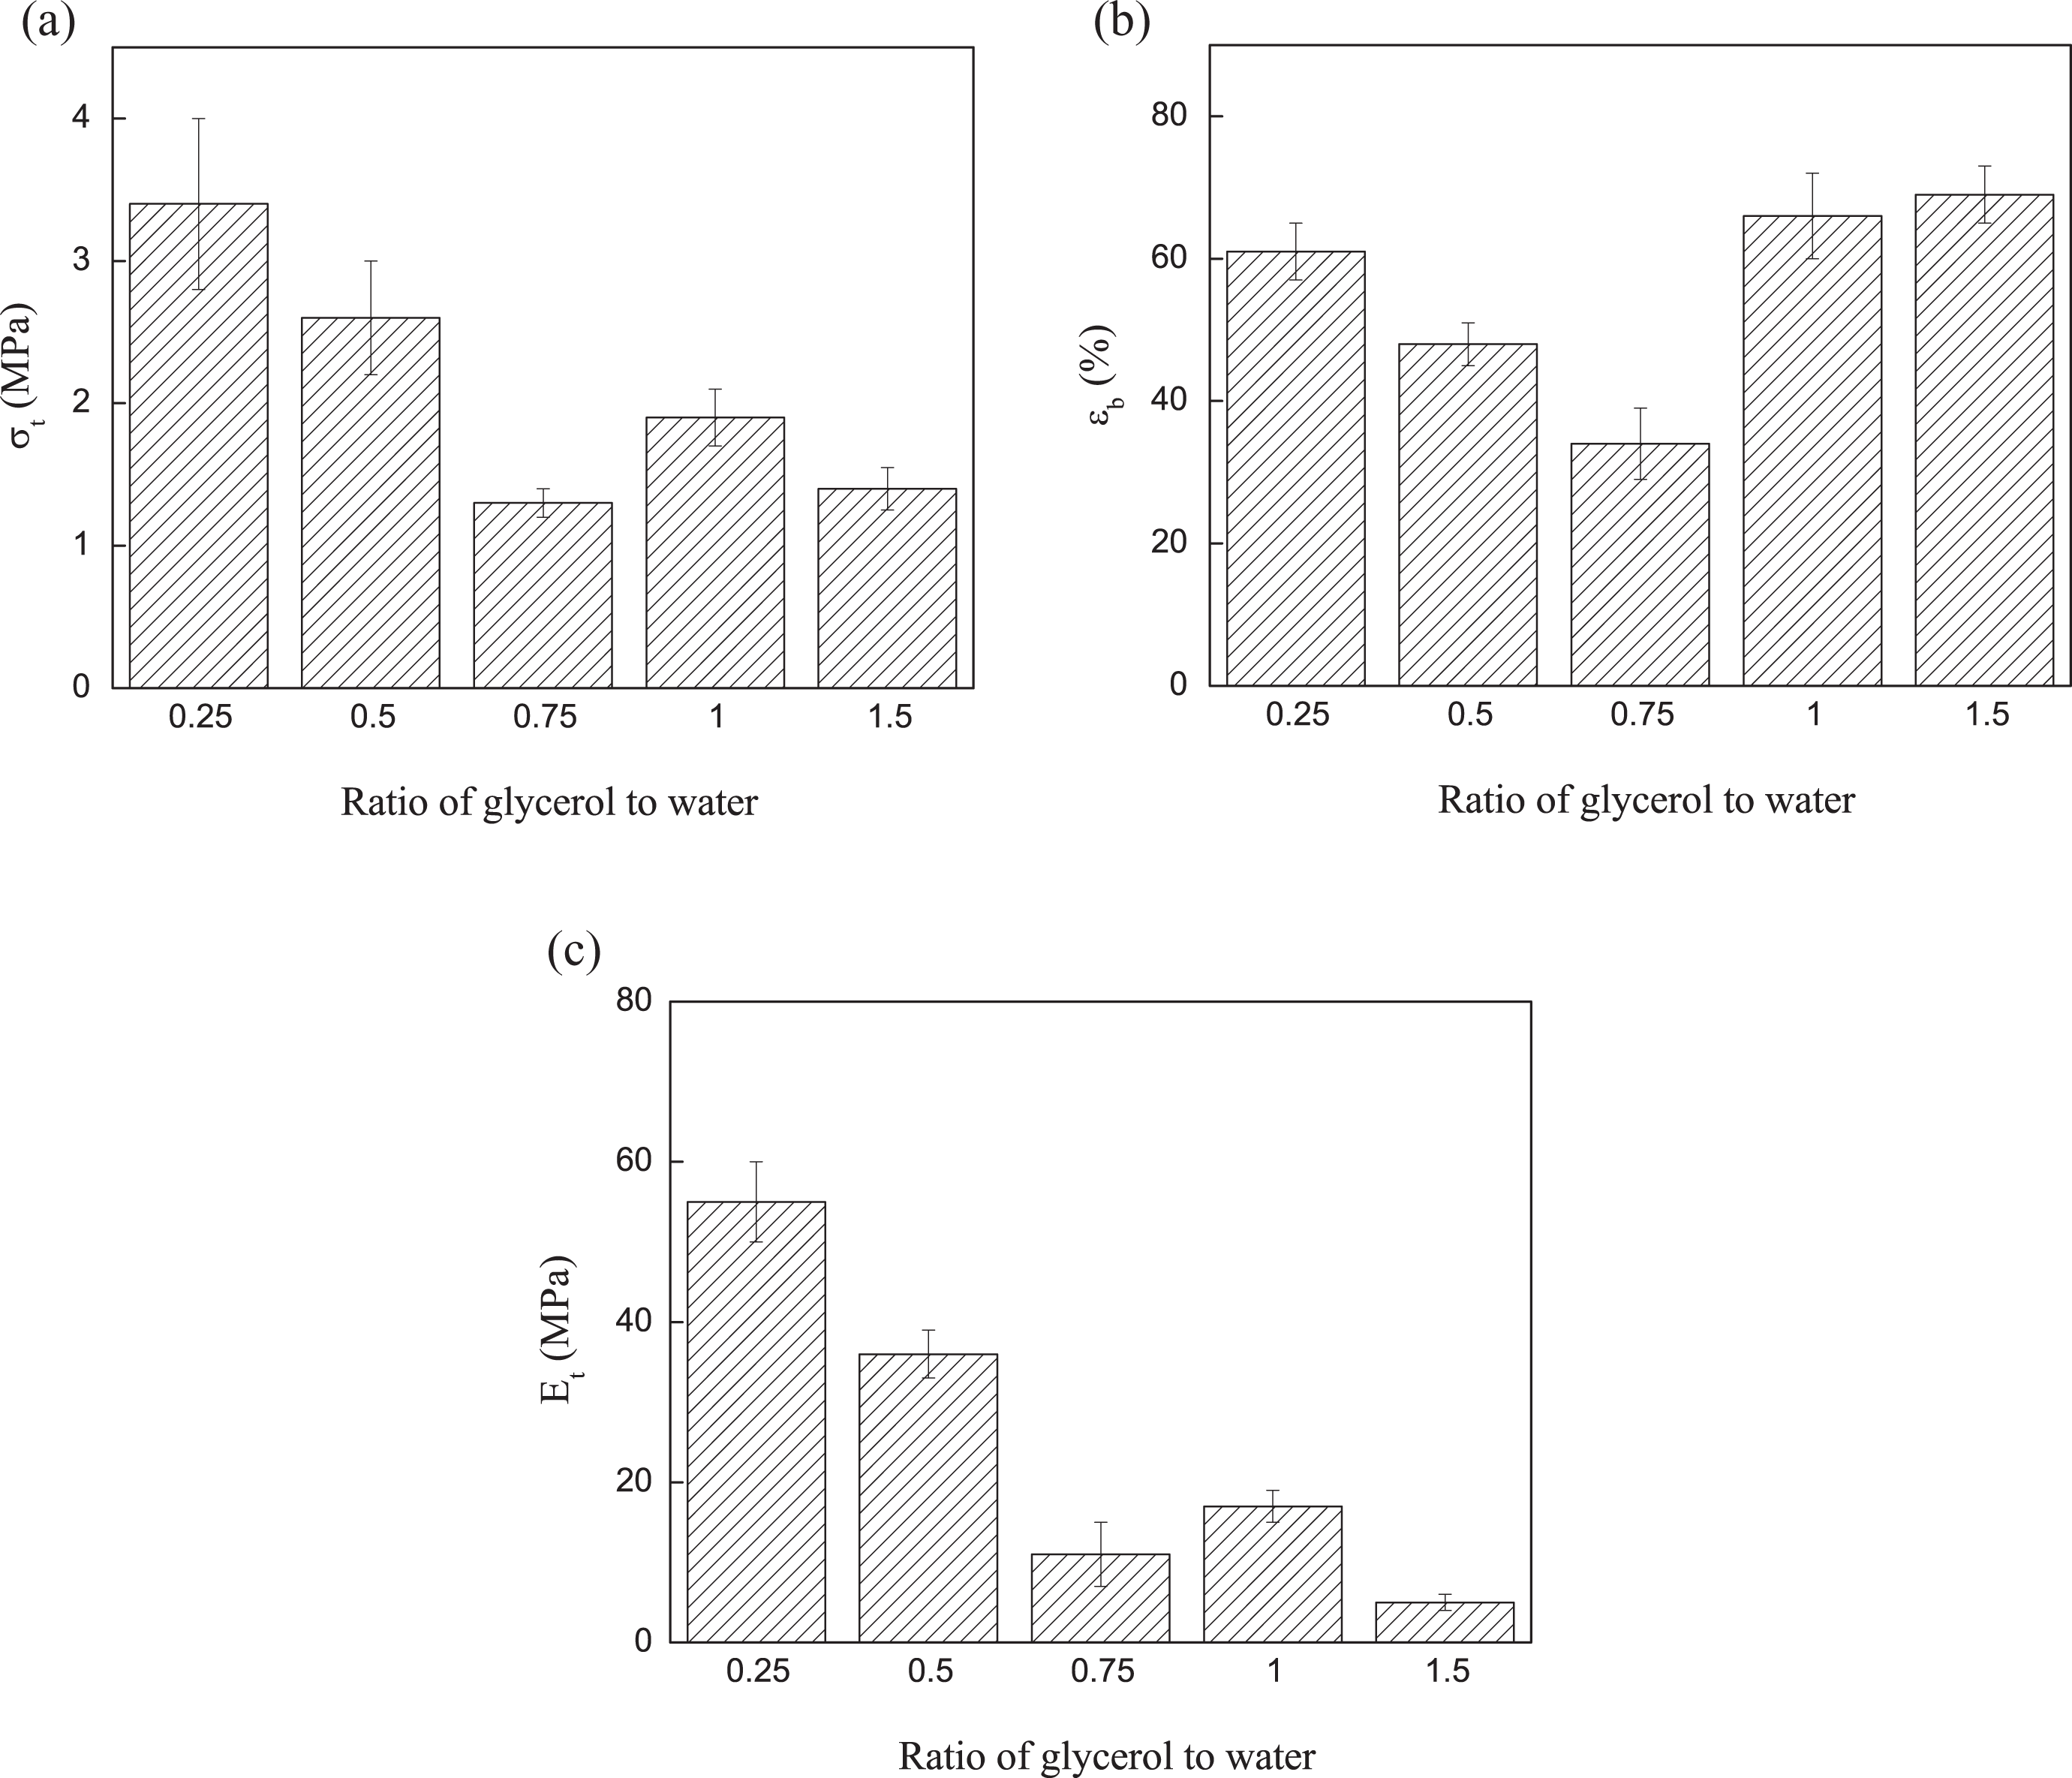
Mechanical properties of TPS films with different ratios of glycerol to water: (a) tensile strength, (b) deformation at break, and (c) Young’s modulus. TPS: thermoplastic starch.
TGA results
TGA and derivative TGA curves for native corn starch and TPS films are shown in Figure 3(a) and (b). Native corn starch shows the first weight loss (approximately 9%) between 40°C and 130°C, which is attributed to moisture. The second weight loss (275–360°C) is related to the degradation of native starch 17 –19 , and the maximum degradation temperature is around 324°C. For TPS, the first weight loss observed between 50°C and 240°C is more gradual. This behavior suggests that the plasticizers could form new interactions with starch molecules, which is in agreement with FTIR results. The maximum degradation temperature of TPS is located around 328°C and a shoulder at 275°C is observed, which could be attributed to the loss of glycerol since this weight loss is absent in native corn starch.
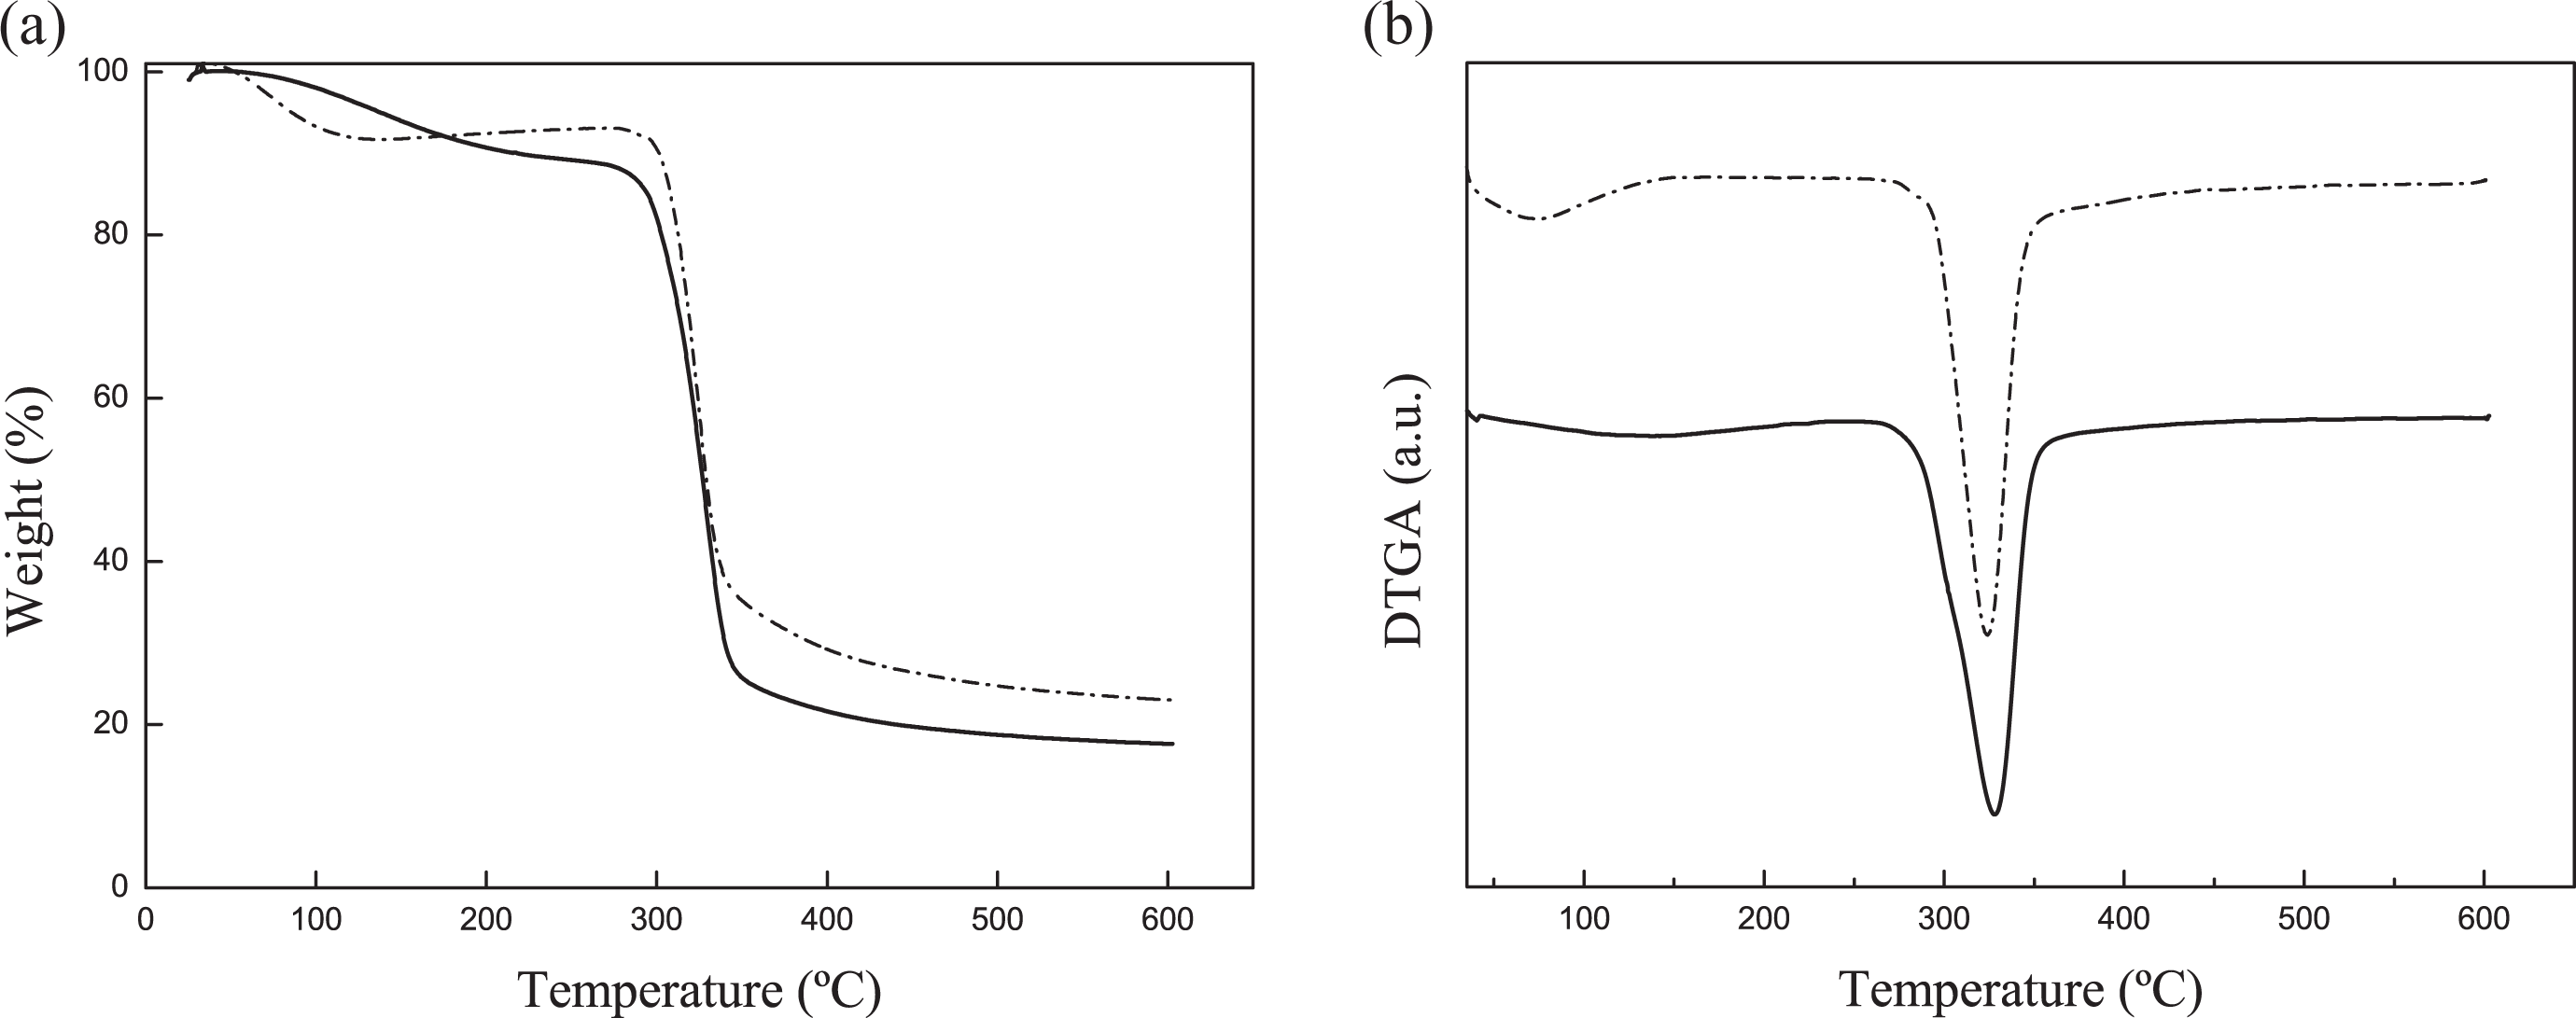
(a) TGA and (b) DTGA curves of native corn starch (dashed line) and TPS polymer with the glycerol to water ratio of 0.25(solid line). TGA: thermogravimetric analysis; DTGA: derivative thermogravimetric; TPS: thermoplastic starch.
Differential scanning calorimetry
Figure 4 shows thermograms of native corn starch and TPS polymer. Native corn starch shows a broad endothermic peak, which begins at room temperature and ends around at 135°C. For native corn starch, Mano et al. 13 mentioned that this peak can vary depending on the amount of water contained in the sample. The endothermic peak could be attributed to the evaporation of surface water and the gelatinization of native corn starch. Taking into account the sample weight and the moisture of the native corn starch measured by TGA, the heat necessary for the evaporation of moisture has been calculated. The heat necessary for the evaporation of surface water is 192 J g−1, and the integral value of the peak calculated by DSC is 205 J g−1, so the difference of 13 J g−1 may be due to the enthalpy of gelatinization. In the literature, 20 –22 it can be found that the heat required for gelatinized 1 g of native corn starch varies between 10 J and 17 J. Beyond 155°C, small endothermic peaks in native corn starch could be observed. Liu et al. 23 also observed an endothermic peak at 155°C for corn starches with different amylose/amylopectin contents and they related this endothermic peak with the melting of amylose. Zhong and Susan Sun 24 investigated the thermal behavior of corn starch with different water contents. For corn starch with 11.9% moisture content, small endothermic peaks at 182 and 192°C related to the melting of corn starch crystals and amylose–lipid complexes, respectively, were observed. For TPS, the heat necessary for the evaporation of water calculated is 183 J g−1 and the integral value calculated by DSC is 185 J g−1, so it is ensured that the peak is corresponding to the evaporation of water since the native corn starch was gelatinized during the process. This means that the crystalline area existing within native starch granules was broken by the addition of plasticizers as well as by the temperature and the force exerted by the rotors in the mixing process. 2 Therefore, DSC results confirmed that the TPS has become amorphous. In the literature, some authors located the glass transition temperature (Tg) of native corn starch around 55–65°C. 25,26 In Figure 4, it is not possible to determine the Tg accurately because in this range of temperature, surface water evaporated and the native corn starch was gelatinized. For corn starch with different water contents, by DSC, Zhong and Susan Sun 24 observed that the Tg increases from the first to second scan about 40°C, exactly from 60°C to 100°C, suggesting that higher Tg in the second scan could be attributed to lower water content in the amorphous water–starch–lipid phase. Tg of TPS is difficult to determine using DSC analysis, because the heat capacity change is quite low at the Tg. 27 As shown in Figure 4, it is not possible to determine the Tg due to the evaporation of water. In the literature, 28,29 it is seen that the Tg values vary from 60°C to 90°C.
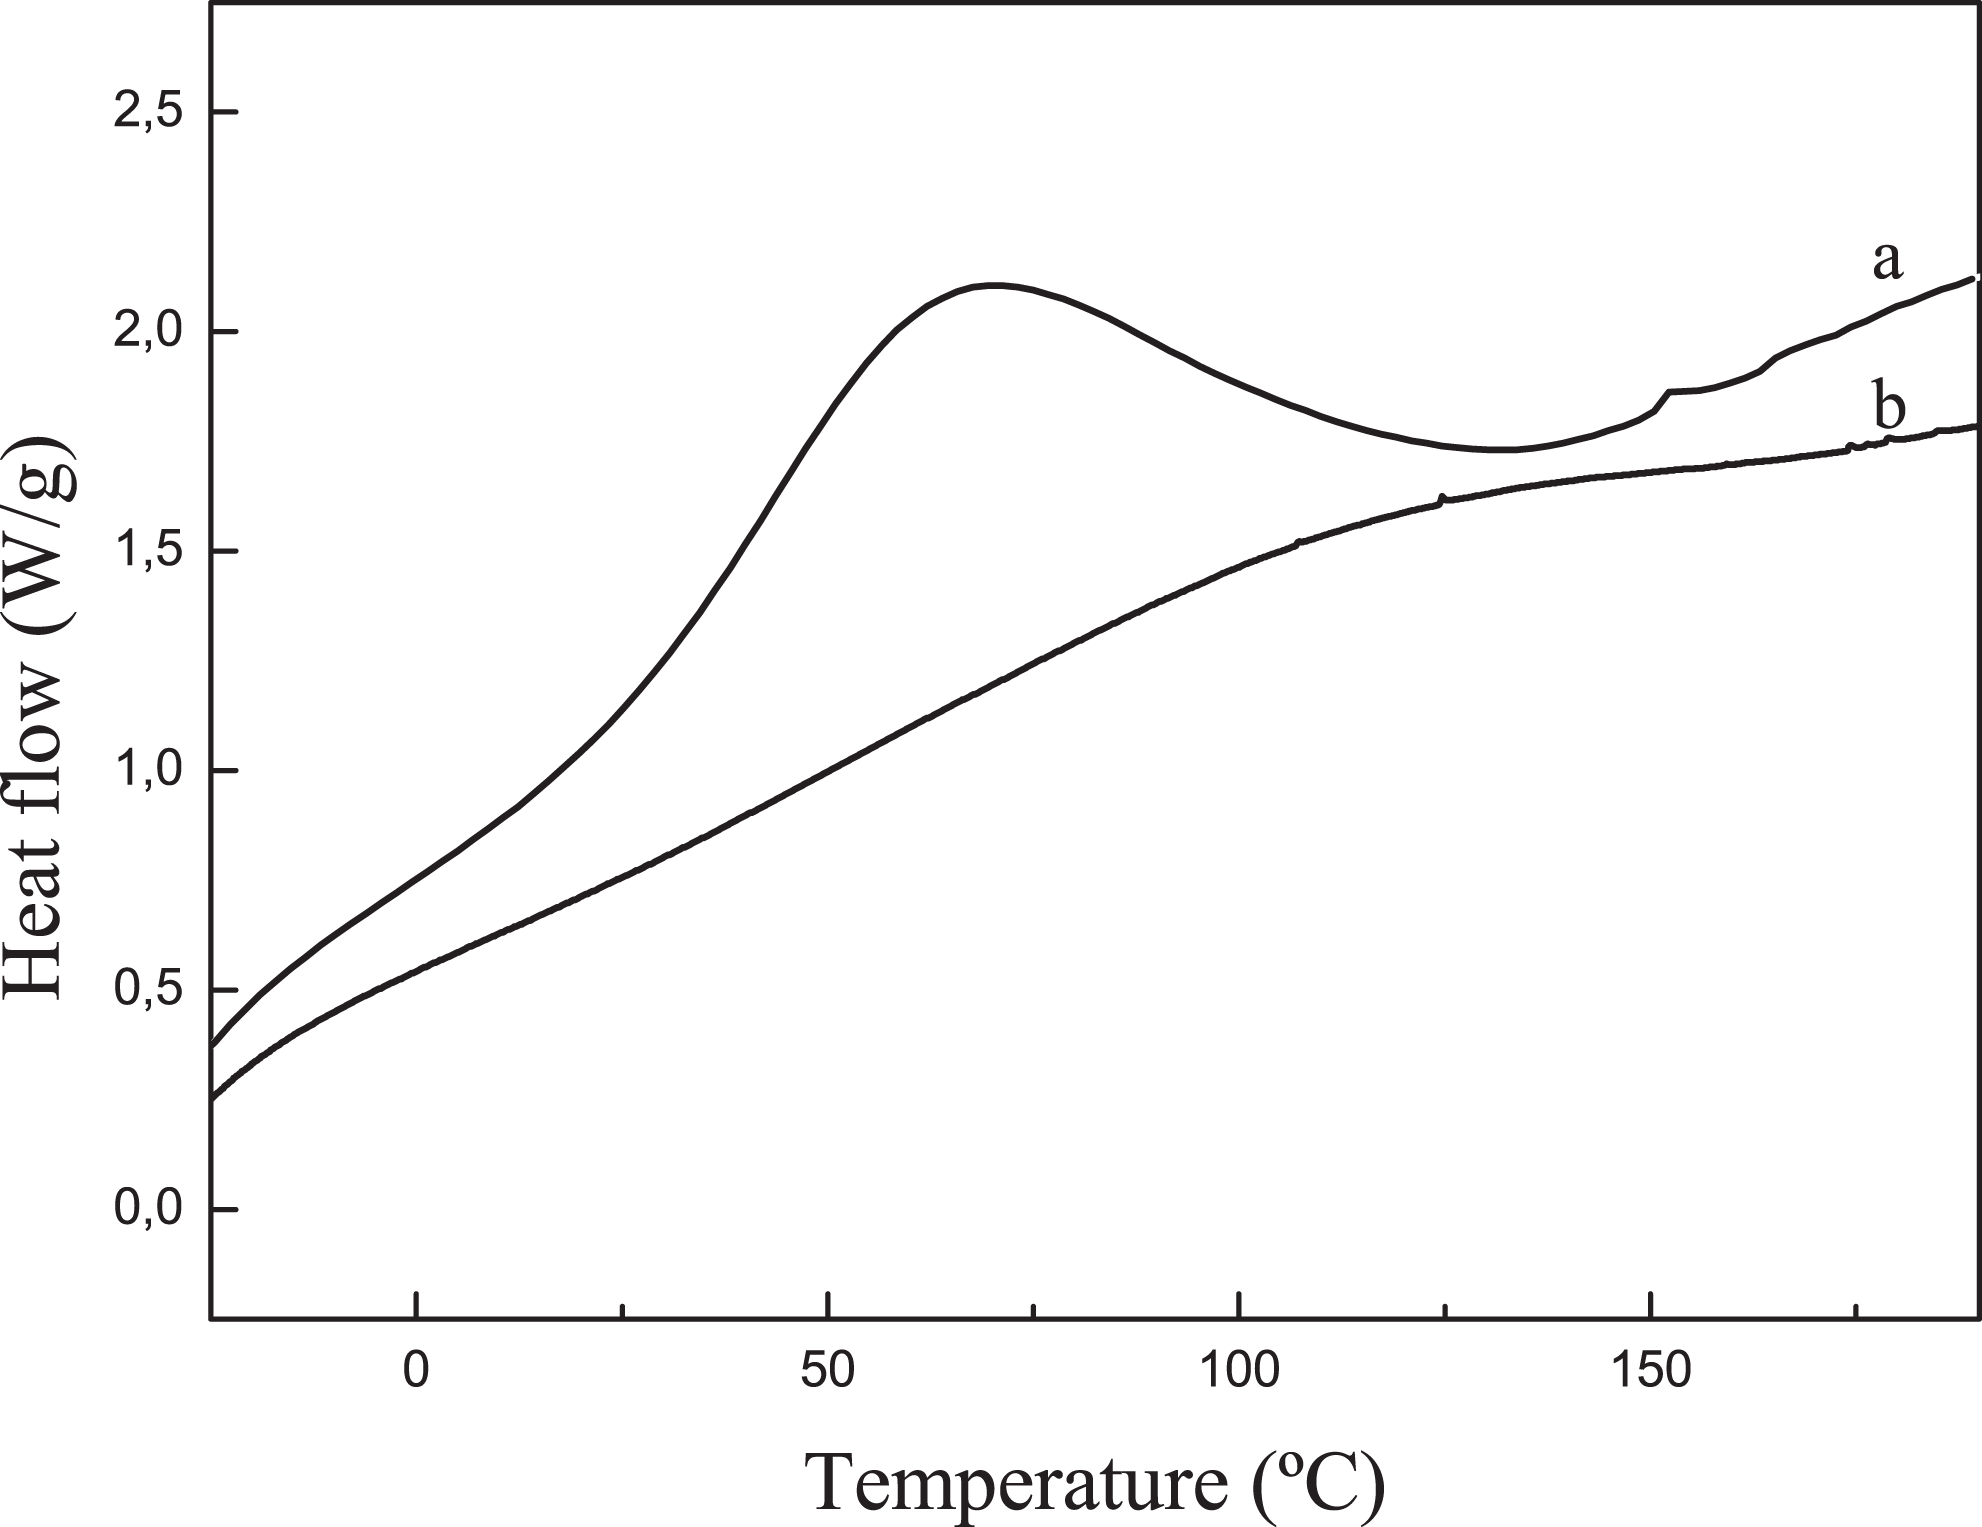
DSC thermograms of native corn starch and TPS films. (a) Native corn starch and (b) TPS polymer with the glycerol to water ratio 0.25. DSC: differential scanning calorimetry; TPS: thermoplastic starch.
X-Ray diffraction
XRD patterns of native corn starch and TPS polymer are shown in Figure 5. The native corn starch exhibited the typical A-type X-ray diffractogram with peak at 2θ values near 15°, 18°, and 23°. Girones et al., 14 Martins et al. 18 , and Corradini et al. 30 observed similar peaks for the native corn starch in their studies. Native corn starch crystals should be destroyed under the effect of plasticizer, shear, or temperature, and the peaks of TPS were abating or disappear. XRD peaks of TPS were not disappeared suggesting that it was not totally amorphous. However, there are some important changes in the structure of the starch after processing. B-type (2θ = 17.1°) and V-type (2θ = 13.1° and 20.1°) crystallinity in XRD patterns of TPS were observed. Corradini et al. 30 observed that TPS aged above its Tg crystallized into the B-type and V-type crystal structures. The V-type crystalline structure can be divided into two subtypes, namely Va (anhydrous) with peaks at 13.2° and 20.6° and Vh (hydrated) with peaks at 12.6° and 19.4°. Girones et al. 14 observed similar changes for natural fiber-reinforced TPS composites by melt processing. Also, Corradini et al. 30 observed similar peaks for TPS/zein blends. One reason for TPS being not totally amorphous and hence categorized under A-type crystallinity may be caused due to the retrogradation of TPS plasticized with glycerol. Ma and Yu, 31 Yu et al., 32 and Ma et al. 33 studied the effect of retrogradation on TPS blends plasticized with different plasticizers and conditions. They observed that there are some plasticizers that avoid the retrogradation, but TPS plasticized with glycerol cannot avoid the retrogradation. Therefore, the crystallinity, which presents the TPS, may be due to the retrogradation because it has been a long time since the films were made until their characterization by XRD.
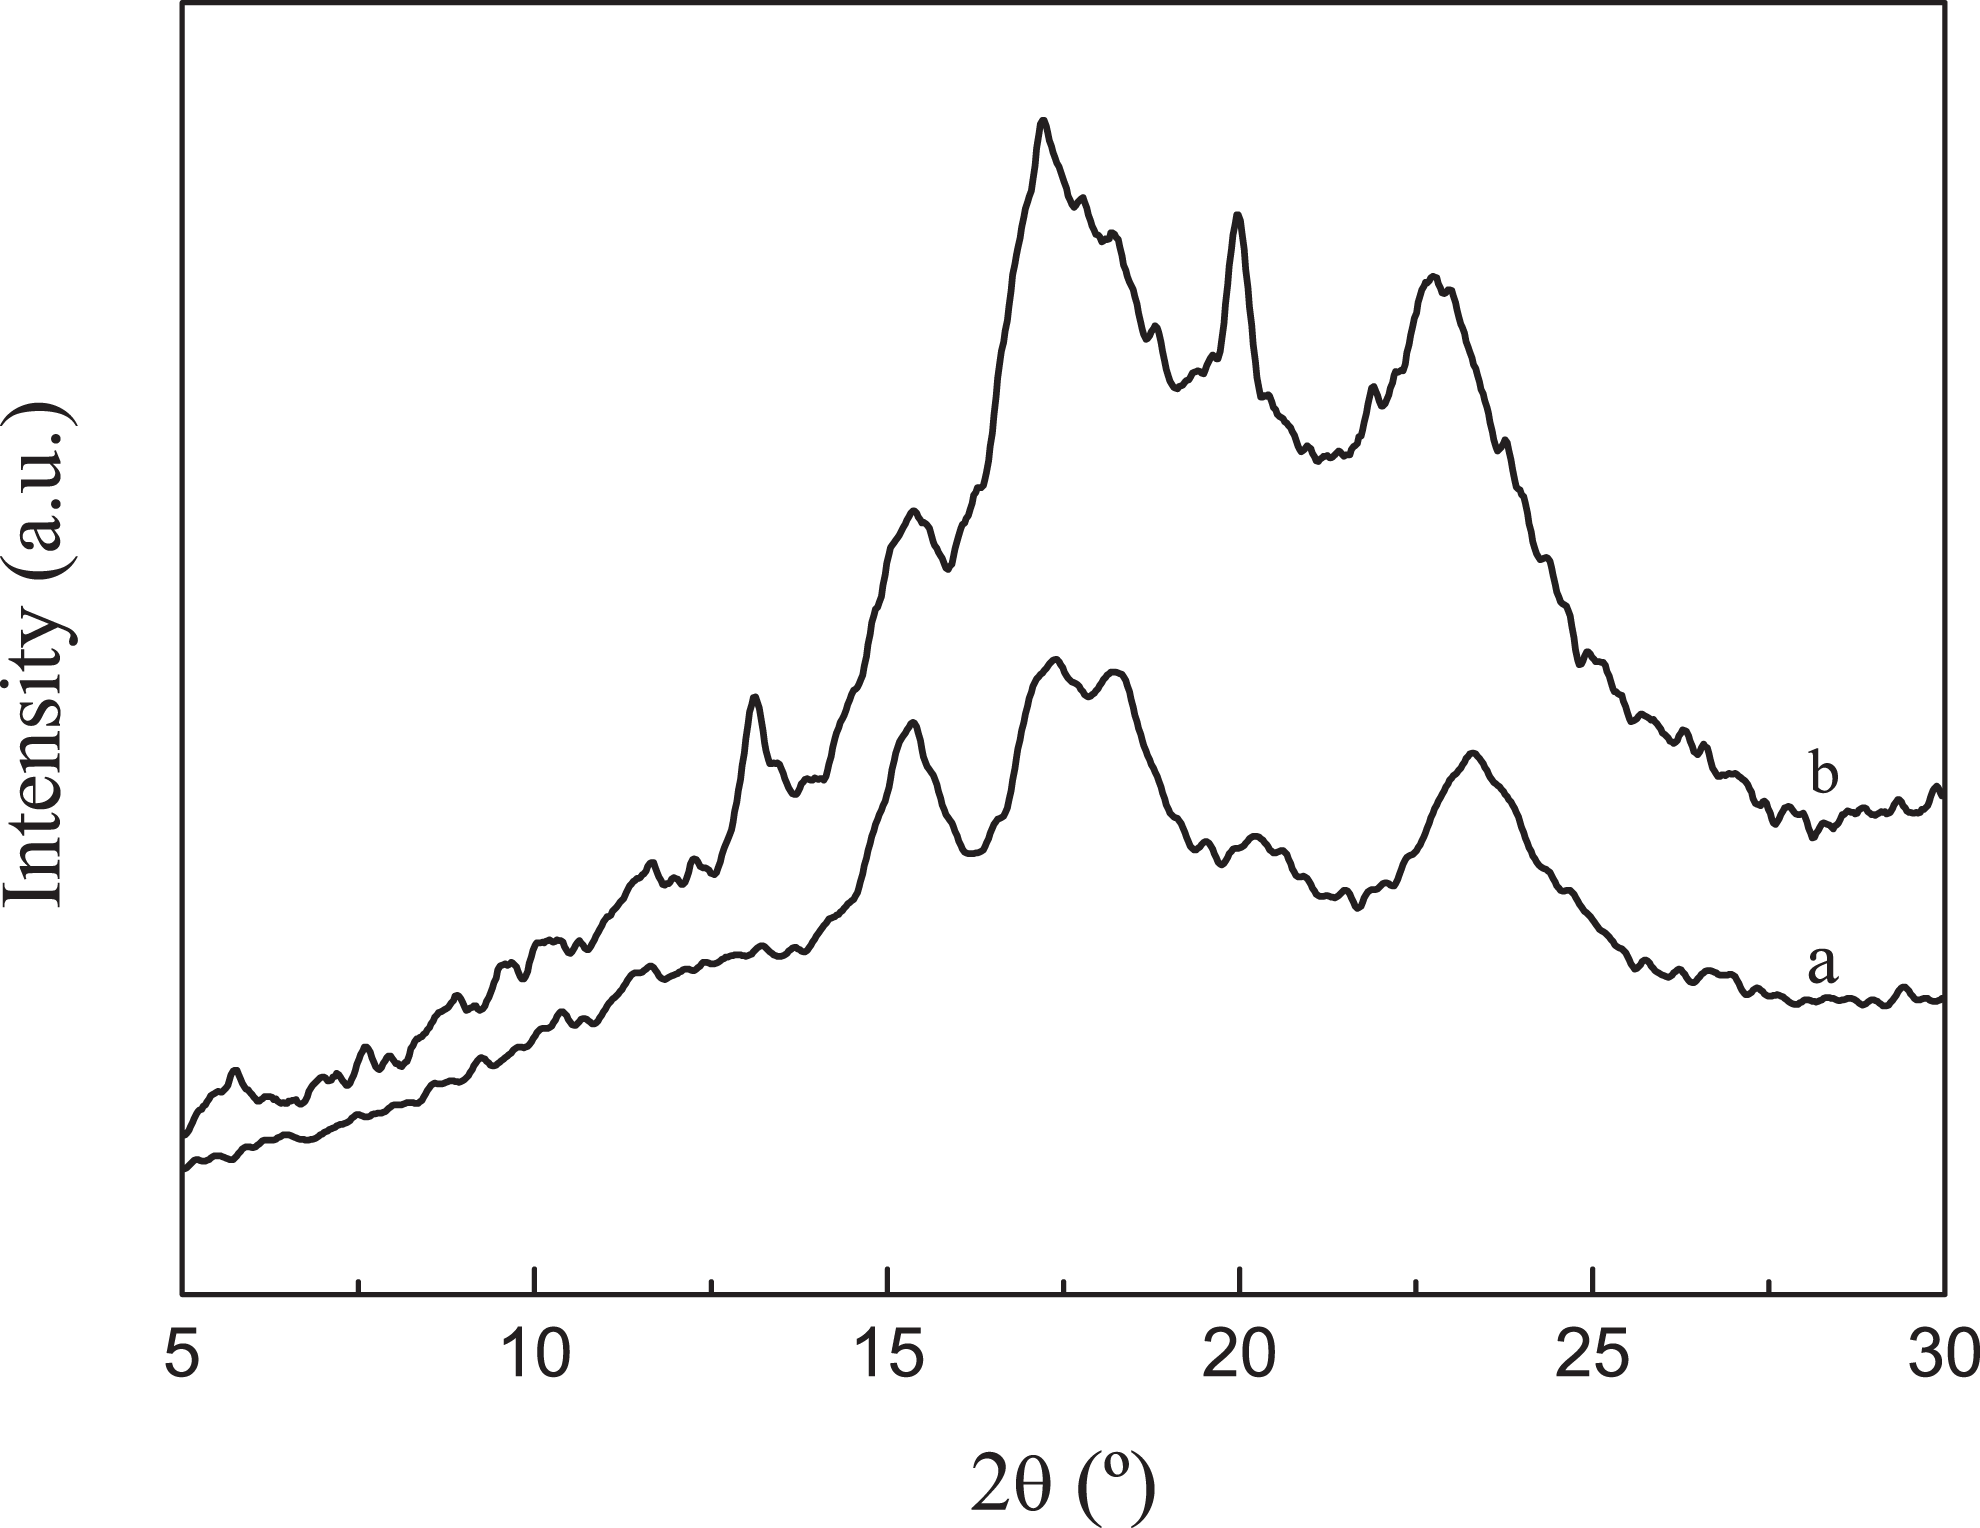
XRD patterns of (a) native corn starch and (b) TPS polymer with the glycerol to water ratio of 0.25. XRD: x-ray diffraction; TPS: thermoplastic starch.
Polarized OM
OM images of native corn starch and TPS polymer are shown in Figure 6(a) and (b). The granules of native corn starch are spherical and have an average diameter of 10.5 μm, which is in the range of 7–15 μm observed in the literature. 34 Native corn starch is birefringent, which means that it is able to split an incident beam of light into two beams perpendicularly polarized to each other as if the material has two different refractive indices. Observing by polarized light, it can appreciate the Maltesse cross structure inside the native corn starch granules which indicates some crystallinity; similar images were obtained in the study by Chaudhary et al. 35 OM image of TPS (Figure 6(b)) shows that the native corn starch has been gelatinized because of the addition of plasticizers and the processing conditions. However, there are significant differences in light intensity that can be attributed to the heterogeneity due to the rich and poor zones in starch. 18
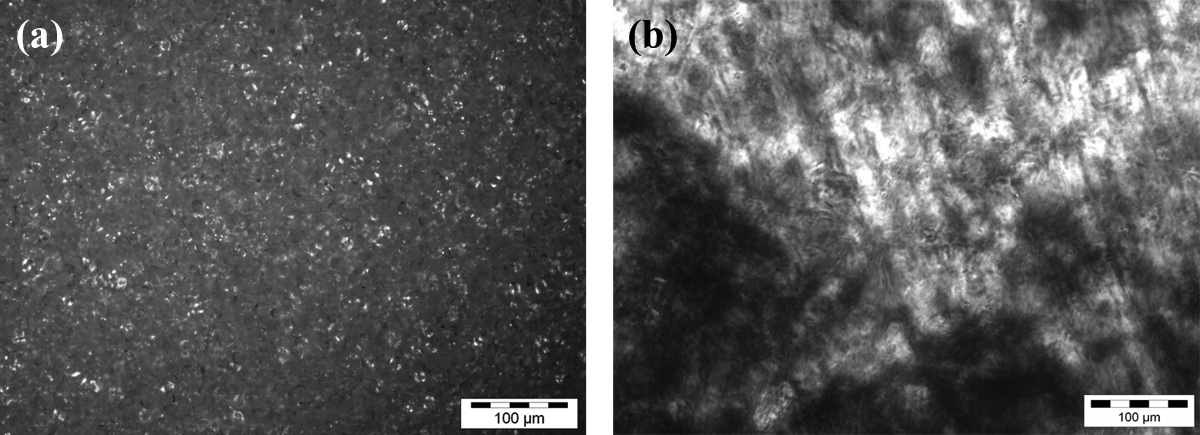
Images of corn starch native and TPS polymer with the glycerol to water ratio of 0.25: (a) corn starch with polarized light (×200) and (b) TPS polymer with the glycerol to water ratio of 0.25 with polarized light (×200). TPS: thermoplastic starch.
Bionanocomposites
Cellulose nanofibers isolated by chemical methods from sisal fibers have been used as reinforcement for TPS matrix. 10 Figure 7(a) and (b) shows the OM and atomic force microscopy phase images, respectively, for cellulose fibers. Cellulose nanofibers are 20–50 nm in diameter and several micrometers in length; however, in the optical image, the presence of cellulose fibers are observed indicating that after successive treatments some fibers still maintained their structure. 10 OM image shows some microsized fibers indicating heterogeneous size distribution. Figure 8(a) to (c) shows the tensile properties of bionanocomposites based on TPS. Tensile strength and Young’s modulus values increased up to a maximum of 0.5 wt% of cellulose nanofiber content. Beyond this nanofiber content, a reduction in tensile strength and elastic modulus values were observed. The reduction in tensile properties could be due to agglomerations or poor dispersion of the cellulose nanofibers in the matrix. Similar observations were made by Savadekar and Mhaske 36 for cellulose nanofiber-reinforced TPS nanocomposites. They observed that tensile strength increased with an increase in the cellulose nanofiber content, showing a maximum around 0.4 wt%, beyond which tensile strength decreased. They suggested that the drop in tensile strength could be due to heterogeneous size distribution and agglomerations of cellulose nanofibers within the TPS matrix. They also studied the fracture surface of the nanocomposites, and they observed that there was a strong adhesion between the fibers and TPS to a ratio of 0.4 wt% as well as a good dispersion of the fibers in the matrix. However, for the composite with 1 wt% of nanofibers, the dispersion of the reinforcement was very poor, forming agglomerations where the specimen could break. Teixeira et al. 16 studied cellulose nanofibers reinforced thermoplastic cassava starch nanocomposites plasticized with a mixture of glycerol/sorbitol. They observed that the elastic modulus increased when 5 wt% of cellulose nanofibrils were added. However, for 10 and 20 wt% of cellulose nanofibrils content, a significant decrease in the elastic modulus was observed, suggesting that plasticizers could hinder the stress transfer at the nanofibril/matrix interface, probably because the transcrystallization phenomenon of starch chains. Fracture surface of tensile specimens for cellulose nanofiber-reinforced TPS nanocomposites is shown in Figure 9(a) and (b). SEM micrograph of nanocomposite shows a fracture surface where cellulose fibers cannot be distinguished from the matrix. No fibers pull out or debonding was observed indicating good fiber–matrix adhesion. Although fibers are not distinguished clearly, some agglomerations seem to observe from SEM images (see arrows) where the specimen could break. The final mechanical performance of nanocomposite is a function of matrix properties and fiber/matrix adhesion among other parameters. If the amount of glycerol would be reduced in bionanocomposites, then the strength and modulus of TPS matrix will increase. Besides, the interactions between starch molecules and cellulose nanofibers could become much stronger and probably the nanofiber/matrix adhesion would improve but perhaps bionanocomposite will become very brittle. Actually, TPS without glycerol was processed in the internal mixer, but it was impossible to cut tensile specimens because the film obtained was too brittle.
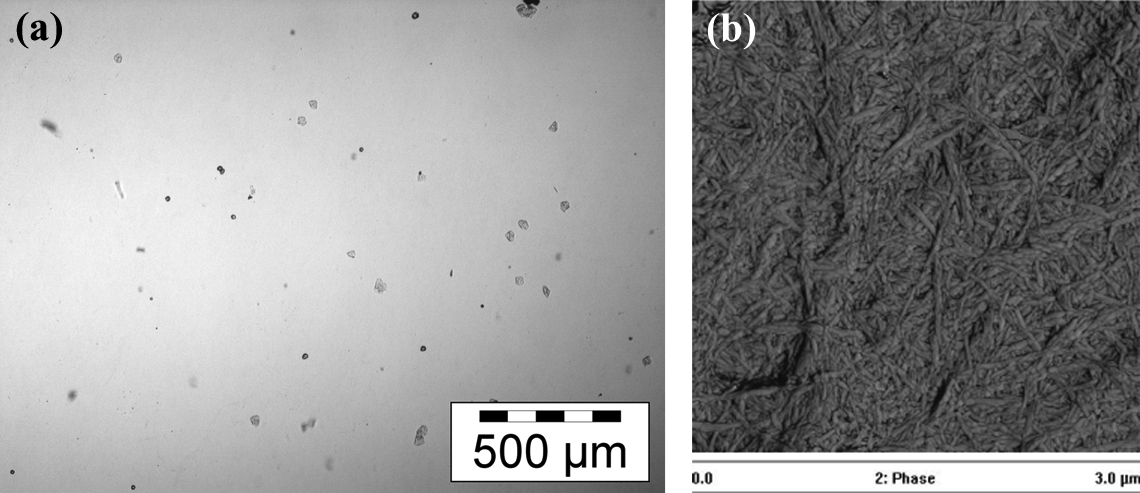
(a) OM image and (b) AFM phase image of cellulose nanofibers. OM: optical microscopy; AFM: atomic force microscopy.
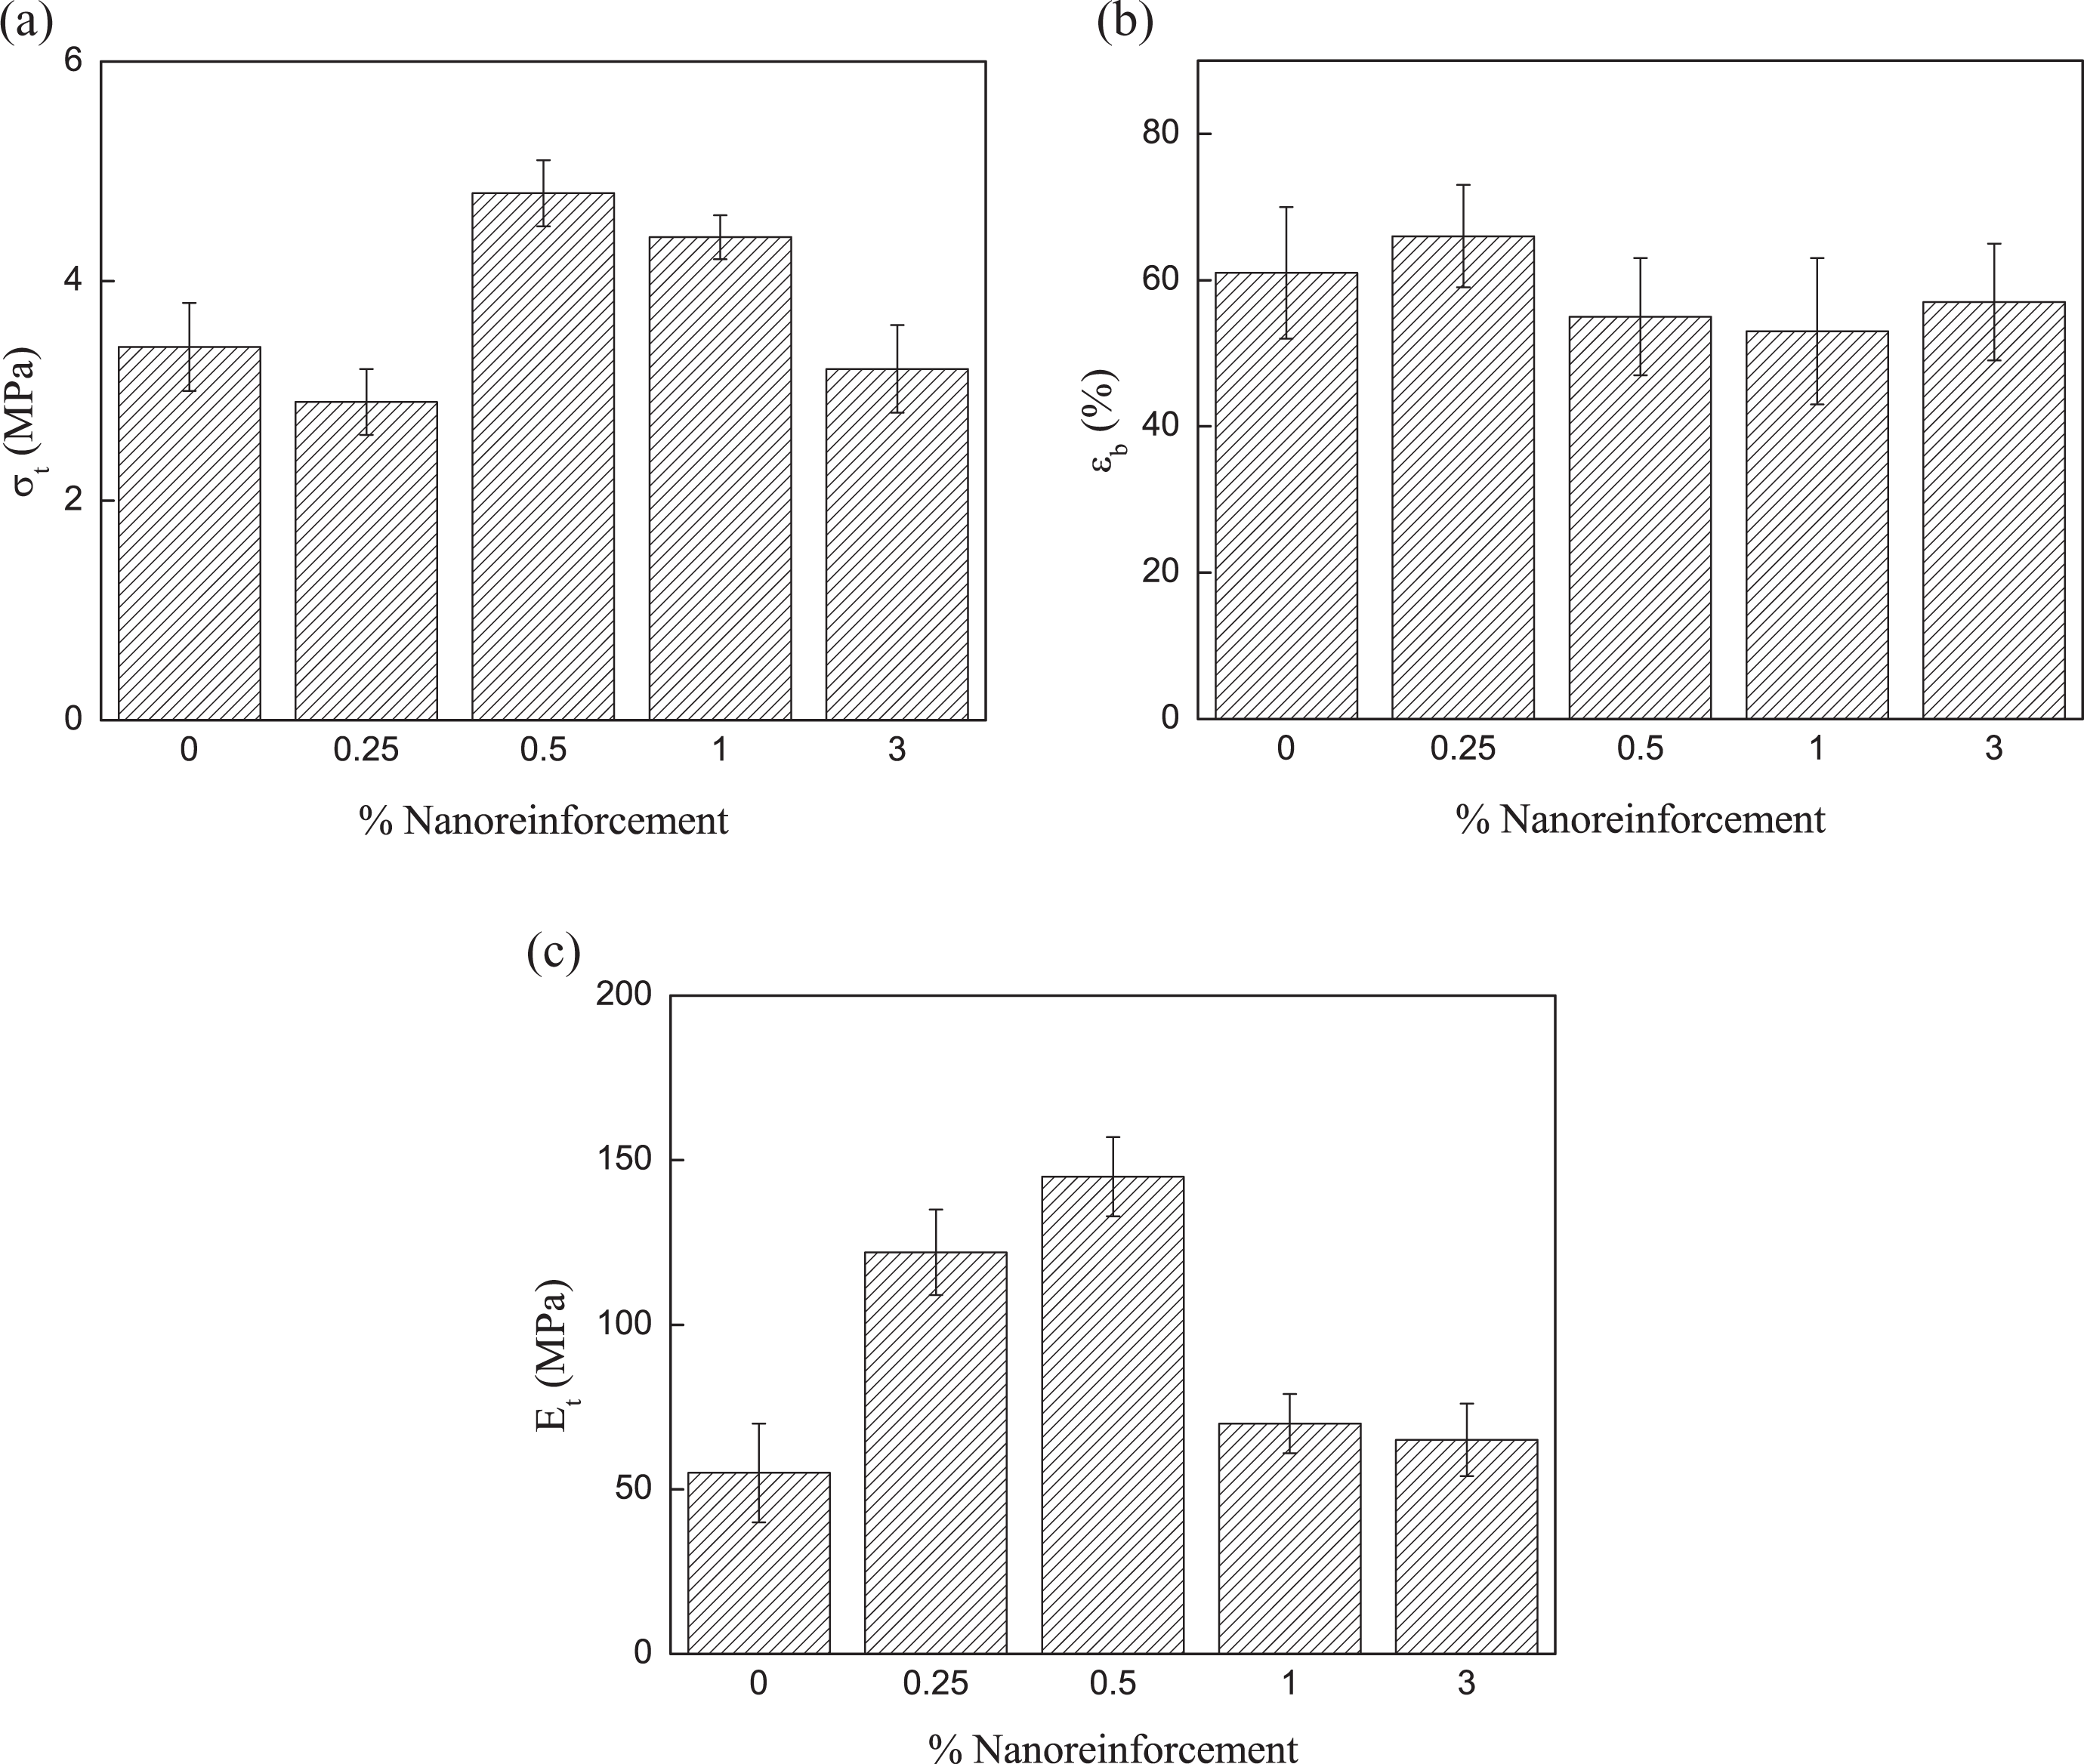
Tensile properties of bionanocomposites based on TPS polymer with the glycerol to water ratio of 0.25: (a) tensile strength, (b) deformation at break, and (c) Young’s modulus. TPS: thermoplastic starch.
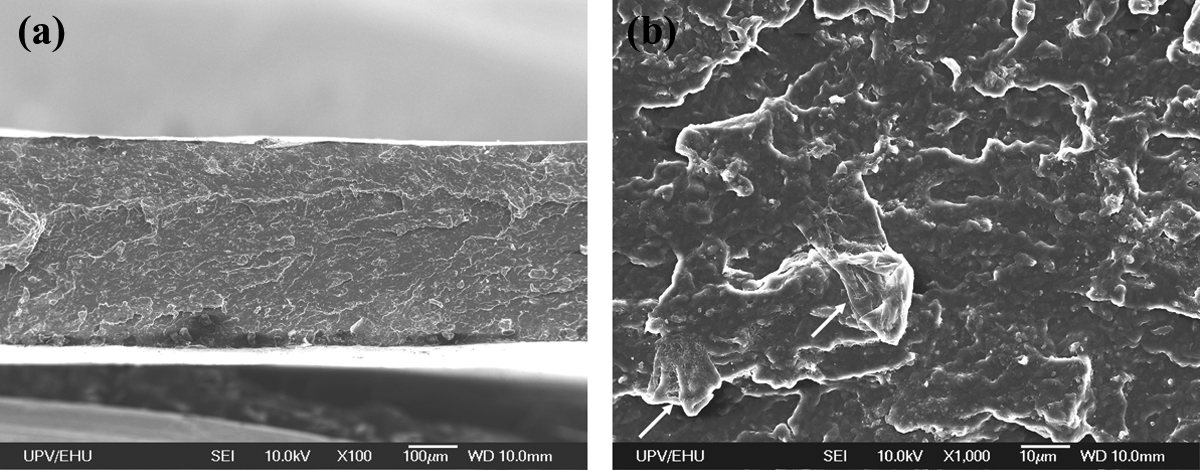
SEM images of fracture surfaces of bionanocomposite with 3 wt% cellulose nanofibers in two different magnifications: (a) ×100 and (b) ×1000. SEM: scanning electron microscopy.
Figure 10(a) and (b) shows the effect of nanofibers addition on the dynamical mechanical properties. TPS polymer shows biphasic behavior, presenting two different transitions in tan δ curves. The first one, appearing at −55°C, corresponds to the phase rich in glycerol; meanwhile, the second transition, which is located at 35°C, is assigned to the phase rich in starch. 27 In the temperature range between 50°C and 150°C, there is an increase in modulus values because material becomes stiffer by the evaporation of water. For the bionanocomposites (Figure 10(b)), there is an increase in E′ values when cellulose nanofibers are added in the TPS matrix, evidencing an increase in the stiffness provided by the reinforcing nanofibers. In tan δ curve, the transition corresponding to the phase rich in starch occurred at higher temperatures in the reinforced materials rather than in TPS matrix. This behavior can result from a decrease in the mobility of the starch, which is in agreement with previous studies. 14,18,37 Girones et al. 14 observed similar peaks in values of tan δ for the TPS reinforced with different amounts of hemp. For bionanocomposites based on TPS and cellulose nanofibrils, Teixeira et al. 16 observed the biphasic behavior and transition temperatures; the results of the present work are similar to those results obtained by them.
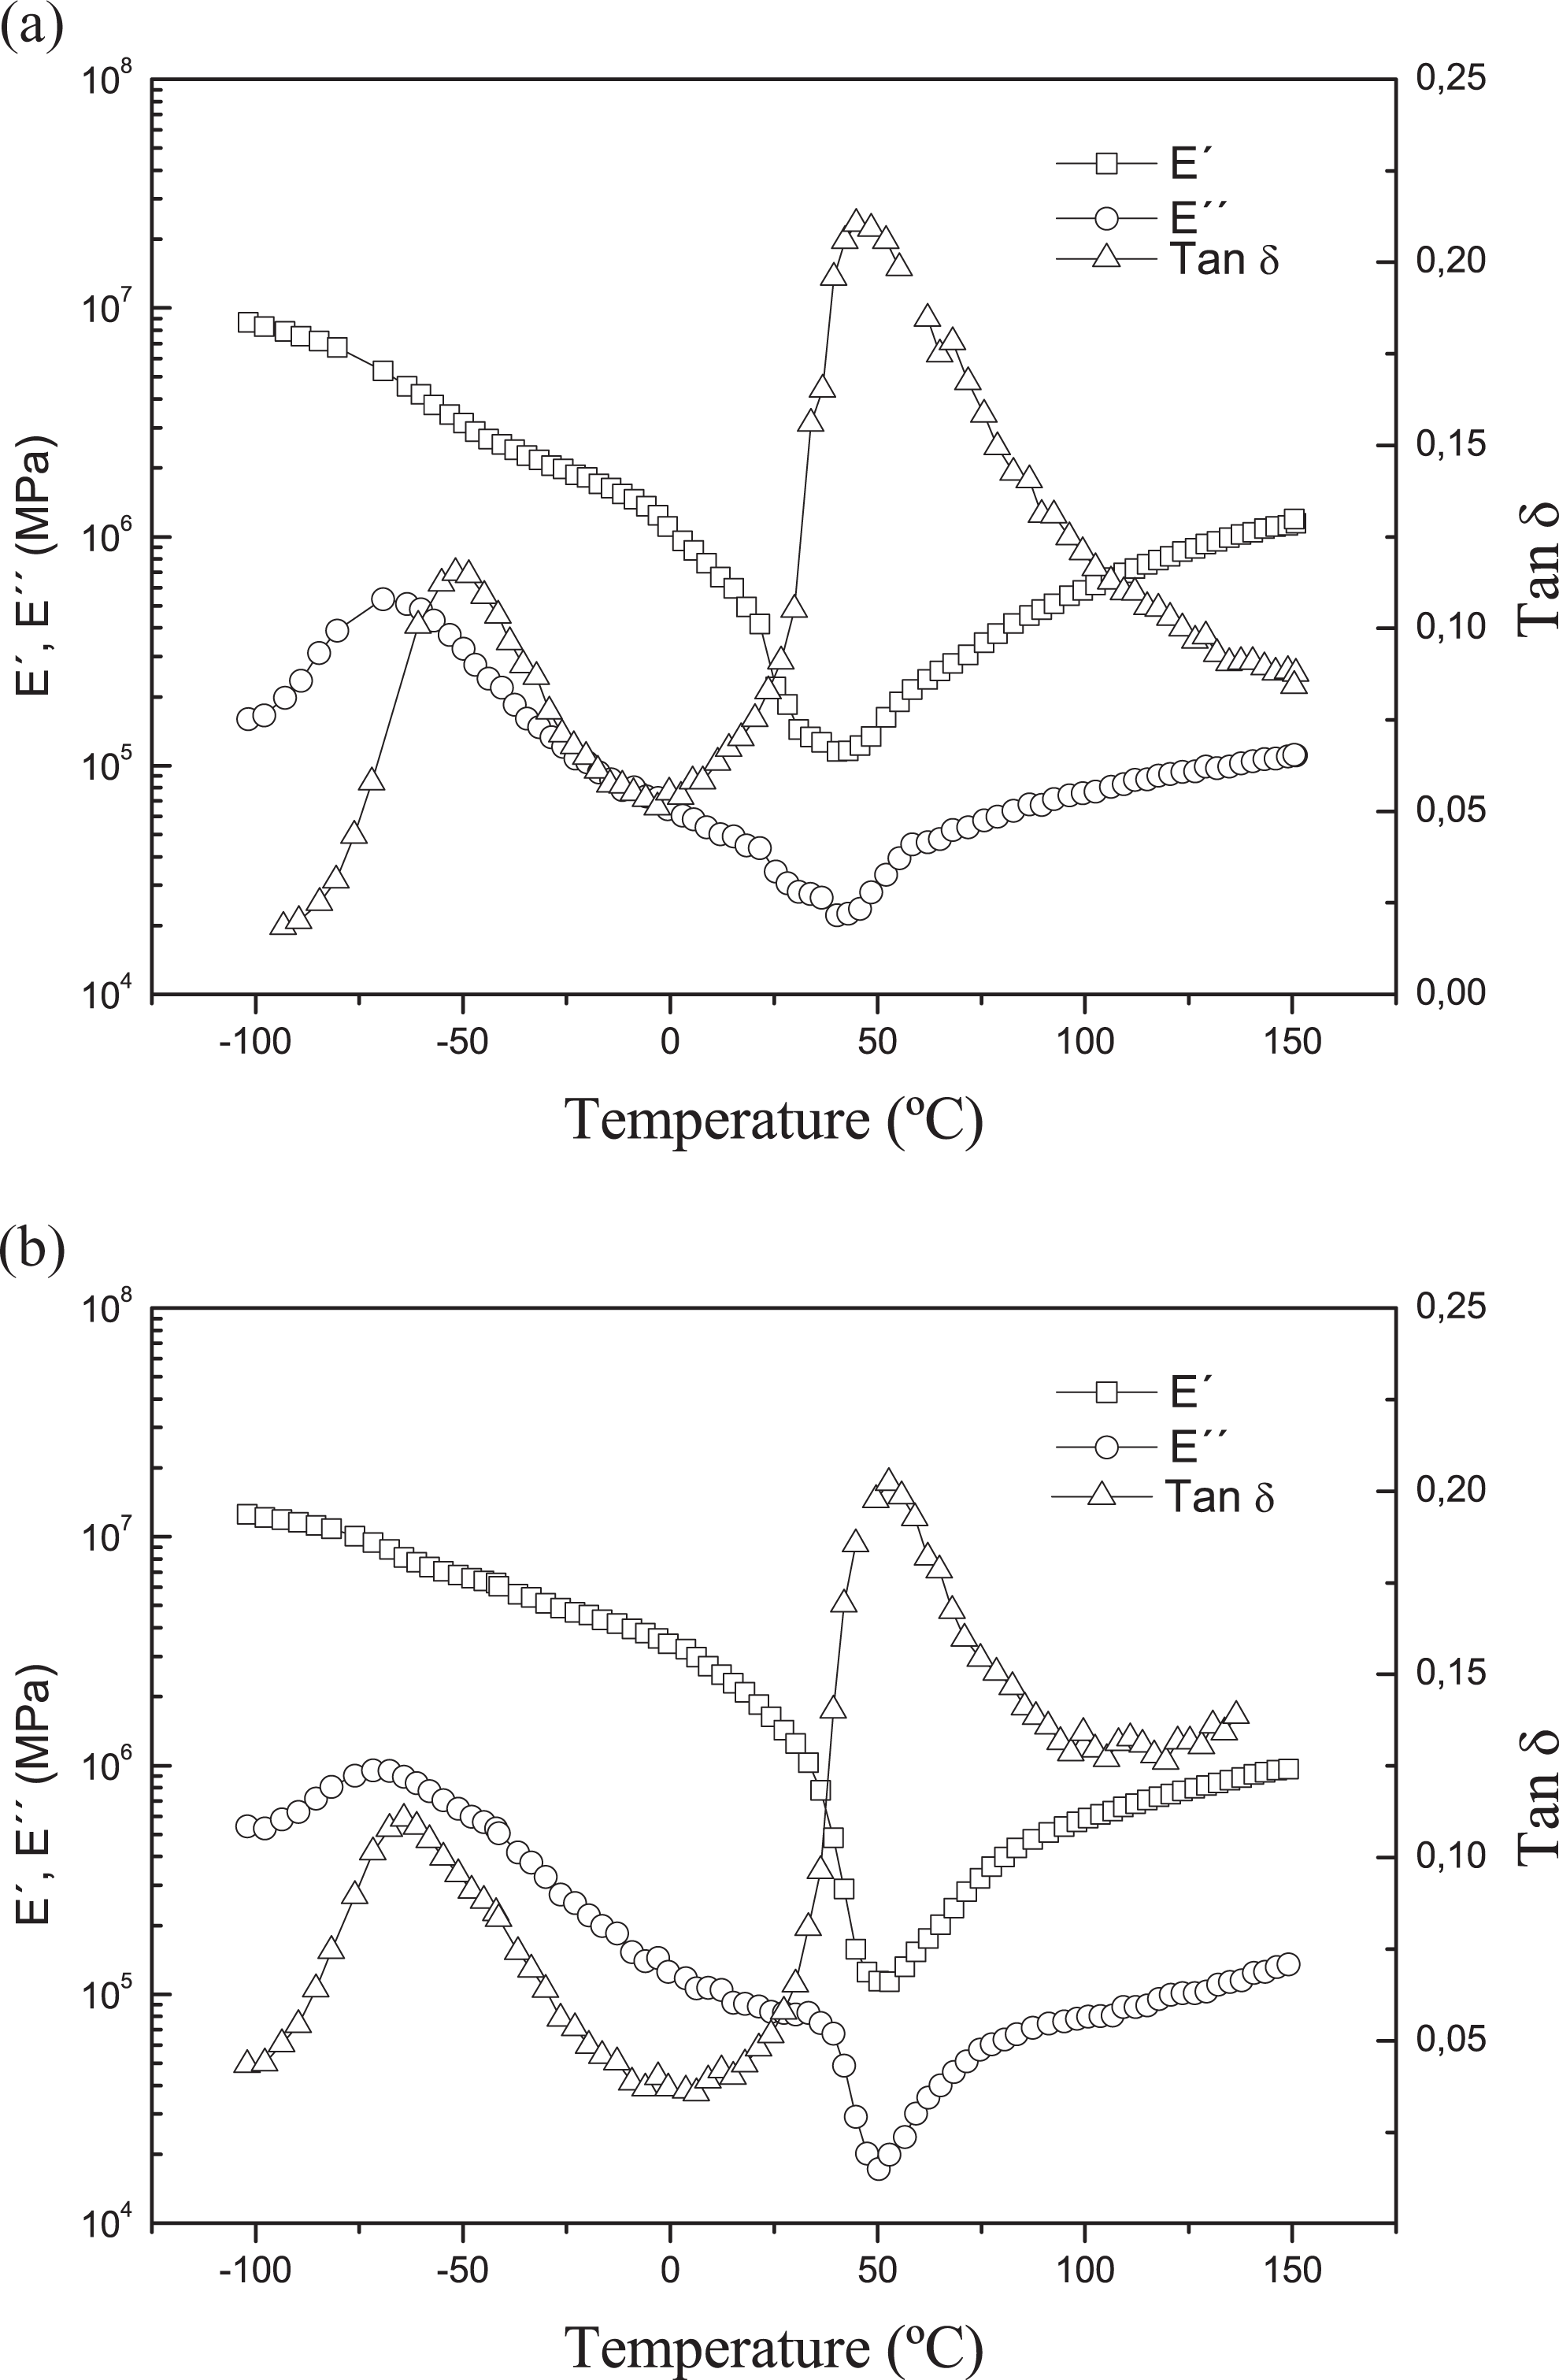
Effect of nanofiber addition on the dynamic mechanical properties: (a) TPS polymer with the glycerol to water ratio of 0.25 and (b) bionanocomposite with 0.5 wt% cellulose nanofiber. TPS: thermoplastic starch.
Conclusions
Using different techniques, such as OM and the DSC, and with the help of plasticizers (water and glycerol) and appropriate processing conditions (90°C for 40 min at 100 revolutions per minute), TPS has been prepared. For developing TPS with good mechanical properties, bionanocomposites with certain amount of water, either to gelatinize the starch granules or to disperse the nanofibers of cellulose, have been incorporated. Tensile properties decreased with increasing the glycerol content. A small amount of glycerol was required to plasticize the starch. TPS composition with the best mechanical property was observed for 60 g starch with glycerol to water ratio of 0.25. The addition of cellulose nanofibers to TPS matrix improved the mechanical properties. Maximum improvement was observed when 0.5 wt% of nanofibers of cellulose was added to TPS matrix. At higher nanofiber contents, the dispersion of reinforcements in the matrix seems not to be good enough and agglomerations could be generated where film starts to break.
Footnotes
Acknowledgements
The authors gratefully acknowledge SGIker (UPV/EHU, MINECO, GV/EJ, ERDF, and ESF) Macrobehaviour-Mesostructure-Nanotechnologie for providing technical and human support and carrying out SEM analysis.
Declaration of Conflicting Interests
The author(s) declared no potential conflicts of interest with respect to the research, authorship, and/or publication of this article.
Funding
The author(s) disclosed receipt of the following financial support for the research, authorship, and/or publication of this article: The present work was financially supported from the Basque Country Government in the frame of Consolidated Groups (IT-776-13).