Abstract
A novel type of silica namely black sand (BS) with silane coupling agent was chosen as reinforcing filler in butyl rubber (IIR). BS was obtained from the beach area of Rosetta in Egypt. The filler was characterized by Fourier-transform infrared (FTIR), X-ray diffraction (XRD), and transmission electron microscope (TEM). The XRD analysis showed that BS is composed mainly of Albite (Sodium Aluminium Silicate) up to 64% approximately. Novel nanocomposites were prepared via a two-roll mill by incorporating different concentrations of BS nanoparticles (5,10, 15, 20,30 and 40 phr) in IIR. The effects of filler loading on shape factor, curing characteristics, and mechanical and dynamic properties of IIR vulcanizates were investigated. The modulus of IIR vulcanizates was used to predict the shape factor of BS aggregation in the polymer. The data indicated that cure time decreased with the increase in filler loading, and the change in scorch time is less. It was found that the shape factor is independent of the concentration. With an increase in the filler loading, tensile and elongation of the composites were significantly increased, especially at 30 phr. The bound rubber content increased with increasing BS content up to 30 phr exhibiting the rubber-filler interaction. The reinforcing factor, R (related to the difference in tan δ peak height at the glass transition temperature (Tg) for the filled and unfilled rubbers), also demonstrated that the BS-IIR interaction was stronger than for unfilled rubber. Since 30 phr black sand loaded IIR composite showed superior physical-mechanical properties. In general, the results indicated that the black sand filler was an effective reinforcement material for the butyl rubber.
Introduction
Butyl rubber (IIR) is a non-polar elastomer; it is a copolymer of isobutyl and isoprene.1,2 The minor isoprene ratio is the unsaturated part of the copolymer. It is one of the most widely utilized available synthetic elastomers being used today. The main application of this polymer was found as an inner tube for tires. Because of the chemical resistance, oxidative degradation, resistance to ozone and chemicals, the lower permeability to gases and weather ability,3–5 the polymer was considered a special-purpose elastomer. Later on, the tire manufacturer changed to tubeless tires. The rubber manufacturers started to think about using this polymer for other applications: such as adhesion, engine mount, cables, tanks, reservoirs lining, airbags, and other components in car manufacture.
However, in the rubber industry several types of fillers were used to improve the polymer processing, and vulcanization properties and also reduce material costs; thus making it more suitable for applications.6,7 These fillers are carbon black, silica, calcium silicate, magnesia, and zinc oxide. The polymer-filler incorporation is essential for rubber hardness and modulus ranges. Carbon black and silica are widely used as reinforcing fillers to enhance the physical and mechanical properties of rubber vulcanizates. Production of these conventional fillers is highly energy-consuming. 8 Thus, the use of renewable fillers as substitutes for carbon black in rubber compounding has been suggested.
Many authors9–12 have extensively studied the reinforcement of butyl rubber with different fillers, and their effects on the various properties of the polymer composites. The electrical and thermal properties of IIR/NBR were enhanced by the addition of carbon black N-326 and N-774. 13 The effect of carbon black (N234) and silica (Vulksail N) fillers with a silane coupling agent Si69 on butyl rubber (IIR) were studied. They found that 30 phr N234 filled IIR had the largest tensile strength and tear strength of IIR. 14 The introduction of boron carbide ceramic (BC) in butyl rubber causes the change of current voltage and thermal stability characteristics, and the thermal conductivity of this rubber also changes. 15 In recent years, natural filler-based polymer nanocomposites, which have emerged as a new class of materials, were extensively studied by various researchers. So in this research, a novel filler namely black sand which is one of the silica resources was used. BS is usually contaminated with other important minerals such as ilmenite, rutile quartz, iron oxides, zircon, granite, gold, heavy silicate, radioactive materials, titanium, and titanium oxides. These nanoparticles were incorporated into the polymer to form rubbery materials that can be used for several purposes.16–19 The potential of using black sand on the physical and mechanical properties of butyl rubber has been studied. The inorganic BS particles form aggregates or agglomerates with increasing volume fraction and this depends on their area and surface energy. Therefore, the reinforcement of IIR polymer by BS filler needs a coupling agent to hinder the filler particles from re-aggregates in the polymer substrate. Silane coupling agents are generally employed for the treatment of the filler because of their unique bi-functional structure in which one end could react on the filler surface while the other is compatible with the polymer during vulcanization. In the late 1960s, a silane coupling agent was first used in a silica-filled rubber to improve the reinforcing properties.20,21
Based on the published literature, seldom studies had been reported using a combination of BS with IIR. The goal of this work was to investigate the loading effect of black sand filler (5,10, 15, 20,30, and 40phr) on curing properties, shape factor, and dynamic and static mechanical properties of IIR compounds via melt mixing. The results are expected to provide valuable data for butyl rubber compounding.
Experimental
Materials
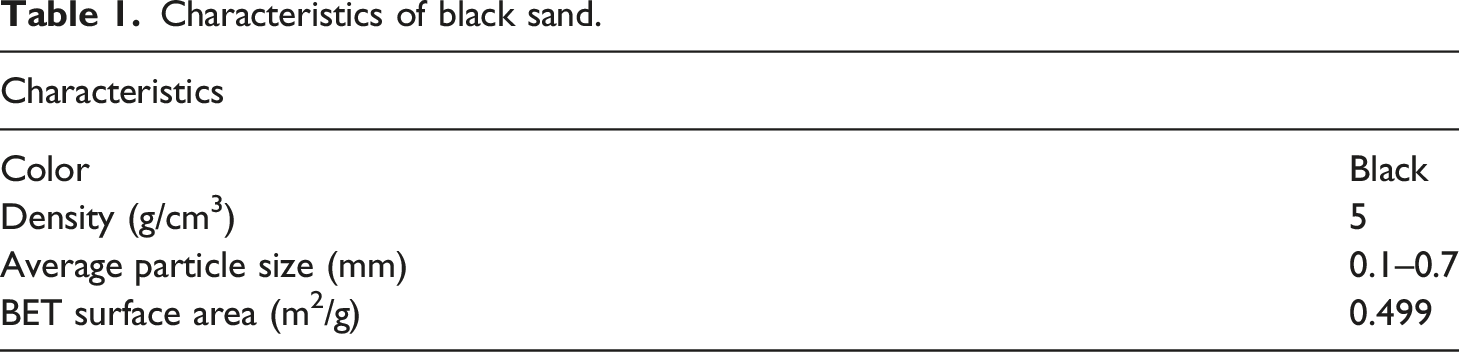
Characteristics of black sand.
Filler preparation
BS granules were collected from the beach area of Rosetta and then stored in plastic bags. The collected BS was sieved to remove coarse particles and then dried in an air vacuum oven for 6 h at 70oC to eliminate water and odor. A ball milling machine was used to reduce the sand particle size to the nanoscale and sieved several times to obtain the uniform size. After the grinding process, they were kept in polyethylene bags for use.
Preparation of composites
Materials and formulations of different BS/IIR composites.
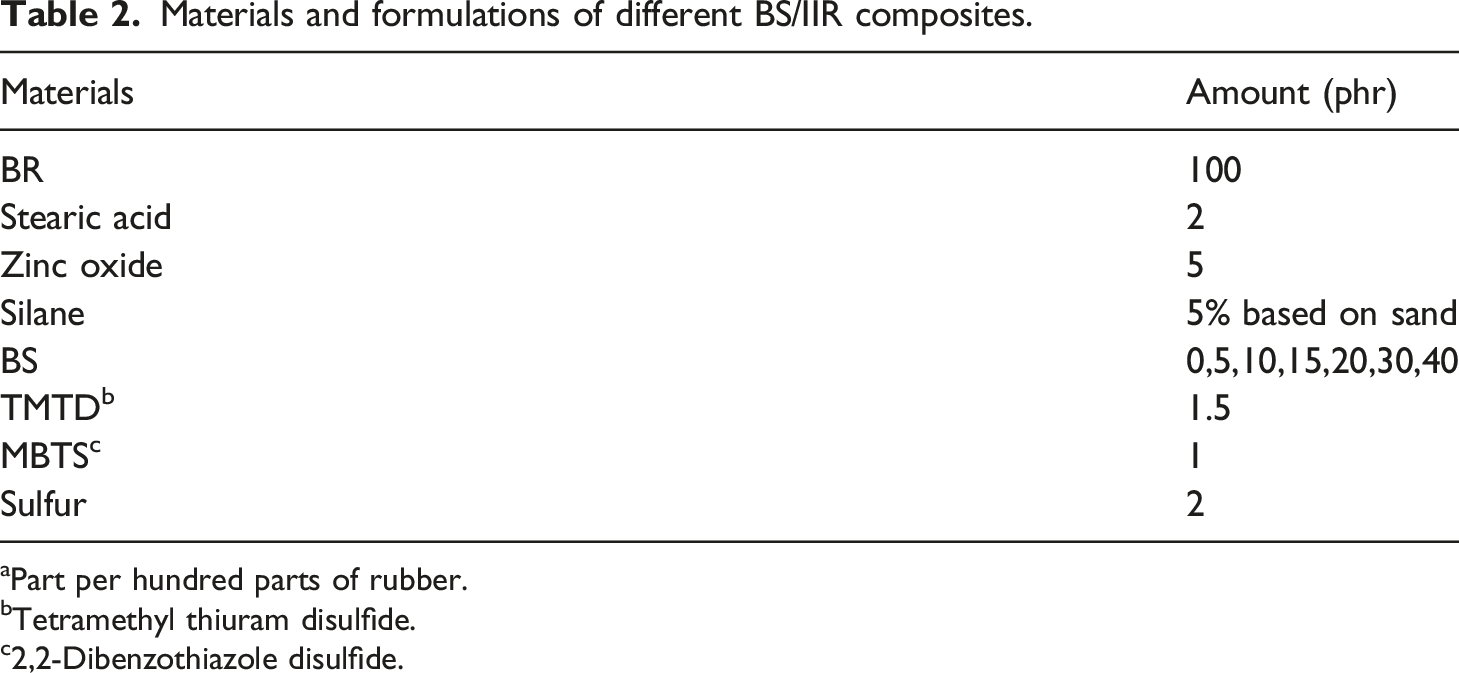
aPart per hundred parts of rubber.
bTetramethyl thiuram disulfide.
c2,2-Dibenzothiazole disulfide.
Filler characterization
A small amount of black sand powder was investigated under Fourier transform infrared (FTIR) Spectroscopy using a Standalone FTIR Microscope (Lumos-M; Bruker Optics, Germany) and the IR spectra were scanned over the wavenumber range of 4000–400 cm−1. X-Ray Diffractometry (XRD) analysis of milled BS was carried out using BRUKER- D8 Advance X-ray diffractometer with Cu-Kα (λ=1.54Ao) as a radiation source, operating voltage at 45 kV and current 40 mA. The pattern is recorded in the wide-angle range from 40 to 800 with step 0.020. Transmission electron microscopy (TEM) was performed with a JEM-2100 multipurpose electron microscope with an accelerating voltage of 200 kV (JEOL Co., Japan). It was employed to measure the particle size and shape of the nanoparticles. A very small amount of the sample was first dispersed in a solvent, followed by ultra-sonication for a certain period to achieve good dispersion. Finally, a single drop was dispersed in the Cu grid.
Thermal analysis
TGA was carried out with composite samples to evaluate the effect of the BS on the sample weight loss as a function of time. TGA measurements were performed with a TA instrument model Shimadzu-50 H, Japan. The measurement temperature ranged from room temperature up to 600oC at a heating rate of 10oC/min in a nitrogen atmosphere. The mass of the samples was between 1:4 mg. The degradation temperature of the composites was studied through this analysis.
Cure characteristics
The cure characteristics were determined using an oscillating disk rheometer (Alpha Technologies MDR 2000; UK) working at 150oC for 30 min. The cure characteristics of the different IIR compounds; minimum torque (ML), maximum torque (MH), scorch time (ts2), cure time (t90), and Cure rate index (CRI= 100/t90 – ts2) were calculated.
Bound rubber measurements
The bound rubber is the rubber portion of an uncured compound that cannot be extracted from the filler because of the adsorption of rubber molecules onto the filler surface. Bound rubber is considered as a measure of the degree of the filler–polymer interaction in rubber compounds. The solvent used for the bound rubber determination was toluene. For the determination, 0.5 g of the sample was cut into small pieces and placed into labeled bottles, and allowed to swell for up to 72 h at room temperature. The solvent was removed after this time elapsed, then the surface of the swollen samples was wiped, and the weight of the swollen composites was measured. The swollen samples were dried in an oven at 55°C for 24 h until a constant weight was achieved. The weights of the samples before and after the extraction were measured, and the bound rubber contents were calculated using the following expression22,23
Crosslink density from stress-strain measurements
The dumbbell-shaped samples were used for stress-strain measurements. The test was carried out using Zwick tensile testing machine (Model Z 010, Germany). The stress-strain relationship was expressed according to the kinetic theory of rubber elasticity relating to the force (F) per unit area (AΟ) required for stretching a perfectly elastic network at a small extension value (λ) is given by the following equationwhere F is load, AΟ is the initial cross-sectional area, ρ the density of rubber, T is the absolute temperature, R is Boltzman’s constant,
The relation between (
Mechanical measurements
Tensile and tear tests were examined on a Zwick tensile testing machine (Model Z 010, Germany). Tests were performed at room temperature at the cross-head speeds of 500 mm/min. For this purpose, samples were prepared and cut from molded sheets into dumbbell and angle-shaped specimens according to ASTM D-412 and ASTM D-624 respectively. The hardness test was performed according to ASTM D-2240 using a hardness tester (Zwick 3150, Germany). The samples used for this test are at least 6 mm in thickness. The average of five different measurements distributed over the specimen was taken.
Dynamic mechanical analysis
Dynamic mechanical analysis (DMA) was made in tensile mode at a constant frequency of 1 Hz using a DMA Q800 apparatus (TA Instruments, USA). The specimens for DMA tests were molded with a compression machine and the specimen’s dimensions were 30 mm × 8 mm × 2 mm (length × width × thickness). Tan δ was determined as a function of temperature within the range of −40 to 10°C, and the heating rate was set to 5°C/min.
Results and discussion
Characterization of BS nanoparticles
The FTIR spectrum of black sand is shown in Figure 1. The characteristic feature of quartz is the doublet appearing at 777 cm−1 and 794 cm−1 due to Si-O symmetrical stretching vibration. The deformation vibrations of Al-O-Si and Si-O-Si are allocated in the region 530 cm−1and 483 cm−1, respectively.
24
Moreover, the peaks at wavelength 460 cm−1 (Si-O asymmetrical bending vibrations), and 694 cm−1 (Si-O symmetrical bending vibrations) are ascribed to the existence of quartz in the samples.
25
The broadband at 1080 cm−1 is probably due to Si-O-Si symmetrical vibration or the Zirconyl bonds Zr = O.
26
The observed absorption peak at about 470 cm−1 region is due to the Zr–O vibration, which confirms the formation of the ZrO2 structure. A similar observation was reported by Chen et al.
27
for zirconia nanoparticles. FT-IR transmission spectra of the black sand nanoparticles.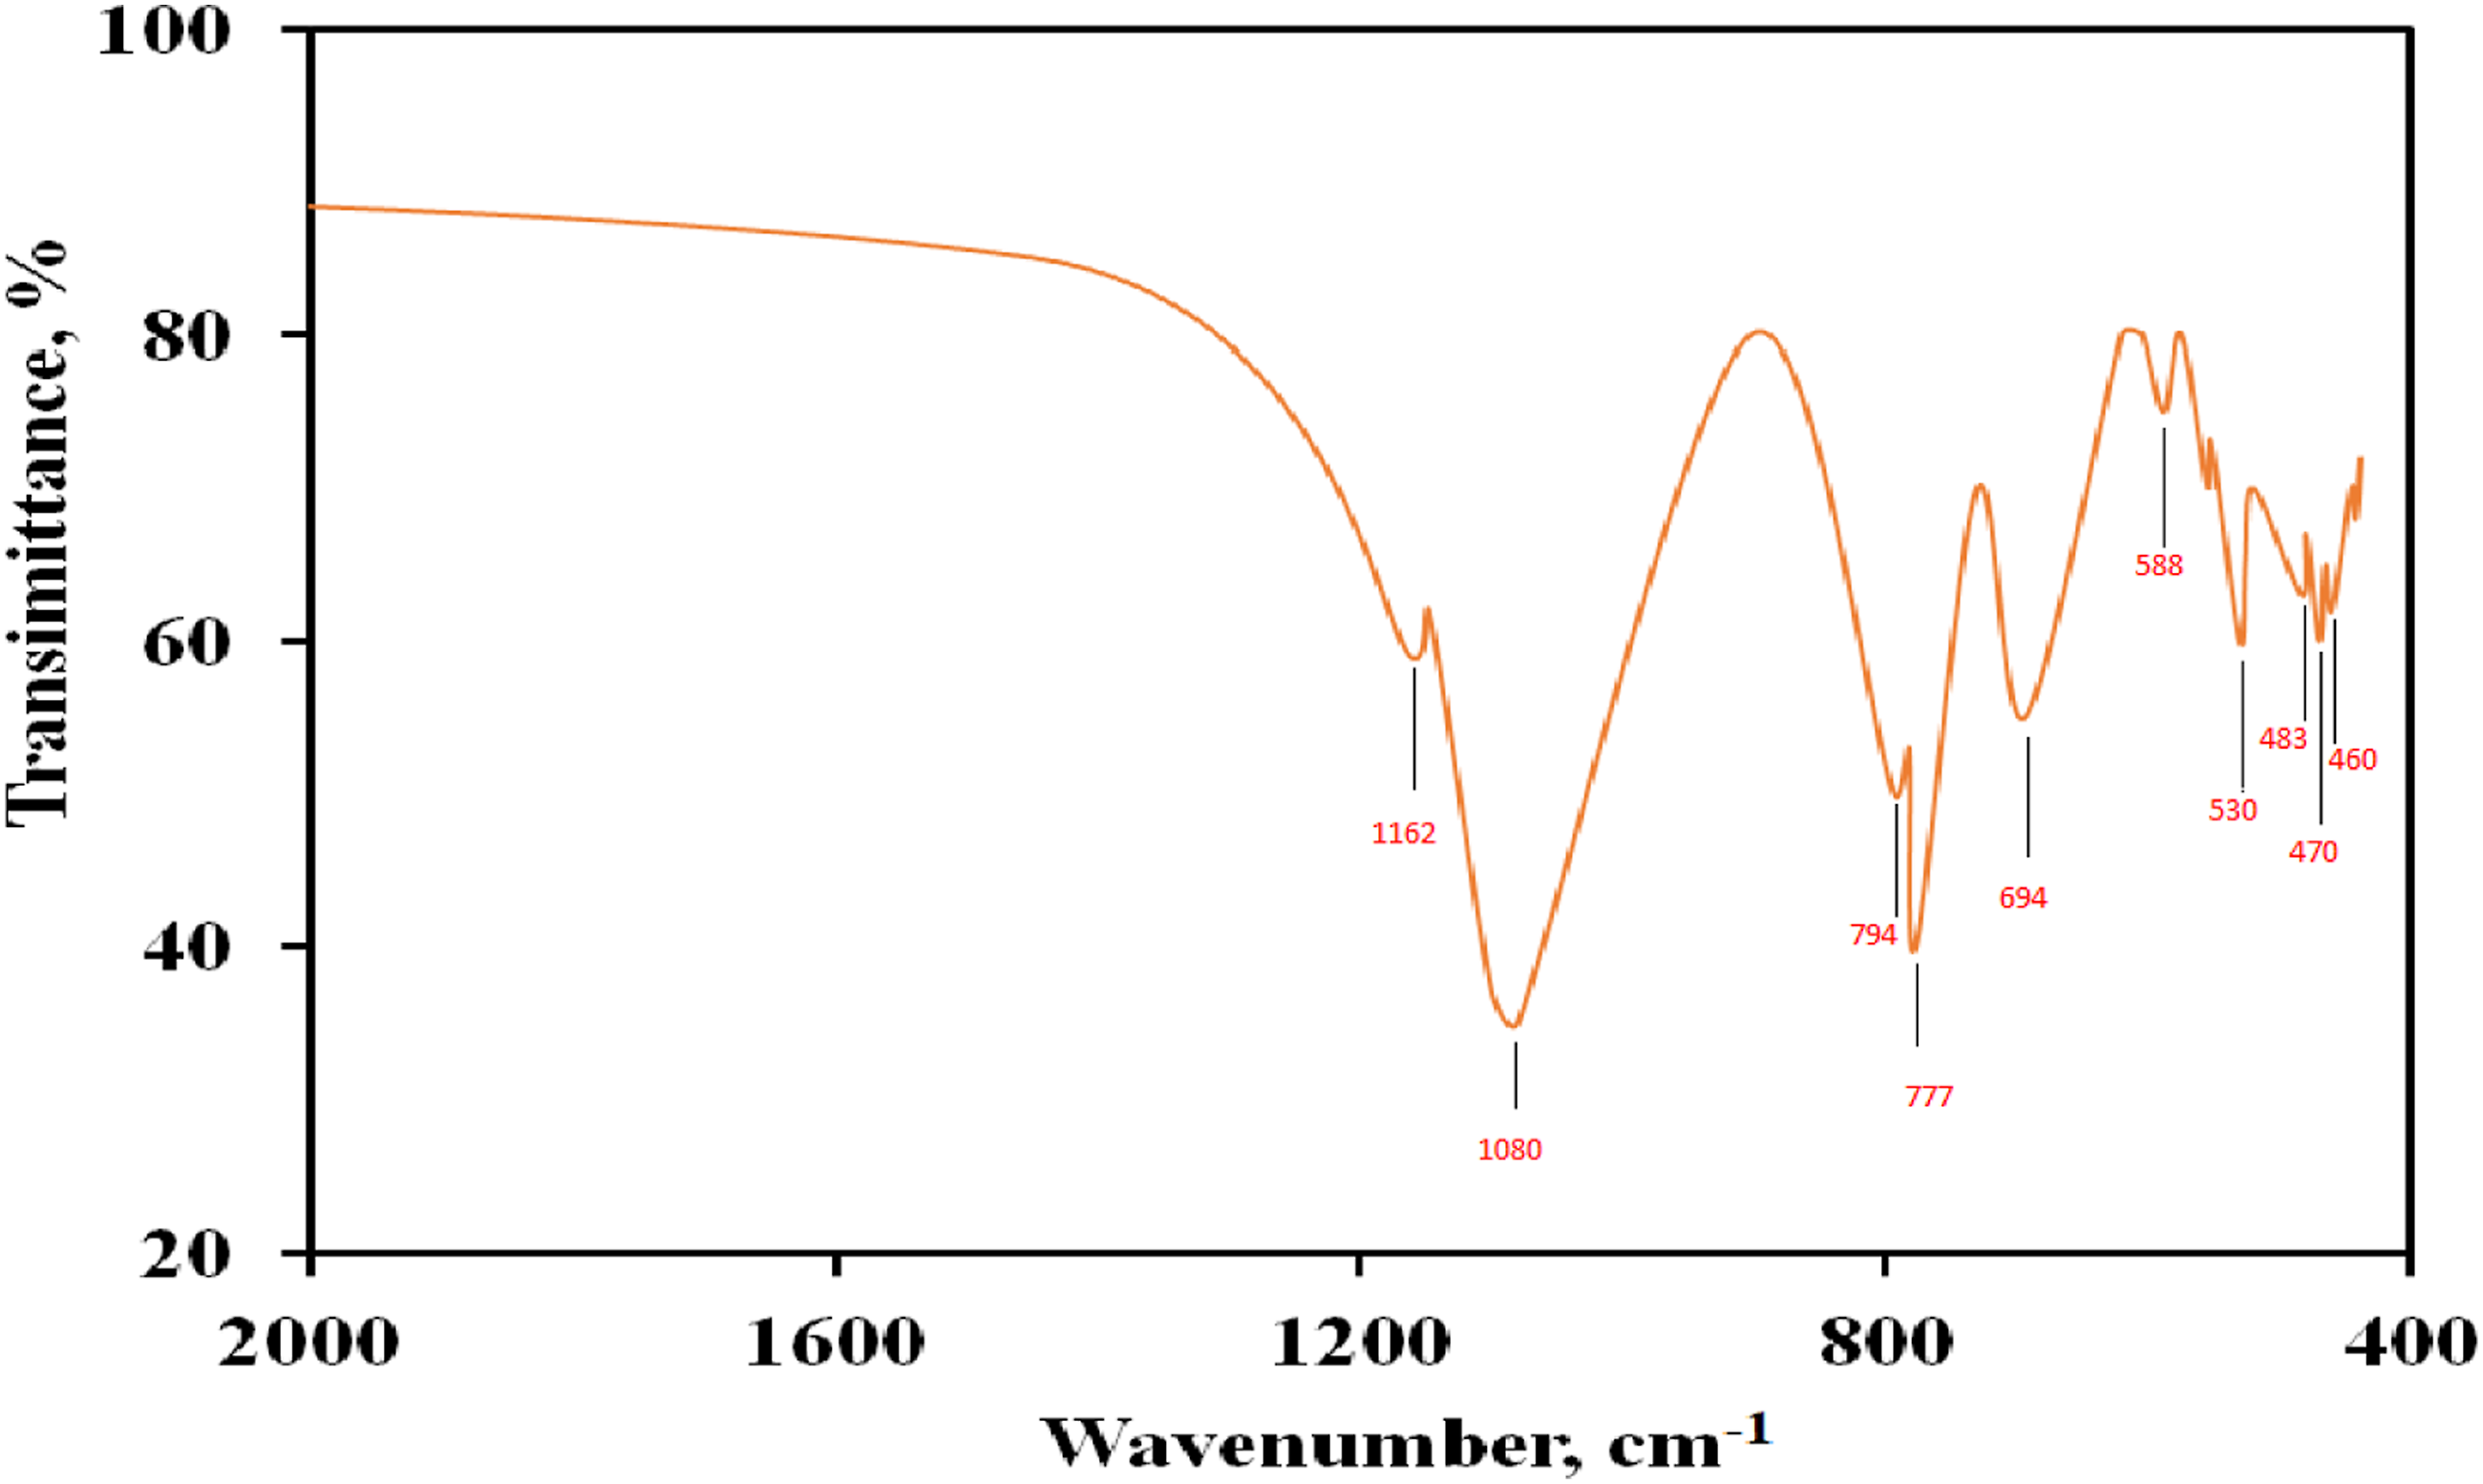
The XRD measurements support the FTIR study that demonstrates the existence of different minerals in BS nanoparticles. Phase identification was carried out automatically by matching the software; identifying the presence of different amounts of crystalline phases that corresponded to quartz (SiO2), Albite (NaAlSi3O8), and baddeleyite (ZrO2), as presented in Figure 2. Each of these minerals has a crystalline structure. The variety in the crystal structure of the BS is suggested to be a good advantage to act as filler in polymeric composites. Quartz and albite are superior substitutes for Al and Si which are used as reinforcing materials in metal matrix composites.28,29 Moreover, the monoclinic crystal lattice structure of baddeleyite has a small grain size and non-spherical crystal shape that yield high surface-to-volume ratios.
30
X-ray diffraction patterns of black sand nanoparticles.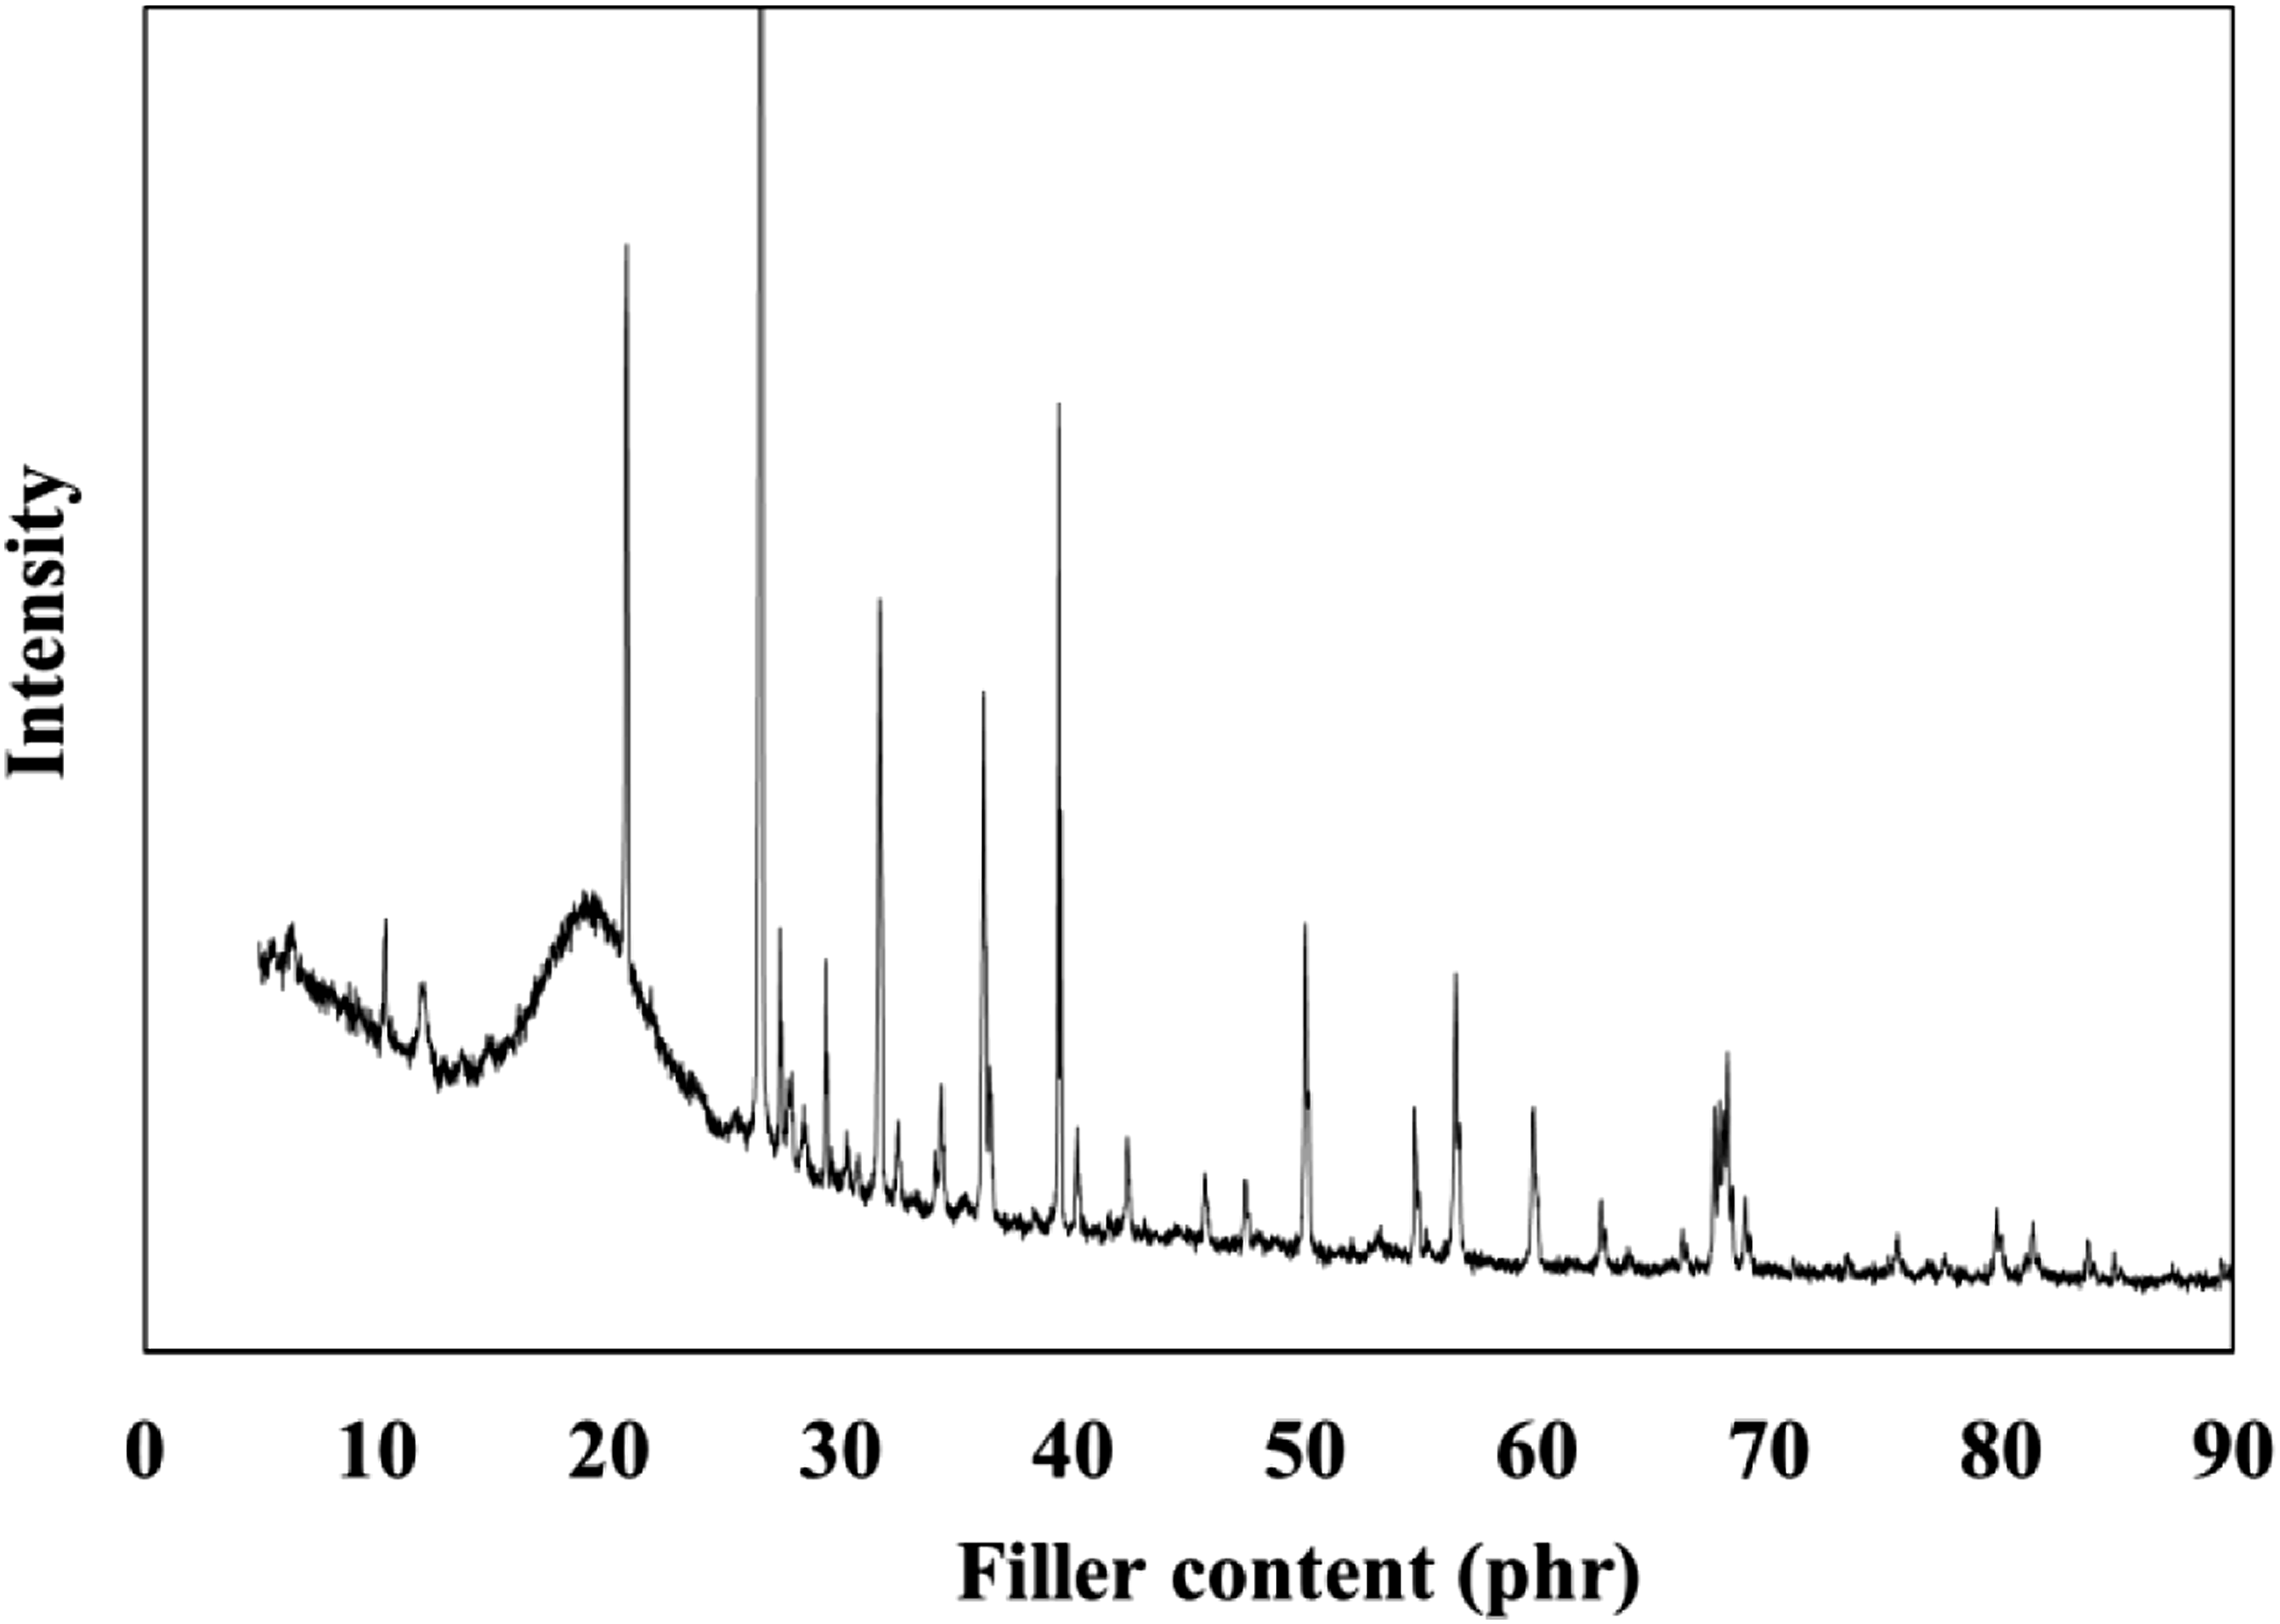
The TEM images were taken to explore the particle morphology of BS under study. Figure 3 describes the TEM micrographs of the produced black sand powder, which demonstrated a non-uniform particle shape that was in the nanometer range. Some aggregates were also observed. The nanoparticles exhibited a strong tendency to form agglomerates or aggregates because of their extremely small dimensions and high surface energy.31,32 The particle size determined by TEM was an average of 17.72 nm. Figure 3 confirmed that the black sand particles were in the nanometer range. Transmission electron microscopy analysis of BS.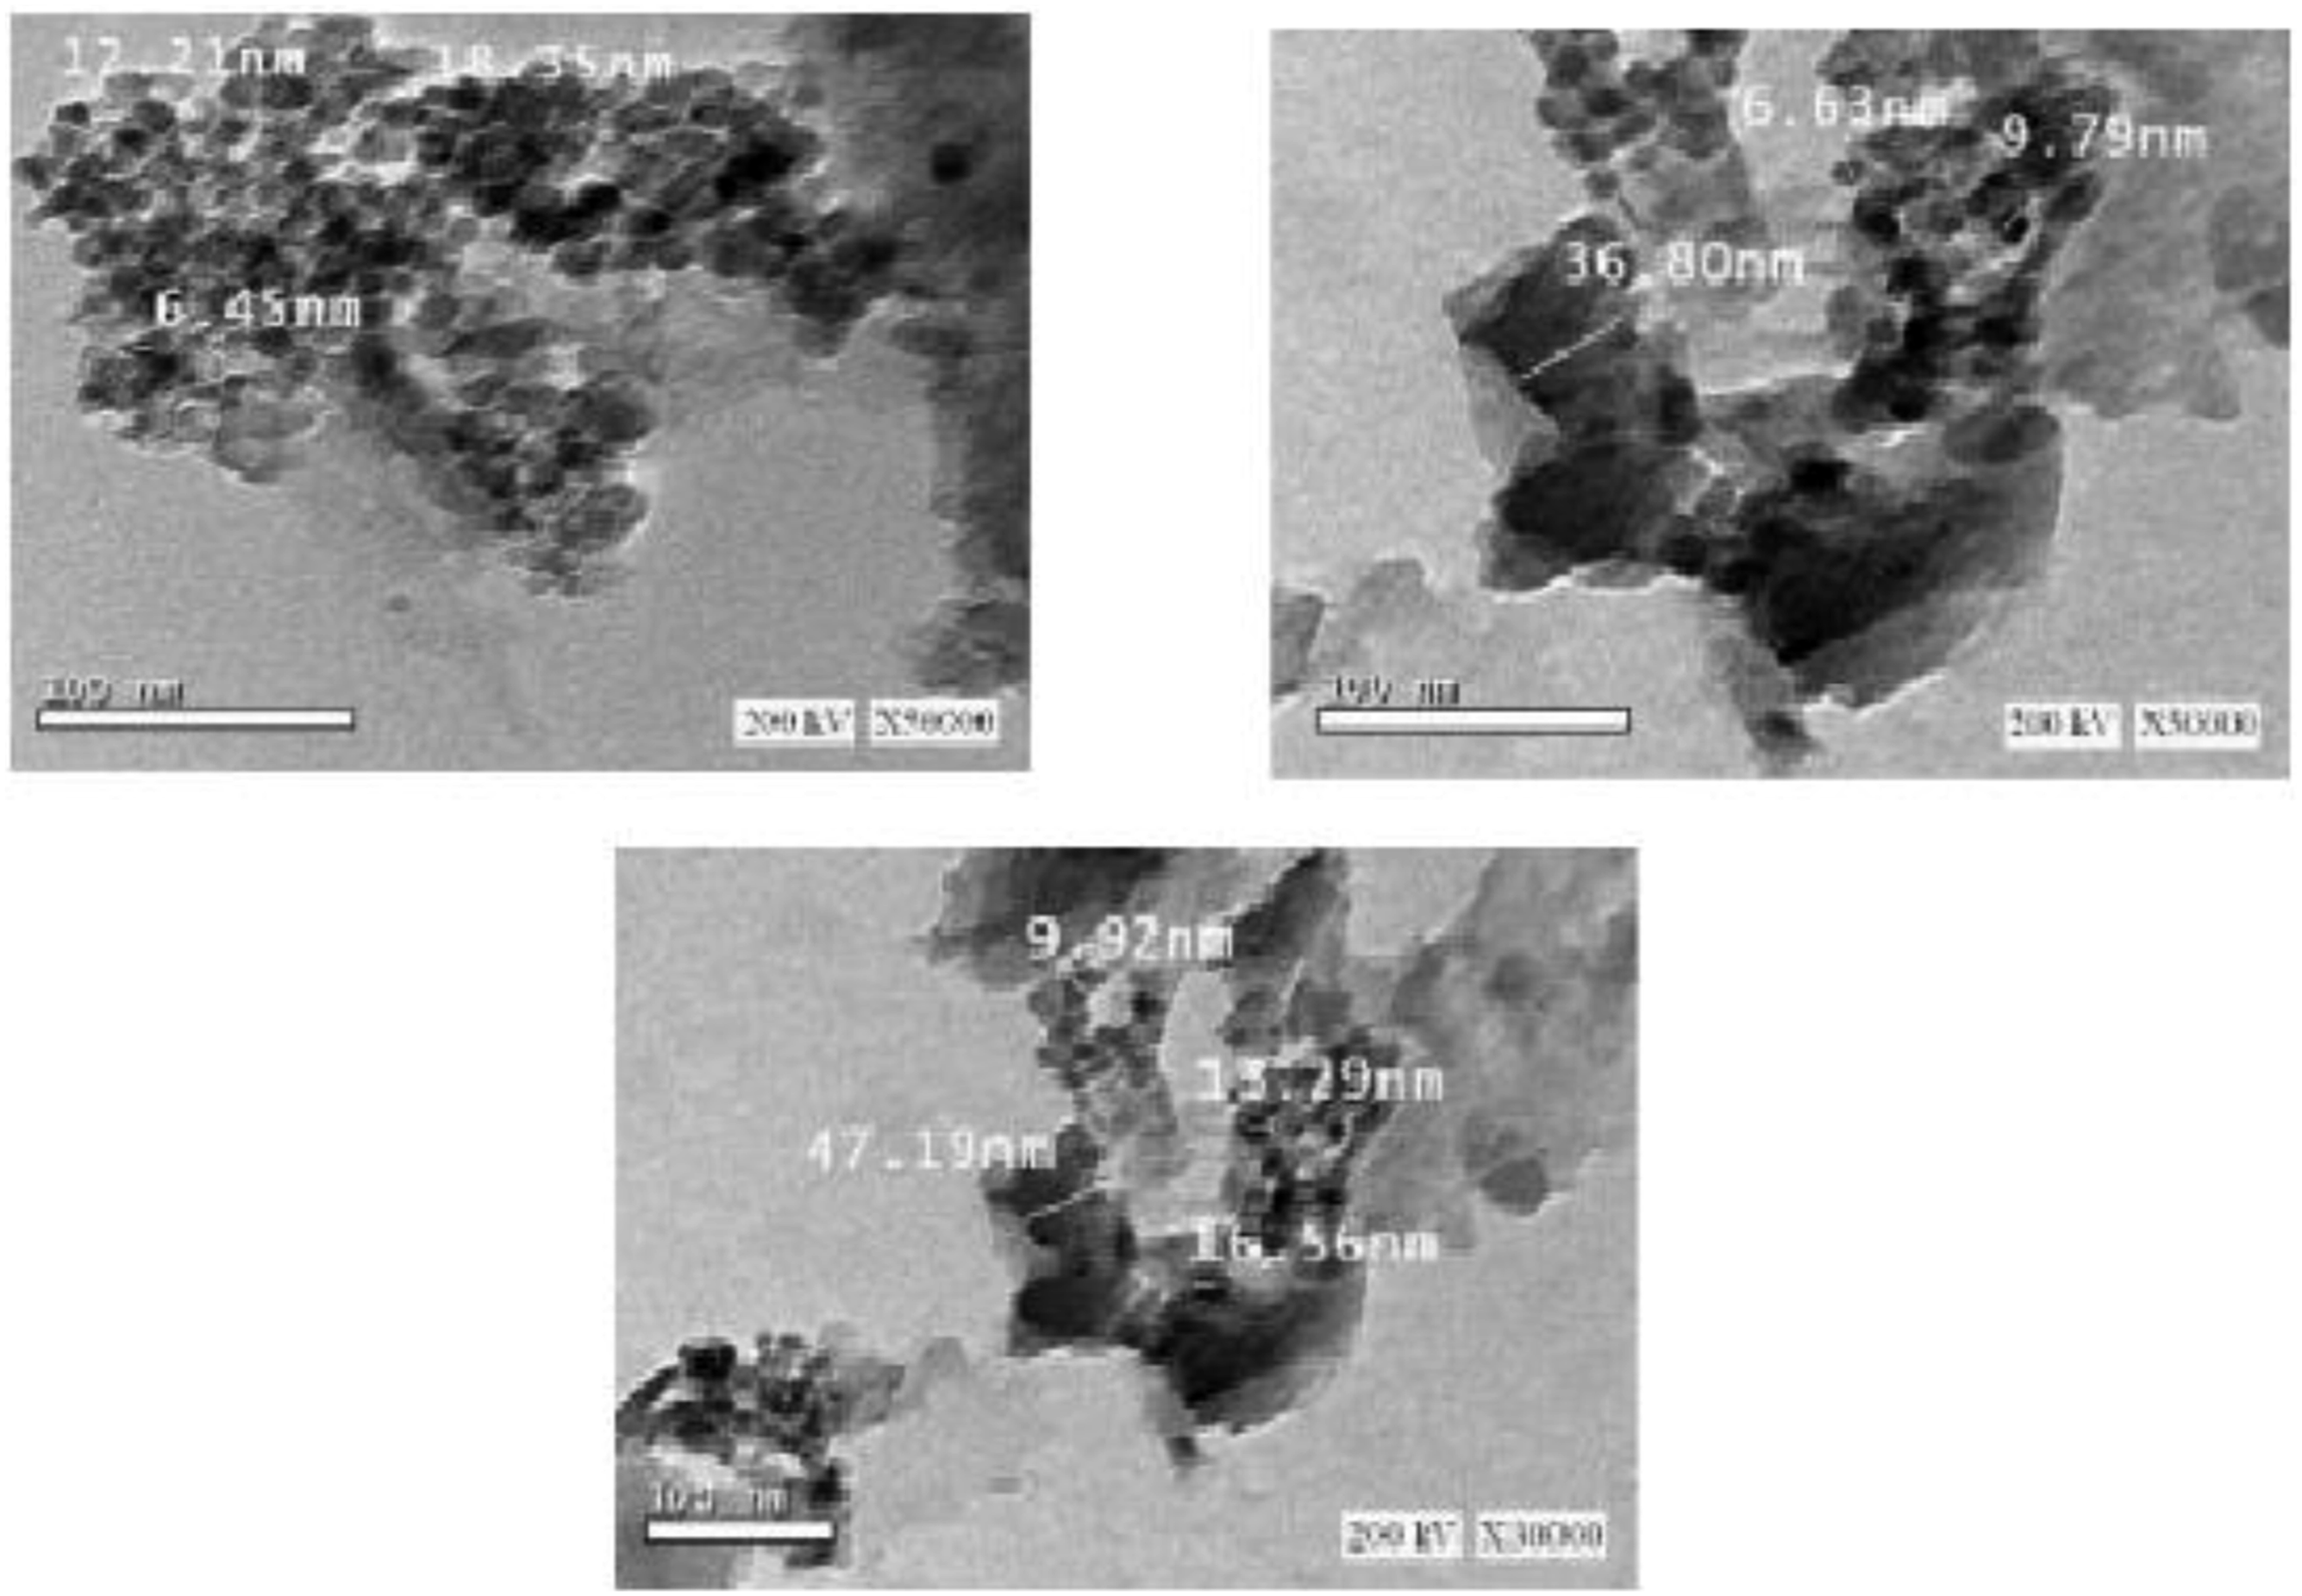
Thermogravimetric analysis
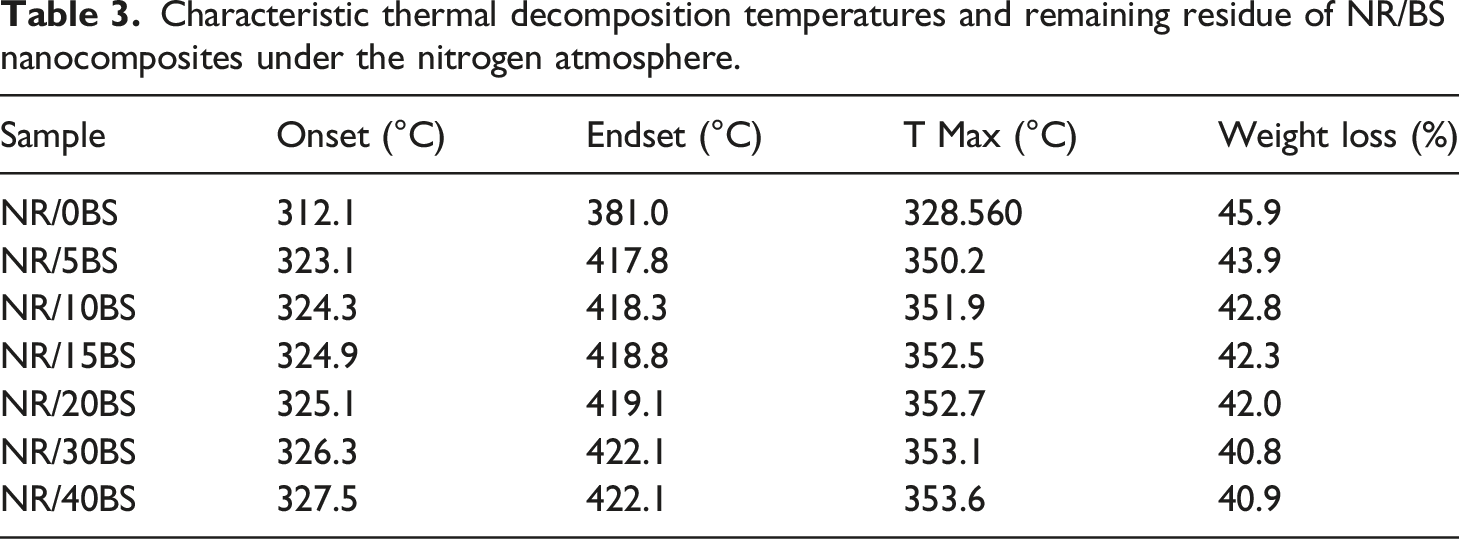
The effect of BS on the thermal stability of IIR was studied using thermogravimetric analysis (TGA) at the temperature range from 30 to 600°C. TGA curves for neat IIR and the prepared IIR/BS nanocomposites at a heating rate of 10°C/min in a nitrogen atmosphere are presented in Figure 4. The results revealed that thermal degradation of IIR and its composites takes place through a one-step process with a maximum decomposition temperature. From the figure, it can be noticed that black sand enhances the thermal stability of the samples rather than the neat sample. Neat IIR begins to thermally degrade at about 312°C, while the presence of black sand nanoparticles causes a shift to a higher temperature. The respective temperatures for each nanocomposite are presented in Table 3. This shift is proportional to the amount of BS nanoparticles. Table 3 also showed that neat IIR and its composite do not degrade completely, while the weight loss of the nanocomposites is inversely related to the content of nanoparticles added to the matrix. This may be due to the good interaction of BS filler within the matrix may slow down the breakdown of the backbone chains of the polymer. So, as the BS content in rubber increased, the weight loss gradually reduced. Thermogravimetric curves of butyl rubber nanocomposite. Characteristic thermal decomposition temperatures and remaining residue of NR/BS nanocomposites under the nitrogen atmosphere.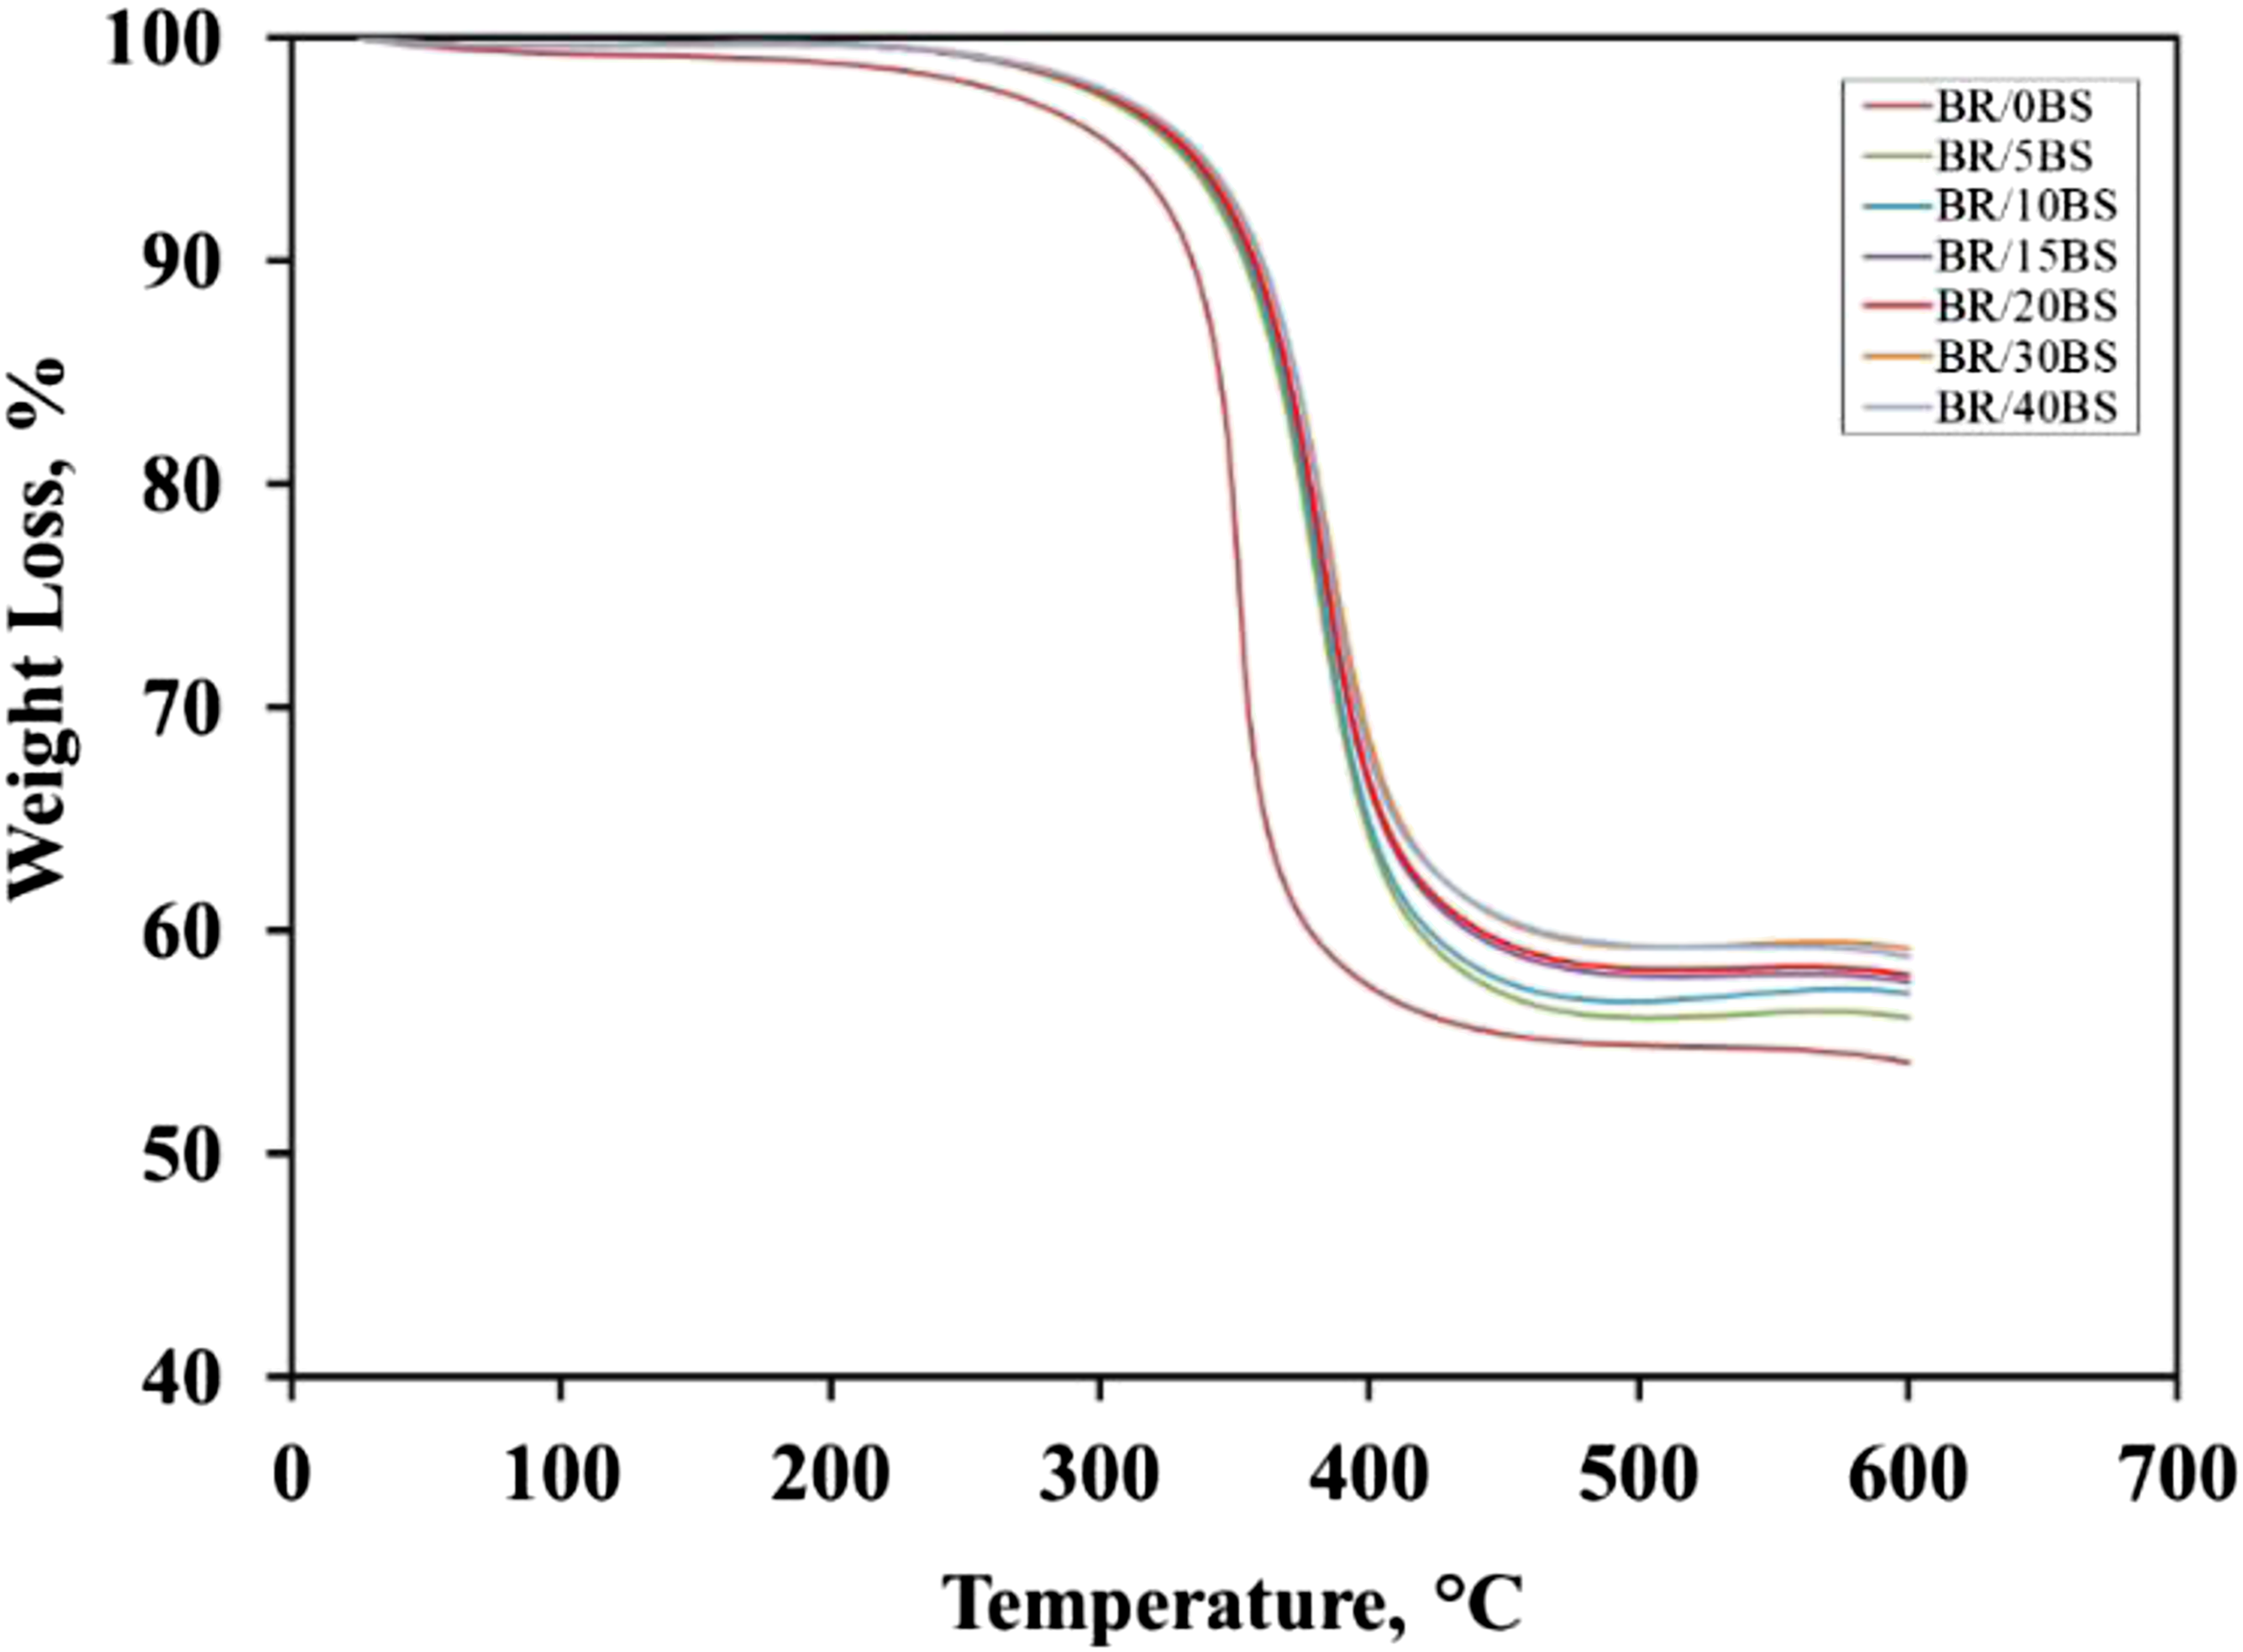
The effect of black sand on cure characteristics of IIR compounds
The effects of BS addition on cure characteristics of the IIR compounds are shown in Figure 5. The cure characteristics are the scorch time (ts2), cure time (t90), and cure rate index (CRI). The minimum torque (ML) reflects the minimum viscosity of the mixes and is taken as a measure of the mastication extent and the filler–filler inter agglomeration. The higher the minimum torque value means the stronger the filler–filler interaction is, also resulting in a higher viscosity of a rubber compound. From Figure 5(a), it can be declared that the minimum torque increased with increasing the BS concentration. This may be due to the presence of the BS in the matrix, which restricts the molecular motion of the molecules in the sample. The maximum torque (MH) is a measure of the modulus of the matrix vulcanized. From Figure 5(a), it is clear that the MH of the composites increases with an increase in BS loading. These are probably due to the inclusion of rigid and hard BS into the soft rubber matrix which tends to immobilize the movement of macromolecular rubber chains. The more BS is added, the more restriction in mobility, and as a result, butyl rubber composites become harder and stiffer. Cure Characteristics of BR Compounds filled BS nanoparticles: a) minimum and maximum torques b) cure and scorch times; c) cure rate index.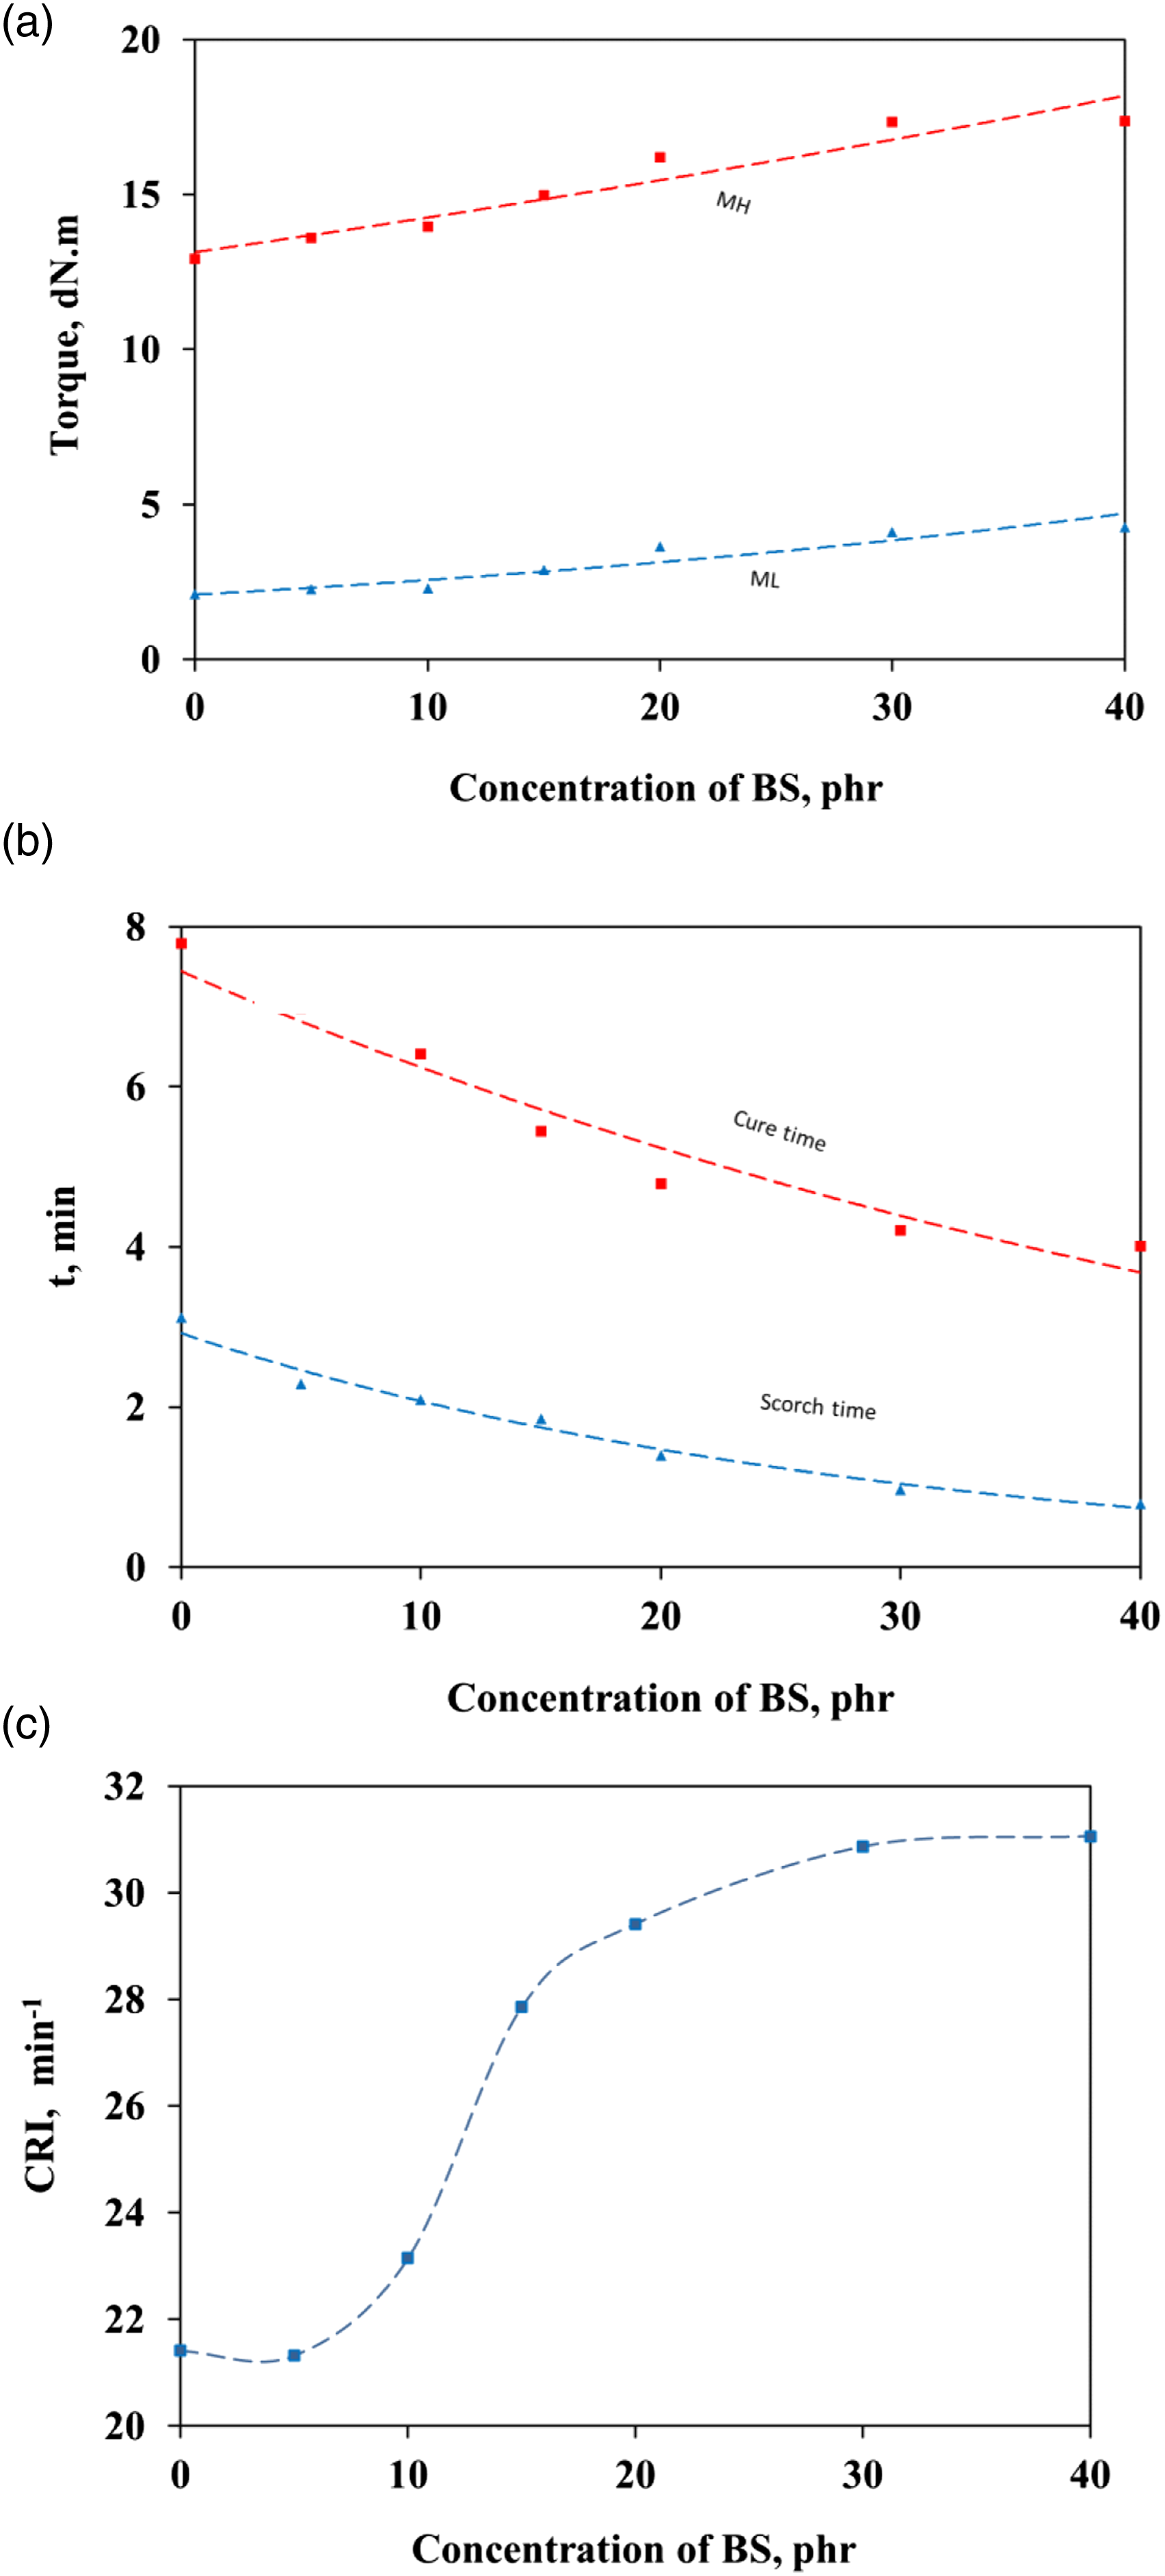
The scorch time (ts2) is the period at which vulcanization of the mixes begins at a given temperature, while the cure time (t90) is calculated as the time required for the torque to reach 90% of the maximum value. As shown in Figure 5(b), the scorch and cure times of BS-filled IIR compounds were lower than those without BS (control compound). The higher the BS loading is the lower ts2 and t90. As shown in Table 2, rubber compounds used MBTS as an accelerator. It is functionally classified as a primary accelerator that speeds up the vulcanization process of the rubber compounds; resulting in scorch delay.33,34 Furthermore, the catalytic role of the free silanol group on the silica surface; present on the BS; can accelerate the vulcanization process improving the curing time and the processing ability.
CRI is a measure of the rate of vulcanization based on the difference between ts2 and t90. It can be seen from Figure 5(c) that the cure rate index of the IIR compounds was affected by the addition of BS. It was observed that the cure rate index of IIR filled with BS increased markedly. The cure enhancement was due to the silica presence in BS, together with zinc oxide, they activated the MBTS accelerator more pronounced and hence, improved the cure rate. It was also seen that increases in the BS loading caused a more pronounced cure enhancement and it was simply due to a higher amount of silica in the IIR compounds.
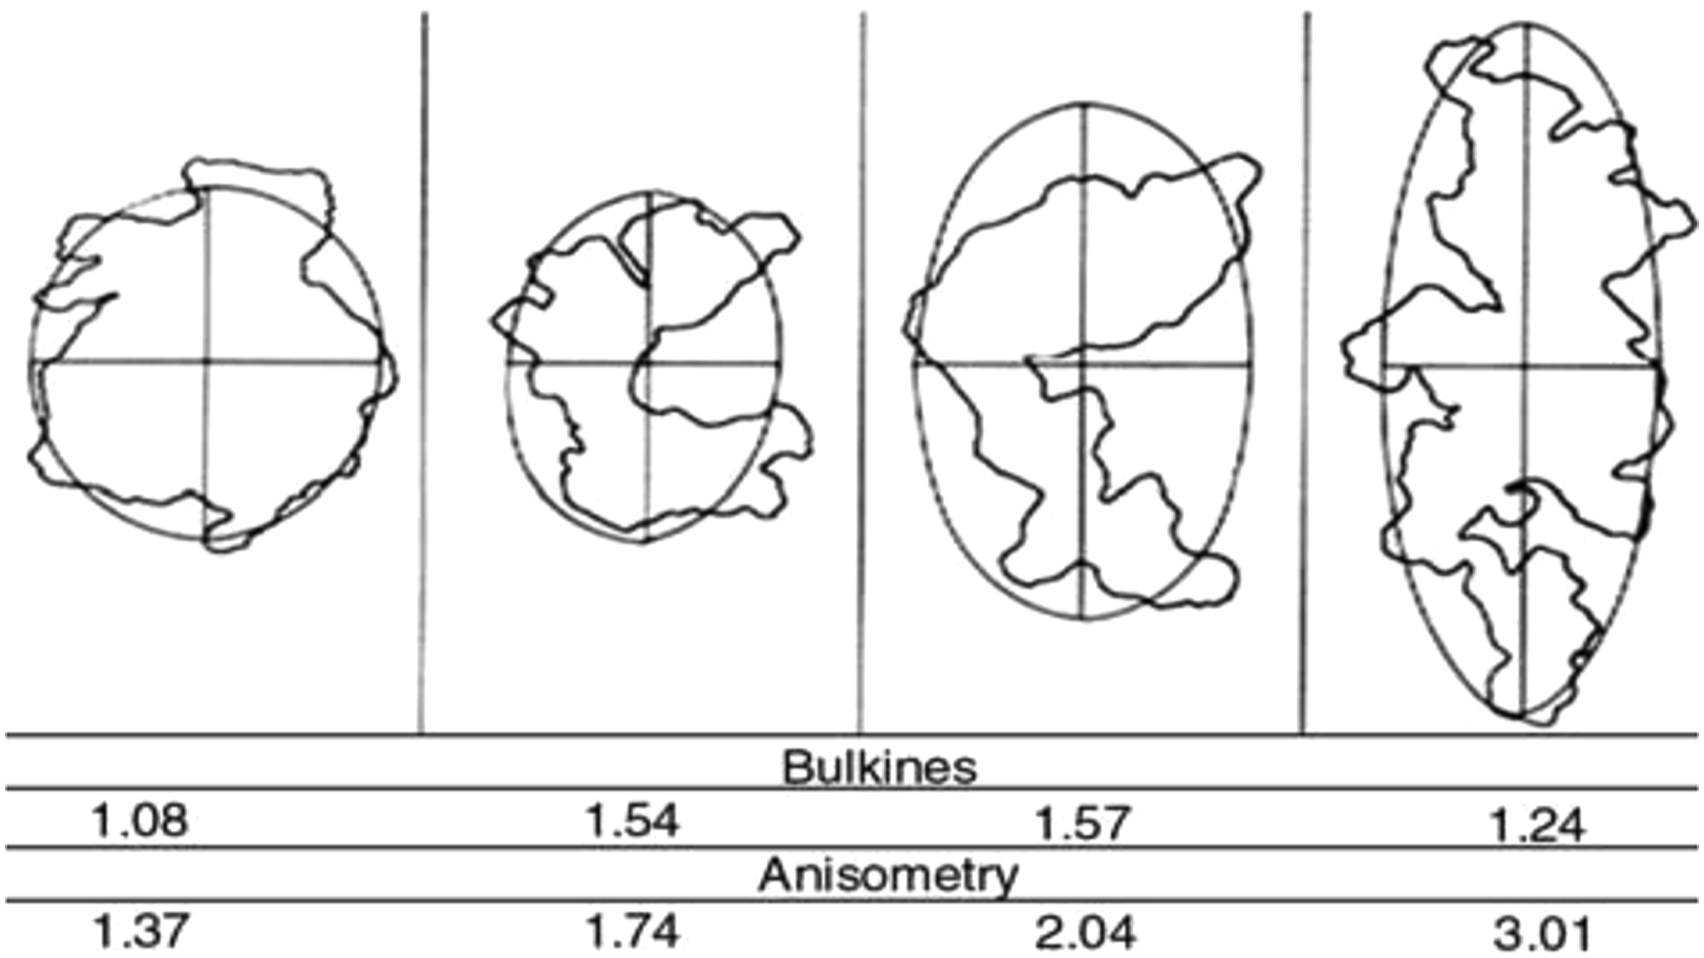
Determination of the shape factor of BS in the IIR compound
The aggregation and shape factor of the filler particles in the compound is of major interest in the determination. The filler aggregations in a polymer usually form either circular or ellipsoid shapes 35 as illustrated in scheme 1. It has to be noted that the ellipse has a major and minor axis; when this axis has an equal axis, the shape is circular. Several aggregates of these shapes form what is called agglomeration. These aggregate’s concentration through Van der Waals force form the agglomerations.36–38 The structure of the aggregation forms the main theoretical in the bulk of the rubber, as shown in Scheme 1. 39
Several authors investigated and discussed the structure of these aggregates by using several techniques such as relating the modulus of unfilled rubber to that of filled rubber,40,41 scanning electron microscope,42,43 and Transmission electron microscopy TEM.
44
The theoretical aspects of the shape factor are based on the earliest theory, which derived from the change in the viscosity of liquid by dispersion of solid particles. The change in viscosity of the suspension is given by Einstein’s equation:
45

This equation indicates that when particles of volume fraction (c) are mixed in a medium of viscosity η0, the viscosity of the suspension increases by (1+2.5φ). The Einstein equation is valid only at a very low concentration of particles. So, several modifications of this equation have been advanced for higher concentrations. Guth, Simha, and Gold
46
derived the following equation (4) which applies to all solutions containing spherical particles:
The viscosity relationships given by equations (4) and (5) are used to propose the elastic problem of rubbers containing fillers, where the viscosity η is replaced by Young’s modulus E. Firstly, Smallwood
47
substituted E and E0 for η and η0 in Einstein equation as presented in the following equation (5):
Guth
48
modified the Guth and Gold equation, and conforms to the following relation (6):
For non-spherical particles, Guth proposed a relationship to define the shape factor of the filler as shown in equation (7):
To calculate the shape factor, the modulus at 20% strain of the unfilled rubber compound (E0) and those of filled rubber (E) at various concentrations of BS (5, 10, 15, 20, 30 and 40 phr) were measured; and the ratio E/E0 was calculated and plotted against the volume fraction of the filler (φ). The volume fraction the particles suspended in the liquid (φ) of BS was calculated for each filler concentration as:
Figure 6 showed the relationship between the ratio E/E0 and volume fraction at different values (φ) of f
s
. The shape factor of each concentration of black sand can be adduced by selecting the quadratic shape-factor curve to which the points are fitted. It was found that the shape factors for butyl compounds containing different concentrations of BS are the same and approximately fitted to the curve of f =8. Figure 5. From the results, it is concluded that the shape factor is independent on the concentration of the BS. The shape factor of butyl rubber filled with black sand at different concentration.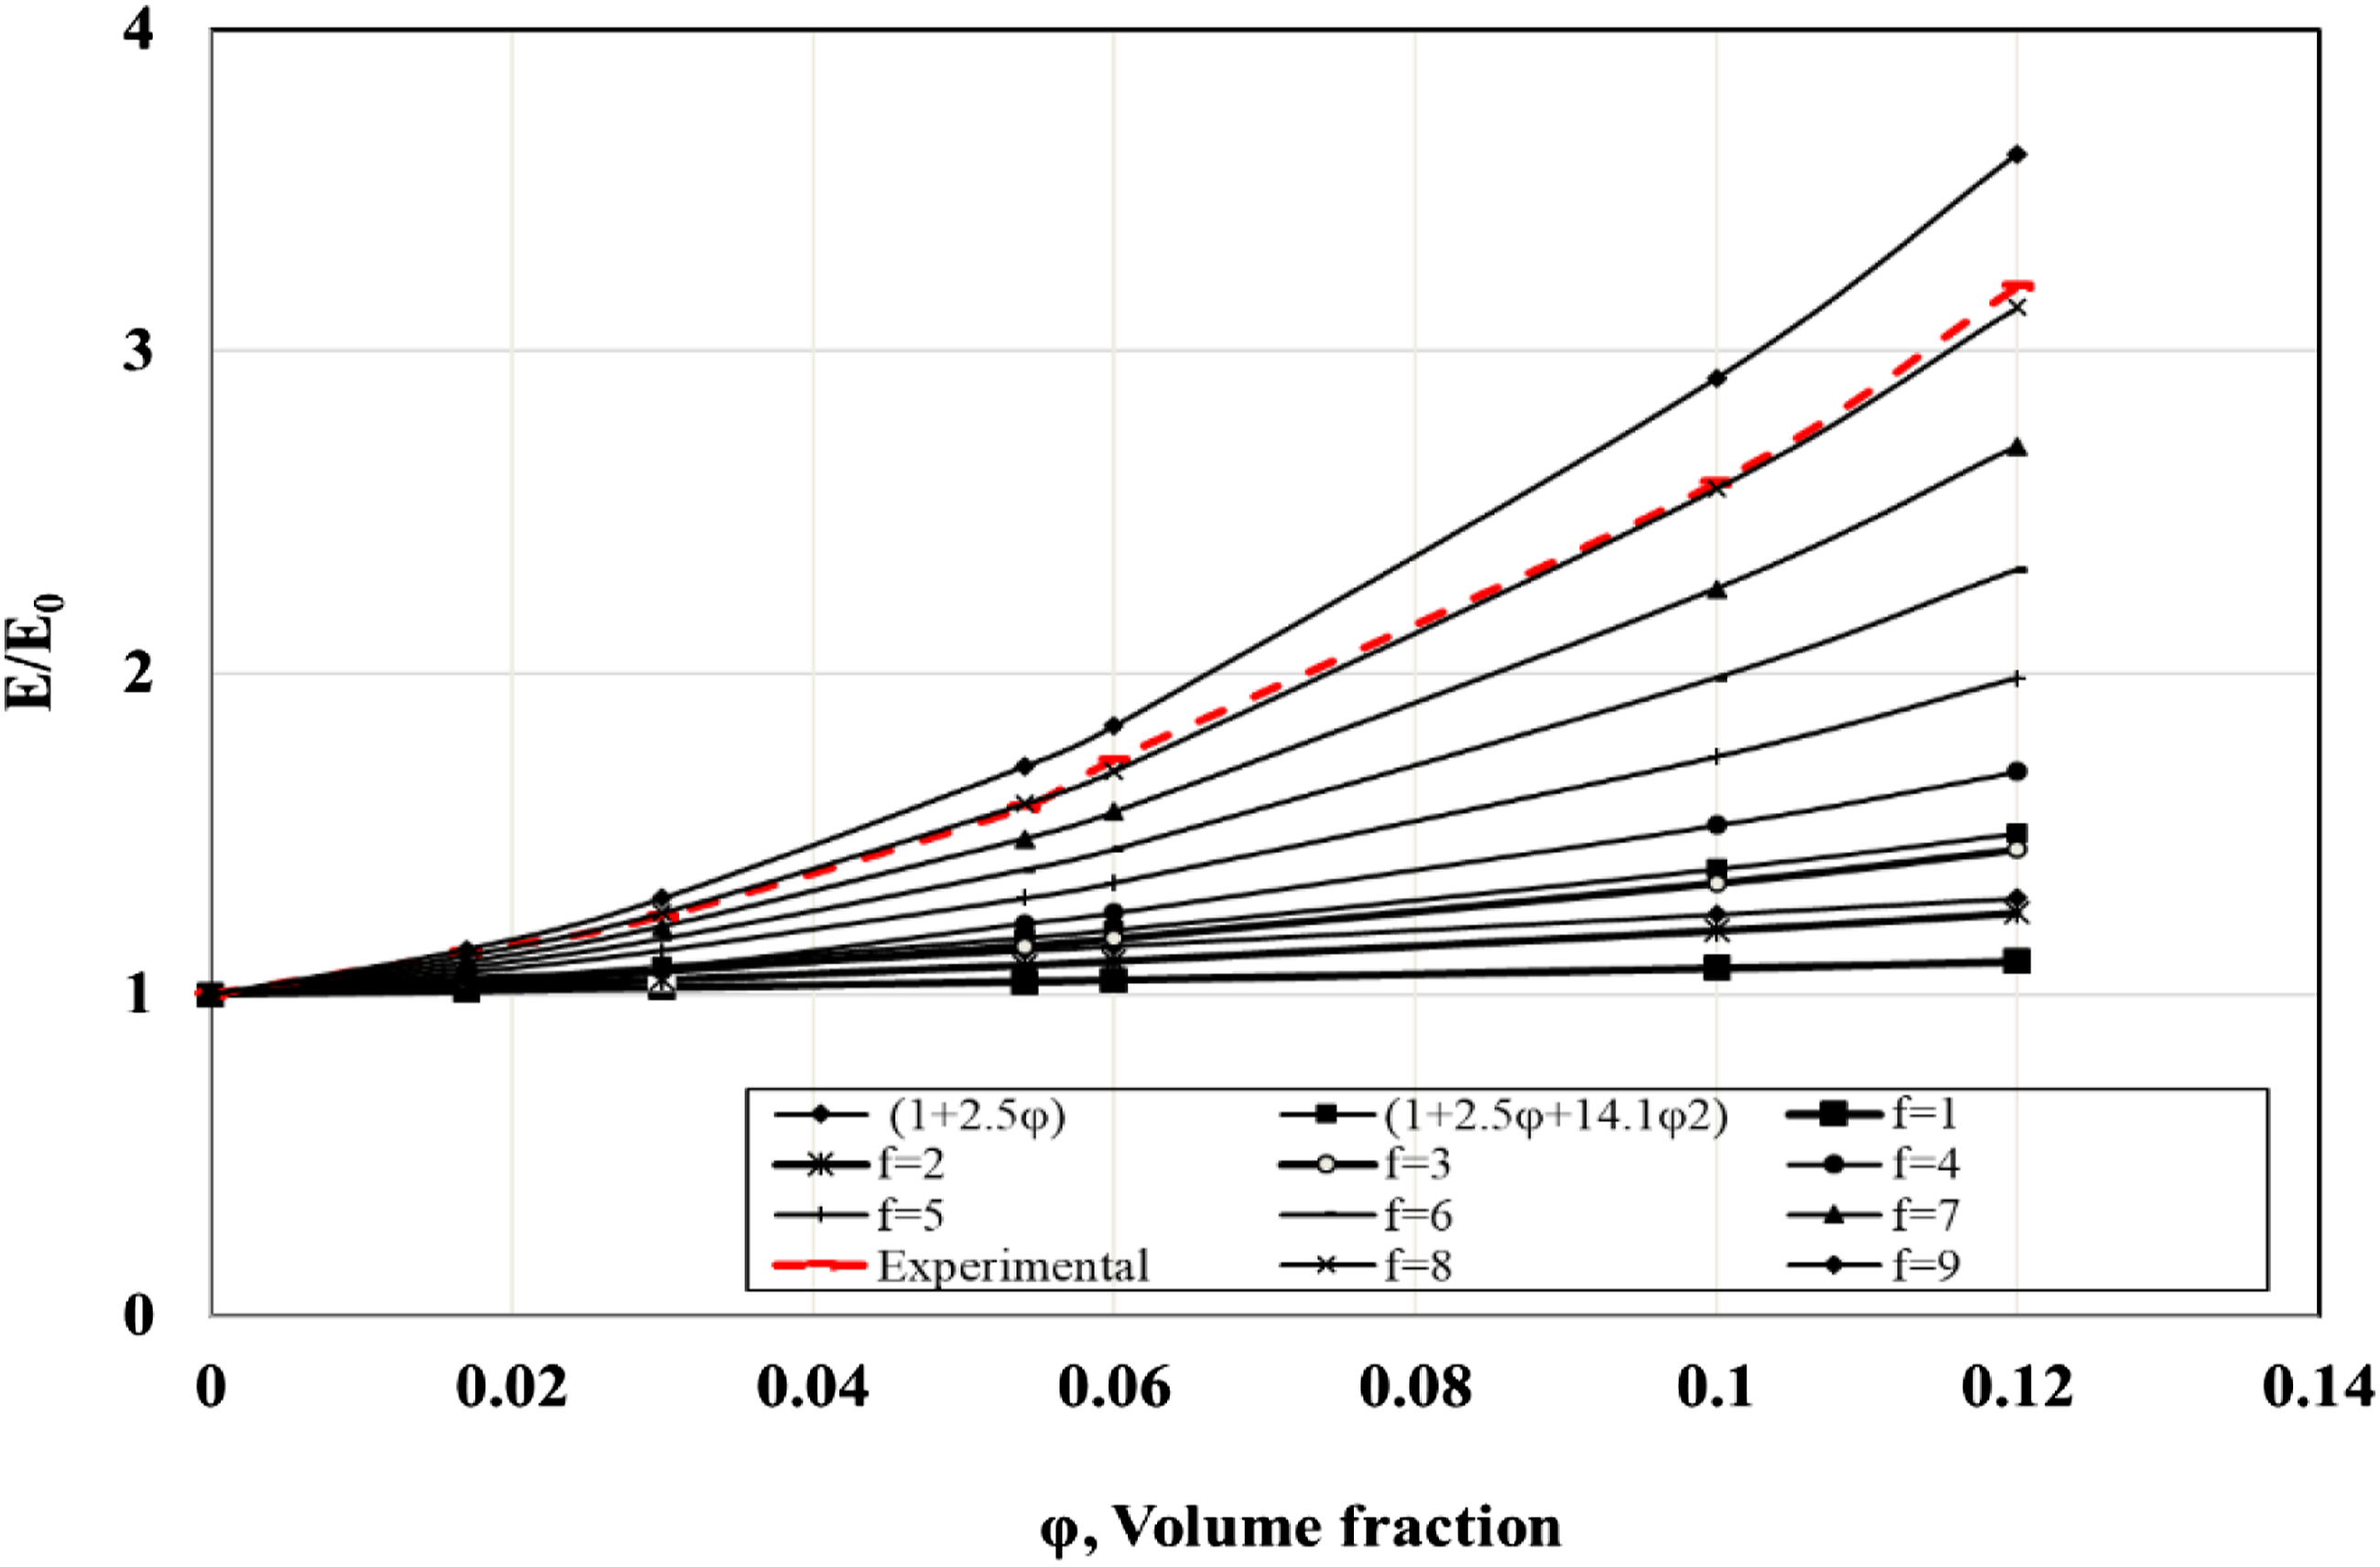
Bound rubber measurement
The bound rubber had referred to as the weight percentage of the insoluble polymer and it exhibited the rubber-filler interaction. The rubber provides an important contribution to the network structure of the rubber composites. In this study, the effect of the BS addition on the bound rubber content of IIR composites can be seen in Figure 7. The addition of BS improved the bound rubber content of IIR composites compared to the unfilled composite. This may be due to the formation of the bonds between the IIR chains and BS particles in the presence of silane. Both filler–rubber interaction and crosslinking can contribute to the increase of bound rubber because the rubber becomes less soluble in the solvent. Furthermore, as the content of BS increased up to 30 phr, the bound rubber content increased and then decreased at further loading. The decrease in the bound rubber content indicated filler aggregations and high filler–filler interactions as a result of the hydrogen bonds between the silanol groups on the silica surface; the silica particles in the BS filler most likely interacted with one another. Effect of the black sand content on the bound rubber level for IIR composites.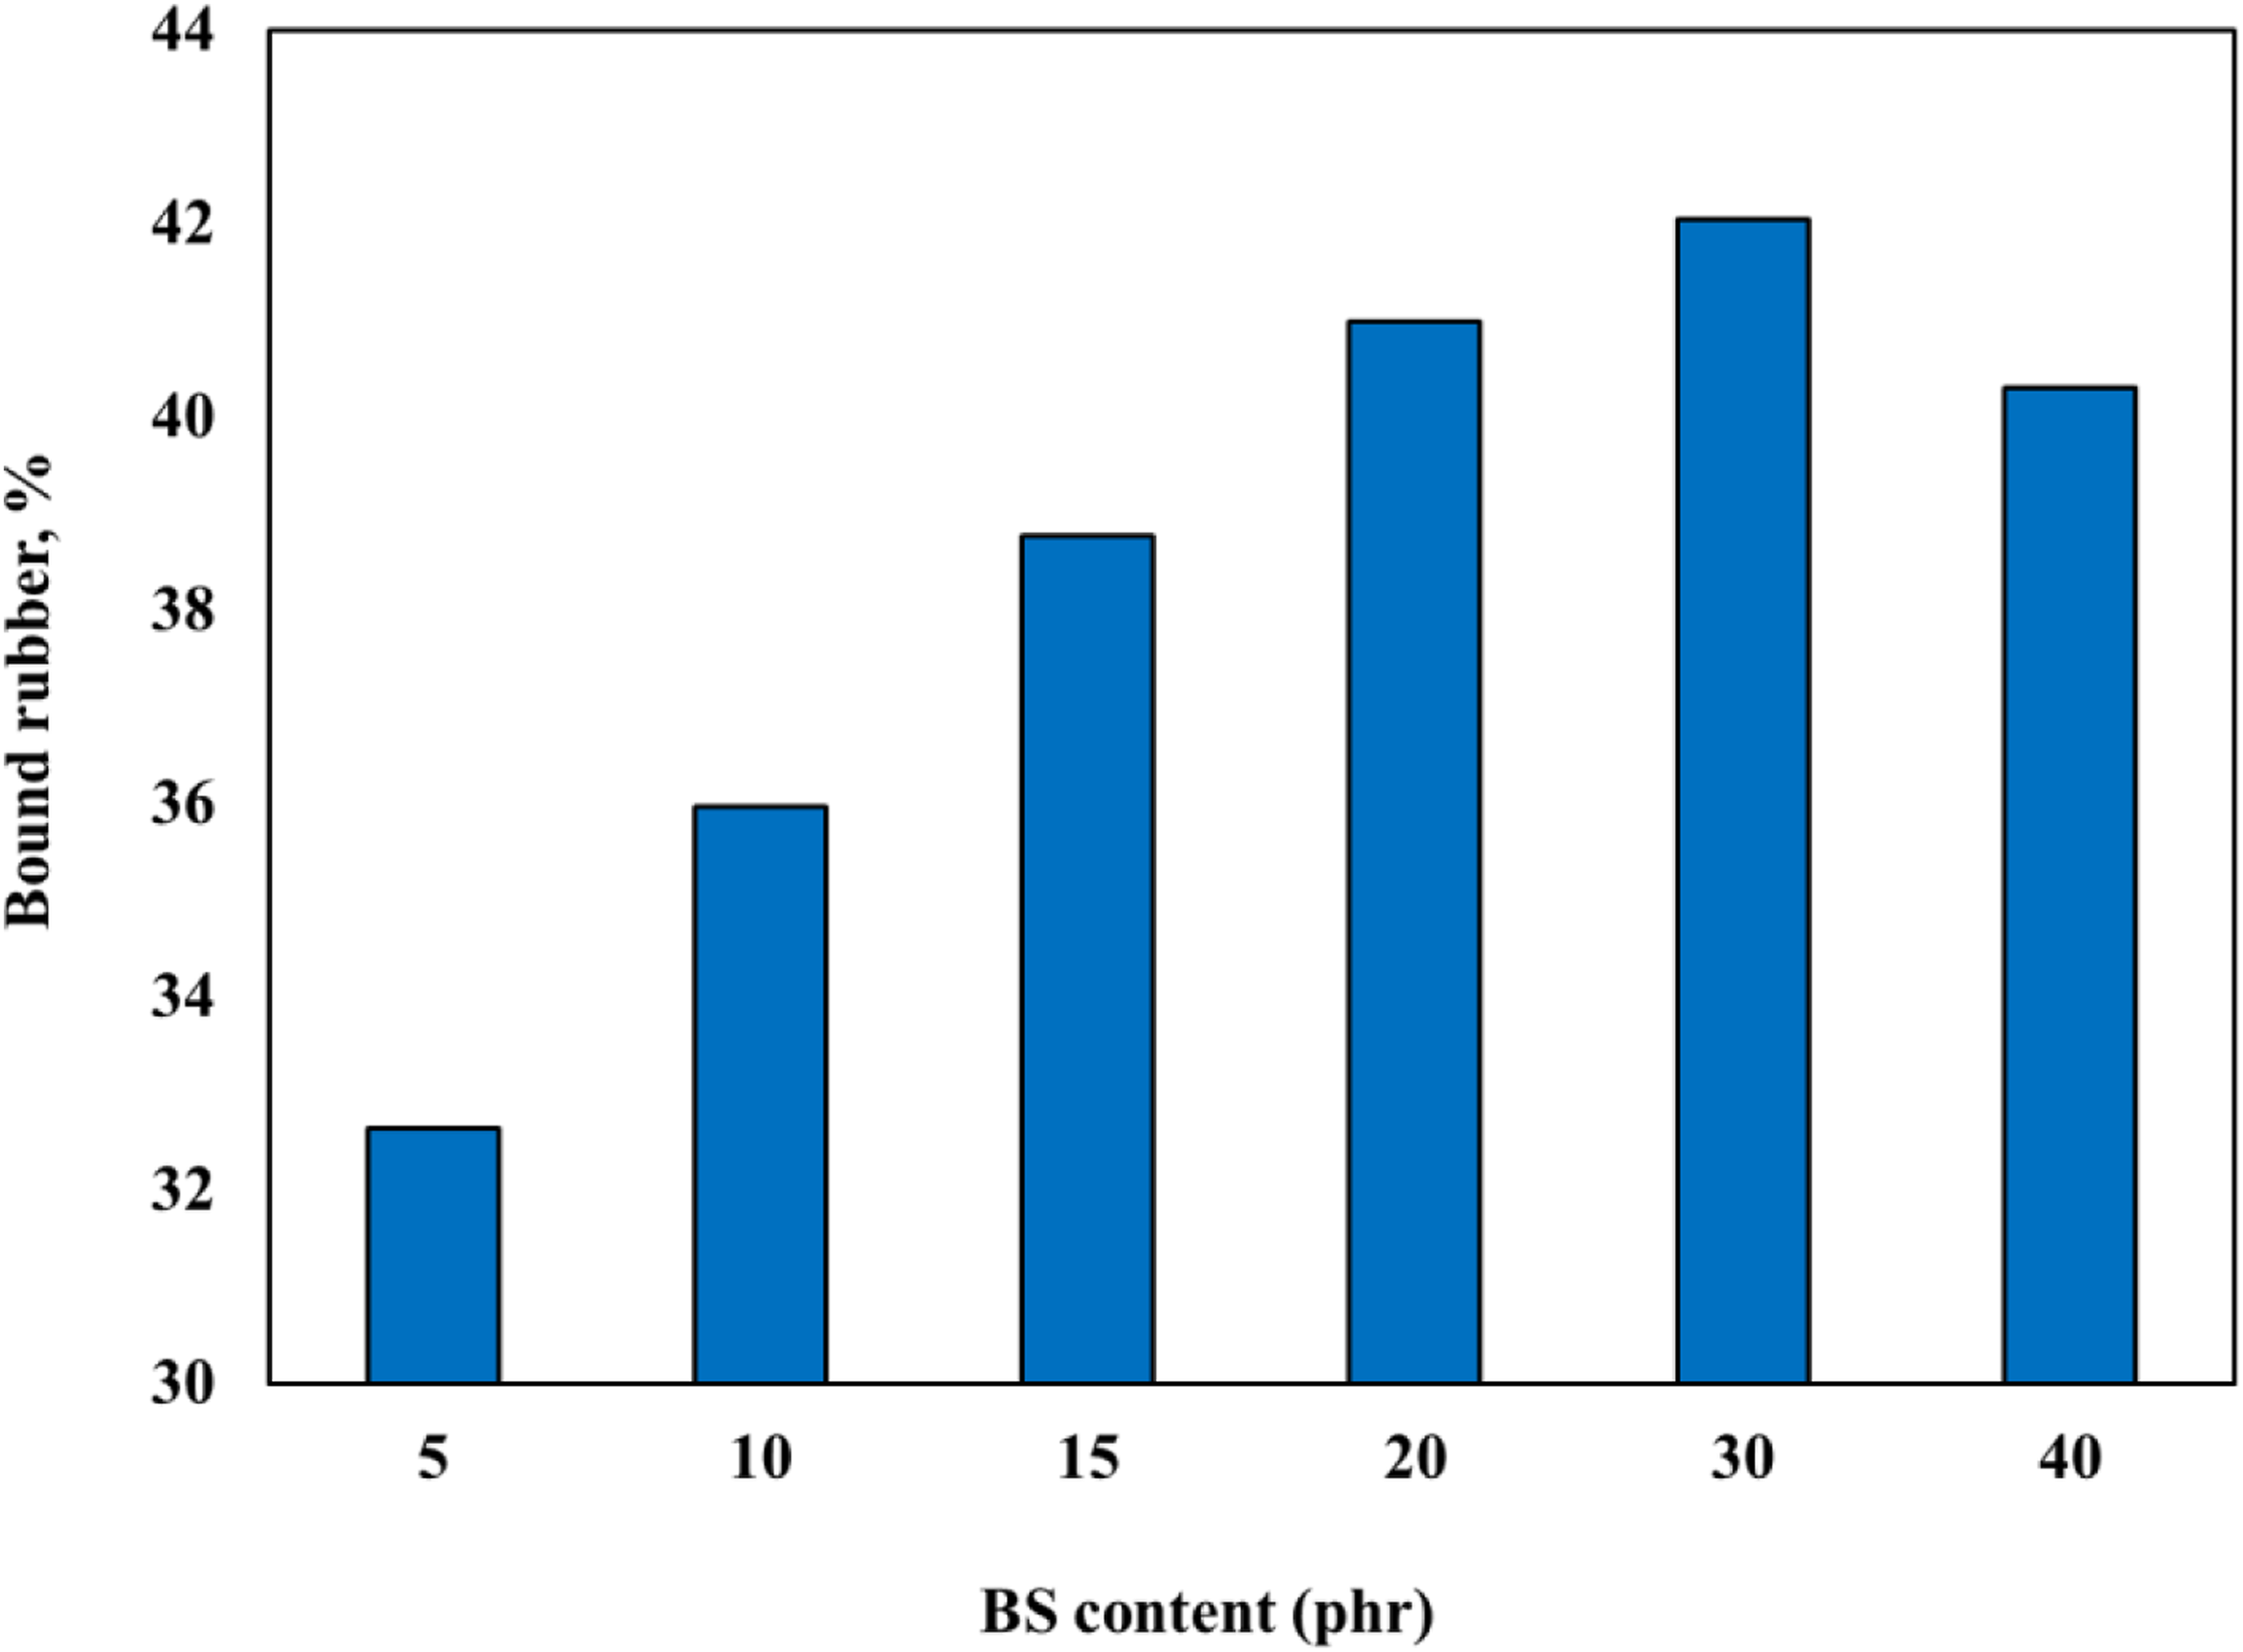
The effect of black sand on the crosslink density of IIR compounds
The crosslink density of a rubber determines its physical properties. 49 By increasing the crosslink density, the tensile, modulus, hardness, and abrasion resistance of the composites increased. The crosslink density of the black sand-filled butyl rubber was compared to that of the matrix. The reaction of rubbers with a vulcanizing agent is merely one specific factor influencing the crosslink density. The other one is the chemical interaction between the rubber and the functional groups present on black sand. The chemical interaction has increased the degree of crosslinking.
The stress-strain measurement was used to obtain the crosslink density of each mix. For each extension ratio λ, the value of (λ-λ−2) was calculated and plotted against the applied stress F/AΟ. The relationship curves showed almost straight lines, as shown in Figure 8. From the slope of the curves, the Mc value was calculated. Consequently, the crosslink density (1/2Mc) can be determined as presented in Figure 9. Stress-strain curves for butyl/black sand nanocomposites. The relationship between black sand concentrations versus crosslink density.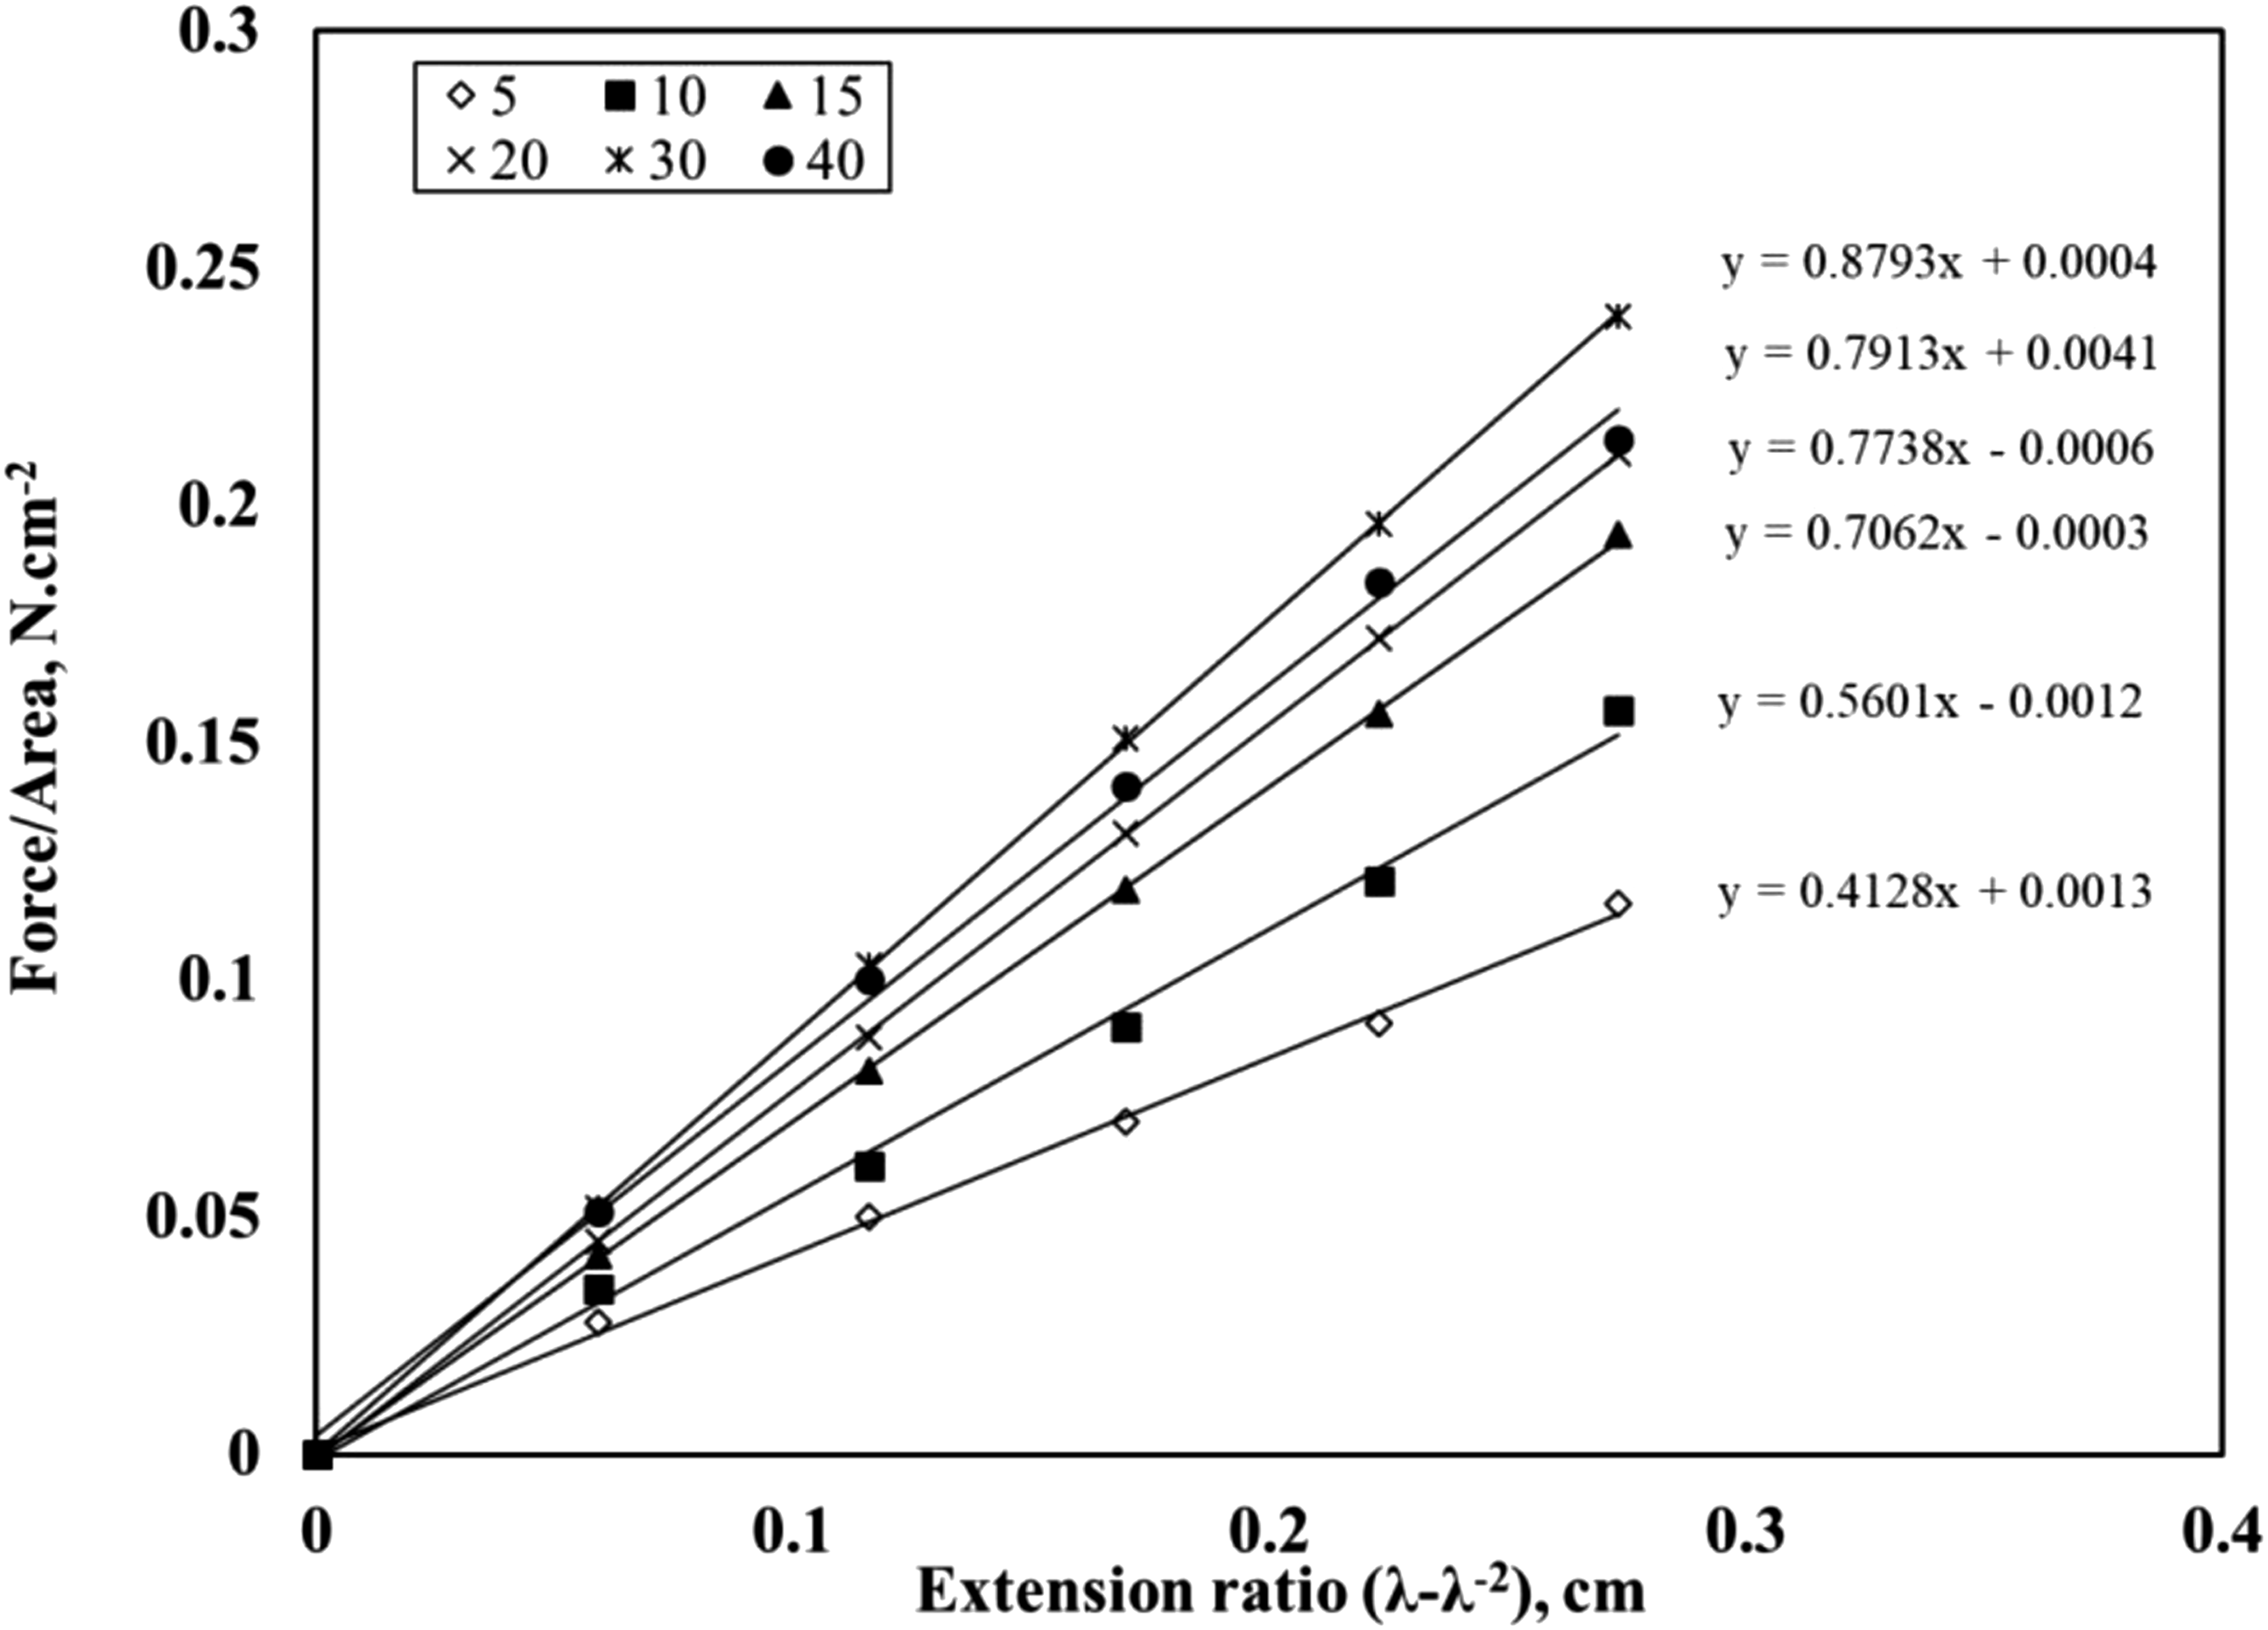
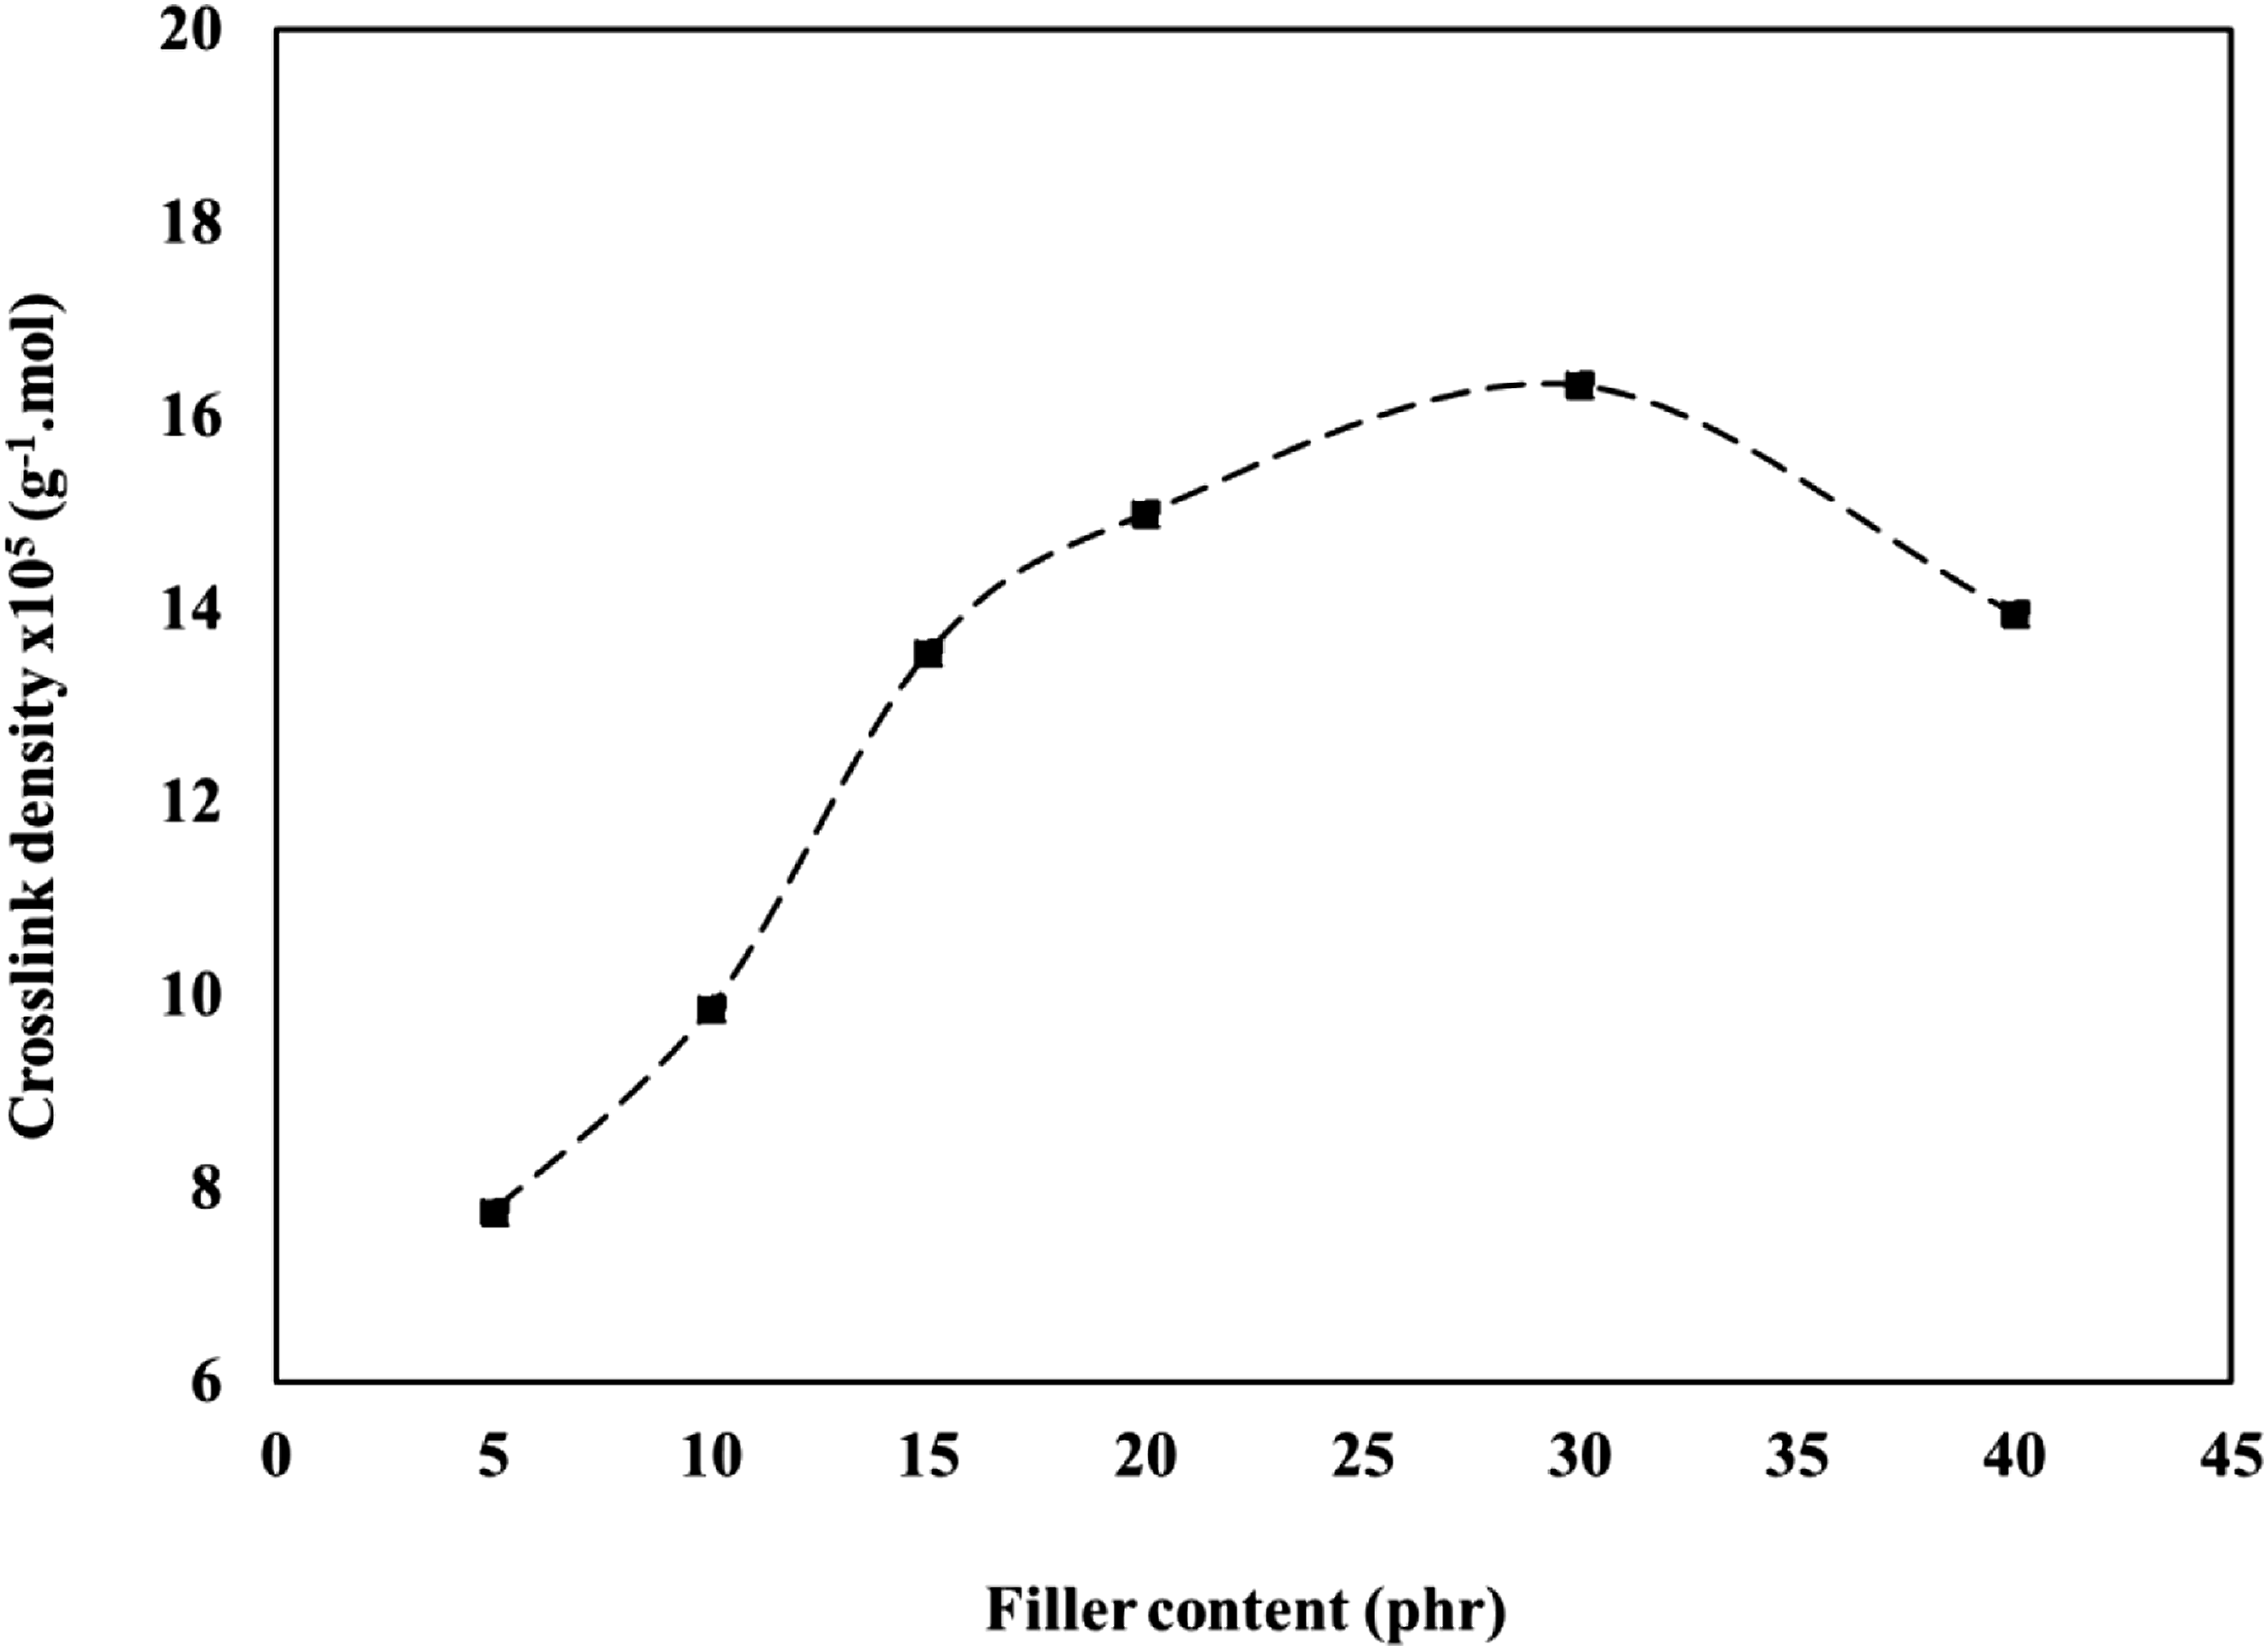
The effect of the nanofiller percentage on the crosslink density of the IIR compounds is shown in Figure 9. The addition of 5.0 phr of BS into the IIR compound increased the crosslink density, and further increase up to 30 phr of the BS loadings increasing the crosslink density. This observation is in line with the result of the curing characteristics as presented in Figure 5.
Mechanical properties
Mechanical properties of IIR with various loadings of black sand.
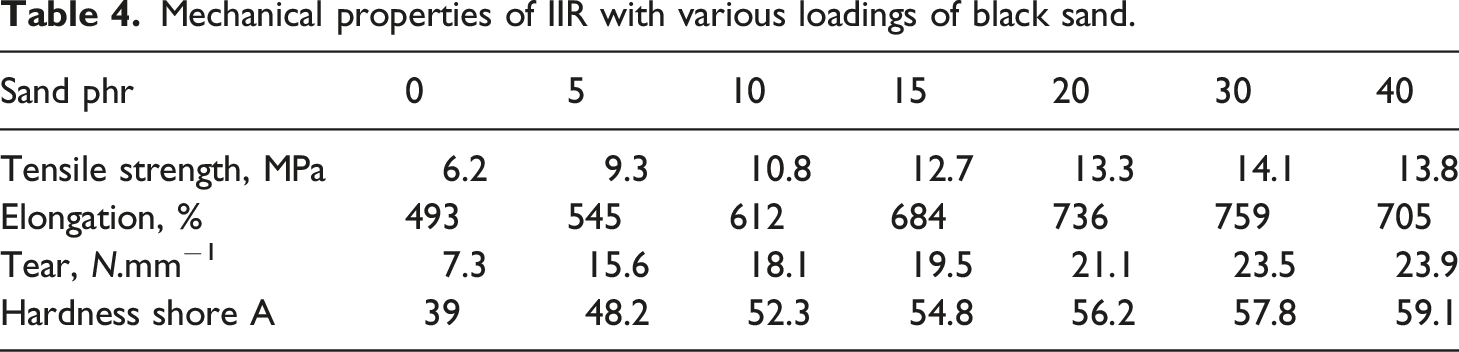
The tear strength of the IIR increased with increasing filler content, with a maximum value of 40 phr. As the filler content increased, the tear strength of black sand-filled IIR increased from 7.3 N.mm−1to 23.9 N.mm−1. The hardness of the BS-filled IIR reached a maximum value at 40 phr. The rigidity and stiffness of the sample increased as the crosslink density within the polymer matrix increased. This indicates that the size and structure of the added small particle size filler are the main factors controlling the improvement of rubber mechanical properties.
Dynamic mechanical properties
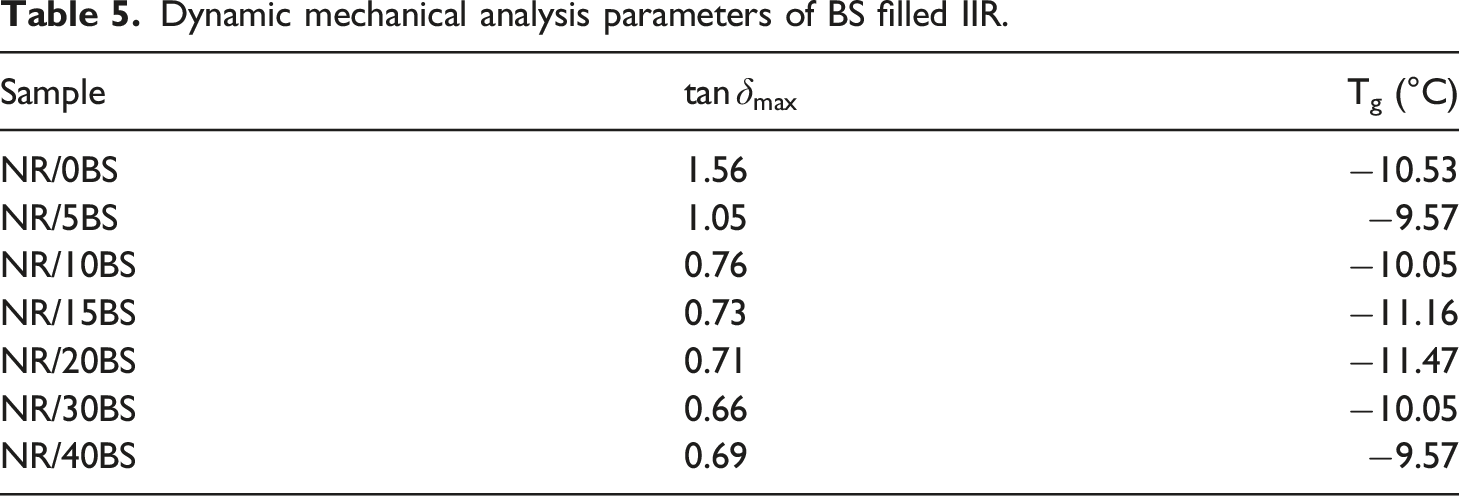
Storage modulus corresponds to the mechanical energy stored by the material in the loading cycle. Consequently, the storage modulus is related to the stiffness and shape recovery of the polymer during loading. Figure 10 compares the tan δ curves for polymer composites with different concentrations of black sand at a heating ramp of 5°C/min and a frequency of 1 Hz. The relatively flat region at lower temperatures corresponds to the rigid (glassy) state of the polymer. The steep rapid increase in tan δ results from significant softening and rubbery flow. All the curves show three distinct regions: a glassy region where the segmental mobility is restricted, a transition zone with a substantial increase in the tan δ values with an increase in temperature, and a rubbery region (the flow region) with a drastic decay with temperature. Increasing the filler loading led to marked changes in the dynamic properties of the compounds. The tan δmax represents the height of the peak of the relation between tan δ and temperature. The value of tan δmax is inversely proportional to the interfacial adhesion between the polymer matrix and filler; as the interfacial adhesion increases the value of tan δmax decreases. As can be shown from Table 5, the composites which contain BS displayed a lower tan δmax than the unfilled composites, which indicates that the addition of BS improves the interfacial adhesion between IIR and BS. Meanwhile, there is no significant change in the Tg value in the presence of BS. Variation of tan δ of IIR vulcanizates filled with different loading of BS. Dynamic mechanical analysis parameters of BS filled IIR.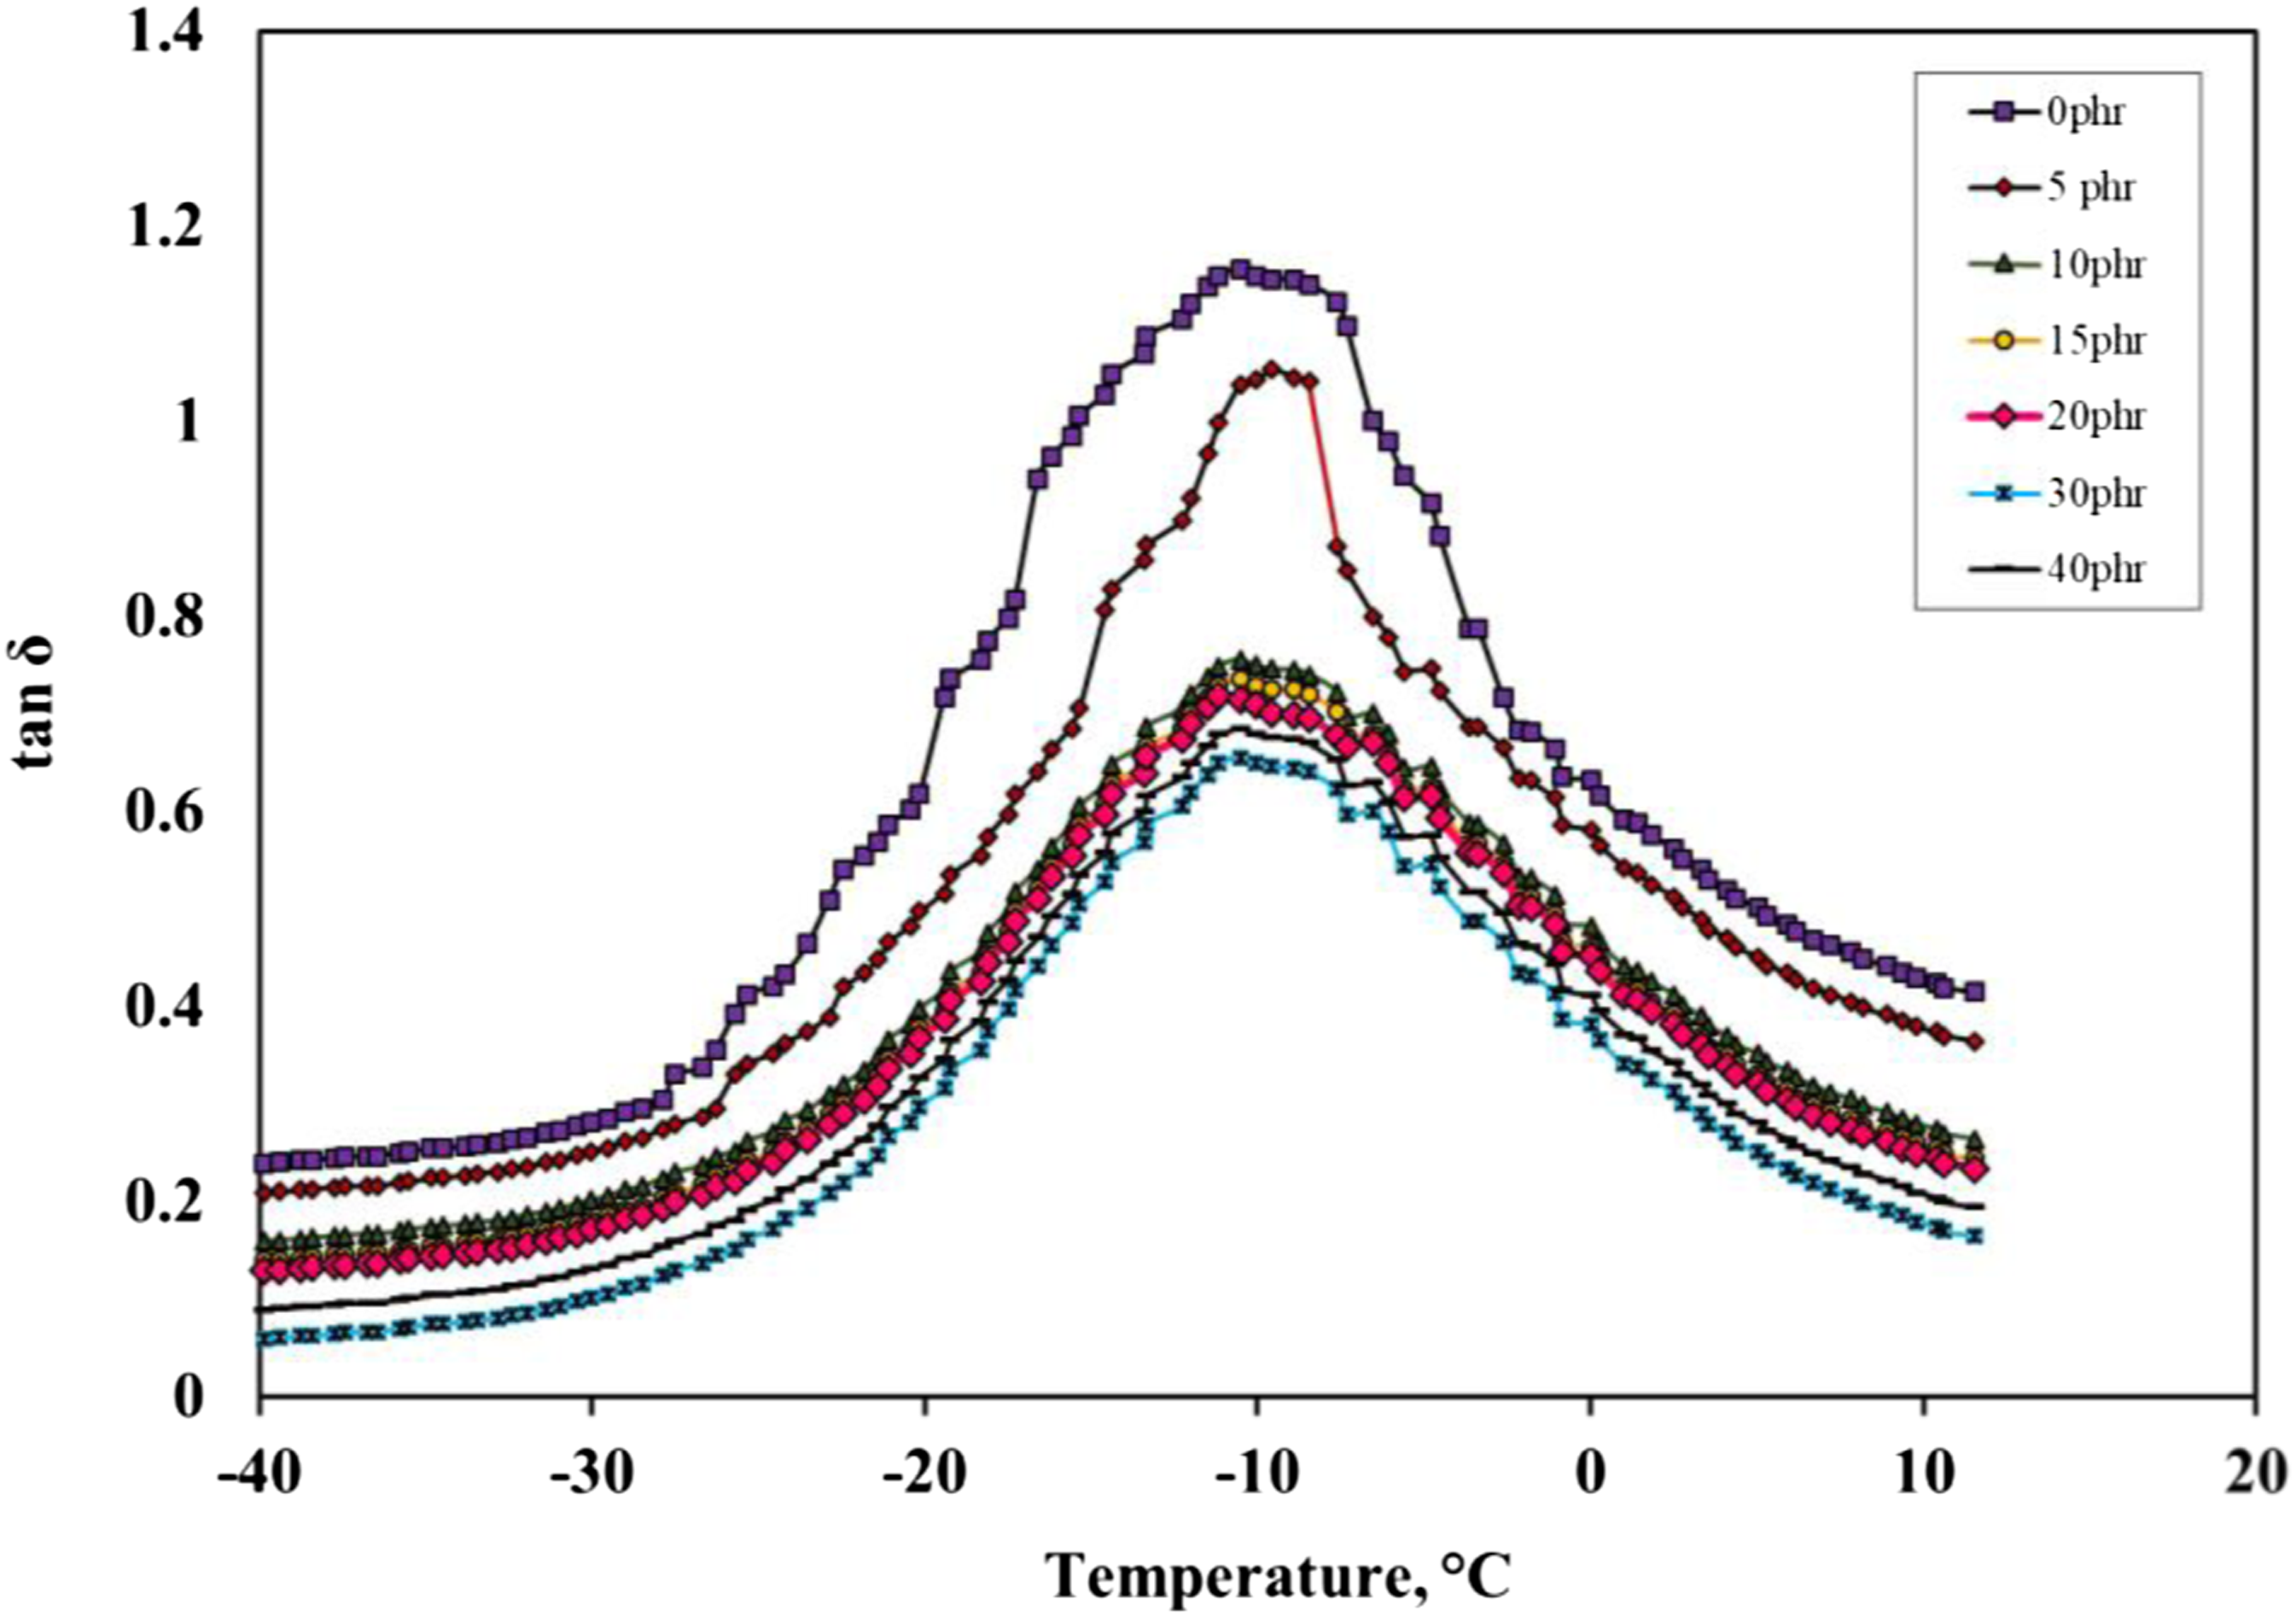
The value of the reinforcing factor, R, can be used to evaluate the filler–rubber interaction: a larger value of R indicates a stronger interaction,
52
where R is given by the equation (9):
The R values of the IIR vulcanizates with different loadings of BS were calculated by the data obtained from Table 5 and presented in Figure 11. It can be seen from Figure 11 that the R-value of the BS-filled IIR increased with increasing filler loading indicating the significantly strong BS–IIR interaction; moreover, increasing the filler loading led to marked changes in the dynamic properties of the compounds. The filler particles act as physical obstacles in the IIR matrix, reducing the mobility of the polymer chain segments so that higher filler content led to more physical entanglements or crosslinks, more complex dynamic properties of IIR, and an increased diminution of the loss peak. The R value of IIR vulcanizates filled with different loading of BS.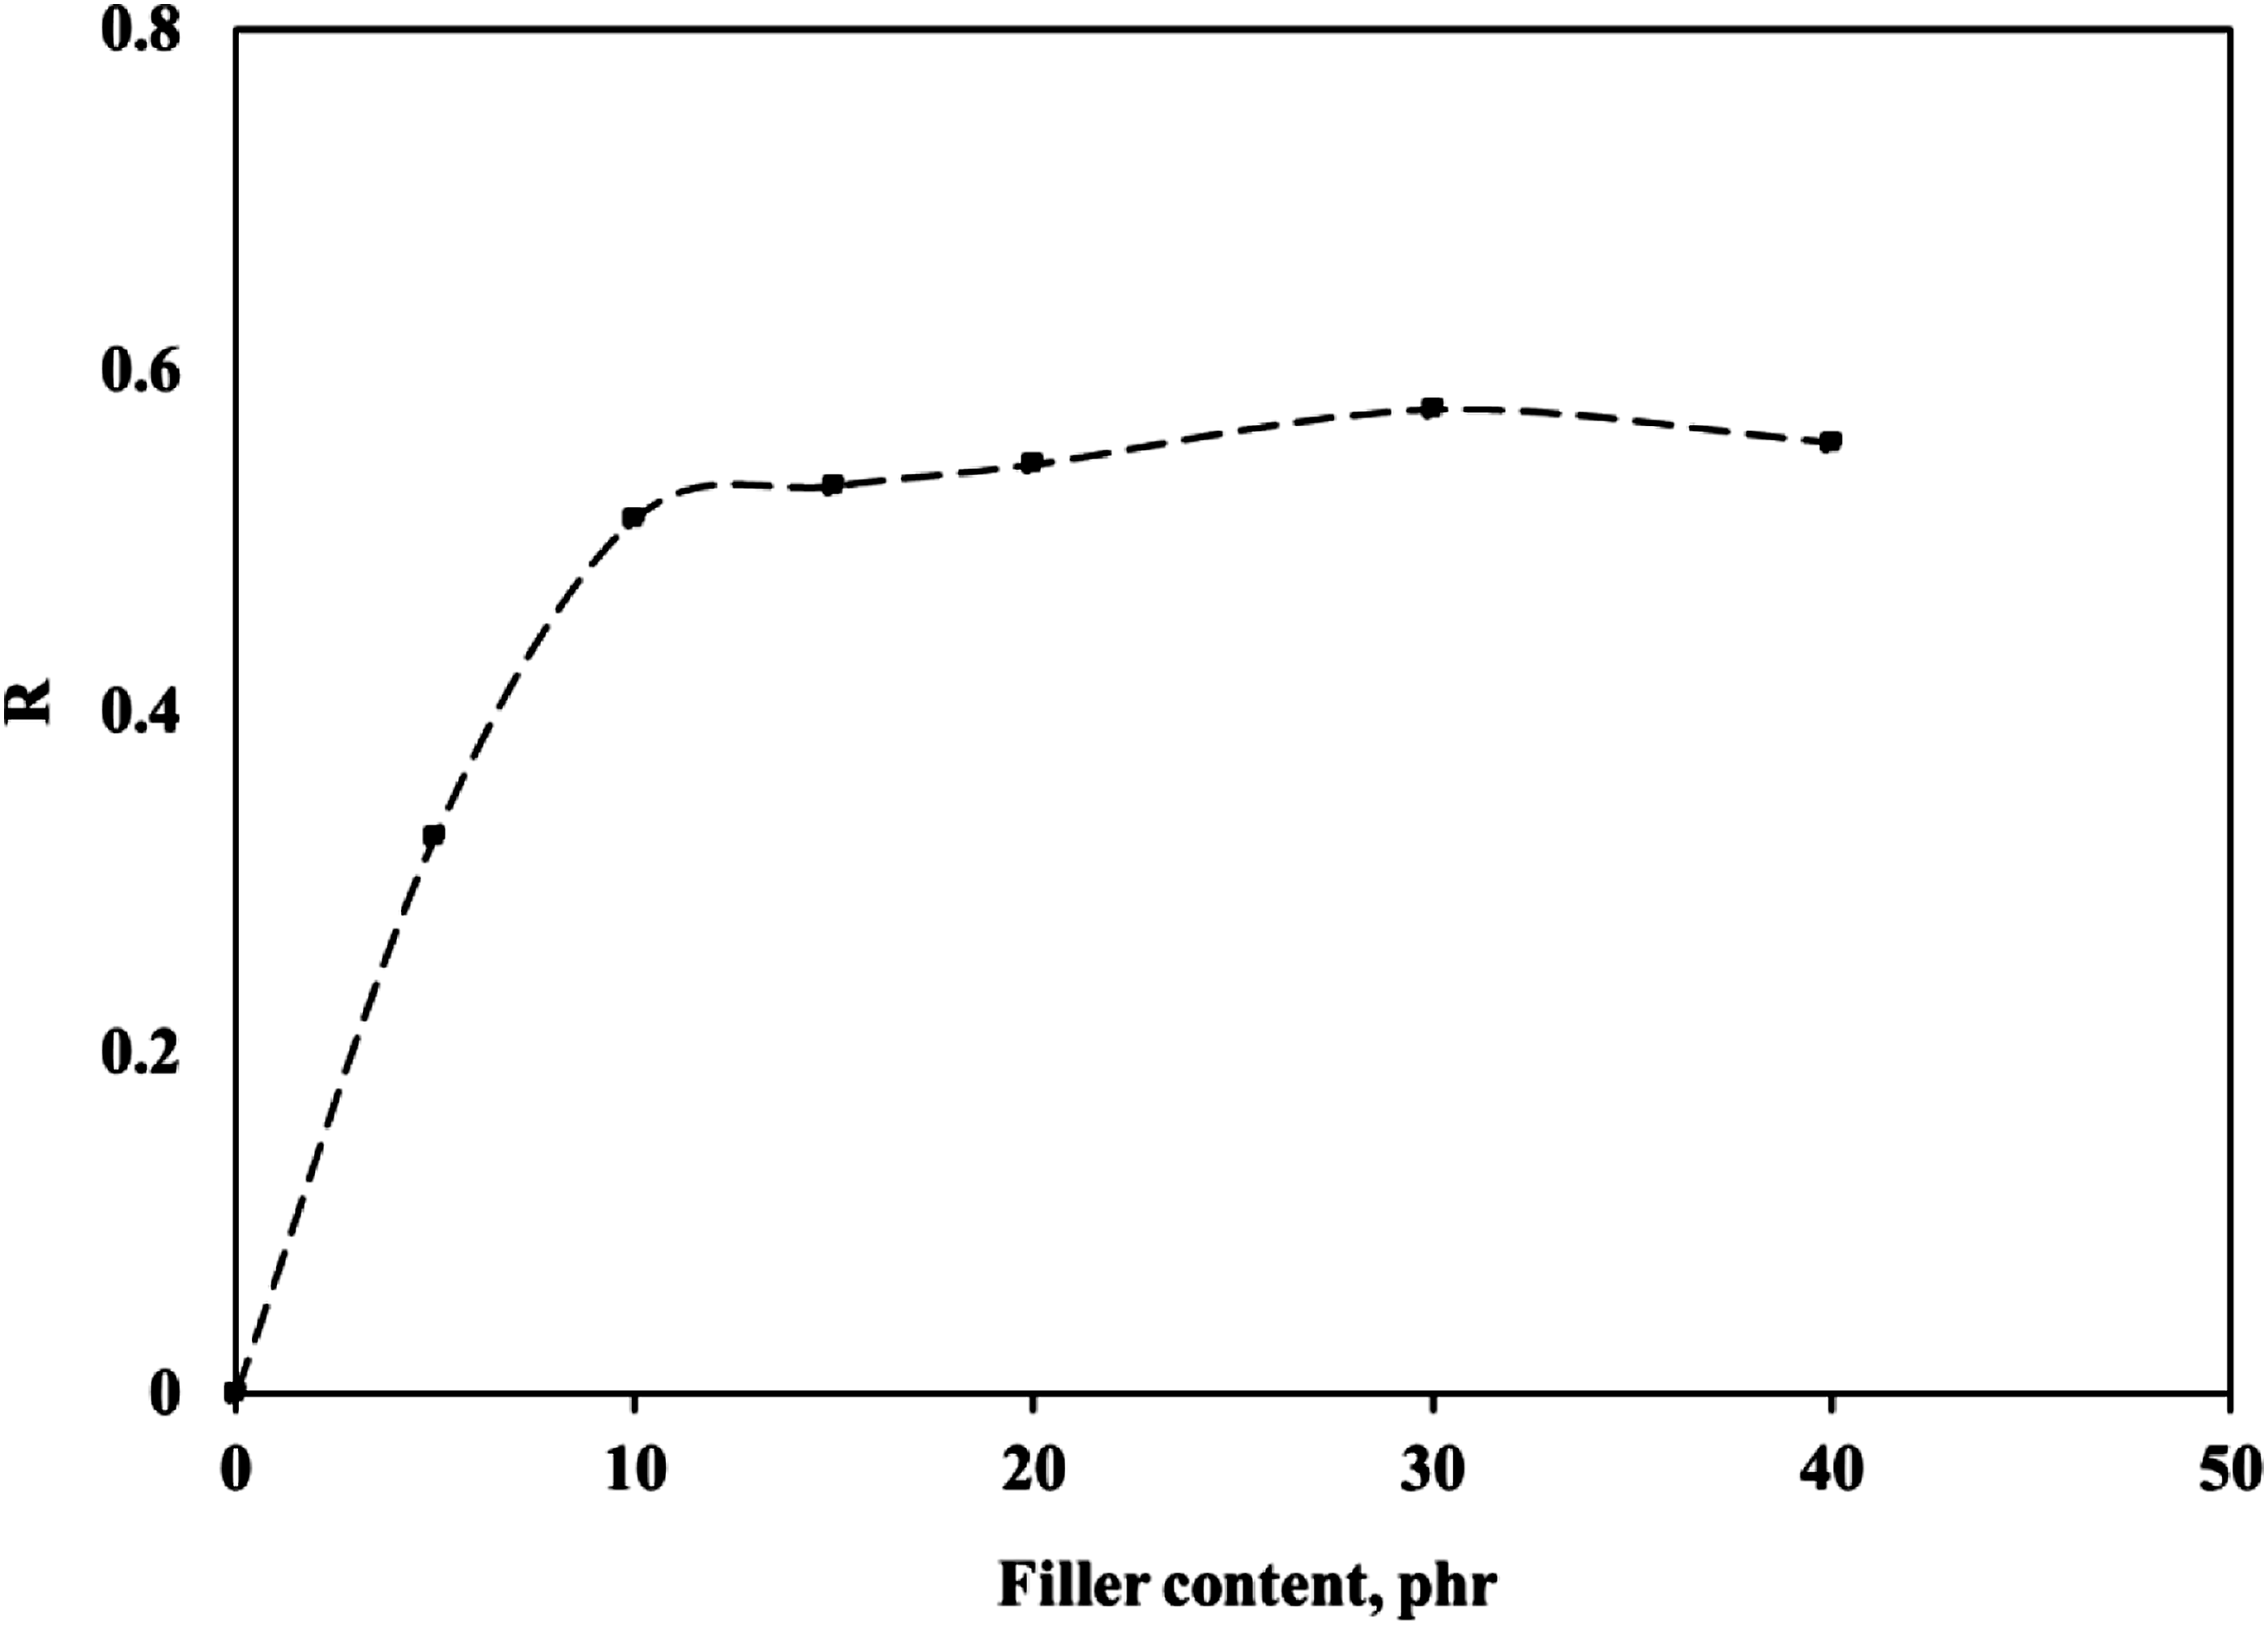
Conclusion
The FTIR and XRD analysis showed that the black sand nanoparticles used in this study are contaminated with metals and metal oxides. The identified compounds are quartz, Albite, baddeleyite, metal oxides, heavy silicate, and radioactive materials. The TEM revealed that the black sand particles have an average particle size of 17.72 nm. The incorporation of BS in the butyl rubber improves the vulcanization reaction by the lower cure time relative to unfilled IIR compounds. The modulus at a low strain of filled and unfilled rubber is a reliable method through Guth’s proposal to detect the shape factor of black sand in rubber. The shape factor of black sand in IIR is independent of the black sand concentration. It is found that thermal stability was significantly affected by the addition of the BS nanoparticles. The addition of BS improved the bound rubber content of IIR composites compared to the unfilled composite. Mechanical properties increased with an increase in filler loading. A superior percent of properties were observed at 30 phr of BS nanoparticles in the IIR matrix. The R-value also demonstrated that the BS-IIR interactions were stronger than the unfilled IIR.
Footnotes
Declaration of conflicting interests
The author(s) declared no potential conflicts of interest with respect to the research, authorship, and/or publication of this article.
Funding
The author(s) received no financial support for the research, authorship, and/or publication of this article.
ORCID iD
Aggregation structure of carbon black
39