
Abstract
Ultra-high molecular weight polyethylene (UHMWPE) composite armor offers a high level of lightweight protection. In the manufacturing of complex curvature UHMWPE based protective materials, UHMWPE composites are transformed from flat sheet stock to a near net shape complex curvature preform through deep-draw forming. The development of a deep-draw forming process model is critical for predicting UHMWPE sheet deformation during processing and knowing the fiber orientations at each location in the entire final part. This work introduces a robust methodology to model the deep-draw forming process. The model is validated by comparing critical output with experimental results for multiple UHMWPE materials and over a range of part thicknesses. A hemispherical geometry is used to demonstrate the methodology. A homogenization strategy for grouping sheets is presented and validated, which is critical for keeping computational times manageable. The influence of the material in-plane shear response, a critical model input, is investigated. The model developed in this work represents a valuable tool for selecting deep-draw forming parameters and accelerates the evaluation of new and emerging UHMWPE materials for application in manufacturing complex curvature protective armor.
Keywords
Introduction and motivation
Complex curvature parts for ballistic and blast protection are currently formed from ultra-high molecular weight polyethylene (UHMWPE) due to its high strength to weight ratio. Examples of complex curvature parts for protective applications include helmets, shielding for engine blades, boat hull armor kits, aircraft cockpit armor, and blast shields for oil rigs. UHMWPE composites are comprised of aligned fibers or film cross plies embedded in a thermoplastic polymer matrix. A two-step process is utilized to convert the commercially available flat UHMWPE sheet stock into a complex curvature part. The material is cut and stacked before undergoing deep-draw forming to transform the two-dimensional flat sheets into a three-dimensional preform. The preform then undergoes high-temperature, high-pressure consolidation between matched metal tooling.
The focus of this work is the deep-draw preforming step, described in Figure 1. During the deep-drawing process, a punch presses the flat UHMWPE sheet stock through a die plate while a binder plate adds a through thickness clamping force on the material to mitigate wrinkling.
1
This process is done at elevated temperatures to ensure the thermoplastic matrix in the UHMWPE material is pliable.
2
The through thickness constraint of the binder causes in-plane frictional forces at the interface between the material and tooling, and shear deformation is developed in the UHMWPE layers, as the punch traverses. The shear deformation is nonuniform in the preform and the UHMWPE sheet thickness increases nonlinearly with shear angle.
3
As a result, thickness gradients can develop in the high shear zones, which contribute to nonuniform pressure distributions when consolidated in matched metal tooling designed to accept uniform thickness preforms. Nonuniform pressure during the consolidation phase can lead to either localized or global reduction in ballistic performance due to differential or insufficient compaction.4,5 The relationship between thickness gradients and part performance makes it critical to accurately predict preform thicknesses in UHMWPE composite forming. Compound curvature deep-draw forming process showing (left) an exploded view of the tooling, (center) the final state of the process, and (right) the composite shape after completion.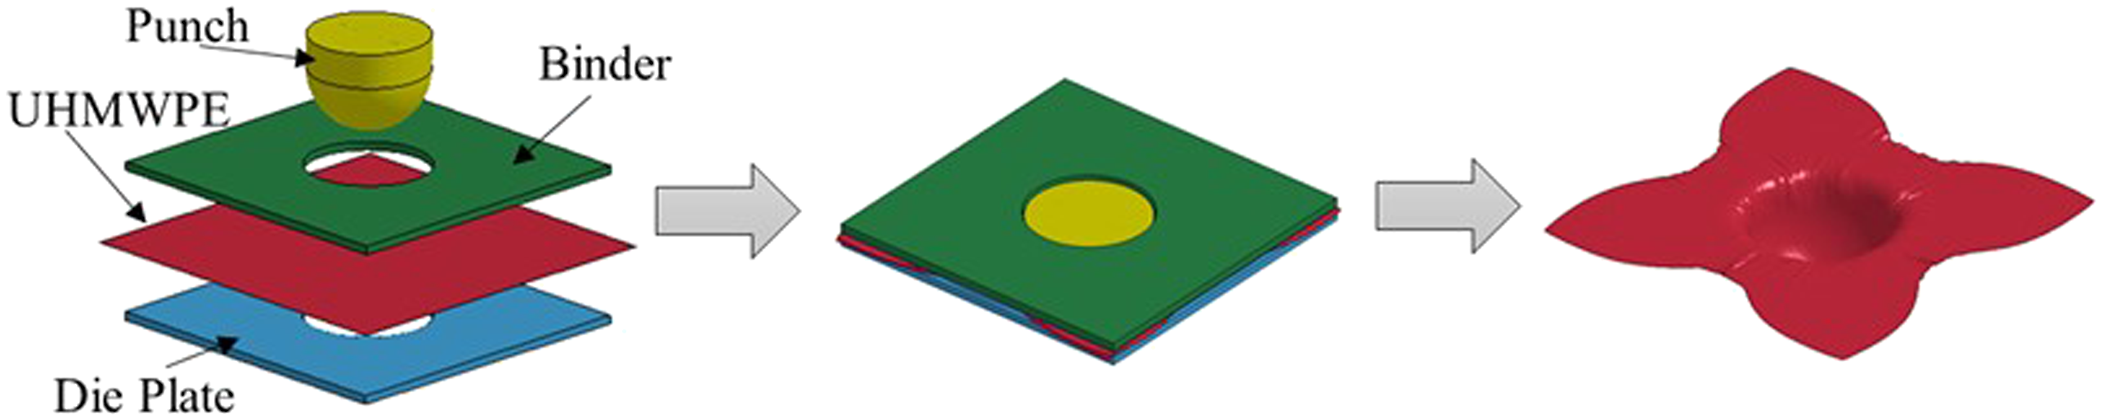
Extensive literature exists on modeling the forming of woven fabrics and carbon prepregs,6–11 with a much smaller community studying UHMWPE composites. Models describing the manufacturing of compound curvature geometries from flat sheet stock is challenging, which is why most of the available literature describes a simplified problem using a hemispherical geometry.1,8,12 Typical model validation procedures in literature include qualitative analysis of wrinkle formation13,14 and accurately predicting the load versus displacement results of characterization experiments.9,10,15 Despite the simplification to a hemisphere geometry, there is still a gap in the literature for a rigorously validated model, quantitatively examining errors in both thickness and shear angle predictions. Works available in the literature that do include multiple sheets of material13,16 do not validate models over a range of part thicknesses or expand the model to include multiple UHMWPE materials and/or resin systems. Validation over a range of part thicknesses is critical for modeling the forming of complex curvature parts, which can have up to 80 sheets of UHMWPE. Such a large number of sheets requires a scalable homogenization strategy to accurately model within a reasonable computational time. Additionally, the resin system of the composite has been shown to substantially influence the material in-plane shear response, 17 making it necessary to validate computational models using UHMPWE materials containing fundamentally different resin systems. Development of a robust, well validated model for the deep-draw-forming process will enable process design for and the rapid evaluation of new and emerging UHMWPE materials for ballistic and blast protection applications.
This work, which aims to fill many of the gaps described above, develops a computational model capable of predicting the in-plane shear deformation of UHMWPE layers during deep-draw forming. A methodology is established to characterize the thickness of manufactured preforms. Multiple procedures for measuring shear deformation in preforms are presented and evaluated. The experimentally measured preform thickness and shear deformation is used to rigorously validate the model. A homogenization strategy to enable forming simulations of many UHMWPE sheets within a reasonable computational time is presented, evaluated, and bounded. This strategy enables model validation over a range of part thicknesses and for multiple UHMWPE material systems, a level of robustness which has not previously been demonstrated. The influence of material in-plane shear response, which is critical in the forming process, is investigated using the computational model. This work, which exclusively utilizes built-in LS-DYNA material models and element formulations, makes UHMWPE composite forming simulations accessible for a larger community and should prove useful for the accurate prediction of fiber architecture and preform thickness in complex curvature UHMWPE composite manufacture.
Experimental Methodology
To validate the computational model, UHMWPE composite sheets are formed using a simplified version of a preforming device developed by DEVCOM-SC to form complex curvature parts. For this work, the preformer is outfitted to form hemispherical preforms. Preforms containing between 5 and 20 sheets are investigated. The preform thickness, in-plane shear deformation (i.e., fiber architecture) and temperature history are measured.
Materials
The materials used in this study are Dyneema™ HB210 and HB212, manufactured by DSM Protective Materials LLC (North Carolina, USA). Both Dyneema HB210 and HB212 are unidirectional prepregs consisting of Dyneema SK99 UHMWPE fibers embedded in a compliant matrix. Dyneema HB210 contains a thermoplastic polyurethane (TPU) matrix, while Dyneema HB212 contains a softer, synthetic rubber based polymer matrix. The fiber diameter and ply thickness of both systems are about 10 µm and 45 µm, respectively. The materials are supplied as [0/90]2 crossply laminates, resulting in a total sheet thickness of approximately 180 µm.
Layup
Two five-sheet stacks are formed, one with Dyneema HB210 and the other with Dyneema HB212. Additionally, ten-sheet and twenty-sheet stacks of Dyneema HB210 are formed. In each case N 53 cm × 53 cm crossply sheets are stacked in a 0/90 orientation to makeup a stack, where N is the number of sheets. Because each sheet is supplied as a [0/90]2 crossply, this results in a [0/90]2N stacking sequence. The outermost sheet is marked with a 25.4 mm × 25.4 mm grid, in which the gridlines are drawn with a permanent marker to identify the initially orthogonal principal fiber directions.
Preforming
The preformer, shown in Figure 2, consists of an 89-kN load frame with one hydraulic cylinder for actuating a central punch through a die plate and eight pneumatic cylinders for applying clamp force to the sheet stack using a single binder plate. The die and binder plates are made from 12.7-mm thick 6061-T6 aluminum. The punch is additively manufactured using Ultem (Stratysys, Eden Prairie, MN). The punch diameter is 17.78 cm and the die opening is 21.53 cm, resulting in a 6.35-mm die gap between the punch and the opening in the die plate when the punch was fully extended. The die plate has a 0.8-mm lead-in radius. Complex curvature deep-draw preforming apparatus.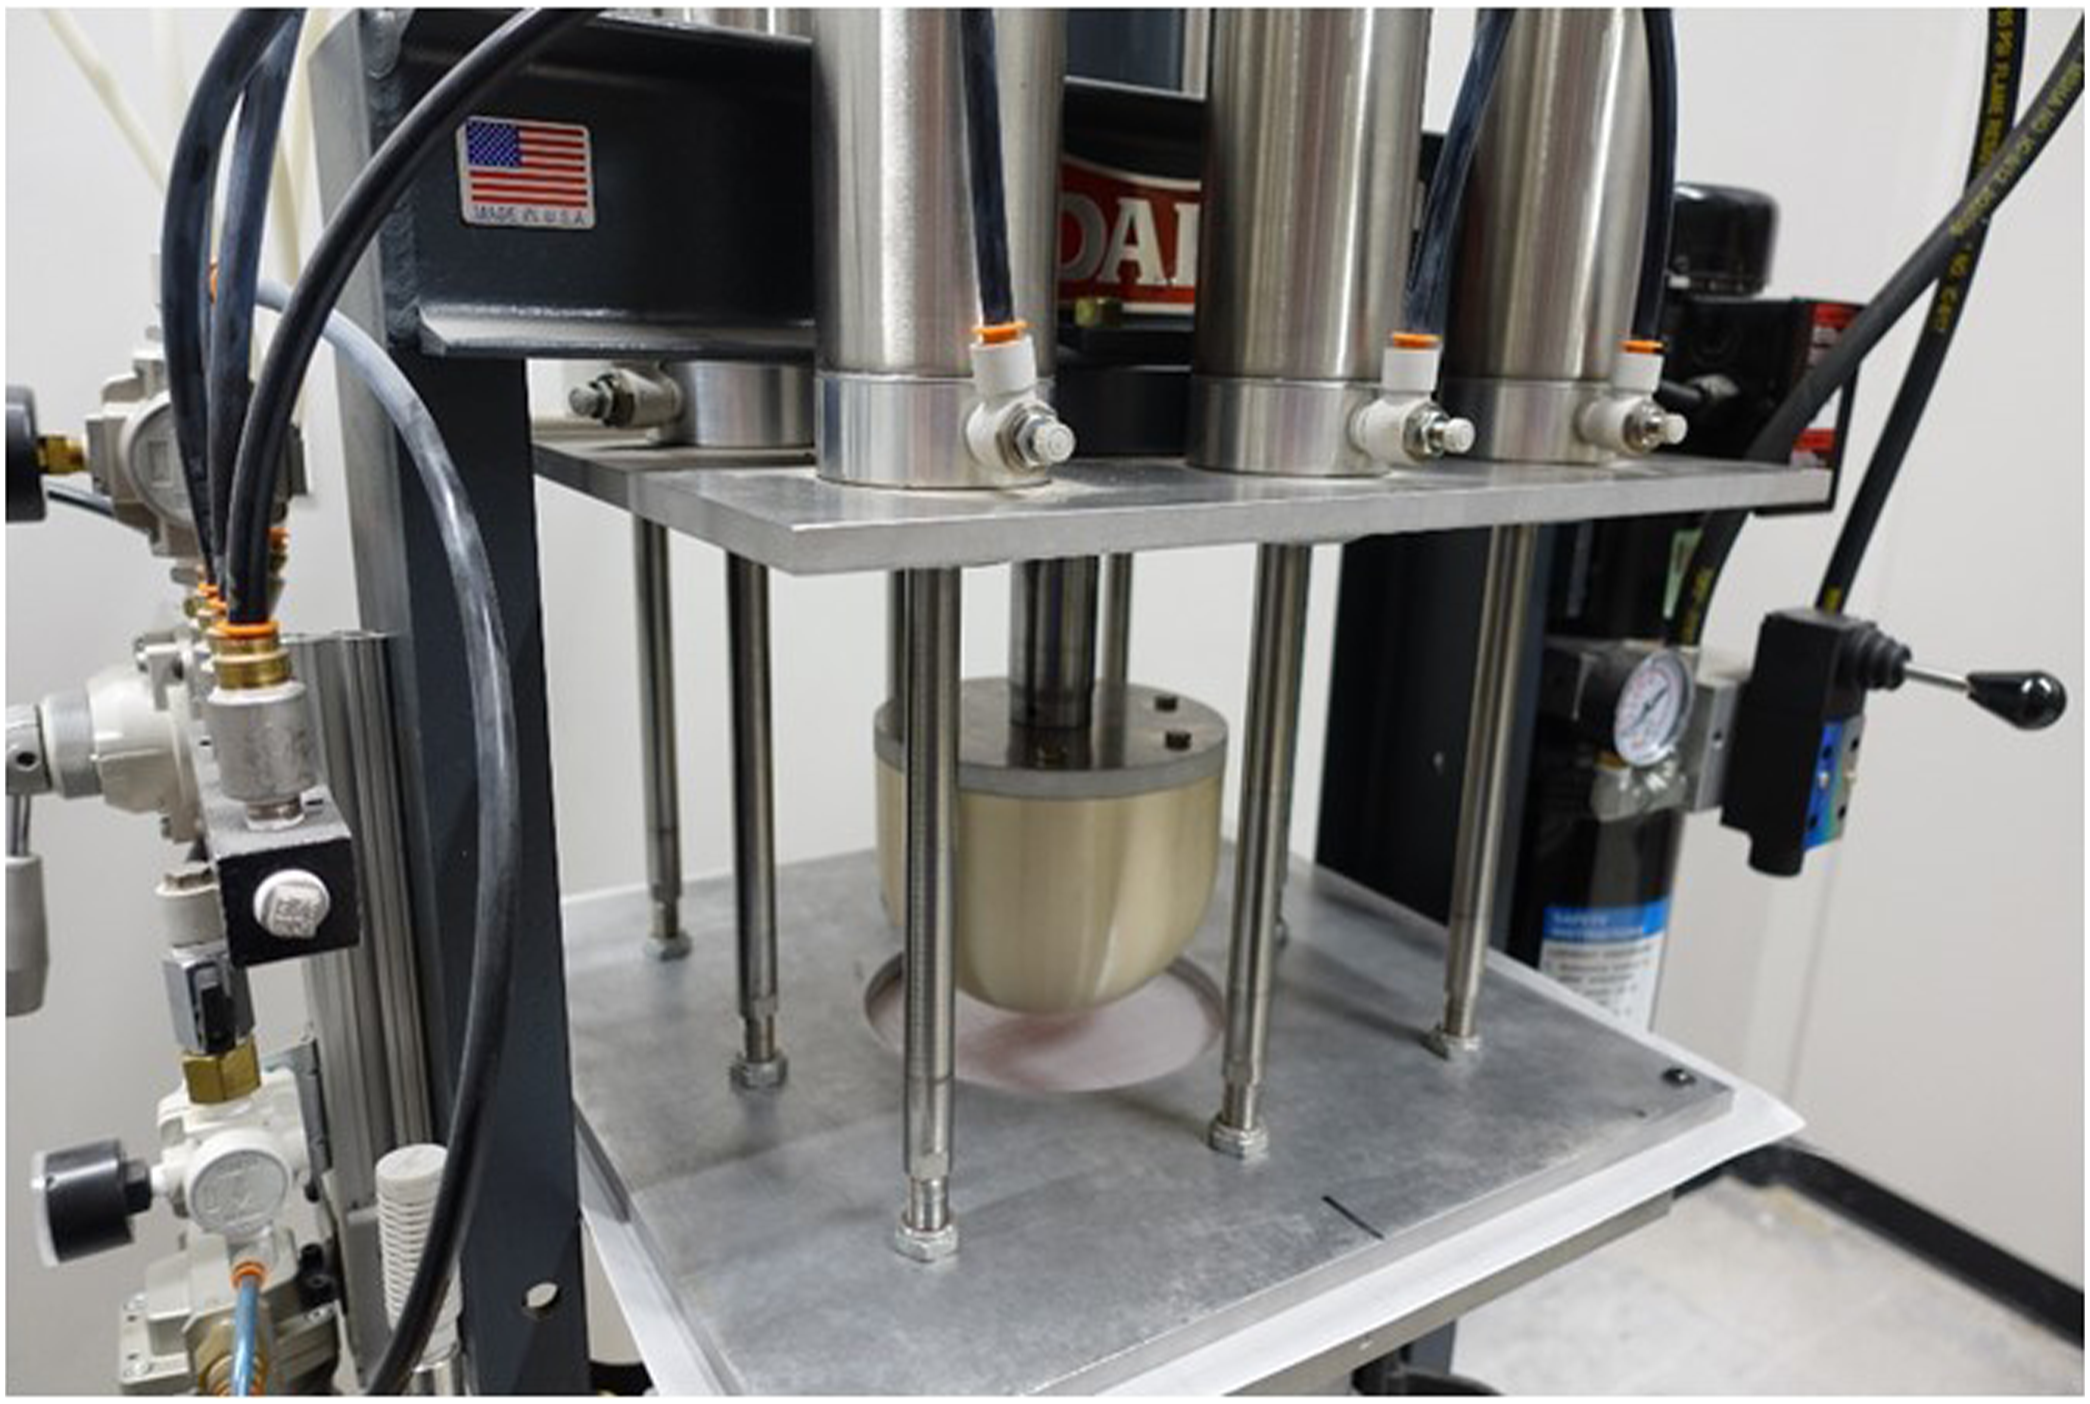
A layer of Stretchlon 800 bagging film (Richmond Aircraft Products, Sante Fe Springs, CA) is placed on both sides of the UHMWPE sheet stack. The sheet stack is sandwiched between the die and binder plates to prevent any of the sheets from shifting prior to forming. The preform assembly is preheated in a Binder FP400 convection oven (Binder GmbH, Tuttlingen, Germany) to 125°C for 105°minutes. After 105°minutes in the oven, the preform assembly is placed into the preforming press. The pneumatic cylinders are pressurized to 860 kPa with air resulting in a total binder clamping force of 32.5 kN. The punch is then extended at 12.5 mm/s until the mid-plane of the hemisphere is 25 mm beyond the top surface of the die plate. The preform is left in the press to cool to room temperature via natural convection for 1 hour before removal.
Thickness measurement
The thickness of the preform post forming is measured at the intersection of each gridline with a Mahr MarCator 0.0127-mm resolution dial indicator (Mahr GmbH, Esslingen). The indicator is fitted with a 3.2-mm diameter spherical tip and placed on an indicator stand with a 3.2-mm diameter anvil fitted with a 3.2-mm diameter spherical tip, as shown in Figure 3. To get an accurate measurement of a concave surface, it is important to ensure that the tip of the indicator is normal to the surface. Consider two axes, labeled Preform thickness measurement technique. The preform is rotated about axes,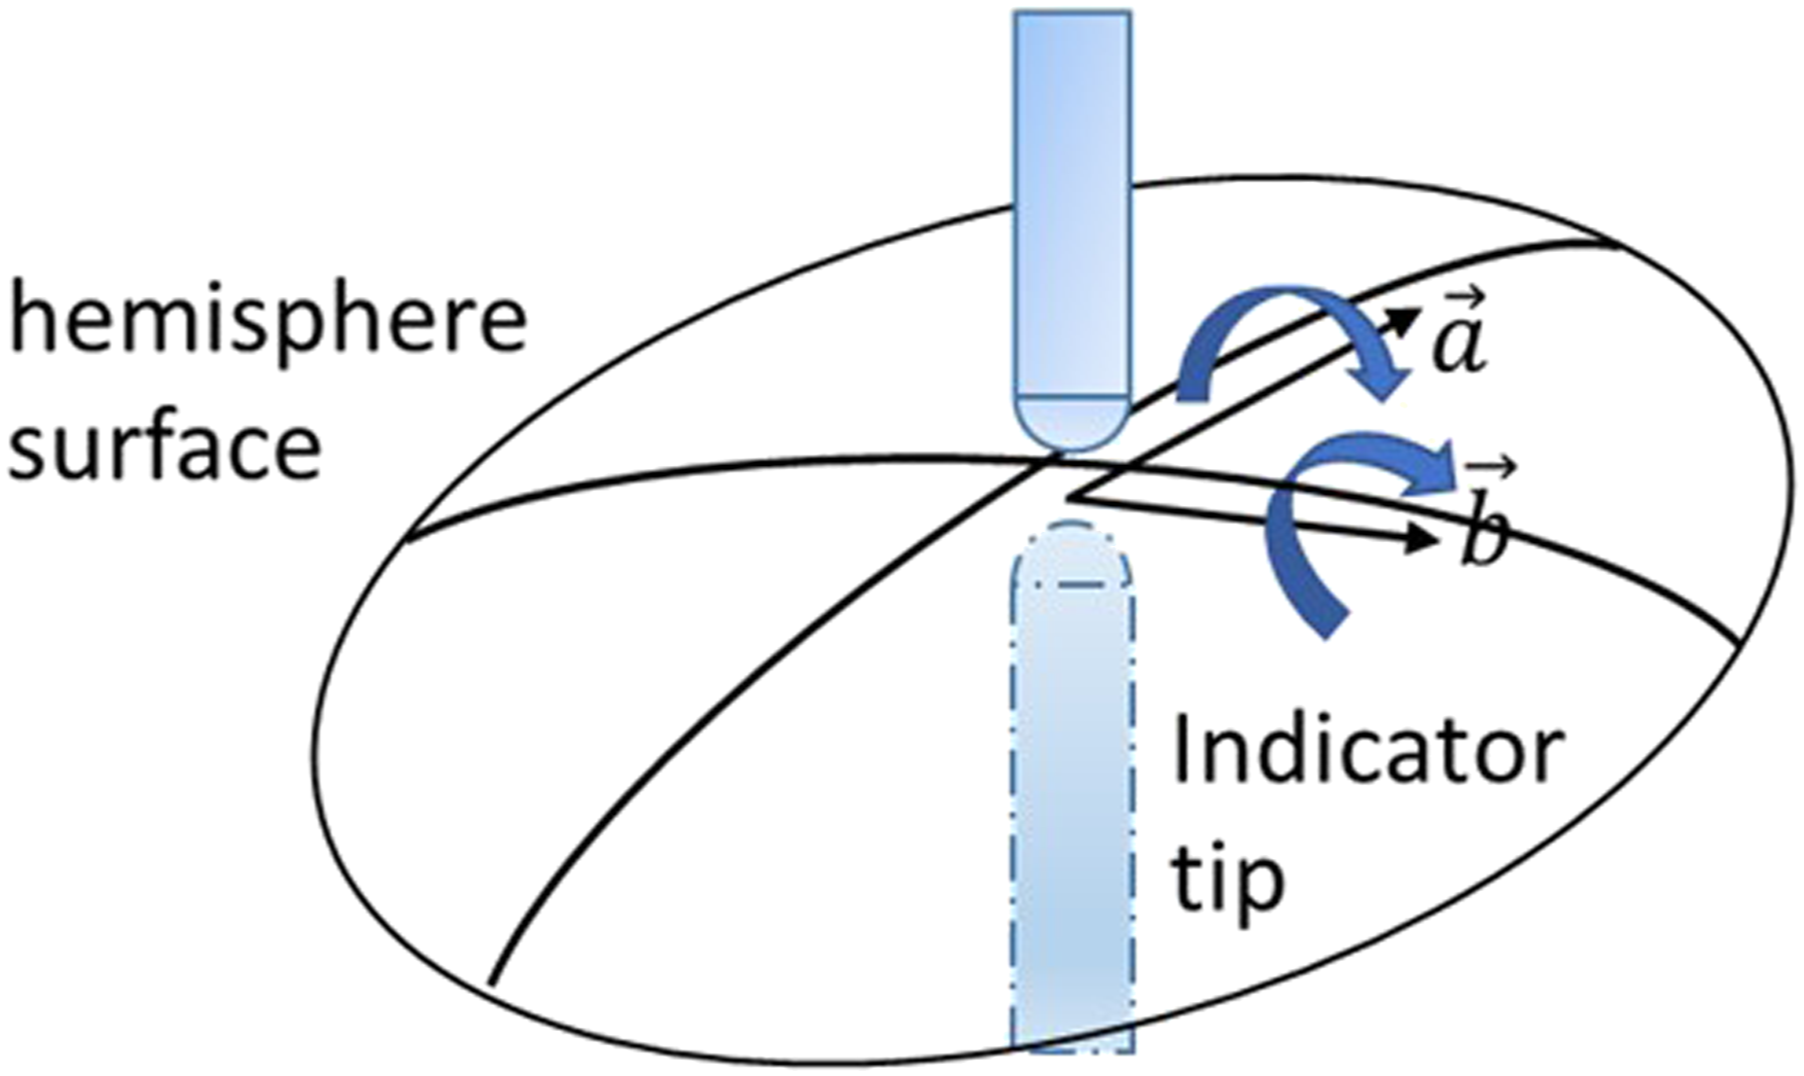
Fiber angle measurement methodologies
Measuring the shear angle on hemispherical preforms presents many challenges due to the curvature of the surface and the continuously changing shear angle throughout the preform. The shear angle and thickness measured on the part surface can be used to validate the conservation of volume-based shear-to-thickness transfer function, which has been derived and verified for a limited amount of data in literature
1
:

Here
A goniometer is a hinged tool capable of measuring the angle between lines formed by the vertices of the deformed grid. The advantage of the goniometer is that it allows the user to directly record angles between lines on a grid, without having to traverse far from the vertex. Keeping all measurements close to the vertex negates errors due the shear angle changing within the measurement area. This method also eliminates any error associated with optical parallax. The disadvantage of using a goniometer is that it is designed for flat surfaces, which introduces some degree of error when using it on a doubly-curved surface.
In the second technique, three-dimensional coordinates of each vertex are characterized using a MicroScribe, which has been shown to have an accuracy of 0.23 mm.
18
Each square on the grid, prior to any extension seen during processing, has a length of 25.4 mm, making the measurement error from the MicroScribe < 1% of the initial edge length. The angle between fibers at each vertex ( Characterization of shear angle on (a) preformed parts using (b) ImageJ built-in pixel based measurements and (c) vectors measured with MicroScribe to calculate the shear angle.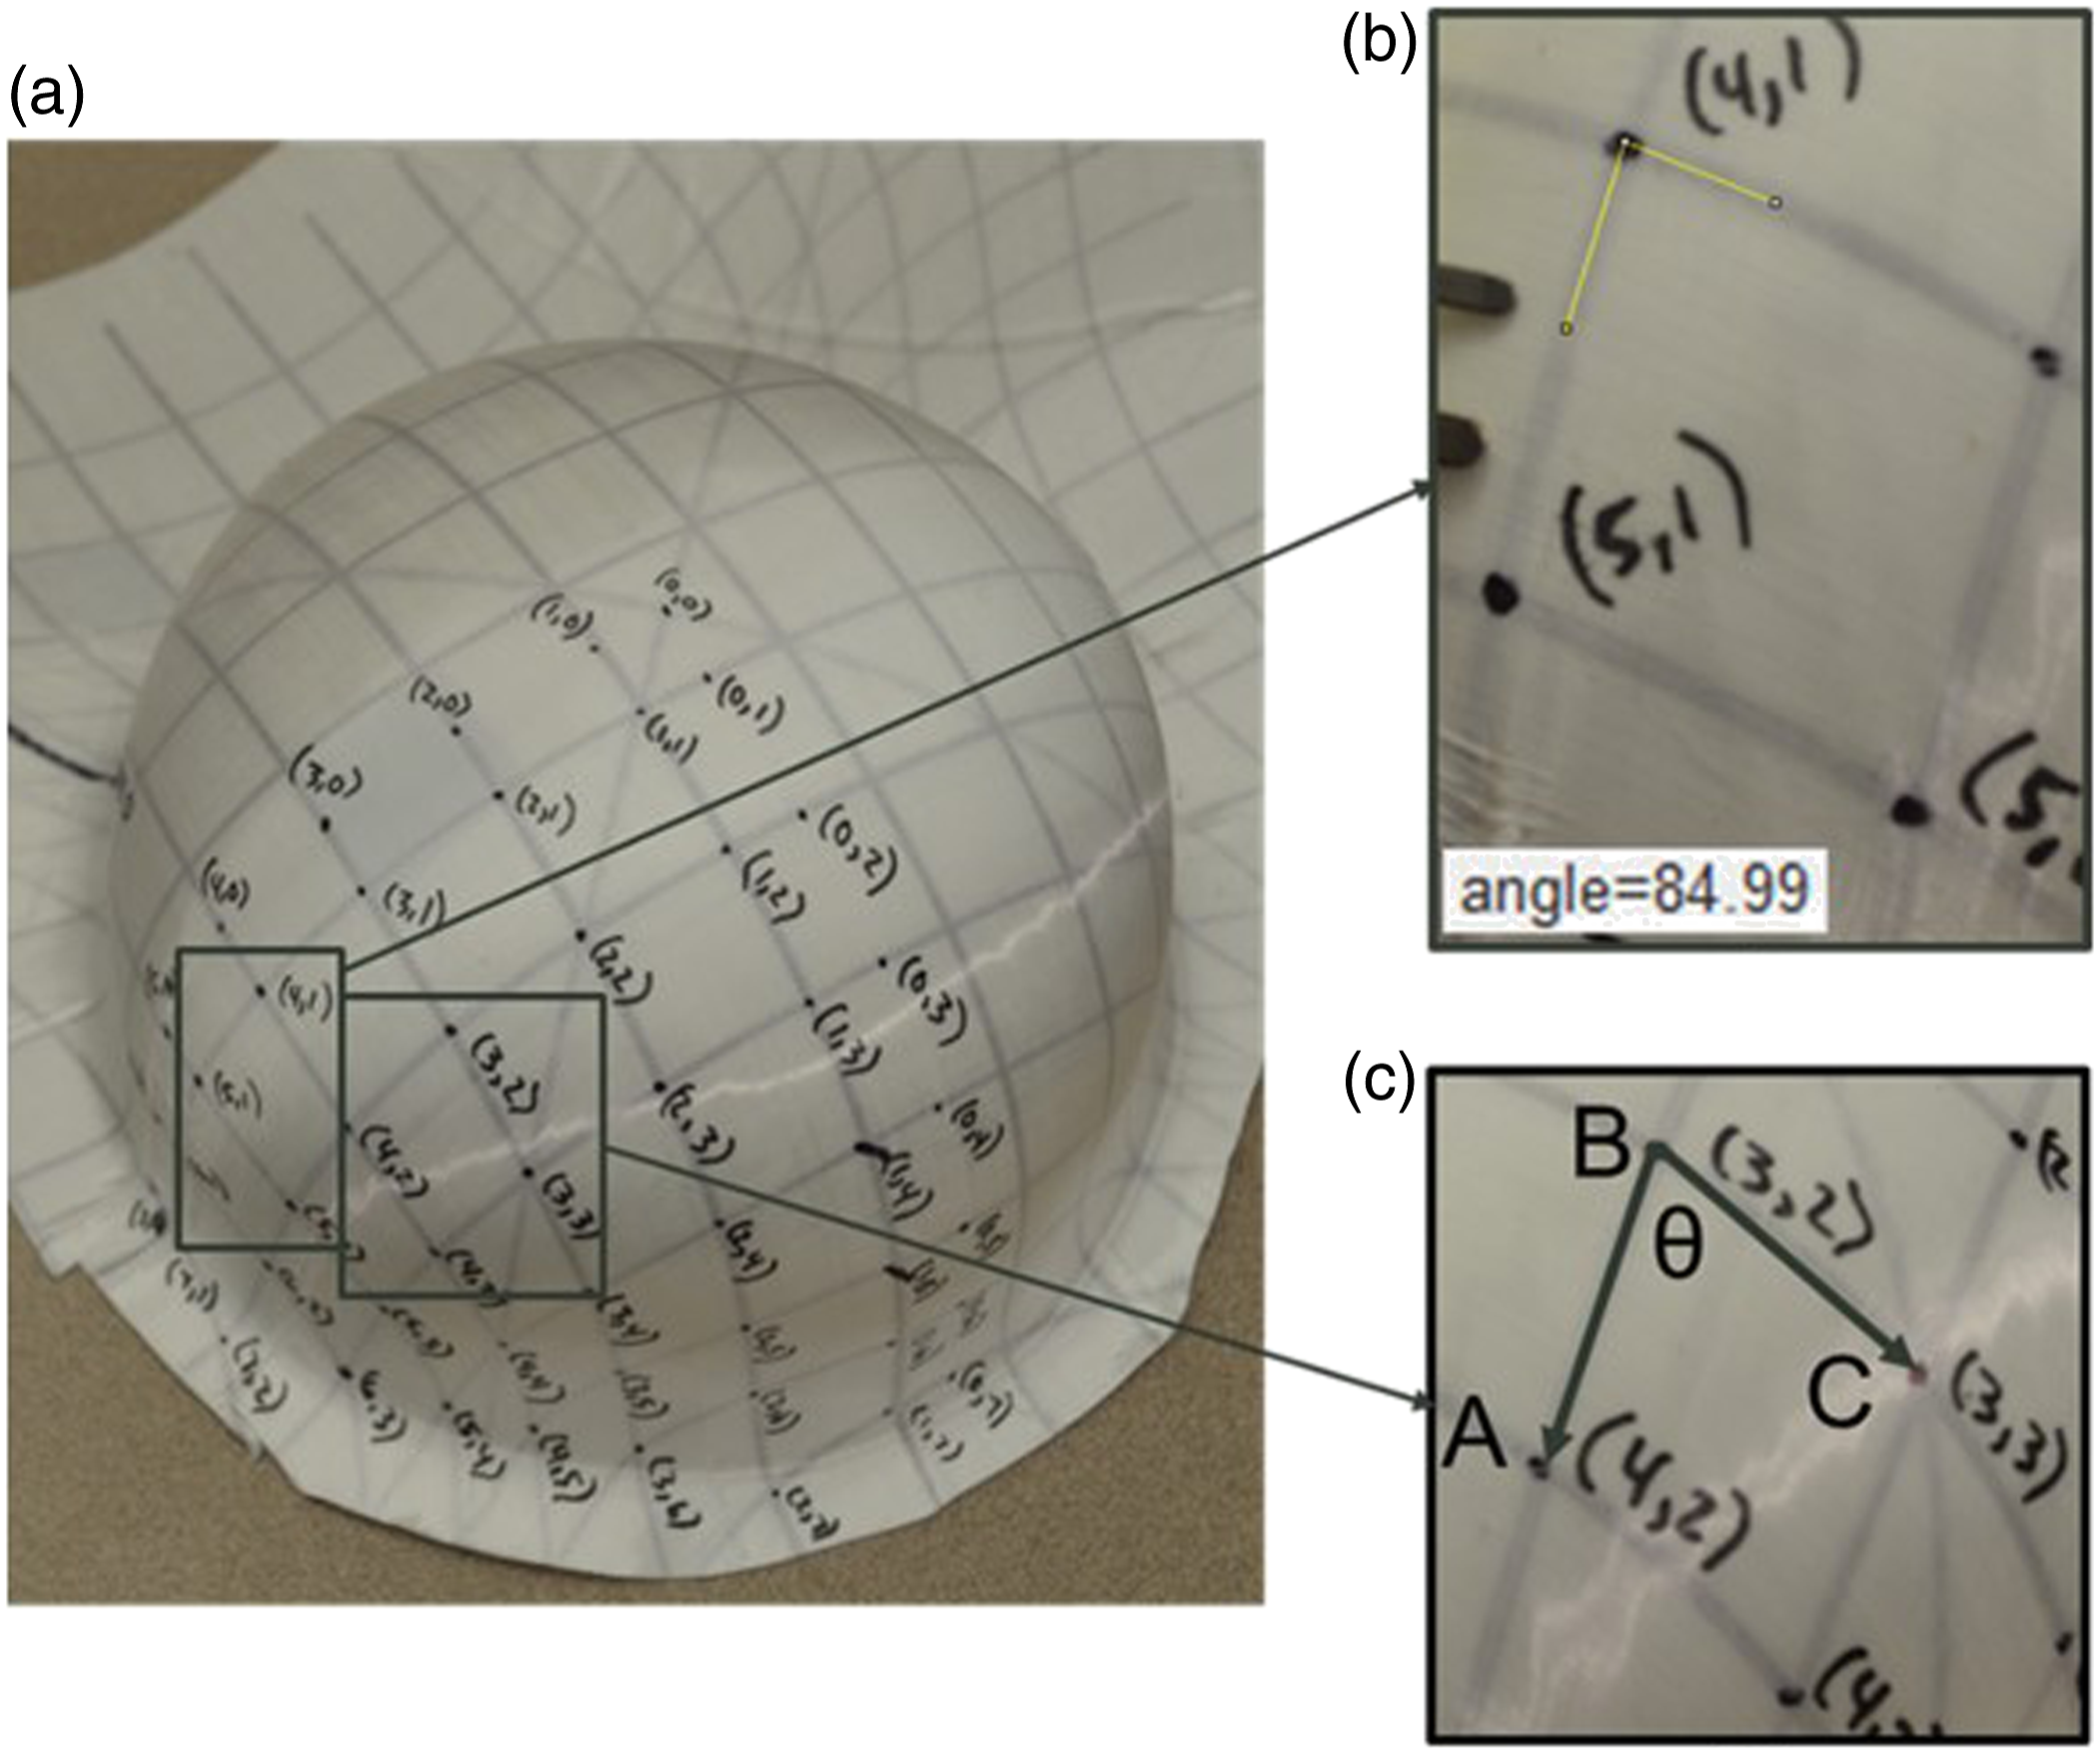

Here,
The measured angle between fibers is then converted to the in-plane shear angle (in degrees) through:

This process is repeated for each grid point to gain insight into the shear strain field throughout the preform.
The final method examined for characterizing the shear angle is through use of the open source image processing program ImageJ. 19 For each point in the grid, an image was taken, as close to perpendicular to the surface as possible. The angle between the gridlines is measured in ImageJ, as shown in Figure 4-(b). The measured angle is then converted to shear angle using equation (3). The advantage of the ImageJ method is the ability to get precise angle measurements without having to expand far beyond the vertex (i.e. not having to extend the line all the way to the next intersection). Although care is taken to minimize errors, a disadvantage in this method is that there are small errors in placing the ImageJ angle endpoints in the center of the marked line and the camera is not perfectly perpendicular to the surface, which introduces a parallax error. The propagation of these errors is not considered significant, and it is expected that this method is the most accurate of the three because it measures the angle local to each point and does not assume that the grid lines stay linear.
Preform temperature history
To get an accurate measurement of the temperature of the laminate during forming, thermocouples are placed in a 5-sheet stack during the 105-minute heating cycle. Two type K thermocouples (Omega, Type K part#5SC-TT-K-40-36) are placed between sheets 2 and 3, one directly in the center of the sheet stack and the other in a corner 9 cm from each edge. Temperature is captured at 1 Hz with a thermocouple data logger (PICO Technologies, USB TC-08).
Numerical Model
An explicit dynamic finite element model is used to predict the deformation of UHMWPE sheets during thermoforming. The LS-DYNA solid mechanics model includes the hemispherical punch, binder plate, die plate, and UHMWPE sheet(s), with an initial configuration depicted in Figure 5-(a). The punch is lowered through the die plate at a constant velocity, which deforms the UHMWPE material. The binder provides an out-of-plane clamping force to limit material wrinkling. The in-plane tensile force is applied through friction at the binder-UHWMPE interface and ensures in-plane shear is the primary deformation mechanism. The simulation terminates when the punch is fully traversed (i.e. when the punch displacement is equal to the hemisphere radius plus the initial gap between the UHMWPE sheets and punch), as shown in Figure 5-(b). Isolating the UHMWPE material allows for examination of final configuration and shape, as shown in Figure 5-(c). (a) Initial preforming model configuration, (b) final state of the model, with the punch fully embedded in the UHMWPE, and (c) UHMWPE preform.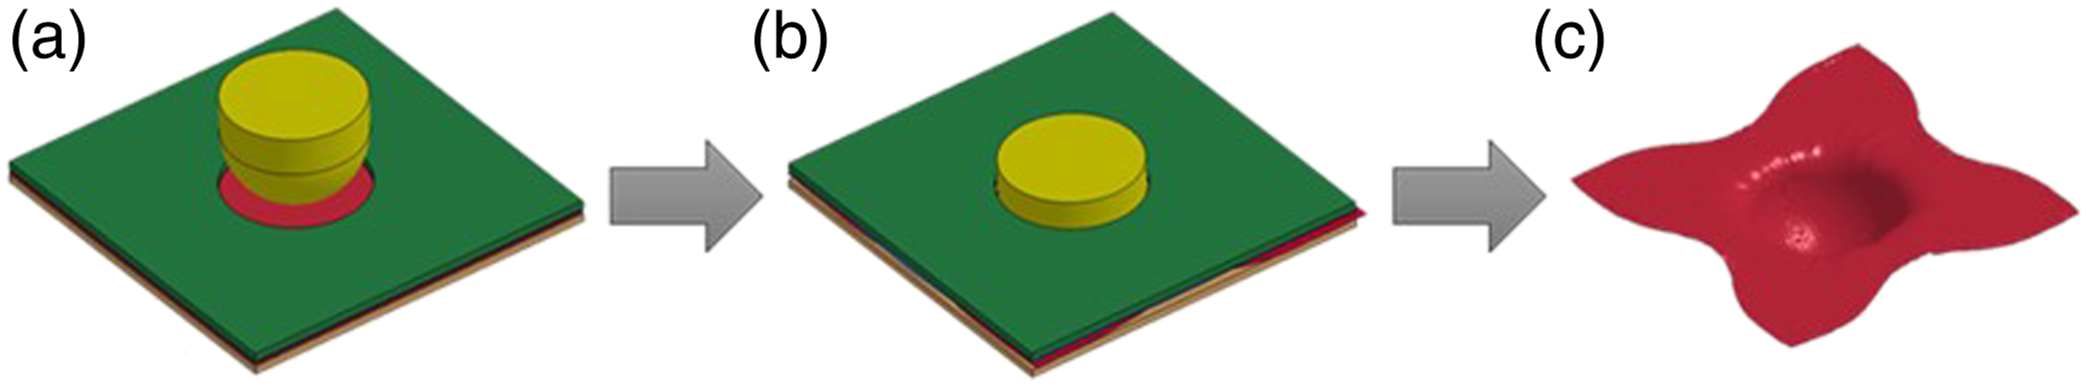
Model setup and boundary conditions
Initially, the UHMWPE stack is in contact with the binder plate and die plate as shown in Figure 6. The punch starts 1 mm above the UHMWPE material to ensure no artificial initial penetrations occur. Initial configuration of the numerical model.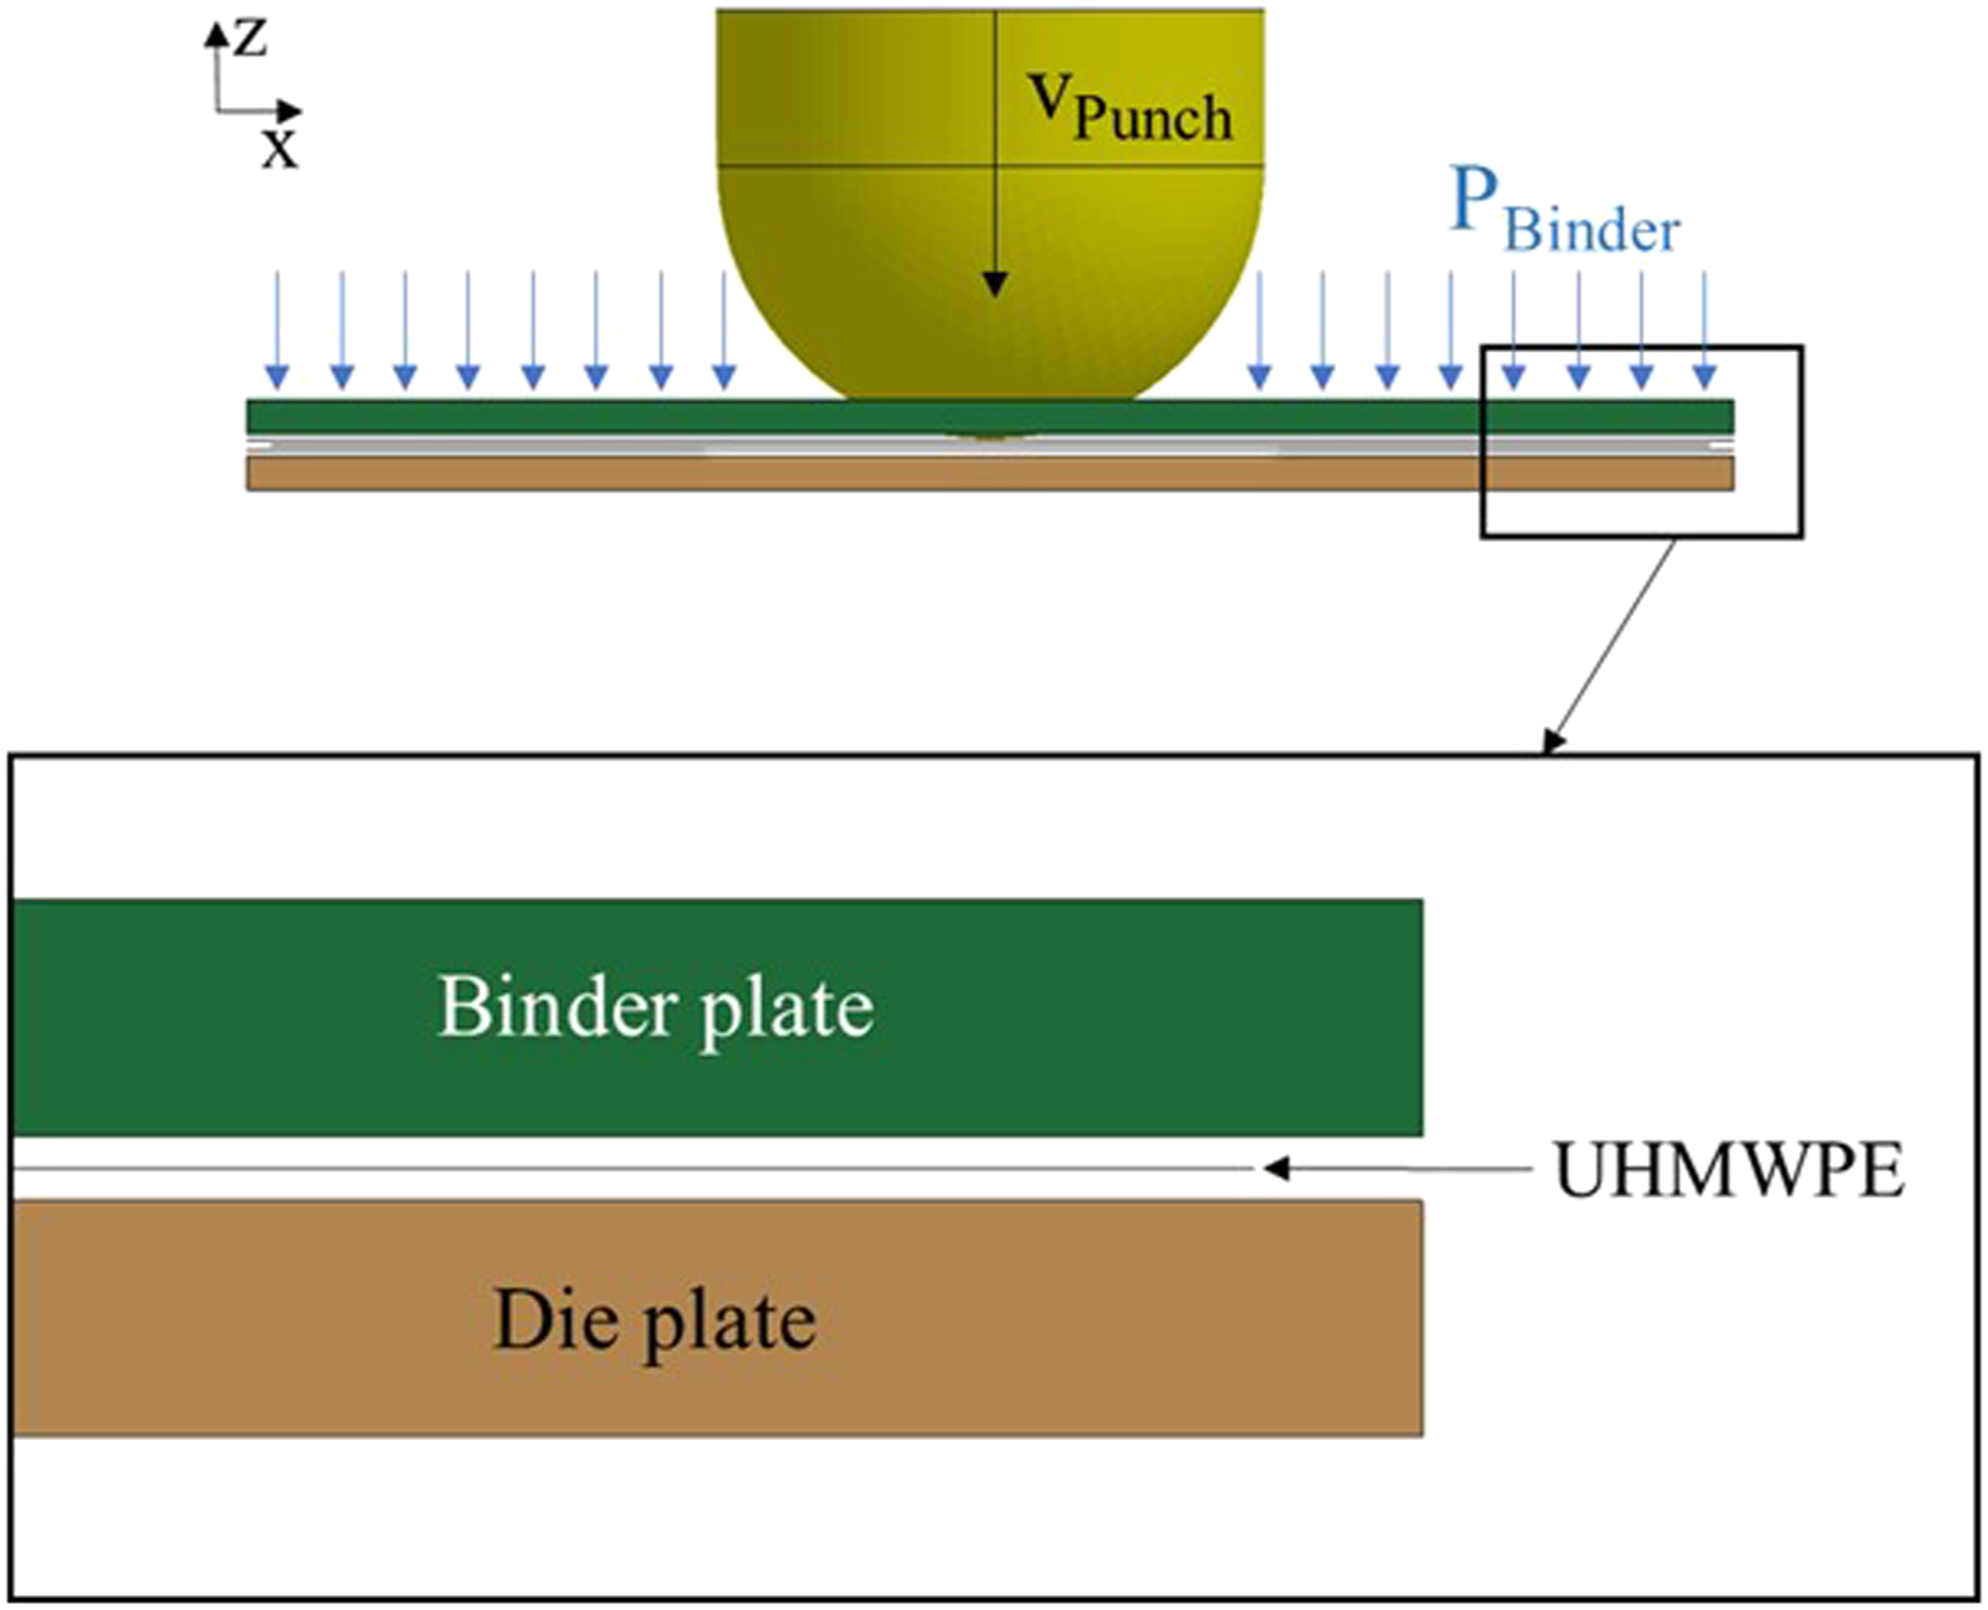
Figure 6 illustrates the z-direction fixed velocity (6.35 mm/s) boundary condition applied to nodes located on the top surface of the punch. The binder plate has a load applied with a vertical (z-direction) force (PBinder in Figure 6) and is constrained in x and y-directions to only permit vertical motion. Dividing the vertical force by the top surface area of the binder yields the average applied normal pressure of 10.0 kPa, which is more than sufficient for thermoforming a small number of sheets. 1 The die plate nodes are constrained in all directions from rotational and translational movement. In the experiments, a Stretchlon 800 bagging film is placed between the UHMWPE and tooling. The mechanical contribution from the bagging is negligible, leading to it not being included in the model. The frictional interaction between the bagging film and UHMWPE is important because it is how the UHMWPE material is loaded in-plane. For this reason, the frictional properties at the tooling-UHMWPE interface were set to the static and dynamic friction coefficients between UHMWPE and the bagging film, which has been experimentally characterized as 0.11 and 0.10, respectively. 20 In models discretizing multiple UHMWPE sheets, the sheet-sheet static and dynamic friction coefficients are set to 0.16 and 0.15 respectively, which is sufficient to ensure no sliding between sheets.
The preforming model uses built-in LS-DYNA material and element formulations, which have not previously been applied to model the highly nonlinear shear response of UHMPWE sheets, making this method different relative to the state of the art in UHWMPE composite forming simulations. 1 Application of this technique increases accessibility for other users to perform these simulations by eliminating the need to create or gain access to custom user materials. A rigid material definition is used to define the tooling (binder, die plate, punch). A fabric material model (LS-DYNA MAT214) 21 is used to represent the UHMWPE sheets. This material model allows the shear stress-strain relationship to be described using a trilinear curve fit to experimental data. Rate dependency of UHMWPE material in-plane shear properties is not included in the model because the UHMWPE material used does not exhibit a rate-dependent in-plane shear response at 100°C for strain rates in the 0.002 to 0.120 radians per second range. 22 The UHWMPE material is assigned orthogonal in-plane stiffness values (Ex and Ey) of 22 GPa, which has been characterized for UHMWPE sheets at 100°C. 2 Fully integrated 3.0-mm × 3.0-mm shell elements (LS-DYNA type 16) are used for the UHMWPE material sheets.
Material in-plane shear response
The in-plane shear response of UHMWPE significantly influences the shear strain distribution and wrinkle formation during thermoforming.
22
The UHMWPE material can be characterized experimentally though the bias-extension or picture-frame tests. In the bias-extension test, a rectangular sheet of +/− 45o unconsolidated UHMWPE sheet stock is placed in an Instron and pulled in tension at constant strain rate. The average of five tests is used to characterize the response for each material and temperature combination. Analyzing bias-extension data for this UHMWPE material at 100°C
22
with a validated data analysis method presented by DEVCOM-ARL
3
yields the shear response of the UHMWPE material at 100°C. There was a negligible difference in HB210 response at 100°C and 125°C,
22
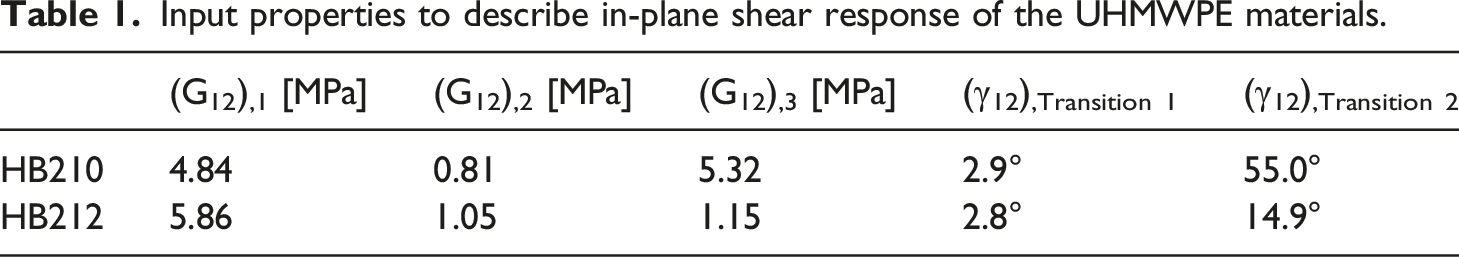
allowing the model to assume isothermal deep-draw forming at 100°C without adversely affecting the results. The transformation from axial stress as measured in the bias-extension test to shear stress, plotted as a function of shear strain is shown in Figure 7 for HB210. Also shown in Figure 7 is a trilinear fit to the data, which defines the input for the numerical model. The difference between the experimentally characterized shear response and trilinear fit is considered negligible. This process was repeated for HB212 with a similarly good match between experimental data and the trilinear fit. The slopes (G12) of the trilinear least squares fit calculated in MATLAB and shear angles at which the transition between segments occur for HB210 and HB212 are given in Table 1. Conversion from bias-extension axial stress to shear stress as a function of shear strain for HB210, with a trilinear fit to the shear stress data. Input properties to describe in-plane shear response of the UHMWPE materials.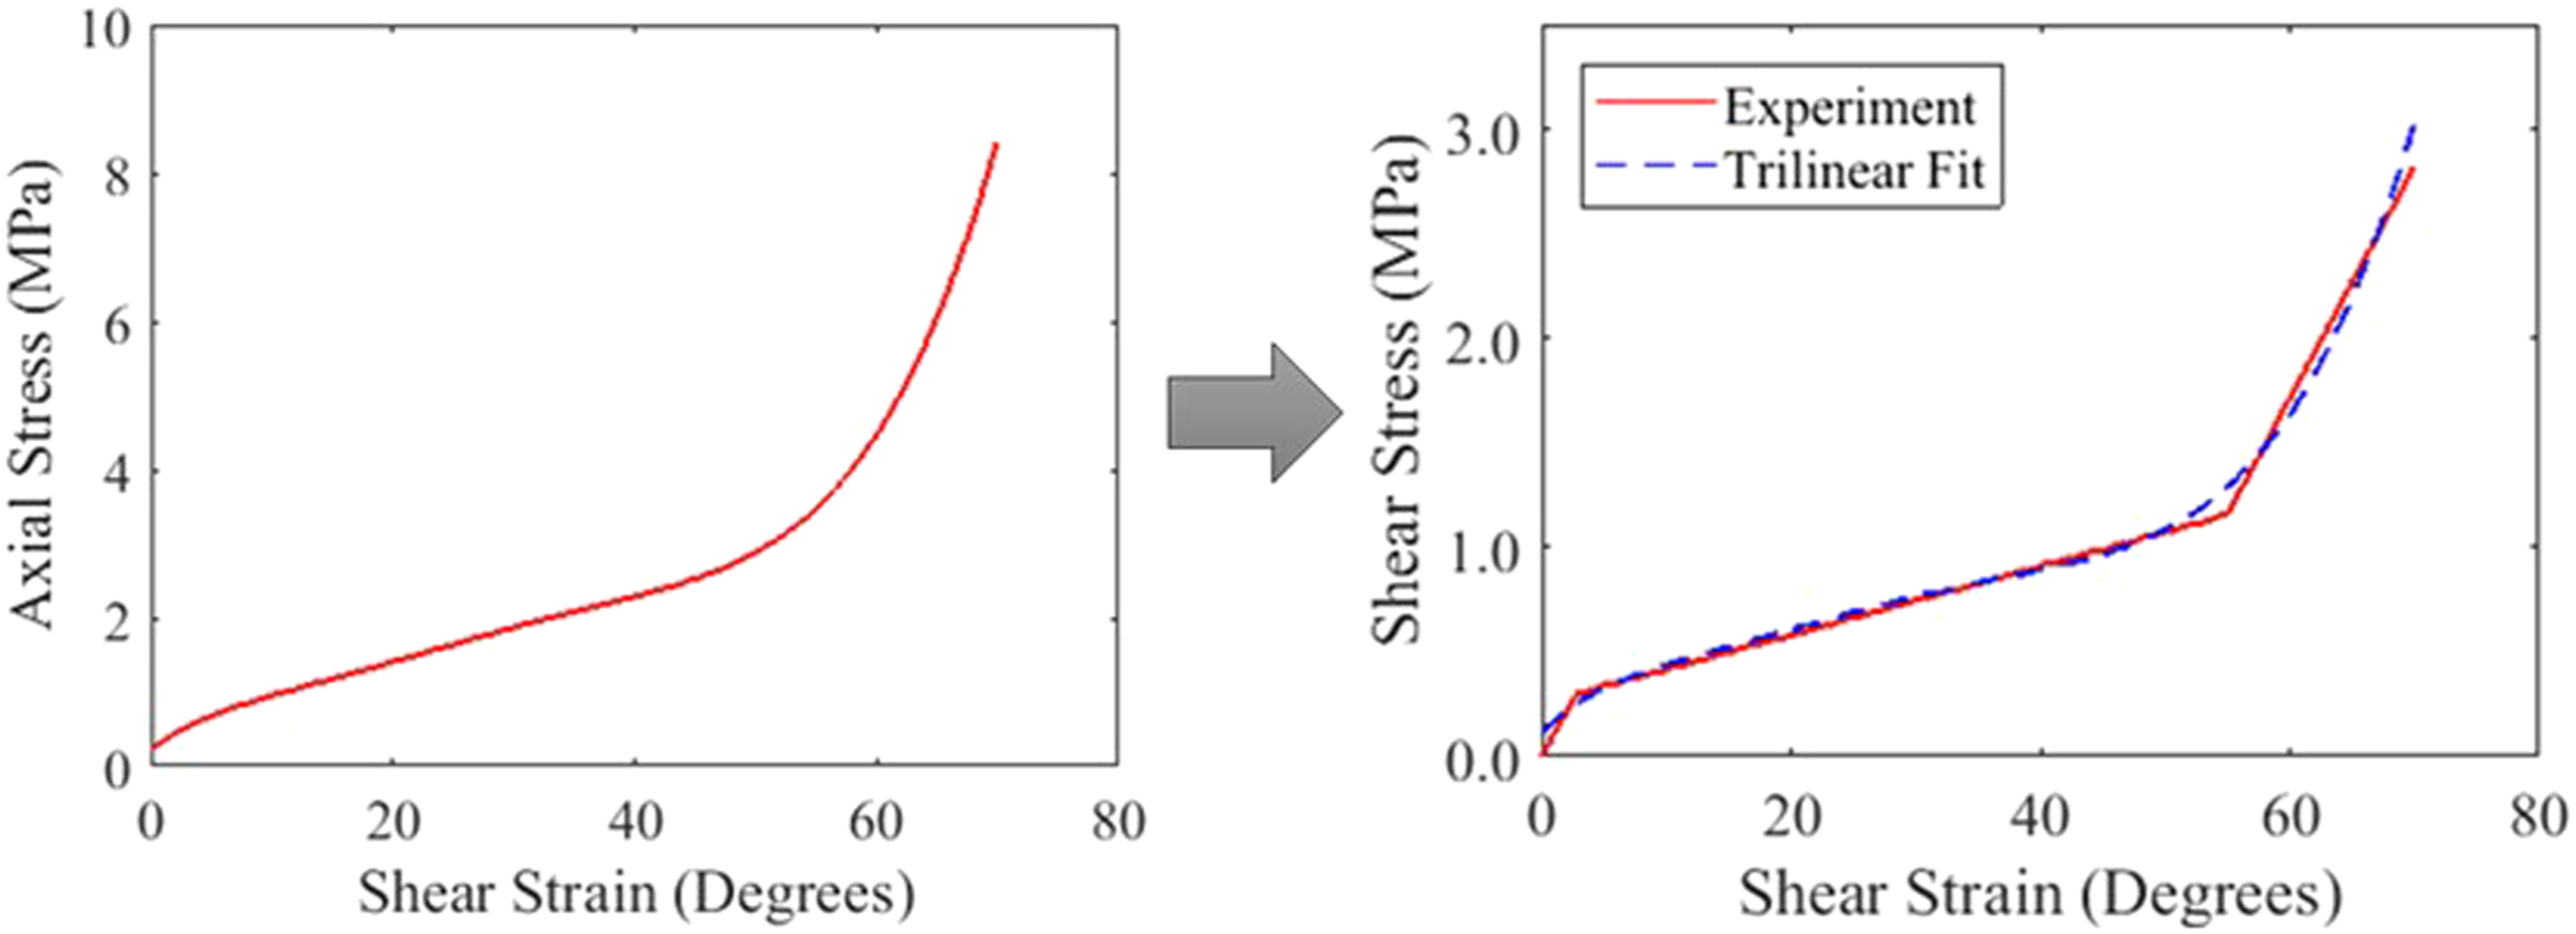
Results
Thickness
The final thickness measurements of each preform from the dial indicator is shown in Figure 8. The thickness is normalized by the average thickness before preforming. Only a single quadrant was measured due to the symmetry of the hemisphere. In each case, the maximum thickness increase occurs along the axis 45° from the 0° and 90° fiber paths, where it is a minimum at the origin and increases towards the equator of the hemisphere. Normalized thickness as a function of position for a single quadrant for the (a) 5 sheet HB210 preform, (b) 5 sheet HB212. (c) 10 sheet HB210 preform, and (d) 20 sheet HB210 preform.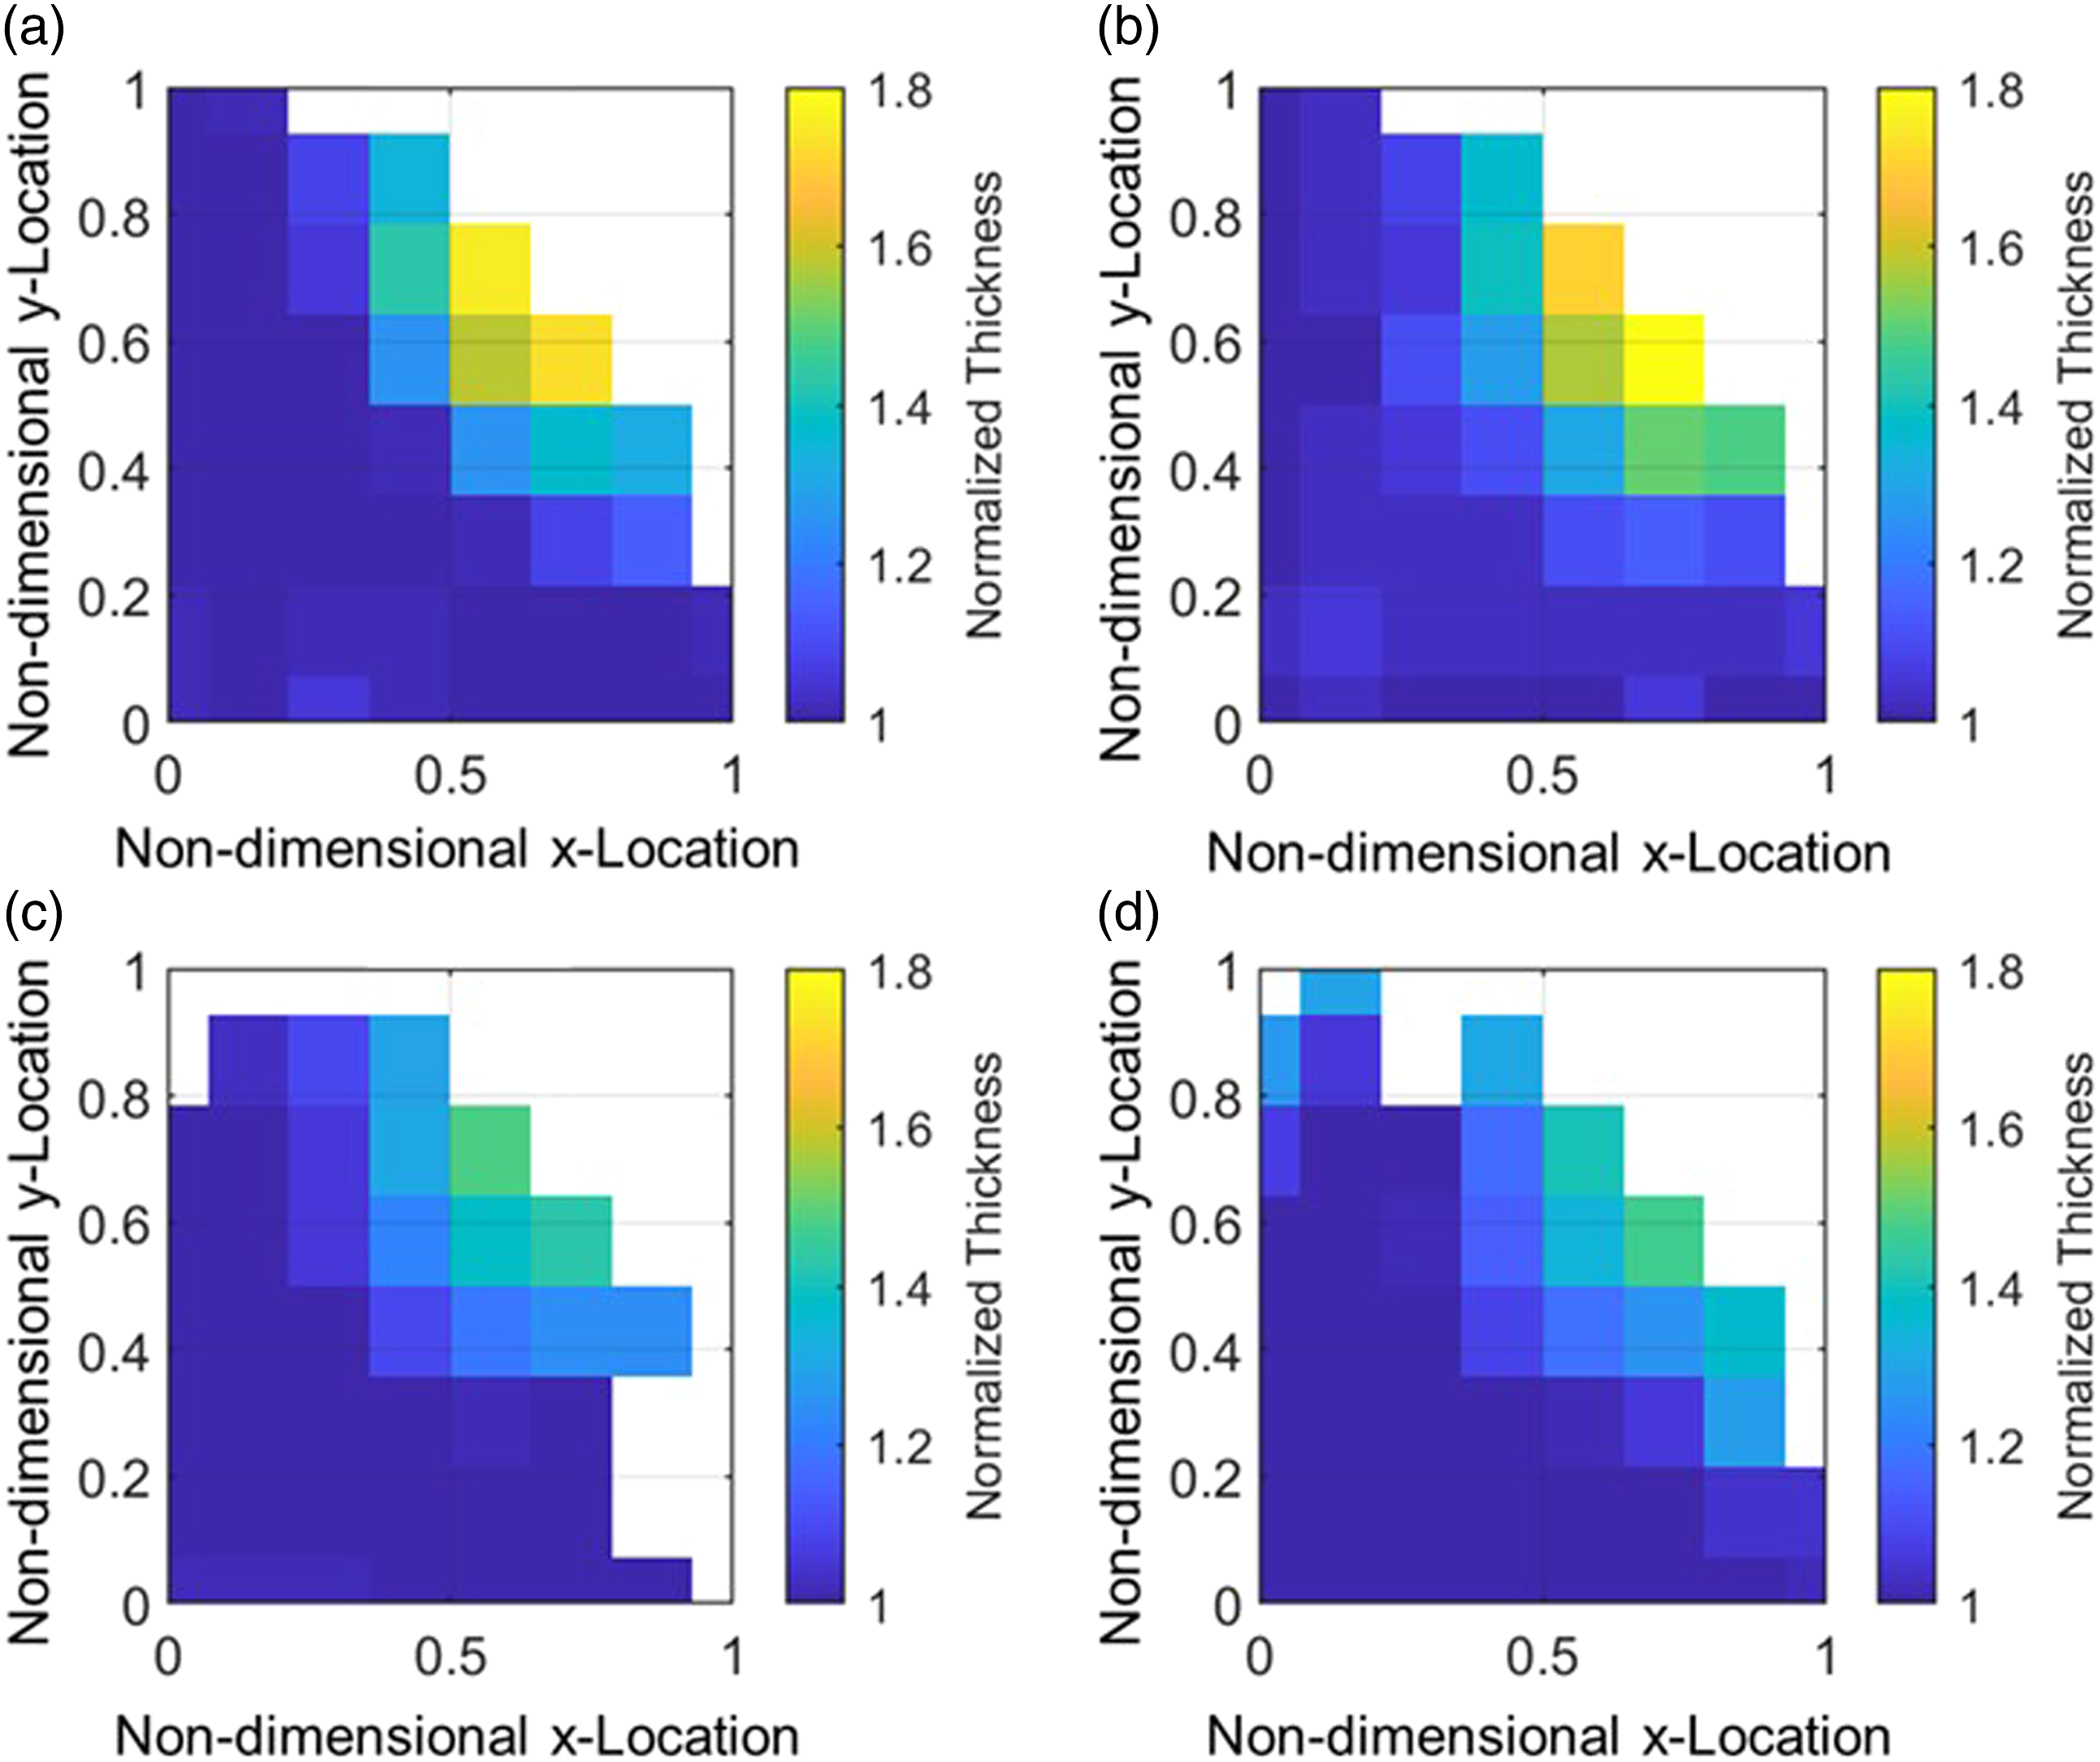
The maximum normalized thicknesses for the 5-sheet HB210 and 5-sheet HB212 preforms are 1.76 and 1.83, respectively. The maximum normalized thickness for the 10-sheet and 20-sheet HB210 preforms are 1.48 and 1.47, respectively. The difference in normalized thickness for each measurement point is compared in Figure 9. Difference in relative thickness between (a) HB210 5 sheet and HB212 5 sheet, (b) HB210 5 sheet and HB210 10 sheet, (c) HB210 5 sheet and 20 sheet, and (d) HB210 10 sheet and HB210 20 sheet.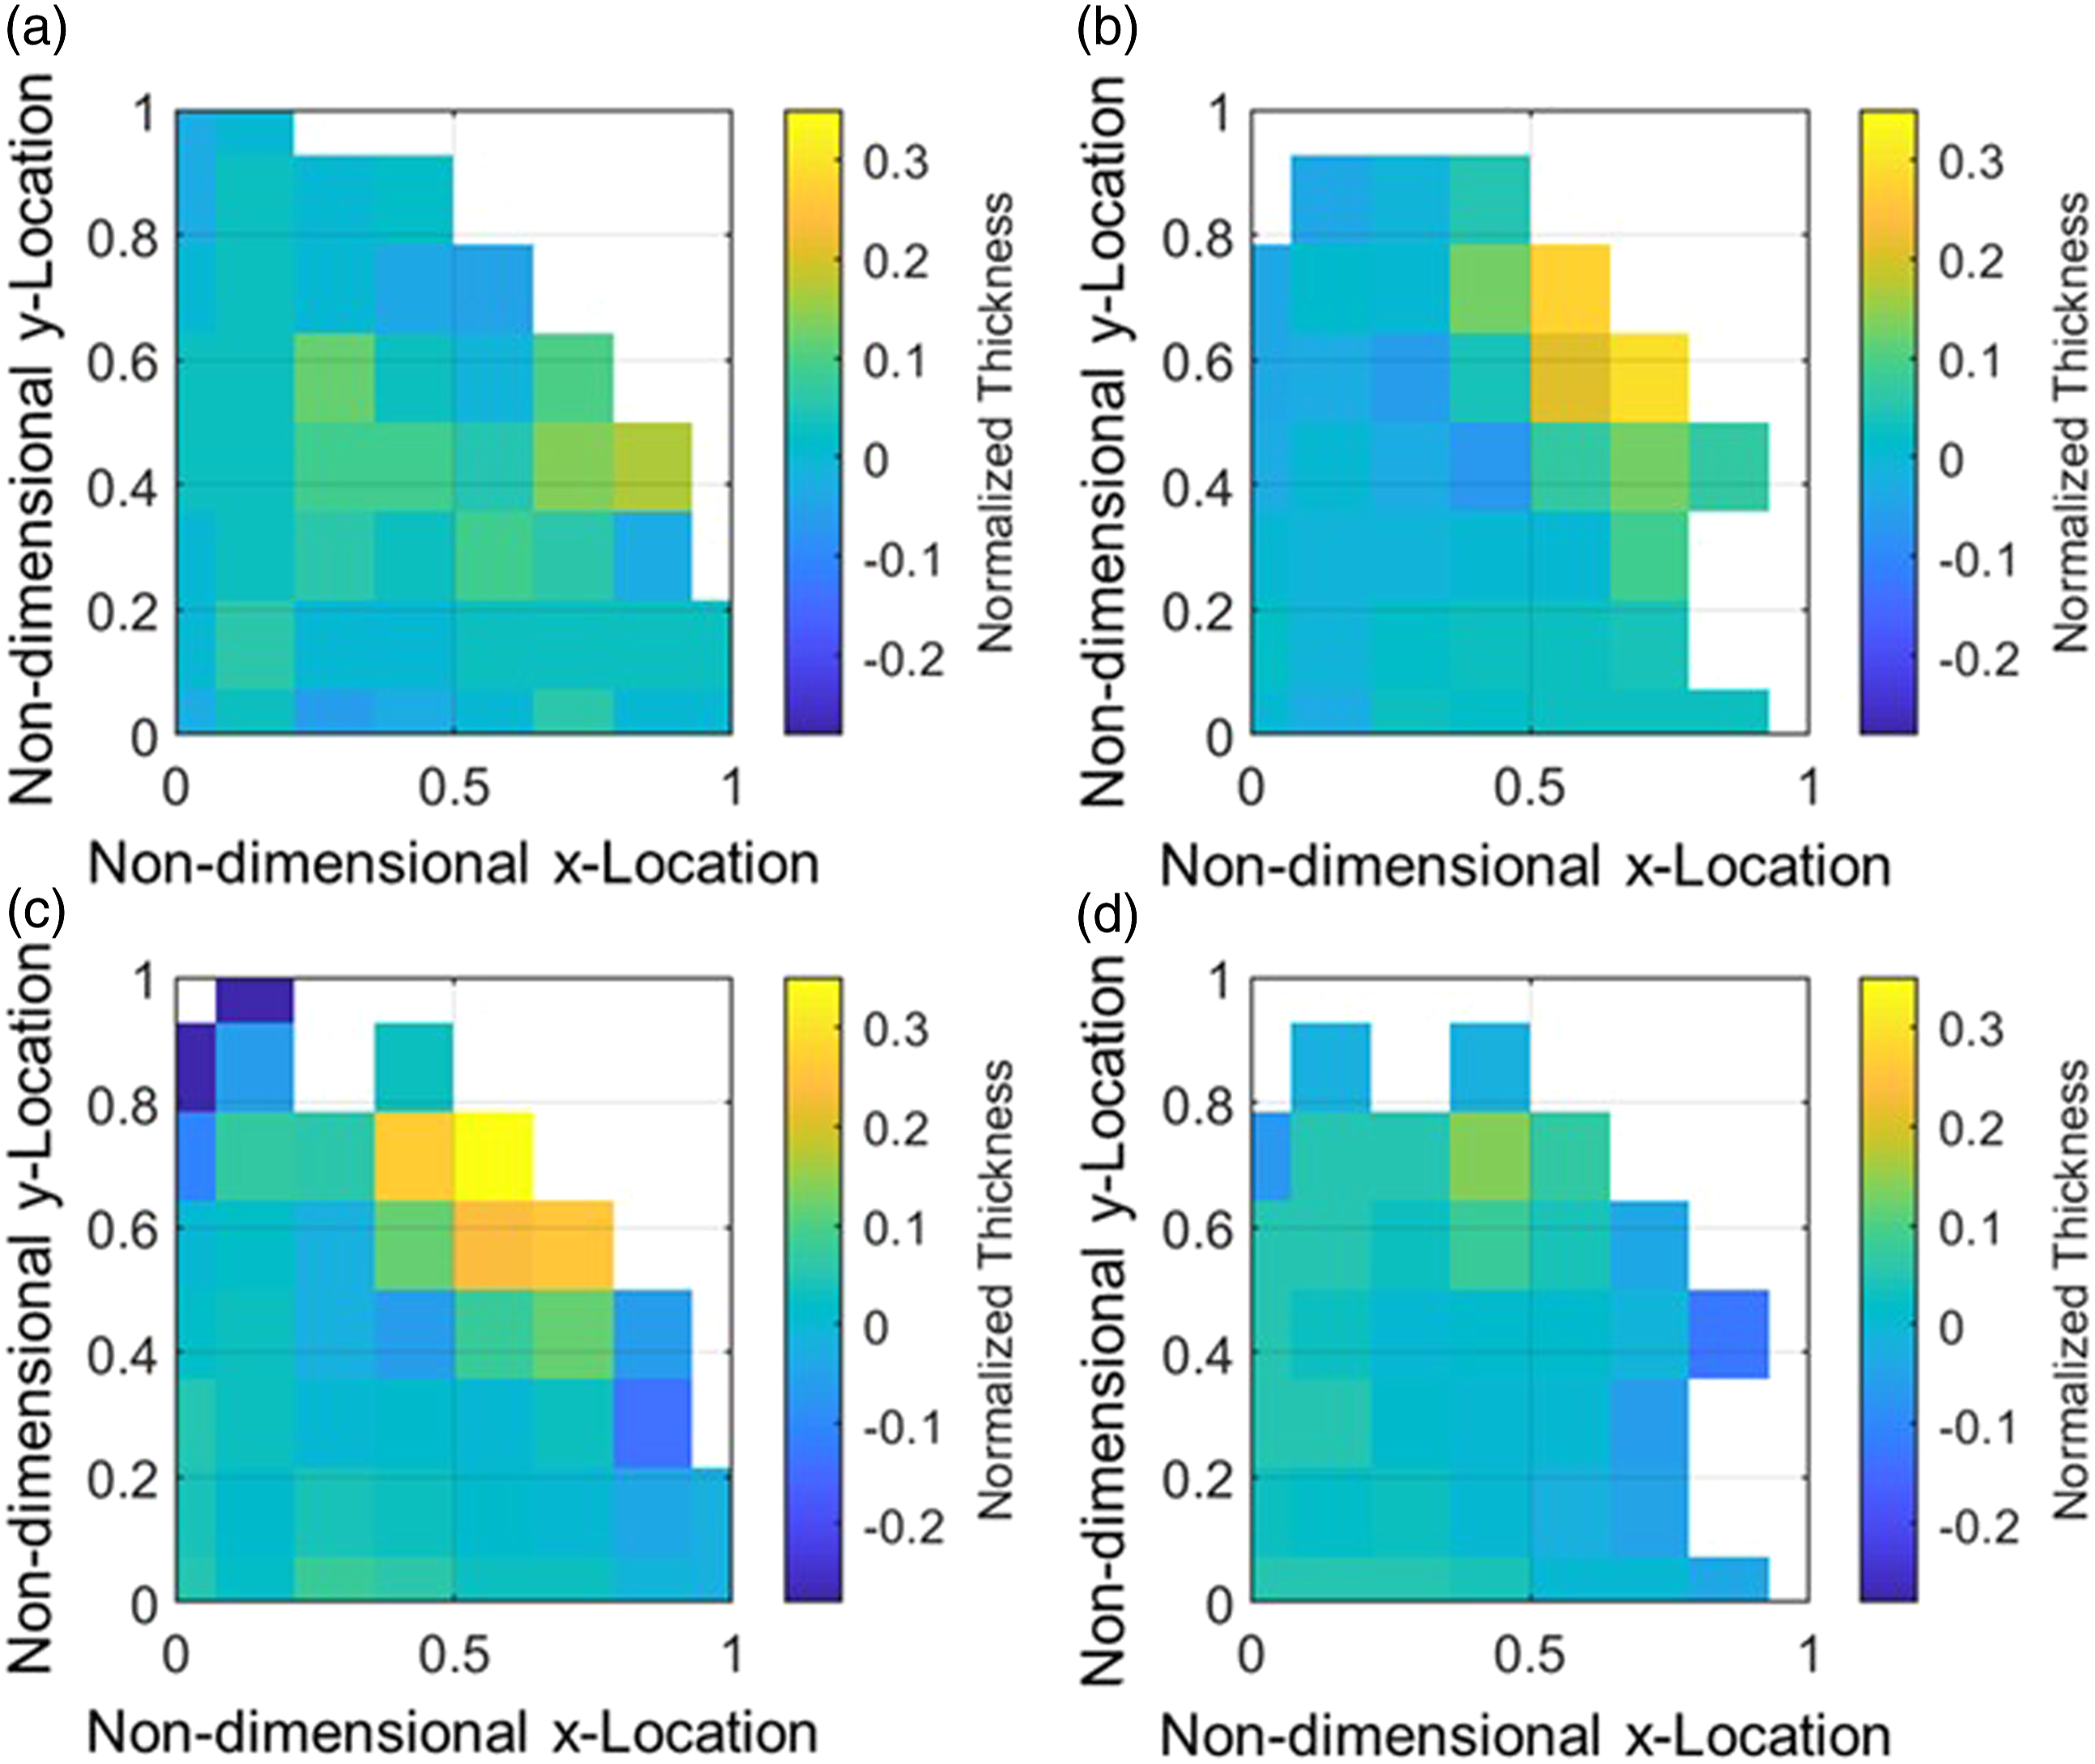
The maximum difference in normalized thickness between the HB210 and HB212 preform is 0.17. The larger normalized thickness in the HB212 preform is likely due to the lower in-plane shear stiffness. This preform had larger in plane shear strains which lead to increased thickening of the plies.
The maximum difference in normalized thickness in HB210 between the 5 sheet and 10 sheet, and between the 10-sheet and 20-sheet, is 0.29 and 0.35 respectively. This is a significant difference, likely due to two reasons. First, sheets 5-10 of the 10 sheet preform (numbered sequentially with 1 being the sheet closest to the punch) are being formed over a larger radius due to the added thickness of sheets 1-5. Sheets 6-10 will undergo slightly less shear strain and therefore a smaller increase in thickness. Similarly sheets 11-20 of the 20-sheet preform will undergo slightly smaller in-plane shear strains than sheets 1-10 in the 10-sheet preform. Secondly, thicker sheet stacks have an increased load requirement to induce out-of-plane shear deformation as well as an increased volume of material which must be formed, both of which require larger punch forces for forming. This increased force is expected lead to a small degree of consolidation. It is expected that the increase in thickness from shear deformation is due to the rearrangement of fibers and void formation within the preform. The thicker preforms likely have lower porosity due to the higher forming forces. The maximum difference in normalized thickness between the 10-sheet and 20-sheet HB210 preforms is 0.13, which indicates scaling would be more accurate from the 10-sheet preform.
Temperature
Due to the dependence that shear stiffness has on temperature, it is important to understand how the temperature of the preform changes during the process cycle. The evolution of temperature with respect to time is shown in Figure 10. The die plate, preform, and binder plate are removed from the oven after 100 minutes and placed in the load frame, this removal can be seen as a sharp decrease in temperature, beginning at t=0 in Figure 10. The cooling rate is higher in the center of the preform because the sheet stack is directly exposed to the air, whereas the corner of the preform is clamped between the preheated die and binder plates which add additional thermal resistance. There is a sharp increase in the cooling rate when the punch engages the preform and heat transfer is increased through conduction into the room temperature punch. The maximum cooling rate occurs when the punch fully engages the preform, i.e. the forming is complete; these points are labelled in Figure 10. At this point, the preform is fully seated against the punch, increasing the amount of heat flowing from the preform into the punch. Preform thermal history at two locations. Preform was placed in oven for 100 minutes, then removed and placed in load frame (t=0 in plot) and formed.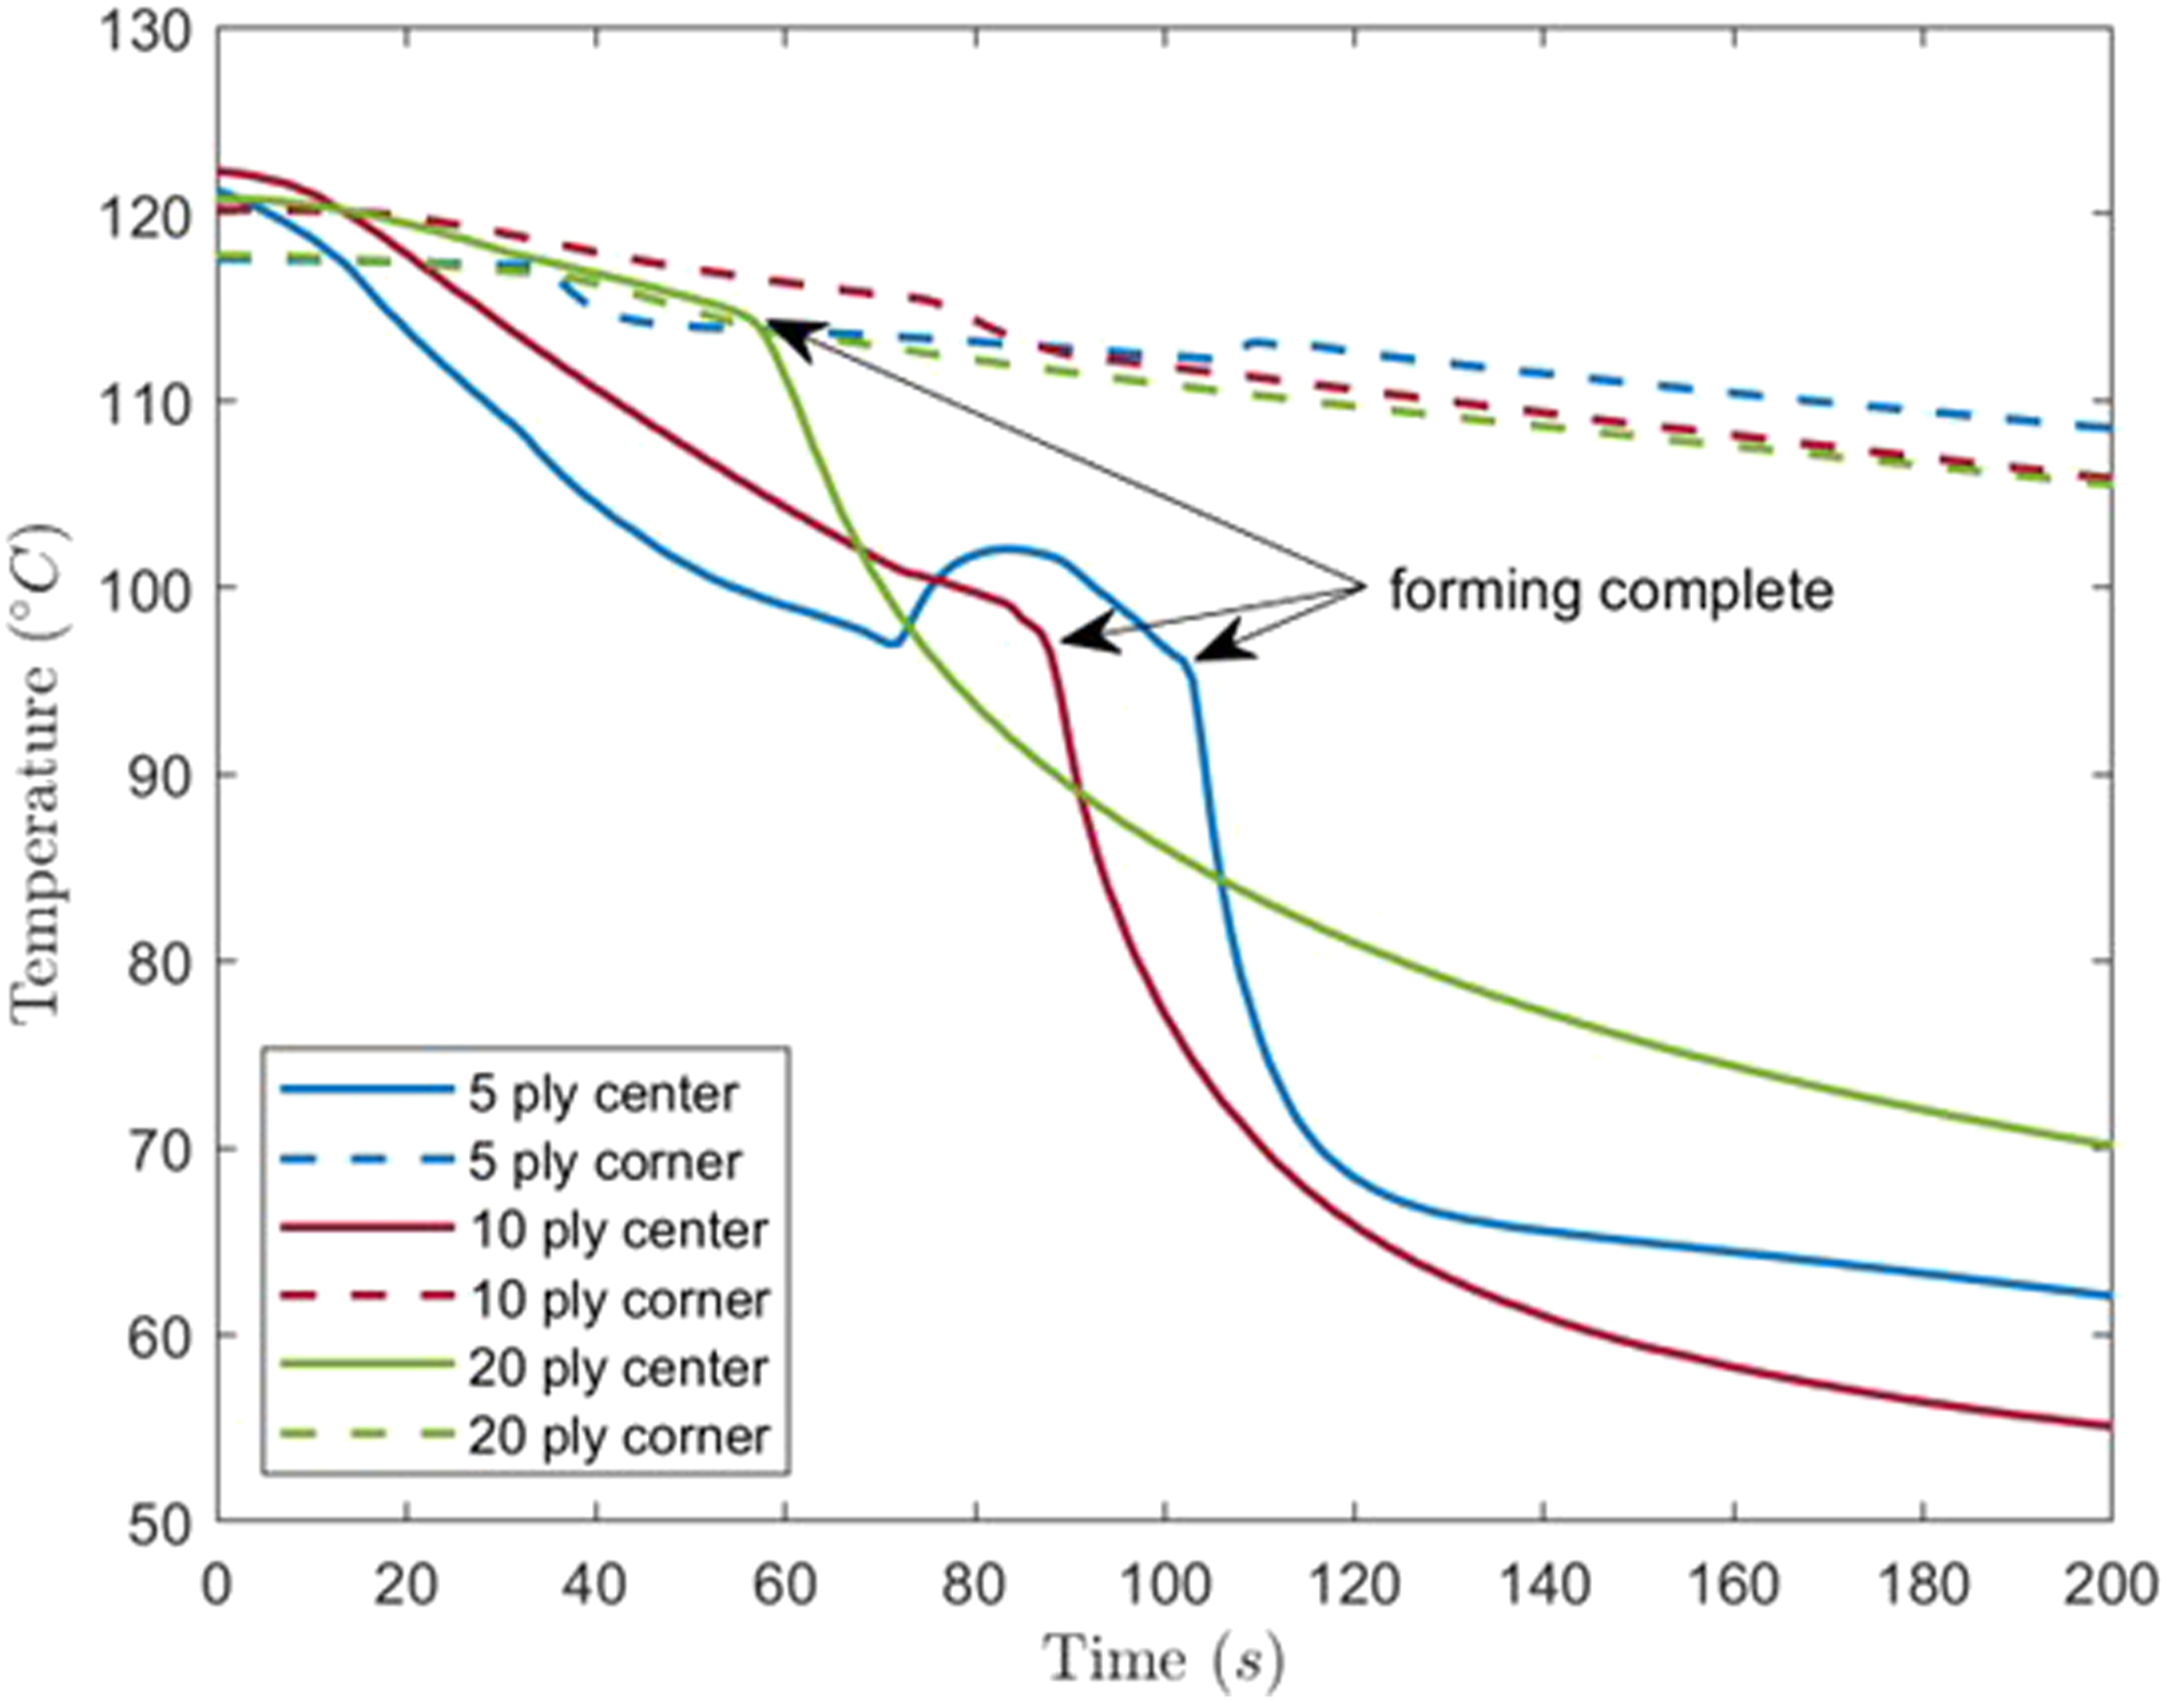
The cooling rate at the center of the preform is a function of the number of sheets in the stack because thicker stacks have more thermal mass. The 5- and 10-sheet preforms have a similar temperature history for the center thermocouple. The 20-sheet preform has a lower cooling rate, due to the added thermal inertia of the additional sheets. All three preforms have a similar temperature history in the corner because the added thermal resistance of 5- and 15-sheets of material is insignificant compared to the added thermal resistance of the 12.7-mm aluminum die and binder plates.
The forming operation lasts 9 seconds once the punch engages the sheet stack. When the forming action starts, the center location temperature is approximately 100°C for the 5- and 10-sheet preforms and 115°C for the 20-sheet preform. Also, for the center location, there is a gradient in temperature through the thickness of the sheet stack, with the maximum temperature occurring in the center of the sheet stack and decreasing towards both surfaces. The corner location was approximately 115°C for all preforms. The majority of the shear deformation occurs within the central exposed region in an area next to the edge of the hole in the binder and die plates which extended into the die and binder plates several centimeters. For these reasons, a temperature of 100oC was chosen for the simulations.
Numerical model shear-to-thickness conversion
The shear angles are indexed at each grid point on the preform using the goniometer, ImageJ analysis, and MicroScribe. Using the thickness results from the 5-sheet experiment with HB210, the thicknesses are plotted as a function of shear angle measured on the top surface, as shown in Figure 11. Experimentally measured shear angle and part thickness results as compared to conservation of volume theory.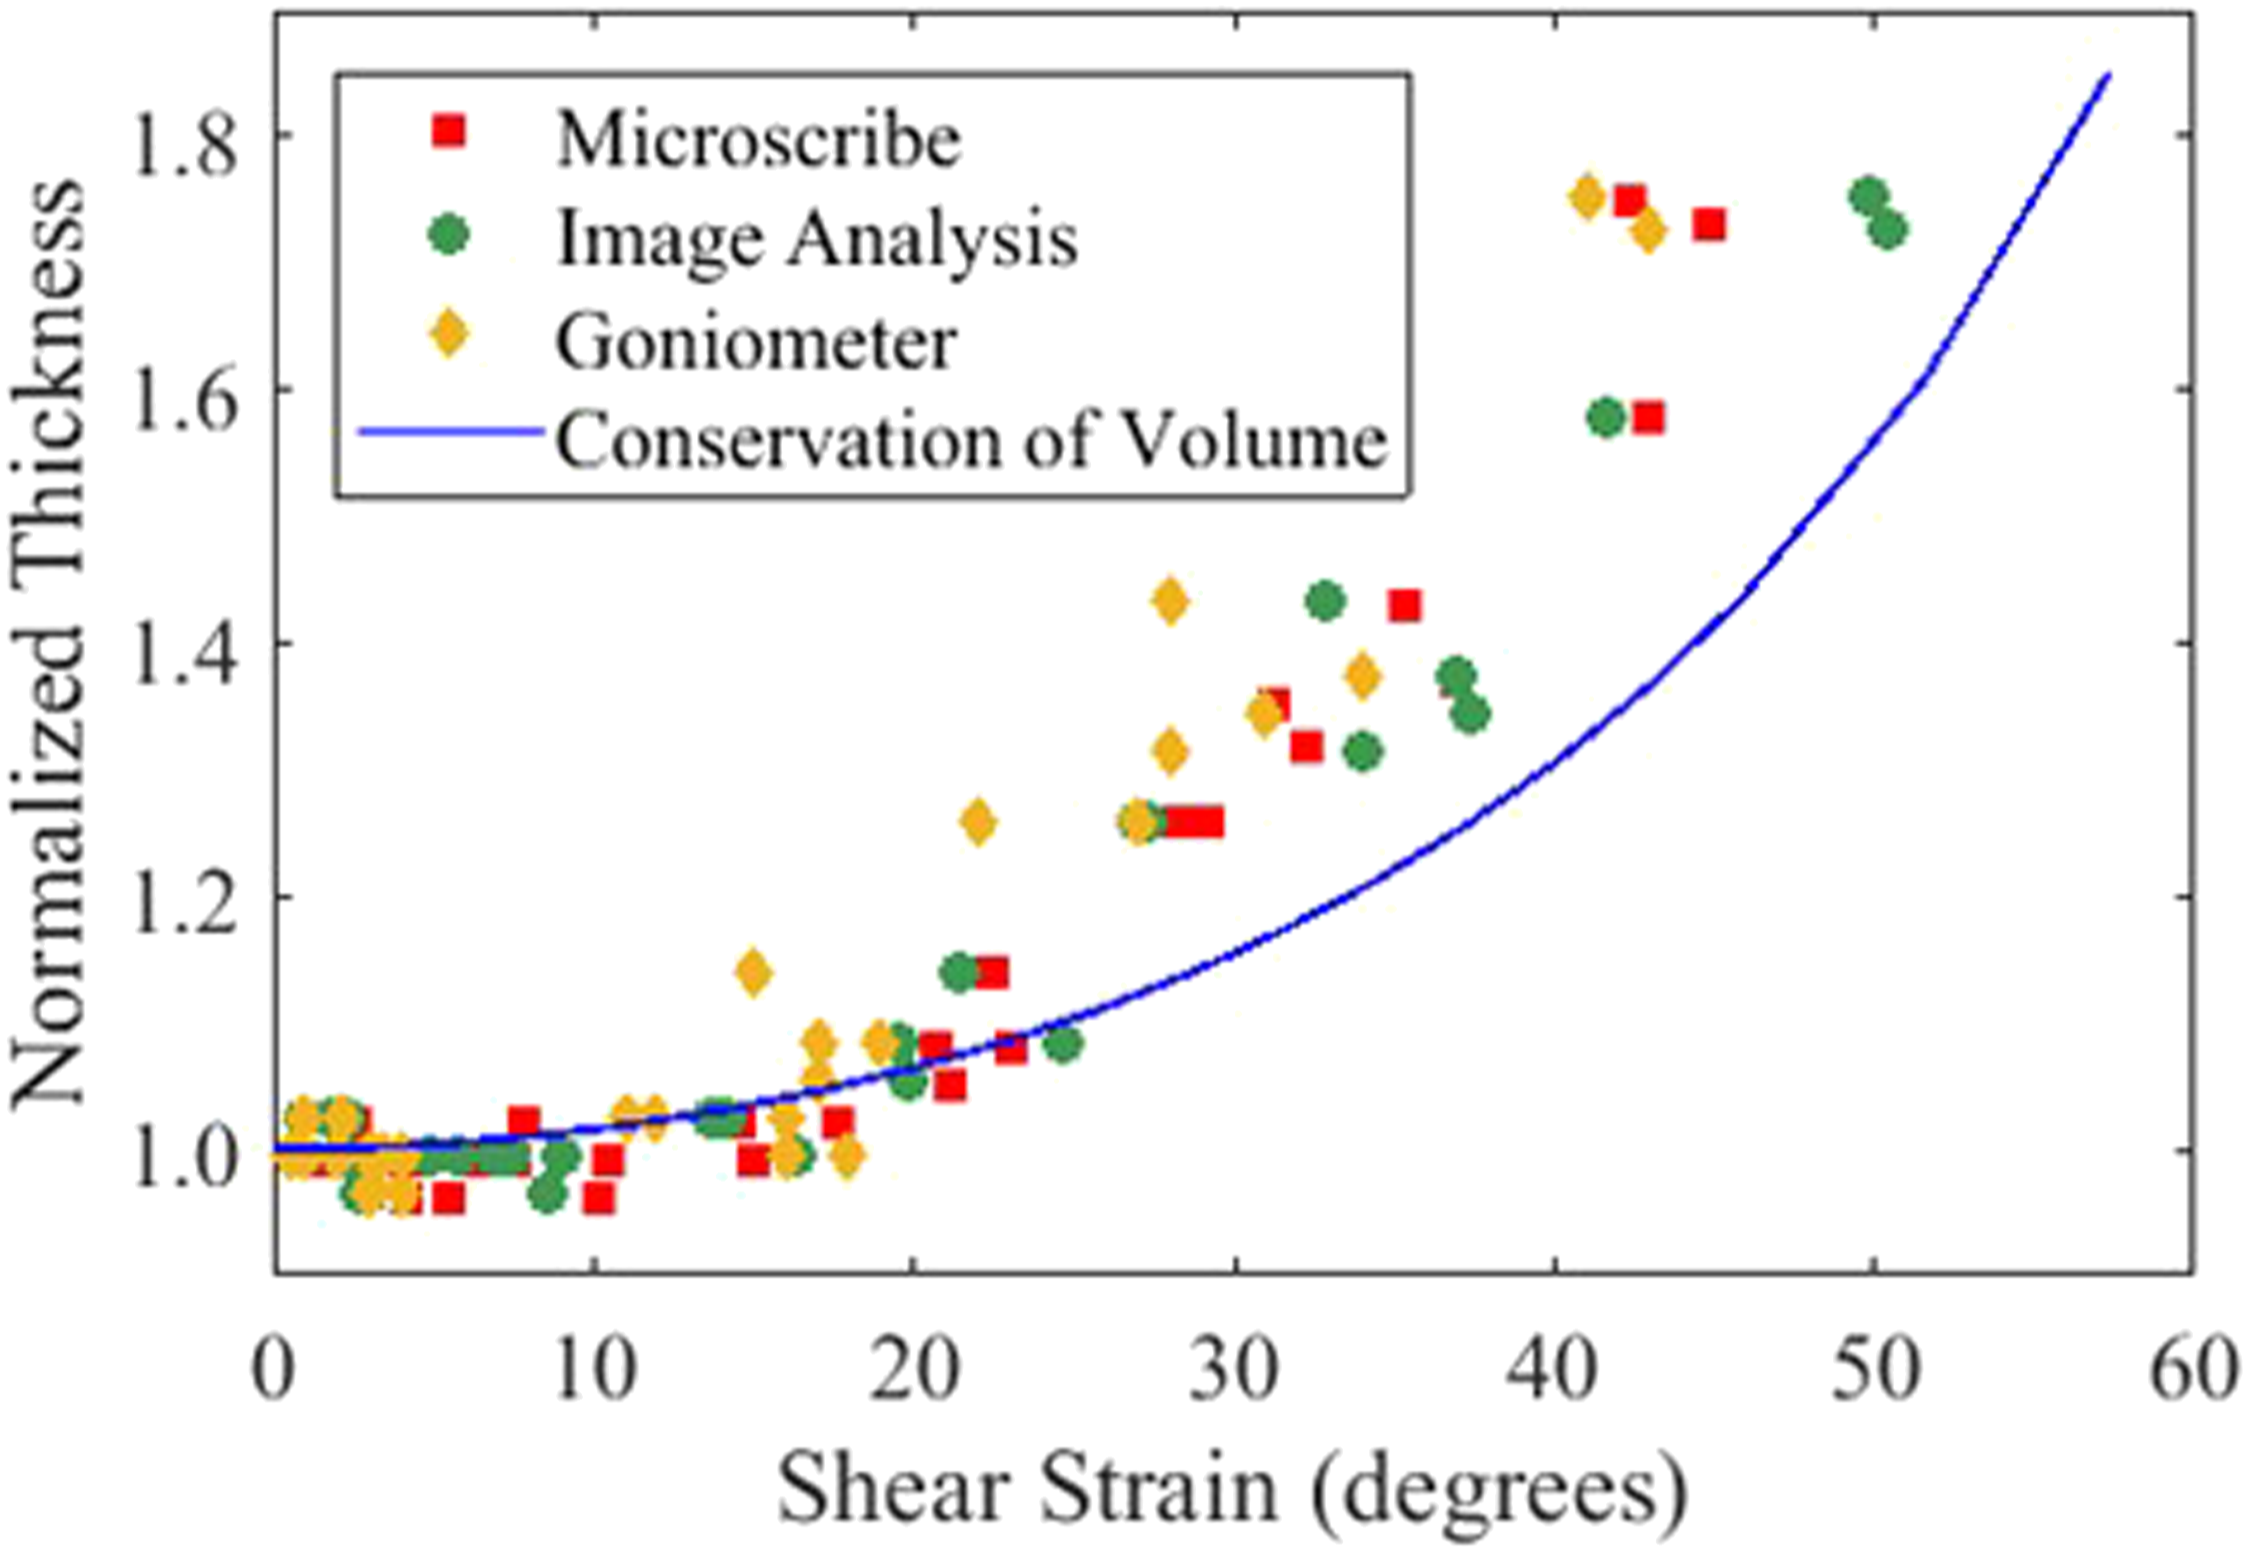
The shear-to-thickness transfer function is shown to be accurate for each of the three methods, with the theoretical conservation of volume, calculated using equation (1), trending closely with all. The image analysis method, which is believed to be the most accurate of the three methods, correlated the best with the conservation of volume. As the UHMWPE shears, fibers rearrange themselves and stack on top of each other to maintain the same volume, which has been confirmed with micrographs. 1 The authors hypothesize that after a critical shear angle, undulations occur in the fibers and packing efficiency becomes diminished. Potential ply-to-ply delamination and inefficient packing arrangements lead to void formation, which may provide an explanation for why the measured thickness values are larger than the conservation of volume predicts for areas with a large amount of shear. After the forming step, the UHMWPE preform will undergo high temperature, high pressure consolidation, where it is expected that voids forming within sheets during preforming will be driven out of the part. Because it is expected that voids generated during forming will be driven out of the part during consolidation, the conservation of volume approach will be used to transcribe thicknesses from the shear angles output from the numerical model.
The thickness measurement at each grid intersection point from the experimental results is mapped back to its original location on the undeformed (flat) UHMWPE sheet geometry. To ensure a one-to-one comparison with the numerical results, the predicted three-dimensional in-plane shear strain field (shown in Figure 12-(a)) is mapped back onto the original undeformed two-dimensional mesh (shown in Figure 12-(b)). The mapping is done by correlating the predicted shear strain of each element with the original x- and y- location of the center of the element. The resulting shear strain field then passes through the conservation of volume based shear-to-thickness transfer function to obtain the predicted thickness mapping (Figure 12-(c)), normalized by the original undeformed thickness of the UHMWPE stack. This thickness mapping is then comparable to the experimental thickness results. The thickness of the nearest element to the x and y location of each experimental grid point is used for comparisons. (a) Three dimensional in-plane shear strain field model output, (b) model output shear strain field mapped to the original mesh, and (c) the corresponding thickness distribution translated by the shear-to-thickness transfer function.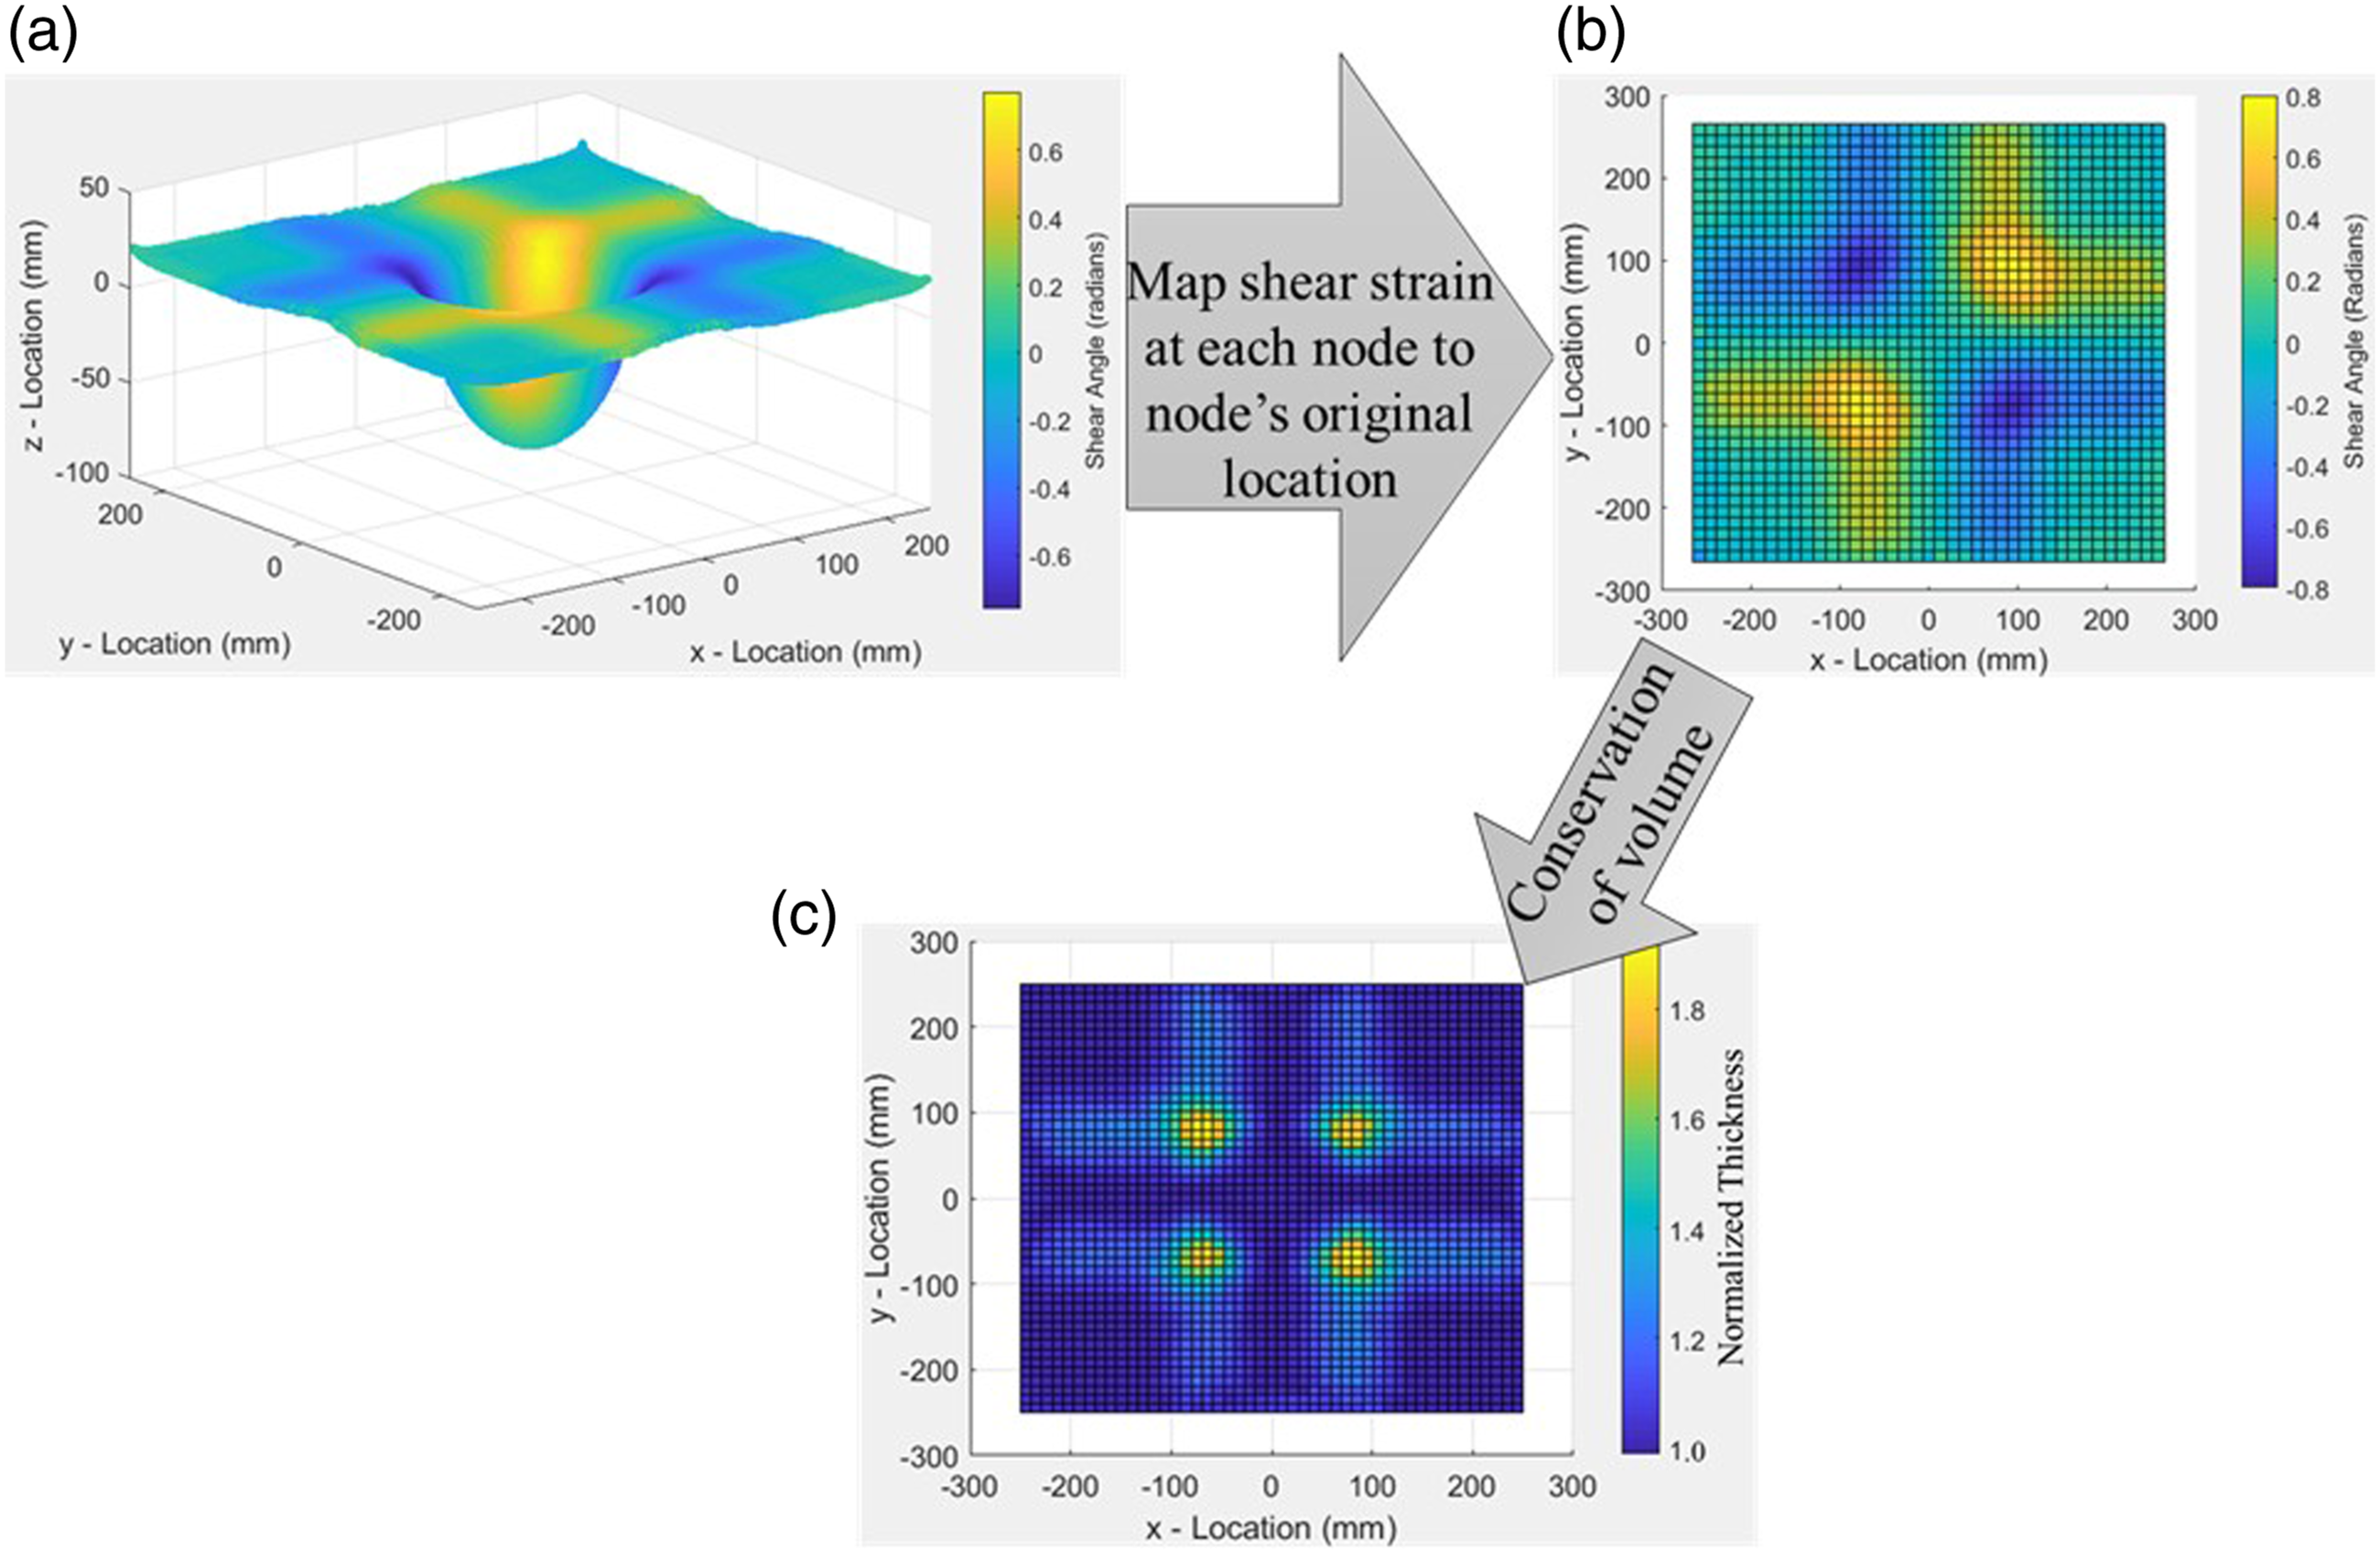
The peak shear deformation is found to occur along the 45° diagonal between the x and y axes. The experimentally measured and simulation predicted shear angle are plotted as a function of distance from the center of the sheet (normalized by the punch radius) in Figure 13. This correlation demonstrates the ability of the model to accurately predict shear deformation at various locations in the preform. Comparison of predicted and measured shear angle along the diagonal (peak shear line) as a function of normalized distance from the center of the preform.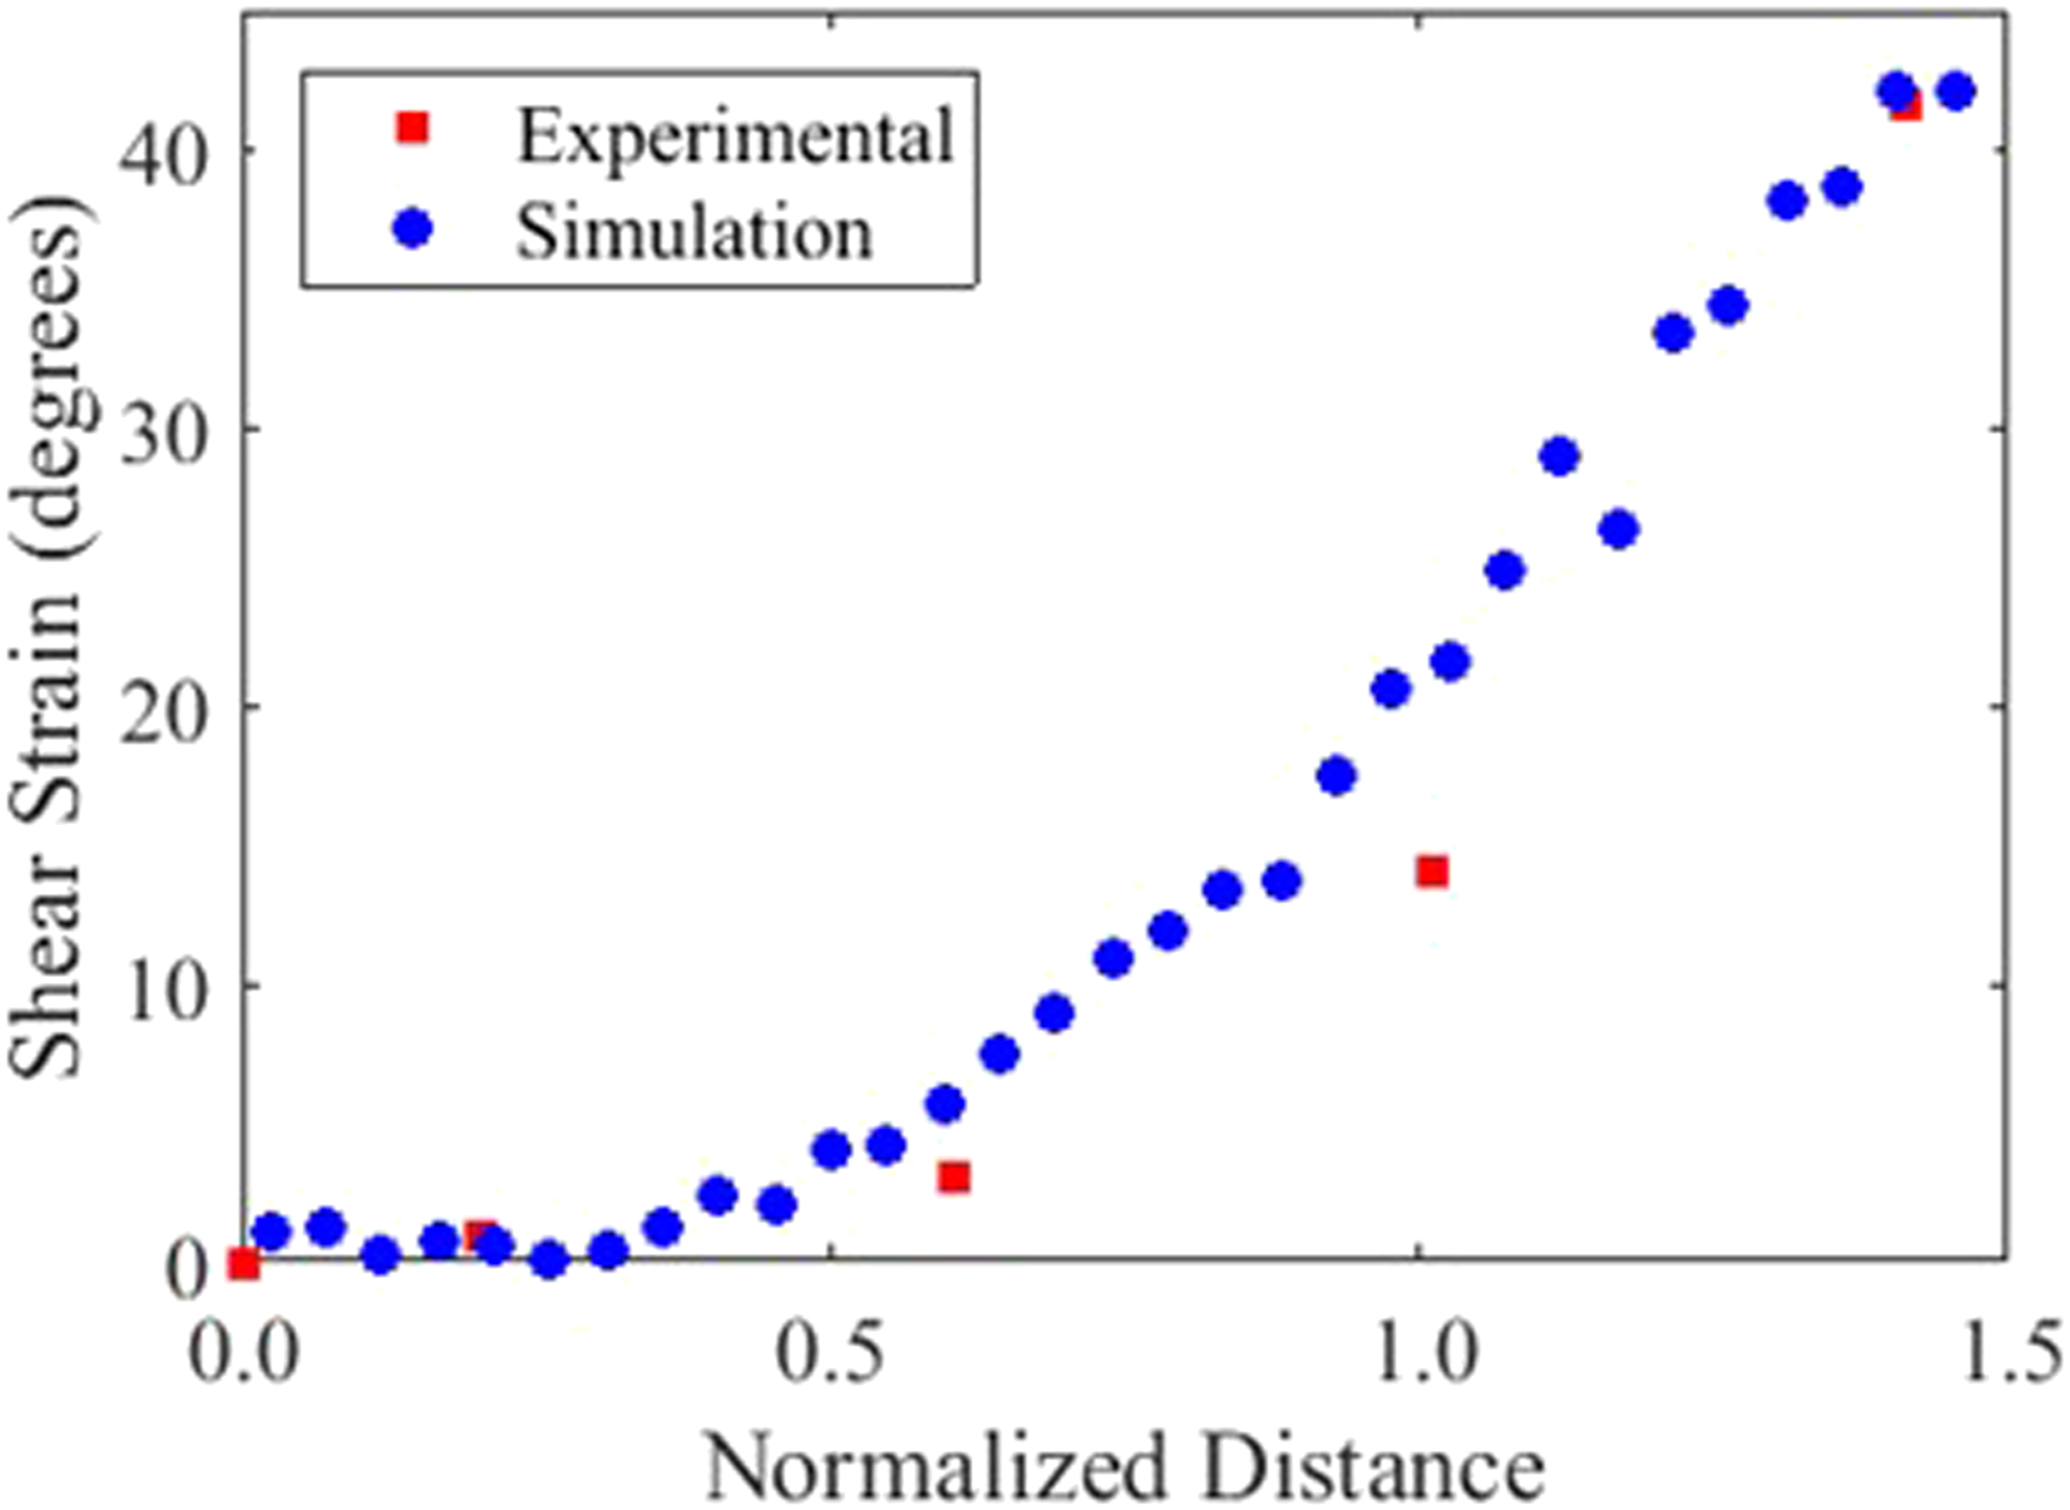
UHMWPE sheet homogenization
Each sheet can be modeled individually for up to five sheets, but it becomes too computationally expensive for ten or more sheets (ten sheets is estimated to take a week running 32 cores on a high performance computer). Multiple UHMWPE sheets are homogenized into a single shell layer to increase computational efficiency. The shear strain distribution is the key metric by which the homogenization schemes were evaluated. The punch force gives insight into the in-plane loading of the UHMWPE material but differences in punch force become negligible as sheets are homogenized due to friction at the tooling surface and the force required to make the material deform being more dominant than the extremely small amount of friction force resulting from sliding between sheets. To demonstrate the effectiveness of the homogenization scheme, a preforming simulation is performed with five shell layers, each the thickness of 1 sheet (0.15 mm), and another is conducted with one shell layer assigned a thickness of five sheets (0.75 mm). The in-plane shear strain fields for each of these cases is compared in Figure 14 to validate the applicability of the homogenization scheme to UHWMPE forming. In the simulation containing five shell layers, no sliding was observed between individual layers, indicating that the deformation is the same in all five layers. This is an important observation because the experimental grid pattern is only drawn on the outermost layer. Similar results are found when scaling from five to ten sheets per shell layer, but major differences were found when scaling from ten to twenty. Shear strain distribution predicted for (a) five shell layers representing five UHMWPE sheets and (b) one shell layer, with a thickness equal to five UHMWPE sheets.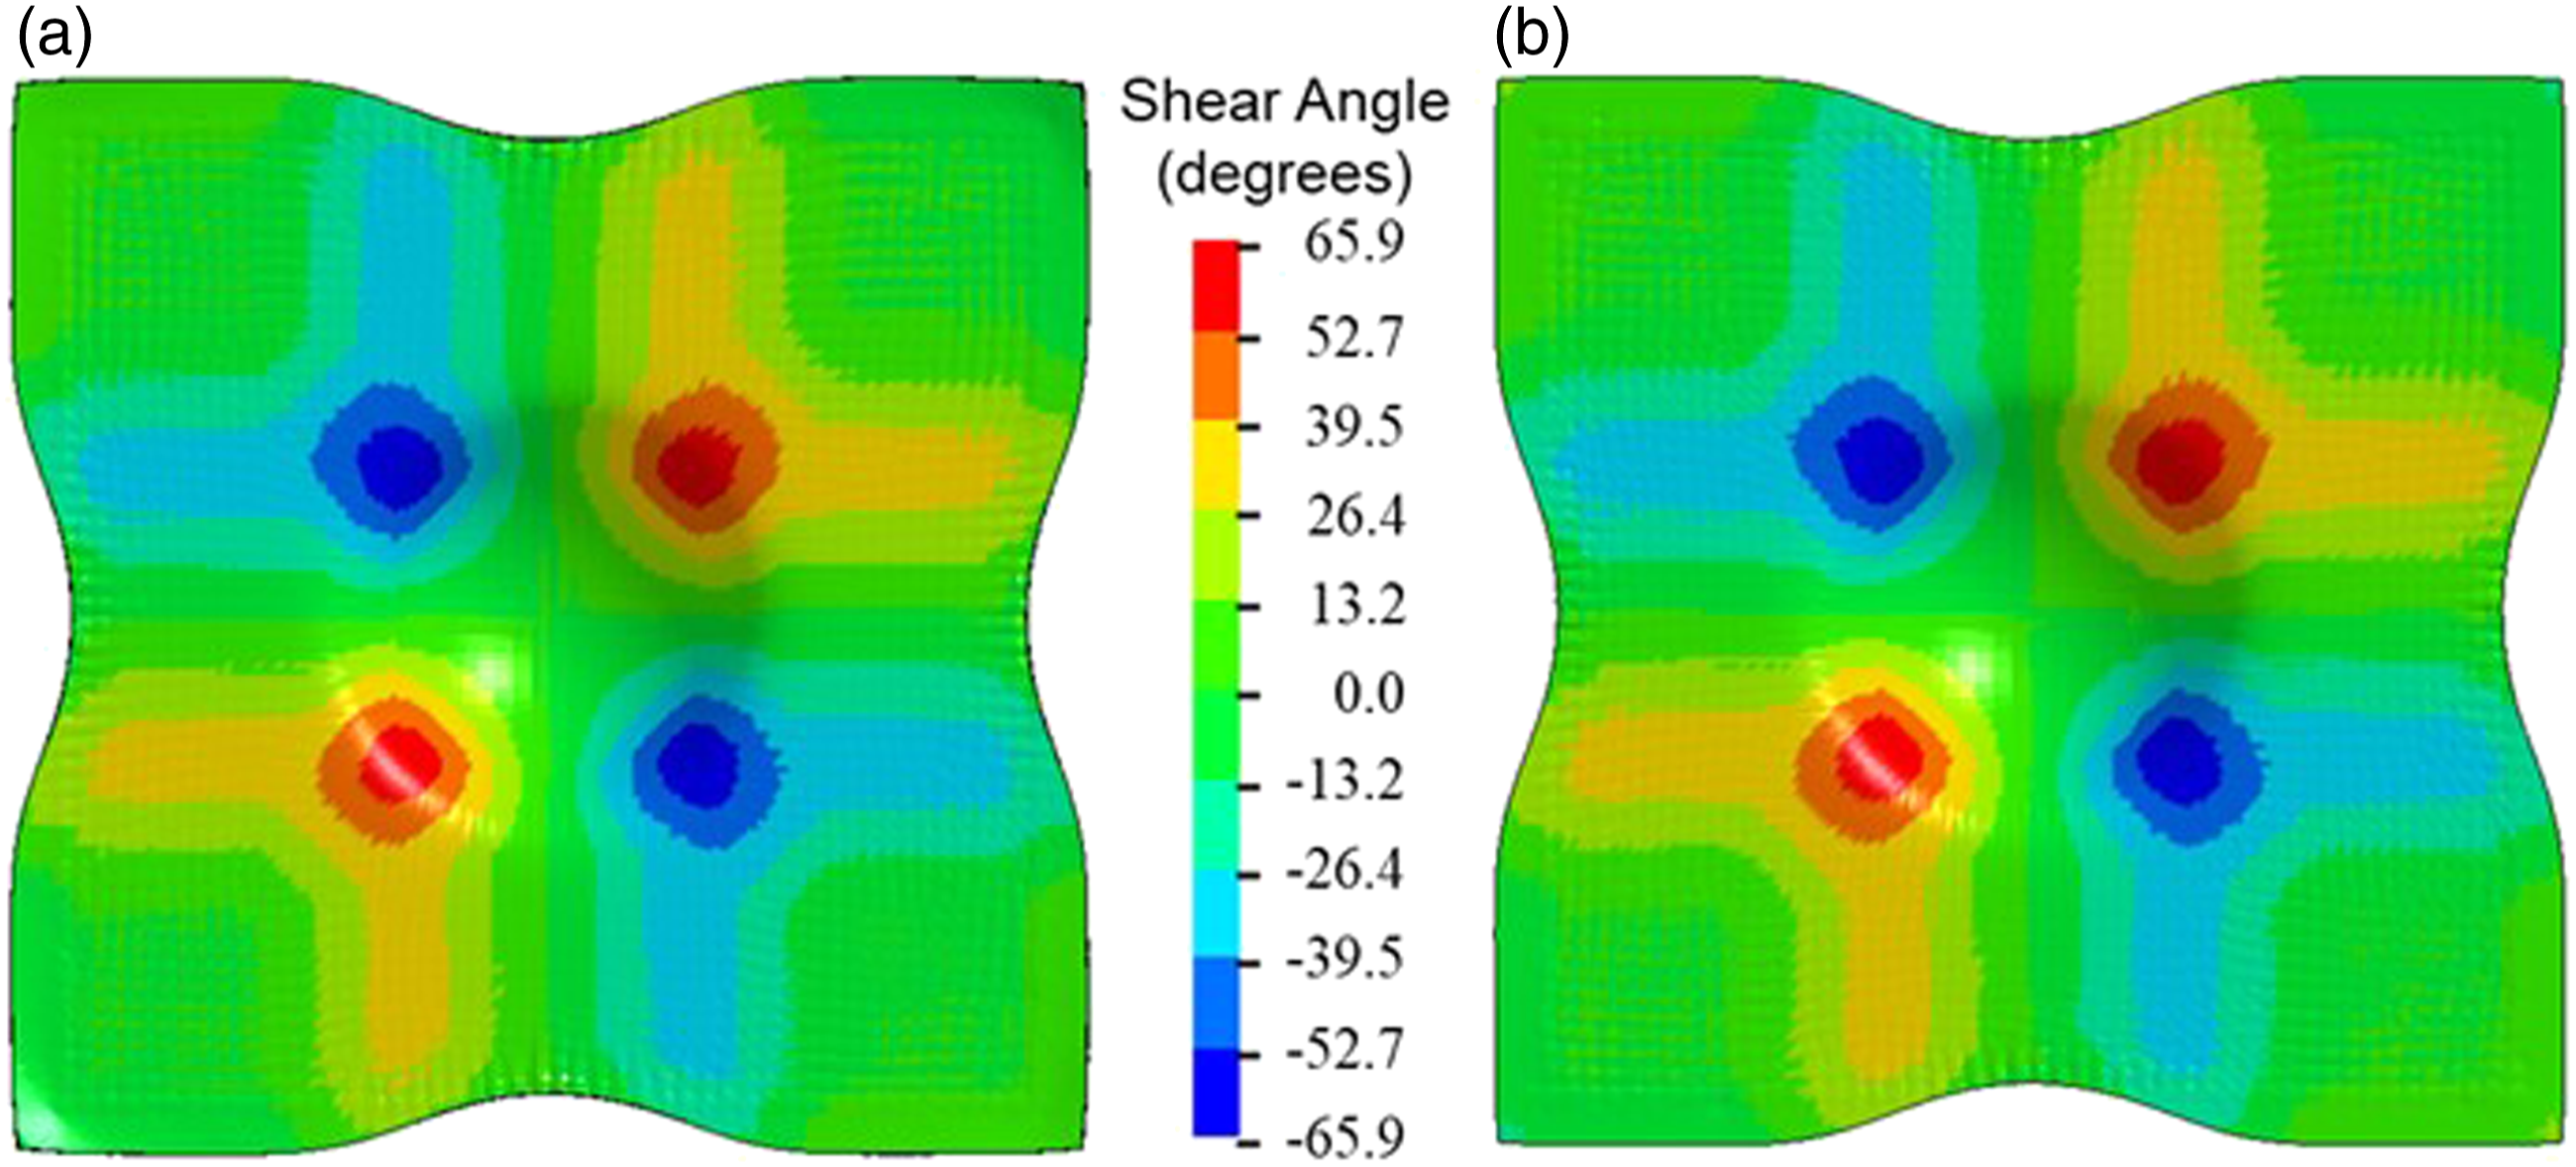
Experimental results and model validation
The numerical model was previously shown to accurately predict UHMWPE material response in pure shear (picture frame experiments) and combined shear and extension (bias-extension test), 3 which has been established as sufficient model verification in related literature.10,23 This work seeks to establish a methodology for full model validation, which includes friction and out-of-plane deformation in addition to the complex in-plane material response.
An example of the predicted shear strain field is given in Figure 15-(a), with the hemisphere fully embedded in the stack of UHMWPE. The numerical shear distribution is flattened out and translated to a thickness mapping on a quarter symmetric flat part (Figure 15-(b)), consisting of 5 sheets of HB210 with an undeformed thickness of 0.75 mm, using the method described in Figure 12. Moving along the peak shear line (Figure 15-(b)), the thickness increases gradually as you move from the center towards cut line, but much less gradual in the vicinity of where the shear angle reaches its maximum value, which differs from the much more gradual shear strain increase in the same region. The more rapid increase in thickness near the peak shear regions is due to the shape of the shear-to-thickness transfer function. Figures 15-(b) and (c) show a cut line, which represents the bounds of the formed hemispherical part on the flattened structure. The thickness distribution inside the cut line for the numerically predicted and experimental results are not differentiable, providing quantitative validation of the numerical model. It is also notable that material outside of the material comprising the final part deforms to enable the UHMWPE material to take the hemispherical shape and ensures the final part remains under tension, indicating that this material does serve a function in the manufacturing process despite not being in the final part. (a) Predicted shear strain distribution, (b) Predicted thickness mapped onto a flat sheet, and (c) experimentally characterized thickness mapping.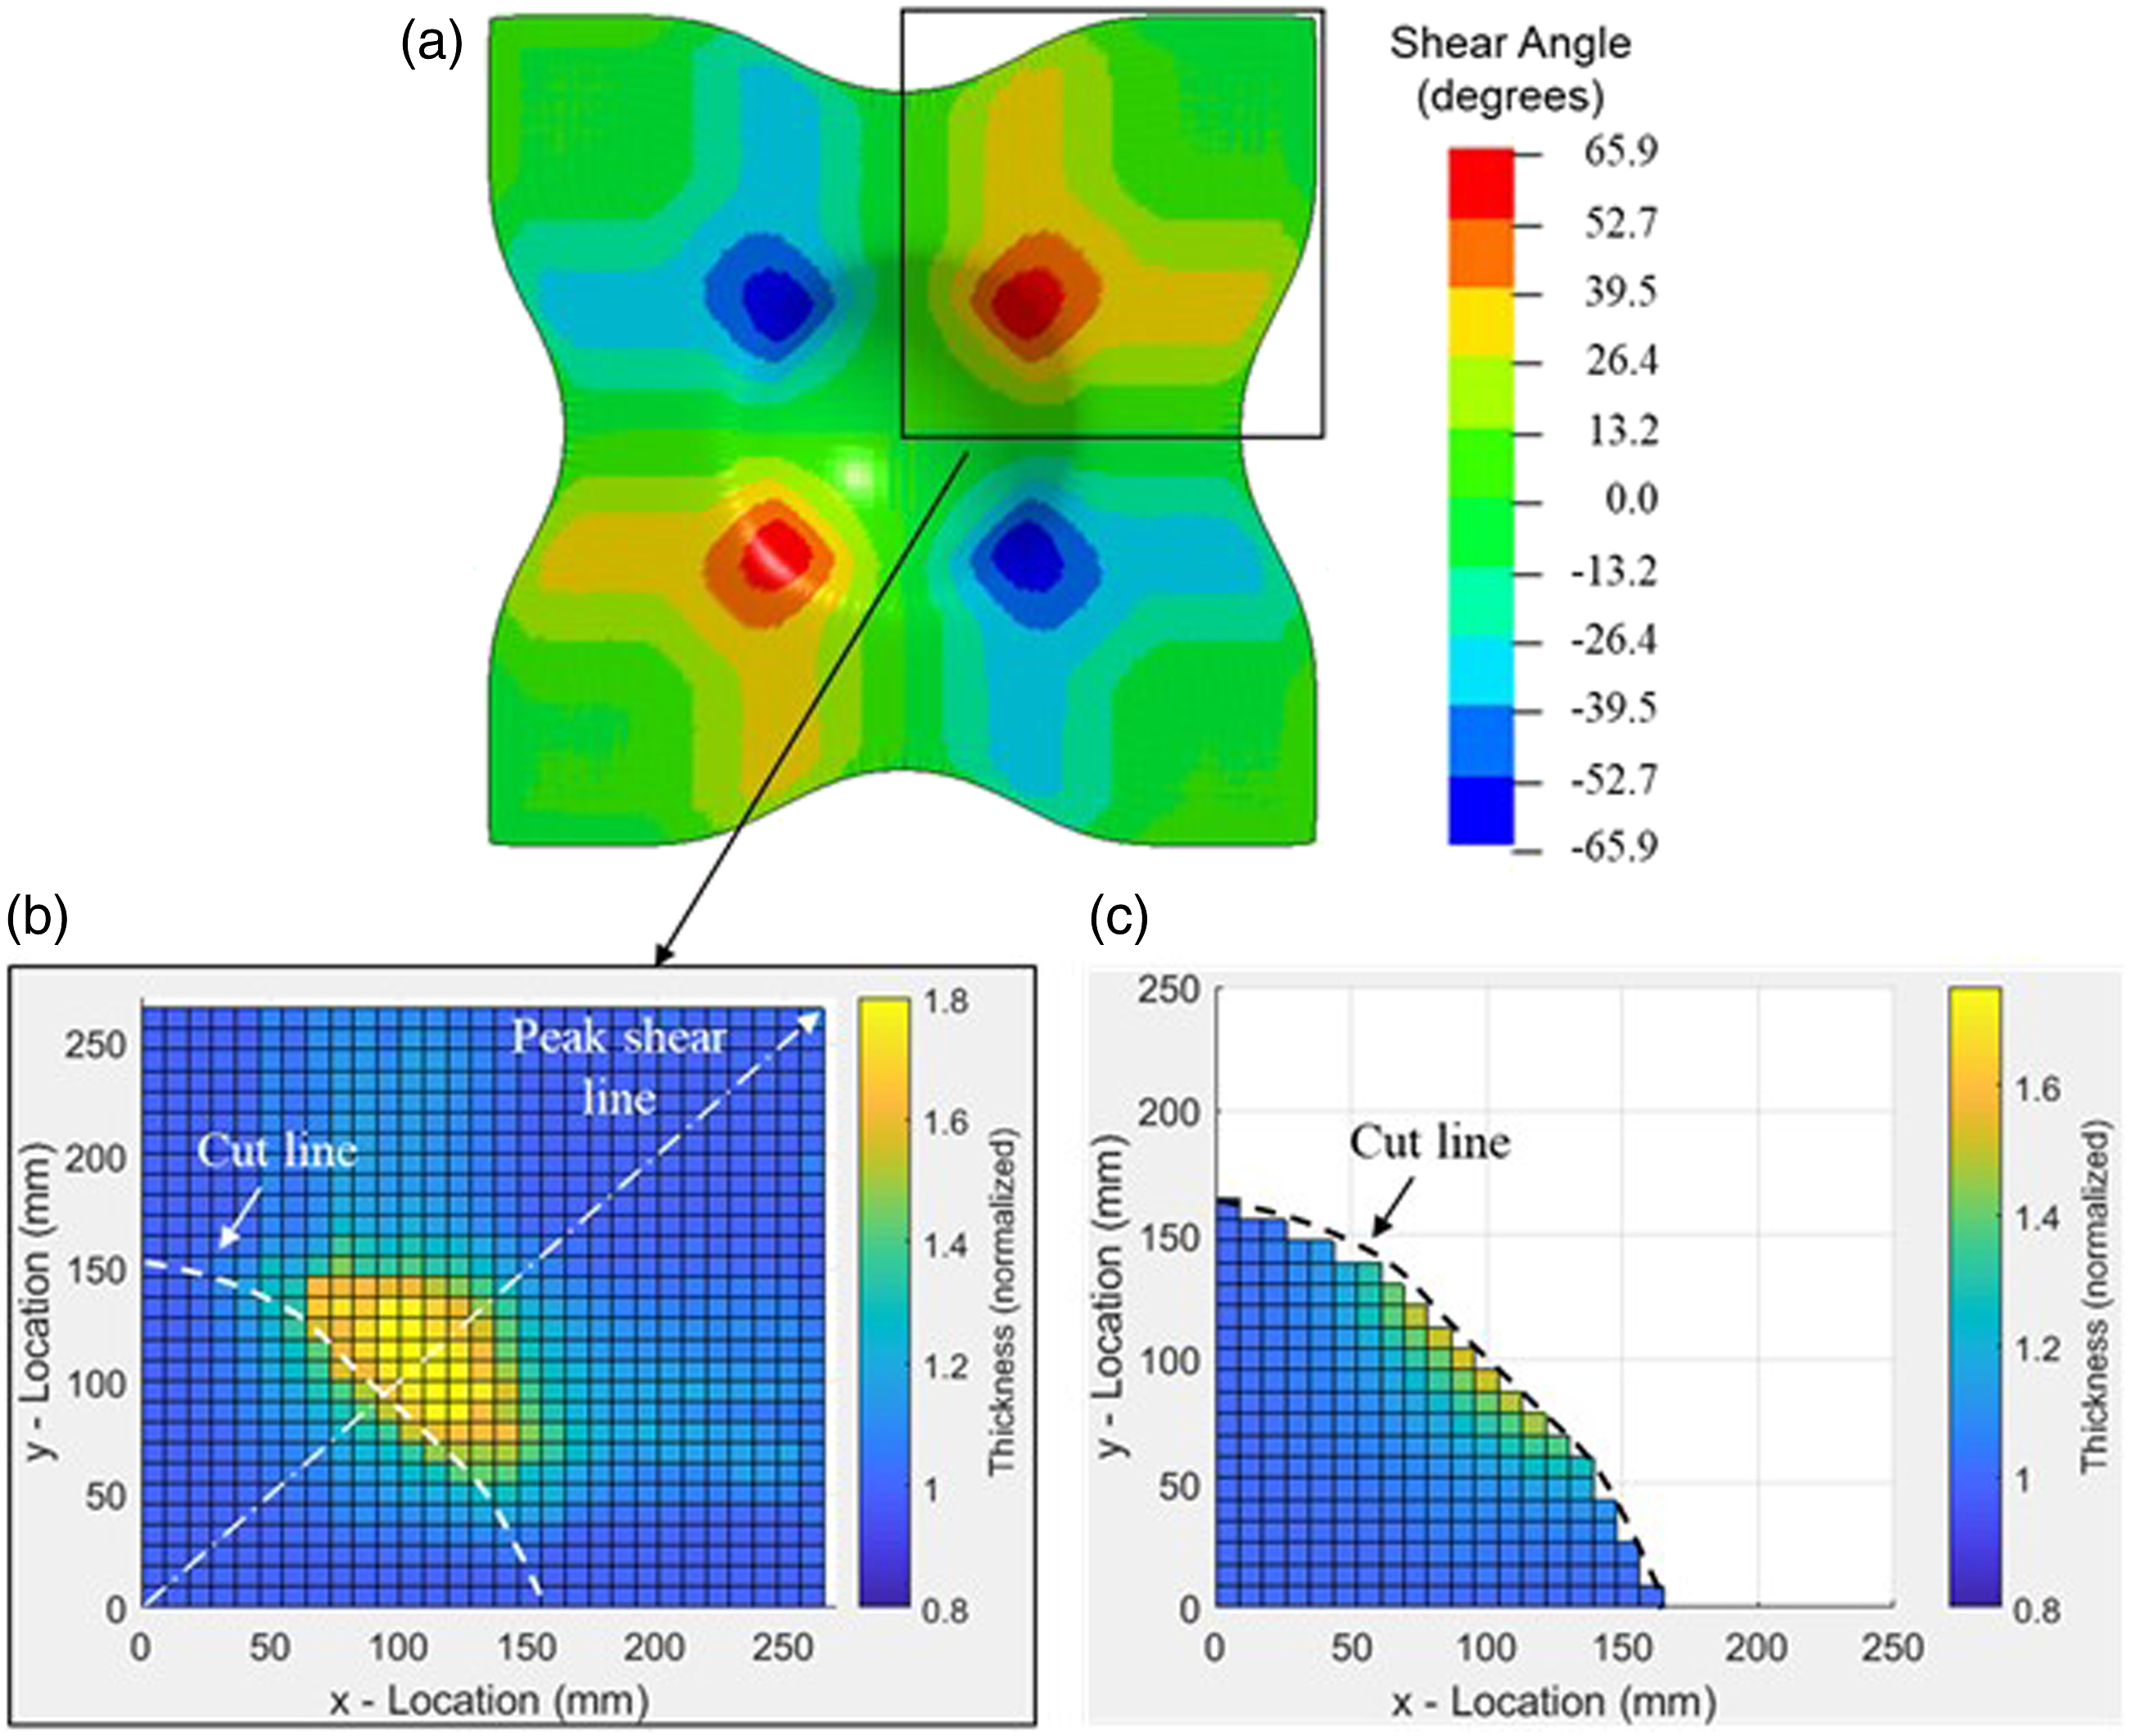
Full model validation is provided though evaluating predictions over a range of part thicknesses and materials. Although visual inspection of results (Figure 15) provides a qualitative support of the model, it can be difficult to objectively compare small color changes at specific locations in neighboring pictures, making a methodology to quantify differences desirable for validation. To quantify differences between model and experimental results, the percentage difference at each experimentally measured point was calculated. The experimental thickness values were taken at exact locations and the model predicted values were taken from the closest element to each experimental data point (within a negligible distance of 2-mm on a 482-mm x 482-mm sheet).
Figure 16-(a) shows the percent difference in thickness for 5 sheets of HB210, with x- and y-location nondimensionalized by half the UHMWPE sheet width and length, respectively. The maximum difference at any location was less than 7%, which fully validates the model for 5 sheets of HB210. The largest differences were found in the areas experiencing the highest amount of shear deformation. The model was next used to predict the deformation of 5 sheets of HB212, with input parameters given in Table 1. The results from the model and experiment were in good agreement (maximum difference of 12%), as seen in Figure 16-(b). Correctly predicting the preforming of multiple UHMWPE materials validates the applicability of both the model and the shear-to-thickness transfer function across this family of fiber based materials. Thickness difference between experimental and model results for (a) 5 sheets of HB210, (b) 5 sheets of HB212, (c) 10 sheets of HB210, and (d) 20 sheets of HB210.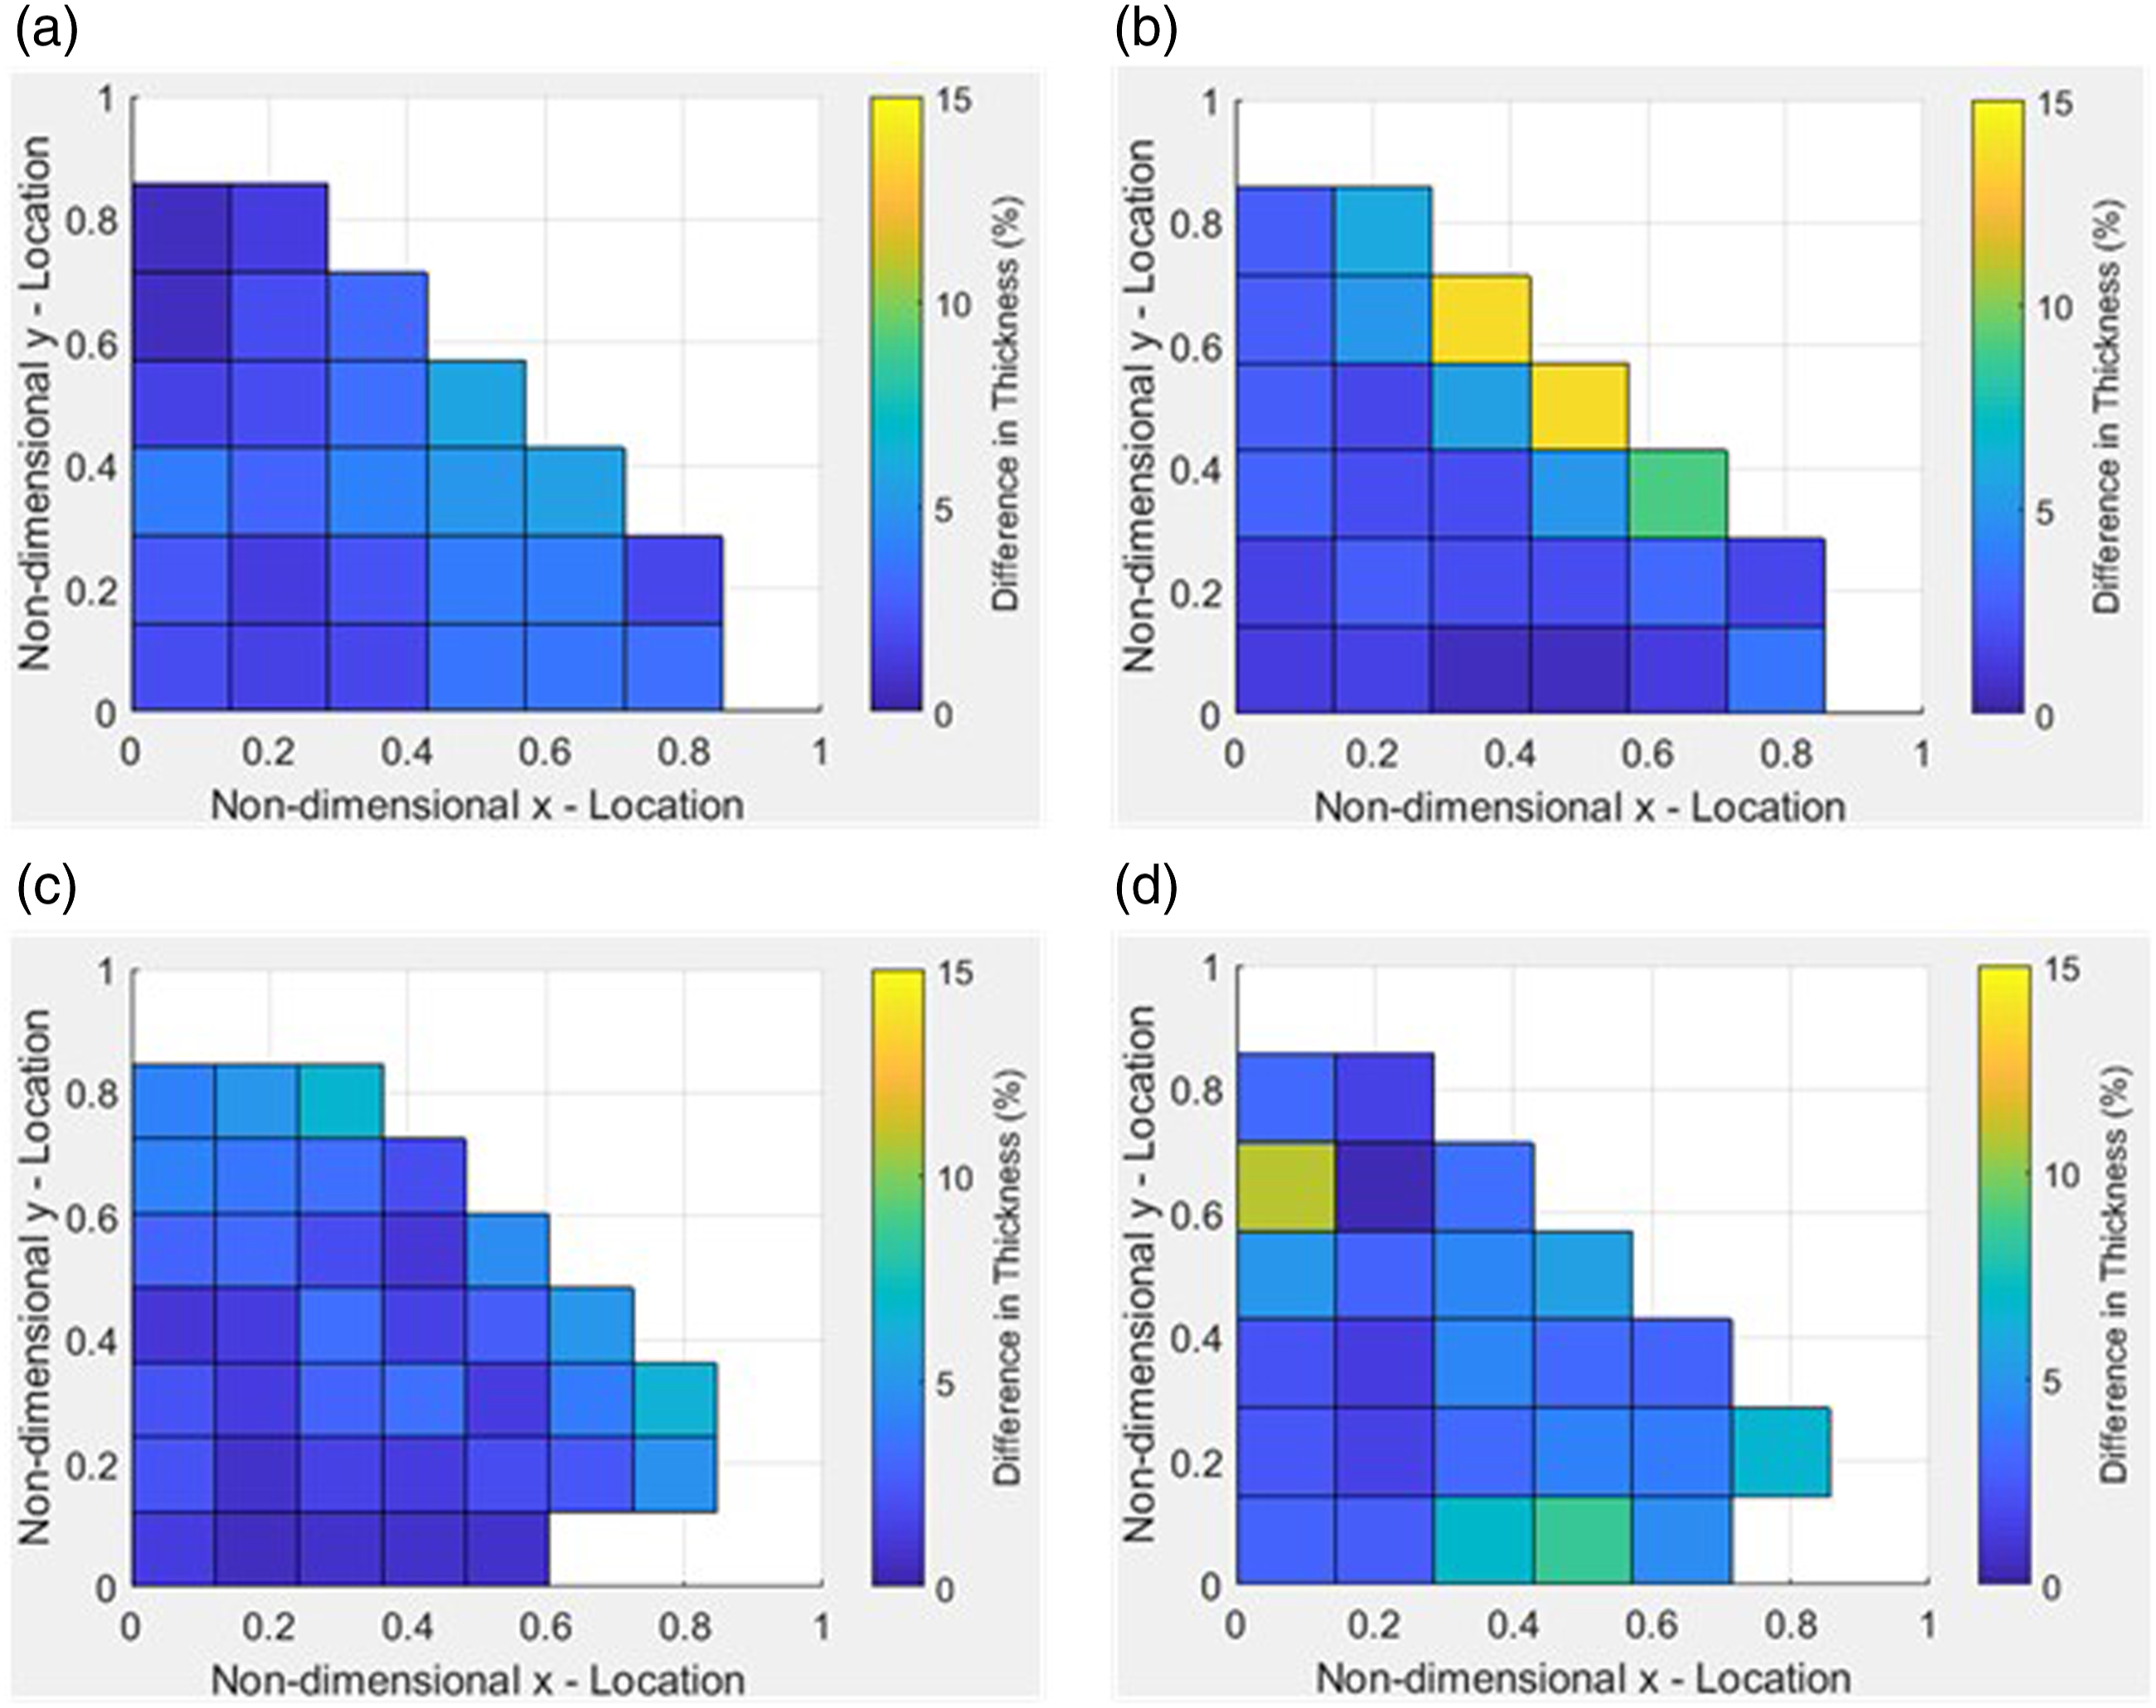
A model was run with 10 sheets represented by one shell layer to examine if the homogenization scheme could be extended further. The good agreement between model and experimental results, shown in Figure 16-(c), confirms that 10 sheets can be homogenized into one shell layer. This good agreement is a critical result because typical complex curvature preforms consist of more than 80 sheets of UHMWPE, which through homogenization can be condensed into a computationally feasible model.
The final aspect of the model validation is including multiple homogenized sheets into the same model. Two homogenized shell layers, each representing 10 sheets of UHMWPE, were used to predict the preforming of a stack of 20 HB210 sheets. The excellent agreement between model and experimental results for 20 UHMWPE sheets, described in Figure 16-(d), demonstrates the accuracy of the model when combining multiple homogenized shell layers into the same simulation. This is critical for simulating 80 or more UHMWPE sheets in complex curvature parts while keeping computational time manageable.
Influence of material in-plane shear response
It has been shown that the in-plane shear response is over 10 times stiffer at room temperature than elevated temperatures,
22
which is the motivation behind forming at elevated temperatures. Although material in-plane shear response has a widely recognized influence on the preforming process,1,24–26 a quantification of its influence on UHMWPE part thickness gradients has not been established. The shape of the baseline in-plane shear strain curve describing the response of HB210 was modified to gain an understanding of its effect on thickness distributions. The modifications include (1) cutting the stiffness in half, (2) doubling the stiffness, (3) multiplying the stiffness by ten, and (4) accelerating the transition between regions (tightening the curve), which are illustrated in Figure 17. In an actual preforming trial, controlling the stiffness of the in-plane shear response is done via changing the temperature at which preforming occurs, while a tightening (and stiffness modification) of the curve corresponds more with changing the type of UHMWPE material being preformed. Parametric study of in-plane shear strain input curves.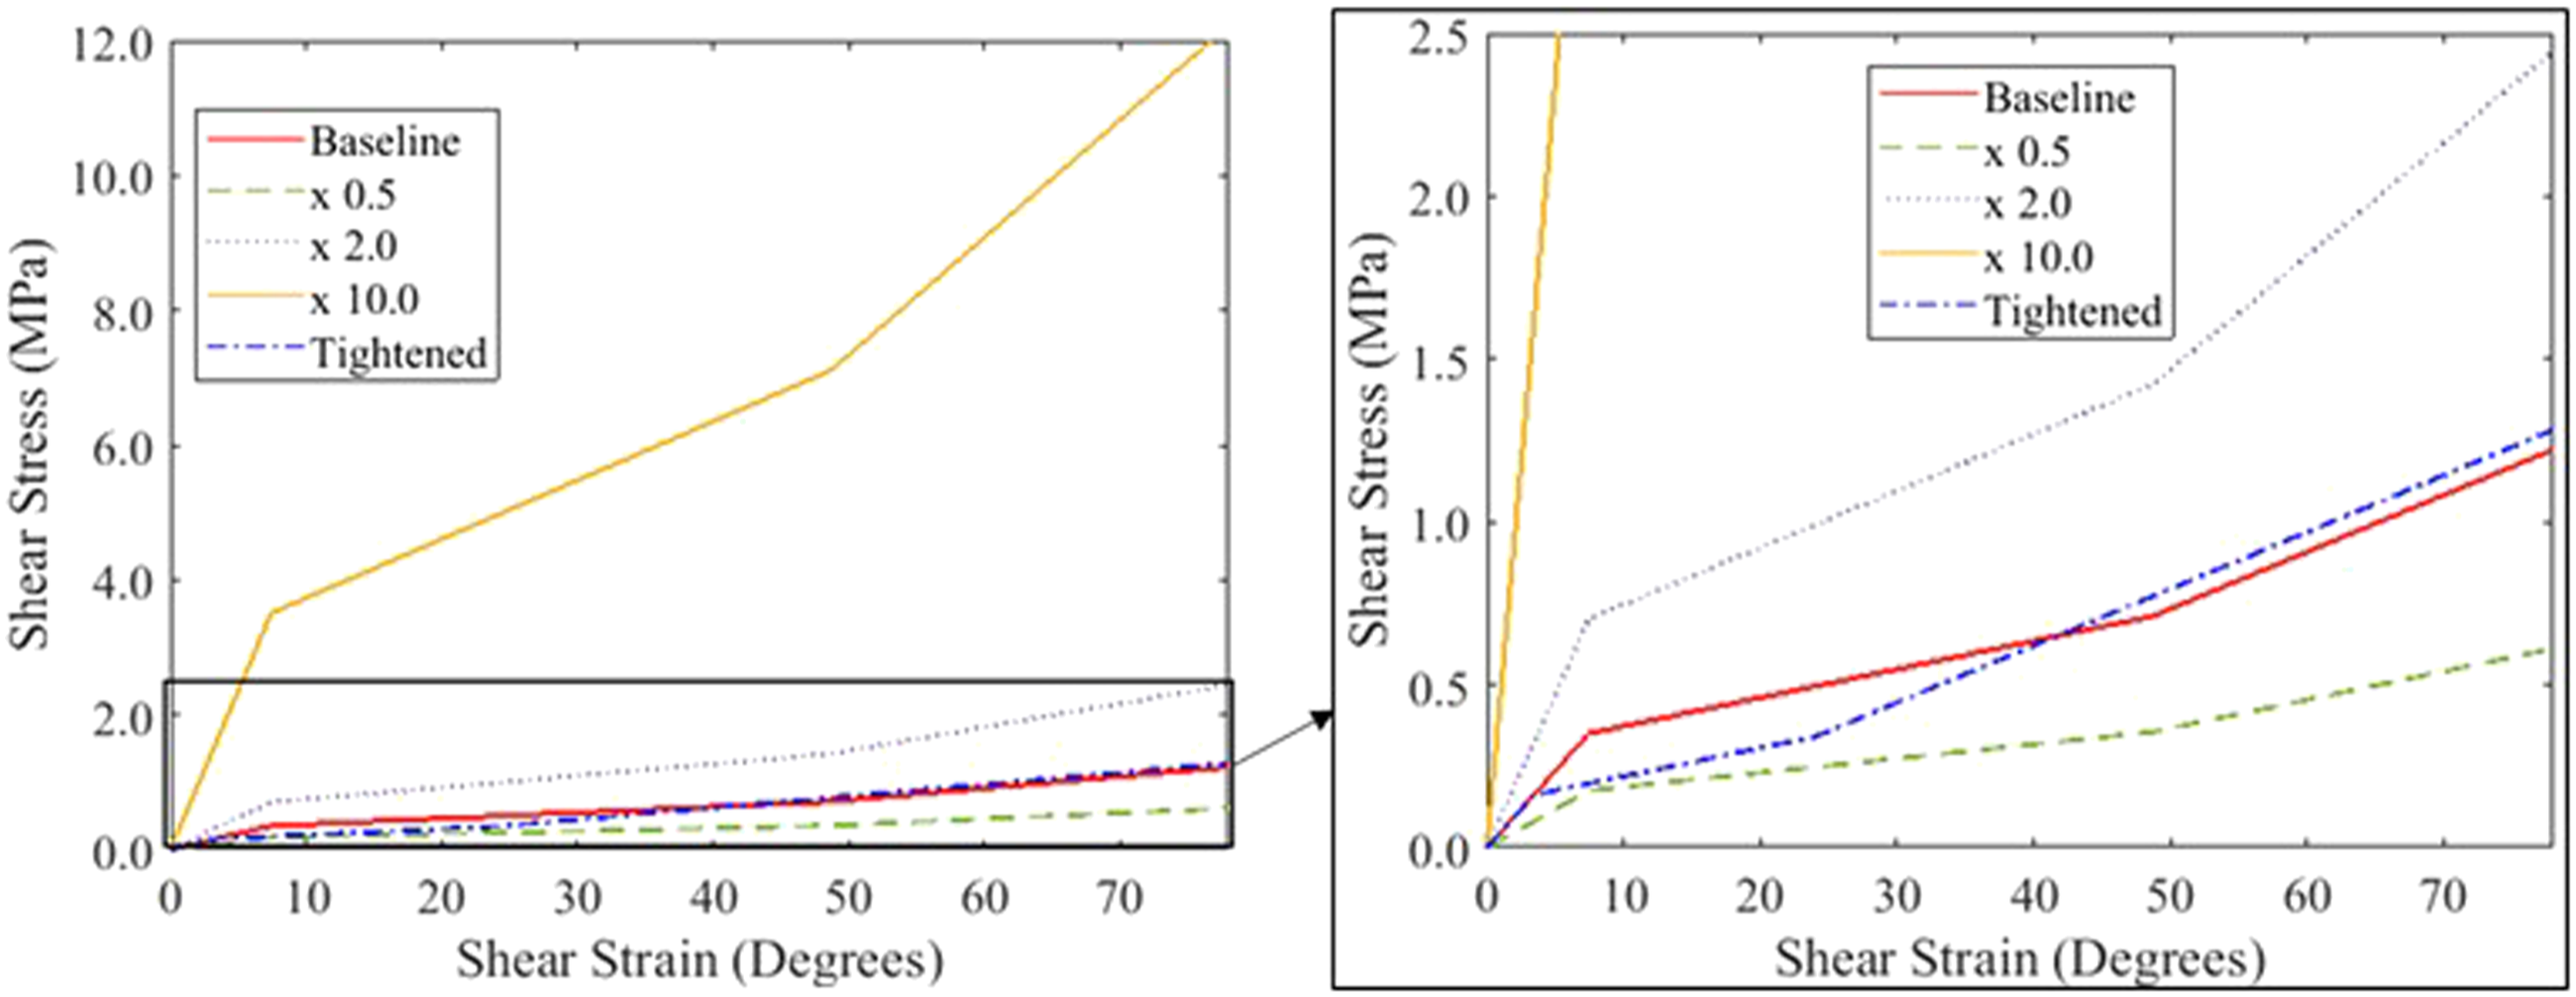
Each modification to the in-plane shar response had an influence on the final part thickness distribution. Cutting the shear stiffness in half led to a modest increase in part thickness (about 20%) in the areas of higher shear deformation, shown in Figure 18. As expected in areas with little or no shear deformation (closer to the center of the preform), there was a negligible change in part thickness, which was observed in all examined modifications of the shear response. Conversely, a doubling of the in-plane shear stiffness led to decreasing the part thickness by about 10% in the peak shear regions. Decreasing the transition angles (angles at which the trilinear shear curve transitions from the first to second and second to third shear stiffness) by 50% had an insignificant influence on part thickness as evidenced by how closely the tightened and baseline curves matched in Figure 18. These results indicate that the shear stiffness of the material, which is a function of location in forming due to the varying shear angles throughout the part (areas with different shear angles will have a different shear stiffness due to the nonlinear relationship between shear stress and shear strain) is what determines the thickness gradients found in the preformed part. The point at which the in-plane shear response changes does not have a noticeable influence on the final part. Influence of shear input curve on nondimensional part thickness along the diagonal (peak shear line) as a function of normalized distance from the center of the preform.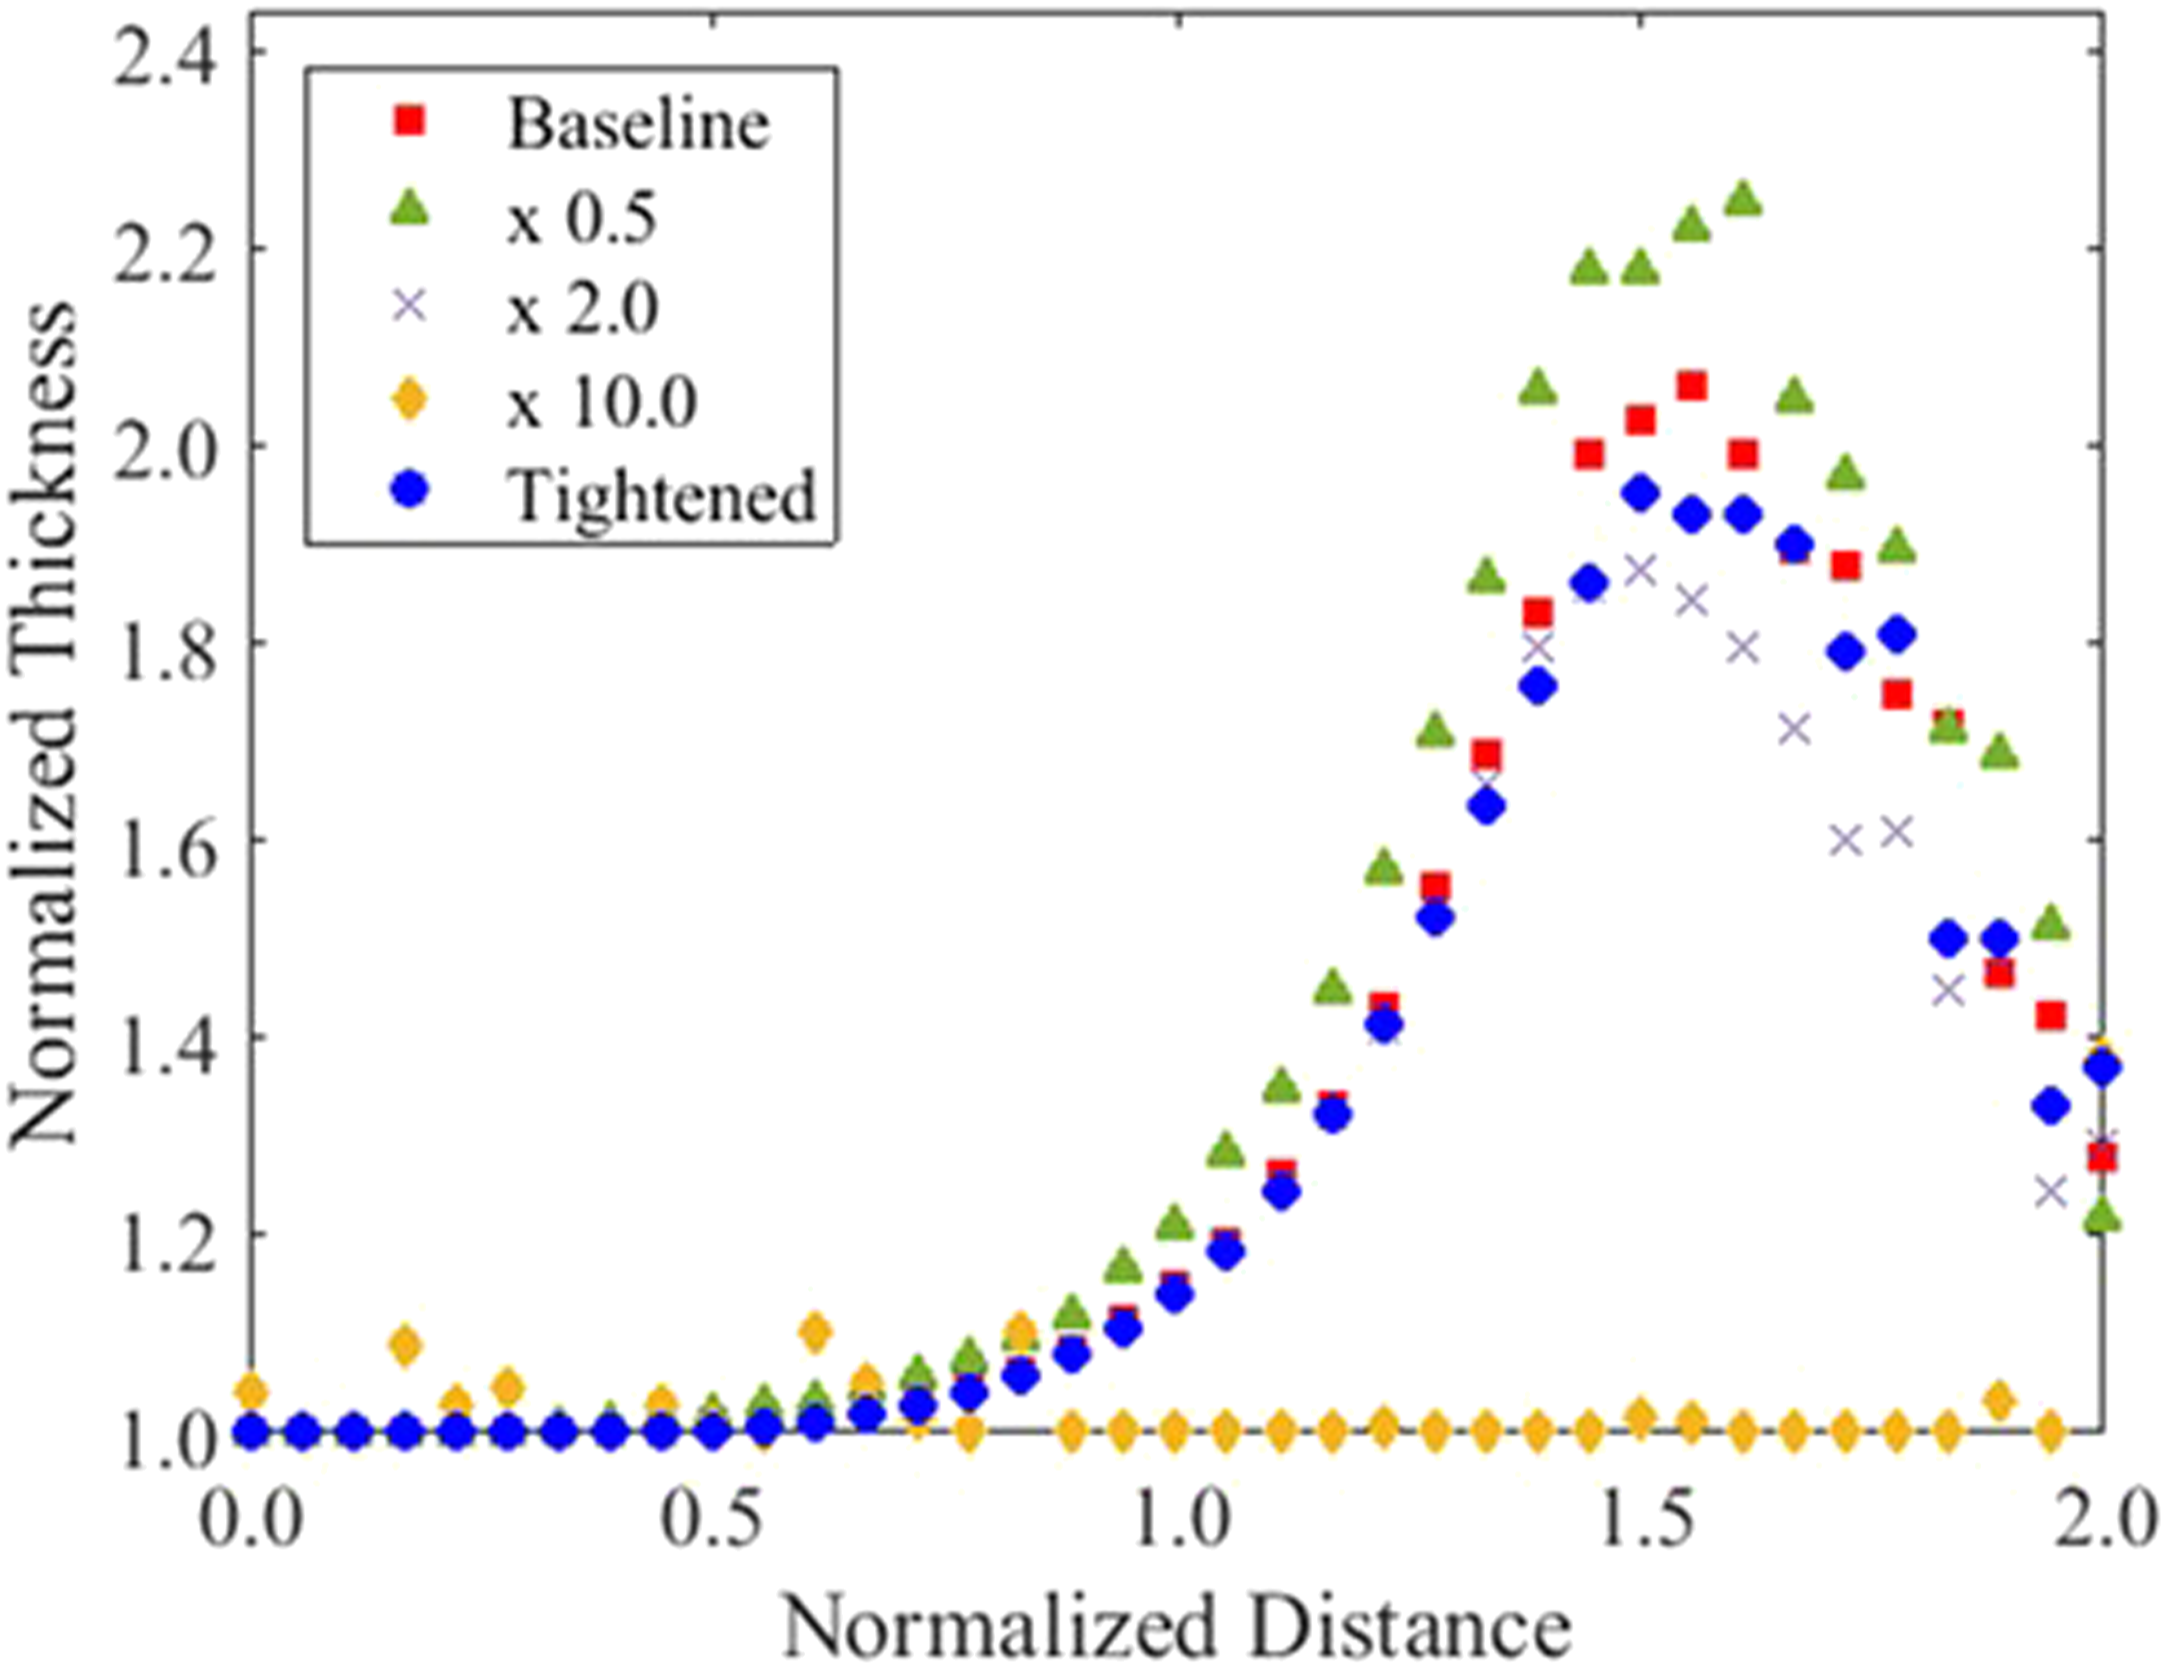
UHMWPE has a much higher in-plane shear stiffness at room temperature than elevated temperatures. When the in-plane shear stiffness in increased by 10x with the baseline normal stress applied to the binder, the default deformation mechanism becomes wrinkling. This decreases the thickness distributions from shear thickening, described in Figure 18, but results in a much lower preform quality. The introduction of wrinkles into a preform for ballistic protection is catastrophic and validates the need to preform at elevated temperatures.
Conclusions
An approach for modeling the deformation of UHMWPE composites during deep-draw forming was presented. Multiple approaches for characterizing shear deformation in compound curvature parts were presented and compared. An analytical methodology for converting shear deformation to UHMWPE sheet thickness increases was shown. Experimental results were presented and used to compare the effect of UHMWPE material type and part thickness on normalized thickness distributions. These results were utilized to validate the computational model over a range of preform thicknesses and for multiple types of UHMWPE materials. A homogenization strategy for grouping sheets in the model was presented and verified for up to 10 sheets of UHMWPE. This is a critical result as it greatly reduces simulation time and enables the modeling of deep-draw forming for full-scale complex curvature UHMWPE composites. The relationship between in-plane shear response and thickness gradients in deep-draw preforms was demonstrated. The model developed in this effort was found to accurately predict the shear deformation and thickness gradients that develop in UHMWPE preforms during deep-draw forming. This model represents a valuable tool for determining deep-draw forming parameters and can be used to accelerate the evaluation of new and emerging UHMWPE based materials for application in advanced complex curvature composite manufacture.
Footnotes
Declaration of conflicting interests
The author(s) declared no potential conflicts of interest with respect to the research, authorship, and/or publication of this article.
Funding
The author(s) received no financial support for the research, authorship, and/or publication of this article.
Disclaimer
The views and conclusions contained in this document are those of the authors and should not be interpreted as presenting the official policies or position, either expressed or implied, of the DEVCOM Army Research Laboratory, DEVCOM Soldier Center or the U.S. Government unless so designated by other authorized documents. Citation of manufacturers or trade names does not constitute an official endorsement or approval of the use thereof. The U.S. Government is authorized to reproduce and distribute reprints for Government purposes notwithstanding any copyright notation hereon.