
Abstract
The massive production and accumulation of industrial solid waste-iron tailings not only occupy valuable land resources but also easily cause environmental pollution and personnel injury. Based on this, the thermoplastic polyurethane (TPU)/modified iron tailings (MIT) composites were prepared by surface modification of iron tailings (MIT) and adding it as flame retardant to TPU. The combustion performance and smoke toxicity of TPU/MIT composites were analyzed by thermogravimetric analysis (TG), thermogravimetric-spectroscopy (TG-IR) and cone calorimetry (CCT). The morphology and structure of the carbon slag of the composites were analyzed by scanning electron microscopy(SEM) and Raman spectroscopy. The results showed that the initial thermal decomposition temperature (T-5%) of TPU/MIT30 composite increased at about 7oC, and the residual carbon content at 700oC increased from 3.13 wt% to 32.17 wt%. The peak heat release rate(PHRR), total heat release(THR) and total smoke release(TSR) of TPU/MIT30 composite decreased from 800.6 kW/m2, 83.1 MJ/m2 and 827.6 m2/m2 of pure TPU to 488.0 kW/m2, 63.6 MJ/m2 and 517.4 m2/m2, respectively. The SEM and Raman1 spectroscopy of char residue showed that the compactness and graphitization degree of char residue for TPU/MIT30 composite was the highest, indicating that the MIT could effectively improve the fire safety of TPU composites. This study provided some ideas for the high-value utilization of iron tailings.
Introduction
Iron tailings (IT) is the remaining industrial solid waste of iron ore after beneficiation. The massive production and accumulation of iron tailings not only occupy valuable land resources, but also have many environmental safety hazards such as dam break, dust, water pollution and so on, and pose a serious threat to the safety of human life and property. 1 According to statistics, China produced 476 million tons of IT only in 2018, so how to deal with large amounts of IT has become a serious social problem.2–4 Thermoplastic polyurethane(TPU) is a kind of polymer material with excellent wear resistance, oil resistance, low-temperature resistance, insulation, ozone resistance and biocompatibility, which is widely used in wire and cable, shoe industry, clothing, medical treatment and national defense.5–7 However, TPU is a flammable material and burns rapidly once exposed to fire, accompanied by molten drip phenomenon and the generation of large amounts of toxic fumes, which seriously threaten the safety of people’s lives and properties.8–10 Therefore, the flame retardant modification of TPU has become the focus of research in the industry.11,12
At present, there are two common flame retardant methods for TPU: reactive flame retardant and additive flame retardant, while reactive flame retardant has high cost and complex process, so it is less applied. In contrast, additive flame retardant has the advantages of the wide source of raw materials, simple process, low cost and good flame retardant effect, so it becomes the main way to prepare flame retardant TPU. Among them, inorganic flame retardants are more widely used in additive flame retardants, mainly including ammonium polyphosphate, metal oxides, metal hydrates, etc.13–15
Shi et al. 16 synthesized titanium carbide/nano-copper(Ti3C2Tx/Nano-Cu) acting in thermoplastic polyurethane(TPU) to prepare TPU nanocomposites. The study showed that the Ti3C2Tx/Nano-Cu heterocycles exhibited strong interfacial interactions with the TPU host, and the CO production rate of the corresponding TPU composites was much lower than that of the pure TPU when 2 wt% of Ti3C2Tx/Nano-Cu was added. Liu et al. 17 prepared nickel-aluminum bimetallic hydroxide(NiAl-LDH) and used it to flame retardant TPU. It was shown that the addition of 3 wt% NiAl-LDH increased the residual carbon rate of TPU/NiAl-LDH nanocomposites from 0.1 wt% to 2.6 wt% at 700oC, meanwhile NiAl-LDH could effectively improve the stability and graphitization of carbon layer for the TPU composites, thereby improving the fire safety performance of the composites.
Turkan et al. 18 studied the effect of (EG) and magnesite(HH) on the flame retardation of TPU. The results showed that when the content of HH was 50%, the PHRR and THR of TPU/HH composites decreased by 57% and 28% compared with pure TPU, respectively. When the ratio of EG and HH was 1:1, the PHRR and THR values decreased significantly, and the LOI value of TPU/HH/EG composites increased from 21.2% to 32.6%. Saha et al. 19 added nano-SiO2 into TPU to prepare a series of TPU/SiO2 flame retardant composites. The results showed that the char residue of TPU-Si-4 composite (4 phr SiO2) increased from 4.1 wt% of TPU to 7.0 wt% at 800oC.
Zhou et al. 20 prepared cobalt oxide nanoparticles modified graphene nanosheets hybrid materials, and the hybrid was introduced into TPU to prepare TPU/Co3O4-GNS nanocomposites. It was shown that the thermal stability, flame retardancy, and mechanical properties of the TPU nanocomposites were significantly improved relative to pure TPU, and the toxicity of combustion fumes was significantly reduced. The char residue at 800oC of TPU/3.0% Co3O4-GNS composite increased from 2.8% of TPU to 8.5%.
IT contains a large number of metal oxides and silica, which have potential applications in the field of flame retardant. 21 Based on this, this paper selects iron tailing(IT) inorganic flame retardant source, and in order to improve the interfacial compatibility of IT and TPU substrate, and effectively play the enhancement effect of IT, the surface modification of IT by silane coupling agent KH550 is selected to prepare modified iron tailing(MIT). Fourier transform infrared spectroscopy(FTIR) and TG were used to characterize MIT. Then MIT were added into TPU by melt blending method to prepare TPU/MIT. The thermal stability and flame retardant properties of TPU/MIT composites were analyzed by TG, TG-IR and cone calorimetry(CCT). The above research provided a new strategy for the high-value utilization of IT.
Experimental part
Experimental raw materials
Iron tailings(IT) was purchased from Maanshan Nanshan Iron Mine. Silane coupling agent KH550, ammonia(NH3·H2O), anhydrous ethanol(C2H5OH) were purchased from Sinopharm Chemical Reagent Co., Ltd. Thermoplastic polyurethane (TPU, E8185) was provided by Baoding Bangtai Polymer New Materials Co., Ltd. Deionized water came from the laboratory.
Sample preparation
Fragmentation and refinement of IT
A planetary ball mill (XQM-4L, Nanjing Institute of Scientific Analysis and Experimental Instruments) was used to grind IT. According to the ball milling process using the size of the ball ratio of 1:5, taking 500 g of IT mixed with ball milling beads, ball milling at 600 r/min for 3 h, and then regrind for 2 h. The IT powder was passed through a 120-mesh sieve to remove the hard abrasives with high hardness and obtain IT powder.
Preparation of modified iron tailings
The deionized water(40.0 g) and anhydrous ethanol(160.0 g) were mixed in three flasks and stirred for 10 min. Then IT (40.0 g) was added, continuously mechanically stirred and heated to 90oC in a water bath, and KH550(8.0 g) was added after 5 min. After continuously stirring for 20 min, 5 mL NH3·H2O was added and kept at 90oC for 6 h. After the reaction was completed, the product was washed with a Buchner funnel three times using deionized water and anhydrous ethanol extraction, respectively, and the product was obtained and dried in an oven at 60oC to produce modified iron tailings (MIT).
Preparation of TPU and TPU/MIT composites
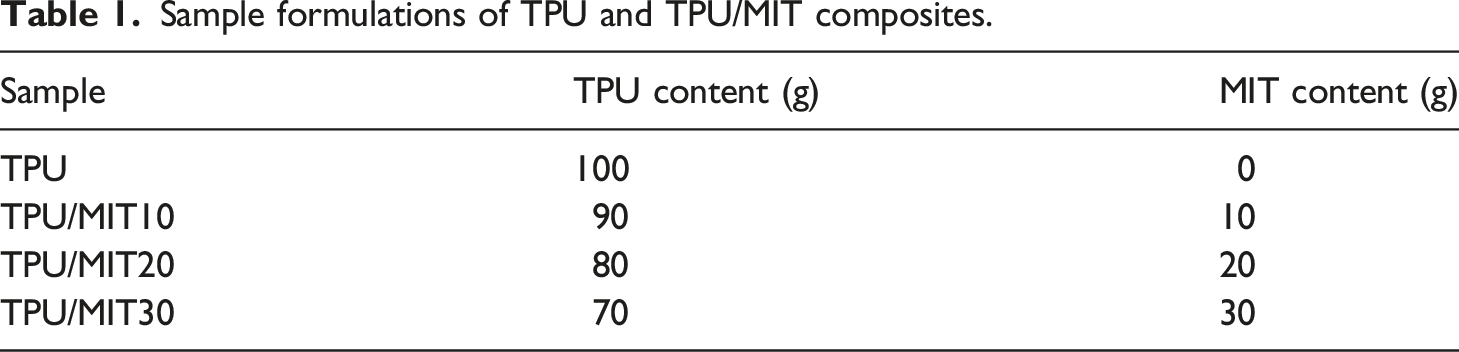
Sample formulations of TPU and TPU/MIT composites.
Testing and characterization methods
X-ray fluorescence spectroscopy(XRF): The sample powder was tested using an ARLAdvant’X Intellipower™ Model 3600 X-ray fluorescence spectrometer to analyze its chemical composition.
Fourier infrared spectroscopy(FTIR): The sample powders were tested by Nicolet 6700 FTIR spectrometer to obtain their Fourier transform infrared (FTIR) spectra. The wavenumber range was 400–4000 cm−1.
Thermogravimetric analysis(TG): 5–10 mg samples were heated from room temperature to 700oC at a rate of 20oC/min in a nitrogen atmosphere by Q5000 thermal analyzer. The TG curve was recorded and the thermal weight loss was investigated. The temperature corresponding to the weight loss of 5% was defined as the initial decomposition temperature (T-5%), the temperature corresponding to the weight loss of 50% was defined as the midpoint temperature of weight loss (T-50%), and the temperature corresponding to the maximum weight loss rate was defined as Tmax.
Thermogravimetric-infrared(TG-IR): TGA Q500 thermogravimetric analyzer connected with Nicolet 6700 FTIR spectrophotometer was used for TG-IR analysis. About 5–10 mg samples were put into the alumina crucible and heated from 30oC to 700oC at 20oC/min (nitrogen environment, flow rate of 70 mL/min).
Cone calorimetr(CCT): According to ISO5660-1 standard, the combustion behavior of the samples was tested by Stanton Redcroft cone calorimeter. The sample’s size were 100 mm×100 mm×3.2 mm, and the radiation heat flux during the test was 50 kW/m2. According to the test results, the heat release rate(HRR), total heat release(THR), smoke production rate(SPR), total smoke production(TSP) and total smoke release(TSR) of the samples were analyzed.
Raman spectroscopy(LRS): The inVia Raman spectrometer was used to test the Raman spectra of the char residue for the samples after combustion, and analyzed the graphitization degree of the char residue for the composites.
Results and discussion
Test characterization of IT
Main chemical components of IT and MIT obtained by XRF test.
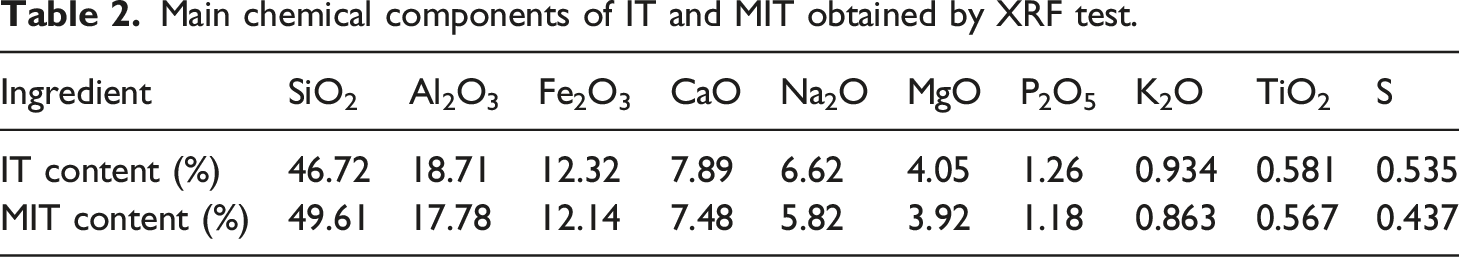
Figure 1 showed the Fourier transform infrared spectra of IT before and after modification, it could be seen that 3621 cm−1 in IT was the stretching vibration peak of -OH in Ca(OH)2 and SiO2.
22
The MIT at 3621 cm−1 as a stretching vibrational peak of N-H on KH550 aminopropyl.
23
The stretching vibration peak of -CH2 appeared at 2920 cm−1,
24
The Si-O-Si stretching vibration at 1008 cm−1,
25
the Si-OH stretching vibration peak at 760 cm−1 and the Si-O bending vibration peak at 462 cm−1 were significantly enhanced
26
indicating that KH550 had successfully modified IT. Infrared spectra of iron tailings and modified iron tailings.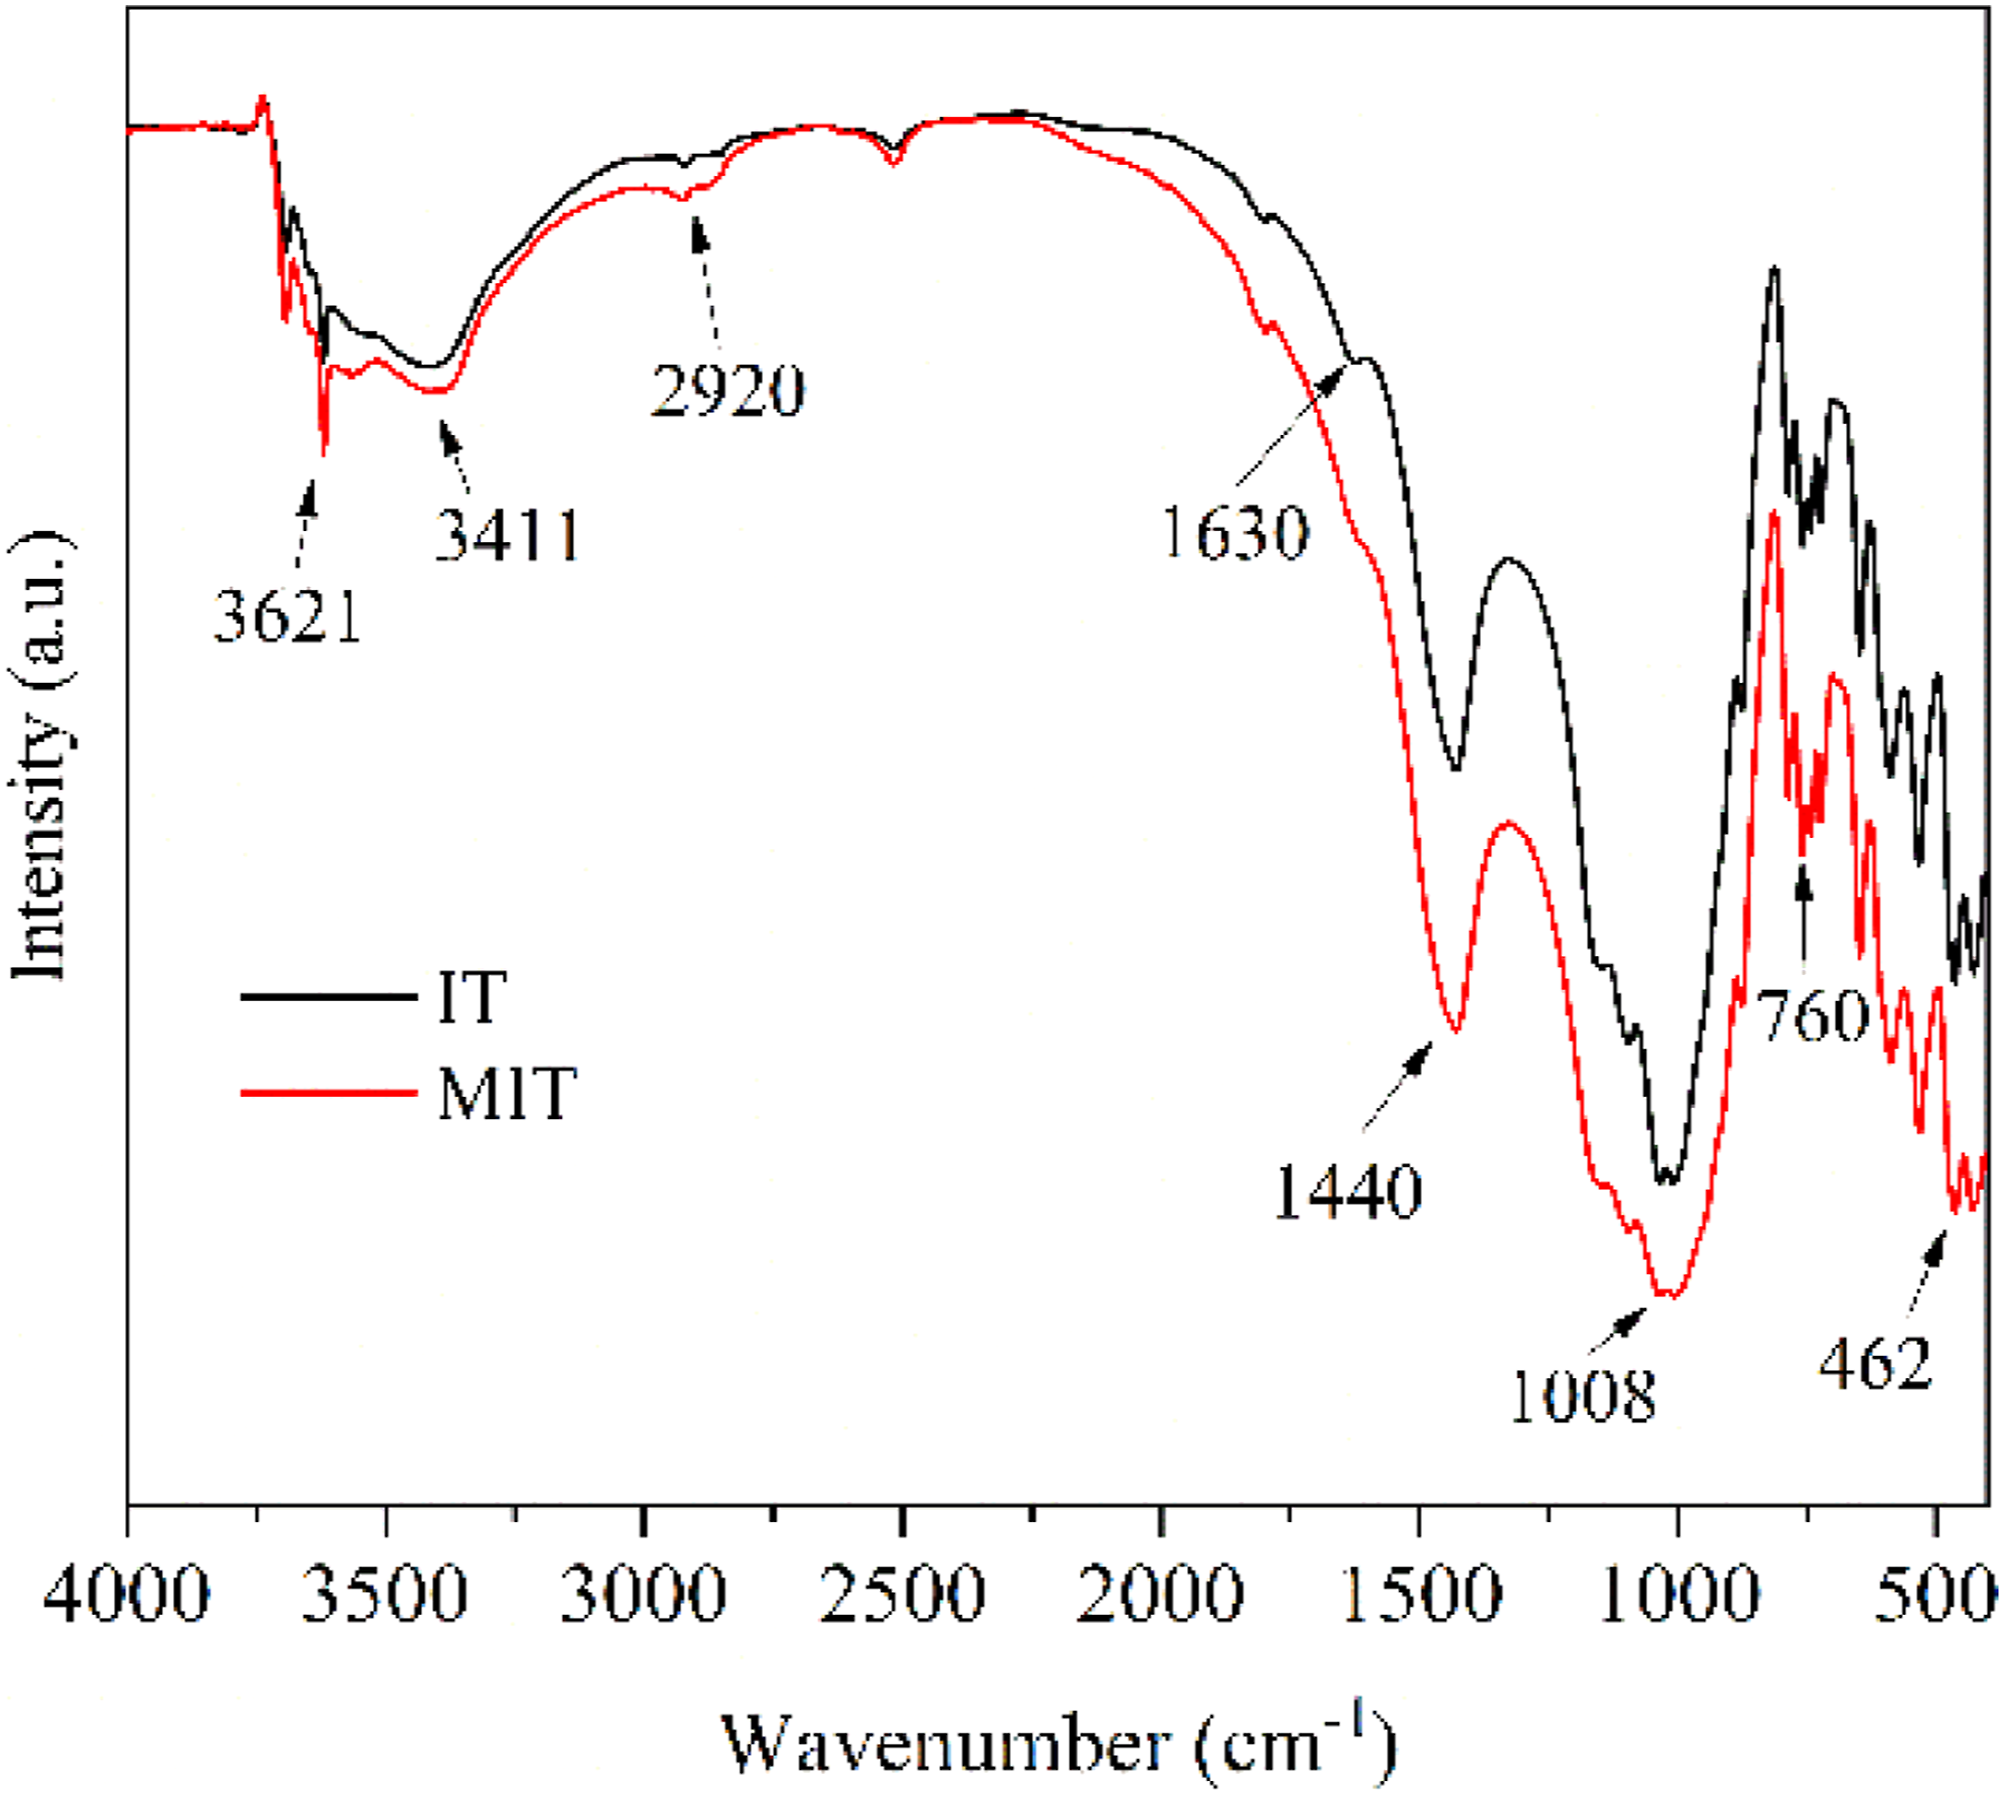
Figure 2 showed the thermogravimetry (TG) and differential thermogravimetry (DTG) curves of IT and MIT in a nitrogen environment, from which it could be seen that IT lose water under high-temperature conditions leading to mass loss. Comparing the TG curves of MIT and IT in Figure 2a, it could be seen that the mass loss of MIT at 700oC was higher than that of IT, and MIT exhibited weight loss at lower temperatures, which was mainly due to the presence of aminopropyl on the surface of MIT. From Figure 2b, the DTG curves of MIT and IT could be seen that the maximum heat loss rate of MIT was lower than the maximum heat loss rate of IT. The above results showed that KH550 had been successfully coated on the surface of IT. In addition to high-temperature dehydration, MIT’s aminopropyl segment of KH550 was also thermally decomposed at high temperature. TG(a) and DTG(b) curves of IT and MIT.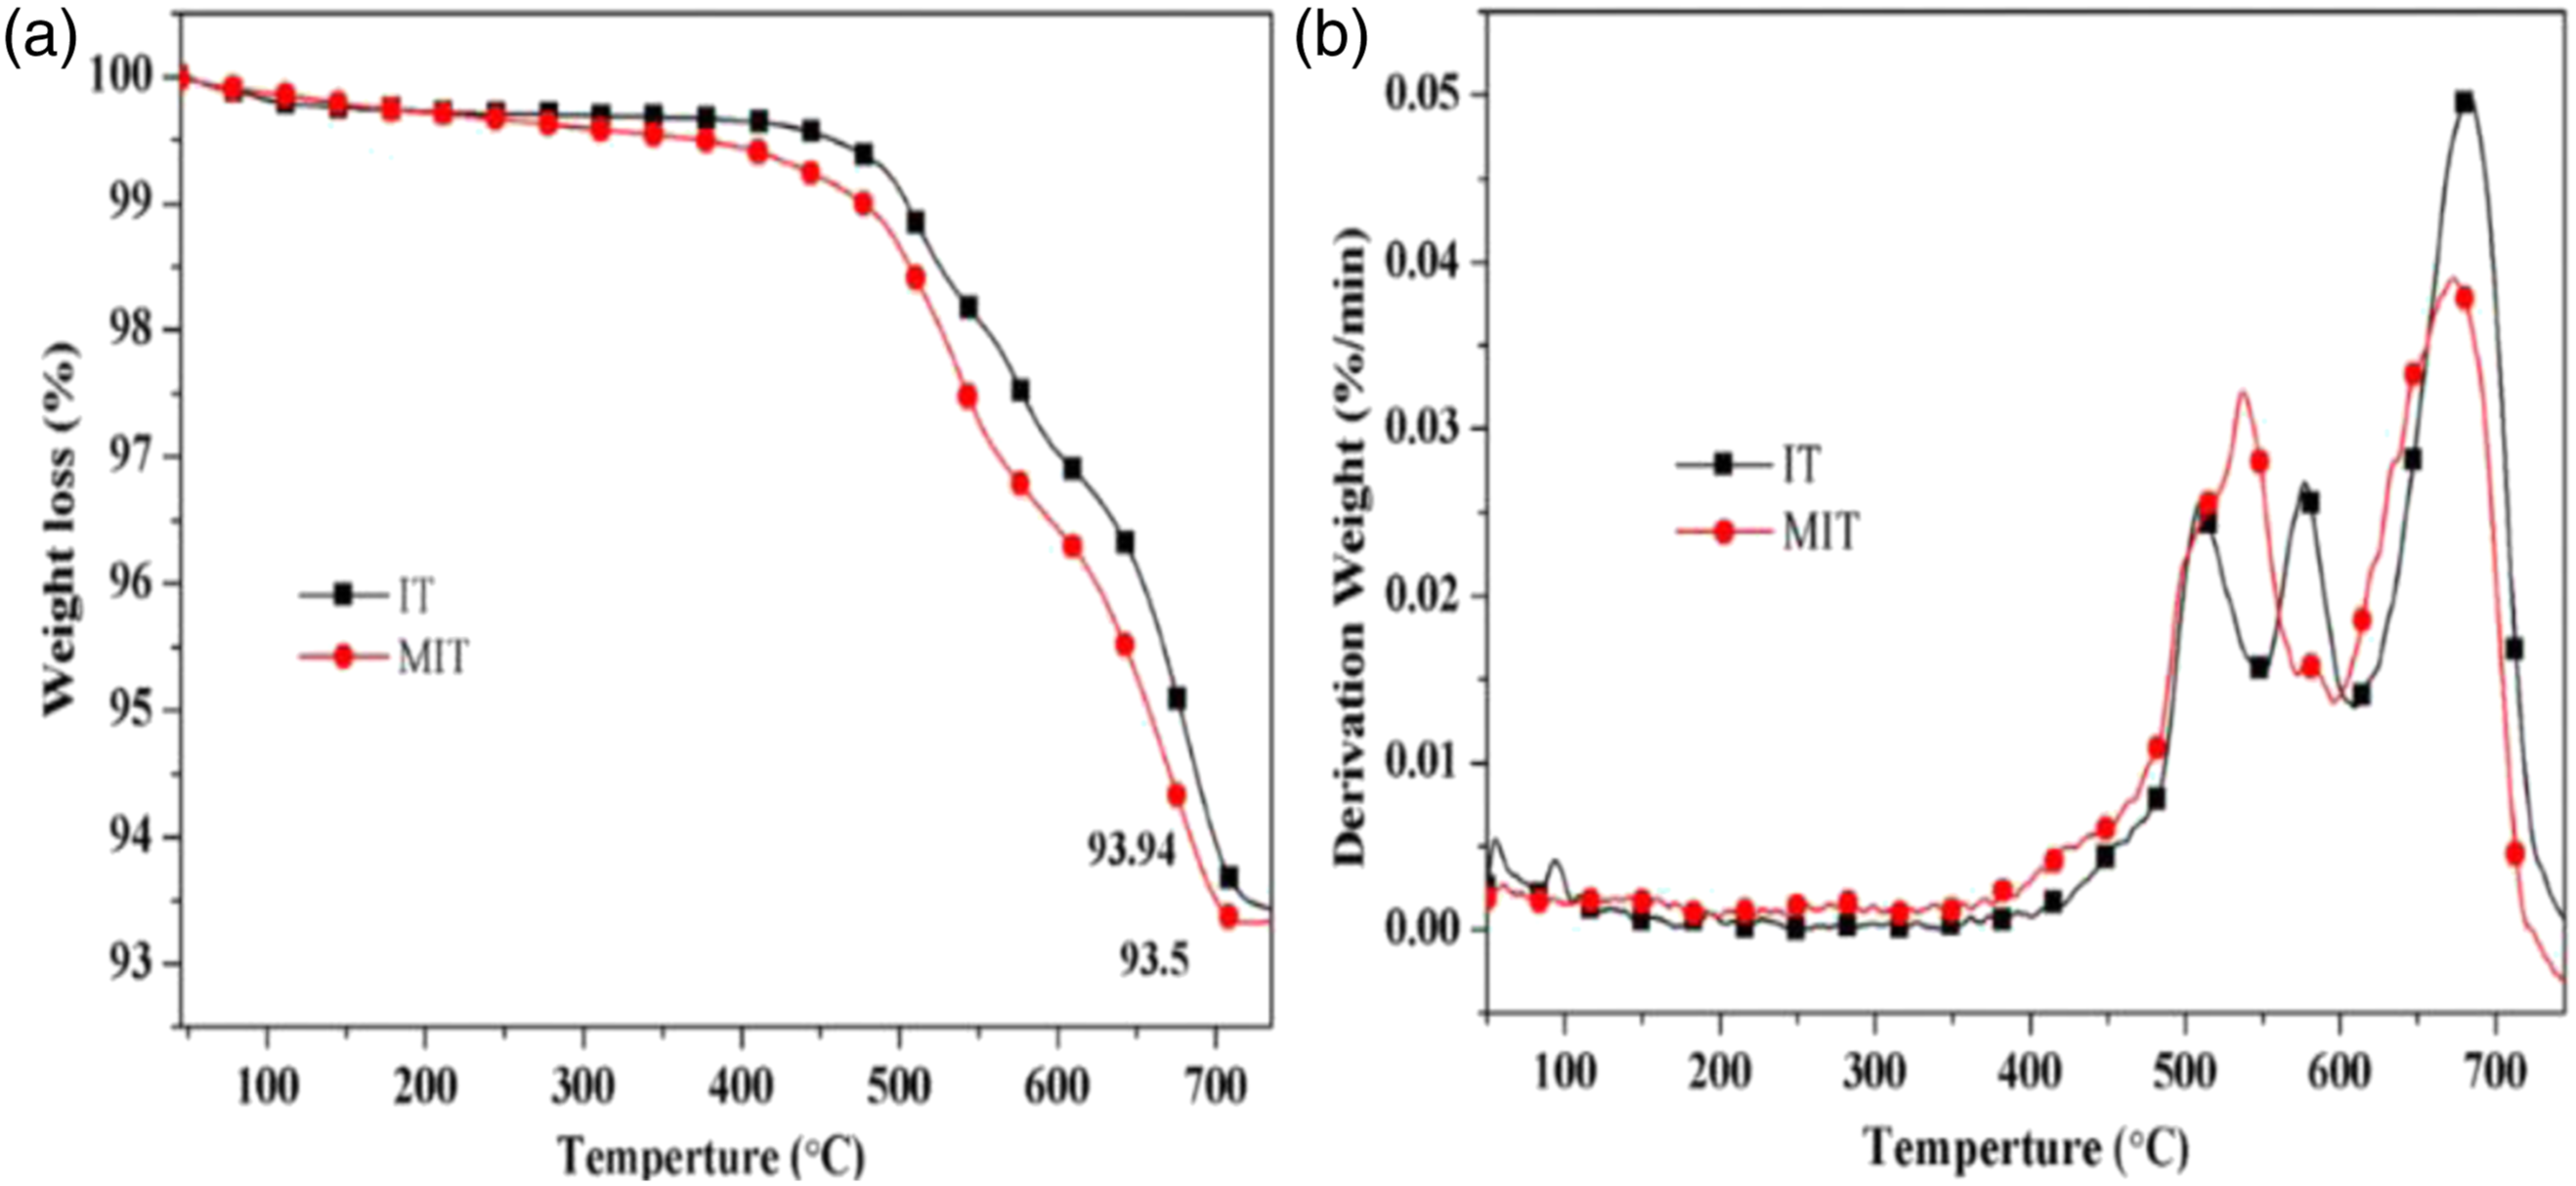
The FTIR, TG and DTG of IT and MIT showed that the silane coupling agent KH550 modified iron tailings were successfully prepared.
Thermal stability of TPU/MIT composites
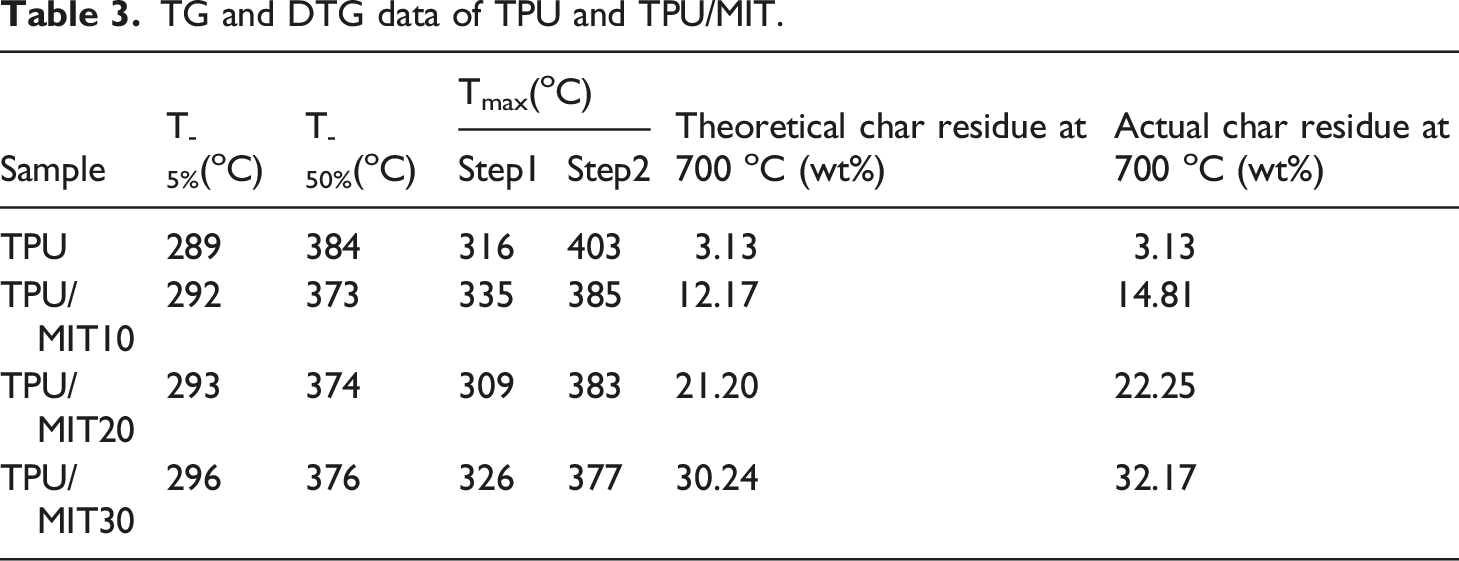
Figure 3 showed the TG and DTG curves of TPU and TPU/MIT composites, and the relevant data are shown in Table 3. It could be seen from Figure 3 that both TPU and TPU/MIT composites showed two degradation stages. The temperature range of the first degradation stage was 270–360oC, and the main chain of the hard segment of TPU was broken. The temperature range of the second degradation stage was 360–440oC, which was mainly the degradation of the soft segment composed of oligomer polyols.
27
By comparing TG curves of TPU/MIT and TPU, it could be found that the T-5% of TPU/MIT composites increase gradually after adding MIT, which may be due to the pyrolysis temperature of MIT higher than that of the polymer matrix to promote the initial degradation of the composites. However, the maximum thermal weight loss temperature (Tmax) of TPU composites gradually decreased with the increase of MIT addition, indicating that MIT could promote the pyrolysis of the TPU matrix at low temperature. Figure 3b presented that the peak value of the thermal weight loss rate of TPU/MIT composites was significantly reduced, indicating that the filler effect of MIT could inhibit the pyrolysis of the TPU matrix. From Figure 2, it could be seen that the char residue of MIT at 700°C was 93.5%, while TPU was only 3.13%. When 10 phr of MIT were added, MIT accounts for 10/100 = 10% of the total weight of TPU/MIT10 composite, and the theoretical char residue of TPU/MIT10 composite could be predicted to be 93.5%×10%+3.13%×90%=12.17%. Similarly, the theoretical char residue of TPU/MIT20 and TPU/MIT30 composites were 21.20%, 30.24%. The actual char residue of TPU/MIT composites were 14.81 wt%, 22.25 wt% and 32.17 wt%, which were greater than the theoretical char residue. The above data showed that MIT as a flame retardant added to the TPU matrix could effectively promote the carbon formation of the polyurethane matrix. The carbon layer formed at the early stage of combustion could inhibit the heat and mass transfer in the combustion process, inhibit the further high-temperature degradation of the polymer, and realize the flame retardant of the polymer material.
28
Thermogravimetric(a) and weight loss(b) curves of TPU and TPU/MIT. TG and DTG data of TPU and TPU/MIT.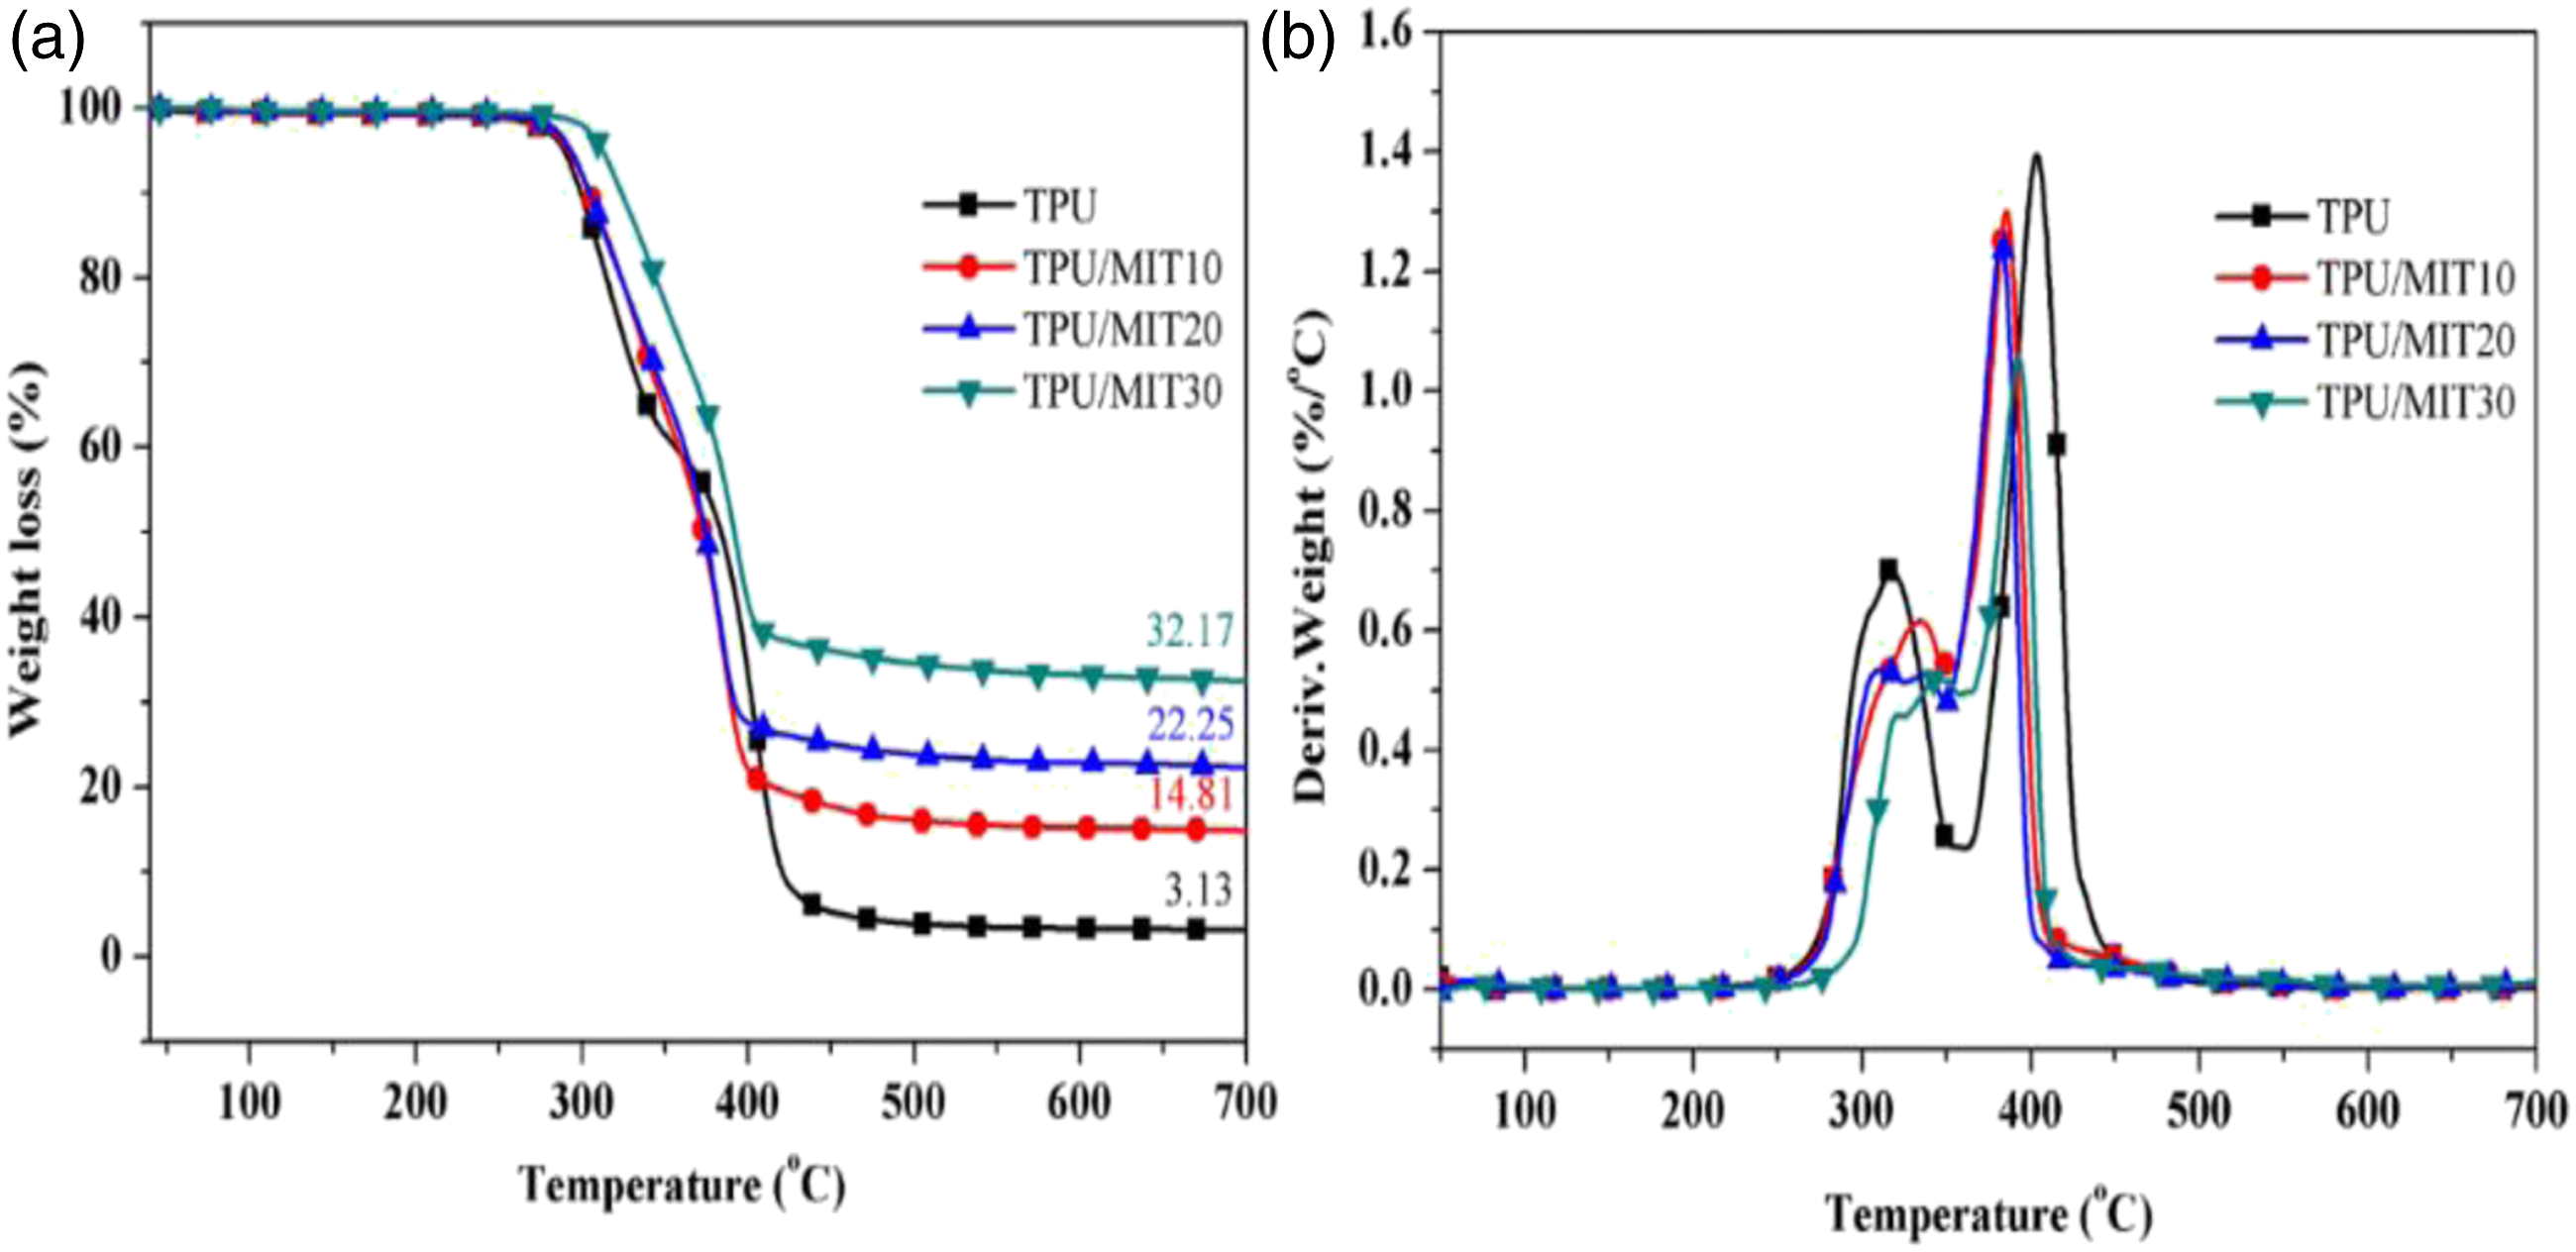
2.3 Thermal degradation kinetics
Pyrolysis kinetic analysis is an analytical method that uses physical methods such as TG, DTA and DSC to monitor the change of relevant parameters such as the macroscopic mass of an object during the reaction with reaction time or temperature, and thus reveal the reaction mechanism. 29 Based on this, this paper the pyrolysis kinetics of TPU/MIT composites was analyzed, and investigated the change of mass with temperature during the reaction, further obtained the activation energy (E) and pre-exponential factor (A) of TPU/MIT composites reaction and other related kinetic parameters through the mathematical fitting, and revealed the reaction mechanism.30–33
The basic assumption of thermoanalytical kinetics is that the Arrhenius equation for the variation of reaction rate with temperature can be used for thermoanalytical reactions. The Arrhenius equation is expressed as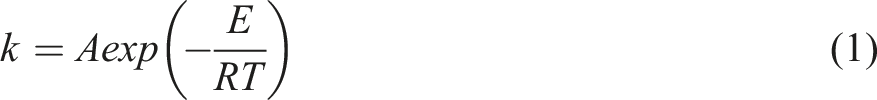
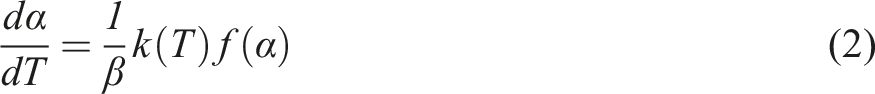
In the TG test, the function 
The kinetic equations commonly used to obtain non-homogeneous systems are obtained by combining equations (1) and (2).
2.3.1 Coats-Redfern method
The coats-Redfern method by taking logarithms on both sides of equation (4)
In equation (5), the logarithm on the right side is regarded as a constant, and the reaction order n can be determined by linear fitting. The real reaction order can be obtained under the optimal regression factor (R2), and then the activation energy (E) and pre-exponential factor (A) can be calculated.
Usually, we can use equations (6a) and (6b).

Combining equations (6a) and (6b) with equation (5) yield equations (7a) and (7b).

According to the linear relationship between
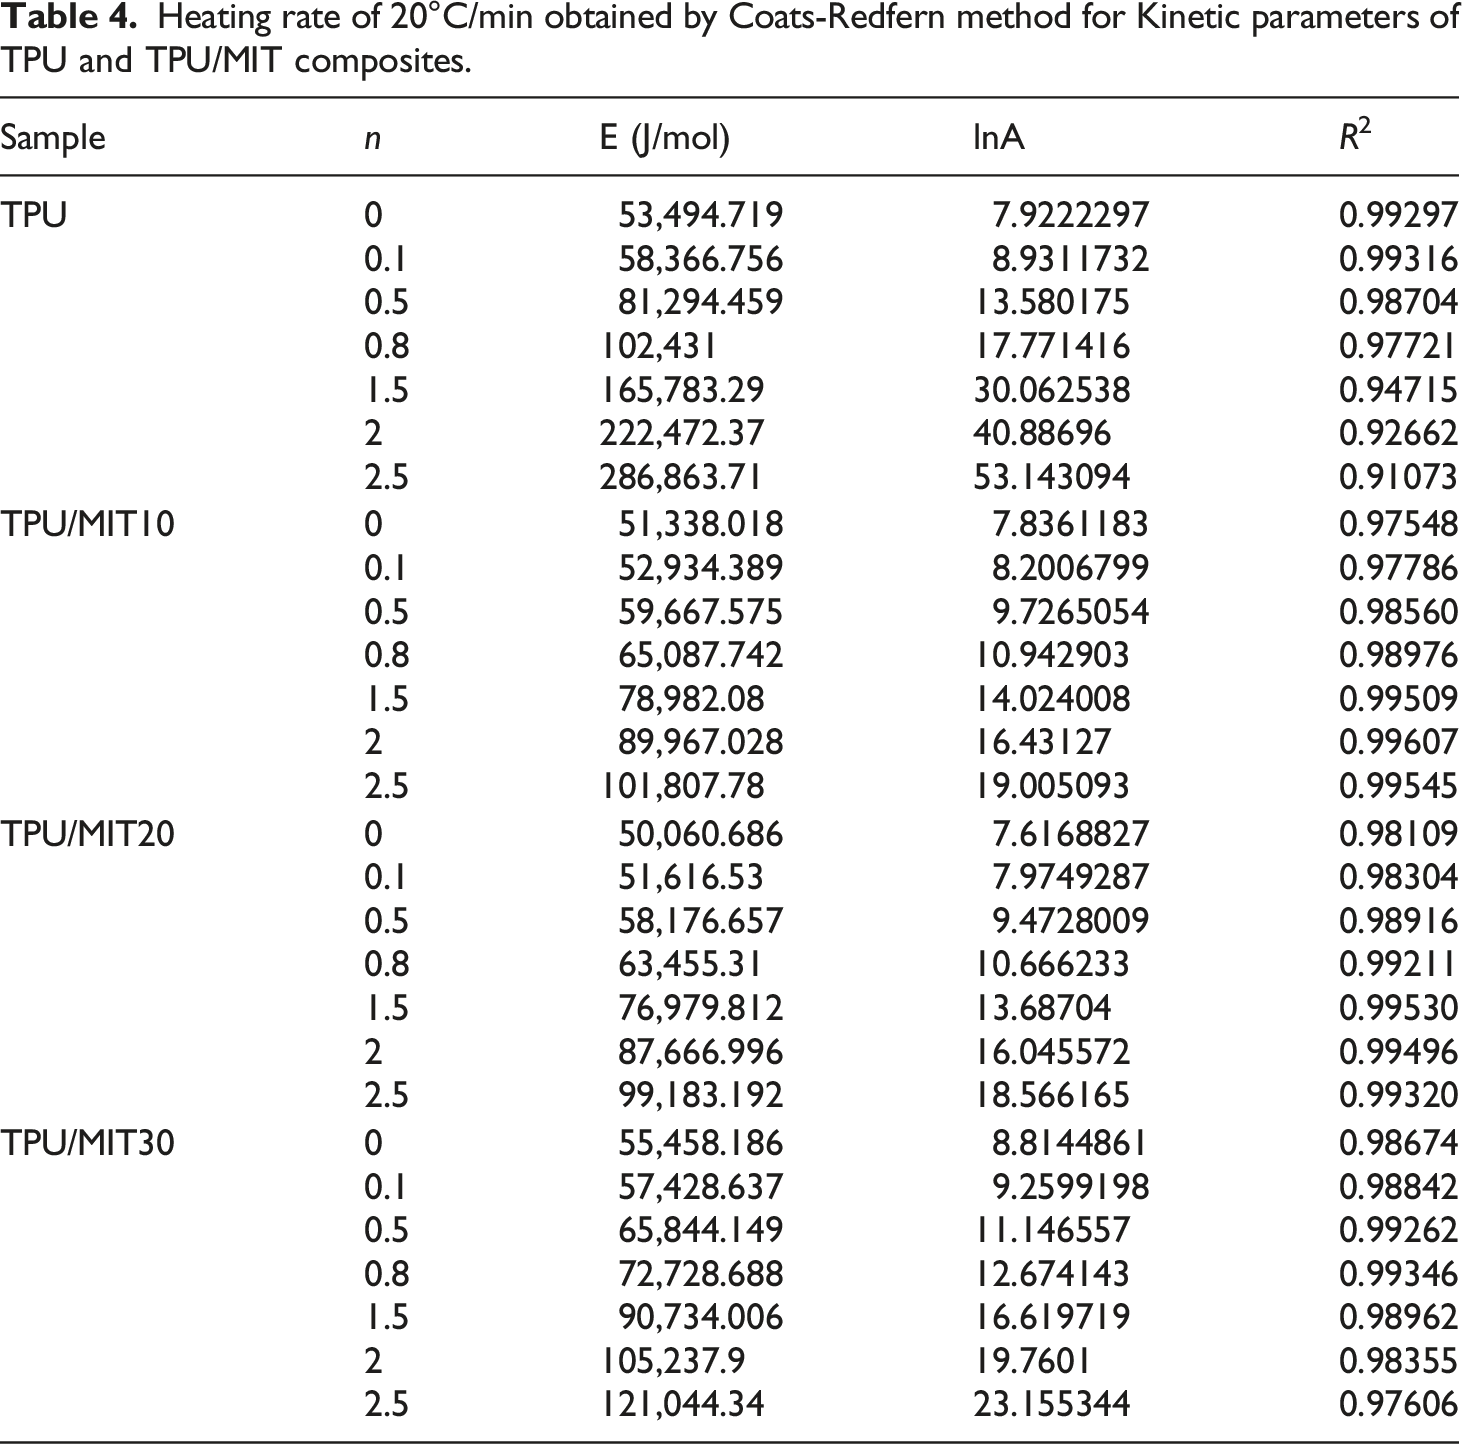
The Coats-Redfern method applies to the main degradation region of the material, and kinetic parameters such as E and A can be calculated.
17
Figure 4 showed the linear relationship between The results of Costs-Redfern kinetic analysis of TPU/MIT composites: (a)TPU; (b)TPU/MIT10; (c)TPU/MIT20; (d)TPU/MIT30. Heating rate of 20°C/min obtained by Coats-Redfern method for Kinetic parameters of TPU and TPU/MIT composites.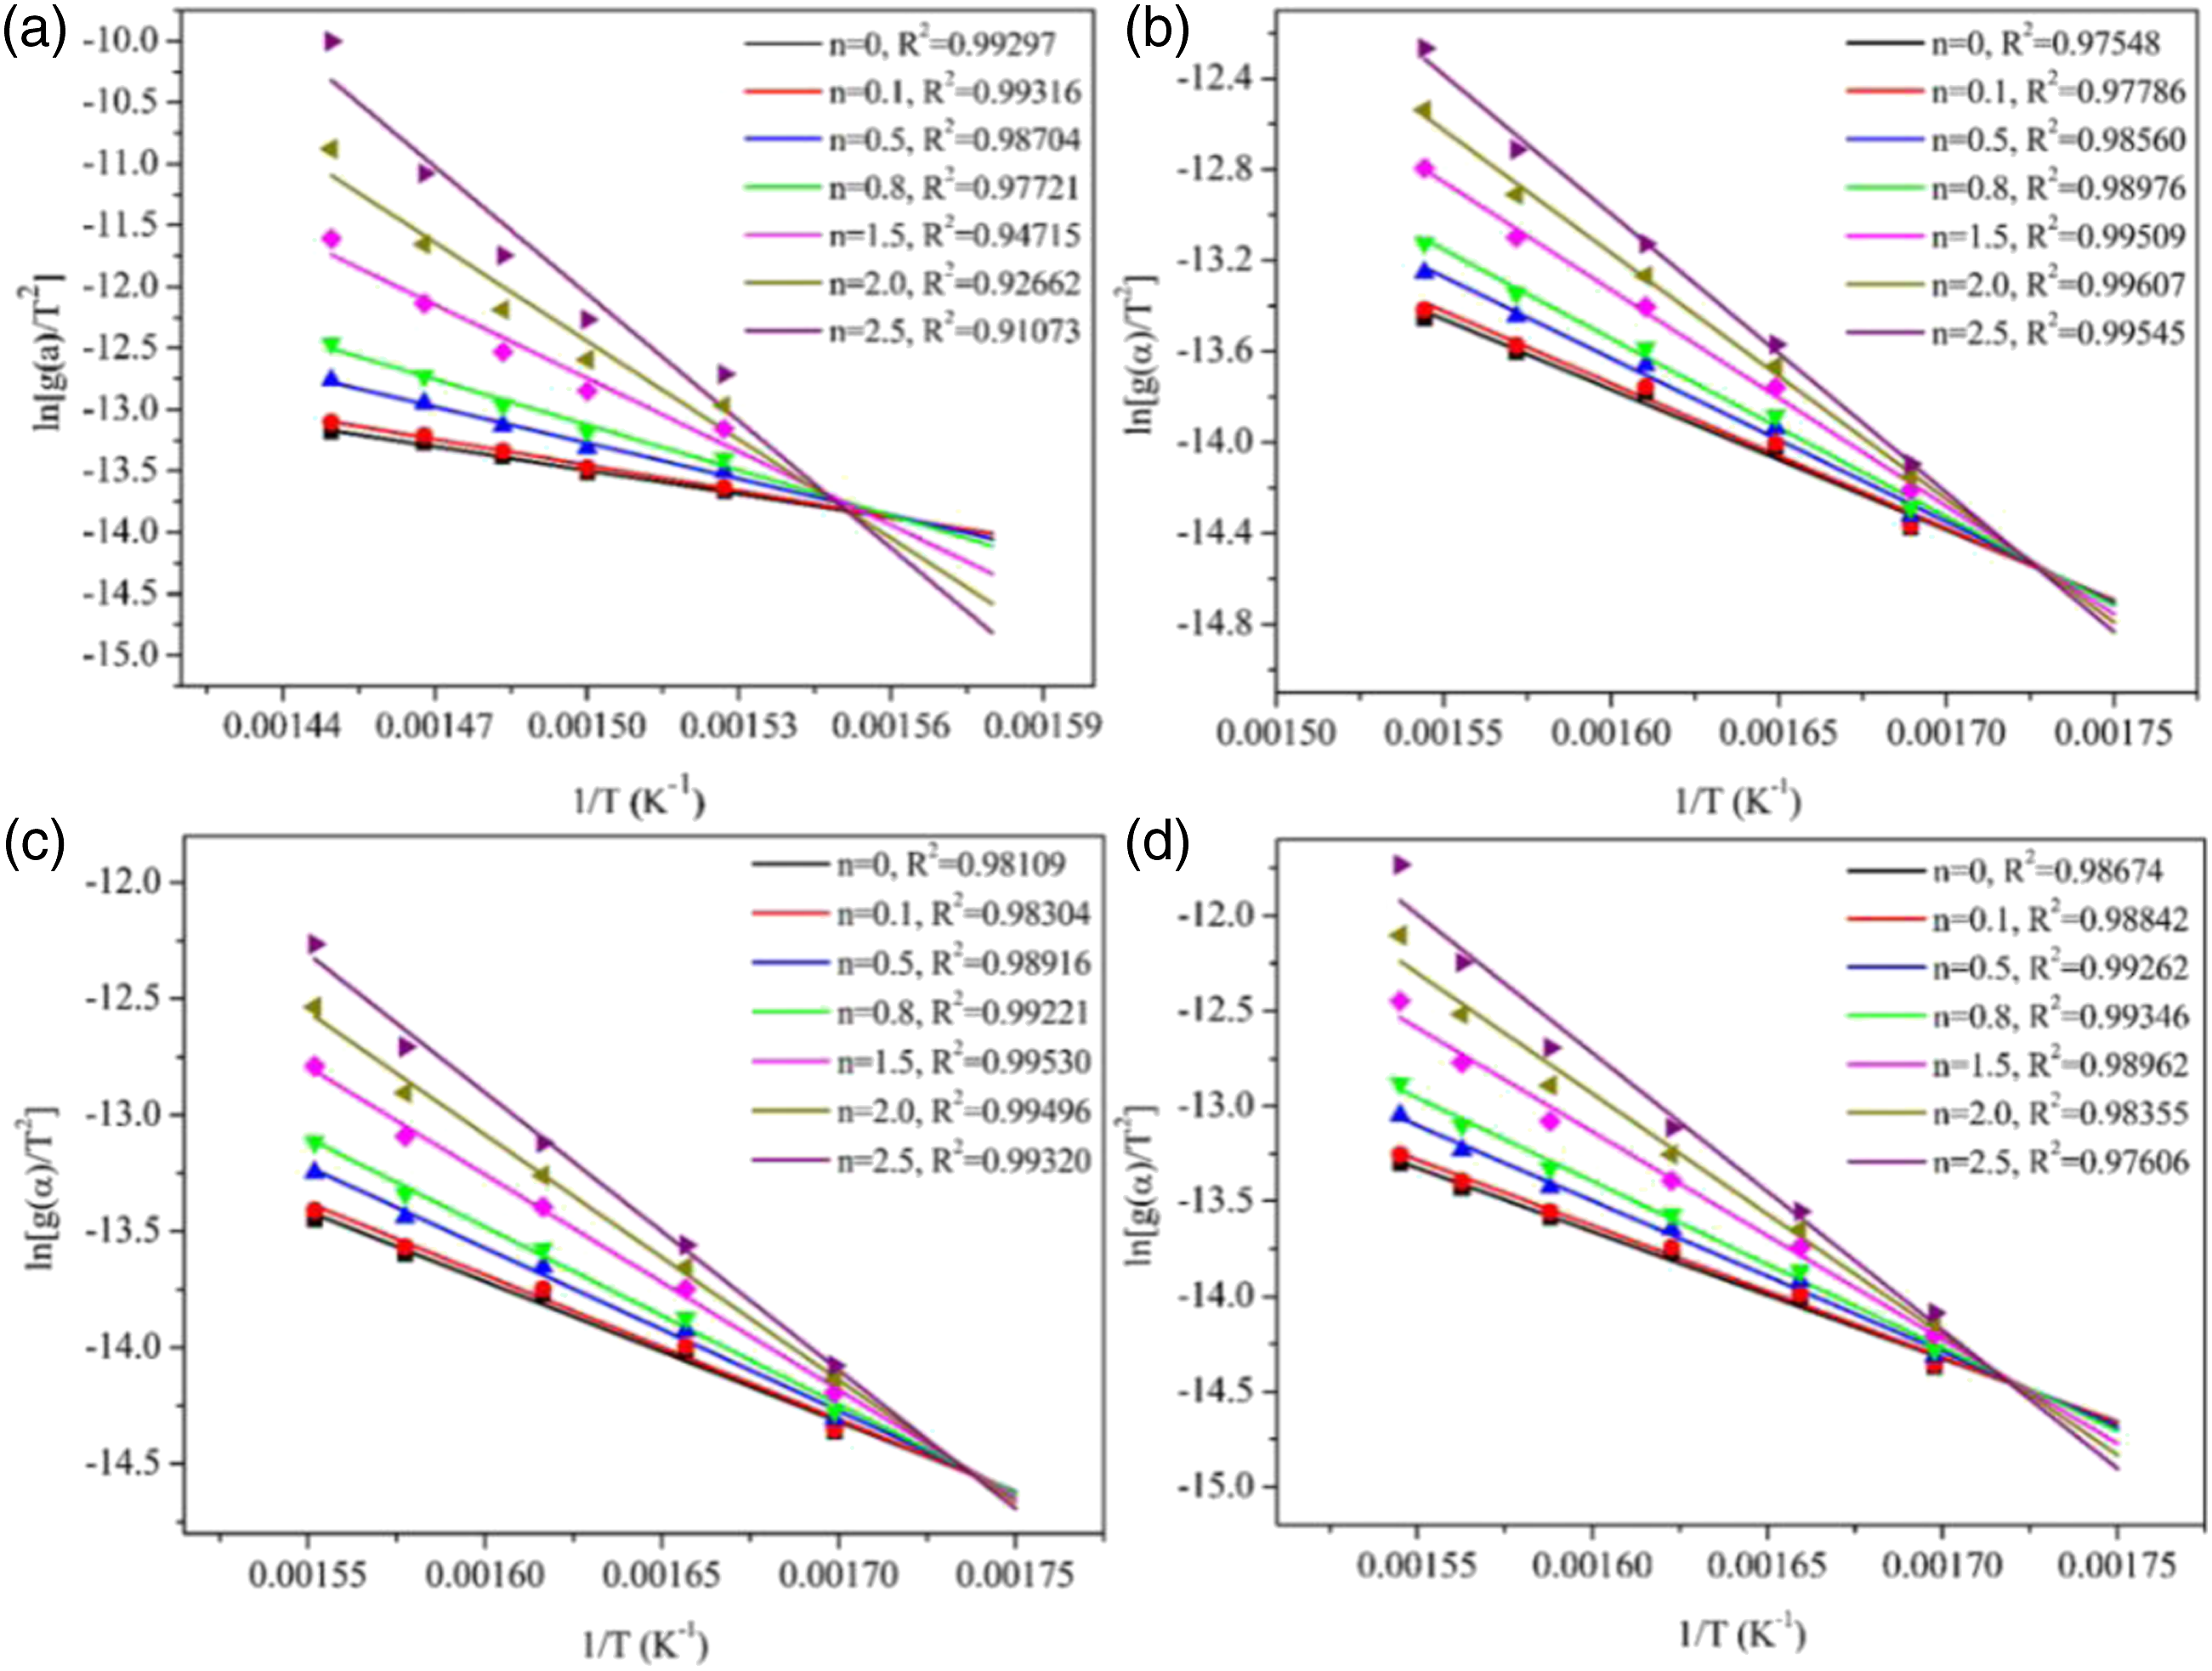
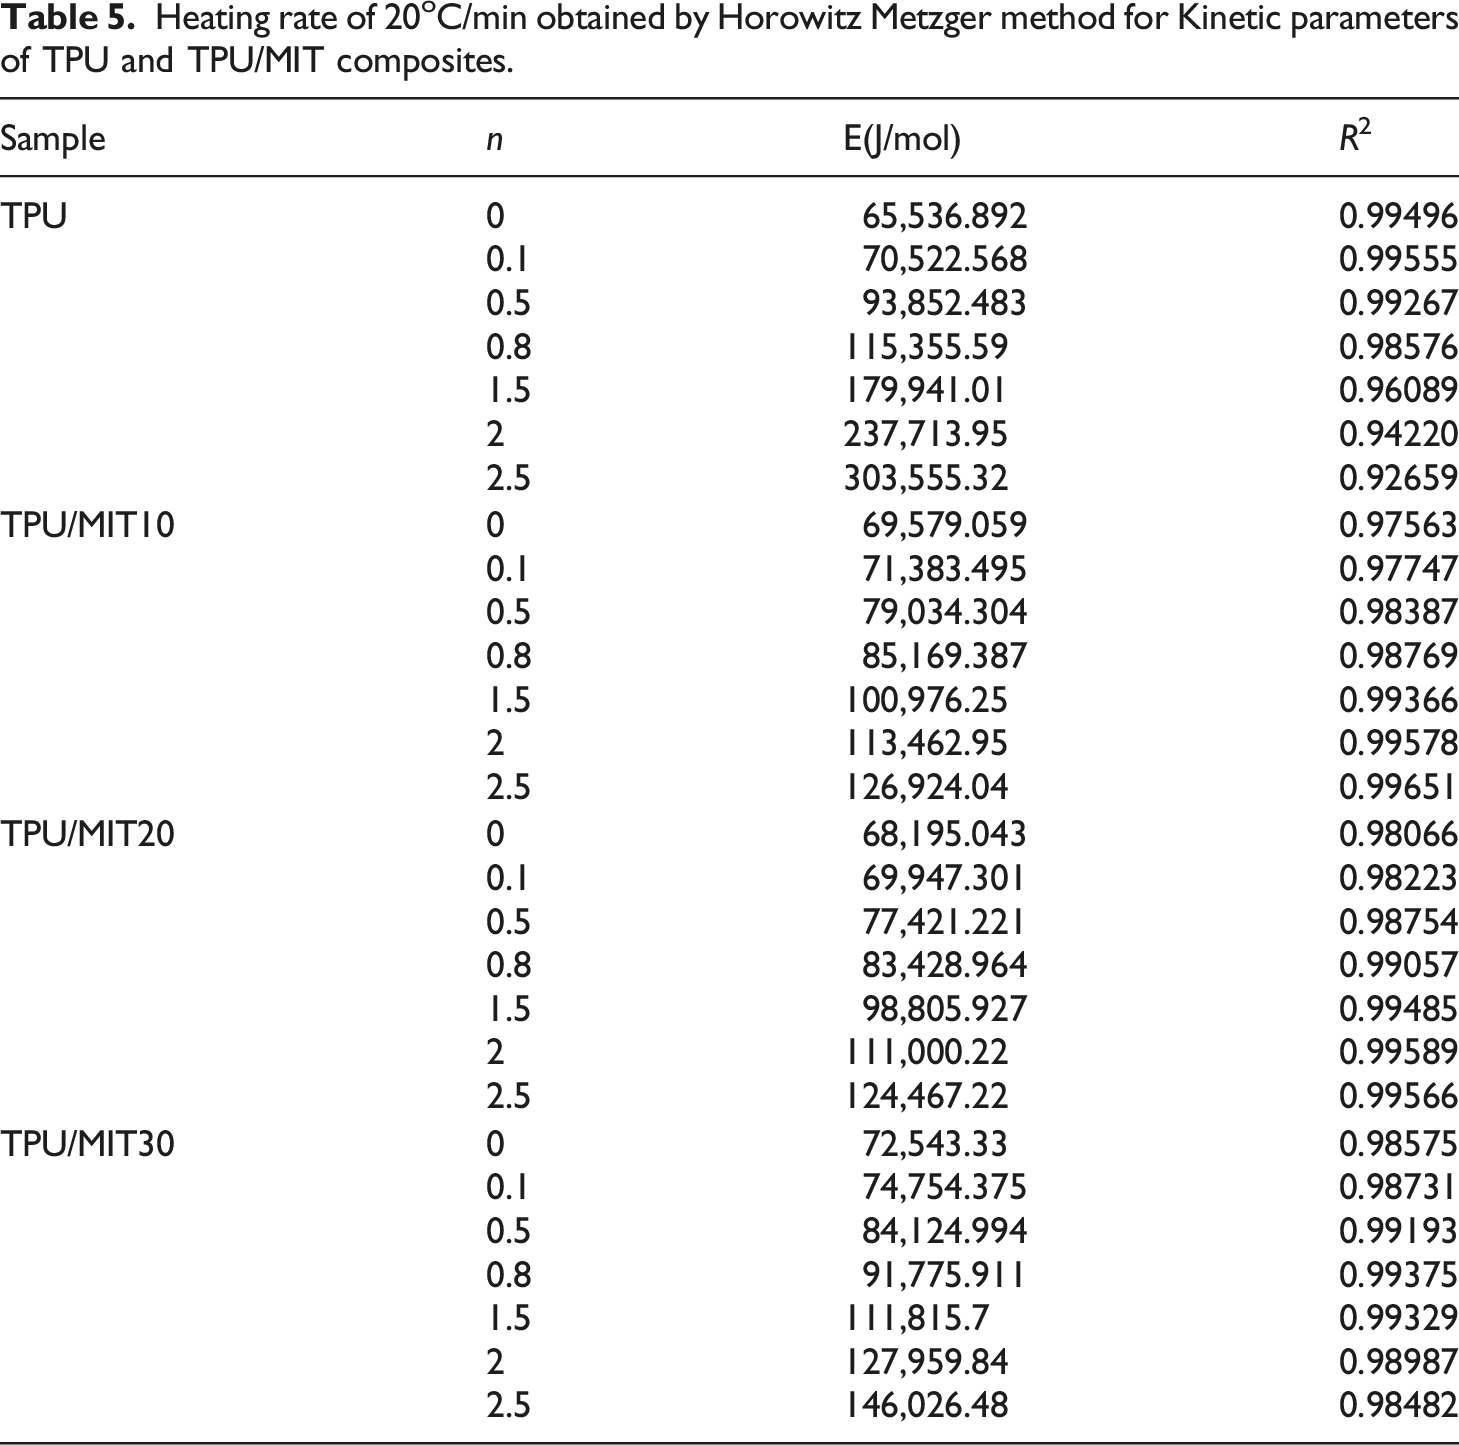
Horowitz Metzger method
Horowitz-Metzger method provides another method to obtain activation energy by introducing characteristic temperature Ts and a parameter.
34

If the reaction order n=1, then T
s
is defined as the temperature corresponding to 
If n ≠ 1, T
s
is defined as the temperature corresponding to the maximum mass loss rate (Tmax), then there is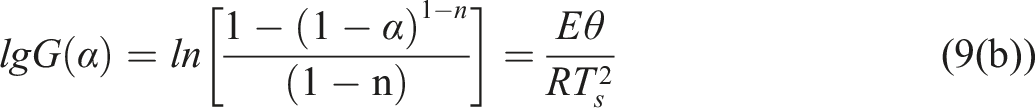
Figure 5 showed the curves of ln[g(α)] and θ of TPU and TPU/MIT composites corresponding to different reaction order n. According to the formula 9a, the slope was The Horowitz-Metzger dynamic analysis results of TPU/MIT composites: (a)TPU; (b)TPU/MIT10; (c)TPU/MIT20; (d)TPU/MIT30. Heating rate of 20oC/min obtained by Horowitz Metzger method for Kinetic parameters of TPU and TPU/MIT composites.
Combustion performance of TPU/MIT composites
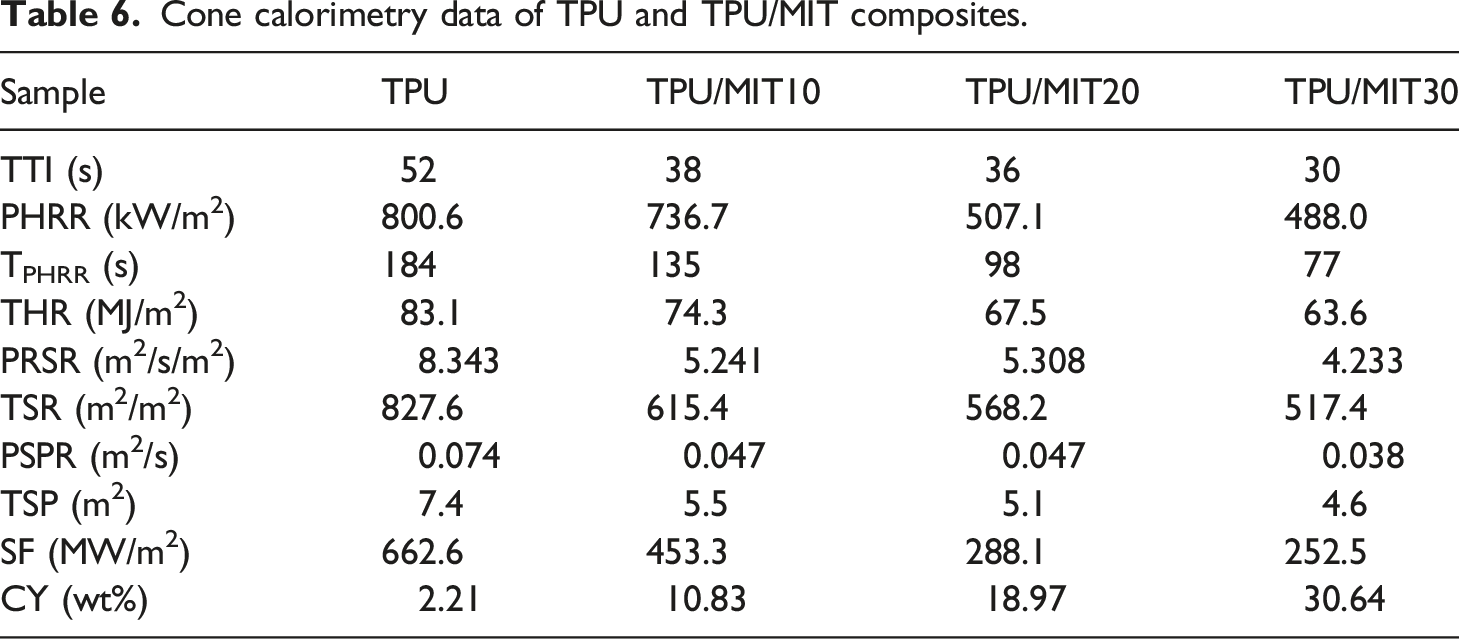
Cone calorimetry(CCT) could effectively detect the combustion behavior of materials under real combustion conditions.35,36 Figure 6 showed the HRR and THR curves of TPU and TPU/MIT composites, and the relevant data were shown in Table 6. It could be seen from Figure 6 that the HRR of TPU reached the peak value of 800.6 kW/m2 at 184 s after ignition, and decreased rapidly after reaching the peak value, the final THR was 83.1 MJ/m2. After the addition of MIT, the PHRR value decreased significantly, and with the increase of MIT content, the PHRR of the composite decreased gradually. When the MIT content reached 30 wt%, the PHRR of the TPU/MIT30 composite decreased to 488.0 kW/m2, 39% lower than that of the pure TPU, and the THR was 63.6 MJ/m2, 23.5% lower than that of the pure TPU. It indicated that MIT could effectively reduce the HRR and THR of TPU composites in the combustion process, and reduced the fire thermal hazard. HRR(a) and THR(b) curves of TPU and TPU/MIT composites. Cone calorimetry data of TPU and TPU/MIT composites.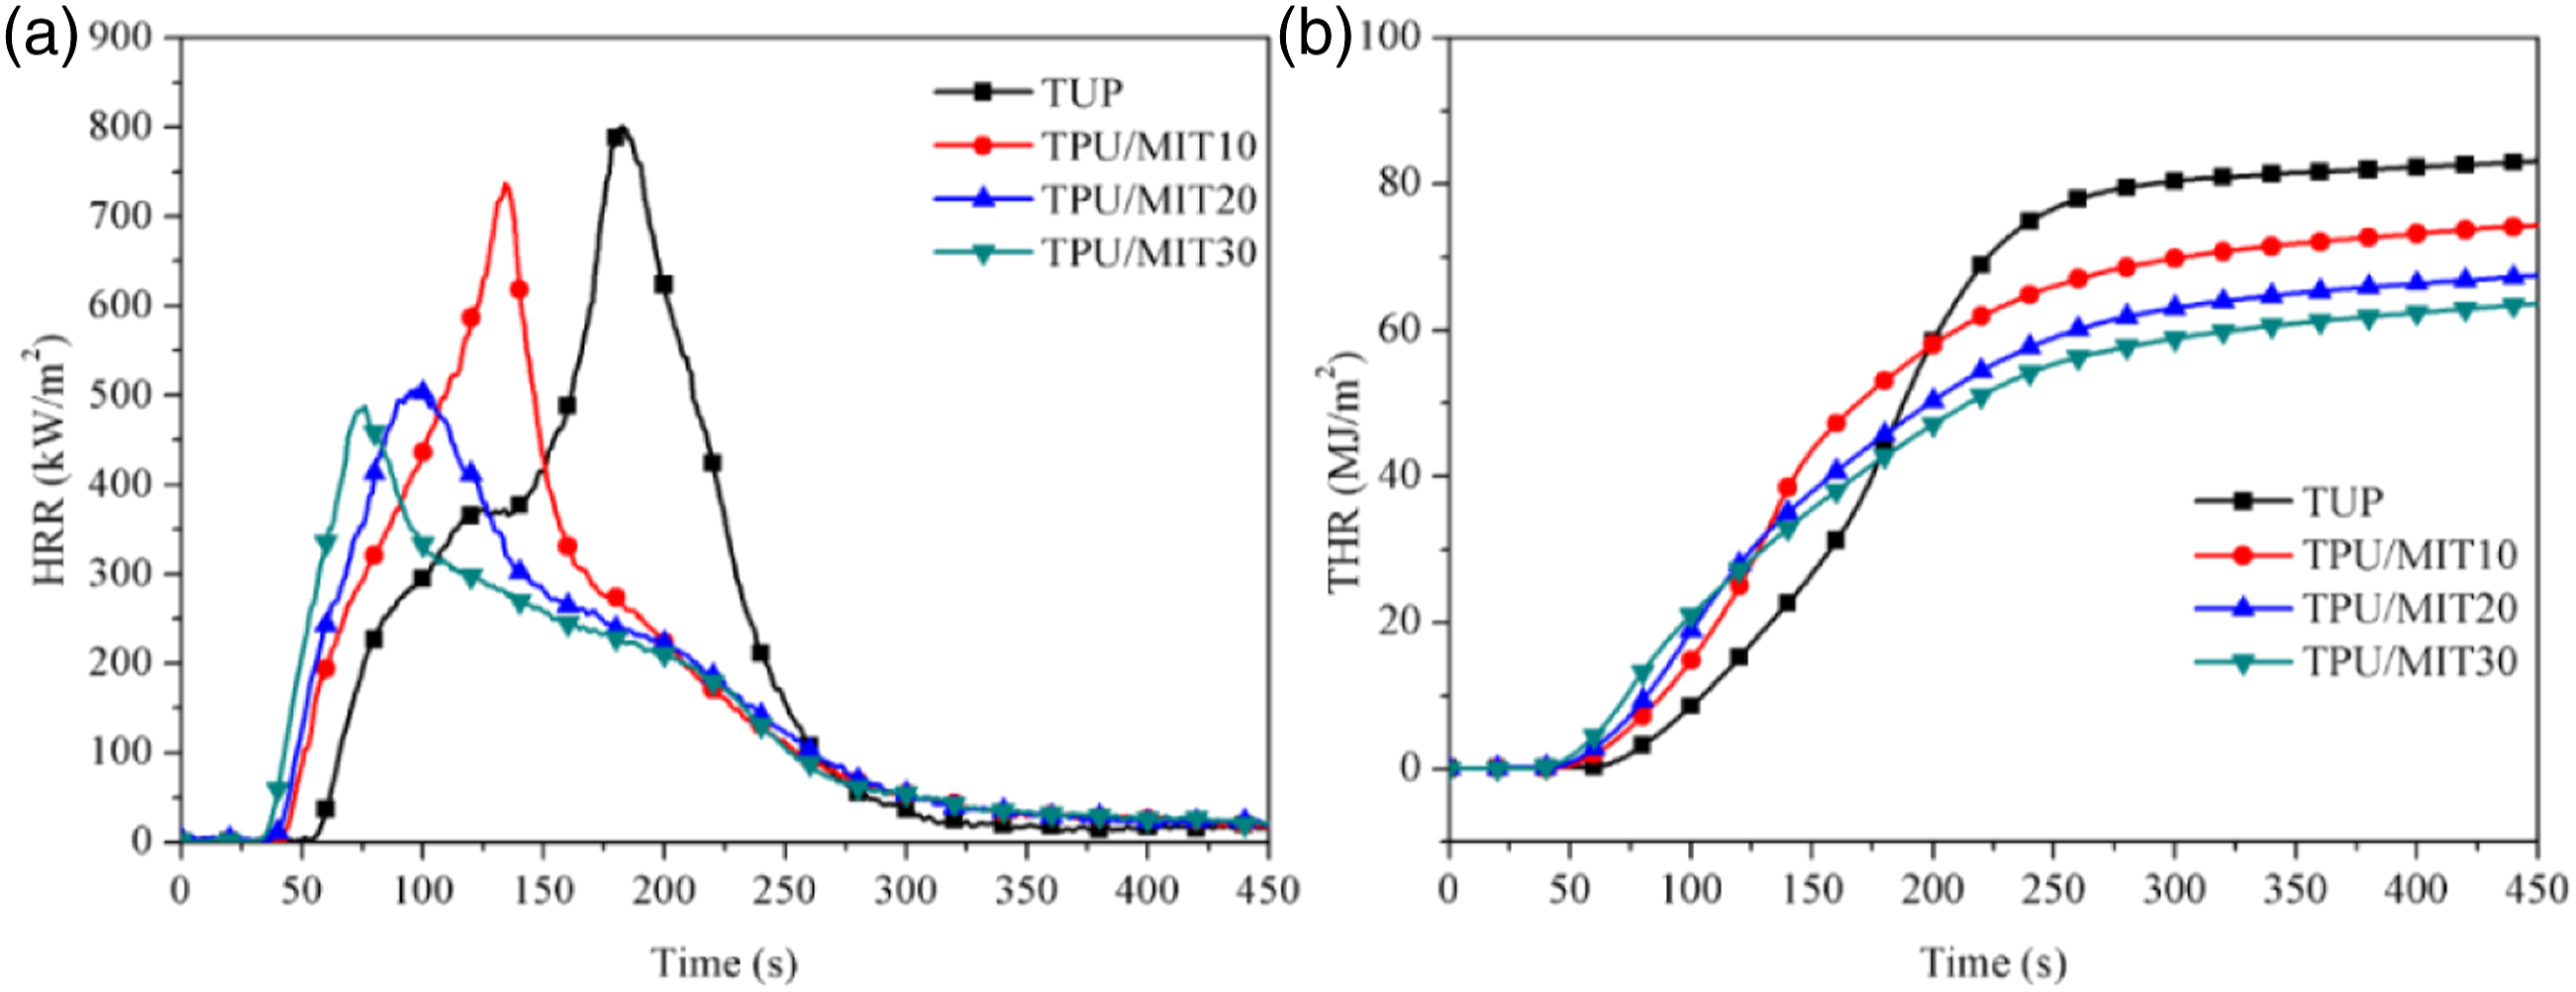
The smoke was another key factor in fire risk.
37
Figure 7 showed the time-dependent curves of Rate of smoke release (RSR), total smoke release (TSR), smoke production rate (SPR), total smoke production(TSP), carbon residue (Mass) and smoke factor (SF) of TPU composites.38,39 It could be seen from Figure 7(a) and (c) that the peak smoke exhaust rate (PRSR) and Peak smoke production rate (PSPR) of TPU were 8.343 m2/s/m2 and 0.074 m2/s, respectively. After the addition of 30 wt% MIT, the PRSR and PSPR of TPU/MIT30 composite were reduced to 4.233 m2/s/m2 and 0.038 m2/s/m2, respectively, with a decrease of 50.4% and 48.6%, respectively. It could be seen from Figure 7(b) and (d) that the TSR and TSP of the TPU were 827.6 m2/m2 and 7.4 m2 respectively when it was completely burned. After adding MIT, the TSR and TSP of the TPU/MIT30 composite decreased to 517.4 m2/m2 and 4.6 m2, respectively, a decrease of 37.5% and 37.8%. The above data showed that MIT could effectively inhibit the smoke generation in the combustion process of TPU composites and improve the fire safety of TPU composites. SPR(a), TSP(b), Mass(c) and SF(d) curves of TPU and TPU/MIT composites.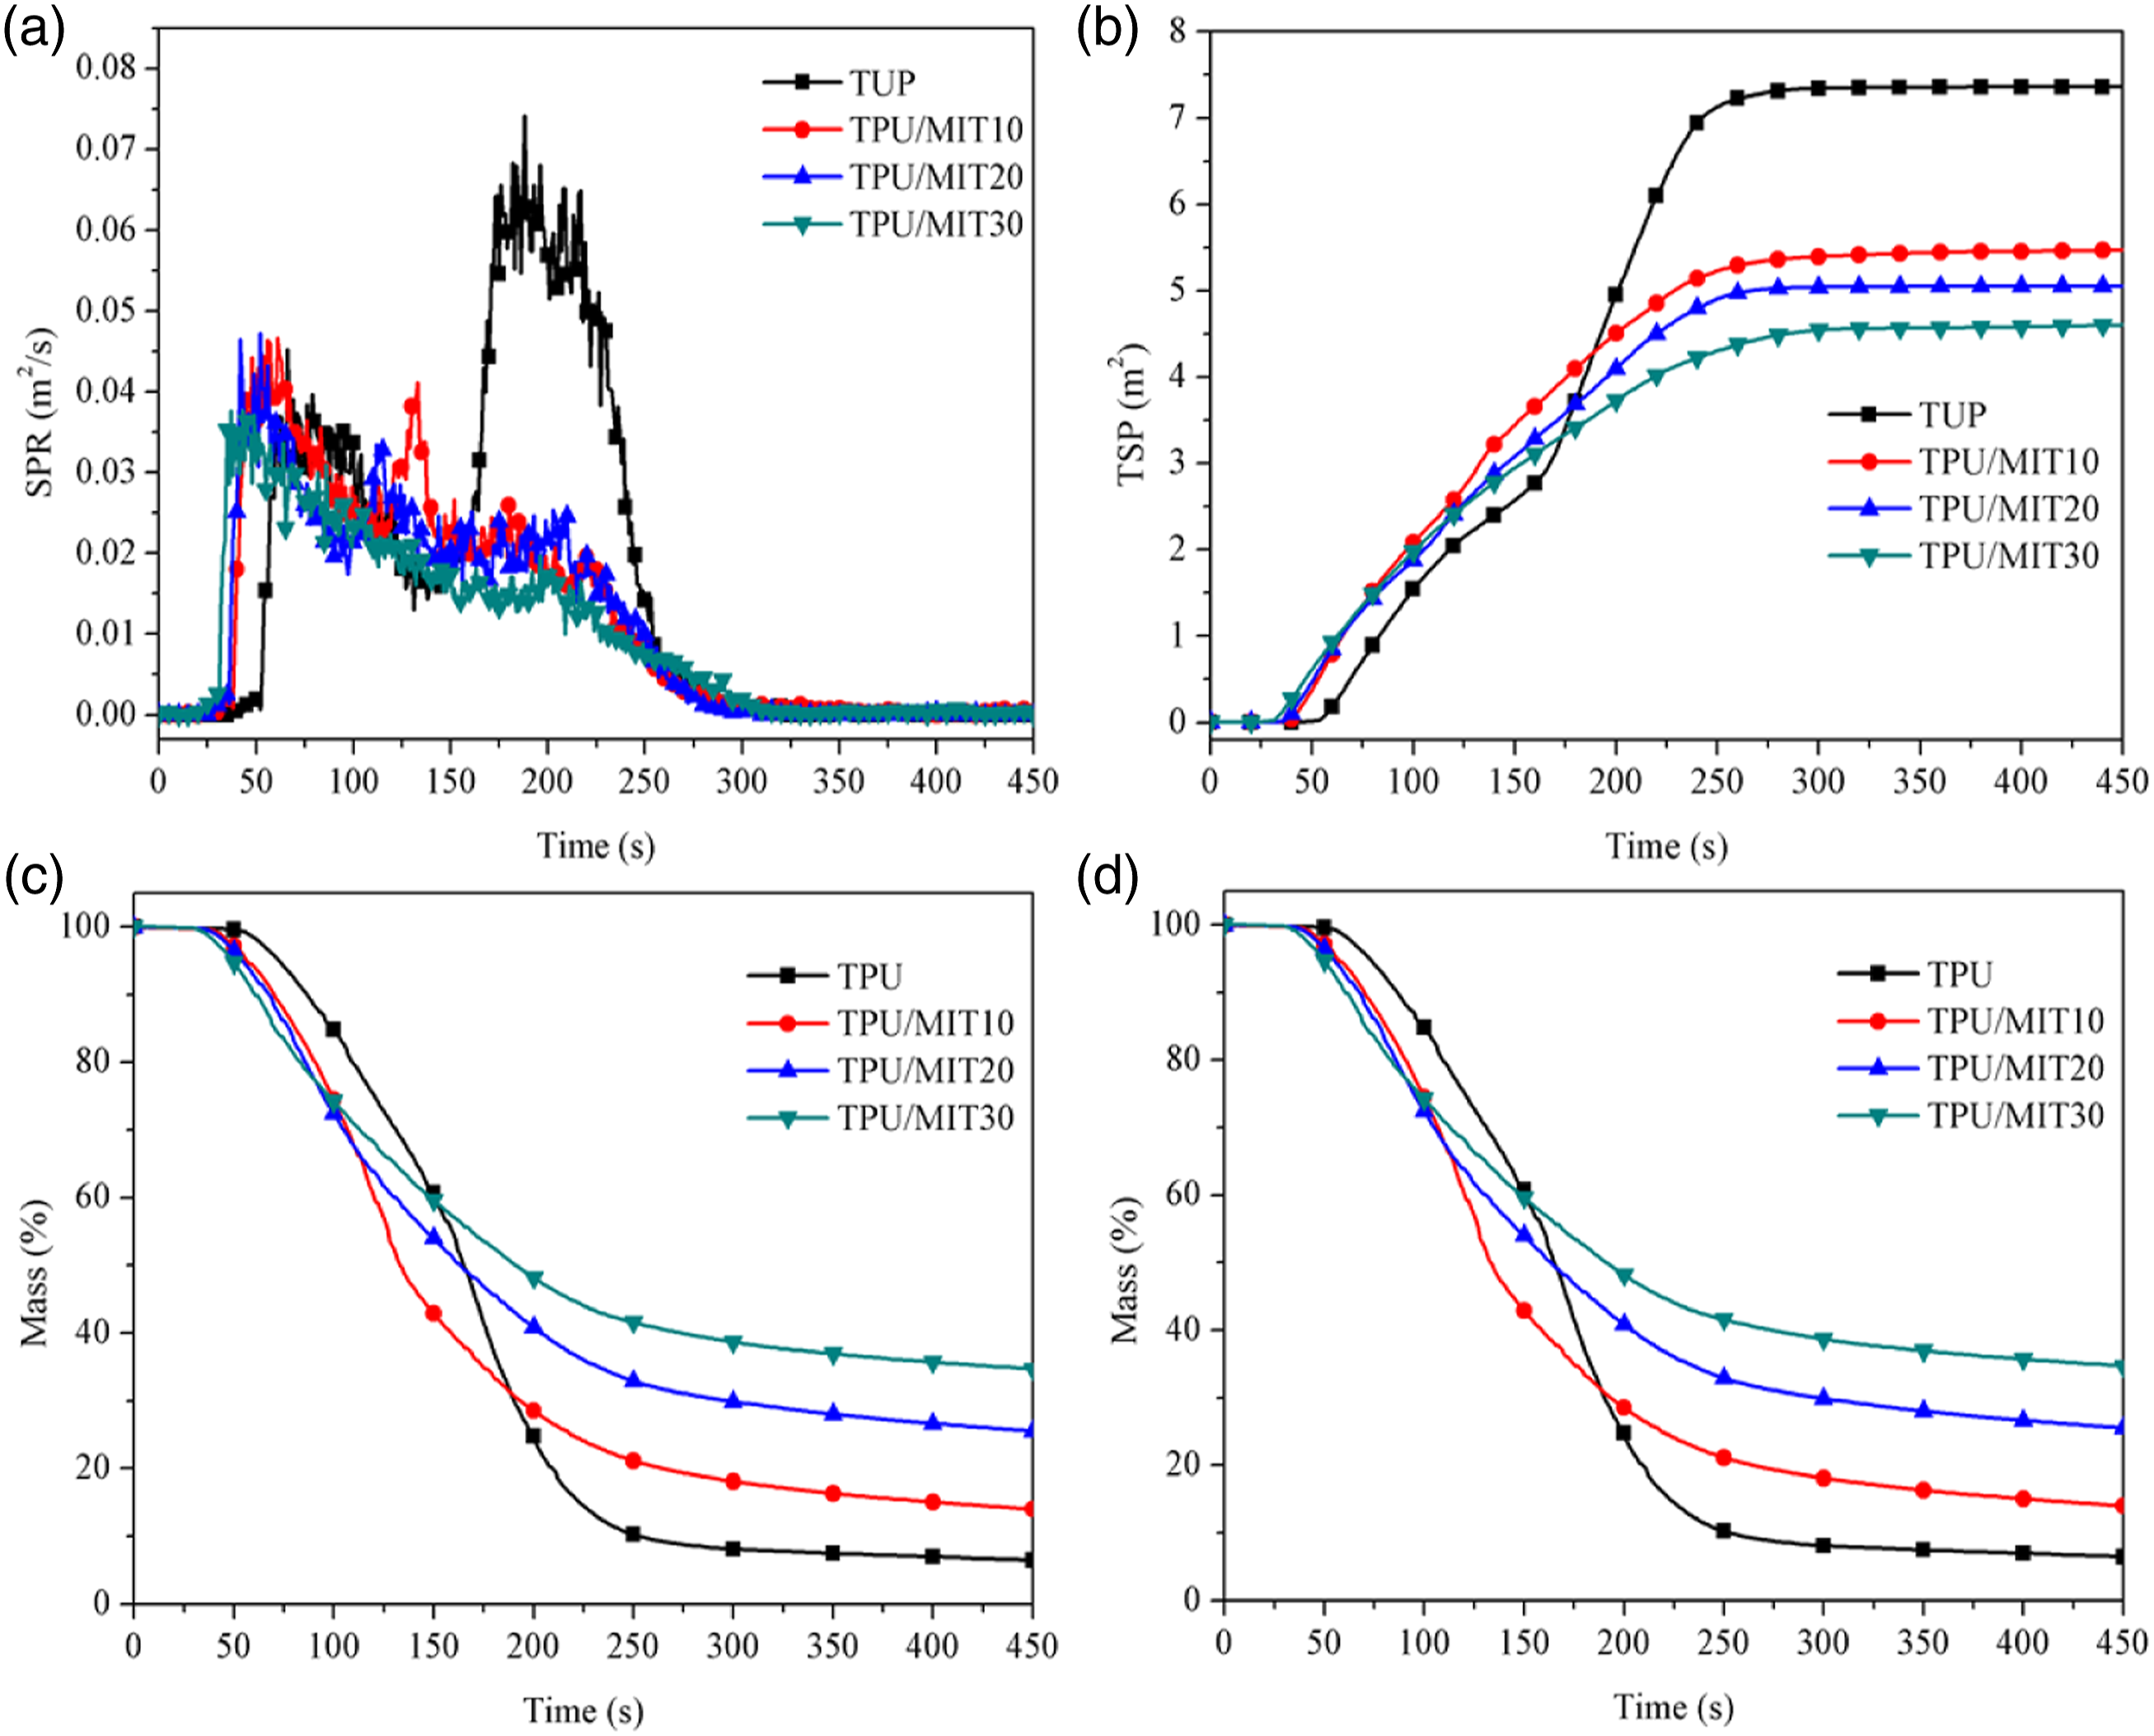
It could be seen from Figure 7(e) that the mass loss rate of TPU/MIT composites was higher than that of pure TPU in the first 200 s of the reaction. With the increase of MIT content, the time of TPU/MIT composites reaching the same mass loss as TPU was earlier. As could be seen from Figure 8, pure TPU formed a small amount of char residue after combustion; while the TPU/MIT10 composite with 10 wt% MIT added has significantly more char residue after combustion, but the structure was looser and partly collapsed. As the amount of MIT addition continued to increase, the char layer structure became more complete. The above data indicated that the addition of MIT could promote the decomposition of the TPU matrix at lower temperatures, but as the reaction continued, MIT could promote the formation of char in the matrix, reduce its decomposition rate and improve the stability of the char layer, and the above results were highly consistent with the TG test. After combustion, the char residue of pure TPU was 6.4% at 450s, while the char residue of TPU/MIT10, TPU/MIT20 and TPU/MIT30 were 13.9%, 25.5% and 34.7%, respectively. Smoke factor (SF) is a comprehensive parameter obtained by the product of PHRR and TSR, which can characterize the heat release and smoke release of composites. The greater the SF value, the higher the fire risk.
40
It could be seen from Figure 7(f) that MIT could significantly reduce the SF of the composites, indicating that MIT could promote the formation of a dense carbon layer on the polymer matrix and effectively inhibit the heat transfer and smoke release during combustion. Photographs of char residue after cone calorimetry test of TPU and TPU/MIT composites: (a)TPU; (b)TPU/MIT10; (c)TPU/MIT20; (d)TPU/MIT30.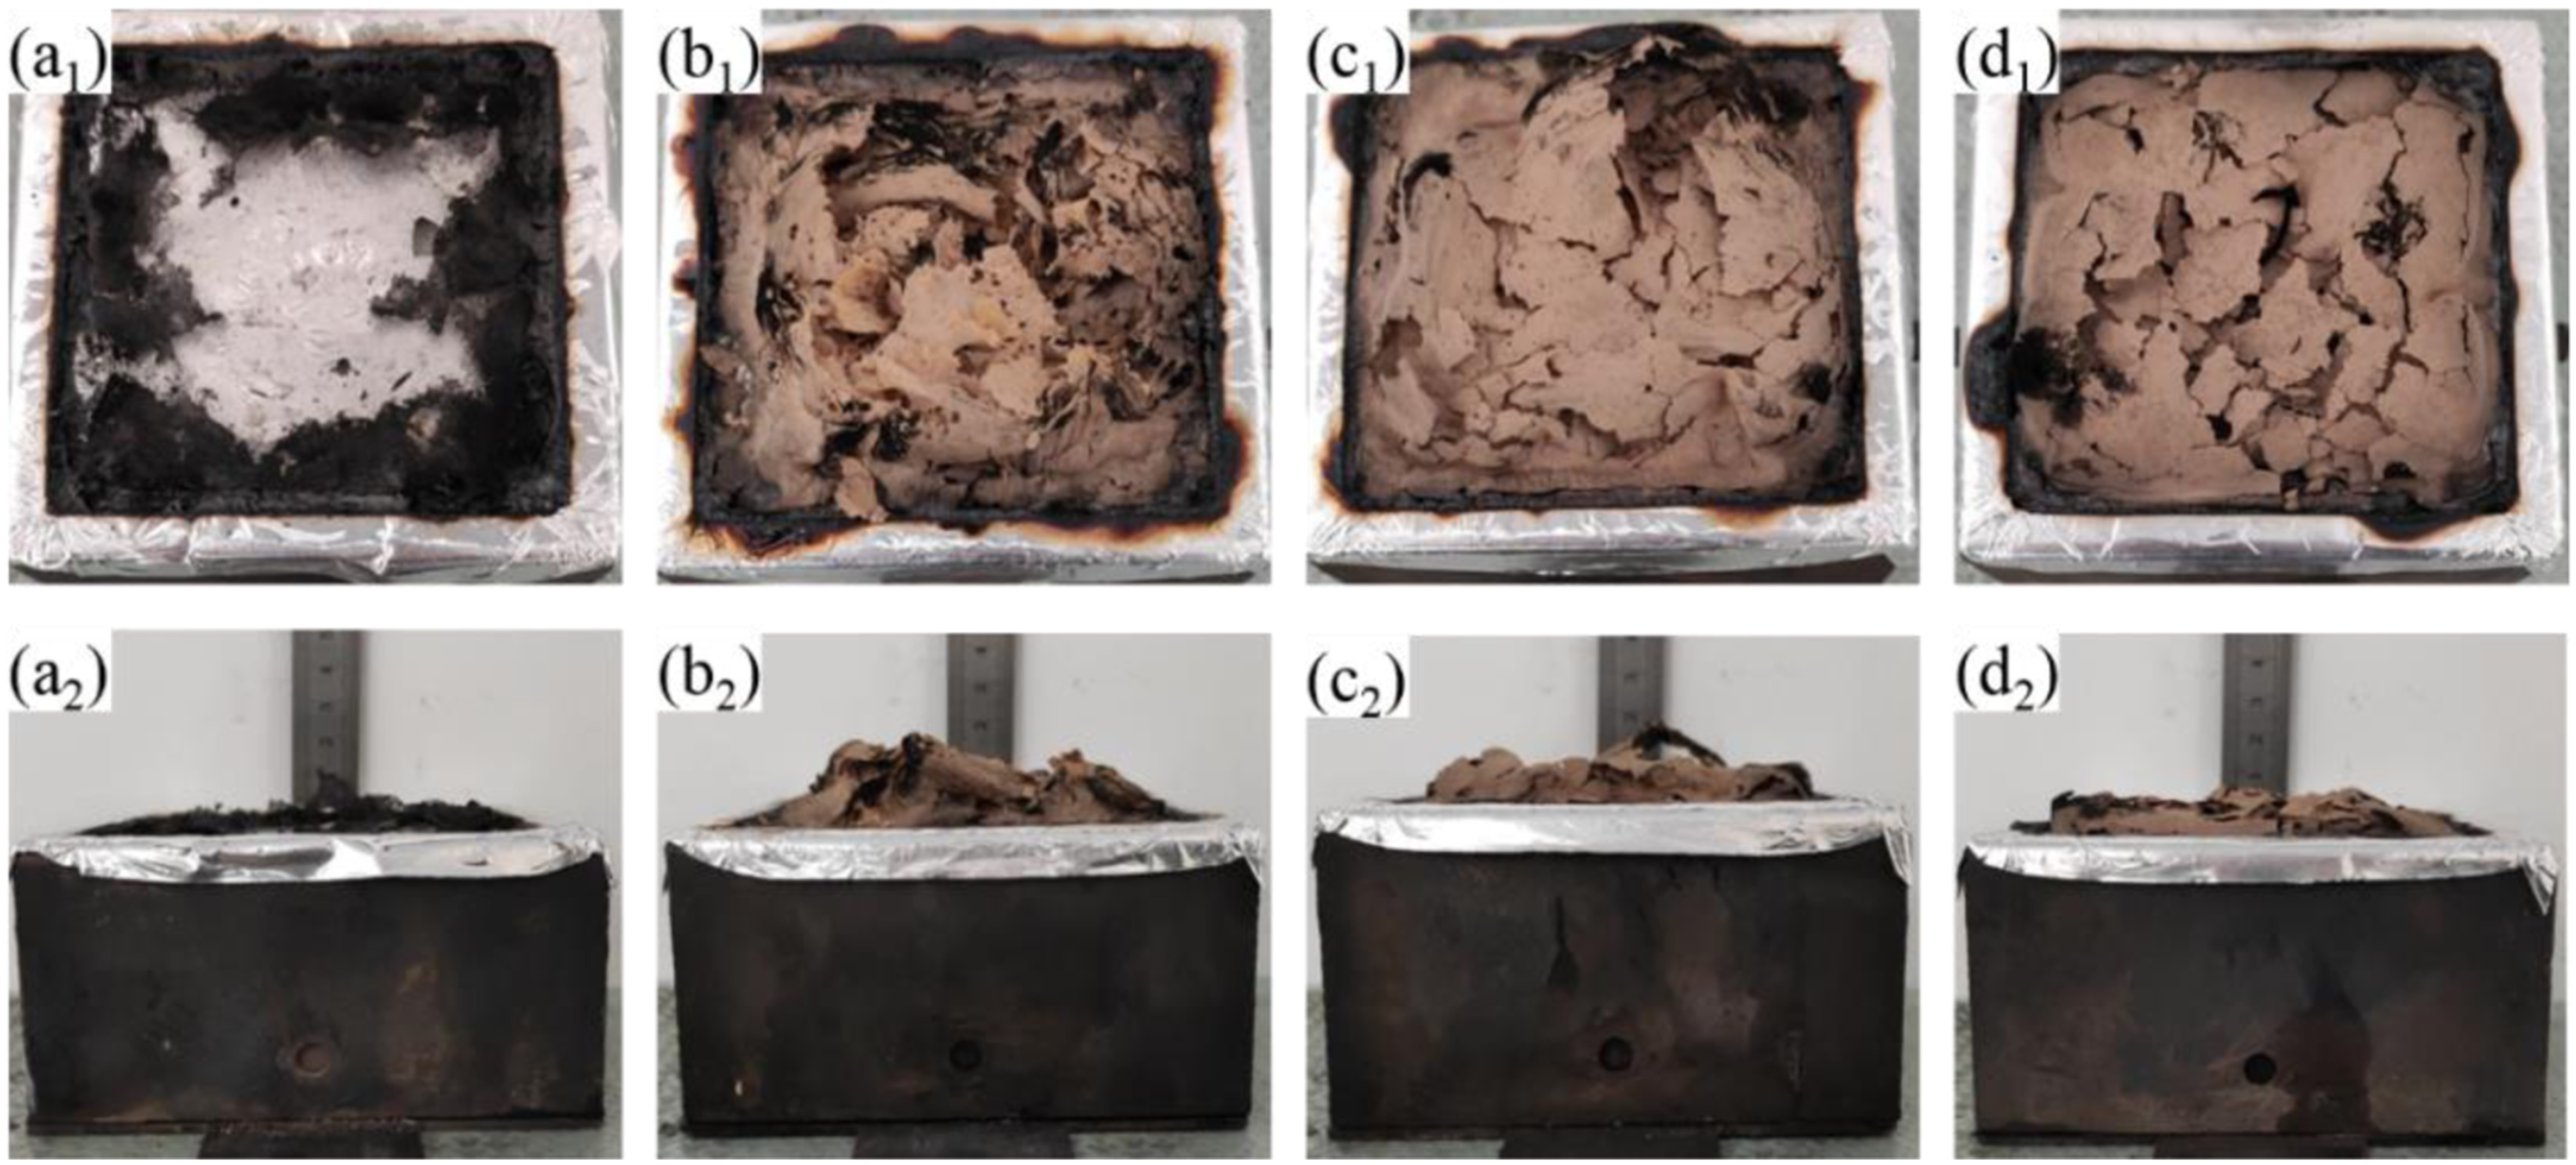
Gas-phase product analysis of TPU/MIT composites
Thermogravimetric-infrared(TG-FTIR) was used to analyze the release of gaseous products during the pyrolysis of TPU and TPU/MIT composites, and to further to investigate their smoke toxicity.
41
Figure 9 was the three-dimensional TG-FTIR spectra of TPU and TPU/MIT composites. It could be seen from the figure that the thermal degradation process of TPU/MIT30 composite was similar to that of pure TPU, and there were strong peaks in the range of 2800–3100 cm−1, 2300-2500 cm−1, 1800-1900 cm−1 and 1000-1300 cm−1. However, compared with Figure 9a and Figure 9b, the intensity of characteristic peaks of TPU/MIT30 composite in 2300–2400 cm−1 and 850-950 cm−1 were significantly lower than that of pure TPU, and the peak time of gas-phase products was advanced, indicating that MIT promoted the pyrolysis of TPU at lower temperatures. Three-dimensional graph of gaseous products for pure TPU and TPU/MIT30 composites.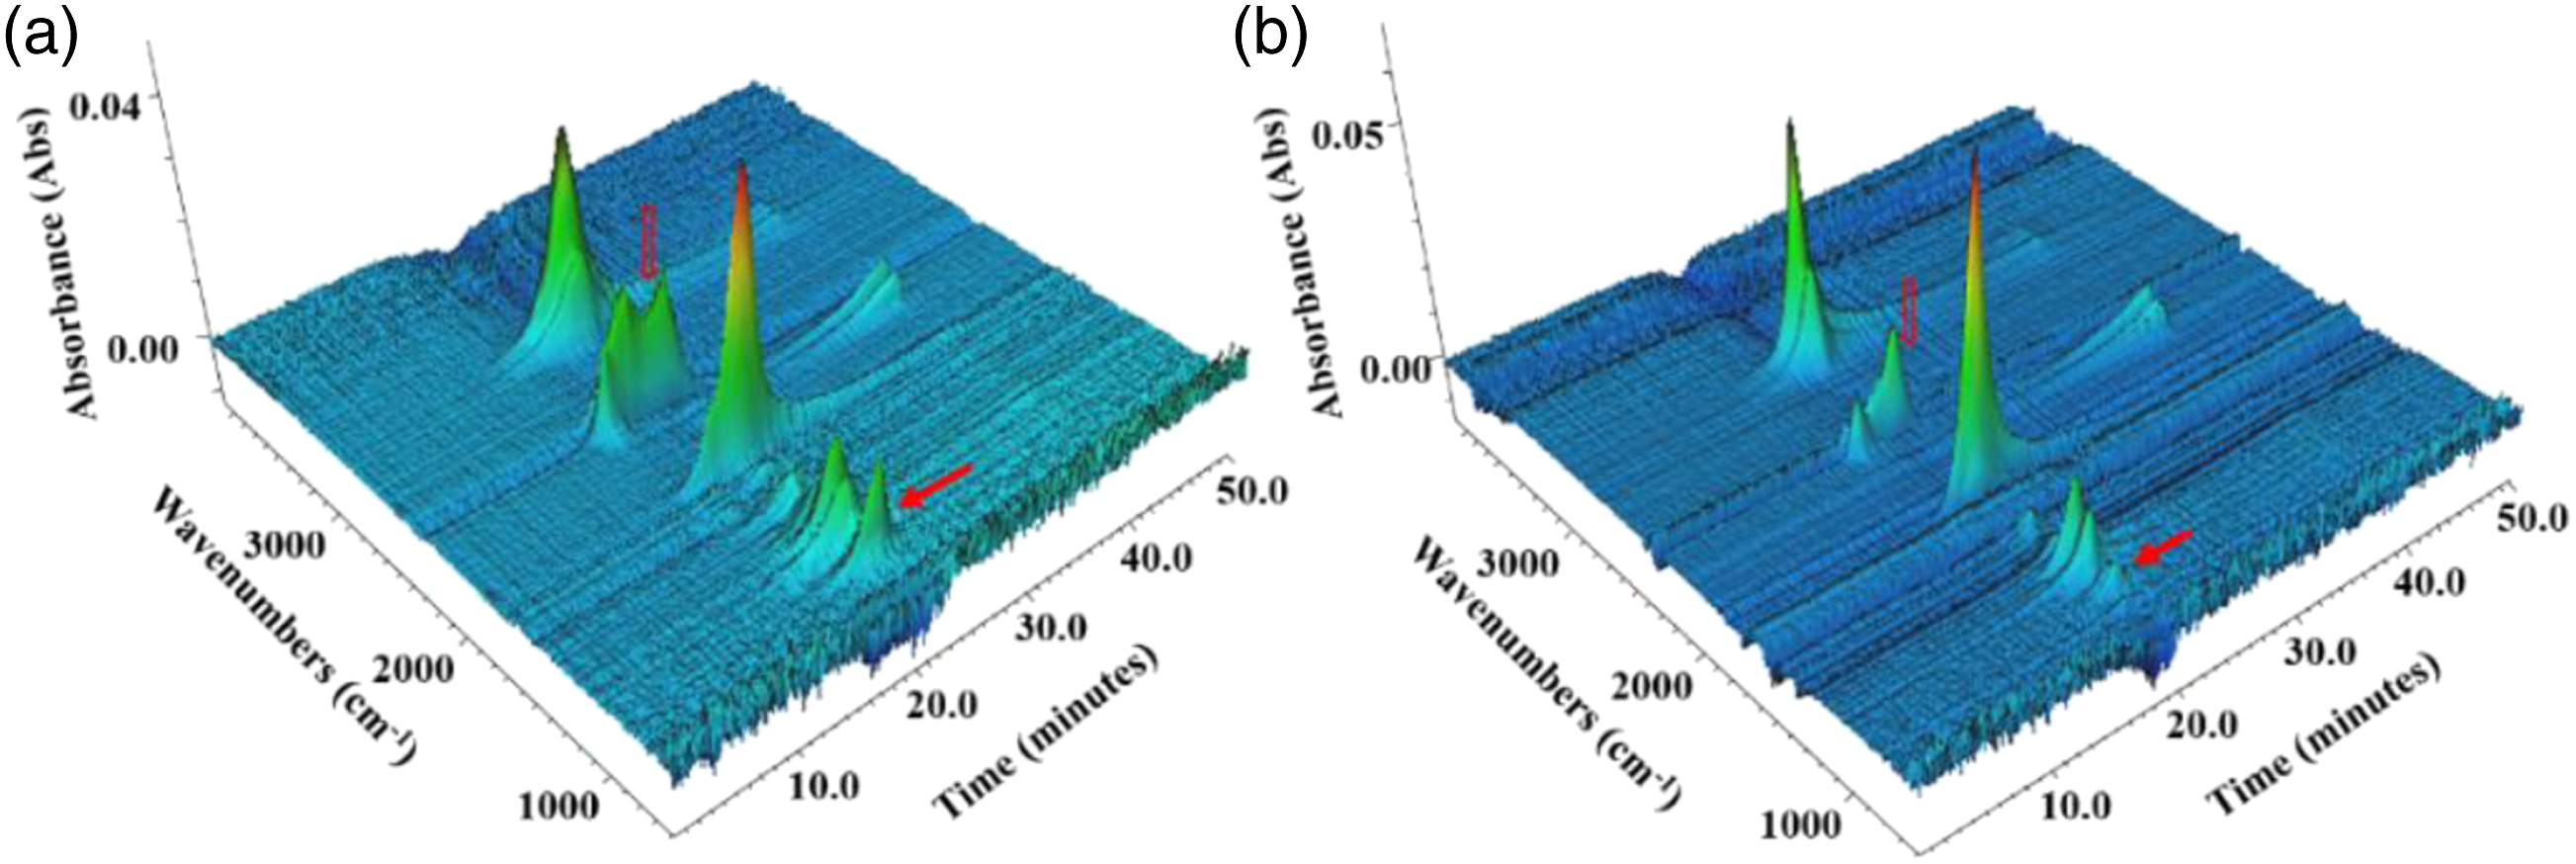
To further investigate the gas-phase composition of TPU and TPU/MIT composites during the cracking process, the infrared spectra of the composites at the maximum cracking rate stage were selected for comparison. As shown in Figure 10, the peaks near 3730 cm−1 and 3370 cm−1 were attributed to the stretching vibrations of the N-H bond in carbamate and the O-H bond in water vapor, respectively. The characteristic peak at 2980 cm−1 was related to the stretching vibration of the C-H bond in hydrocarbons.
42
The characteristic peaks at 2360 cm−1 and 2310 cm−1 confirmed the formation of CO2 and isocyanate compounds.
43
1766 cm−1 corresponded to the peak of carbonyl compounds. 1605 cm−1, 1510 cm−1 and 1460 cm−1 belonged to the characteristic peaks of aromatic compounds. 1260 cm−1 and 1110 cm−1 were characteristic peaks of esters.
20
The pure TPU reached the maximum thermal decomposition rate at 408°C, while the TPU/MIT30 composite reached the maximum rate at 380°C, indicating that MIT could promote the pyrolysis of the TPU matrix at a lower temperature. The above test results were highly consistent with TG and CCT test results. Fourier infrared spectra of pyrolysis products of TPU and TPU/MIT30 composite at the maximum decomposition rate.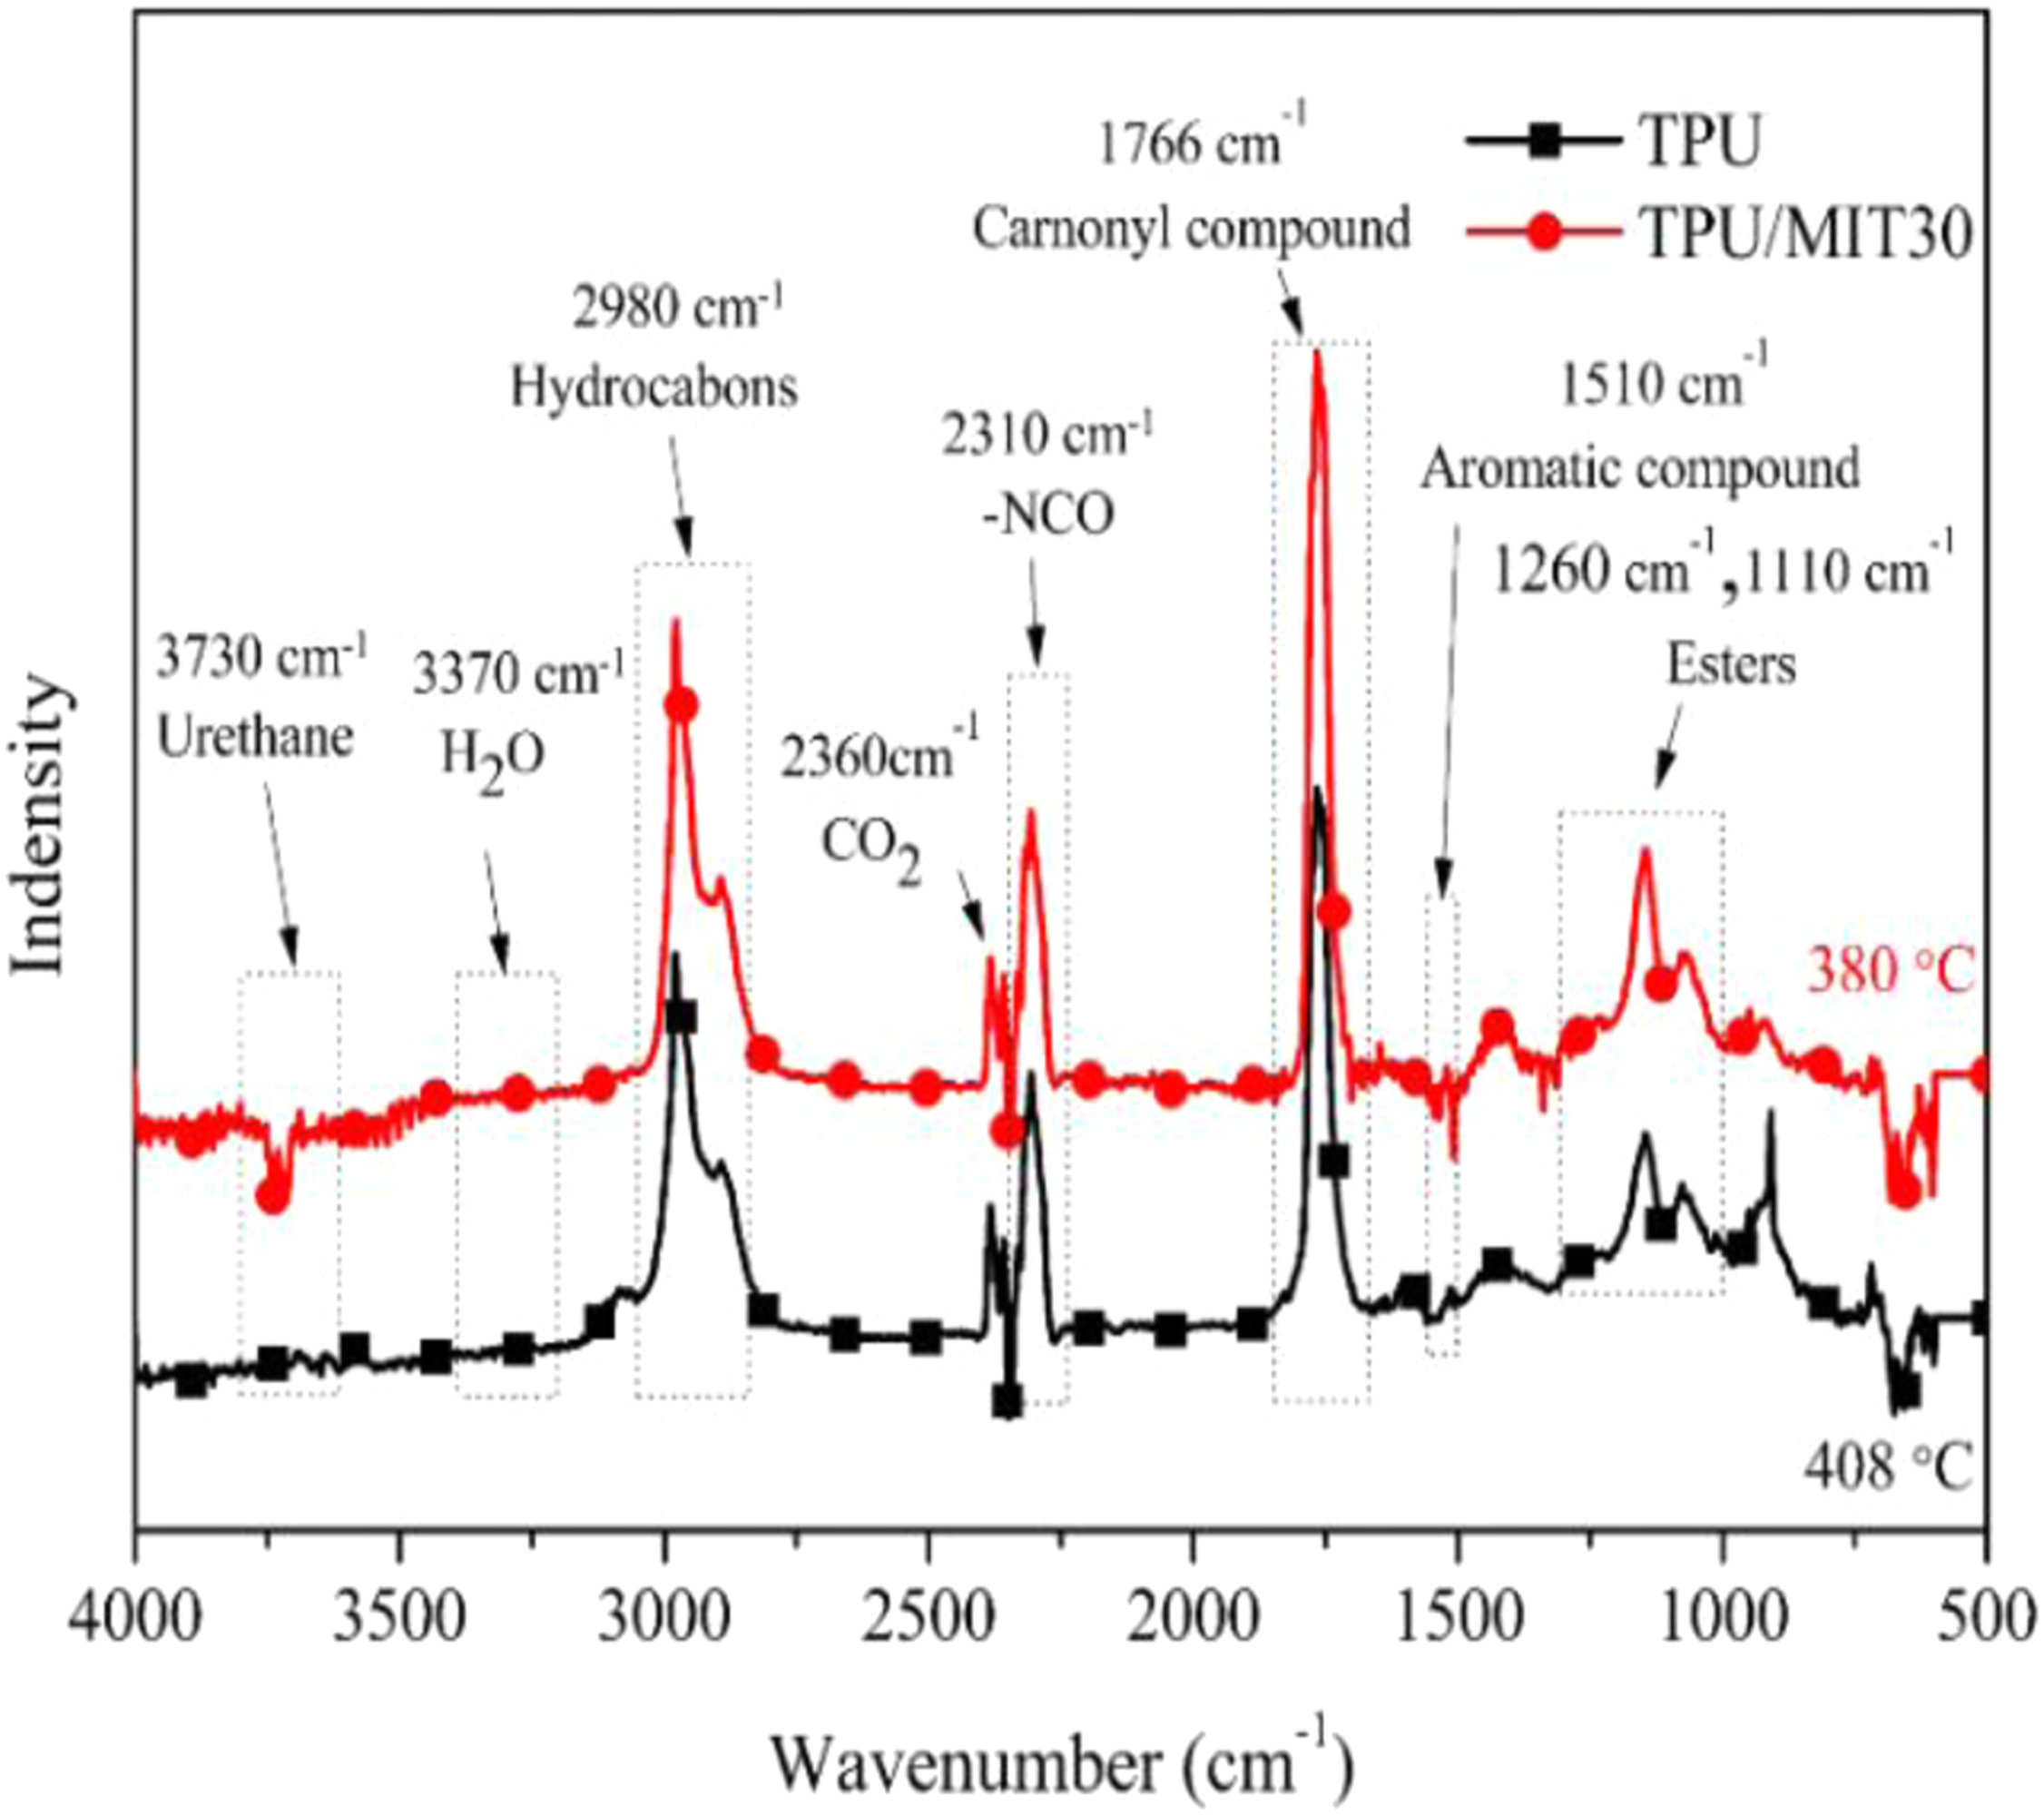
Figure 11 was the curves of the infrared absorption spectrum of gas-phase products with time.
16
From Figure 11(a), it could be seen that at 14°min (280oC), TPU began to produce CO2 and isocyanate compounds. TPU/MIT30 began to produce CO2 and isocyanate compounds at 15–16°min, but the release intensity of TPU/MIT30 was lower than that of TPU. TPU began to produce carbonyl compounds at 17°min. The formation rate of carbonyl compounds and hydrocarbons of TPU/MIT30 composite was higher than that of TPU at 18°min (360oC). At 19°min, the maximum release peaks of hydrocarbons, CO2, isocyanates, carbonyl compounds and esters appeared in the TPU/MIT30 composite. At this time, the temperature corresponded to the maximum thermo-gravimetric temperature, and then the production rate decreased rapidly. The pyrolysis products of TPU peaked at 20°min, corresponding to the maximum weight loss temperature of TPU, and then the production rate of pyrolysis products decreased slowly. By comparing the infrared spectral intensity of volatile products at different time points, it was found that the peak intensity of CO2 at 2360 cm−1, isocyanate compounds at 2310 cm−1 and ammonia at 923 cm−1 of TPU/MIT composites decreased due to the addition of MIT, while the peak intensity of hydrocarbons and esters decreased, and concentrated in the range of 360–400oC, which were lower than that of pure TPU (340–440oC). Different times during thermal decomposition of TPU and TPU/MIT30 composite infrared spectrum of volatile products: (a)TPU; (b)TPU/MIT30.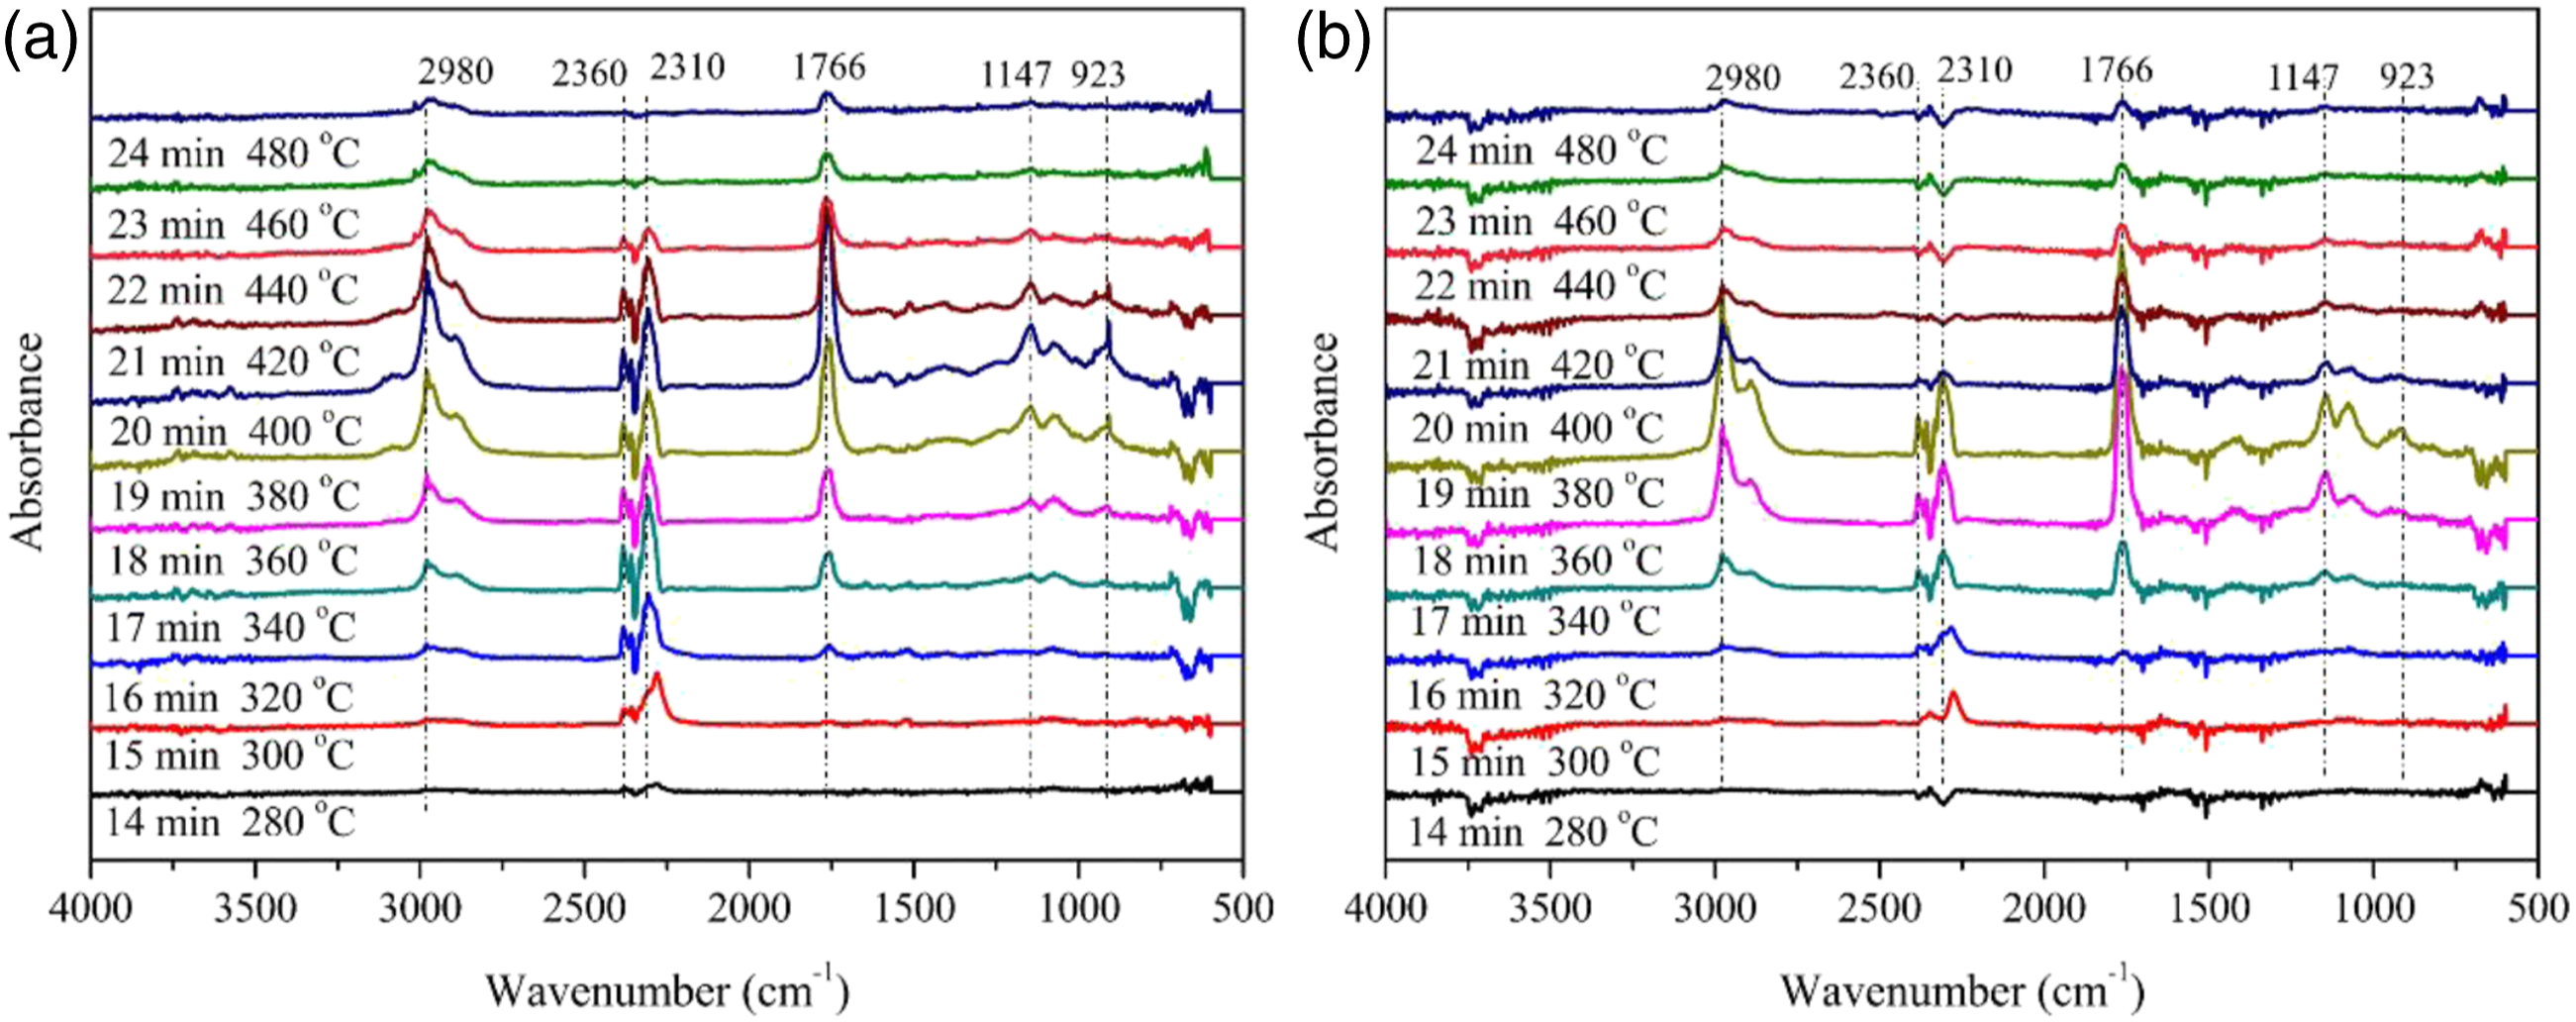
Char analysis of TPU/MIT composites
The polymer usually forms a dense char residue layer with the ability to block heat and inhibit the mixing of external oxygen and internal combustible gas during combustion. Figure 12 showed the SEM images of TPU and TPU/MIT composites calcined at 600oC for 20°min. It could be seen from Figure 12a that the char residue of pure TPU presented a lamellar char layer with a large number of cracks on the surface, and the above structure was difficult to play a role in heat insulation and oxygen insulation. TPU/MIT10 char layer was fluffy and had more pore structures, but the cracked state disappeared compared to pure TPU, Therefore, the barrier to energy and material during composite combustion was limited. The char layer of TPU/MIT30 was the most compact, and its surface pore structure basically disappeared. The above structure had an obvious barrier effect on gaseous pyrolysis products, oxygen and heat, thus effectively improving the fire safety of TPU composites. SEM images of char residue for TPU and TPU/MIT composites: (a)TPU; (b)TPU/MIT10; (c)TPU/MIT20; (d)TPU/MIT30.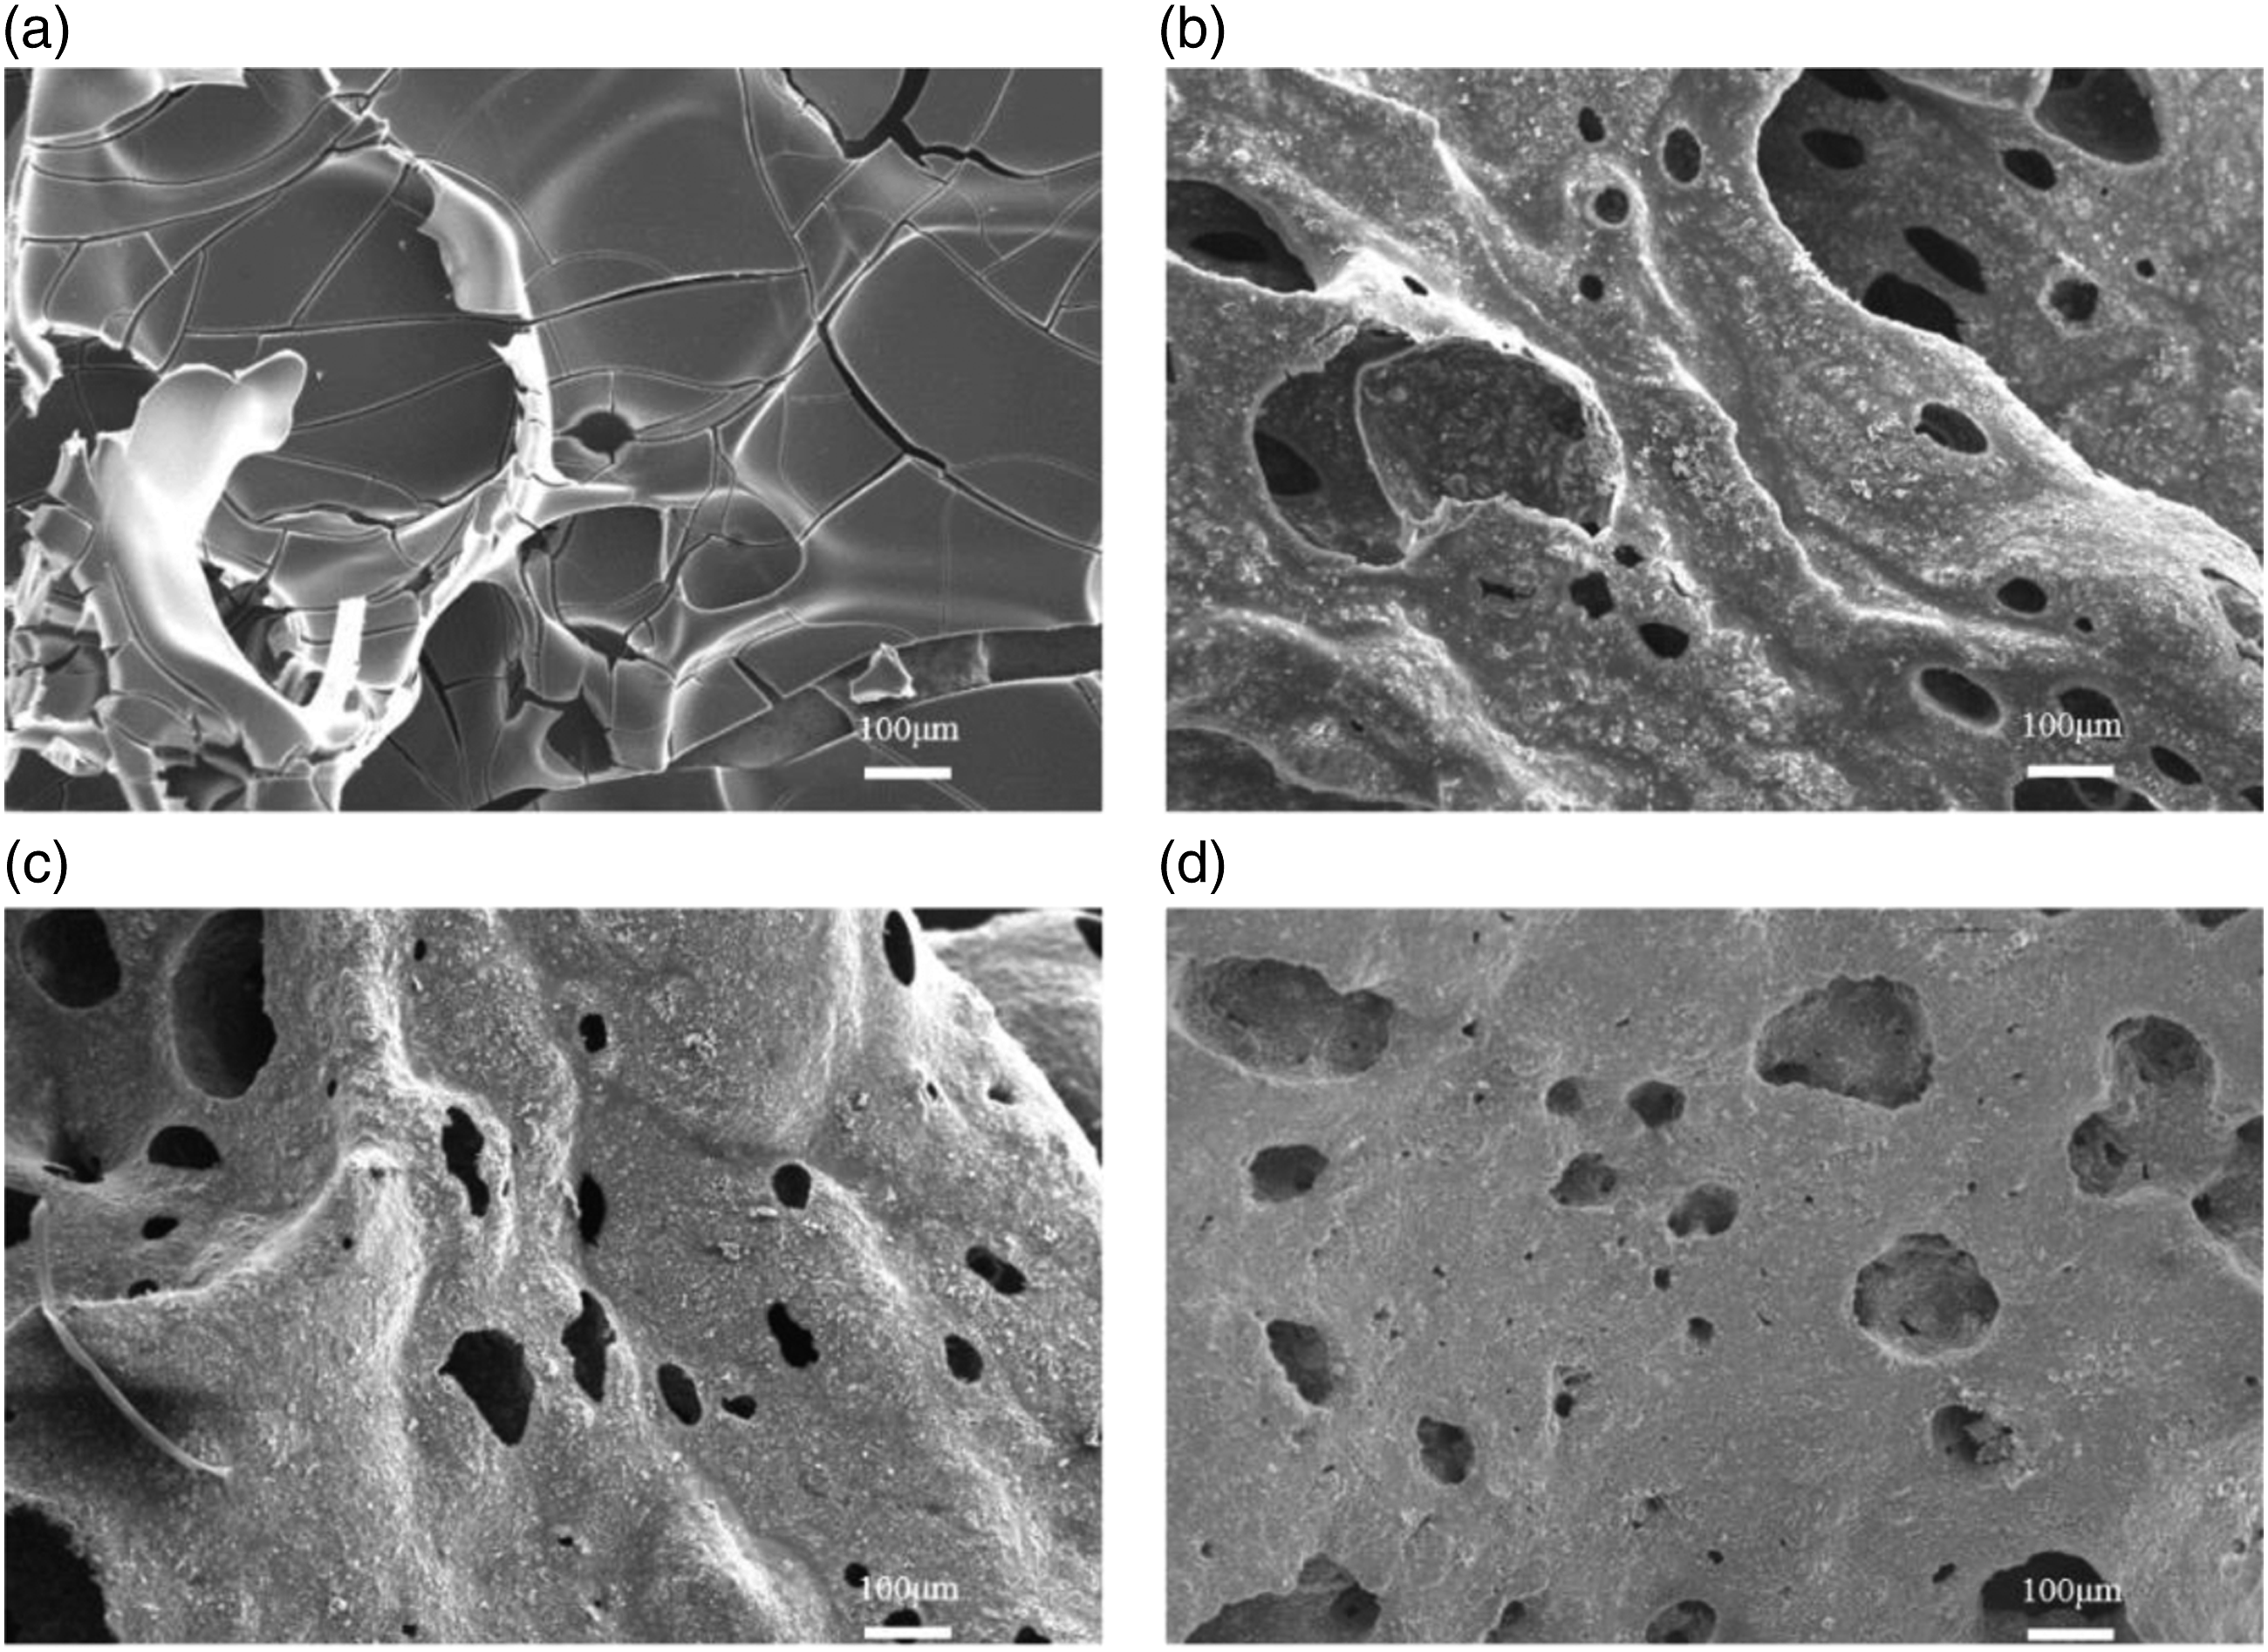
Raman spectroscopy was usually used to analyze crystalline and non-crystalline phases in carbonaceous materials and to provide key information for revealing the flame retardant principle of materials.
42
Figure 13 showed the Raman spectra of TPU and TPU/MIT composites. D band corresponded to 1360 cm−1, G band corresponded to 1603 cm−1. The area ratio (ID/IG) in the D peak and G peak was usually used to evaluate the graphitization degree of the char residue, the larger the ID/IG ratio, the lower the graphitization degree of the char residue, and the low graphitization degree of the char residue was prone to re-combustion when exposed to higher heat fluxes for a long time, thus affecting the flame retardant properties of the material.
44
From Figure 13, the ID/IG values of TPU and TPU/MIT composites were TPU/MIT30(2.02) < TPU/MIT20(2.15) < TPU/MIT10(2.26) < TPU(2.87), indicating that the addition of MIT could effectively improve the graphitization of the char residue of TPU/MIT composites and increase thermal stability of the char residue, and thus improve its flame retardant properties. Raman spectra of char residue of TPU and TPU/MIT composites: (a)TPU; (b)TPU/MIT10; (c)TPU/MIT20; (d)TPU/MIT30.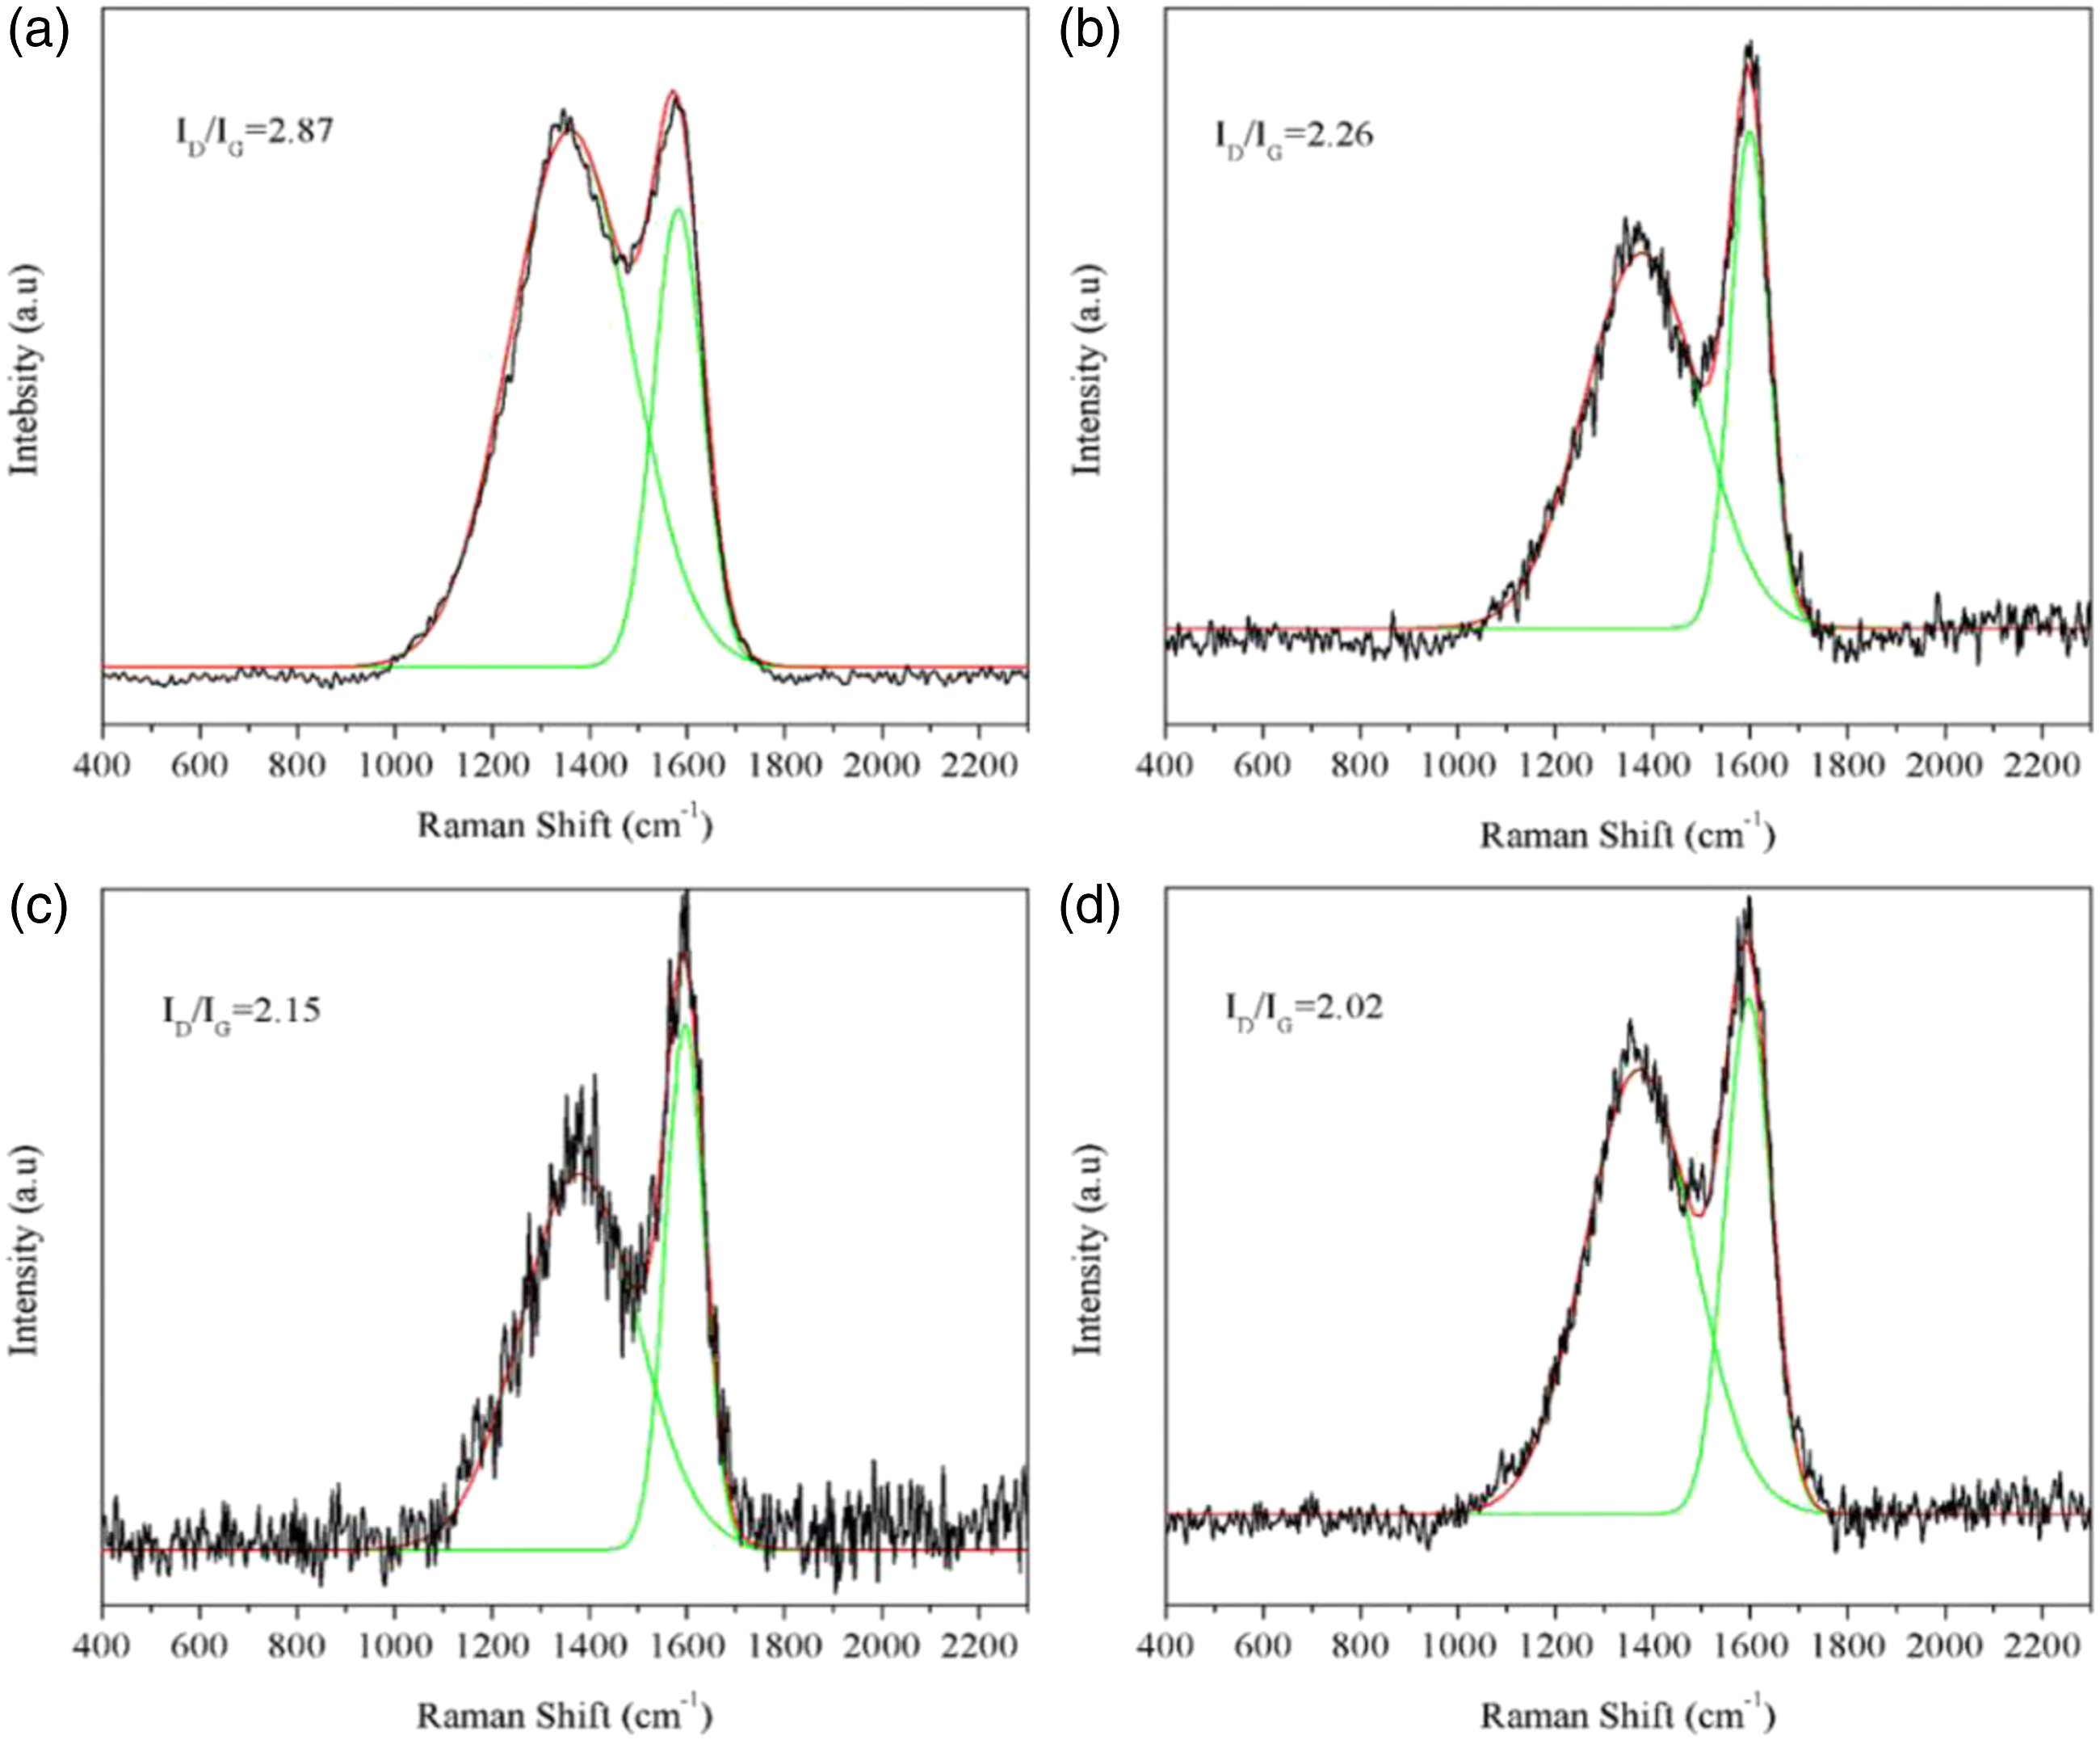
The infrared spectra of the char residue for TPU and TPU/MIT composites were shown in Figure 14. The stretching vibration of O-H in adsorbed water appeared at 3423 cm−1, the absorption peak at 1627 cm−1 was the characteristic peak of the C=C double bond
45
the characteristic peak of CO32- was at 1411 cm−1, a significant Si-O-Si stretching vibration peak appeared at 1040 cm−1, and 763 cm−1 peak was the characteristic peak of aromatic compounds. By comparing the infrared spectra of char residue for TPU and TPU/MIT composites, it could be found that the C=C double bond, Si-O-Si peak and aromatic compounds in the char residue layer of TPU/MIT composites were significantly increased, indicating that the metal oxide components in IT could effectively promote the formation of polycyclic aromatic hydrocarbons in the TPU, and it formed a dense char residue layer with the inorganic components in IT, thus effectively improving the flame retardation of TPU/MIT composites. Fourier infrared spectra of char residue of TPU and TPU/MIT composites.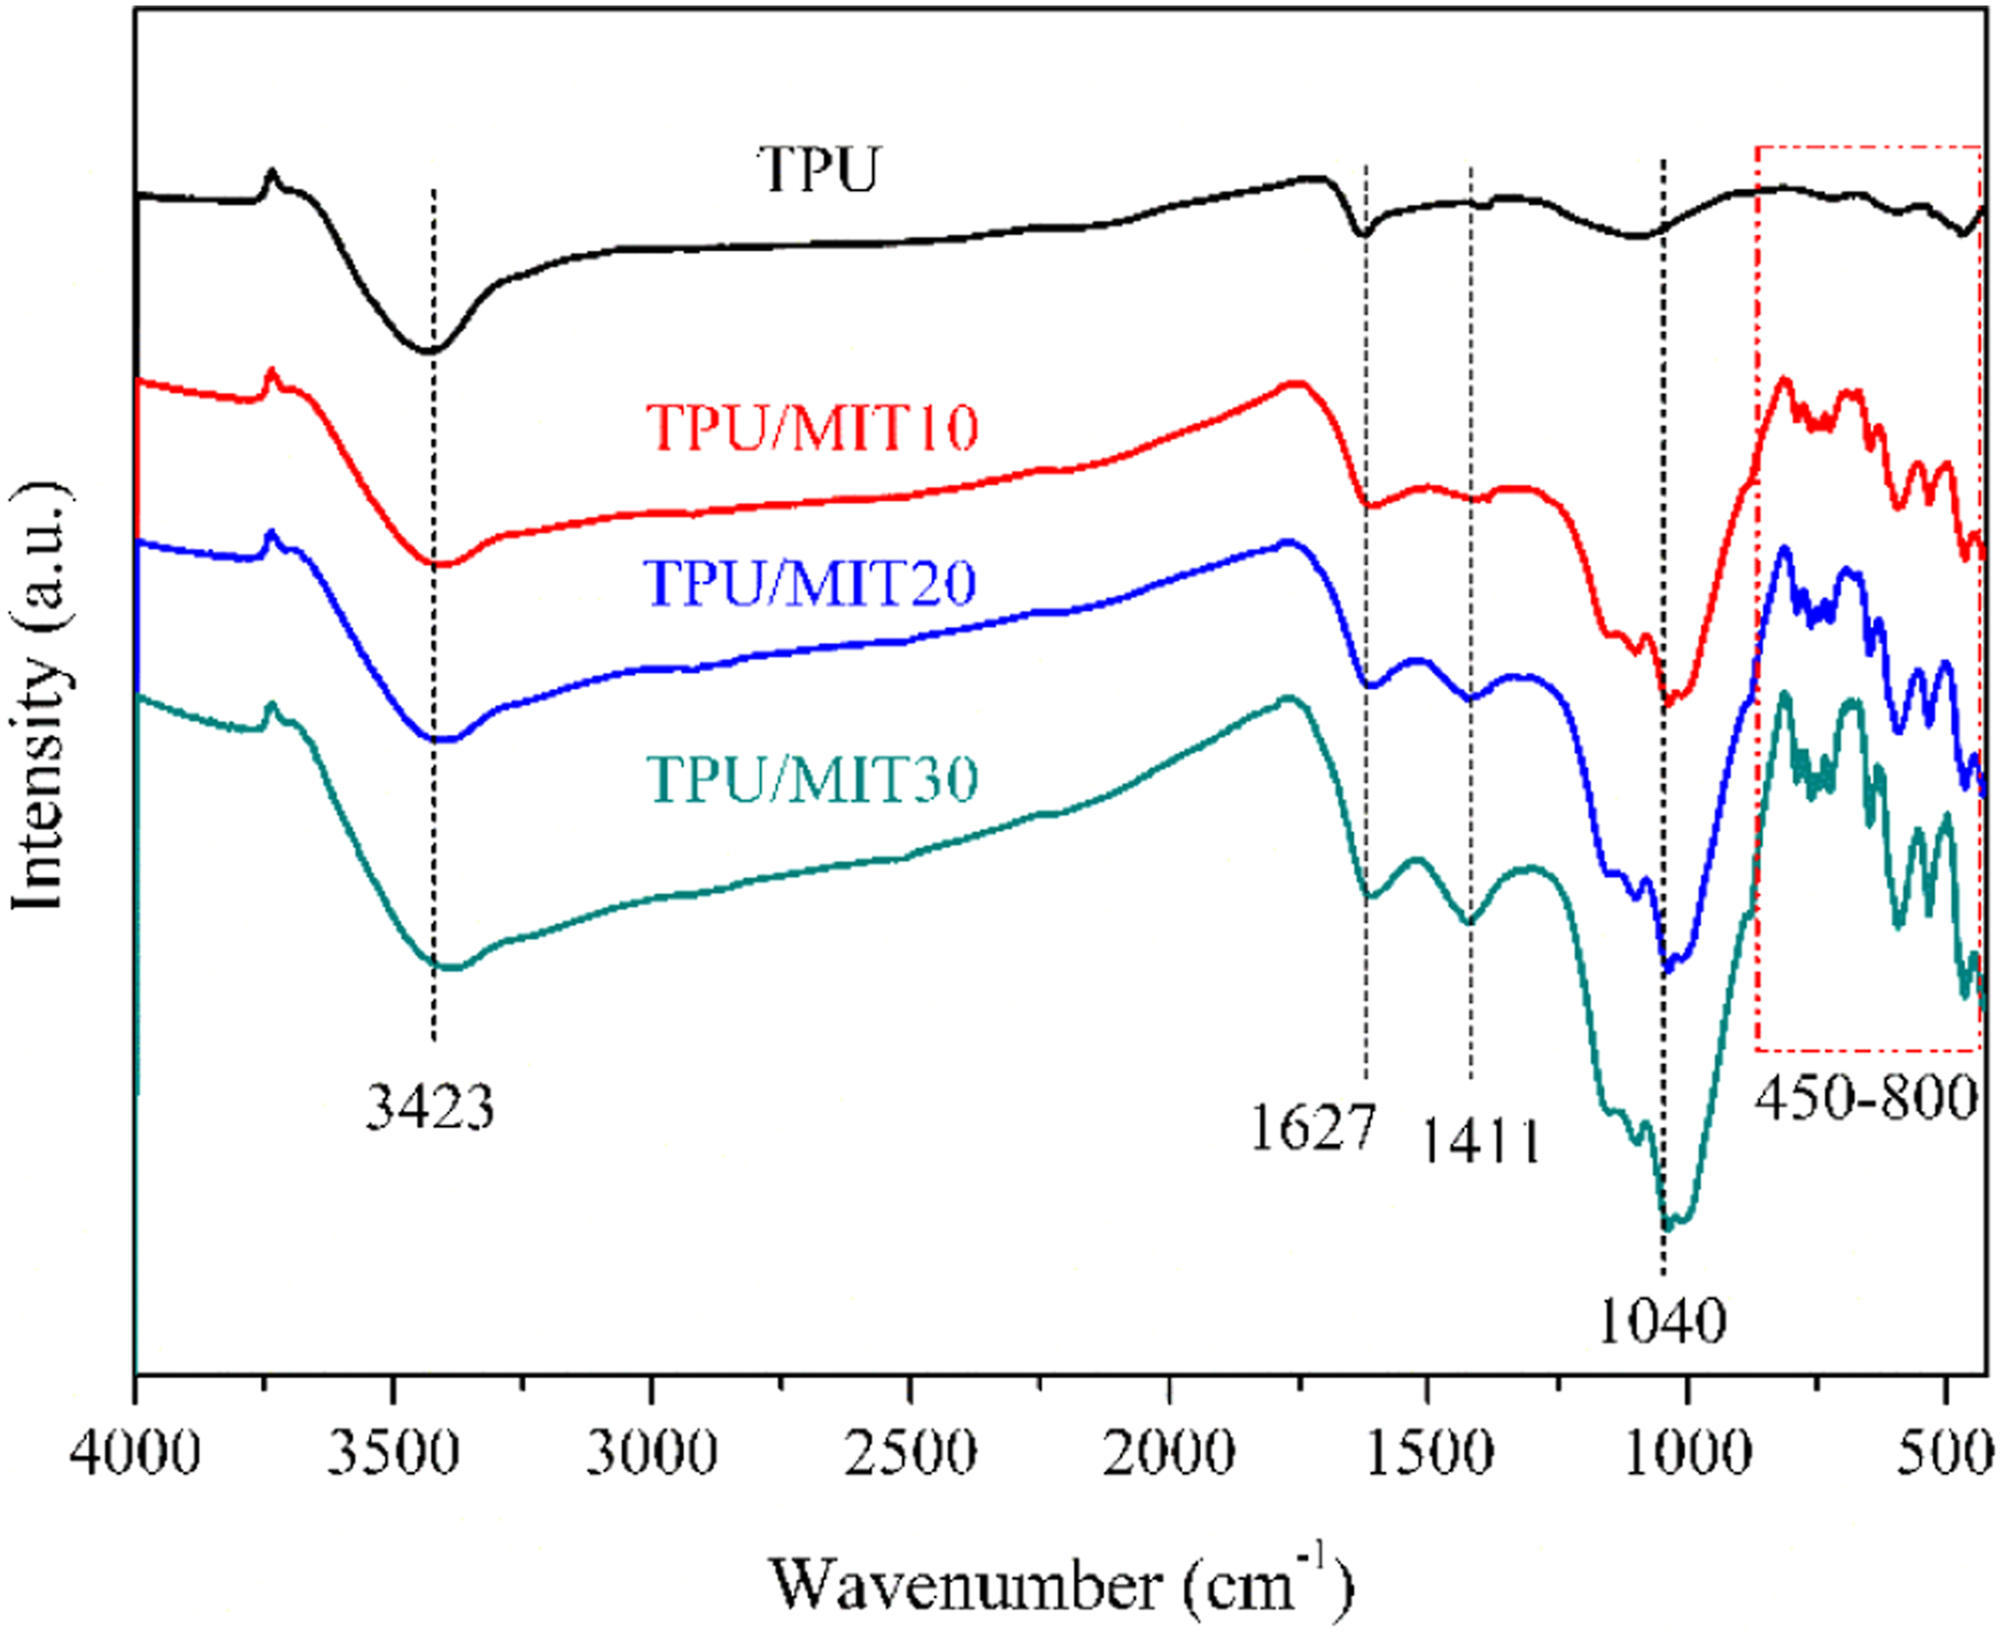
Conclusions
In this paper, Iron tailings was surface modified (MIT) with surface modifier KH550 and introduced into TPU as flame retardant to prepare a series of TPU/MIT composites by melt blending method, and then the thermal stability, combustion properties and smoke production properties of TPU and TPU/MIT composites were investigated to analyze the effect of MIT on the flame retardant properties of TPU. TG analysis showed that MIT promoted the early degradation of TPU into char residue thus improving its high-temperature stability. Compared with TPU, the Tmax of TPU/MIT30 composite decreased from 403oC to 376oC, and the char residual at 700oC increased from 3.13 wt% to 32.17 wt%. The Coats-Redfern and Horowitz-Metzger methods were also used to analyze the pyrolysis kinetics of TPU and TPU/MIT composites. The study showed that the degradation activation energy of TPU/MIT composites was significantly higher compared with that of pure TPU, which further confirmed that the introduction of MIT could improve the high-temperature stability of the composites. The CCT results showed that MIT could improve the combustion performance of TPU composites and significantly reduce smoke production. Compared with pure TPU, the PHRR of TPU/MIT30 composite decreased by 39% and the THR decreased by 23.5%; meanwhile, the SPR and TSP decreased by 48.6% and 37.8%, respectively; and the SF decreased by 61.9%. SEM, Raman and FTIR tests showed that MIT could enhance the graphitization of the char residue layer of TPU composites and their high-temperature thermal stability, which could effectively block the heat transfer and inhibit the transport of combustible gases and oxygen in the combustion region, thus improving the fire safety performance of TPU/MIT composites. The above study showed that MIT had a positive role in TPU composites, and also provided new ideas for the high-value utilization of IT.
Footnotes
Declaration of conflicting interests
The author(s) declared no potential conflicts of interest with respect to the research, authorship, and/or publication of this article.
Funding
This research was supported by National Natural Science Fund of China (No.51403004, No.U1833113), Anhui Provincial Nature Science Foundation (No.2108085ME178), Jiaxing Science and Technology Project (No.2020AD10020), Key Research Projects in Nanhu College of Jiaxing University (No.N41472001-49). Student ResearchTraining Program (S201910360229).