
Abstract
Plastic materials are widely used as geosynthetics. The use of plastic products poses a serious environmental risk due to their degradation. Aiming at the environmental problems caused by the difficulty of direct degradation of traditional plastic geogrid and the effects of material filling ratios, material filling forms, mesh shapes and tensile rates on the mechanical properties of geogrids. Based on 3D printing technology, polylactic acid (PLA) geogrid was prepared, and indoor tensile tests of polylactic acid geogrid were carried out. The effects of material filling ratios, material filling forms, geogrid geometries and tensile rates on the mechanical properties of geogrid are analyzed. The test results showed that PLA can be used as an environmentally friendly material for making geogrids and can reflect the mechanical properties of different geogrids. The triaxial geogrid had the greatest tensile strength, while the uniaxial one had the least. The tensile strength of triaxial and biaxial geogrids increased with the increase of tensile rates, while uniaxial decreased and then increased. The elongation at break of uniaxial and triaxial geogrids increased with increasing tensile rates, while biaxial increased and then decreased. With the increase of filling ratios, the tensile strength of geogrid increased and then decreased. For the line 45 angle printed geogrid, the elongation at break increased first and then decreased and finally increased.
Introduction
In recent years, geogrids have been widely used in geotechnical engineering. 1 Geogrid plays an important role in engineering, mainly through its tensile strength to bear the load. Therefore, tensile strength has become an important index to measure the performance of geogrid. 2 The study of the tensile strength of geogrids has also become a major project, and the most commonly used test method is the indoor tensile test. In terms of indoor tensile tests, Yang et al. 3 investigated the effect of different tensile rates on the tensile properties of HDPE geogrids of three strengths through indoor tests. Hsieh and Lin 4 conducted tensile tests by using single-width geogrids and wide geogrids at different rate conditions. Chantachot et al. 5 conducted a series of tensile tests on two different geogrids using different load and temperature conditions to evaluate the effect of ambient temperature on their load-strain-time behavior. Zhou et al. 6 summed up the variation law of tensile strength and elongation of geogrids by tensile tests on different forms of geogrids.
However, most of the traditional geogrids are made of polypropylene, polyvinyl chloride and other polymers through thermoplastic or molding. Polypropylene and polyvinyl chloride are difficult to degrade directly and pollute the environment. 7 In the recent 10 years, biodegradable materials as biopolymers instead of synthetic materials have attracted more and more attention all over the world. This urges the scientific and industrial circles to find a good and cost-effective method to replace traditional materials in some engineering applications. 8 Singh et al. 9 recycled thermoplastic materials and manufactured energy storage devices (ESD) through 3D printing technology, which confirmed that the prepared ESD has higher thermal stability and mechanical properties. Several researchers10–12 extracted bamboo fiber to synthesize geosynthetics. Zhang et al. 13 verified the applicability of bamboo reinforcement by tendon tensile test and reinforced soil interface friction test and also selected bidirectional plastic geogrid as reinforcing material for comparative analysis. Hegde and Sitharam14,15 discussed the ultimate bearing capacity of the clay bed that is reinforced with bamboo cell and geogrid and determined that the ultimate bearing capacity of the clay bed reinforced with bamboo cell and geogrid was 1.3 times greater than that of a clay bed reinforced with a geocell and geogrid. Polylactic acid is an environment-friendly material. Among the fully biodegradable polymers, the poly (lactic acid) or polylactide is certainly the most promising. 8 Polylactic acid is a thermoplastic, high-strength and high-modulus polymer 16 that has already been used in large-scale production and commercialized for a wide range of fields such as food technology, medical engineering, pharmaceutical, packaging and agriculture, thanks to its huge versatility. 17
3D printing has become a revolutionary technology since its emergence in the mid-1980s. 18 Yamato et al. 19 studied the mechanical properties of open hole tensile specimens made of 3D printed continuous carbon fiber reinforced thermoplastic. Sabarinathan et al. 20 studied the effects of various process parameters after filling hexagonal lattice structure in 3D printing PLA polymer materials on structural characteristics, such as filling density, layer thickness and printing temperature. Recently, 3D printing has also been adopted in geotechnical research. Geetha et al. 21 made a 3D concrete model and a geogrid model, which proposed the optimization effect of Geogrid on the interlayer stability and flexural strength of concrete. Most scholars have only made use of 3D printing technology to create geogrids, but there has been little research into the way the material is filled. Stathas et al. 22 fabricated a small geogrid model by a 3D printing method using different base resins to study its geometry and tensile properties under working conditions. Fowmes et al. 23 fabricated a geomembrane model using polymers through rapid prototyping technology. They studied the effect of the spacing and height of microbumps on the geomembrane surface on the shear properties of the geomembrane-sand interface. Cislaghi et al. 24 fabricated the uniaxial prototype geogrid made of PLA-based polymer mixed with titanium dioxide by 3D printing technology and discussed the potential of biopolymer in the production of geogrids. Nabeel et al. 25 manufactured a lightweight porous composite structure with continuous carbon fibers through 3D printing technology, and examined and explored its fracture interface through tensile tests.
In view of the environmental problems caused by the difficulty of direct degradation of traditional geogrid raw materials, most of the research on the mechanical properties of geogrids is still focused on uniaxial and biaxial geogrids, and the research on the mechanical properties of triaxial geogrids is not mature enough. In the study of 3D printed geogrids, most scholars still use 3D printing technology to print the geogrids model to study the mechanical properties of the geogrids. There has been little research into the effects of printing parameters. The filling ratios and filling forms of consumables are very important parameters in 3D printing. The filling ratio indicates the filling ratio of the consumables inside the printed solid model, 26 and different filling forms print out different internal structures of the model. In the currently applied geogrid tensile test specifications, the tensile rates specified in different specifications for geogrid tensile tests are not uniform. 12
In this context, the purpose of this study is to explore the use of biodegradable polymers to replace common geogrid raw materials and study its potential and possibility in geotechnical engineering. Meanwhile, in order to better apply 3D printing technology to geotechnical engineering, a series of indoor tensile tests were designed from the perspective of engineering applications, mainly investigating the effects of geogrid form, speed of tensile tests, 3D printing filling form and filling rate on the mechanical properties of geogrids.
Experimental
Test equipment
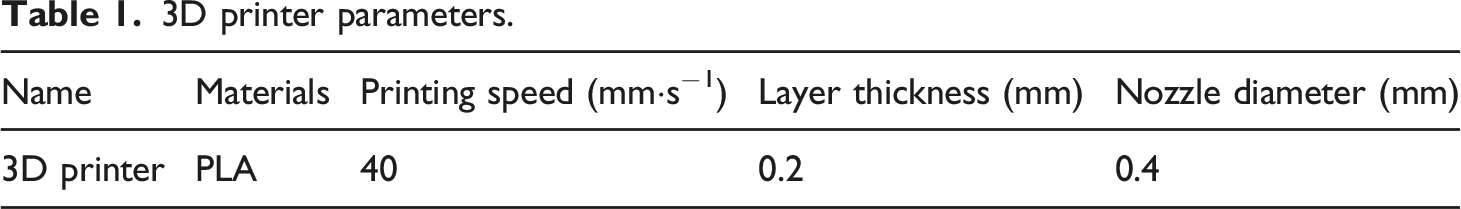
3D printer parameters.
The tensile test was performed with a CTM8050 universal testing machine with a control accuracy of ±0.1 N and a range of 5000 kN. According to the specification of SL-235-2012, “Specification for test and measurement of geosynthetics,” the tensile rate was set to 20 (mm·min−1). The geotextile was clamped to the edge of the fixture to avoid damage to the geogrid sample, as shown in Figure 1. CTM8050 universal testing machine.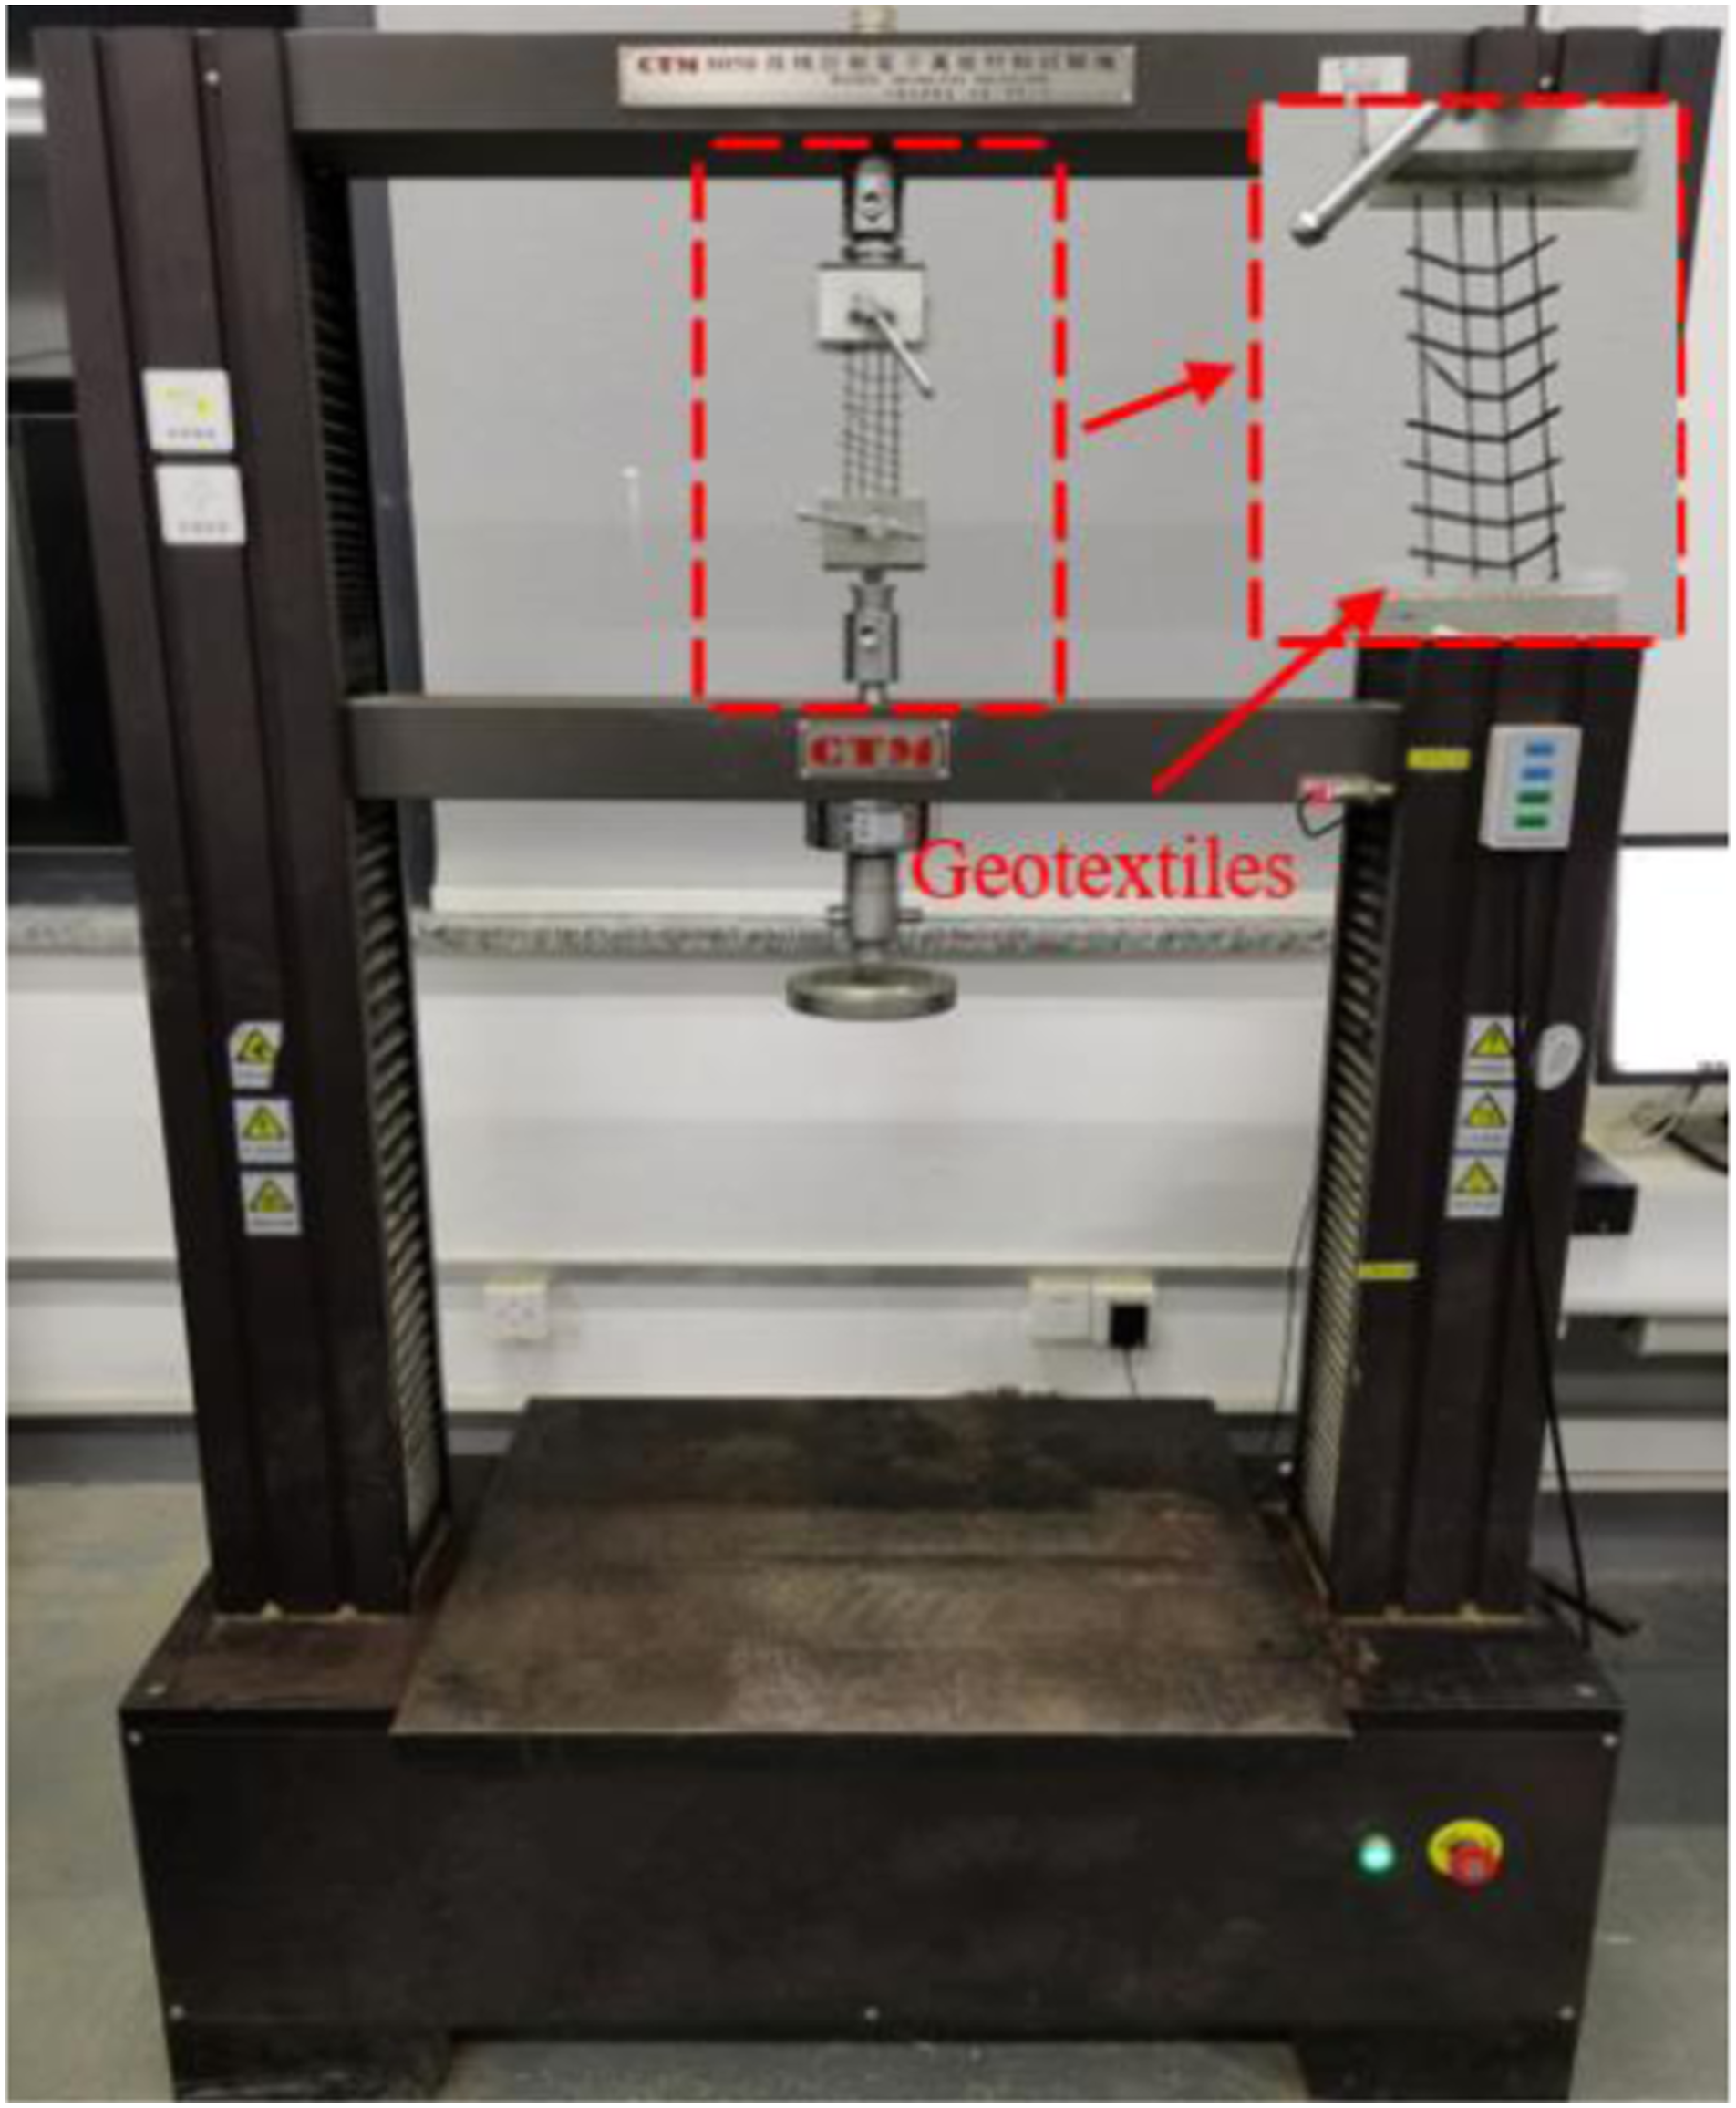
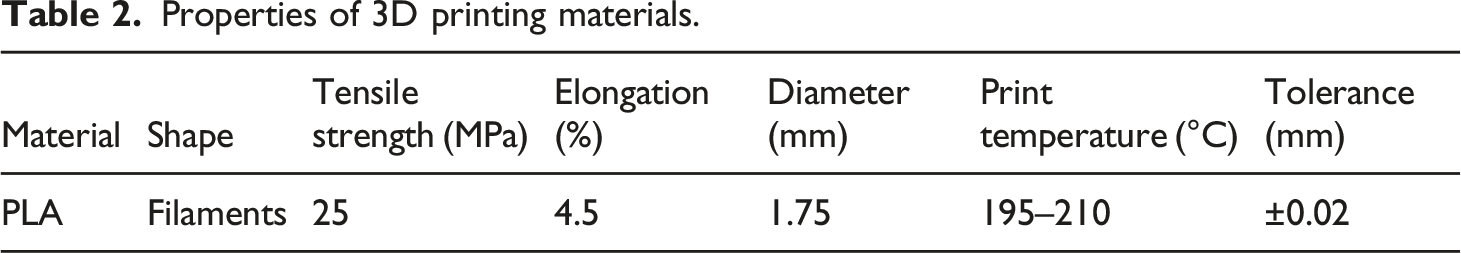
Materials
Sample preparation
The first step in sample preparation was to design the object with CAD software. Figure 2(a) shows our designs with the software based on the geogrids used in the actual project. The second step was to import the CAD 3D model into the CURA software, set the corresponding printing parameters and perform slicing. Figure 2(b) shows the 3D printed geogrid model after slicing. Finally, the model obtained by slicing is imported into the 3D printer and starts to print. A geogrid model takes about 30 min to print, and after the base plate was removed, the model specimen was obtained, see Figure 2(c). This is consistent with the approach of Gunasekaran et al.
35
3D printed geogrid preparation process.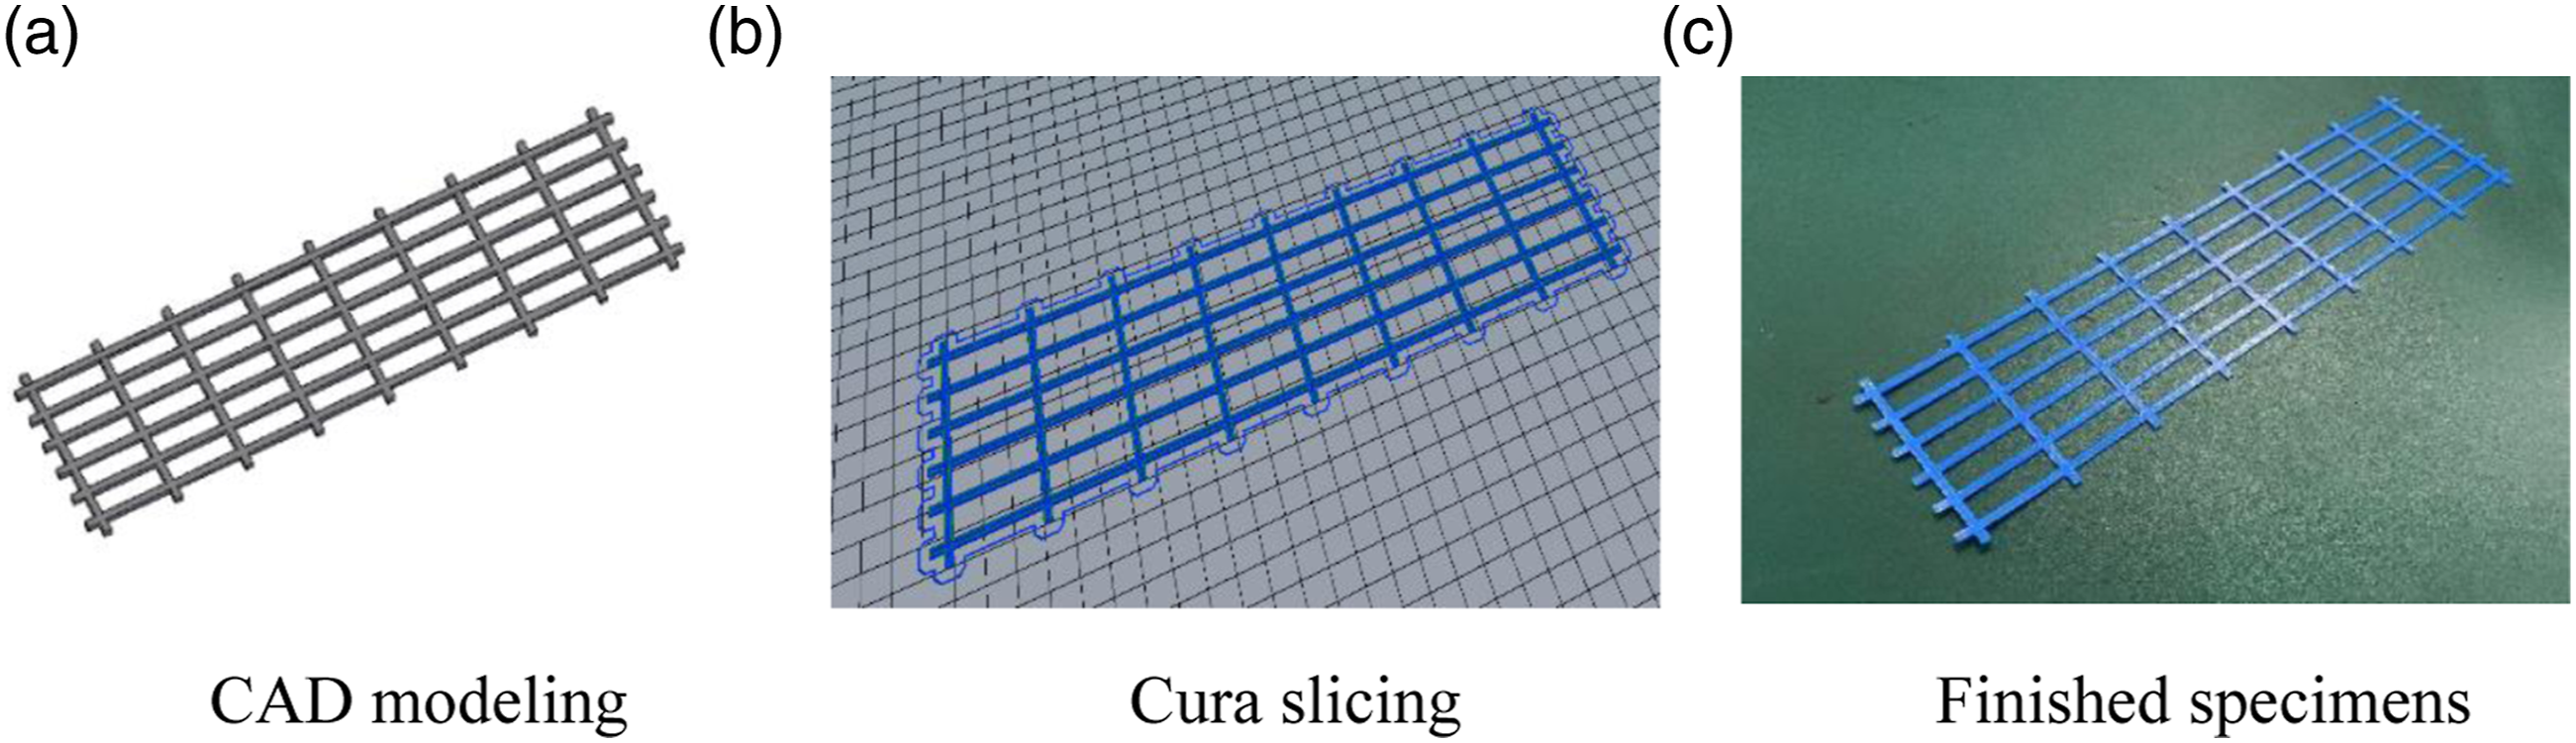
3D printing geogrids technical parameters.
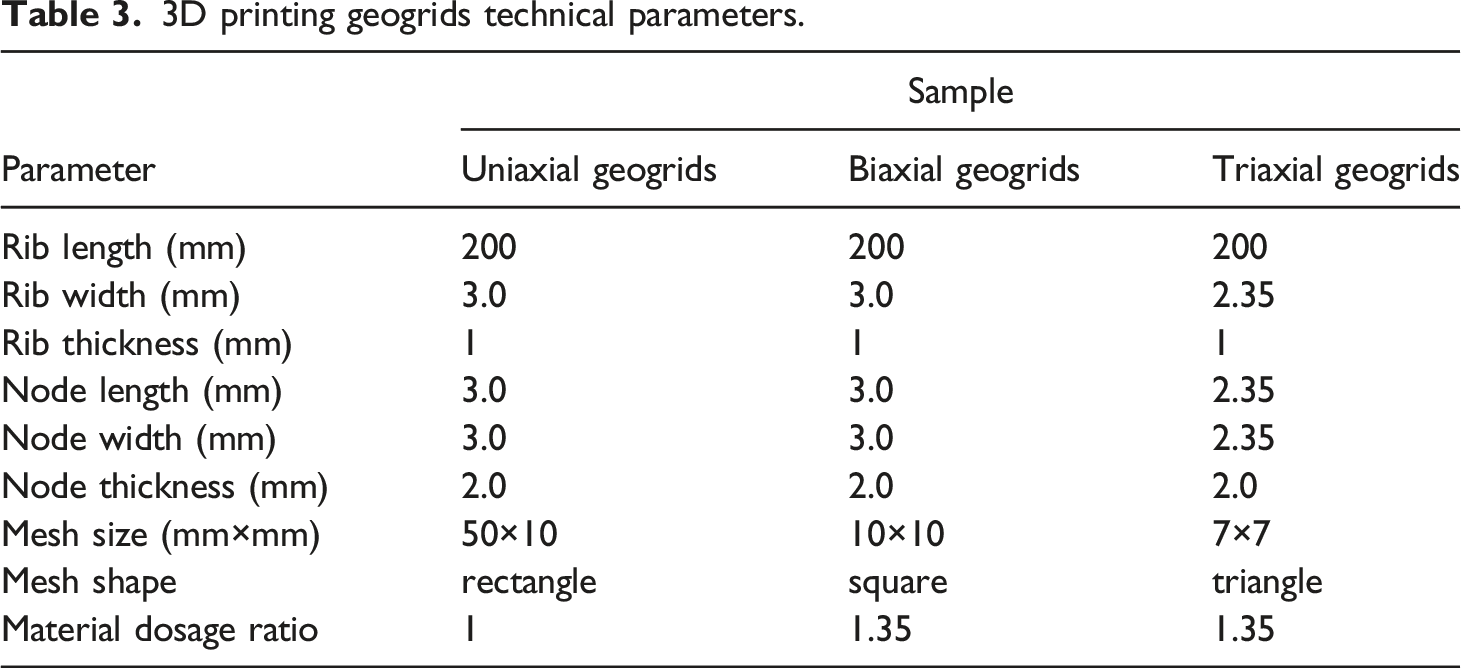
Figure 3 shows three different types of geogrid samples, as well as their grid size and node size. Geogrid sample.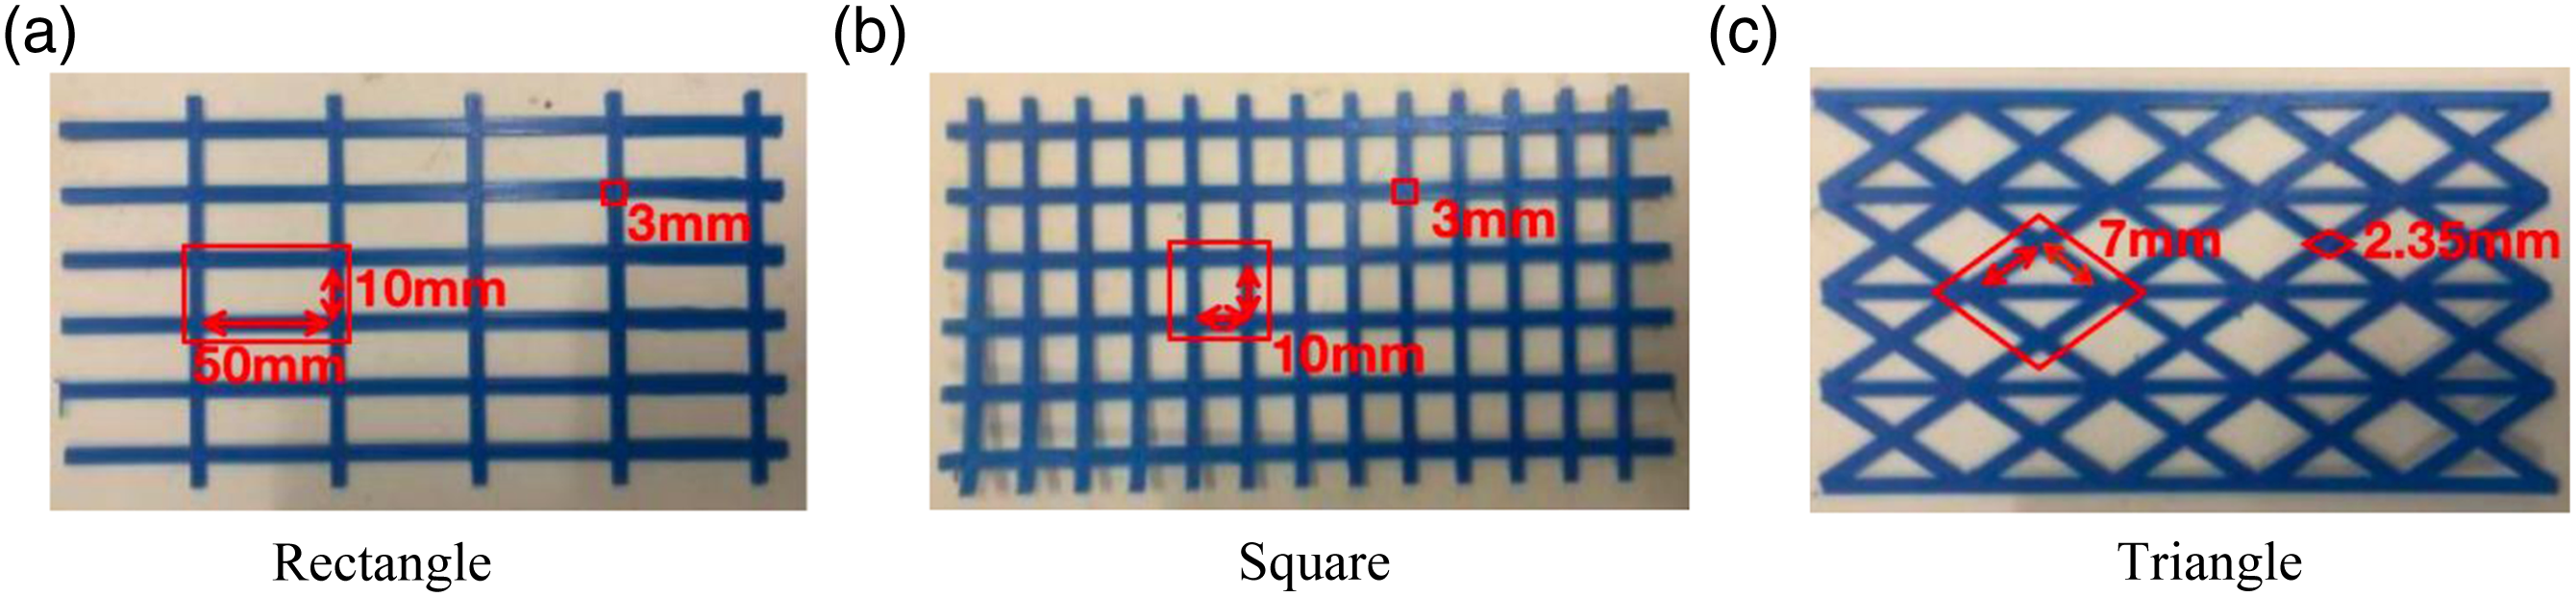
Test program
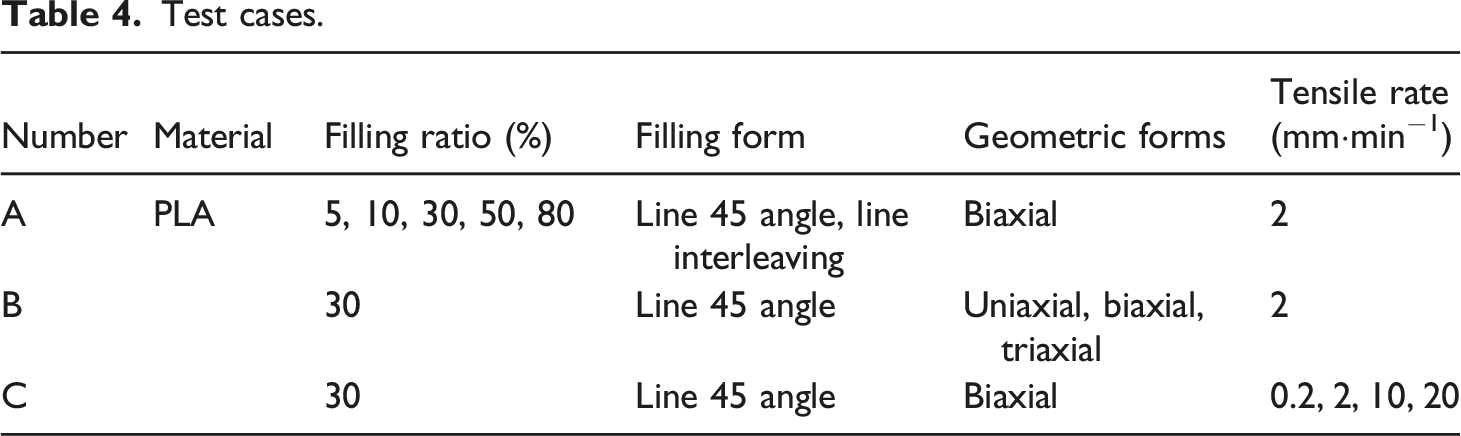
In this test, the geogrid models with five filling ratios (5%, 10%, 30%, 50%, and 80%), two filling forms (line 45 angle filling and line interleaving filling, showed in Figure 4) and three geometric forms (uniaxial geogrids, biaxial geogrids, and triaxial geogrids) were designed to be carried out the tensile test at four tensile rates (0.2 mm·min−1, 2 mm·min−1, 10 mm·min−1, and 20 mm·min−1). The test cases are summarized in Table 4. Schematic of 3D printing technology process. Test cases.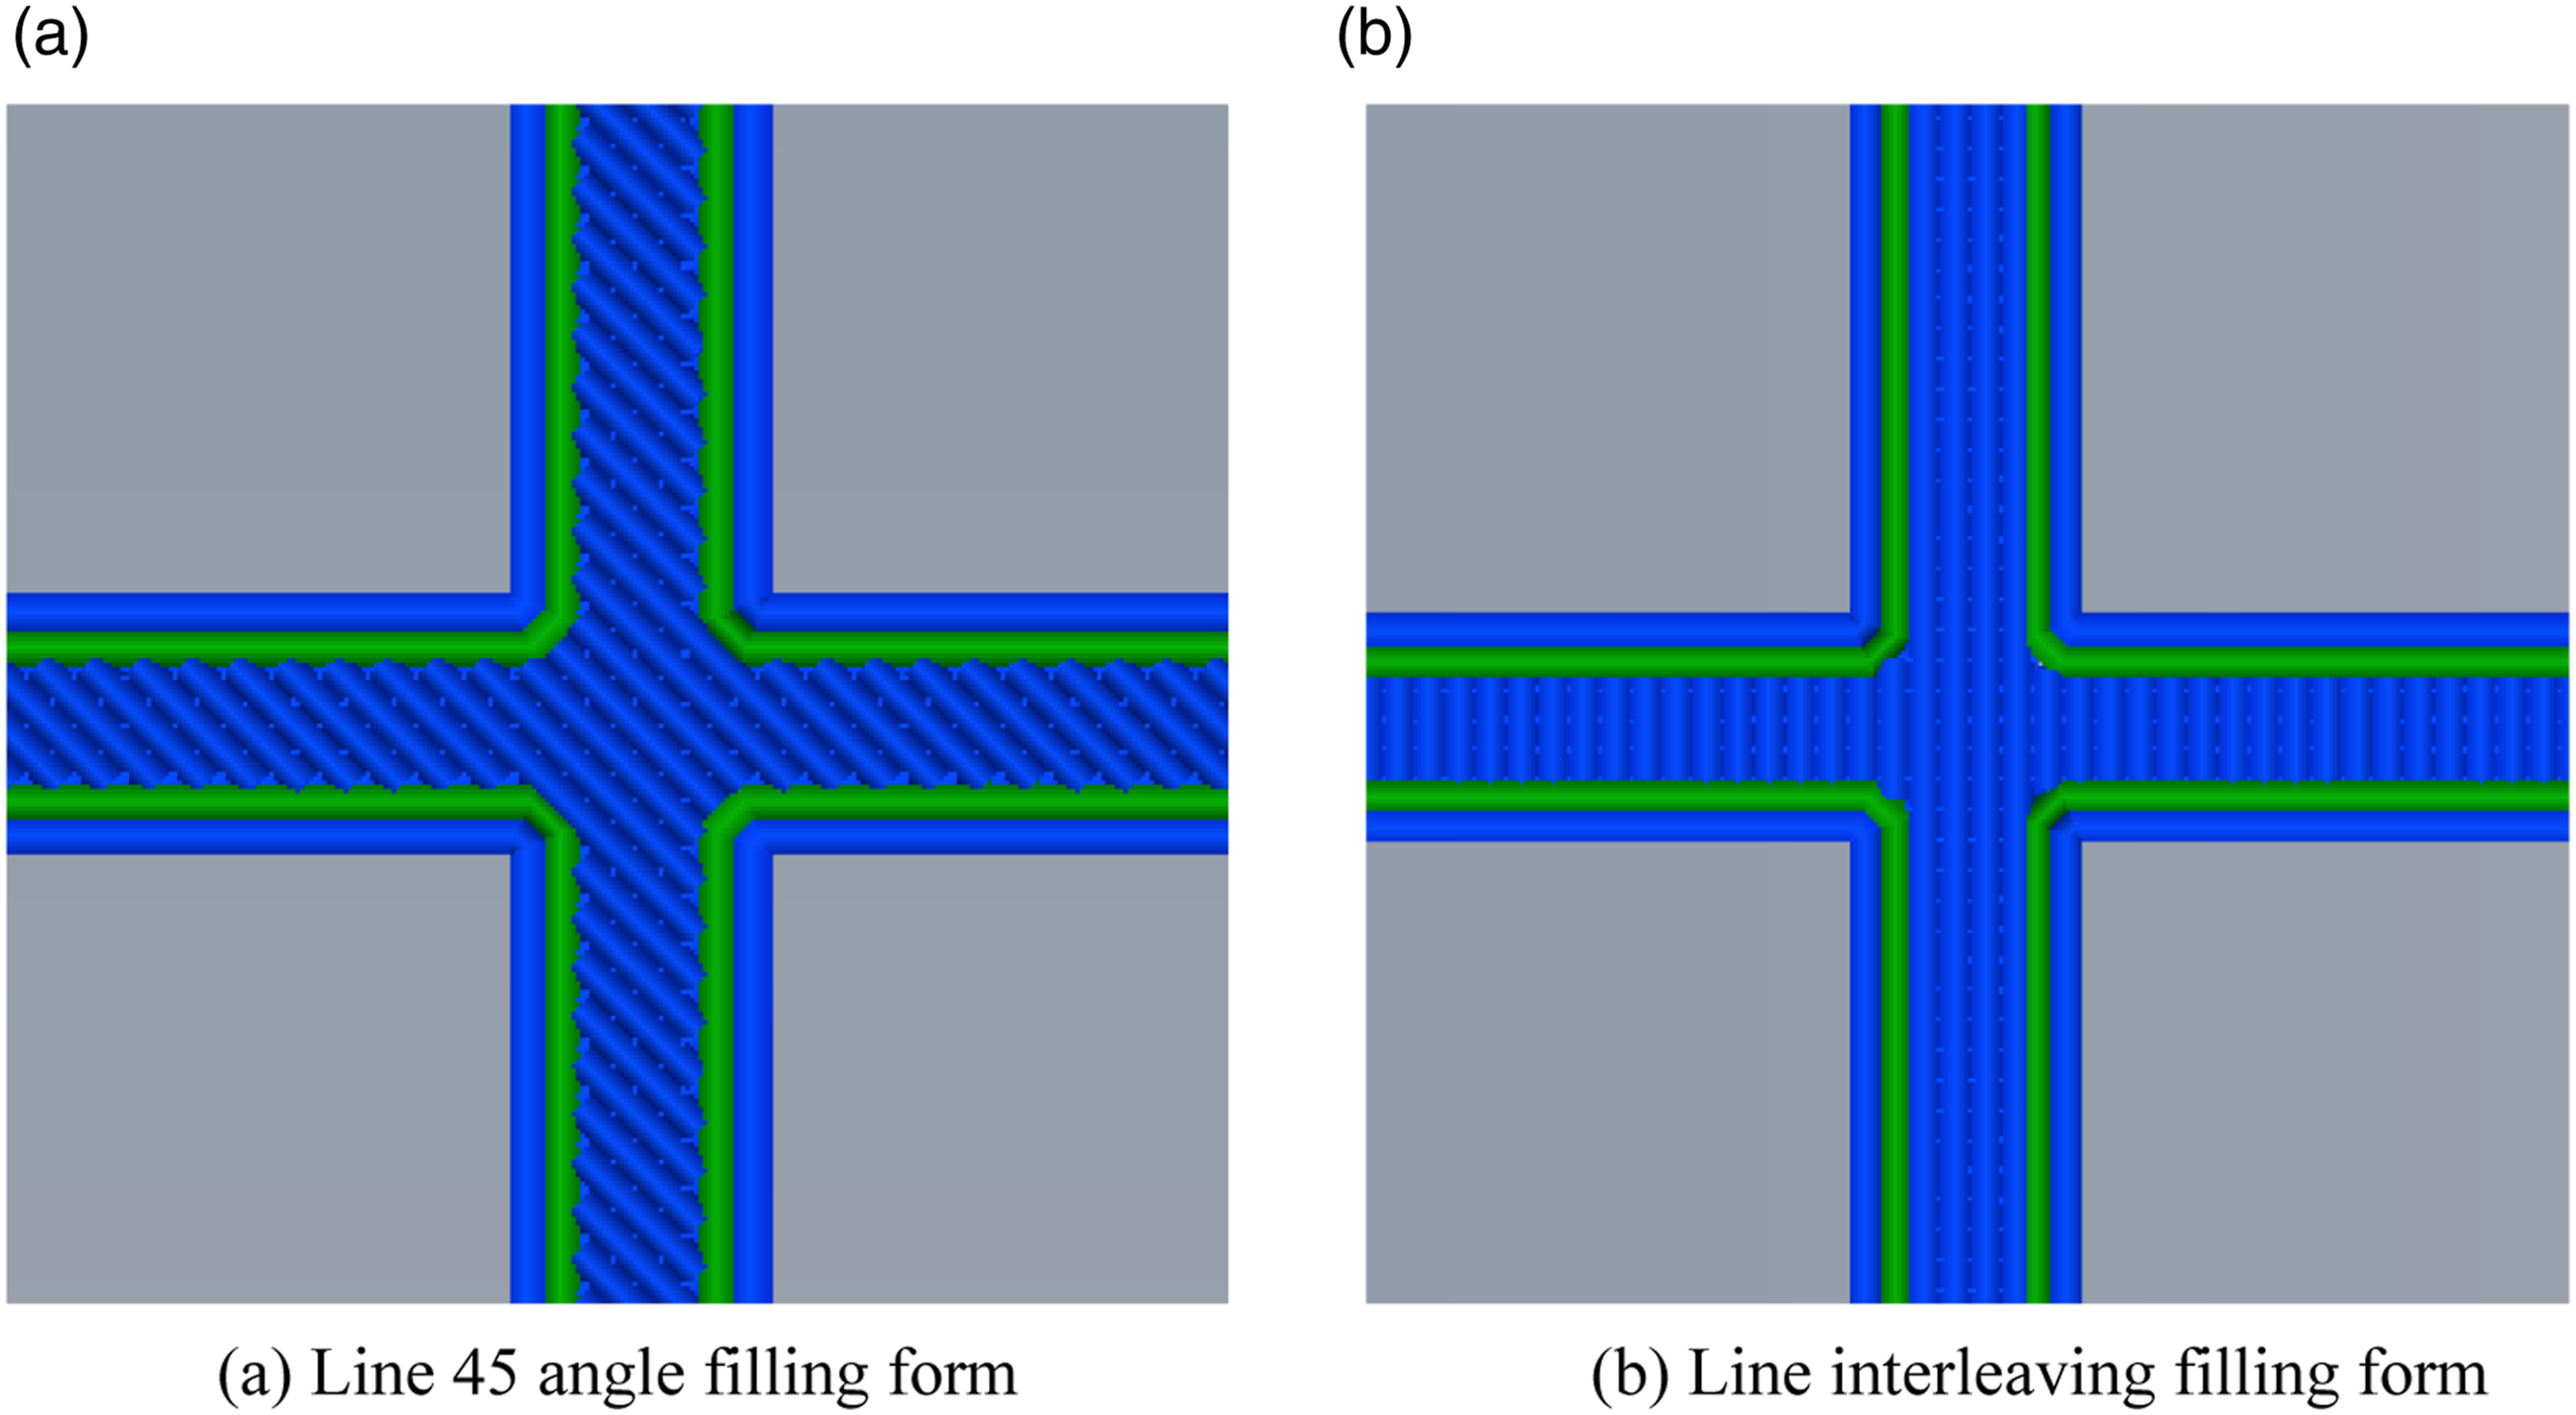
Calculation of test parameters
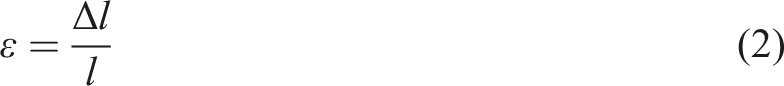
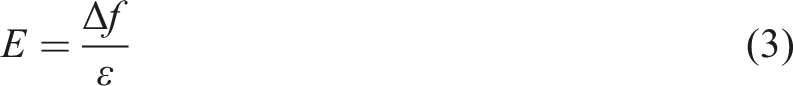
The tensile strength, elongation and tensile modulus of geogrid are the main performance indexes of its mechanical properties. Tensile strength refers to the tensile force that the material can bear per unit width, in kN·m−1. It is the most important performance index of geogrid in the reinforced cushion. The elongation of geogrid is expressed as a percentage of the original length. The tensile modulus represents the deformation resistance of geogrid in tension. The tensile strength, elongation and tensile modulus of geogrid are as follows.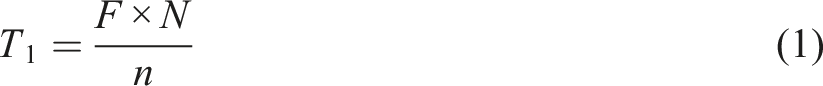
Results and discussion
Effect of different geogrid forms
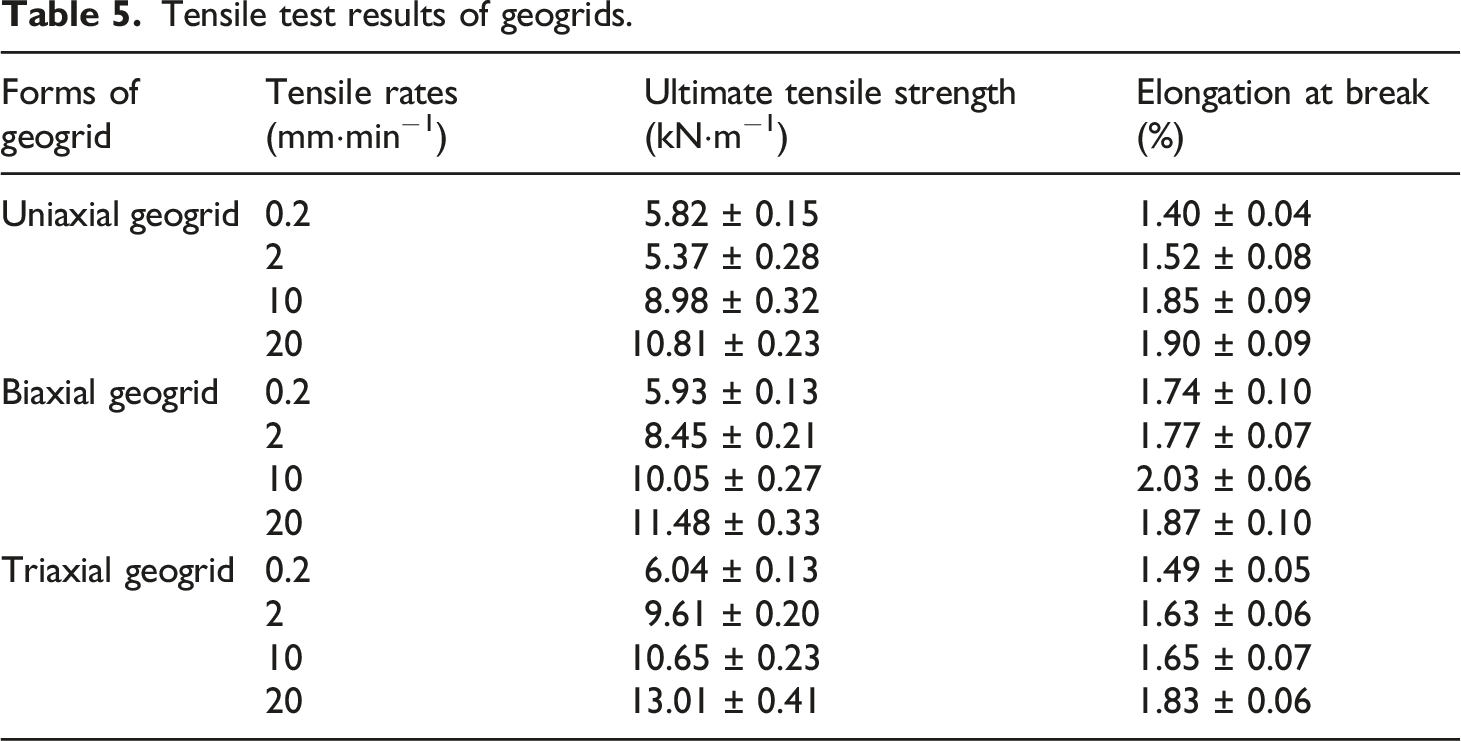
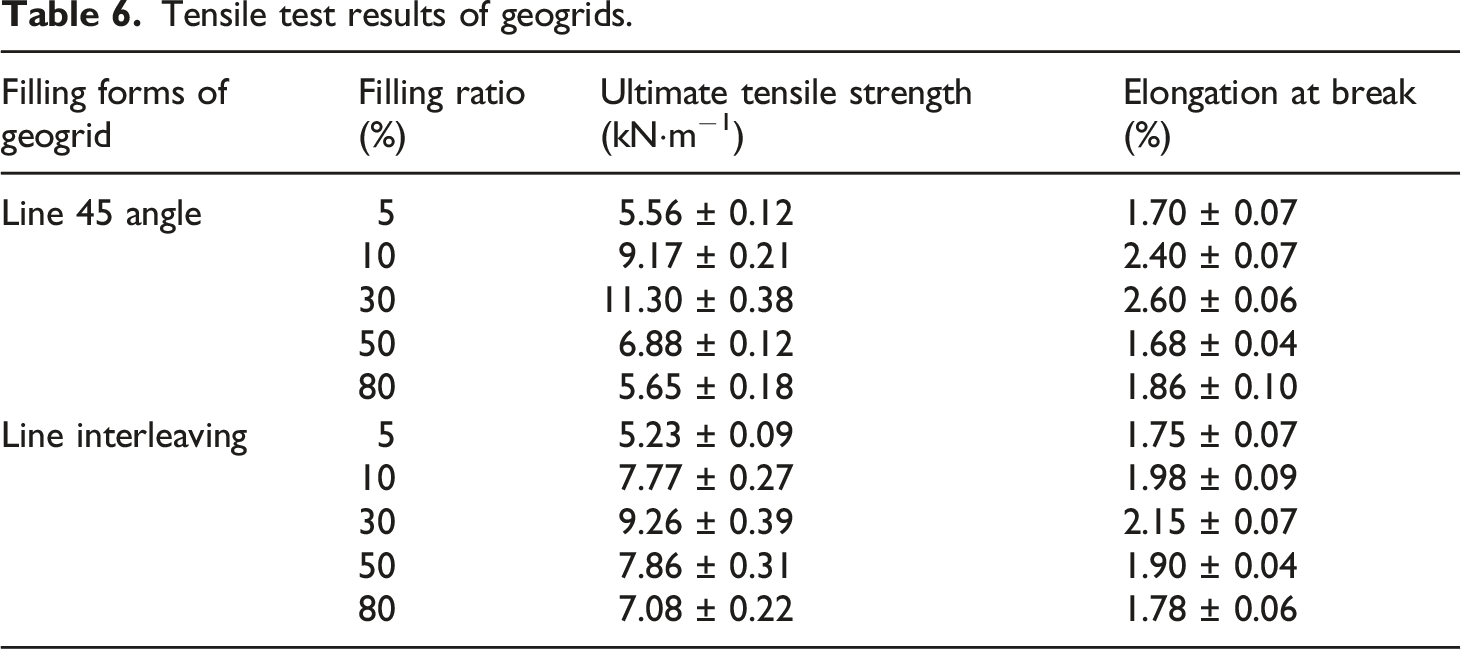
Tensile test results of geogrids.
Tensile force versus elongation curves for different forms of geogrids.
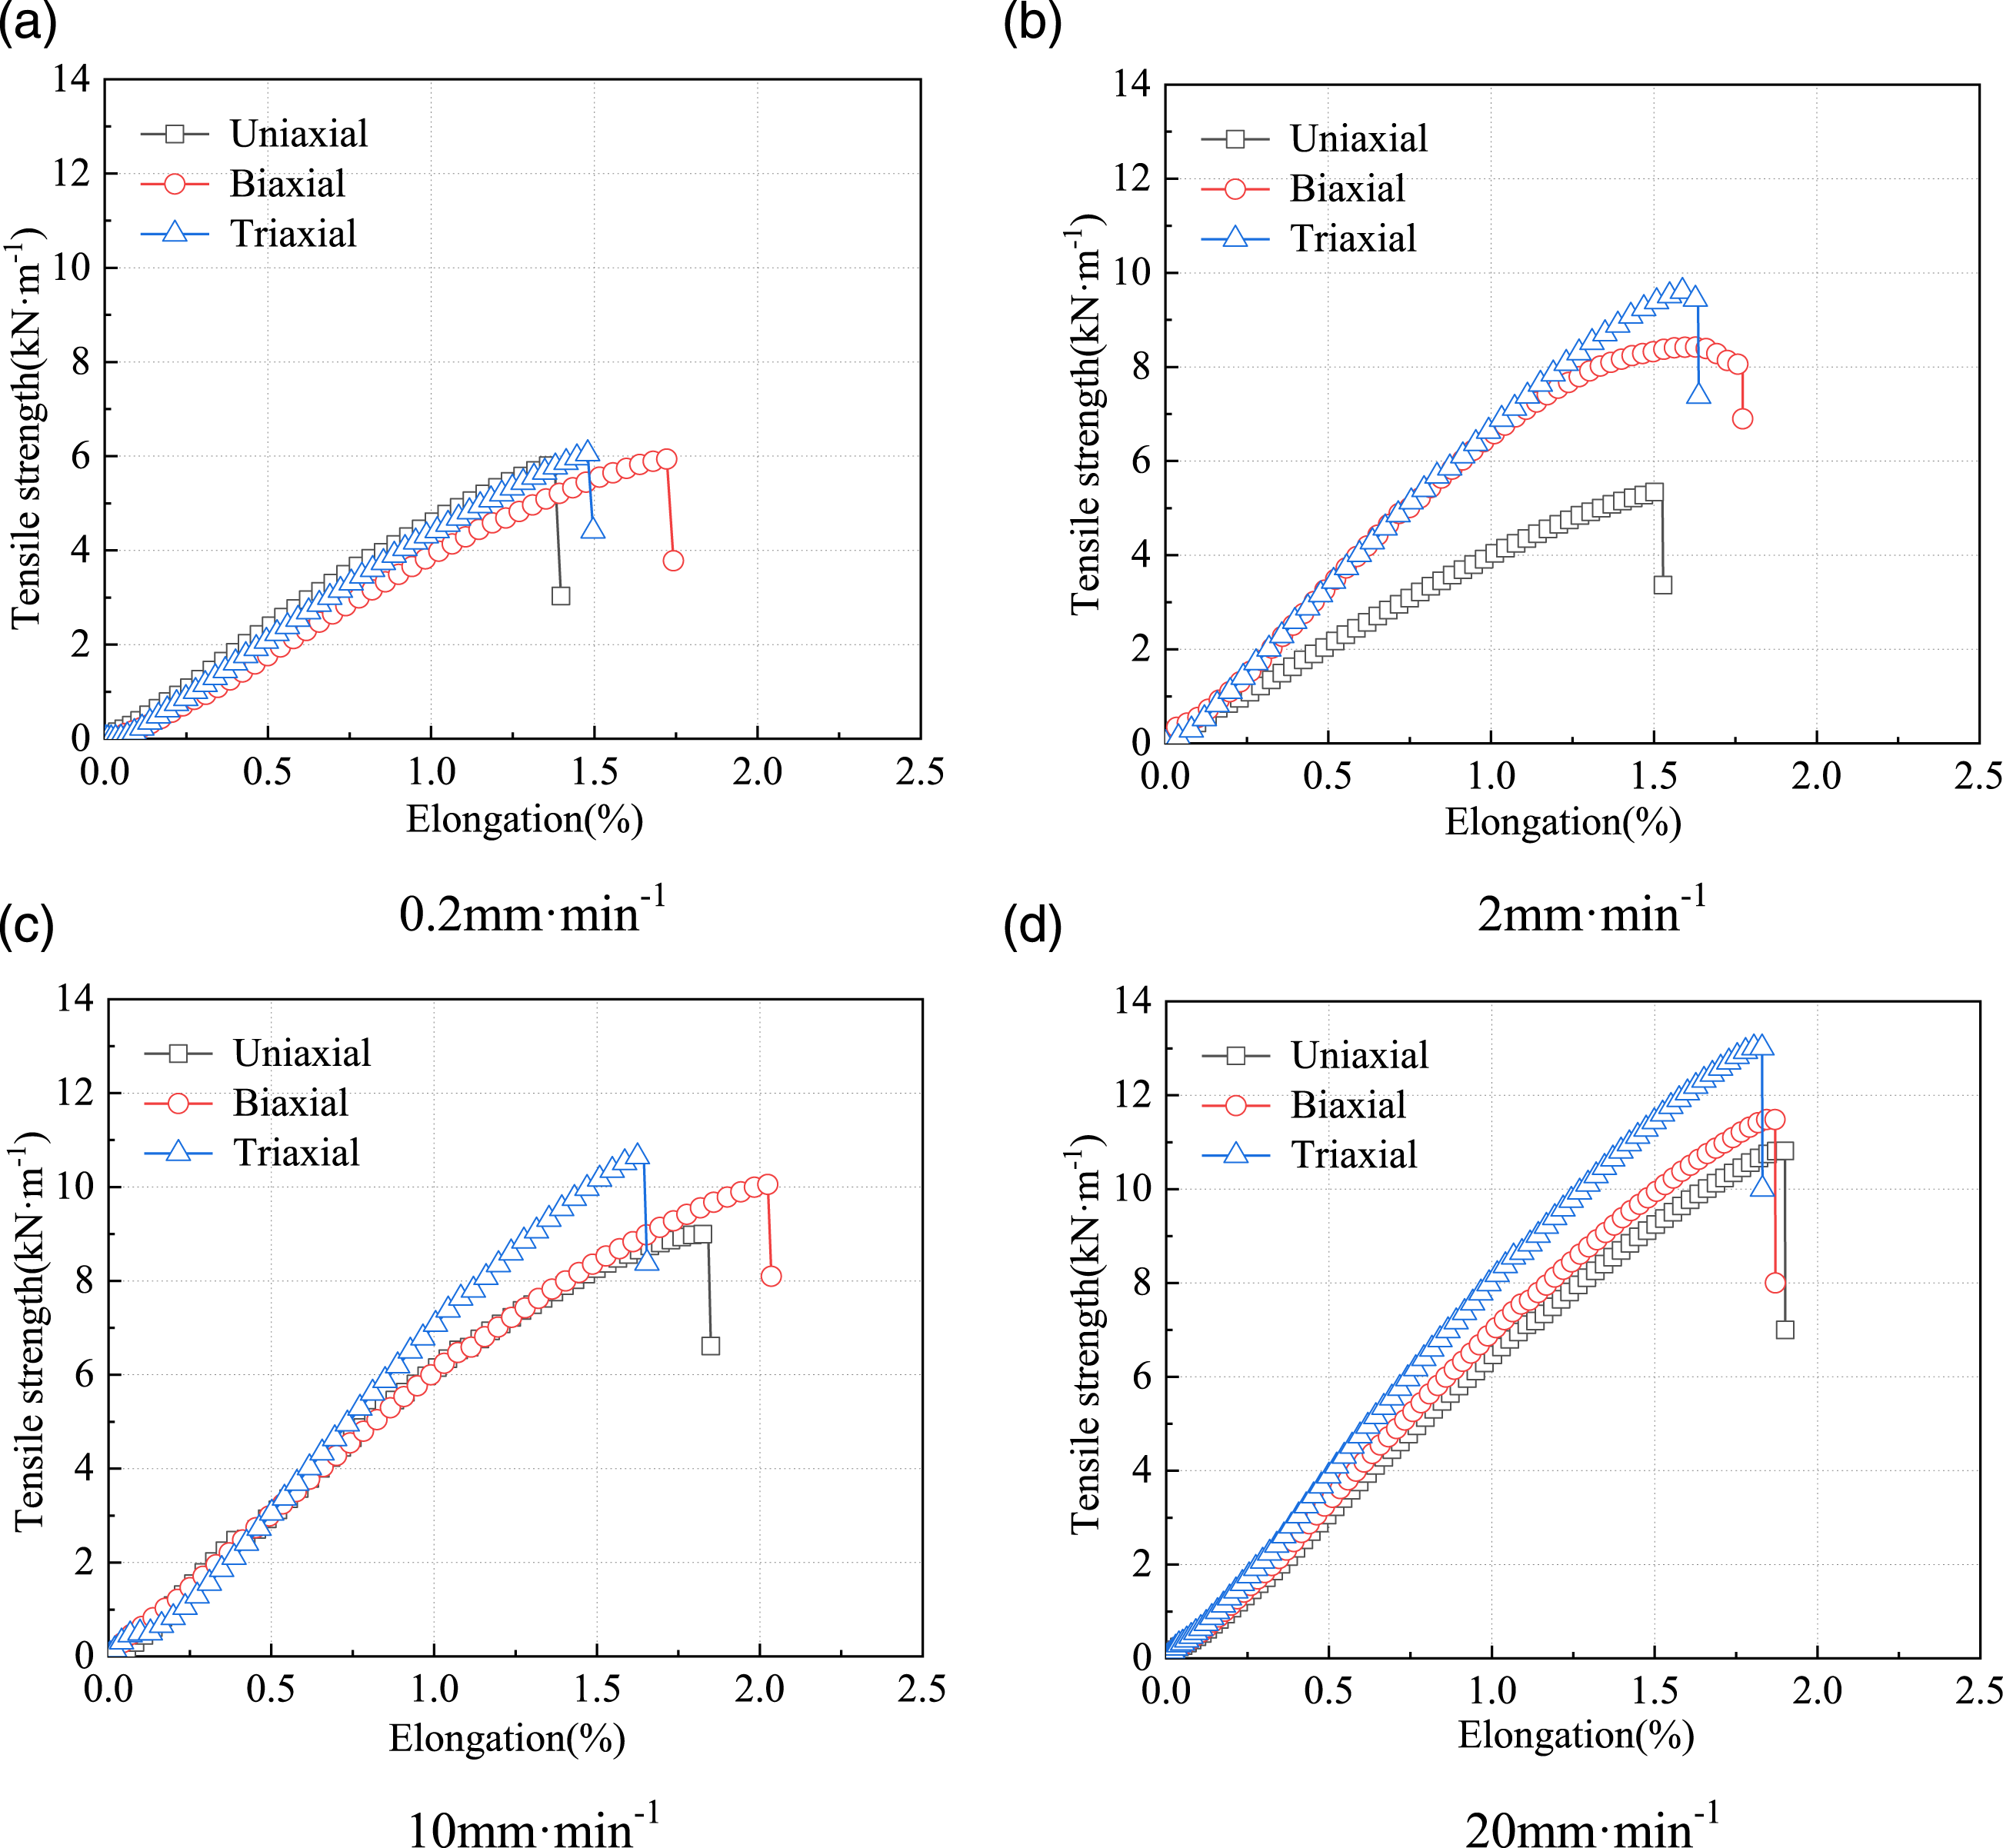
Figure 5 shows the variation curves of tensile strength versus elongation for the three forms of 3D printed geogrids under different tensile rates. From Figure 5, it can be seen that the mechanical properties of different forms of geogrids are widely disparate. The tensile strength versus elongation curves of the three different forms of geogrids decreased with the slope of the tangent line as the tensile test proceeded until the peak of tensile strength was reached, and finally, a brittle fracture occurred. When the tensile rate was 0.2 mm·min−1, the slope of the tensile force versus elongation curves of the three forms of geogrids did not differ significantly, with biaxial geogrids being slightly smaller than uniaxial geogrids and triaxial geogrids. In terms of tensile strength, the values of the three geogrids were approximate. In terms of elongation at break, uniaxial geogrids had the lowest elongation at break, while biaxial geogrids had the highest elongation at break. When the tensile rate was 2 mm·min−1, the slope of the tensile strength versus elongation curve was close for triaxial and biaxial geogrids, while the lowest for uniaxial geogrids, indicating that triaxial and biaxial geogrids have similar ability to withstand tensile strength, while uniaxial geogrids have the least ability to withstand tensile strength. In terms of tensile strength, the triaxial geogrid had the highest tensile strength, and the uniaxial geogrid had the lowest tensile strength. In terms of elongation at break, biaxial geogrids had the largest and uniaxial geogrids had the smallest. At the tensile rate of 10 mm·min−1, the slopes of the tangents of the tensile strength versus elongation curves of the three geogrids were close to each other in the early part of the tensile test and changed in the later part of the tensile test, which showed that the slopes of the triaxial geogrids were the largest, while the uniaxial geogrids and biaxial geogrids were closer. This indicates that at 10 mm·min−1, the triaxial geogrid has a greater ability to withstand tension, while the uniaxial geogrid and biaxial geogrid have a close ability to withstand tension. In terms of tensile strength, triaxial geogrids had the greatest tensile strength, while uniaxial geogrids had the least tensile strength. In terms of elongation at break, biaxial geogrids had the greatest, while triaxial geogrids had the least. At a tensile rate of 20 mm·min−1, there was a significant difference in the slopes of the tangents of the relationship curves between tensile force and elongation of the three forms of geogrids, which indicated that triaxial geogrids were the most capable of withstanding tensile forces and uniaxial geogrids the least. In terms of tensile strength. The tensile strength of triaxial geogrid was the largest, followed by biaxial geogrid, while the tensile strength of uniaxial geogrid was the smallest. In terms of elongation at break, it showed that uniaxial geogrid was the largest while triaxial geogrid was the smallest.
Effect of tensile rate
Figure 6(a) plots the scatter diagram of the change of ultimate tensile strength with the tensile rate under multiple groups of parallel tests and the curve of average ultimate tensile strength obtained from them, shows the relationship between ultimate tensile strength and tensile rate for different forms of geogrids. From Figure 6(a), it could be seen that the ultimate tensile strength of biaxial and triaxial geogrids increases with increasing tensile rates, which was also confirmed in Zheng et al.
36
While the ultimate tensile strength of uniaxial geogrids decreased and then increased with increasing tensile rates. This explained that the ultimate tensile strength of different geogrids was affected differently by the tensile rate. For uniaxial geogrids, there was a small decrease in the ultimate tensile strength of geogrids when the tensile rate was increased from 0.2 mm·min−1–2 mm·min−1, reaching a mean value of 7.73%. When the tensile rate increased from 2 mm·min−1–20 mm·min−1, the ultimate tensile strength of the geogrid increased significantly, with a mean value of 101.3%. The ultimate tensile strengths of both biaxial and triaxial geogrids increased significantly with the increase of the tensile rate. Among them, the ultimate tensile strength of biaxial geogrid and triaxial geogrid increased the most when the tensile rate increased from 0.2 mm·min−1–2 mm·min−1, with mean values reaching 57.24% and 78.61%, respectively. At tensile rates greater than 2 mm·min-1, the change in ultimate tensile strength values of geogrids increased almost linearly with the increase in tensile rate, with mean values reaching 35.86% and 35.38%, respectively. Tensile rate curves for three forms of geogrids.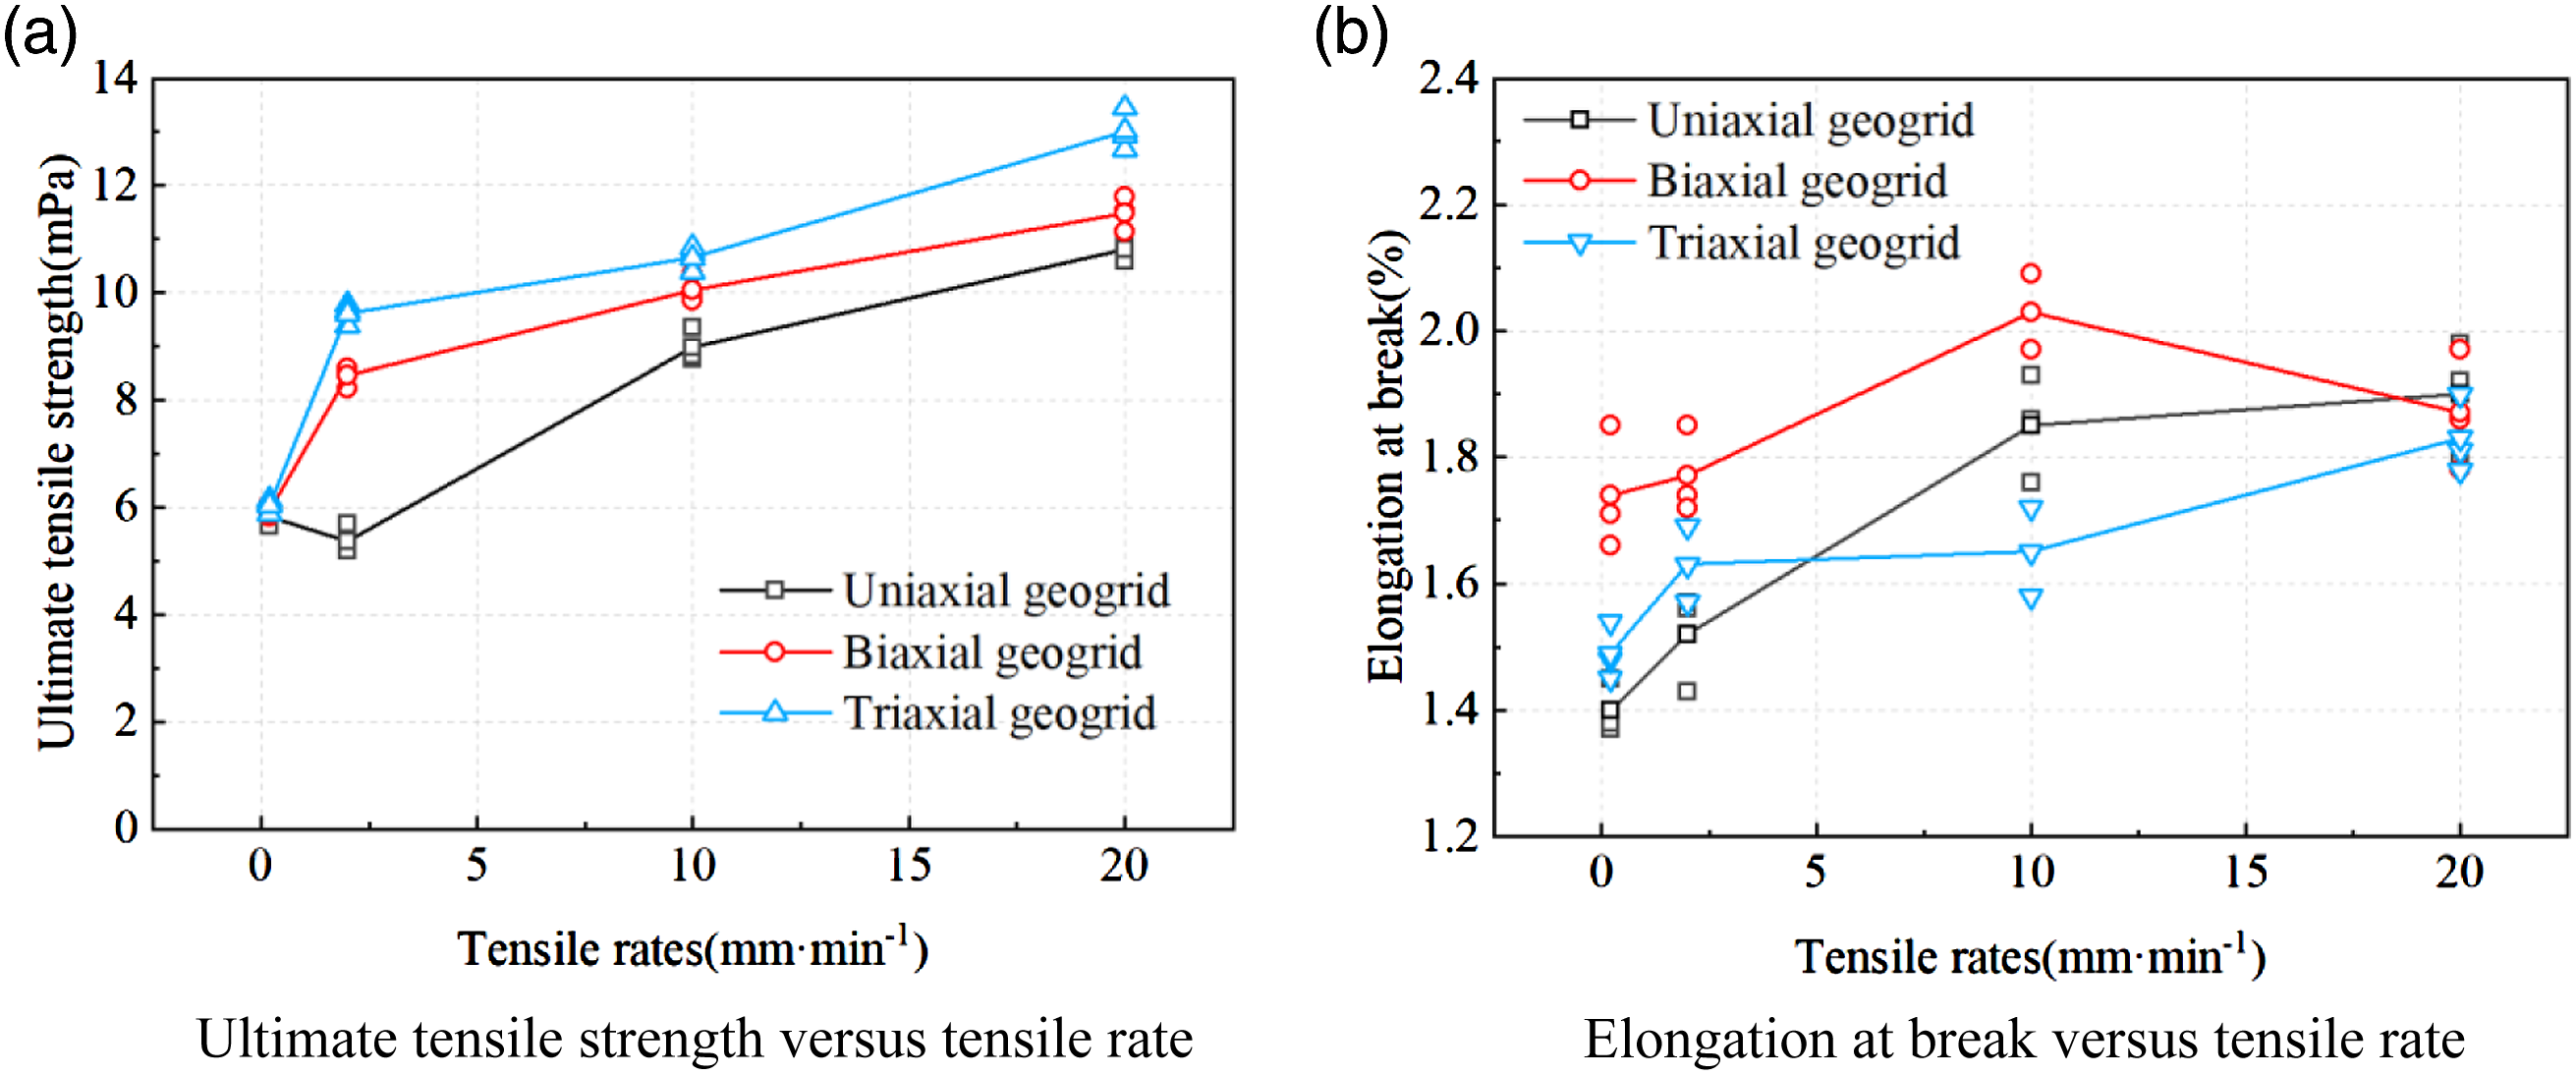
Figure 6(b) plots the scatter diagram of the change of elongation at break with the tensile rate under multiple groups of parallel tests and the average elongation at break curve obtained from them, shows the relationship between elongation at break and tensile rate for the different forms of geogrid. It could be seen from Figure 6(b) that as the tensile rates increase, the elongation at the break corresponding to uniaxial and triaxial geogrids increased, while the elongation at break for biaxial geogrids first increased and then decreased. This indicated that the tensile rates had different effects on the elongation at break of different forms of geogrids. When the tensile rates were less than 10 mm·min−1, the elongation at break of uniaxial, biaxial and triaxial geogrids tended to increase with the increase in tensile rates, with the average values reaching 32.14%, 17.17% and 10%, respectively. When the tensile rates were greater than 10 mm·min−1, the elongation at break of uniaxial and triaxial geogrids increased with the increase in tensile rates, with the average values reaching 2.72% and 12.13%, respectively, while the biaxial geogrids showed a decreasing trend, with the average value reaching 9.76%. When the tensile rates were less than 5 mm·min−1, it could be seen that the elongation at the break of geogrids is biaxial geogrids > triaxial geogrids > uniaxial geogrids. When the tensile rates were greater than 5 mm·min−1 and less than 18.72 mm·min−1, the elongation at the break of the geogrid was biaxial geogrid > uniaxial geogrid > triaxial geogrid. At a tensile rate of 20 mm·min−1, the elongation at break was greatest for uniaxial geogrids and least for triaxial geogrids, which once again illustrated the large effect of tensile rate on the mechanical properties of geogrids.
In summary, it could be seen that the mechanical properties of geogrid tensile are the best when the tensile rate is 20 mm·min−1. which conformed to the tensile rates specified in SL-235-2012 “Specification for test and measurement of geosynthetics."
Effect of consumable filling parameters
Tensile test results of geogrids.
Tensile strength curves at different fill rates.
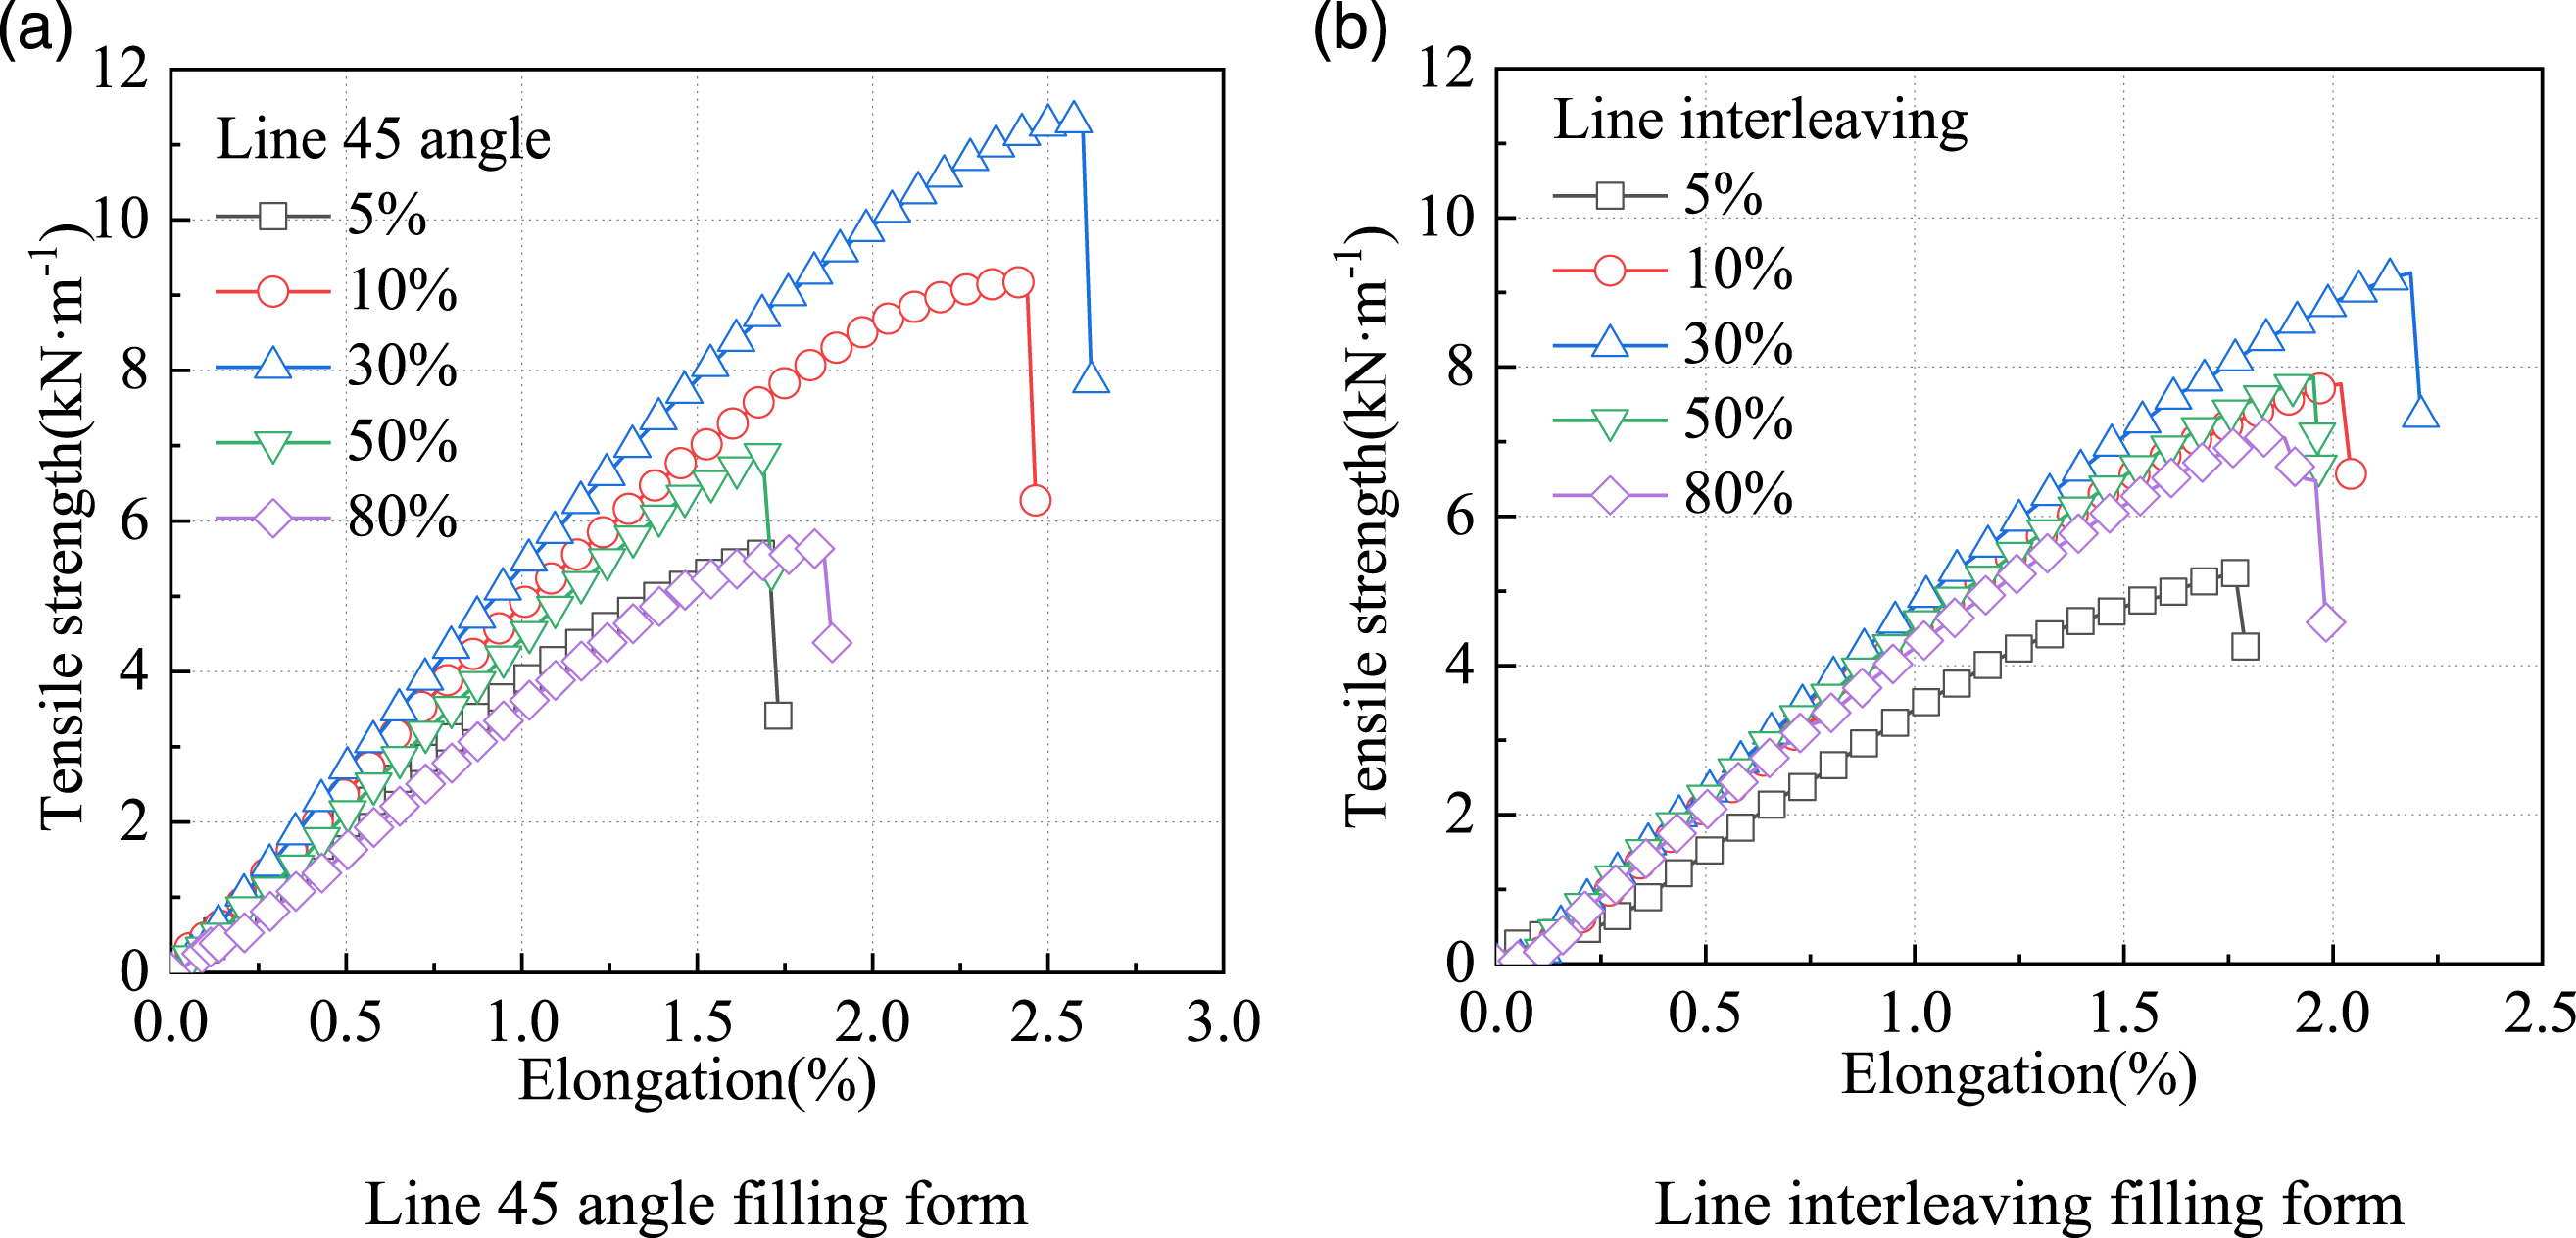
Figure 8(a) plots the scatter diagram of the change of ultimate tensile strength with the filling ratio under multiple groups of parallel tests and the curve of average ultimate tensile strength obtained from them, shows the variation curve of the ultimate tensile strength of the geogrids obtained from the two filling forms with the filling ratios. It could be seen that the ultimate tensile strength of the geogrids printed by both the line 45 angle filling form and the line interleaving filling form increased and then decreased with the increase in filling ratios. As the filling ratios increased from 5% to 30%, the ultimate tensile strength of the geogrid printed by both filling forms increased, reaching an average value of 103.12% and 77.32%, respectively. The ultimate tensile strength of the geogrids printed by both filling methods decreased when the filling ratios were increased from 30% to 80%, with mean values reaching 50.36% and 24.37%, respectively. The results indicated that the ultimate tensile strength of the geogrids did not increase with increasing filling ratios, but there existed an optimum filling ratios value that maximized the ultimate tensile strength of the specimens. It could be seen that at filling ratios below 30%, the ultimate tensile strength of the geogrids obtained by printing the line 45 angle filling form is higher than the line interleaving filling form, which indicated that the line 45 angle filling form could significantly increase the ultimate tensile strength of the specimen at lower filling ratios. At filling ratios above 50%, the ultimate tensile strength of the geogrids printed in the line interleaving filling form is higher than that of the line 45 angle form, which indicated that at higher filling ratios, the line interleaving filling form could significantly increase the ultimate tensile strength of the specimen. Tensile strength and elongation at break versus filling ratios for different filling forms.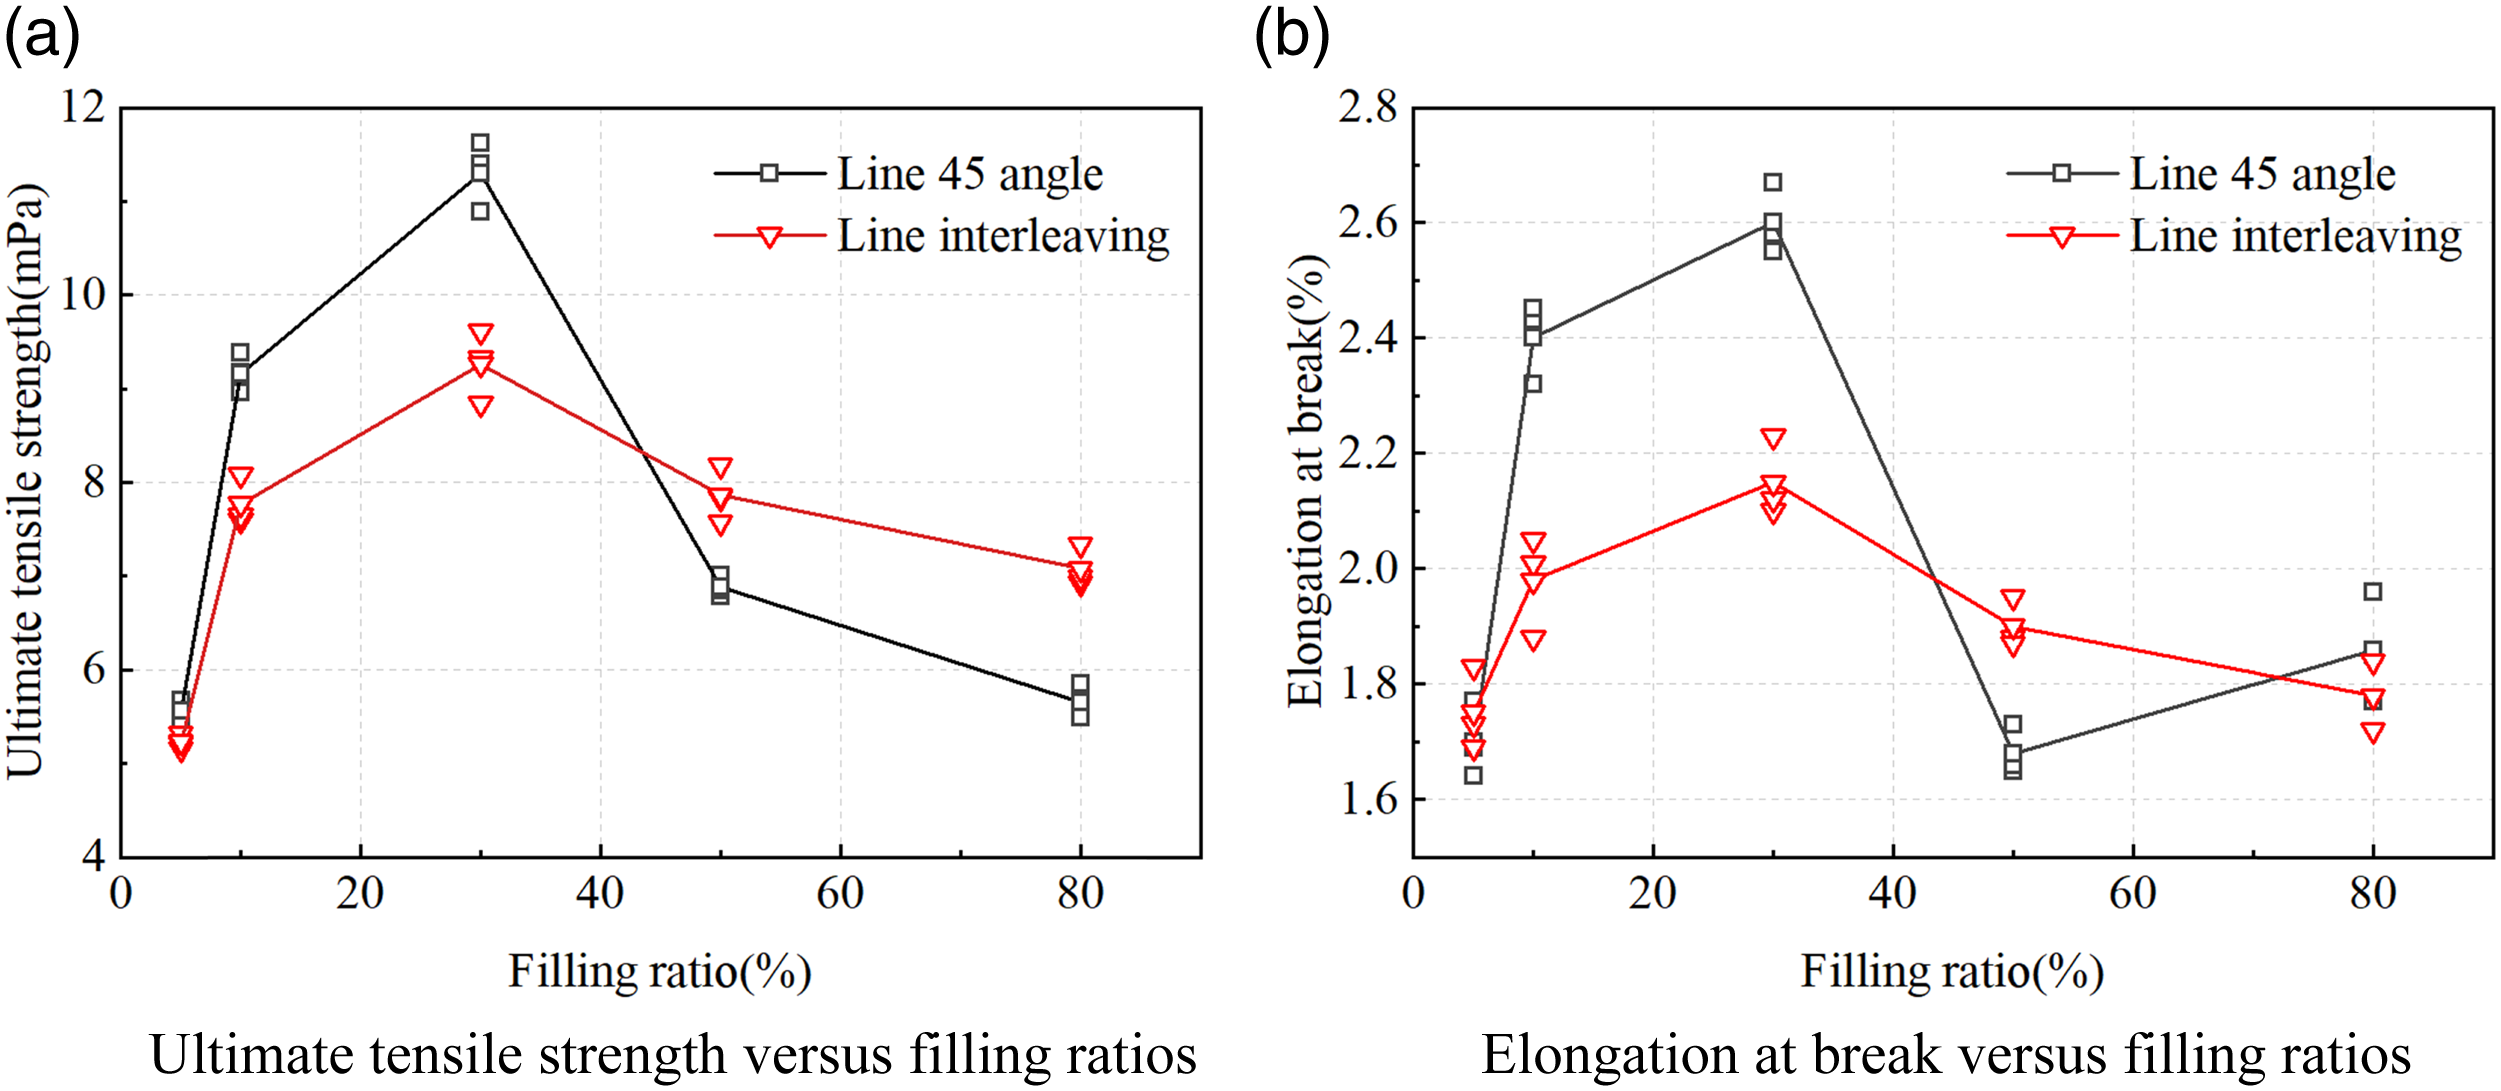
Figure 8(b) plots the scatter diagram of the change of elongation at break with the filling ratio under multiple groups of parallel tests and the average elongation at break curve obtained from them, shows the variation curve of elongation at break with filling ratios for the two filling methods. It can be seen that the elongation at break of the geogrid printed with the line 45 angle filling method increased, then decreased and finally increased as the filling ratios increased. The increase in elongation at the break for geogrids printed by the line 45 angle filling form was greatest when the filling ratios increased from 5% to 10%, with an average value of 41.18%, which illustrated that increasing the filling ratios in this range could significantly increase the tensile capacity of the geogrid. When the filling ratios were increased from 30% to 50%, the reduction in elongation at the break of the geogrid was greatest, reaching an average value of 34.62%, which indicated that increasing the filling ratio after the filling ratios exceeded 30% severely reduced the tensile capacity of the geogrid. It could be seen that the elongation at the break of the geogrids printed by the line interleaving filling increase and then decrease as the filling ratio increase. The greatest increase in elongation at the break for geogrids printed by the line interleaving form occurred when the filling ratios were increased from 5% to 10%, with an average value of 12.5%, which indicated that increasing the filling ratio in this range could significantly improve the elongation performance of the geogrid. Increasing the filling ratio from 30% to 50% resulted in a greater reduction in elongation at the break for the geogrids, with an average value of 11.63%, which showed that increasing the filling ratios after the filling ratios exceeded 30% could seriously reduce the ductility of the geogrid. It could be seen that there was an optimum value for the elongation at break in the model and that the elongation at break did not decrease gradually with increasing filling ratios. When the filling ratios of the consumables were below 30%, the elongation at break of the specimens printed in the line 45 angle filling the form was higher than that of the specimens printed in the line interleaving filling, which indicated that at lower filling ratios, the geogrid could be printed in the line 45 angle filling form to improve the ductility of the geogrid.
In summary, it could be seen that the mechanical properties of 3D printed geogrids were optimal when the filling ratio was 30% and the filling form was line 45 angle.
Failure mode analysis
The damaged parts of uniaxial geogrids and biaxial geogrids mostly occurred at the connection between rib and node. When the unidirectional geogrids were damaged, the rib will break or even fall. This was because the number of transverse ribs of uniaxial geogrid was small, resulting in insufficient restraint of transverse ribs on longitudinal ribs. Most of the triaxial geogrids were damaged at the joints, and the fracture was neat. As shown in Figure 9. The results showed that the weak link in the tensile process of uniaxial geogrids and biaxial geogrids were the connection between ribs and nodes, which was consistent with the conclusion of Zhou et al. The strength of the connection between the rib and the node had a great impact on the overall tensile capacity of uniaxial geogrids and biaxial geogrids, while the strength of the triaxial geogrid node had a great impact on the tensile capacity of the geogrid. The failure places of the three geogrids were relatively clean without many burrs and fibers, which also reflected that the three geogrids are brittle failures. Changes in tensile rates and changes in printing parameters did not have a large effect on the damage form of geogrids, which was mainly influenced by the material and specimen structure. Geogrid damage after tensile tests.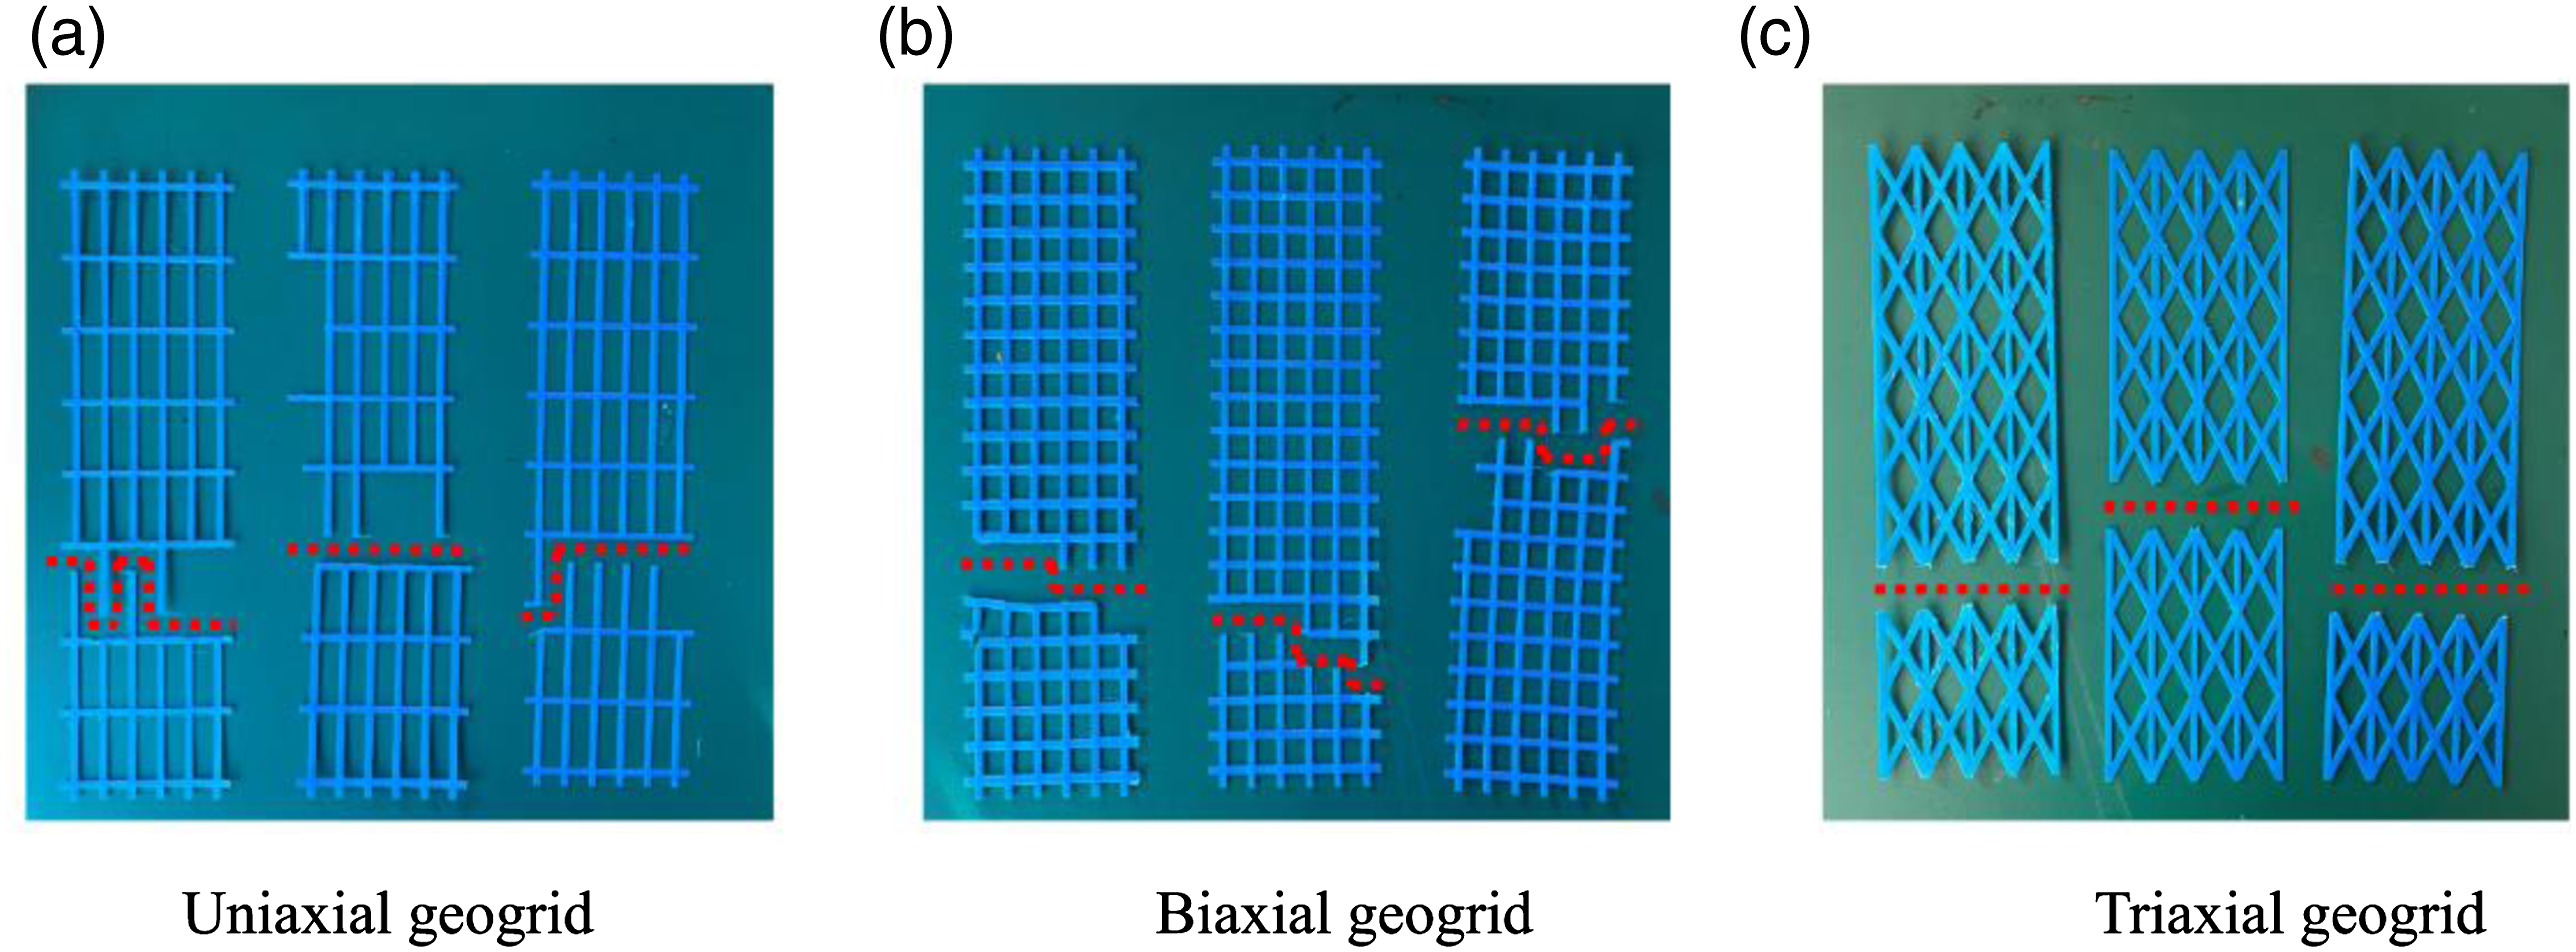
Regression analysis
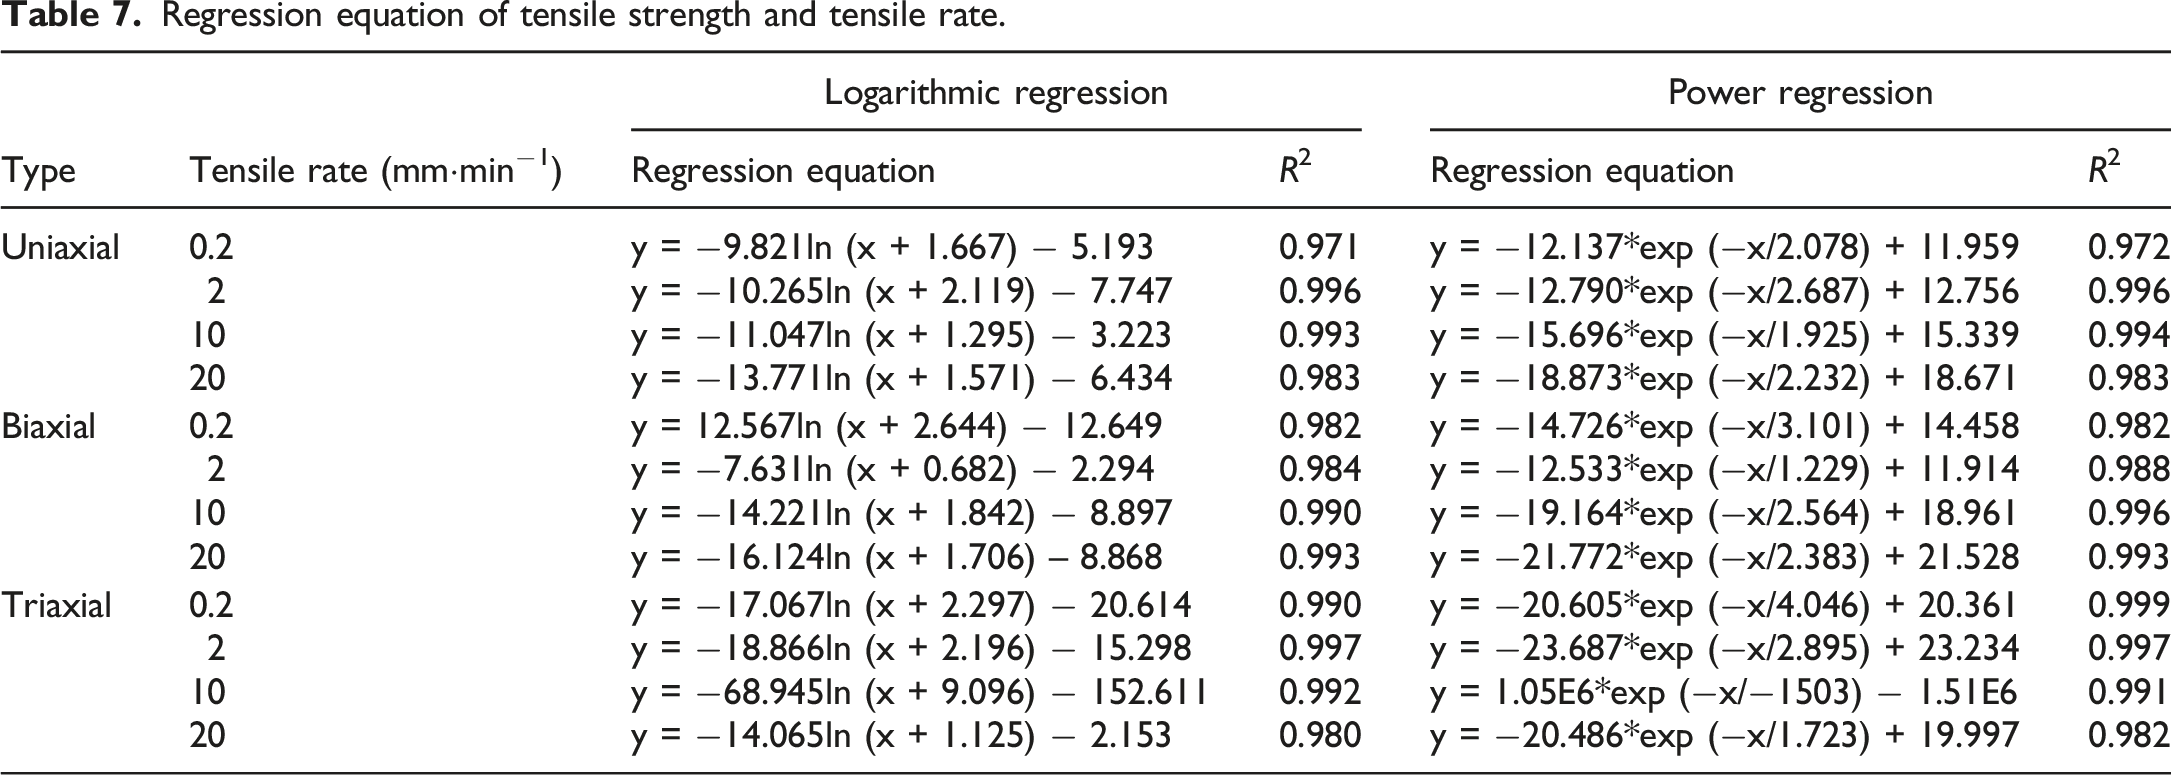
Regression equation of tensile strength and tensile rate.
Stress analysis of joints
To further study the tensile mechanism of geogrid, it was known that the factors affecting the different damage modes of geogrids were mainly the forms of geogrids according to the test results. In this paper, the nodes of three different forms of geogrid were studied for the force analysis, showed in Figure 10. The difference in geometry between uniaxial and biaxial geogrids was that the former had transverse ribs perpendicular to the direction of tension. During tension, the longitudinal ribs were subjected to forces, and then they transferred the forces to the nodes. However, for biaxial geogrids, the nodes will be subjected to the bonding force Stress diagram of different types of geogrid joints.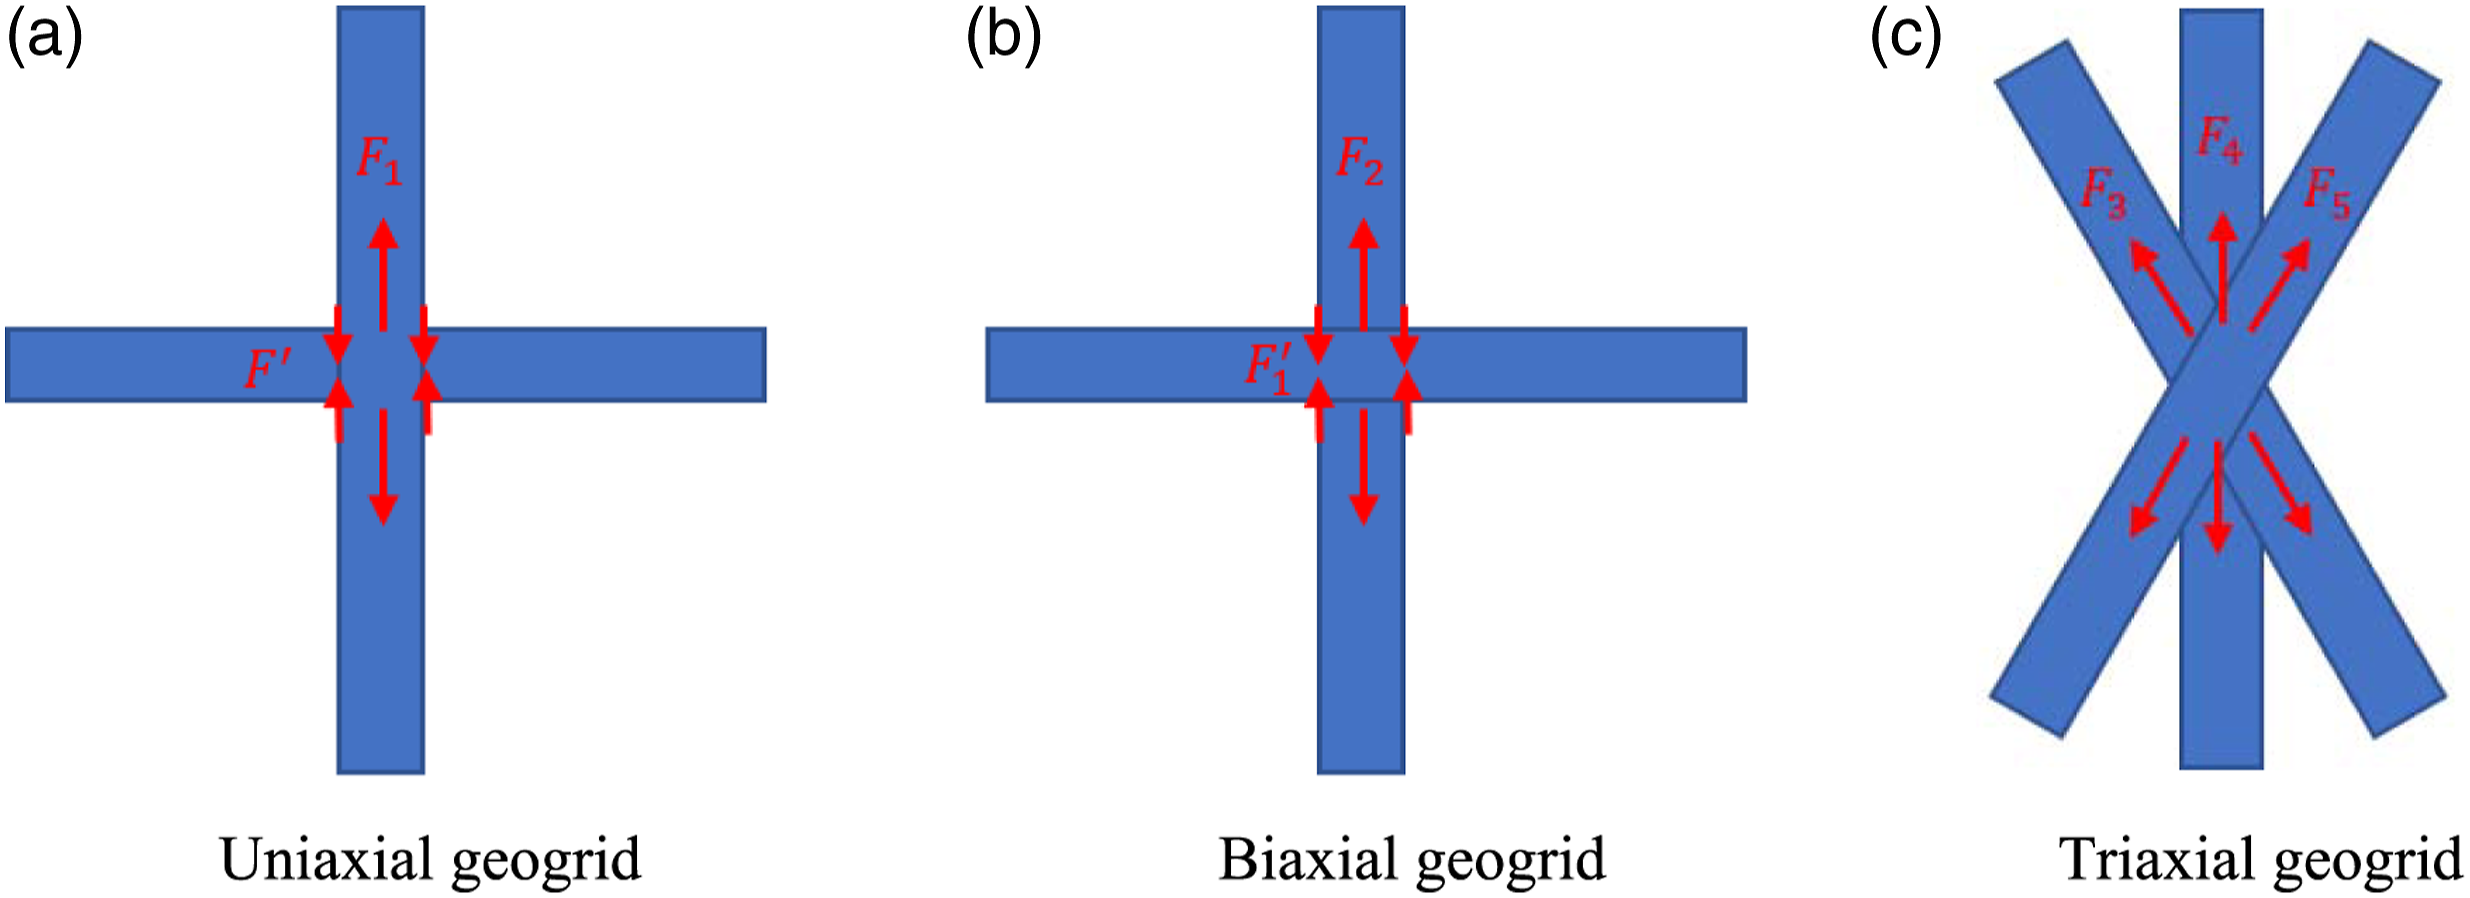
In the uniaxial geogrid, due to the small number of transverse ribs and ignoring the influence of bonding force, and there were six longitudinal ribs in total, the theoretical stress of each longitudinal rib was calculated as follows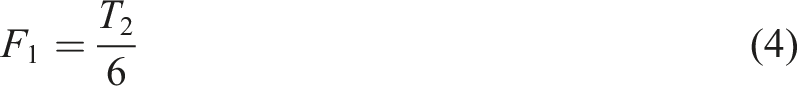
Compared with the uniaxial geogrid, the biaxial geogrid had more transverse ribs, which formed a dense network structure, so that the whole geogrid was more difficult to damaged and had a stronger bearing capacity, which was consistent with the previous test results. The theoretical stress relationship of each longitudinal rib shall meet the following requirements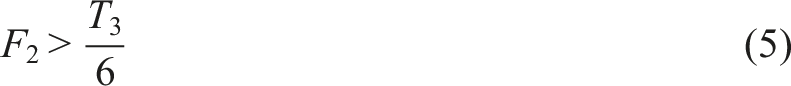
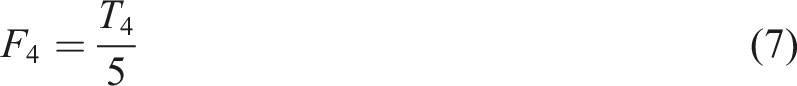
In the triaxial geogrid, there were six ribs connected at each node. In the tensile direction, the tensile force could be divided into three force components on the same side and the same three force components on the other side. In the tensile process, the nodes were studied, and it could be seen that the forces on both sides of the nodes are equal along the tensile direction. However, the nodes of the triaxial geogrid were not connected by transverse ribs. With the increase of the force, the joint was damaged when the stresses reached their peak. After calculation, the theoretical forces of the three ribs on one side of the joint were

As can be seen from equations (4), and (6)–(8), suppose
Conclusion
In this paper, tensile tests were conducted on three different forms of 3D printed geogrids at different tensile rates to investigate the effects of tensile rates and filling parameters on the mechanical properties of the three forms and discuss the tensile failure mechanism of geogrids. The following conclusions are drawn:
1) At the same tensile rate, the maximum tensile strength of triaxial geogrid was generally greater than that of biaxial geogrid, while the maximum tensile strength of biaxial geogrid was generally greater than that of uniaxial geogrid. When the tensile rates were lower than 2 mm·min−1, the elongation at break of biaxial geogrid was the largest, and the elongation at break of uniaxial geogrid was the smallest. When the tensile rate is 10 mm·min−1, the elongation at the break of biaxial geogrid was the largest and the elongation at the break of triaxial geogrid was the smallest. The elongation at the break of uniaxial geogrids was the largest, and the elongation at the break of triaxial geogrids was the smallest when the tensile rate was 20 mm·min−1.
2) As the tensile rate increased, the maximum tensile strength of biaxial and triaxial geogrids gradually increased, and the maximum tensile strength of uniaxial geogrids first decreased and then increased. With the increase of tensile rates, the elongation at the break of uniaxial and triaxial geogrids gradually increased, and the elongation at the break of biaxial geogrids first increased and then decreased. After comparison, the mechanical properties of 3D printed geogrids were optimal at the tensile rate of 20 mm·min−1.
3) As the filling ratio of geogrid increased, the tensile strength corresponding to the geogrid first increased and then decreased. As the filling ratio of geogrids increased, the tensile strength corresponding to the geogrid printed in the line 45 degree method first increased, then decreased and finally increased. The tensile strength corresponding to the geogrid printed by line interleaving first increased and then decreased. After comparison, it was concluded that the mechanical properties of 3D printed geogrids were optimal when the fill rate was 30% and the filling form was line 45 angle.
4) Line 45 angle filling method was more obvious to improve the tensile strength of geogrid in the form of less than 30% filling ratios, while in the case of more than 50% filling ratios, line interleaving filling was more than enough to improve the tensile strength of geogrid. At a filling ratio of less than 30%, the line 45 angle filling method improved the elongation of the geogrid more obviously, while at a filling ratio of 50%, the line interleaving filling could improve the elongation of the geogrid more than enough, and when the filling ratio is 80%, the line 45 angle filling method showed more than enough to improve the elongation of the geogrid.