
Abstract
Following the emergence of new morphology geogrids, tensile tests on some of the new morphology geogrids were conducted in this paper for practical engineering options. The study focuses on the tensile testing of 3D printed geogrids to analyze the effects of morphology differences (material, planar structure, filling rate, rib width and rib height) on the tensile properties of geogrids. The test results show that the tensile properties of high density polyethylene geogrids are stronger than those of polylactic acid geogrids. Increasing the filling rate of geogrid can increase the tensile performance while decreasing the rate of tensile performance improvement. In contrast to the elongation at the break of the geogrid, the maximum tensile strength and the maximum tensile modulus increase in the order of bidirectional, triaxial and quadaxial geogrids. When the rib width and the rib height increase by the same amount, the rib height increases the maximum tensile strength of the geogrid more than that of the rib width.
Introduction
Geogrids are widely used in practical projects such as foundations and roads because of their better soil strengthening effect, lower price and construction ease.1–5 As such projects are subjected to loads, they often result in tensile forces on the geogrid inside the project.6–9 Therefore, the tensile properties of geogrids become an important indicator of the effectiveness of geogrid strengthening projects. 10
Currently, the most common test method for the tensile properties of geogrids is the indoor tensile test. In terms of geogrid tensile tests, the existing literature mostly analyzes the effects of tensile medium,11–15 tensile rate16,17 and different ambient temperatures18–20 on the tensile properties of geogrids. Balakrishnan and Viswanadham 21 found that the tensile load-strain behaviour of geogrids improved, and their tensile stiffness increased by a maximum of 2.42 times after tensile tests on geogrids inside the soil. Hegazy et al. 22 analyzed the difference in tensile properties of single-rib and multi-rib geogrids at different tensile rates through geogrid tensile tests. Chantachot et al. 23 evaluated the effect of ambient temperature on the load-strain-time behavior of geogrids using tensile tests. Shokr et al. 24 performed several tensile tests on glass fibre geogrids at different temperatures and obtained that the ultimate tensile strength and the elasticity modulus of geogrids increased by about 24% when the temperature was reduced from 20°C to −30°C.
Additional studies have pointed out that the geogrid material24–26 and the geogrid planar structure27,28 also affect their tensile properties. Shinoda and Bathurst 25 performed tensile tests on geogrids of three materials and found that under large strain conditions, compared to PET (polyethylene terephthalate) geogrids, PP (polypropylene) and HDPE geogrids experience larger transverse strains. The test results also showed that PP geogrids exhibit significantly higher axial and transverse strain breakage fractures. In addition, it was determined that the tensile stiffness and maximum tensile strength of PP and HDPE geogrids increased with the rate of change. Gao, Zhang, et al. 29 conducted tensile tests on geogrids made of four materials (PLA (polylactic acid), PLA/CF (carbon fiber reinforced polylactic acid), TPU (thermoplastic polyurethanes), and fiberglass). The results showed that the tensile strength of PLA/FAC and PLA geogrids decreased with increasing temperature, while the glass fibre and TPU geogrids increased with increasing temperature. Dong et al. 27 performed the tensile tests and the numerical simulation on the biaxial and triaxial geogrids. The results showed that triaxial geogrids’ tensile stiffness and strength distribution were more uniform than the biaxial geogrids. Castelli et al. 28 found that the tensile strength stiffness was maximum in the 0° and 90° directions (longitudinal and transverse ribs), and the tensile strength and stiffness were minimum in the 45° direction using the tensile test of bidirectional geogrids at different angles.
Although many articles have studied the effects of many factors on the tensile properties of geogrids, it is a pity that the existing studies have paid little attention to the effects of the changes in multiple morphological parameters on the tensile properties of geogrids. Therefore, this paper conducted a series of tensile tests on geogrids with different morphologies (geogrid material, geogrid plane structure, geogrid filling rate, rib width and rib height of geogrid) to compare and analyse the tensile properties of geogrids with different morphologies. The main purposes of the study are as follows: (1) Compare and analyze the effects of morphology differences on the tensile properties (maximum tensile strength, elongation at break and maximum modulus of elasticity) of geogrid. (2) Perform regression analysis on the relationship between the geogrid morphology parameters and its tensile properties. (3) Compare the differences of failure modes of geogrids when the geogrid morphology parameters are varied.
Experimental equipments and materials
The experimental equipment consists of tensile loading and data acquisition systems. The tensile loading system comprises an electronic universal testing machine and two matching stainless steel fixtures. The two fixtures are respectively fixed below the upper beam (fixed beam) and above the middle beam (moving beam) of the universal testing machine. The maximum tensile force the universal testing machine can provide is 100 kN. The data acquisition system consists of the tensile force and displacement sensor, and the measurement accuracy is ± 1‰.
According to the standard ASTM D663,
30
the dimensions of all geogrids used in this paper are 400 mm (length) × 100 mm (width) with a standard distance of 300 mm in tension, as shown in Figure 1. The geogrid parameter includes geogrid material, geogrid planar structure, geogrid filling rate, rib width and rib width of geogrid. Two main materials are used in geogrids: HDPE
31
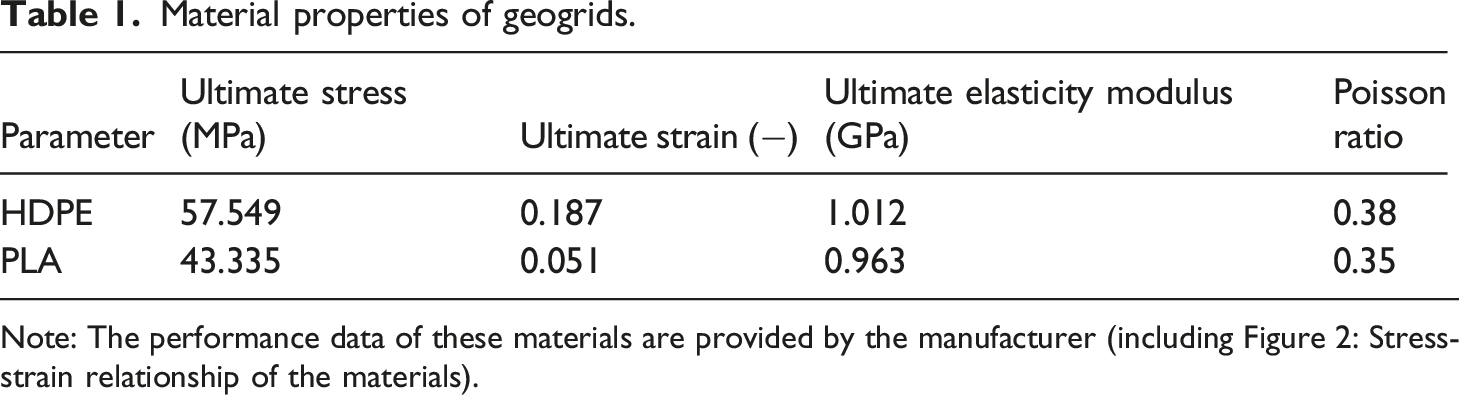
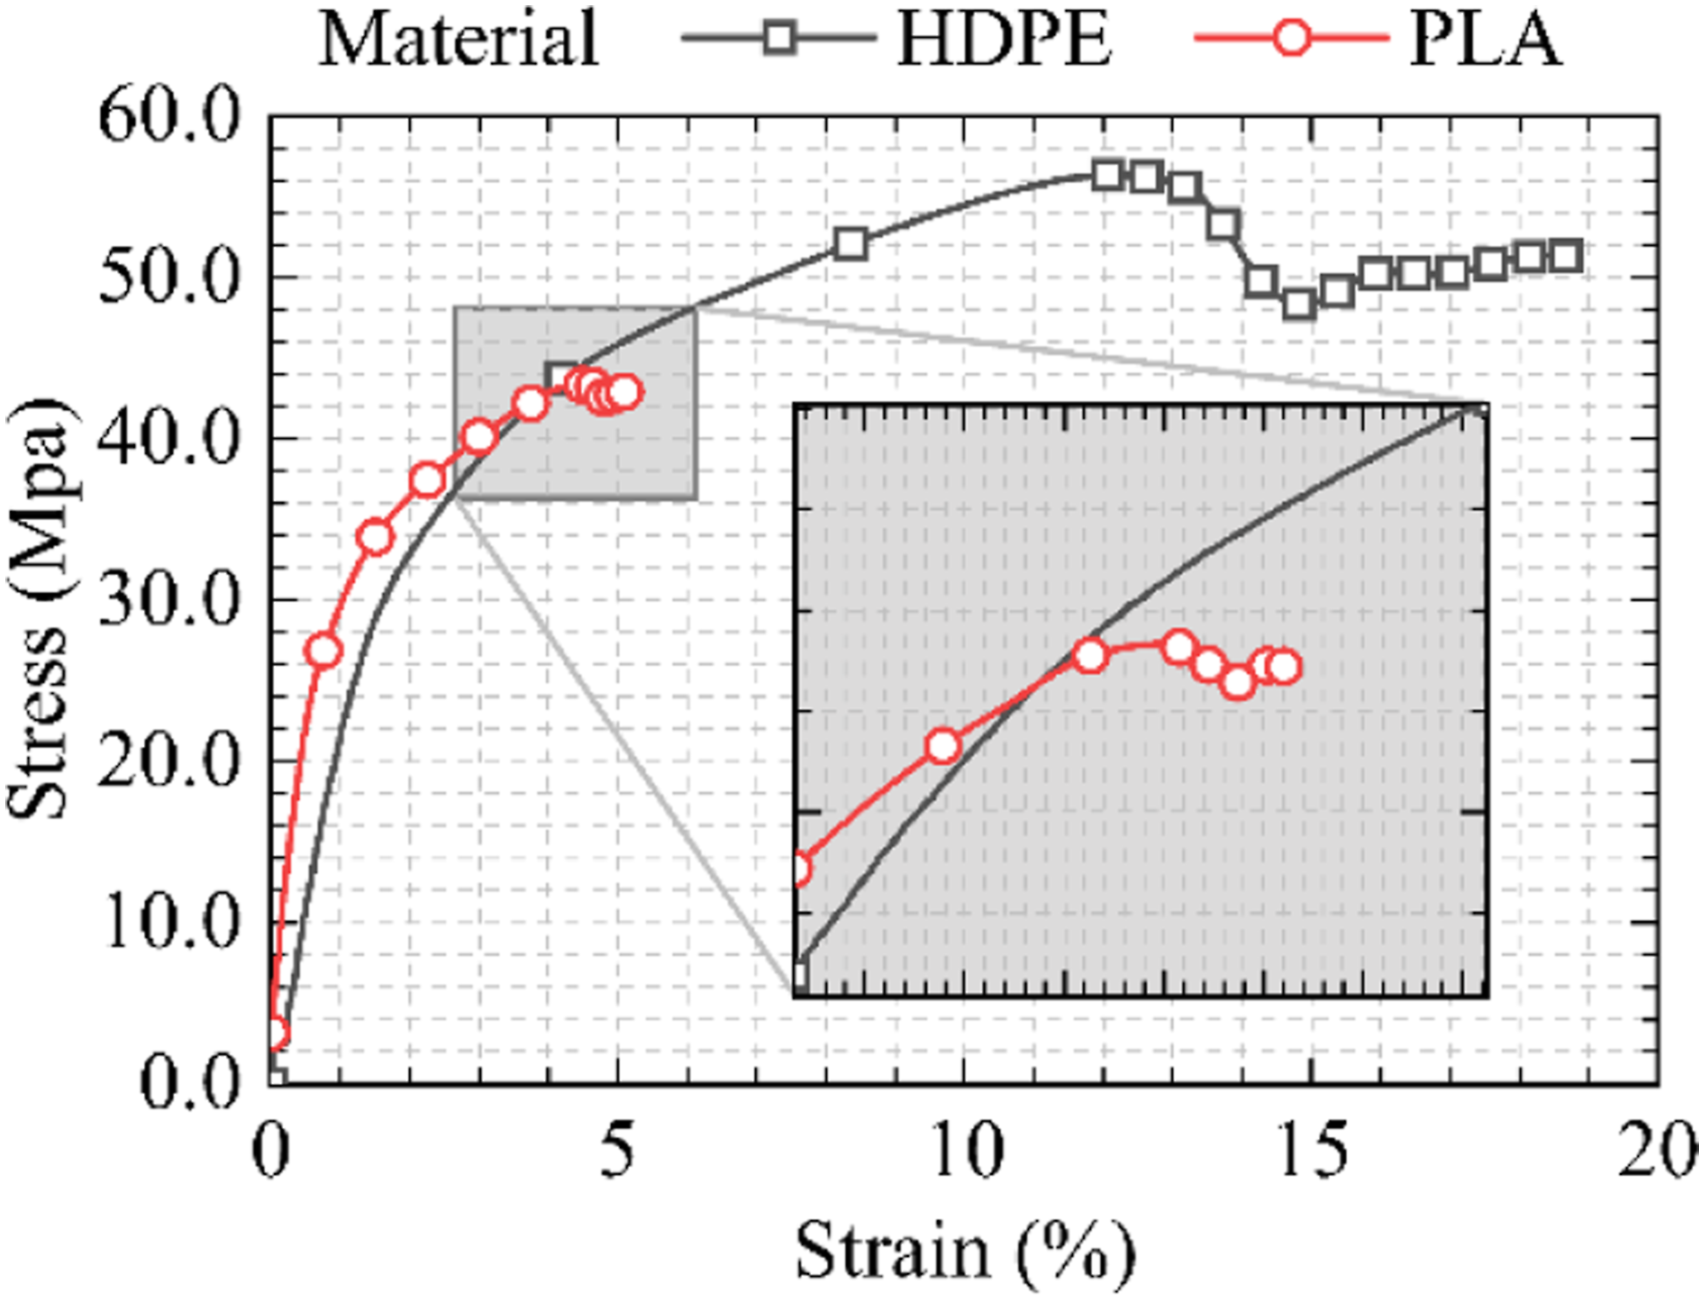
and PLA.32,33 Table 1 presents their material properties while Figure 2 shows their corresponding stress-strain relationship. The HDPE geogrids are produced by engineering manufacturers and can be used in real projects, but their morphology is fixed and hard to be changed. The PLA geogrids are produced by an industrial 3D printer with a printing accuracy of 0.1 mm,34,35 and their morphology can be personalized according to the studied parameters. Therefore, the variations of geogrid morphology parameters, including geogrid planar structure (biaxial, triaxial and quadaxial geogrids), geogrid filling rate (25%, 33.3%, 50%, 75%,100%), rib width (1.5 mm, 3.0 mm, 4.5 mm, 6.0 mm) and rib height (1.5 mm, 3.0 mm, 4.5 mm, 6.0 mm) of geogrid were achieved by 3D printer. The three types of geogrid planar structure are used to explore the effect of planar structure on the tensile strength of geogrid. Geogrids prepared for tensile testing in this experiment have all been listed in Table 2. Diagram of geogrid. Material properties of geogrids. Note: The performance data of these materials are provided by the manufacturer (including Figure 2: Stress-strain relationship of the materials). Stress-strain relationship of the materials. Parameters of geogrids. Note: HB is HDPE biaxial geogrid; PB is PLA biaxial geogrid; PT is PLA triaxial geogrid; PQ is PLA quadaxial geogrid.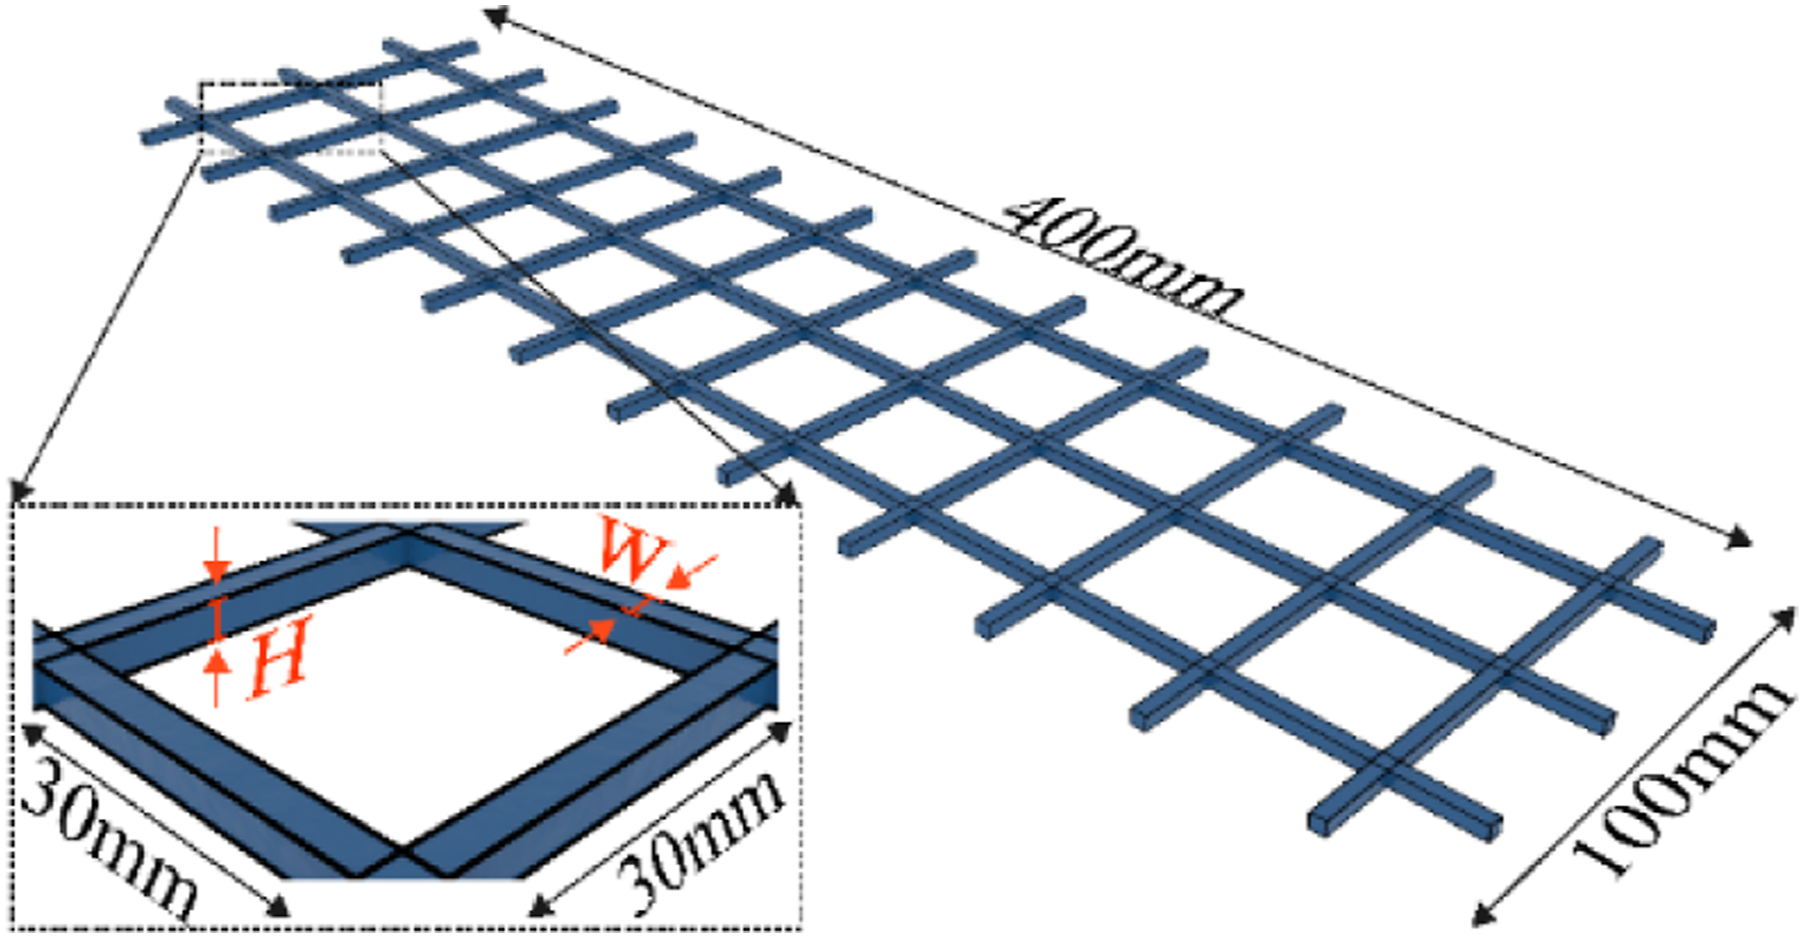
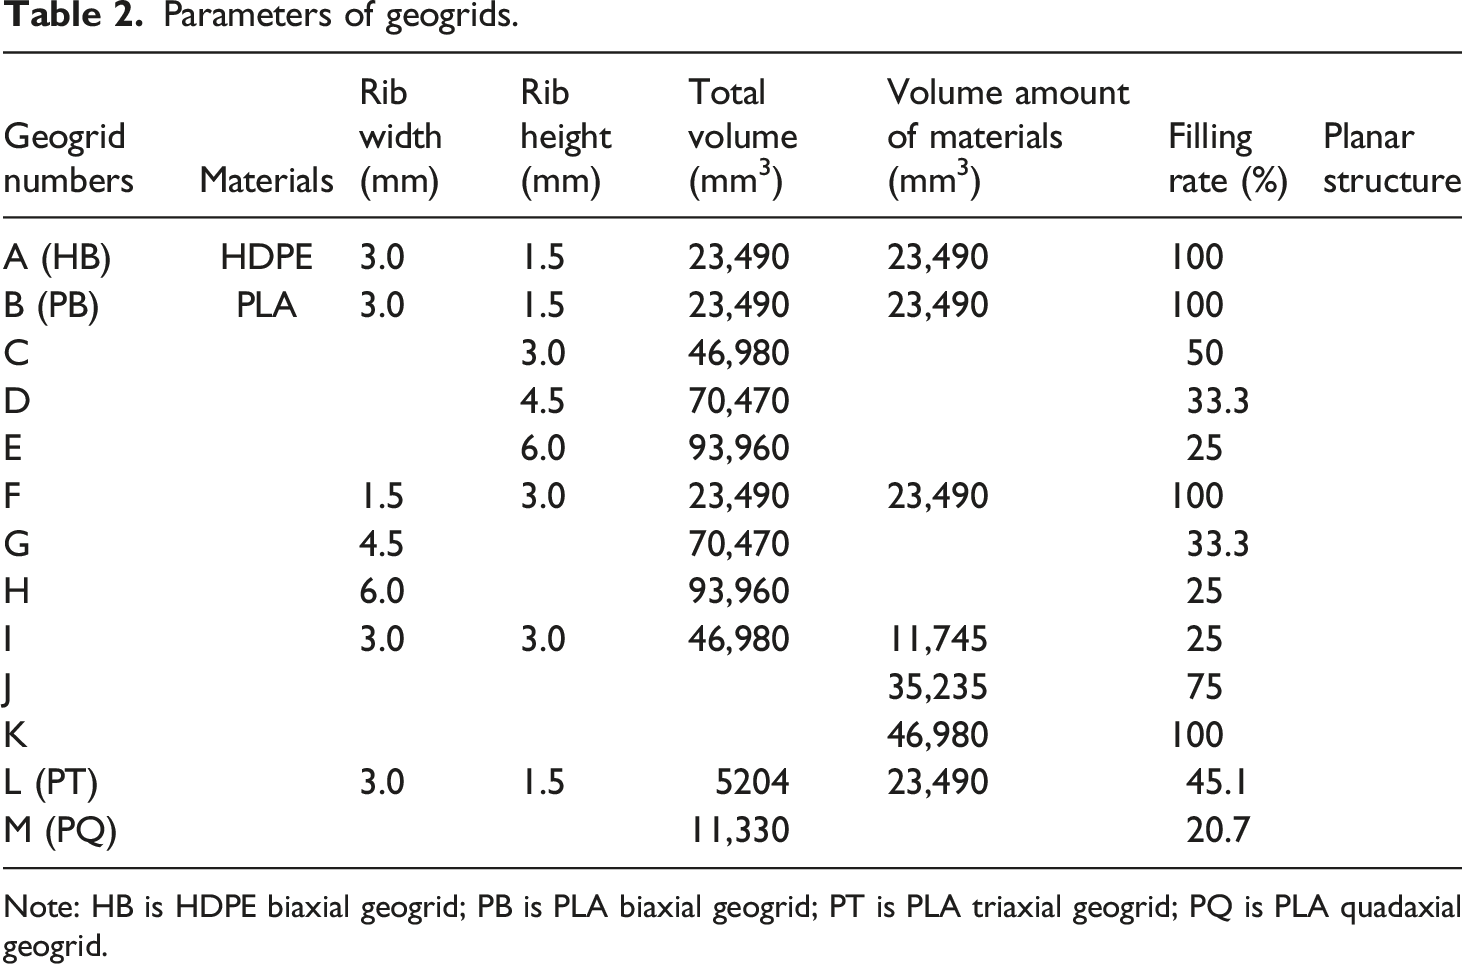
In this paper, the mesh size of geogrid is controlled to ensure that the mesh area of geogrid with different planar structures is approximately the same. In addition, the material consumption is controlled to achieve the purpose of studying the filling rate of geogrid material. Table 2 lists the parameters of geogrid in the experiments. Since the standard ASTM D663 30 specifies a tensile rate of 10% strain per minute for the material in the tensile test, the tensile rate used in this experiment was positioned at 30 mm/min.
The test procedure in this paper is as follows. Firstly, after placing and fixing the upper and lower clamps inside the universal testing machine, adjust the spacing between the upper and lower clamps to 300 mm, then put the geogrid into the clamping joints of the upper and lower clamps and make it drape over the clamping opening of the upper and lower clamps. Finally, let the upper and lower clamps fix and clamp the geogrid, and adjust the tensile parameters of the test apparatus to make it perform the tensile test according to 30 mm/min. Figure 3 shows the placement of each instrument during the experiment. Location of experimental equipments.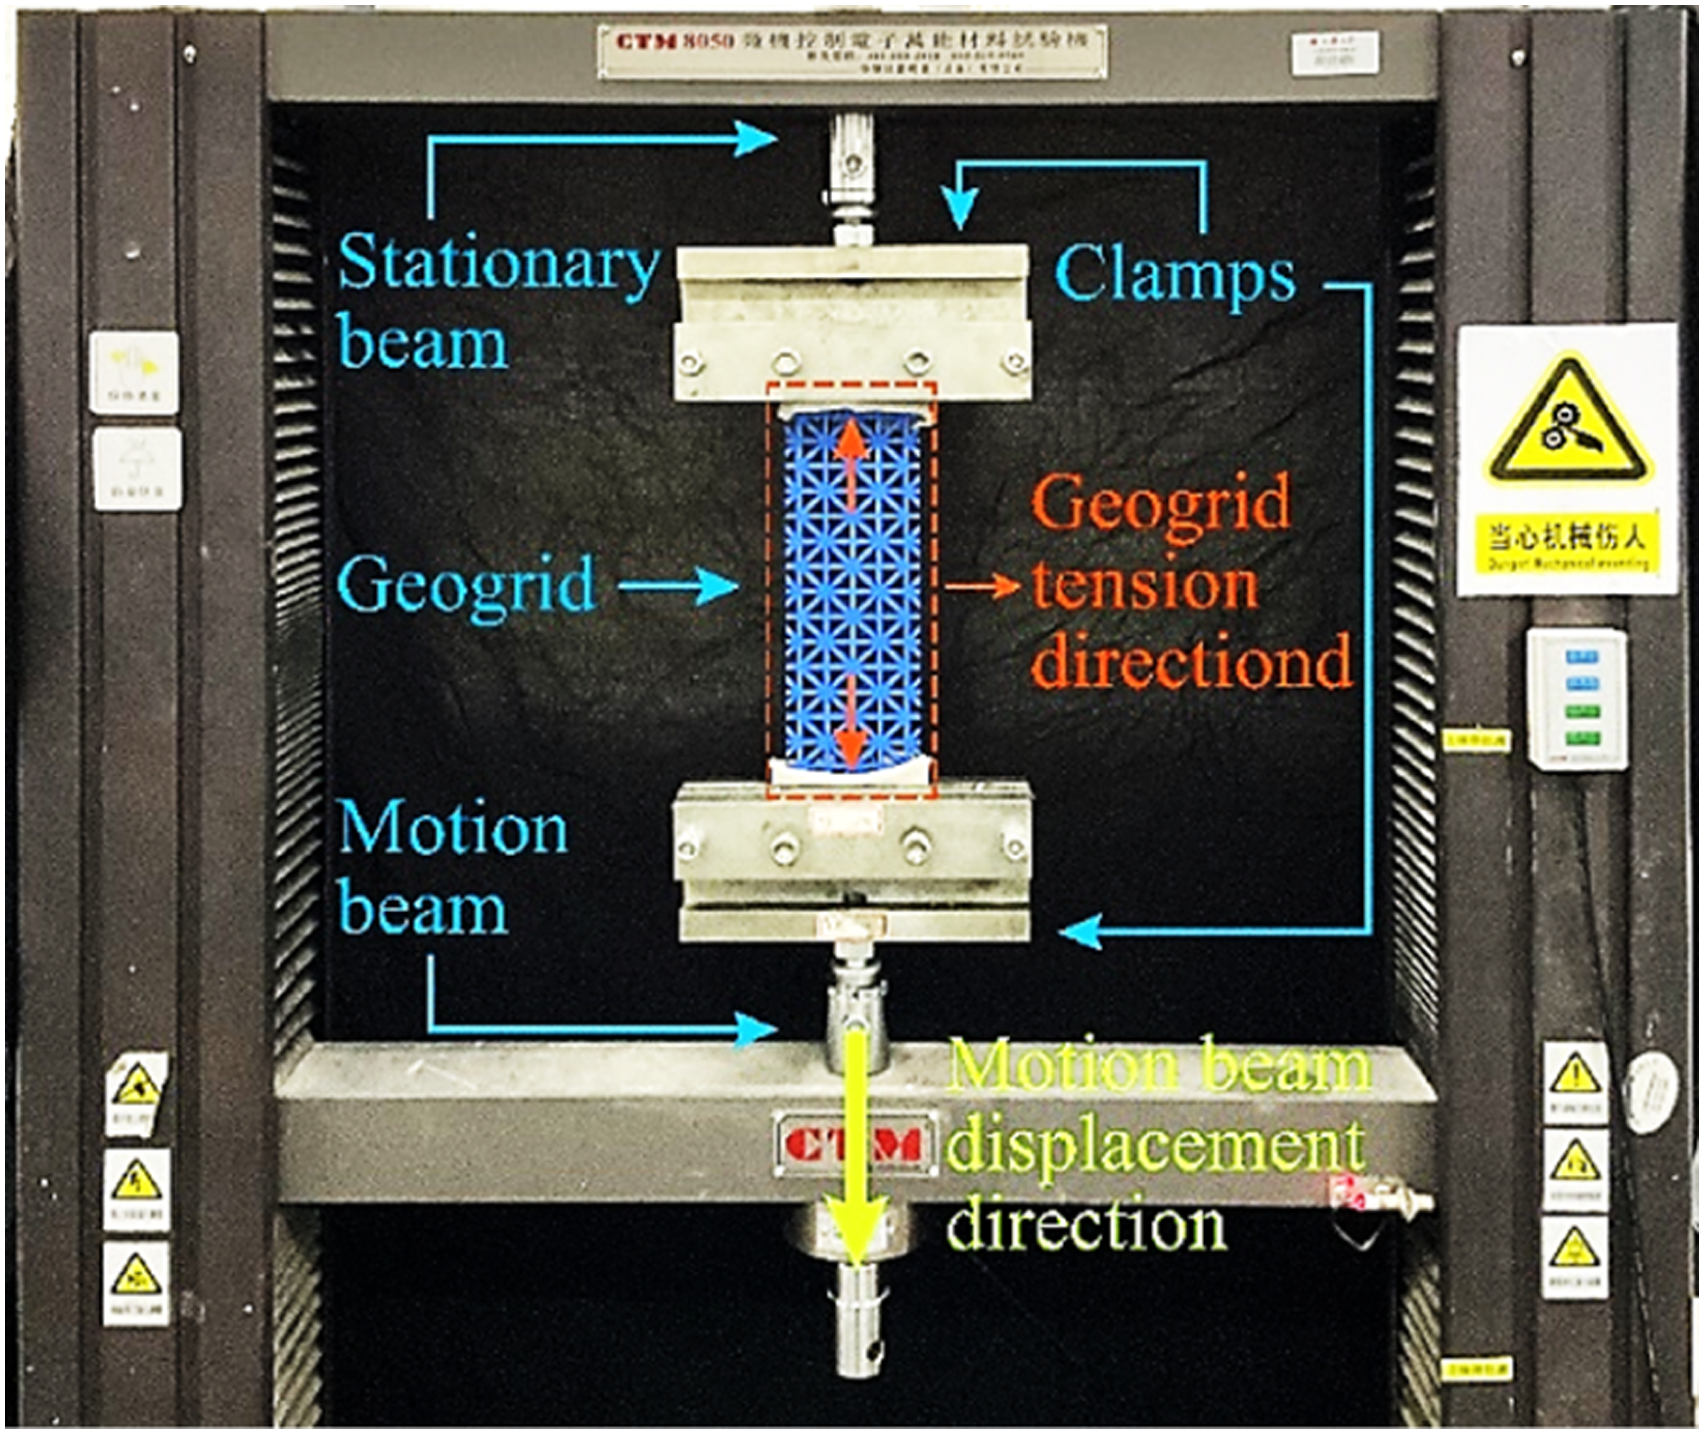
Results analysis
Tensile strength-axial strain curves


Tensile test results of geogrids.
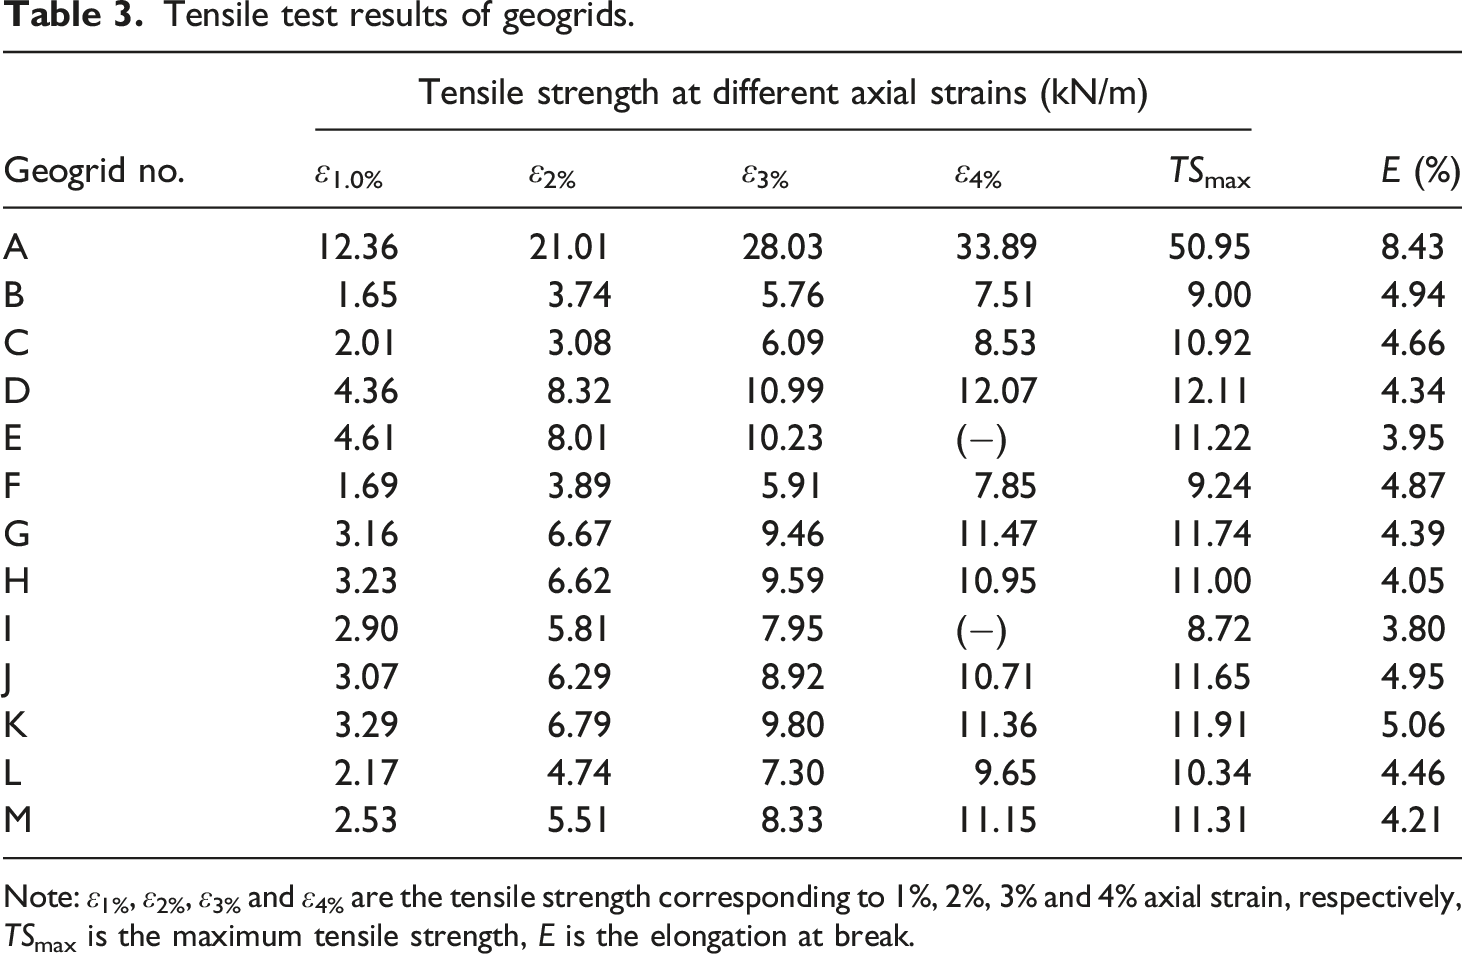
Note: ε1%, ε2%, ε3% and ε4% are the tensile strength corresponding to 1%, 2%, 3% and 4% axial strain, respectively, TSmax is the maximum tensile strength, E is the elongation at break.
Note: P is the tensile load on the geogrid (kN); B is the number of ribs for a geogrid with a width of 1m; L is the total length of the geogrid (m); ΔL is the change in length of the geogrid (m). ε is the axial strain or elongation of the geogrid (−) J is the modulus of elasticity of geogrid (kN/m);
Figure 4 shows the tensile strength-axial strain curves of various geogrid types. From Figure 4, it can be seen that the morphology of the tensile strength curves of geogrids is basically the same. These tensile strength-axial strain curves all increase with increasing axial strain, and the rate of increase is decreasing, i.e. the corresponding tangential modulus is decreasing. This indicates that the tensile elongation of geogrid leads to its own softening. Compared with PLA geogrids, Figure 4(a) shows that the increment of tensile strength of HDPE geogrids is greater at the same increment of axial deformation, which is similar to the results of Petersen et al.
36
It is not only because the bond energy of the C-C single bond is higher than that of the C-O single bond,37–39 resulting in higher tensile properties of HDPE
40
materials than PLA
41
materials, but also because the integrity of HDPE geogrids is higher than that of PLA geogrids. The former is integrated injection molding, while the latter is manufactured in layers by fused deposition. In addition, because PLA materials have experienced the annexing heat treatment during 3D printing manufacturing,
42
PLA geogrids are subject to some damage in tensile properties.
43
This further increases the gap between PLA and HDPE geogrids in terms of tensile properties. Tensile strength-axial strain curves for different morphology geogrids; (a) Material and planar structure; (b) Filling rate; (c) Rib width; (d) Rib height.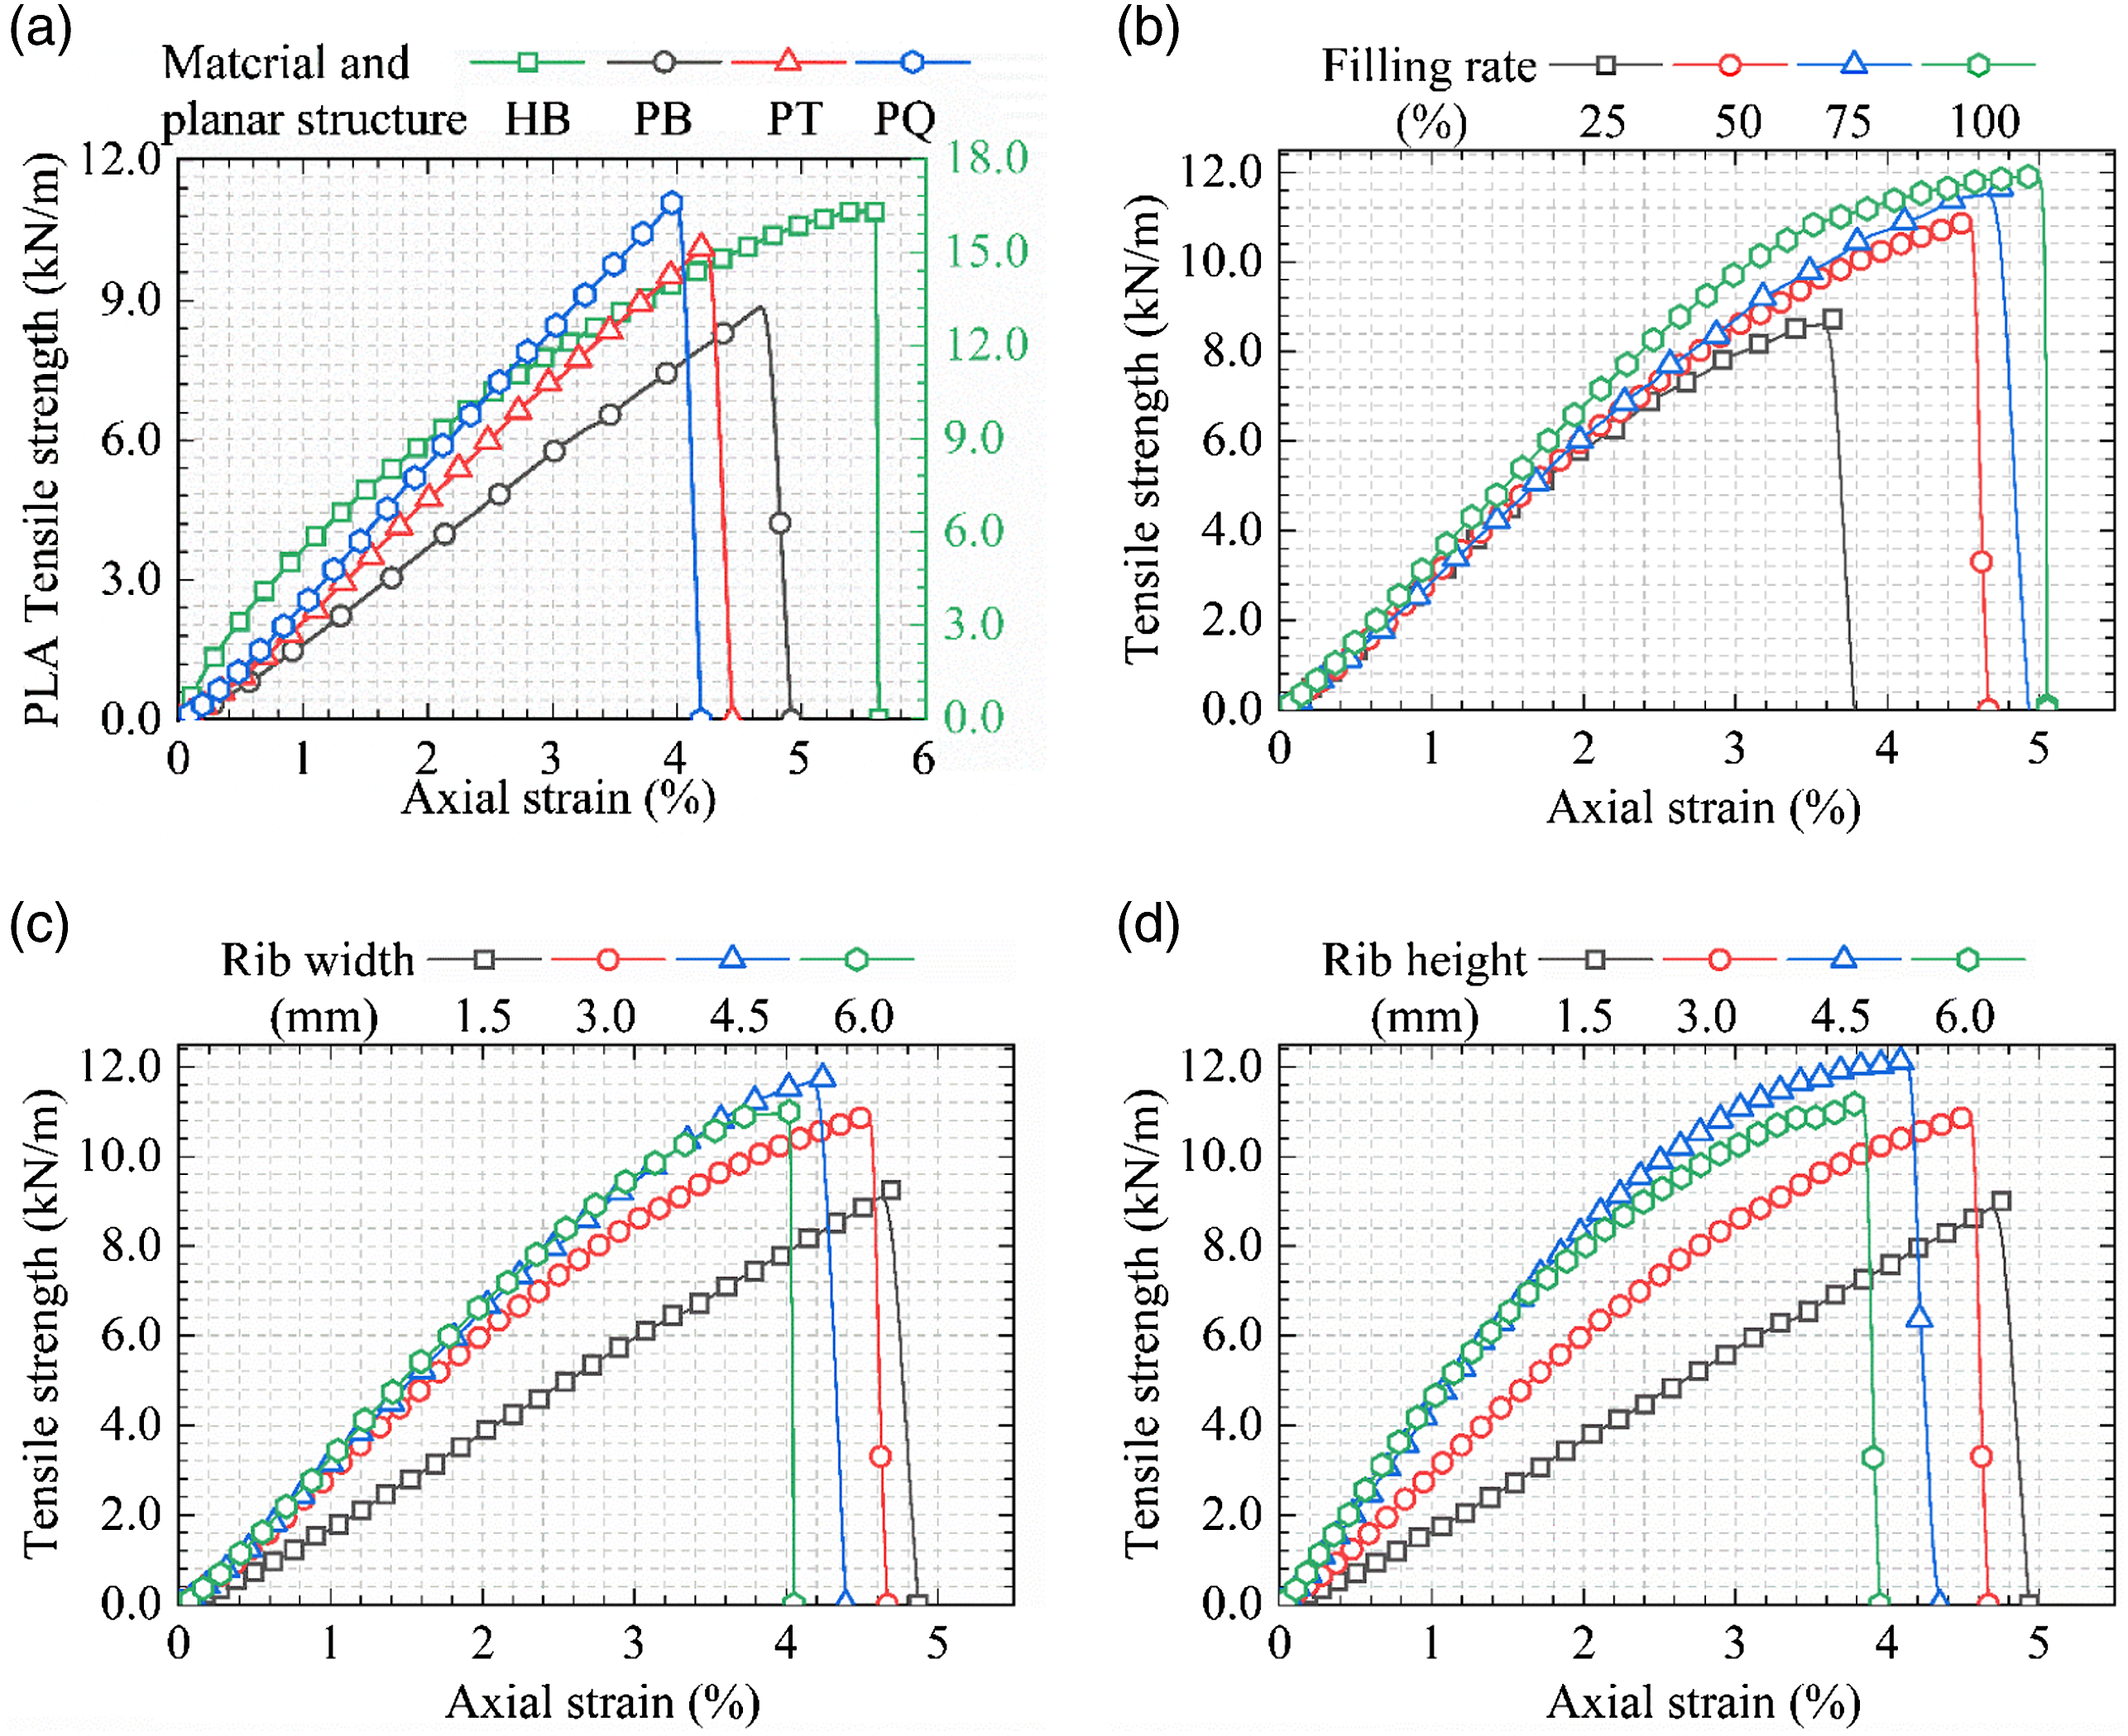
Figure 4(a) shows that for the same increase in tensile strength of the geogrid, the increase in the axial strain of the geogrid decreases in the order of biaxial, triaxial and quadaxial geogrids. It means quadaxial geogrids can have the same tensile strength with a smaller axial strain than biaxial and triaxial geogrids. In Figure 4(b), it is shown that the maximum tensile strength and the elongation at the break of geogrid increase gradually with the increase of the filling rate. It indicates that under the tensile load, increasing the filling rate can promote the geogrid to better play its tensile material characteristics.
From Figure 4(c) and (d), it can be found that the tensile strength curves for rib width or rib height of 4.5 mm and 6 mm are very close in the coordinate system when the axial strain is in the range of 0–4%. This indicates that the behavior of the tensile deformation of the geogrid is basically the same when the rib width or rib height is 4.5 mm and 6 mm.
According to Figure 4, the plastic deformation of HDPE material is greater than that of PLA material due to the former’s superior ductility. Additionally, as the filling ratio increases, the plastic deformation of the geogrid gradually increases, indicating a positive correlation between filling ratio and geogrid plastic deformation. Upon observing Figure 4(c) and (d), it was found that geogrid plastic deformation is greatest when rib width or rib height is 3 mm, compared to the cases of rib width or rib height being 4.5 mm and 6 mm. This is because an increase in rib width or rib height leads to a decrease in geogrid filling ratio.
Maximum tensile strength, elongation at break and maximum tensile modulus
Figure 5 depicts the maximum tensile strength, elongation at break and maximum tensile modulus of the geogrids with different morphology parameters. From Figure 5, it can be found that, in contrast to elongation at break, the maximum tensile strength and maximum tensile modulus of the geogrid increase in the order of biaxial, triaxial and quadaxial geogrids. The maximum tensile strength and maximum tensile modulus of geogrid increase in the order of biaxial, triaxial and quadaxial geogrids. This means that quadaxial geogrid can be preferred when the actual project requires the geogrid with larger tensile strength. And when the actual project needs geogrid to bear larger deformation, biaxial geogrid can be considered. In addition, when the filling rate of geogrid increases, the maximum tensile strength and elongation at break can increase more obviously compared with the maximum tensile modulus. Maximum tensile strength, elongation at break and ultimate tensile modulus of geogrids with different morphology; I Filling rate, material and planar structure; II Rib width and rib height; (a) Maximum tensile strength; (b) Elongation at break; (c) Maximum tensile modulus.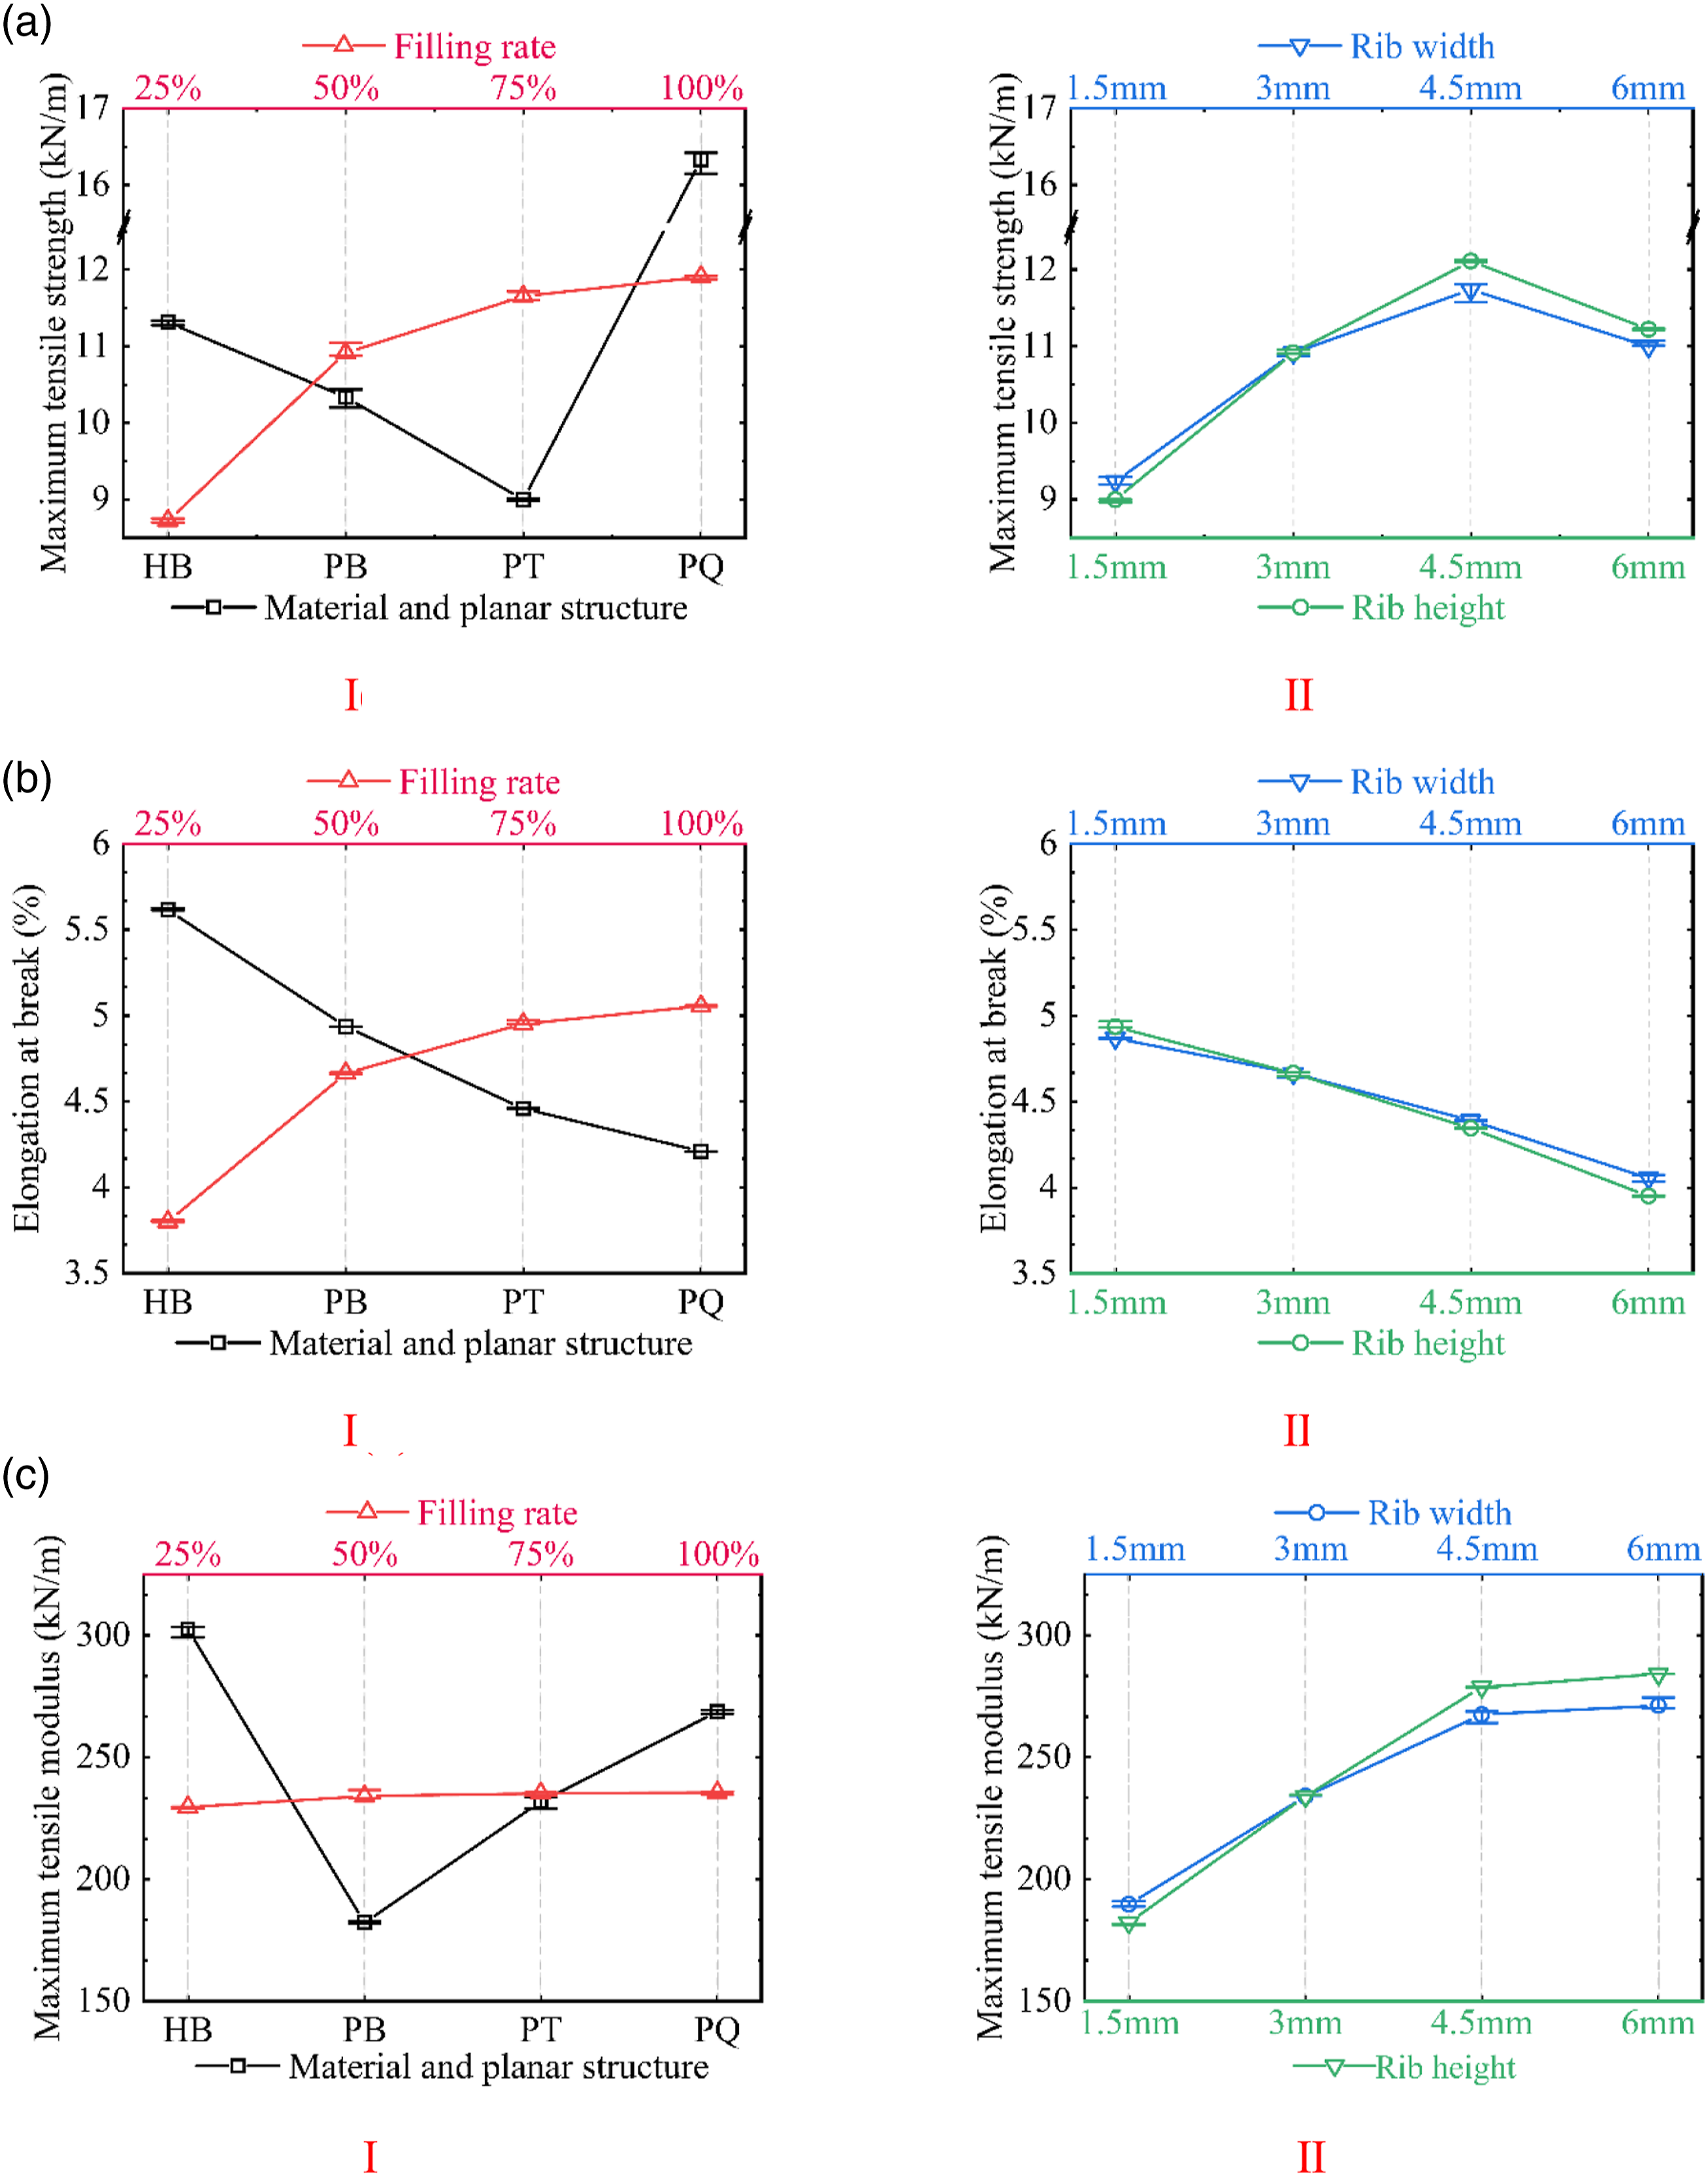
When the material consumption is the same, the maximum tensile strength of geogrid increases and then decreases with the increase of rib width and rib height (Figure 5(a)). On the one hand, the increase of rib width and rib height can better transfer the tensile strength to each position of the geogrid and improve its tensile strength. On the other hand, the decrease of the geogrid filling rate can lead to the corresponding decrease of its tensile strength. In other words, the tensile strength of geogrid is not unilaterally determined by the rib size but by the rib size and the filling rate together. Therefore, the tensile strength of geogrid under the variation of rib height or rib width will have extreme values. In addition, as shown in Figure 5(b), the increase in rib width and rib height significantly reduces the elongation at the break of the geogrid. Figure 5(c) shows that when the geogrid rib width or rib height is at 4.5 mm–6 mm, the maximum tensile modulus does not show a large increase, i.e. a marginal effect is produced. It indicates that the method to increase the maximum tensile modulus of geogrid by increasing the rib width or rib height is no longer highly effective.
In order to better evaluate the influence of morphology parameters on the tensile property of geogrid, the rate of tensile property is introduced in this paper. The corresponding equation is shown below.


Note: IRTP is an increase rate of tensile property of TS (Maximum tensile strength), E (Elongation at break) and TM (Maximum tensile modulus); TP is the tensile property that includes TS, E and TM; MP is the material and planar structure that includes HB, PB, PT and PQ; F is the filling rate that includes 25%, 50%, 75% and 100%; W is the rib width that includes 1.5 mm, 3 mm, 4.5 mm and 6 mm; H is the rib height that includes 1.5 mm, 3 mm, 4.5 mm and 6 mm.
The increase rates of maximum tensile strength, elongation at break and maximum tensile modulus for different morphology geogrids were calculated using equations (4)–(7), and the results are depicted in Figure 6. Figure 6(a) shows that compared to PLA geogrid, the increase rates of HDPE material on the maximum tensile strength, elongation at break and maximum tensile modulus of geogrid are 81.5%, 13.8% and 65.8%, respectively. This means HDPE geogrids are better adapted to practical projects requiring tensile properties. Increase rates of maximum tensile strength, elongation at break and maximum tensile modulus of geogrids with different morphology; (a) Material and planar structure; (b) Filling rate; (c) Rib width; (d) Rib height.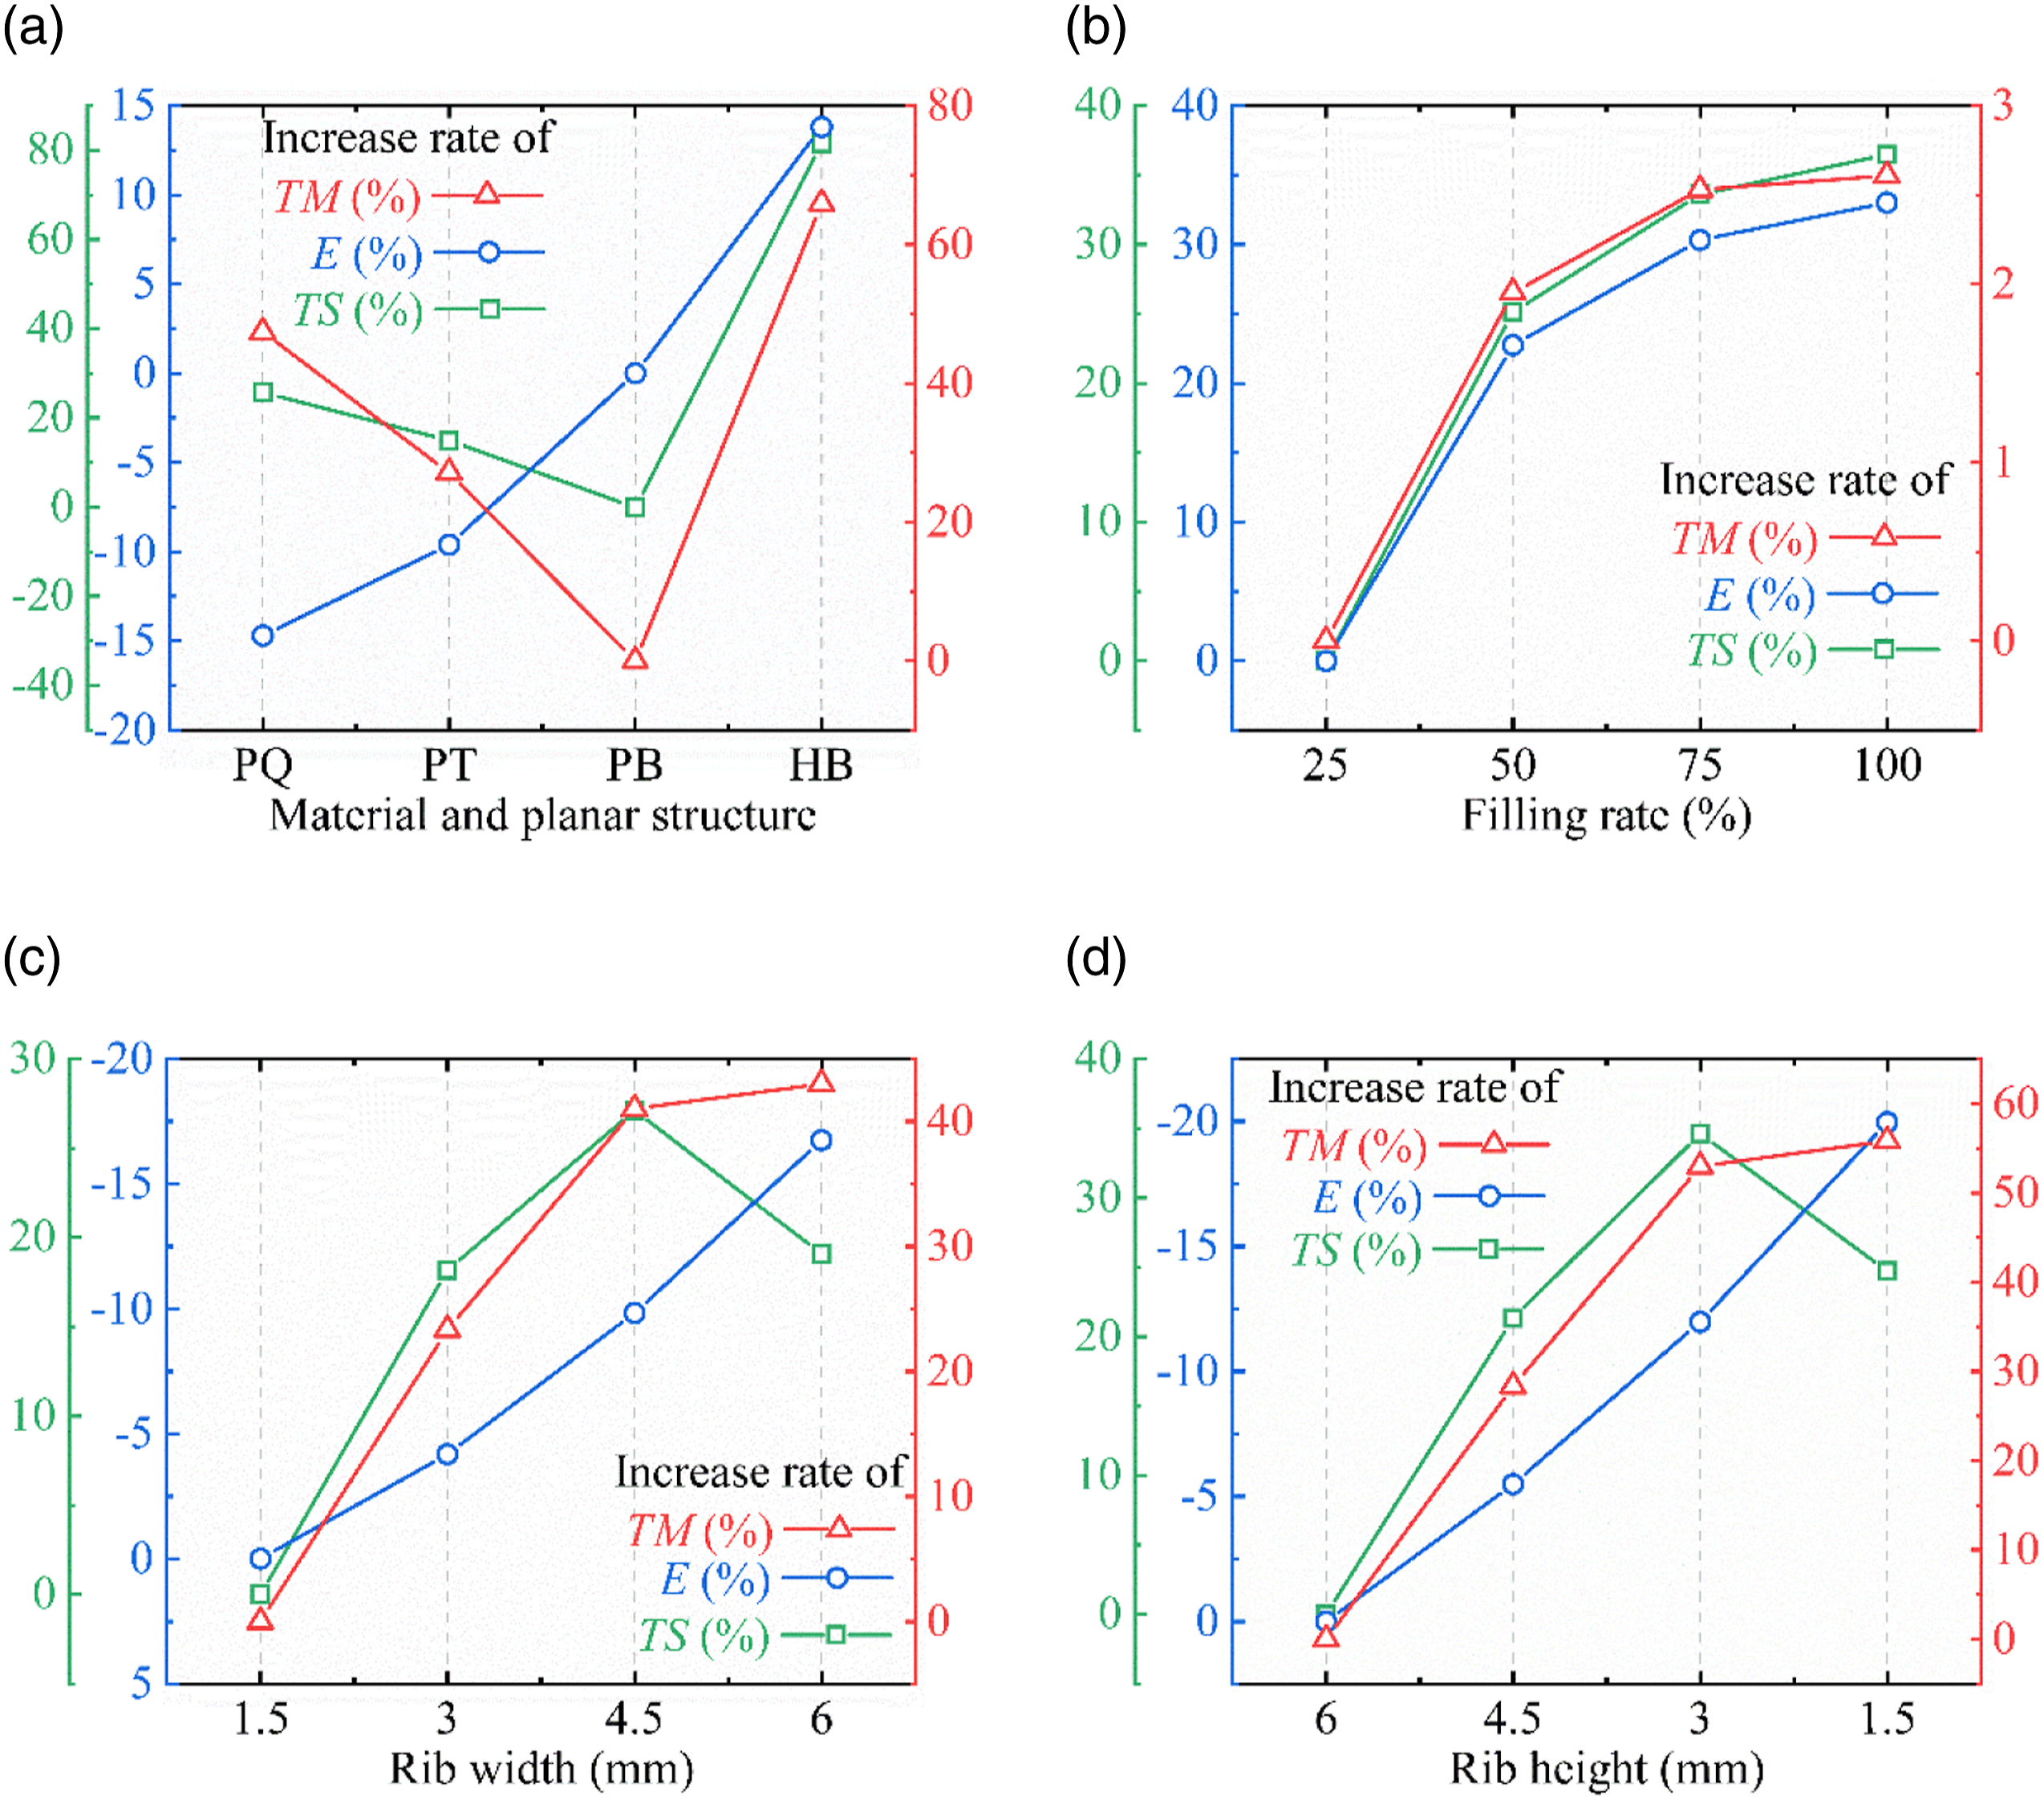
From Figure 6(a), it can also be concluded that the increase in the maximum tensile strength of triaxial and quadaxial geogrids is 14.9% and 25.7%, respectively. Compared to biaxial geogrids, their maximum tensile modulus increase rate is 27.1% and 47.4%, respectively. This is mainly because the geometry of triangular mesh is more stable than that of square mesh and less prone to deformation when subjected to loads. 27 This enables quadaxial and triaxial geogrids to perform well in terms of material properties. In addition, although the mesh shapes of both quadaxial and triaxial geogrids are triangular, quadaxial geogrids are triangular groups of multiple small triangles, whereas triaxial geogrids have a single triangular mesh. Therefore, the quadaxial geogrid can better distribute the load evenly on the geogrid and improve the tensile performance of the geogrid. This is why the increase in maximum tensile strength and maximum tensile modulus of quadaxial geogrids is higher than that of triaxial geogrids.
In addition, the increase in elongation at break for triaxial and quadaxial geogrids is-9.6% and −14.7%, respectively, which indicated that the triaxial mesh weakened the elongation at break of the geogrid. Due to the existence of rapid load transfer performance of the triaxial mesh, the unit axial strains in triaxial and quadaxial geogrids can bear a larger load at the unit axial strain (as shown in Figure 4(a)). This will force the geogrid to break faster and thus reduce the elongation at the break of the geogrid.
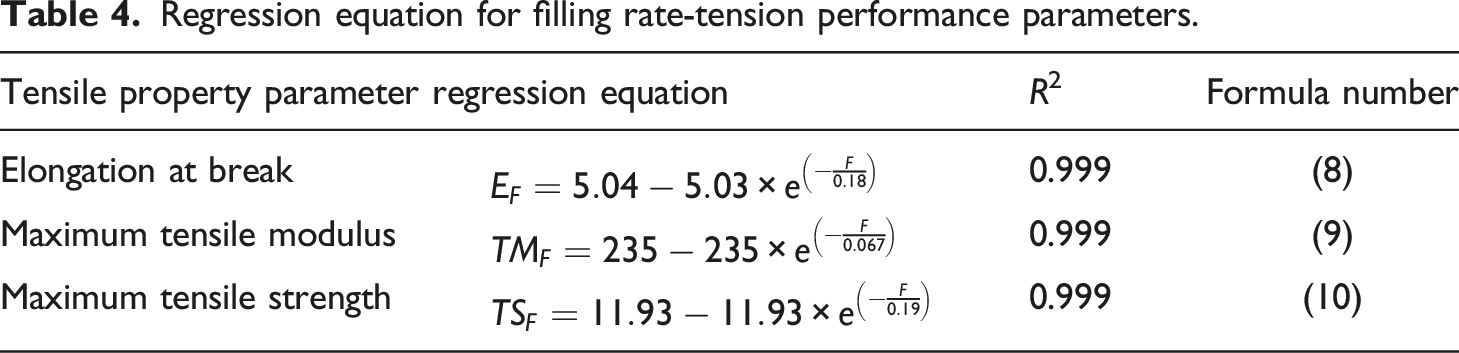
Figure 6(b) reveals a more interesting phenomenon, with the increase of geogrid filling rate, the increase rate of geogrid maximum tensile strength, elongation at break and maximum tensile modulus increases gradually decreases. When the geogrid filling rate increases from 0 to 50%, the rate of increase of the tensile properties of the geogrid gradually increases. This indicates that the geogrid does not show the tensile properties of the original material better when the geogrid filling rate is less than 50%. Figure 6(c) and (d), show that when the rib width and rib height increase by the same value, compared to the rib width, although the rib height can strengthen the maximum tensile strength and maximum tensile modulus of the geogrid, it will also further reduce the elongation at break. This indicates that in practical projects, if the maximum tensile strength and elongation at the break of geogrid need to be considered simultaneously, then increasing the rib width is more advantageous than increasing the rib height. On the contrary, if only the maximum tensile strength of the geogrid is considered in the actual project, then increasing the rib height is definitely a better choice.
Damage morphology
Because the tensile damage morphology of geogrids differs significantly only in the material and planar structure of geogrids, only the tensile damage morphology of geogrids with different materials and planar structures are analyzed in this paper. Among them, PLA biaxial geogrids with a filling rate of 100%, a rib width of 3 mm, and a rib height of 1.5 mm.
Figure 7 shows the tensile damage morphology of geogrids with different materials and planar structures. From Figure 7, it can be found that the main tensile damage morphologies of geogrids are rib alone, node alone, and rib and node joint damage. In contrast to the brittle fracture of PLA geogrids,44,45 HDPE geogrids tend to have flocculent rib fibres remaining at the damage.
24
These flocculent fibres are located on the outside of the longitudinal ribs of the geogrid and are associated with the cross ribs of the geogrid. This indicates that the cross ribs of the geogrid can provide some tensile strength to the geogrid by the fibres on the outside of the longitudinal ribs during the tensile process of the HDPE geogrid. Tensile damage morphology of geogrids; (a) HB; (b) PB; (c) PT; (d) PQ.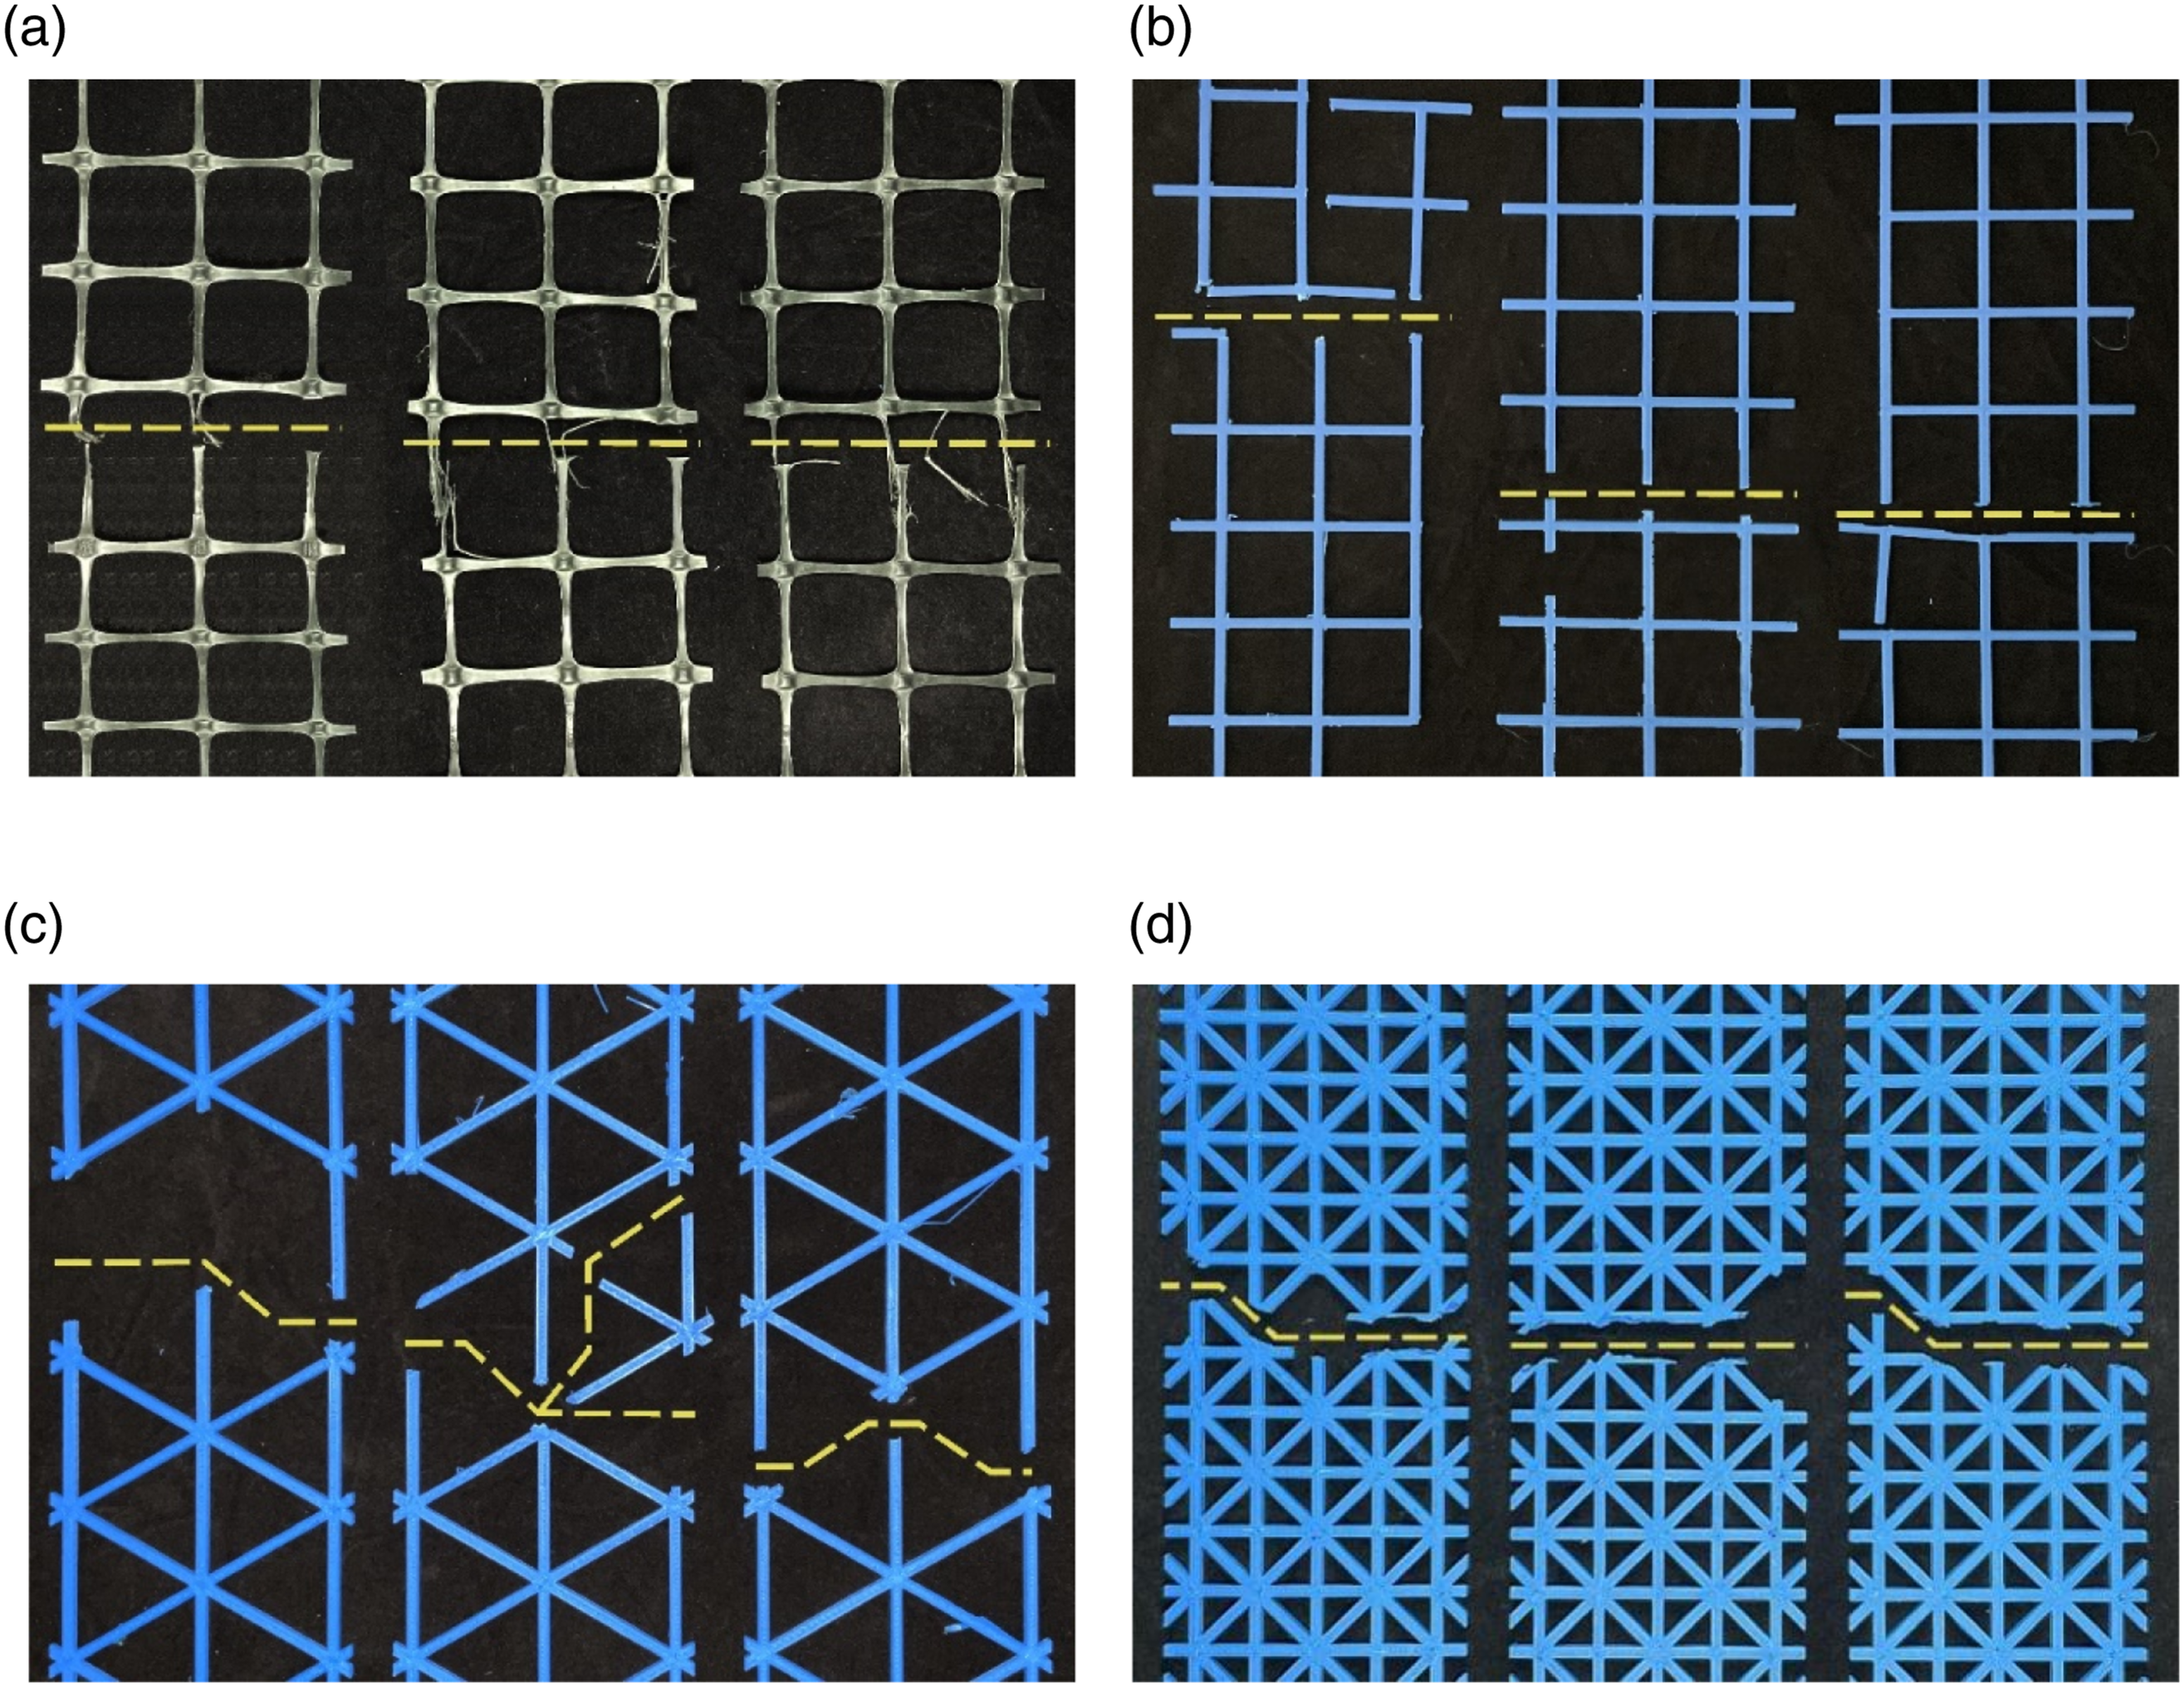
Compared to biaxial geogrids, triaxial and quadaxial geogrids tend to have missing ribs or nodes at the tensile damage. This proves that the surrounding connection part of the missing ribs or nodes can be damaged simultaneously under load. This shows that triaxial and quadaxial geogrids transmit tensile loads more than biaxial geogrids. In addition, the cross ribs of quadaxial geogrids tend to show a torn morphology at the geogrid fracture, which is caused by the load on the cross ribs of quadaxial geogrids. This phenomenon is also found at the fracture of HDPE and PLA biaxial geogrids, although the tearing of the cross ribs is less pronounced in both than in PLA quadaxial geogrids. This indicates that quadaxial geogrids bear higher loads in the cross ribs than triaxial and biaxial geogrids.
Figure 8 illustrates the comparison between the stress-strain relationship of a single rib of the geogrid and the stress-strain relationship of the material. The stress-strain relationship of a single rib of the geogrid is obtained through calculation. From Figure 8(a), it can be seen that the failure stress and rupture strain of the PLA geogrid rib roughly follow the mechanical characteristics of the PLA material. However, for the HDPE geogrid (Figure 8(b)), although its stress characteristics conform to the characteristics of the HDPE material, the strain at failure is smaller than that of the HDPE material. This may be due to the manufacturing process of the HDPE geogrid. Shows the comparison between the stress-strain relationship of a single rib of the geogrid and the stress-strain relationship of the material. (a) Compares the PLA biaxial, triaxial, and quadaxial geogrid with the PLA material; (b) Compares the HDPE biaxial geogrid with the HDPE material.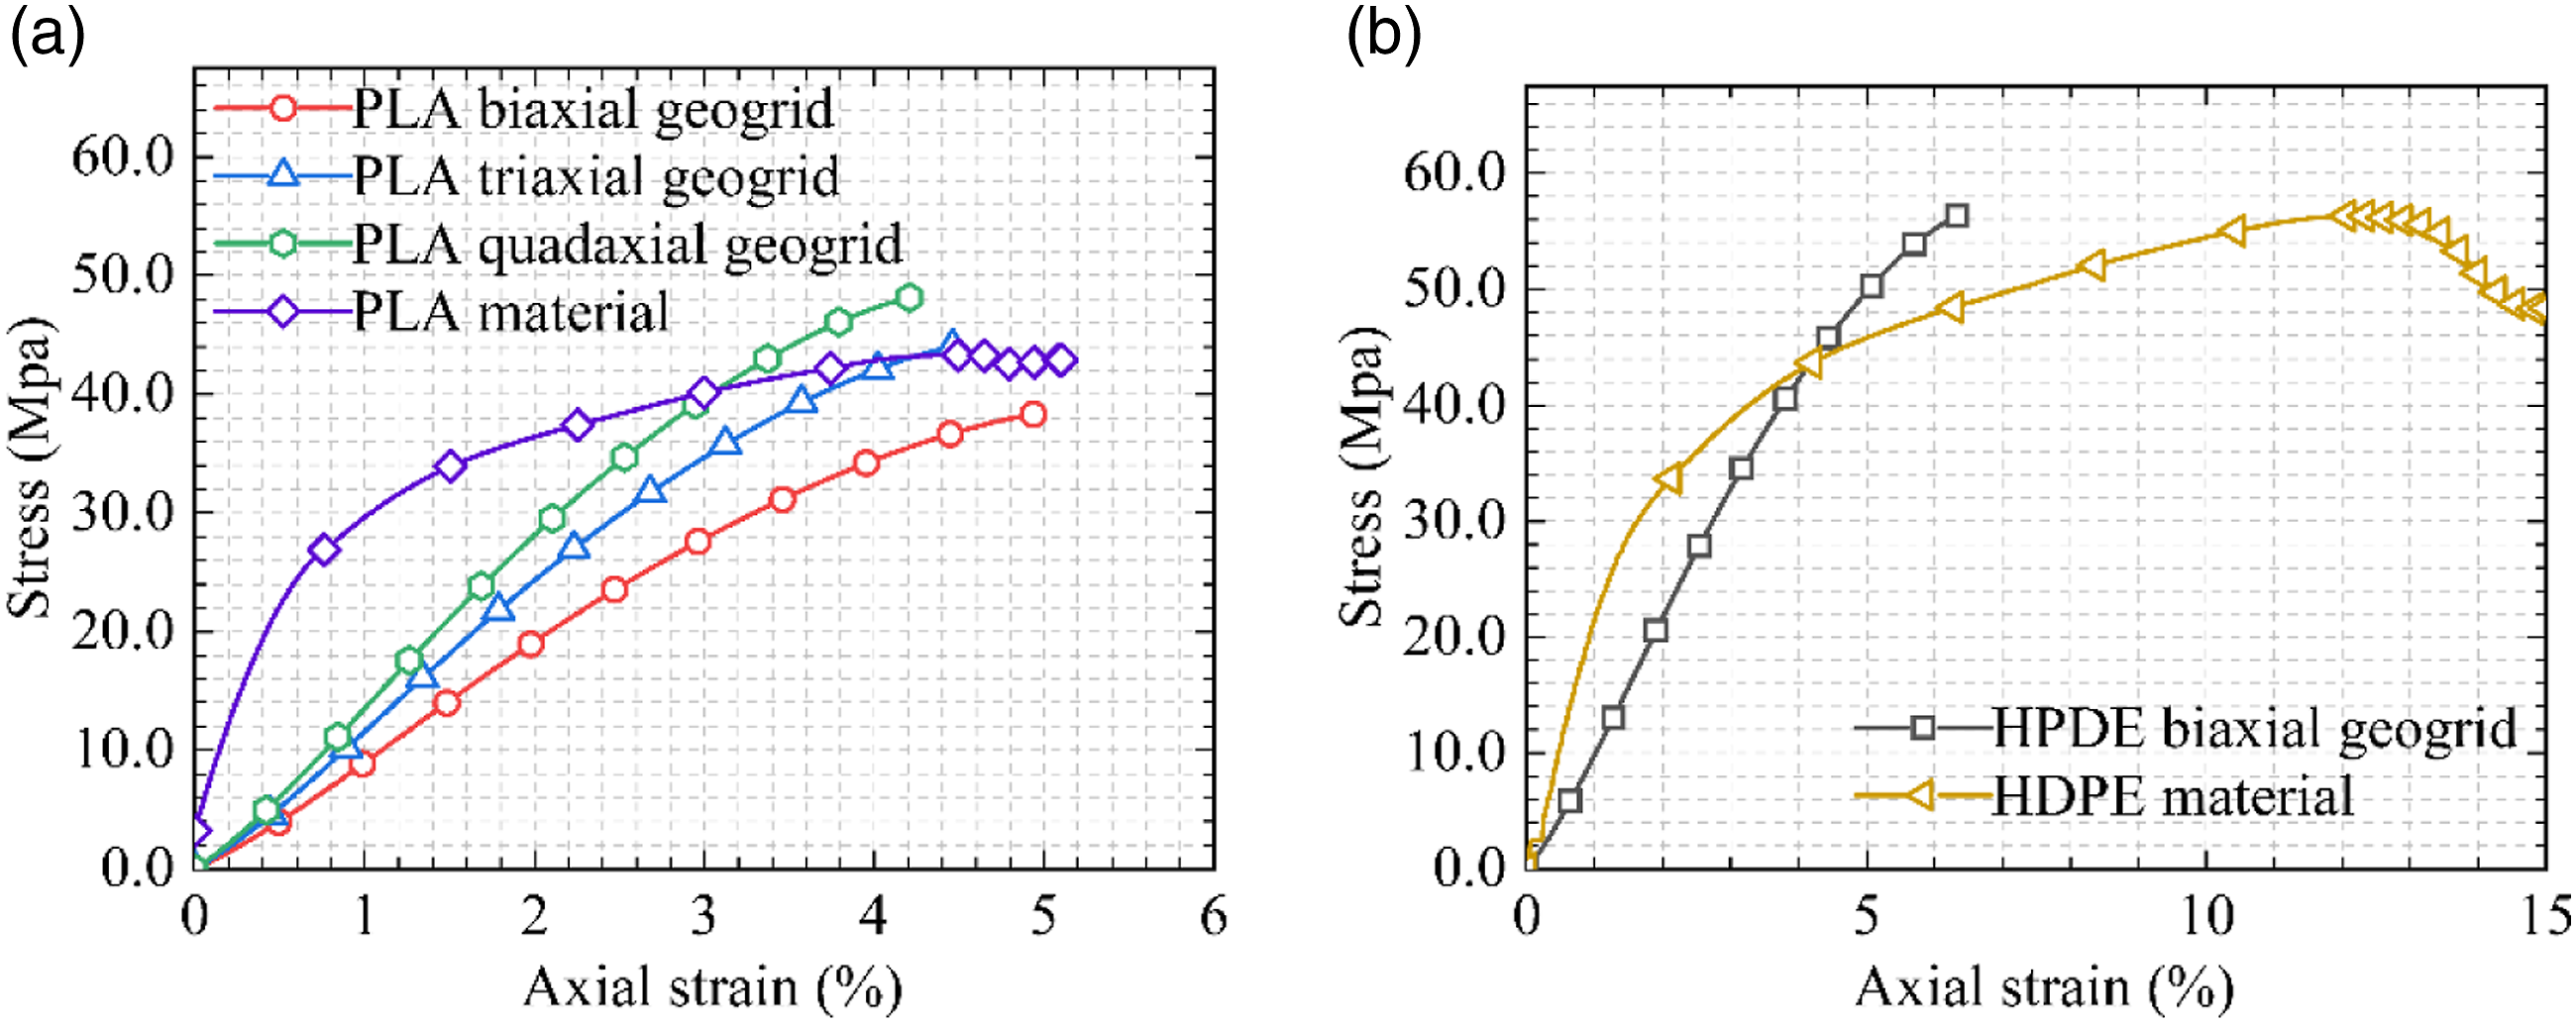
Regression analysis
A regression analysis 46 was performed to quantify the relationship between the morphology parameters and the tensile performance parameters in order to determine the relationship between the geogrid morphology parameters and its maximum tensile strength, elongation at break and maximum modulus of elasticity.
In order to determine the relationship between the geogrid morphology parameters and their maximum tensile strength, elongation at break and maximum modulus of elasticity, a regression analysis 46 was performed to quantify the relationship between the morphology parameters and the tensile performance parameters. It should be noted that only the quantifiable morphology parameters (filling rate, rib width and rib height) were analyzed by regression in this paper, since the morphology parameters for different materials and planar structures could not be quantified.
Regression equation for filling rate-tension performance parameters.
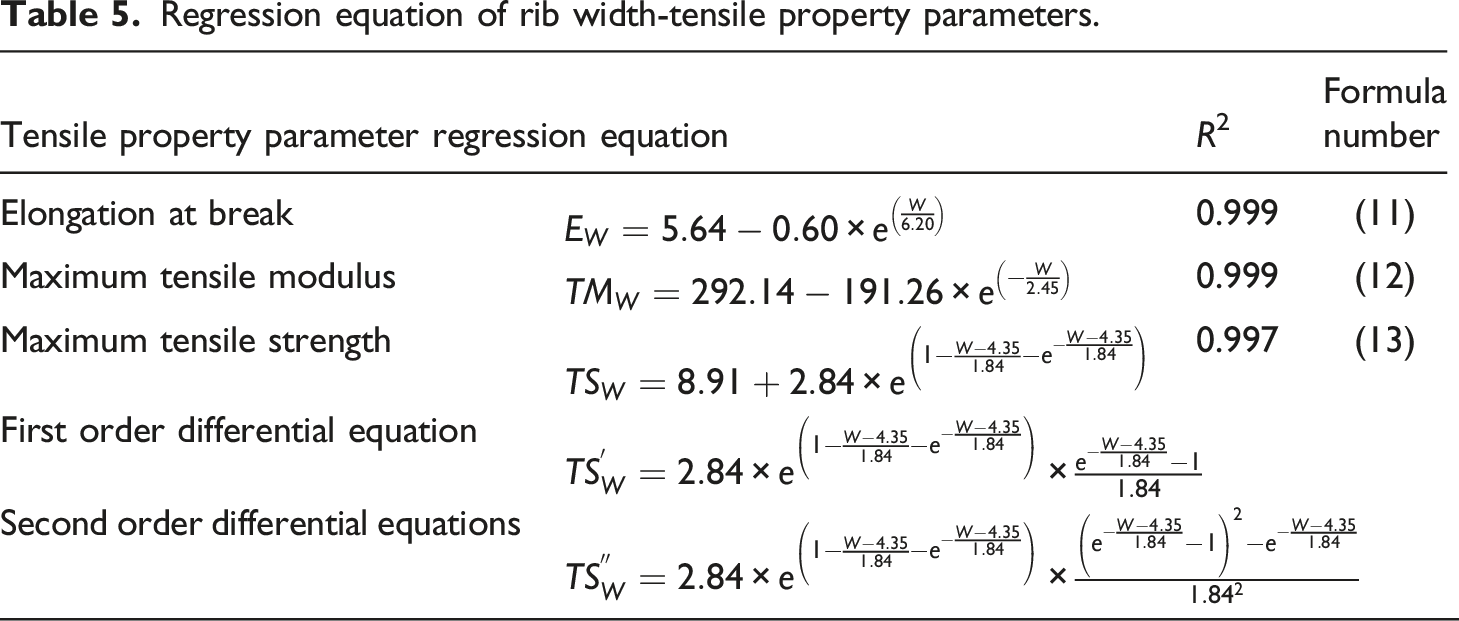
Regression equation of rib width-tensile property parameters.
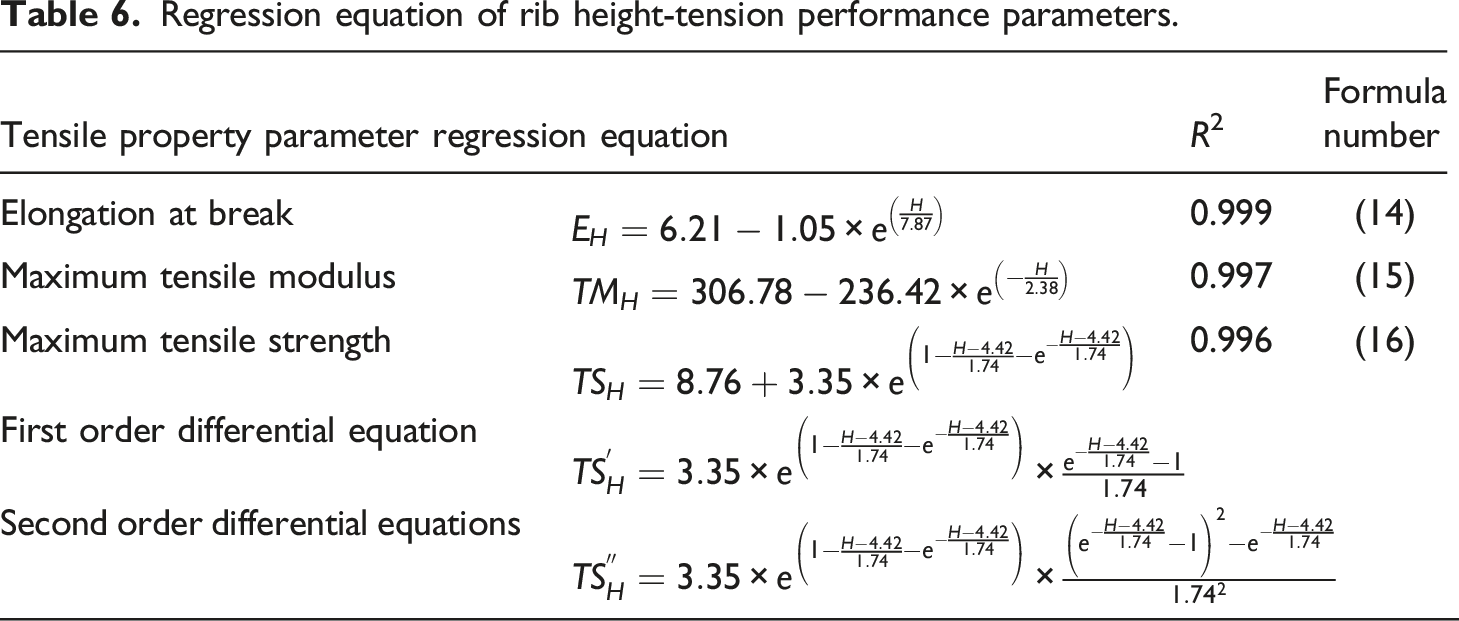
Regression equation of rib height-tension performance parameters.
According to Figure 5, it is also found that the maximum tensile strength curve of the geogrid shows a significant peak as the rib width increases. Therefore, the single-peak function model 48 (i.e. the Extreme function model) is chosen in this paper to perform the regression analysis of the rib width-maximum tensile strength curve. In order to find the values of rib width and maximum tensile strength corresponding to the peak point, the first order differentiation of the rib width-maximum tensile strength regression curve is performed. The zero point value of the first-order differential equation is solved, and its zero point value can be obtained as 4.35 mm. This indicates that the maximum tensile strength of the geogrid can be reached at a rib height of 3 mm and a rib width of 4.35 mm, with a value of 11.75 kN/m.
In addition, in order to evaluate the gain of maximum tensile strength increase of geogrid under the condition of unit increase of rib width. A second order discretization of the rib width-maximum tensile strength regression curve is performed in this paper. This second order differential equation has zero point values of 2.58 mm and 6.12 mm, which indicates that when the rib width is less than 2.58 mm, the increase in rib width increases the maximum tensile strength more rapidly (higher positive gain). When the rib width is larger than 6.12 mm, the increase in rib width reduces the maximum tensile strength faster (higher negative gain). The regression equations and the corresponding differential equations involved are presented in Table 5.
Since the rib height-maximum tensile strength curve is morphologically similar to the rib width-maximum tensile strength curve, the rib height-maximum tensile strength curve is also selected for regression analysis by the Extreme function model. Since the rib height-maximum tensile strength curve also has extreme values, the zero point value of this equation can be obtained as 4.42 mm after first-order differentiation of the rib height-maximum tensile strength equation. This represents the maximum tensile strength of the geogrid at a rib height of 4.42 mm under the condition that the rib width of the geogrid is 3 mm. (this value is 12.12 kN/m). In addition, the zero values of the second-order differential equation of the rib height-maximum tensile strength regression curve are 2.75 mm and 6.09 mm. This indicates that when the rib height is less than 2.75 mm, increasing the rib height will accelerate the maximum tensile strength of the geogrid, while when the rib height is larger than 6.09 mm, increasing the rib height can cause the geogrid to maximum tensile strength decays faster.
Research on the tensile strength-axial strain model of geogrid
In order to make the tensile strength-axial strain curves of different morphology parameters of geogrids predictable, this paper establishes a model for the tensile strength-axial strain of different morphology parameters of geogrids based on the Sherwood-Frost constitutive model
49
(see equation (17)). Similar to regression analysis, this paper only constructs a model for the geogrid tensile strength-axial strain by quantifiable morphological parameters such as filling ratio, rib width, and rib height.
Note: ε is the axial strain or elongation of the geogrid (−);
Since only the morphology variation term 

Coefficients of morphology modification terms.
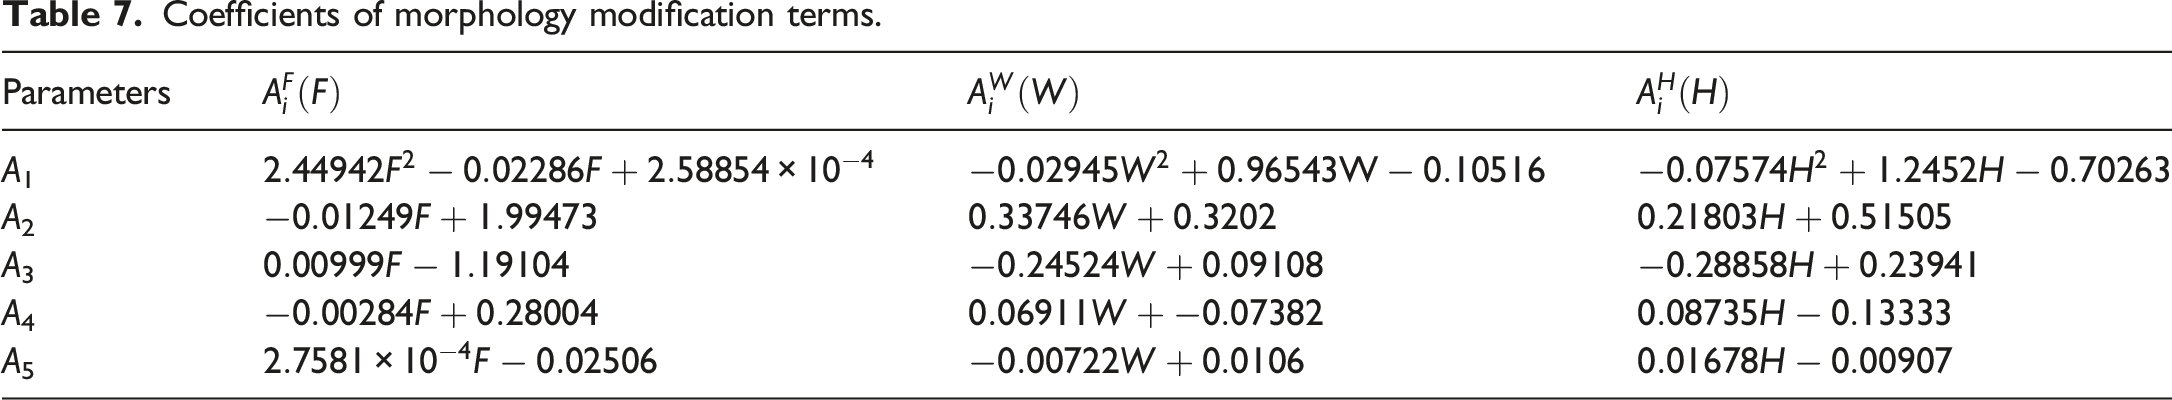
Figure 9 shows a comparison between the predicted and experimental results of the tensile strength-axial strain equation for geogrids. From Figure 9, it can be seen that the predicted results by the equation for geogrids are in good agreement with the experimental results, with a prediction error between −7.5% and 7.5%. In addition, in order to expand the range of applicability of the equation, the study also compared the experimental data and predicted results for geogrids with arbitrary morphology parameters (involving only changes in filling ratio, rib width, and rib height), as shown in Figure 9(d). The results of this comparison indicate that the ability of this equation to predict is quite good. Comparison between predicted and experimental results of the tensile strength-axial strain equation for geogrids; (a) Filling ratio; (b) Rib width; (c) Rib height; (d) Geogrid with arbitrary morphology parameters.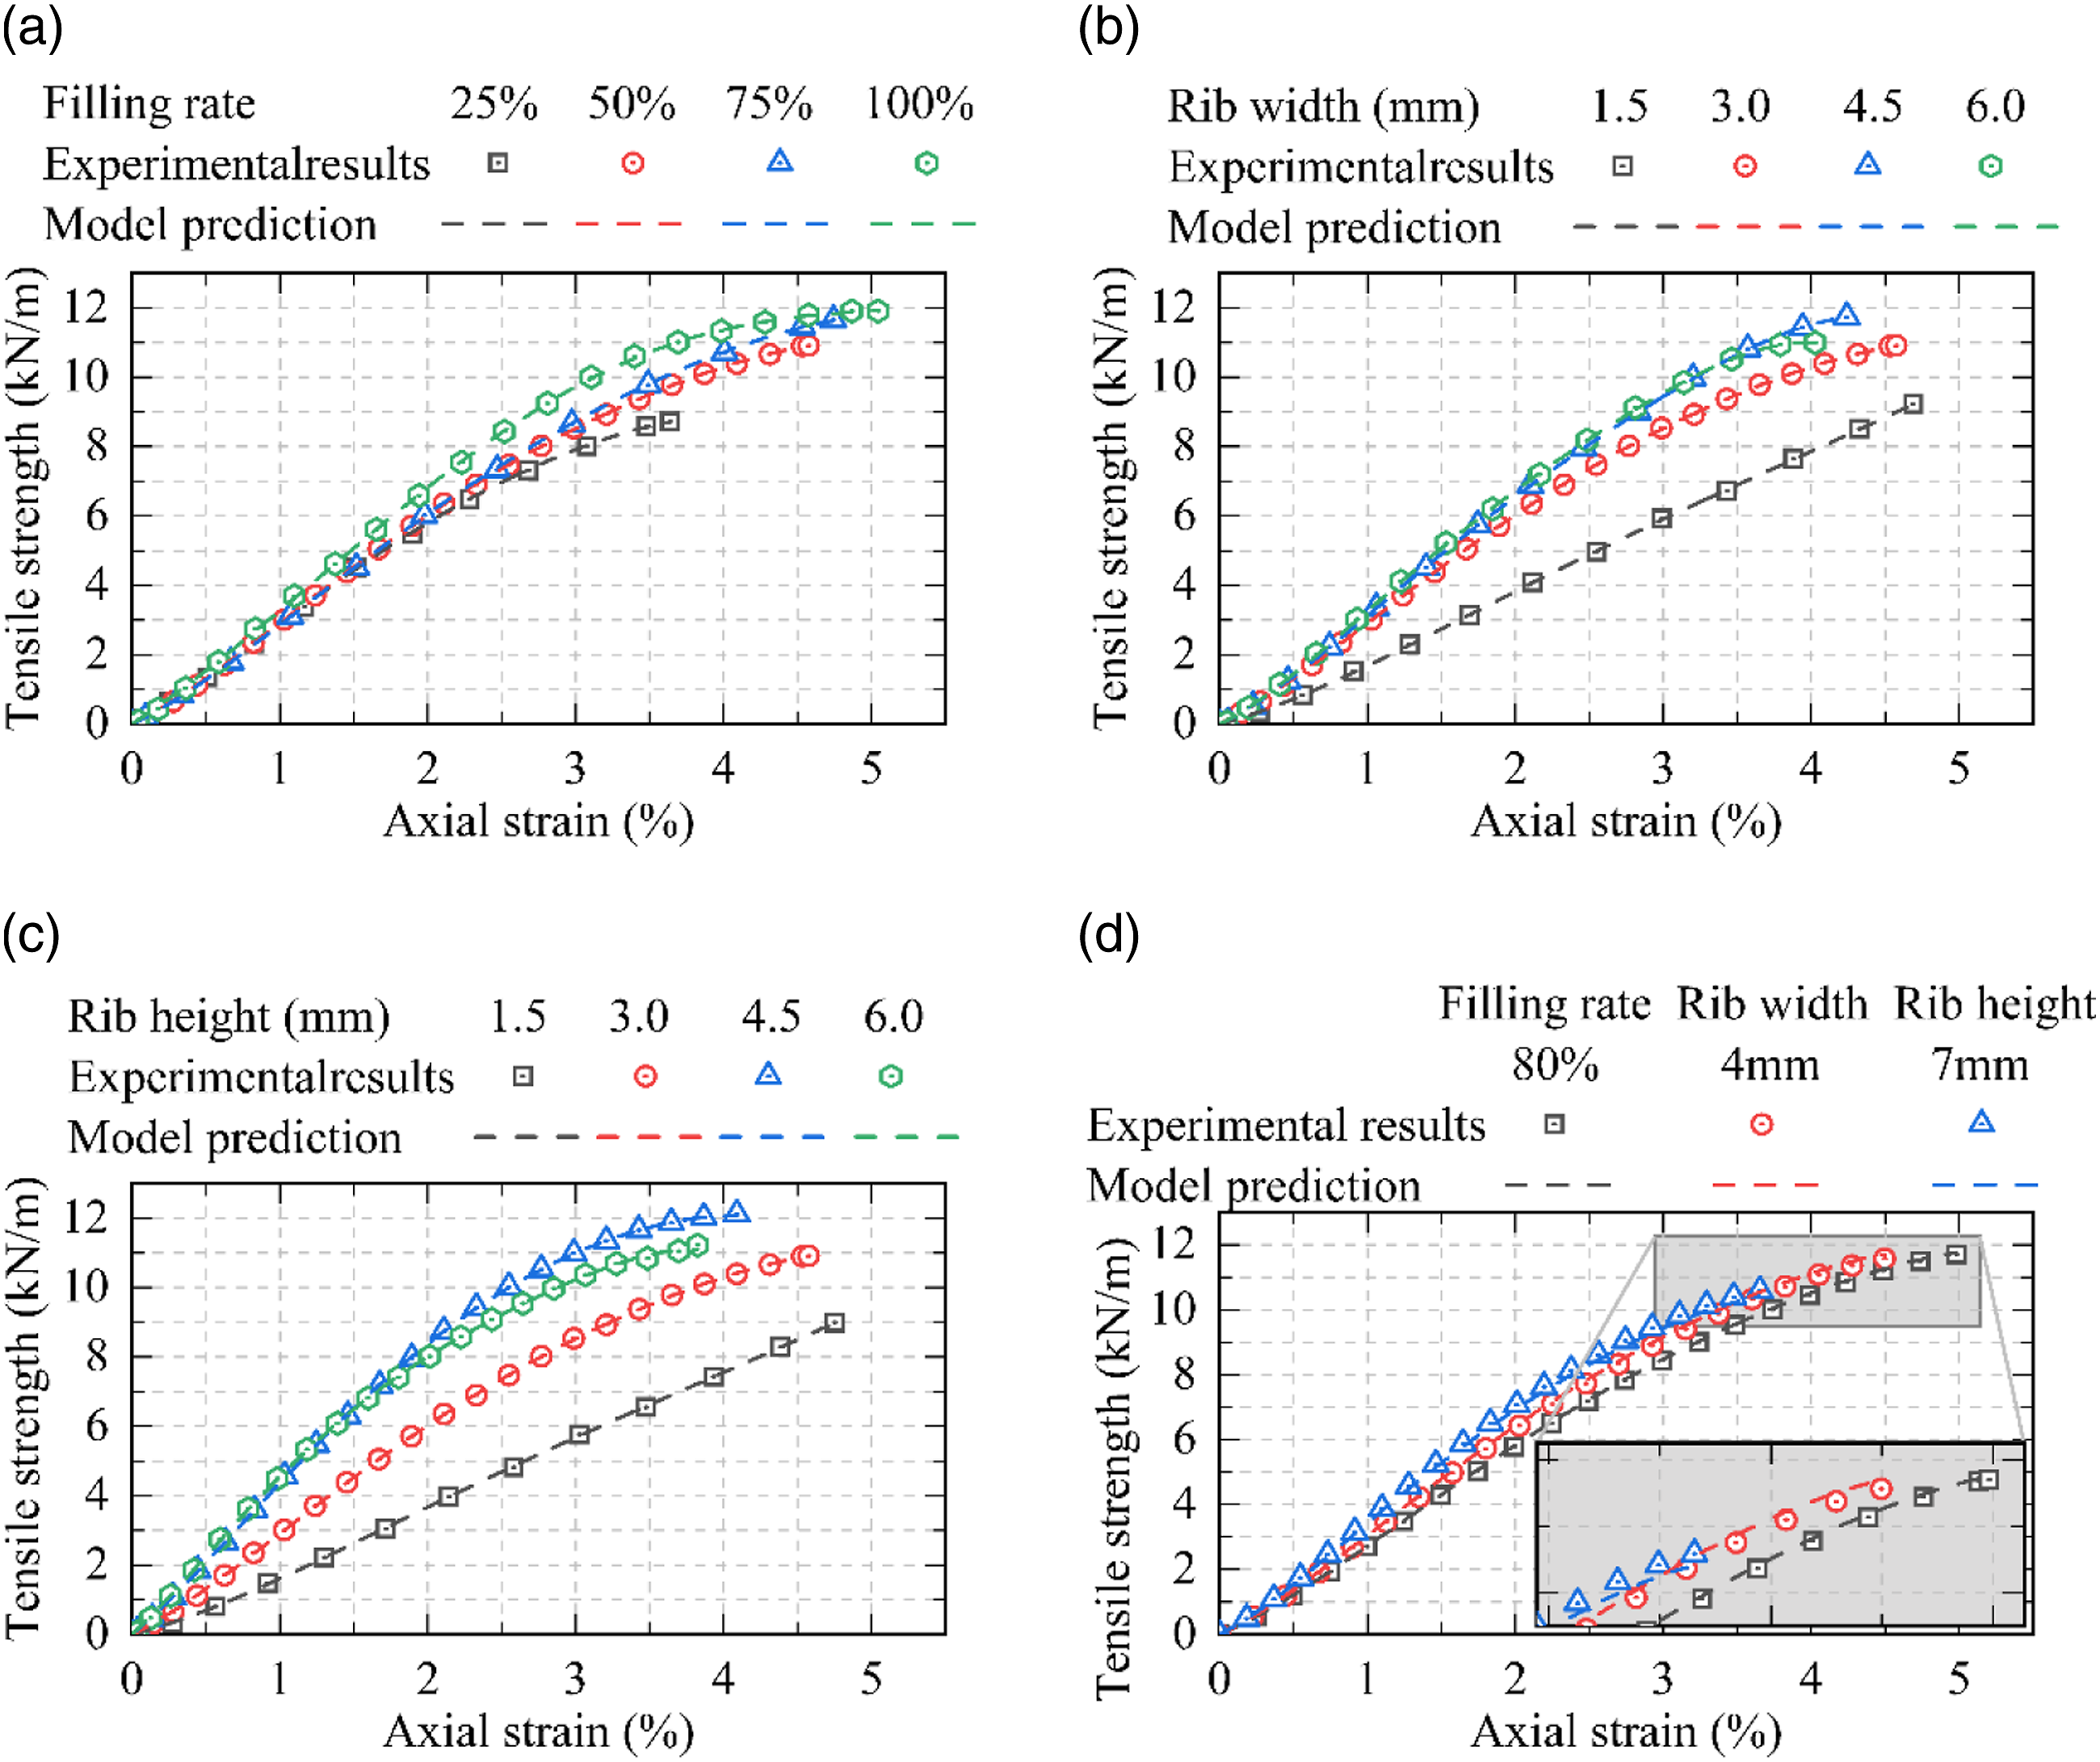
Conclusions
In this paper, the effects of various morphology parameters including material, plane structure, filling rate, rib width and rib height on the tensile properties of geogrids were investigated through indoor tensile tests. The results of the study show the following. 1. The tensile performance of HDPE geogrid will be stronger than that of PLA geogrid, and the horizontal ribs of HDPE geogrid will strengthen the tensile performance of geogrid by the fibres on the outside of the longitudinal ribs. In addition, increasing the filling rate of geogrid will improve the tensile performance of geogrid and reduce the speed of tensile performance improvement of geogrid. 2. For geogrid maximum tensile strength and maximum tensile modulus, both values increase sequentially in the order of biaxial, triaxial and quadaxial geogrids. In contrast, the geogrid elongation at break decreases in the order of the above geogrid. 3. When the rib width and rib height of the geogrid increase by the same value, compared to the rib width, the rib height not only increases the maximum tensile strength of the geogrid more, but also decreases the elongation at break more. 4. The regression analysis shows that the rib width and rib height of geogrid are 4.35 mm and 3 mm or 3 mm and 4.42 mm, respectively, when the geogrid achieves the extreme value of maximum tensile strength.
It must be noted that this paper considers morphological parameters in a more limited way and does not consider other factors such as geogrid rib cross-section shape and strengthed nodes, so more comparisons and studies of such morphology parameters are needed. In addition, there may be over-fitting or under-fitting in the regression analysis of geogrid morphological parameters-tensile performance parameters. Therefore, there is a necessity to develop a more suitable functional model for morphological parameters-tensile performance parameters.
Footnotes
Declaration of conflicting interests
The author(s) declared no potential conflicts of interest with respect to the research, authorship, and/or publication of this article.
Funding
The author(s) received no financial support for the research, authorship, and/or publication of this article.