
Abstract
In this study, waste hazelnut shells (HNS) were powderized and used as the filler for the fabrication of sustainable polymeric composites. HNS based composites can be used for many applications because of their tunable intrinsic brown color for various indoor and outdoor applications including decking applications and furniture that require a natural esthetic appearance. Polypropylene (PP), styrene-b-(ethylene-co-butylene)-b-styrene (SEBS), and 50/50 PP/SEBS blends were used as the polymeric matrixes. HNS concentration was set to 2.5, 5, and 10 wt%. PP/SEBS blend and HNS filled granules were prepared by melt mixing in an extruder. Following that polymeric films were fabricated from the granules by compression molding. The morphological, structural, thermal, mechanical, contact angle, water absorption analyses were performed in order to characterize the composites. Matrix type and filler concentration were found significant for the properties. PP/SEBS blends showed homogeneous morphology. At low concentrations, fillers were well-dispersed. On the other hand, at 10 wt% HNS loading agglomerations were observed and mechanical properties showed a noticeable drop. PP-based composites showed the highest tensile strength and elastic modulus with the lowest tensile strain. SEBS-based composites showed the lowest tensile strength and elastic modulus with the highest tensile strain. PP/SEBS composites showed mechanical properties between PP and SEBS. The incorporation of SEBS into PP increased the flexibility of the composites and resulted in relatively higher strain at break.
Keywords
Introduction
Hazelnut is commonly used as a raw material in dried fruit form for chocolate, confectionery, bakery, and oil industry around the world. It is one of the most significant products in the north-eastern part of Turkey. The hazelnut consumption is assumed to be around 1 million tons. Turkey ranks in the first place in the world in terms of hazelnut production amount, planting area, and export. Although production yield changes from year to year, almost 72% of the total world hazelnut export is provided from that region and 270 thousand tons/year of hazelnut kernels were exported in the last 5 years. The average hazelnut production in Turkey was reported as around 610 thousand tons/year, and 270 thousand tons/year of hazelnut kernels were exported in the last 5 years. Hazelnut consists of shell and kernel, the ratio of shell varies around 55–50 wt%. By considering all these, it could be concluded that around 300 thousands of tons of hazelnut shell (HNS) waste is produced in Turkey. 1 Hazelnut shells consists of 35–55% hemicellulose, 30–35% cellulose, 30-45 lignin and 5–10% ash and volatiles. 2 Because of lignin and cellulose dominant structure, it is evaluated as a lignocellulosic material. Hazelnut shells has various advantages including high abundance, environmentally friendly nature, sustainability, biodegradability, strength, high modulus, antioxidant effect, good thermal endurance, and stability. 3 By using the shell wastes as filler material, the cost of the composite can be reduced thanks to the lower cost of the HNS. The approximate cost of HNS can be given as 25% of polypropylene (PP) and 10% of styrene-b-(ethylene-co-butylene)-b-styrene (SEBS). HNS can be used for various applications such as energy,4,5 biofuel production, 6 active carbon production,7,8 adsorption,9,10 waste water treatment, 11 civil engineering applications,12,13 and polymeric composites.14–32 In all these applications generally, it is mechanically powderized in various sizes. Since the green and sustainable material requirement is increasing, number of the research in the area of HNS filled polymer composite production has been increasing. Hazelnut shells based composites were prepared by using thermoplastics such as PP,14–18 polyethylene,16,19 polylactic acid (PLA),2,20–22 polymethylmethacrylate, 23 and thermosets including epoxy,2,20–22 urea formaldehyde, 24 polyester.25–27 In addition to these, HNS filled polyurethane (PU) rigid foams 28 were also reported in the literature. Also, HNS was mixed with various fillers and hybrid filler-loaded composites were also reported in the literature.29–32 In all these studies the first goal was to lowering the negative environmental impacts of polymeric materials and increasing the bio-material rate in the final product. As obvious from these studies, incorporation of HNS into PP/SEBS, with a low styrene content, polymer blend was not investigated before.
Polypropylene/styrene-b-(ethylene-co-butylene)-b-styrene blends have been analyzed for more than 3 decades. As known PP is a rigid polymer compared to SEBS. In order to improve its morphological, mechanical properties, and processability, it can be mixed with SEBS. In the literature, various SEBS morphologies (molecular weight, block size) were studied at different PP/SEBS ratios. As reported in these studies, incorporation of SEBS led to lowering in Tg, tensile strength, elastic modulus, yield stress, increase in yield strain, tensile strain, toughness, bendability, and flexibility because of an increase in rubbery phase in the blend. However, the level of change was reported to be directly related with PP/SEBS ratio.33,34 These tunable properties opened various application areas. Although it was not mentioned in a detailed way in these studies, there are a couple of critical points those should be considered before blending these polymers. The melt flow index (MFI) values of the polymers and SEBS morphology are of importance for processing, mixing efficiency and final product properties. In the literature, various PP matrixes were used. However, almost the same SEBS morphology was preferred. In most of these studies, styrene (S) and ethylene-butylene (EB) S/EB ratio was generally 30/7033−36, 29/71 37 , and in some studies S/EB ratio was not given. 38 In these studies, SEBS content was in the range of 0–10 wt%, 36 0–25 wt%,33–35 20–80 wt%, 38 30–70 wt%. 37 As reported by Setz et al., 37 since S phase is not compatible with PP, EB midblock of SEBS was found responsible for the blending efficiency that was basically stemmed from the similar chemical structure of EB phase and PP. Because of above mentioned reasons, low styrene content SEBS S/EB: 13/87 was used for the PP/SEBS blend preparation. As far as reviewed, there are limited studies about PP/SEBS blends with this composition. One of the studies, SEBS with the S/EB ratio of 13/87 was used. 39 The PP/SEBS blends were fabricated in different compositions via twin screw extruder. It was reported that the tensile strength of the blend decreased and tensile strain increased with the incorporation of SEBS compared to PP. In this study, as a natural filler material, talc was used in PP/SEBS blends. The nucleating effect was investigated and talc incorporation led to increase in mechanical properties. In some studies about polymeric composites that contain natural fillers such as HNS, almond shell, and olive shell; compatibilizers, plasticizers, lubricants, or different additives were used to increase polymer-filler interaction. However, effect of so called materials weren’t investigated in details.14,16,40,41 In this study, the aim was to fabricate sustainable, polymeric composites that had homogenous blend morphology without any plasticizer, compatibilizer, or additives to maintain natural, sustainable characteristics. Hazelnut shell wastes were used as fillers to produce low-cost, sustainable, flexible polymer-based composites with natural esthetic appearance. In this study, PP, SEBS (S/EB: 13/87), and 50/50 PP/SEBS matrixes were used in order to fabricate HNS loaded composites. PP/SEBS granules and 2.5, 5, and 10 wt% HNS filled composite granules were prepared by extrusion mixing and films were fabricated by compression molding. The morphological, structural, thermal, mechanical, contact angle, water absorption analyses were performed.
Materials
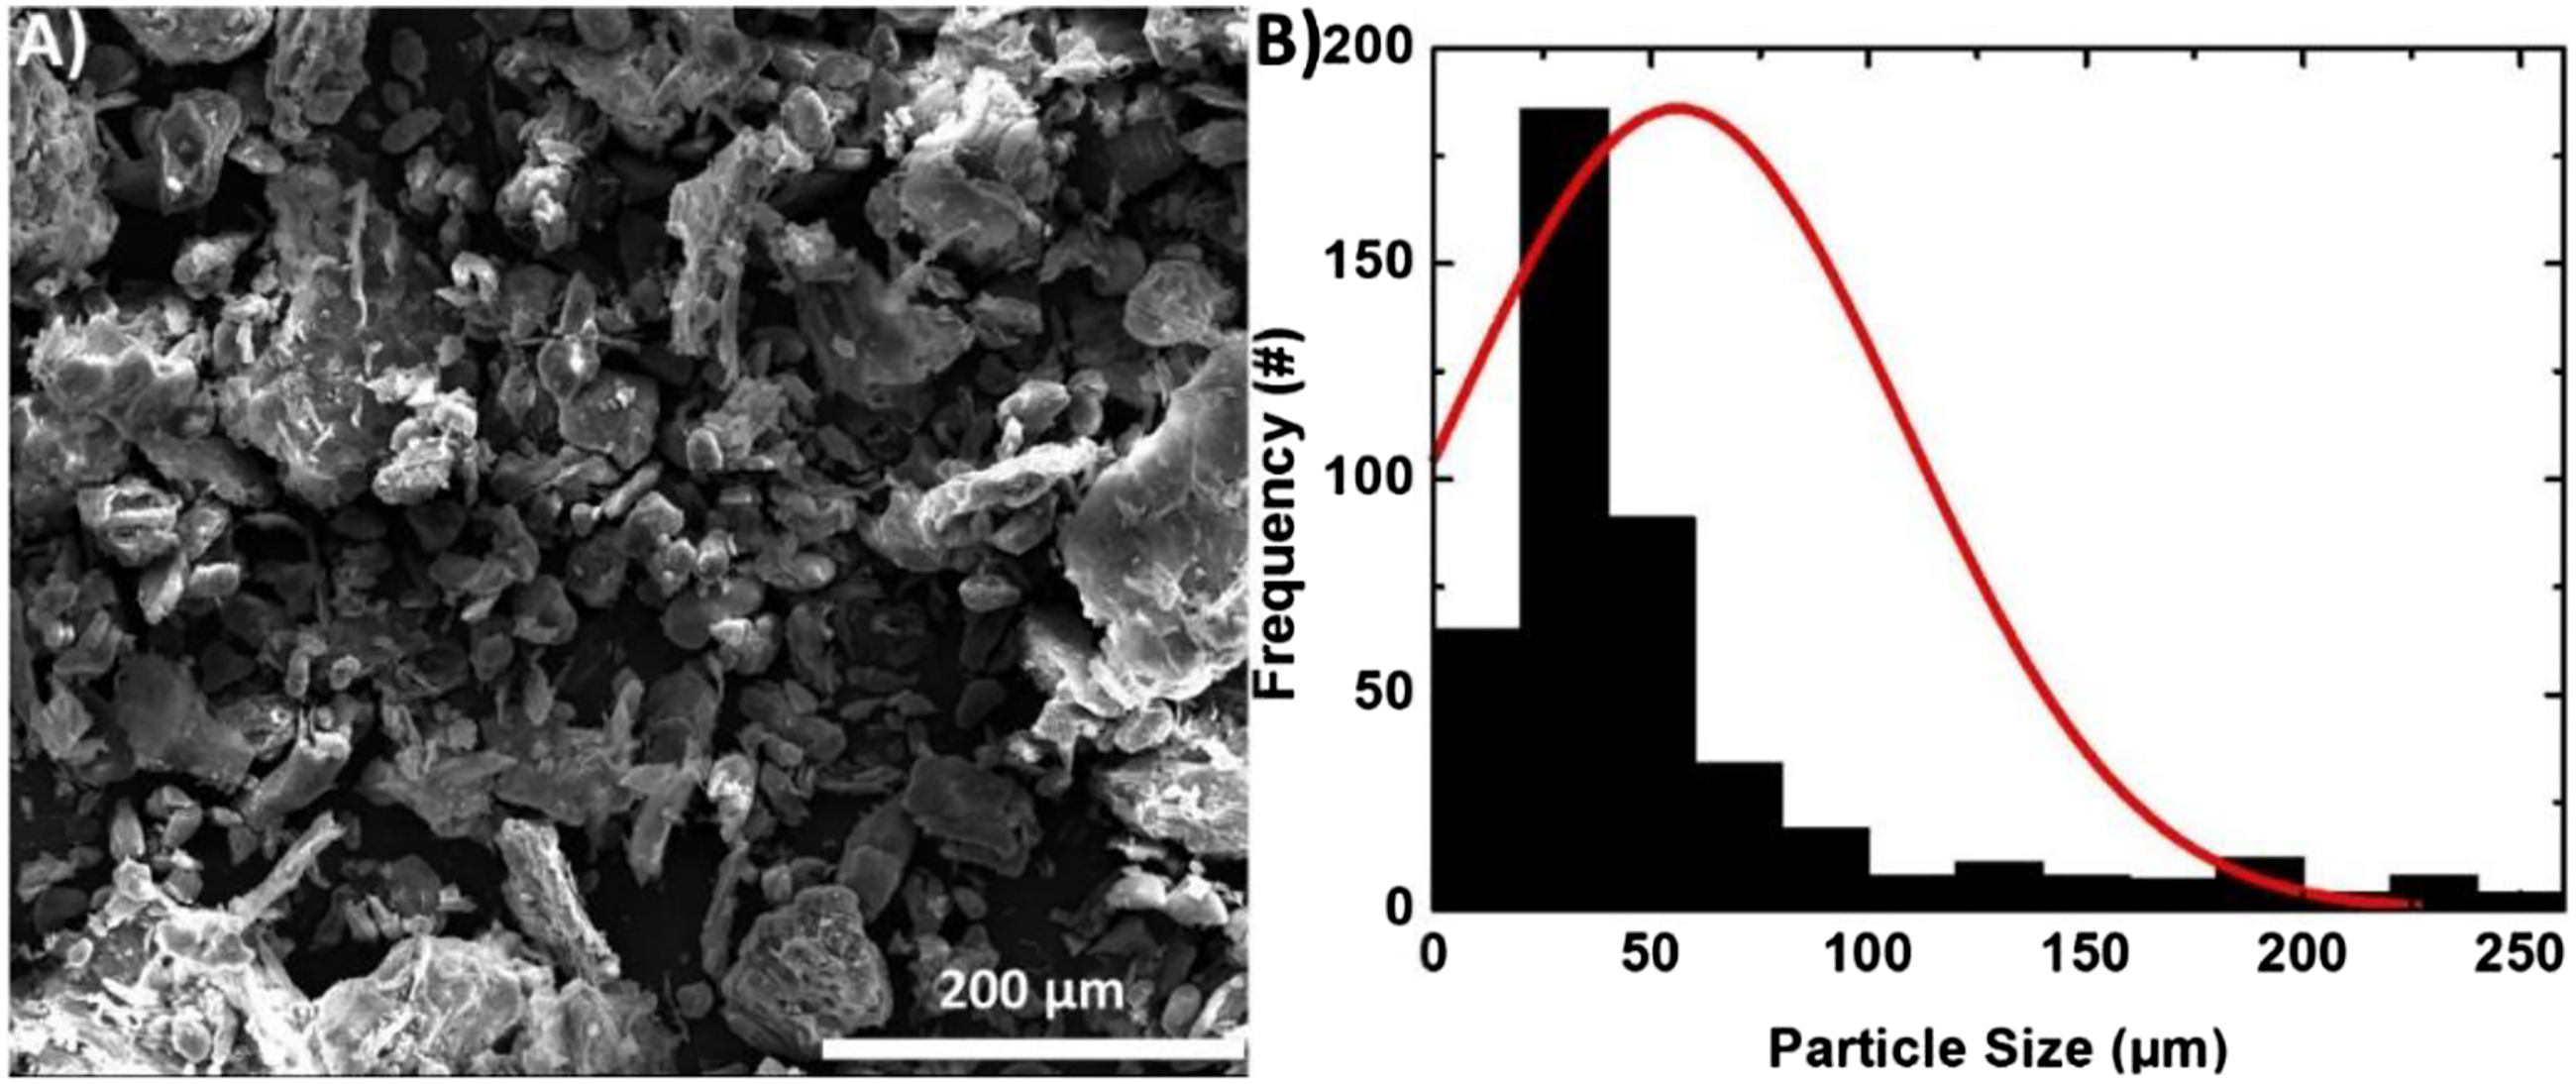
Polypropylene homopolymer Isplen PP070G2M with the MFI of 12 g/10 min (under 2.16 kg load at 230°C) was kindly supplied by Repsol Chemicals. The triblock copolymer SEBS (Kraton, G1657) with S/EB ratio of 13/87 and MFI of 22 g/10 min (under 5 kg load at 230°C). The dried hazelnuts were harvested in August 2019 from Gorele, Giresun (Black Sea region, Turkey) were used to obtain the hazelnut shell powder (HNS). HNS was obtained as shown in Figure 1. The fruit and shell were separated and the shell was grinded by a grain mill (Lavion, HC–100 model, 28,000 r/min). Following that, the powder was sieved by using a mesh. The average particle size was calculated from the field emission scanning electron microscope (FESEM) image by using Image J software. Since some of the particles were not circular, both width and length of these particles were measured and average value was used as the particle size. As shown in Figure 2, particles showed size range between 10-250 μm, and the average particle size was determined as 56 μm. Preparation of the hazelnut shell powder. (a) SEM image of the hazelnut shell powder, and (b) particle size distribution histogram.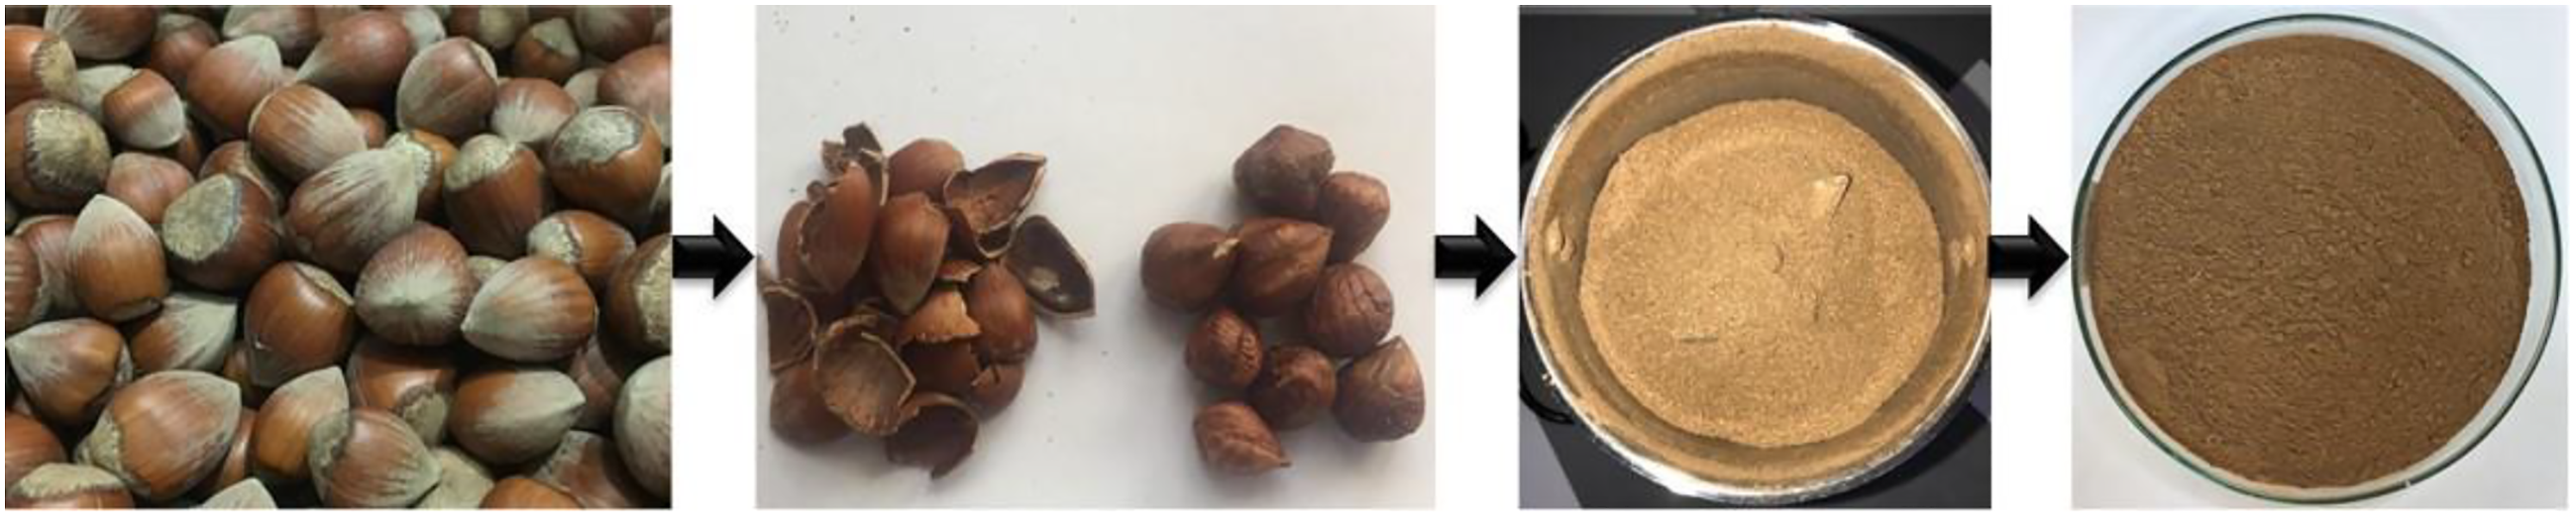
Preparation of the composites
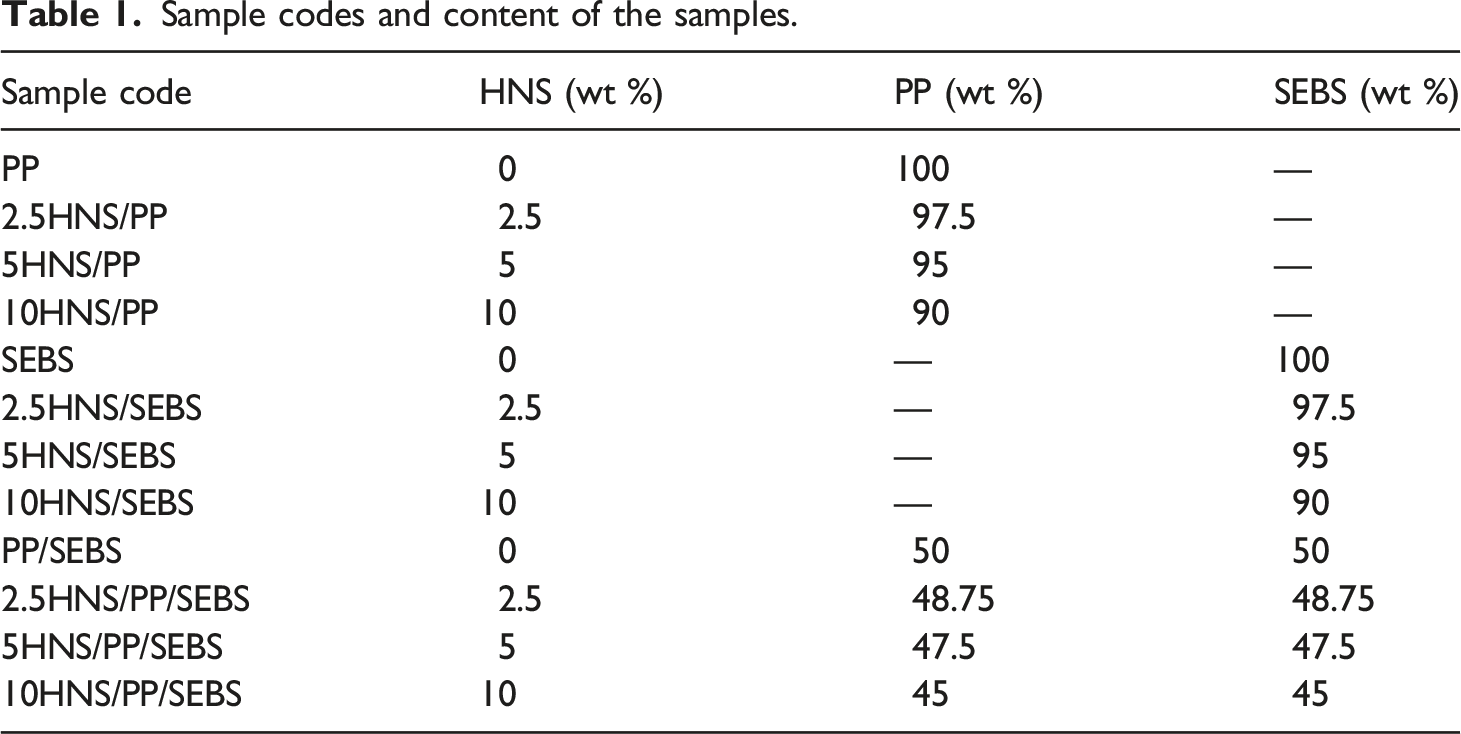
Sample codes and content of the samples.
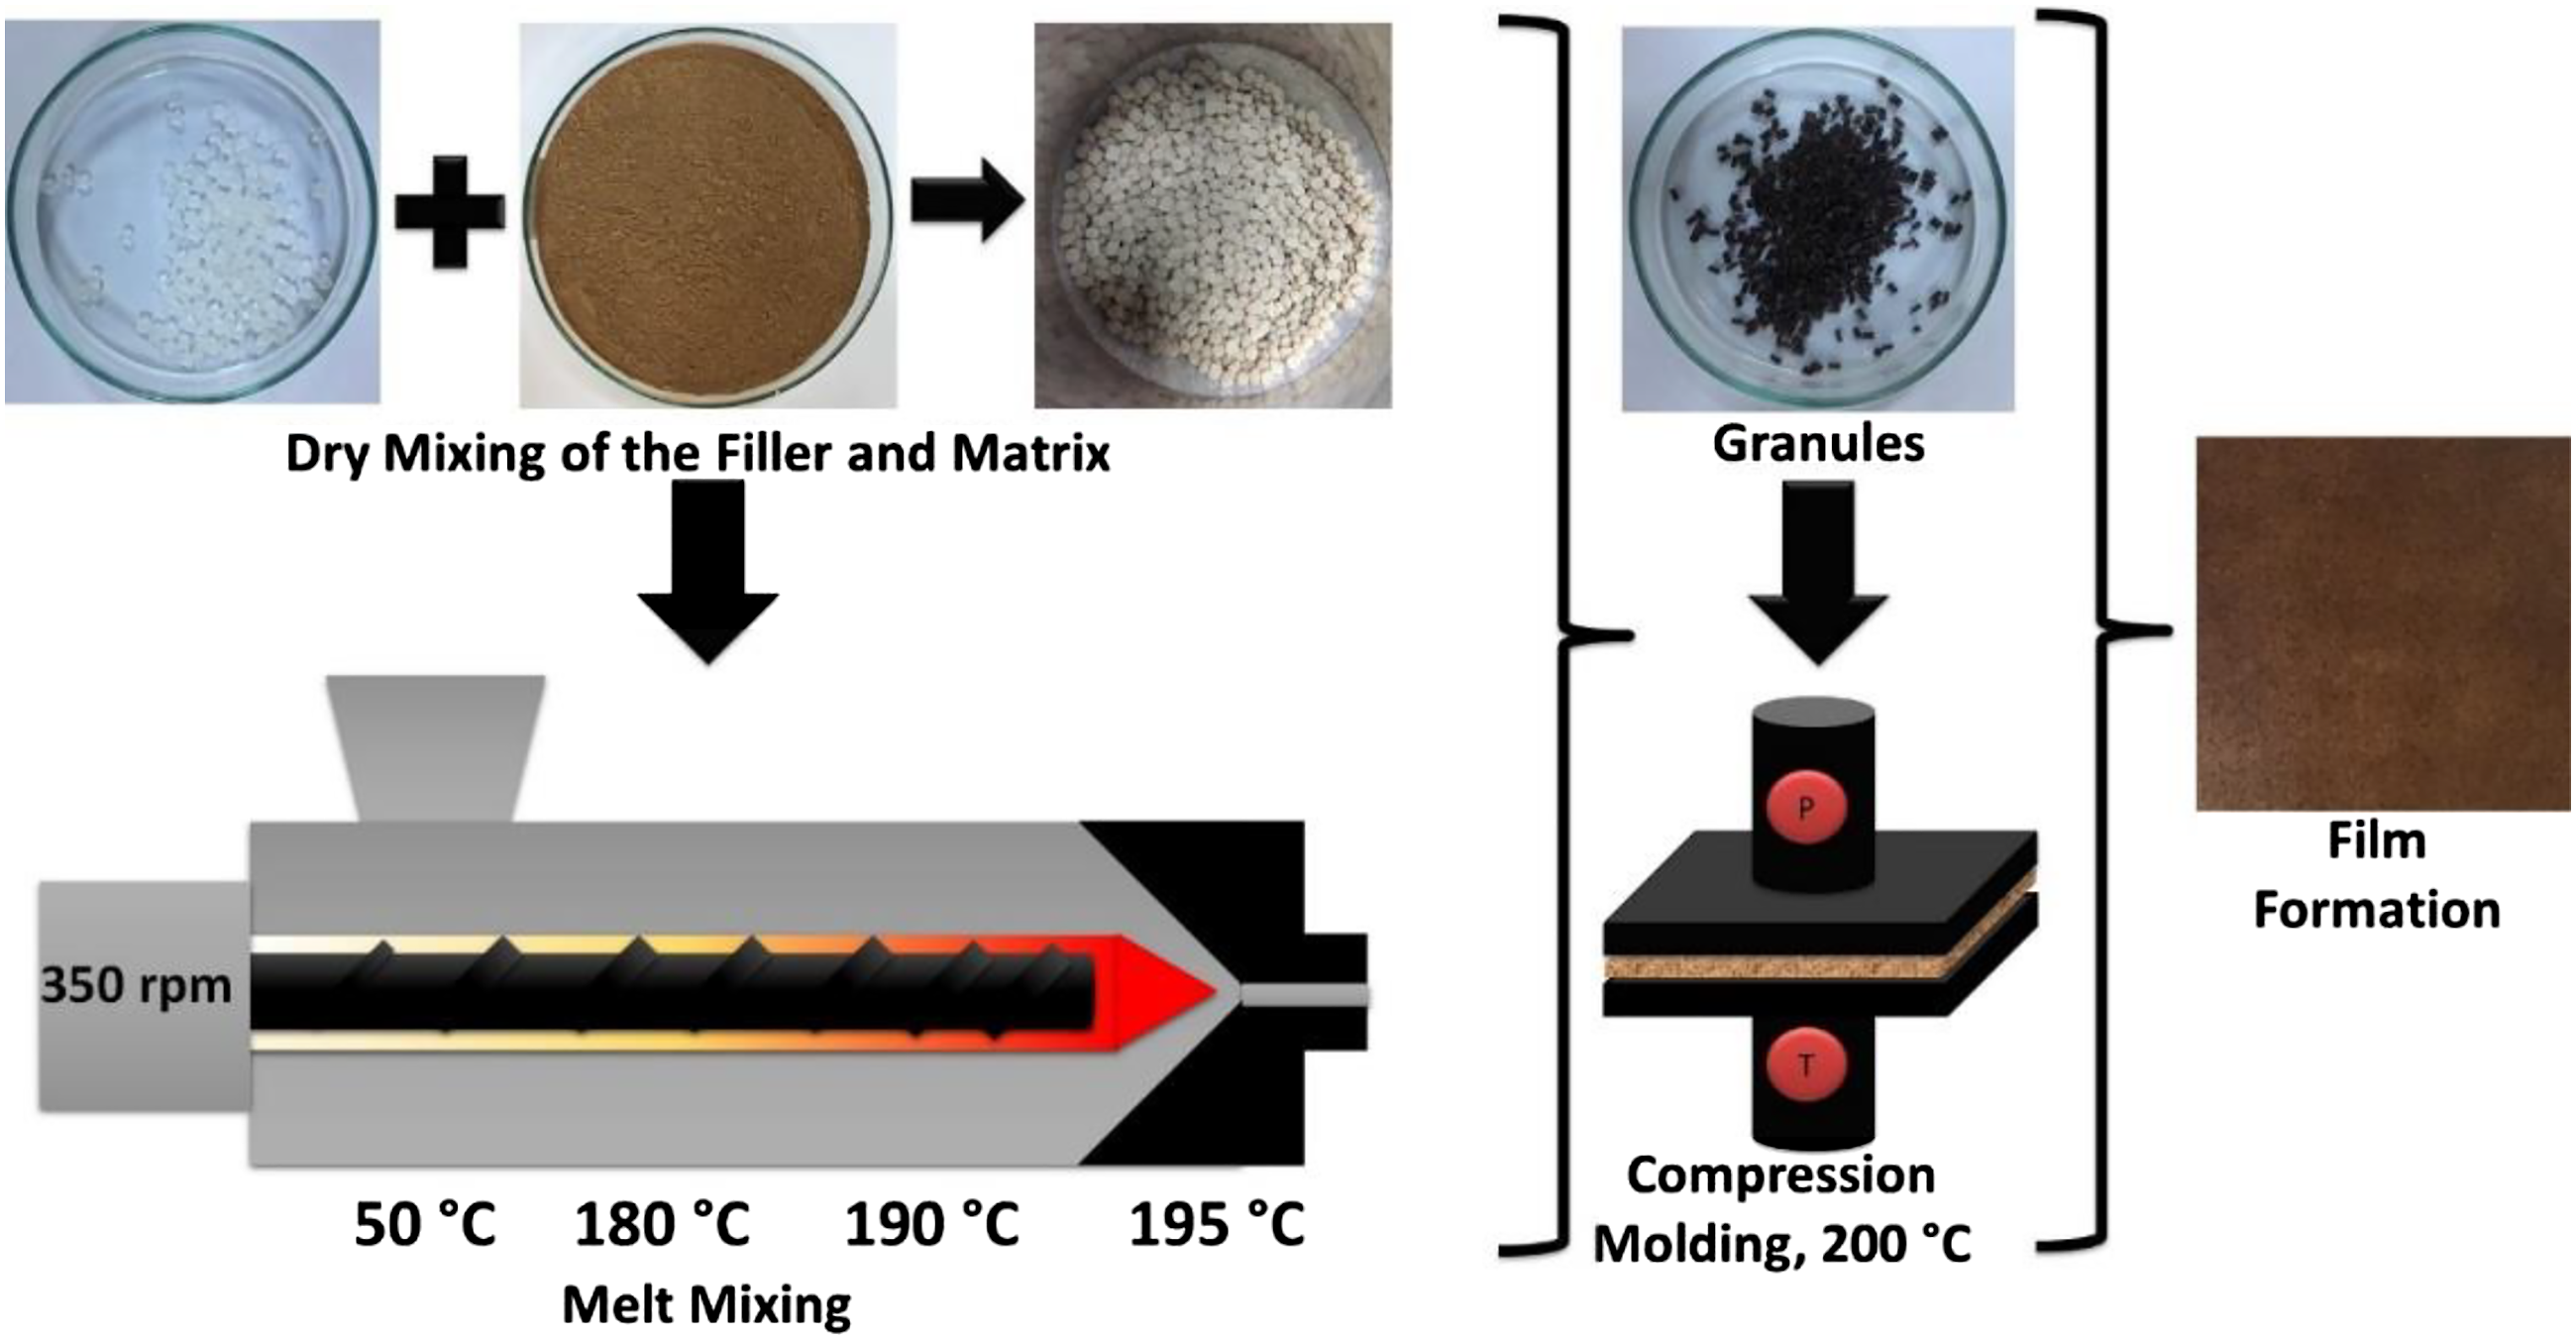
Dry mixing of the filler and matrix and processing conditions.
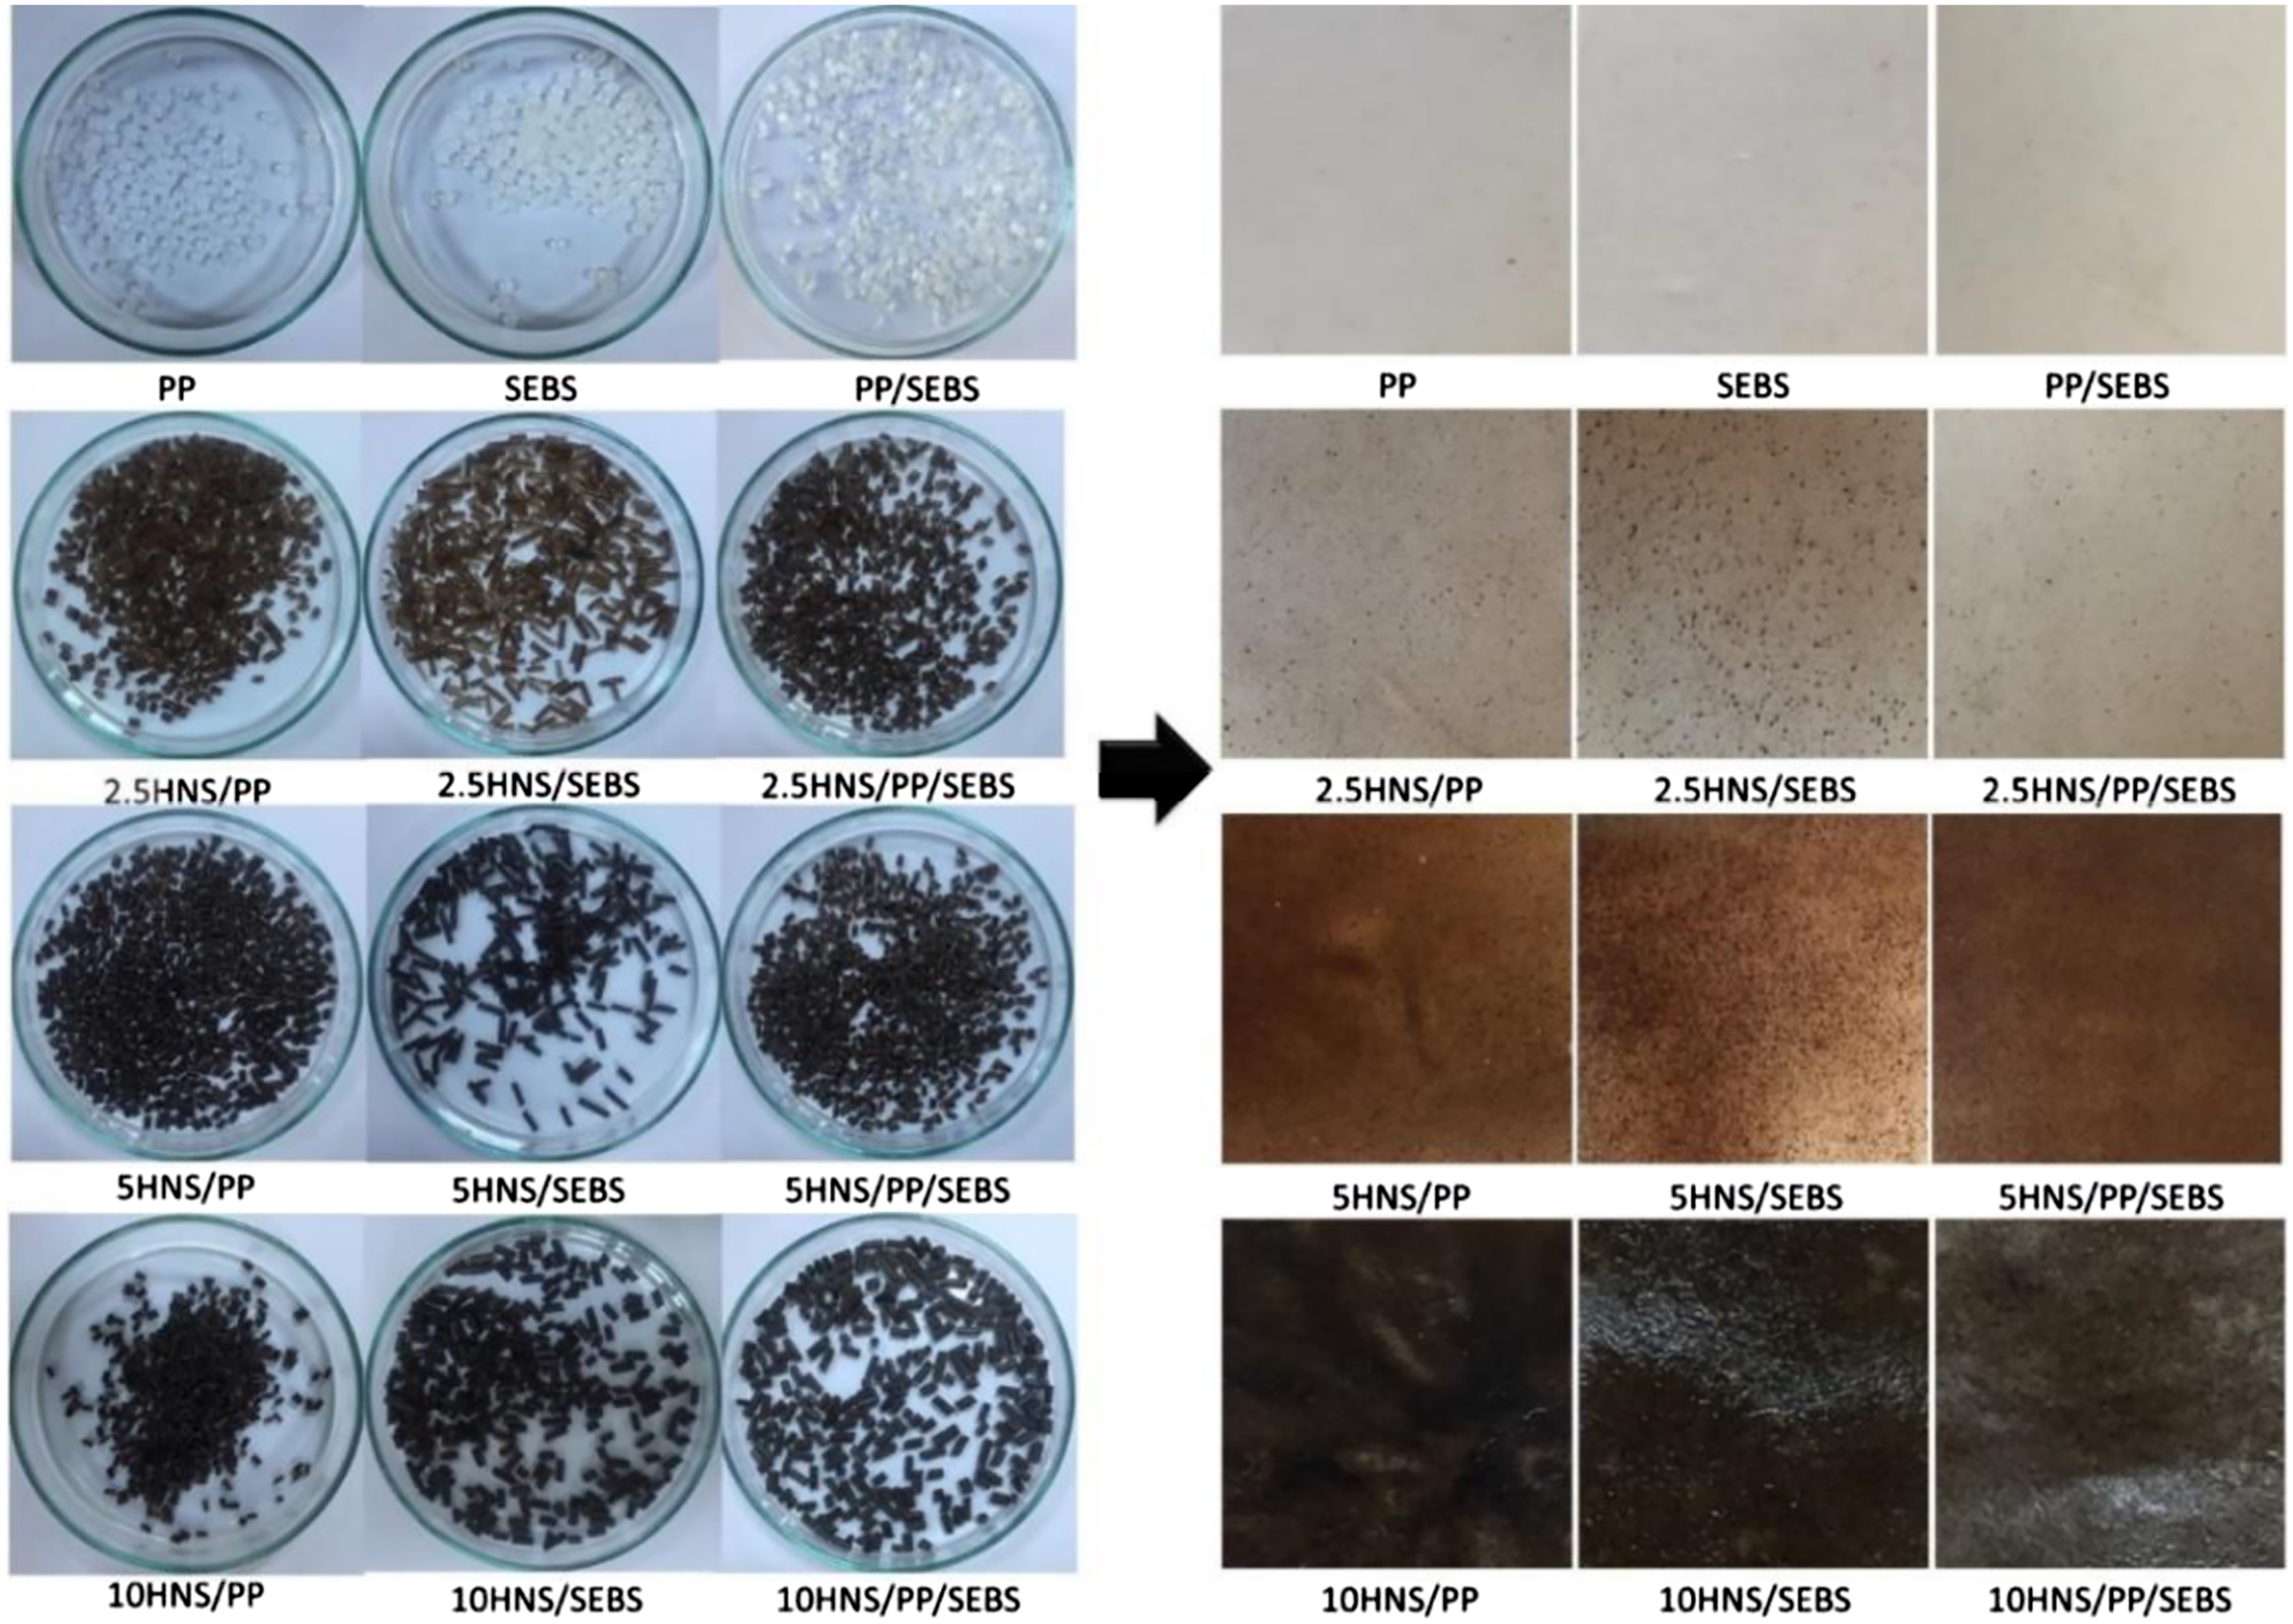
Digital images of the granule samples and corresponding films prepared by compression molding.
Characterization of the composites
Morphological analysis
The morphology of the HNS and samples were analyzed by a FESEM at 20 kV. All film samples were cut by a blade and sputter-coated (Au/Pd alloy, 3–6 nm) before the analysis. In order to analyze filler dispersion and interaction with the matrix, cross-sectional images were captured at various magnifications.
Fourier transform infrared spectroscopy
IR spectrometer, and attenuated total internal reflectance (ATR mode, Perkin Elmer, Spectrum 100) spectroscopy were used for the Fourier transform infrared spectroscopy (FTIR) analysis. Spectra were recorded between 650 and 4000 cm−1 in the transmittance mode with a spectral resolution of 4 cm−1 at a scan rate of 4 scans.
Thermogravimetric analysis
Thermogravimetric analysis (TGA) was carried out by Seiko, TG/DTA 6300 between 25 and 610°C under the nitrogen atmosphere with a gas flow of 200 mL min−1 and temperature increase rate of 10°C min−1. Thermogravimetric analysis and derivative thermogravimetric (DTG) curves were used for the analysis of the thermal behavior.
Mechanical characterization
The stress-strain behavior of the PP, SEBS, PP/SEBS blend films and their HNS filled composite films was characterized by a mechanical testing system (Devotrans, DVT GPU/RD). The stress-strain graphs were given as engineering stress and strain. Before the test, sample thickness was determined by a thickness meter (Asimeto). The test speed was 50 mm min−1, specimens were cut from the film in both directions with the dimensions of 5 mm × 15 mm (width × length) and for each composite type, 4 specimens were tested.
Contact angle analysis
In order to measure the contact angle values, a home-made goniometric measurement system (a syringe (1 mL), a digital video camera and a stage) and Image J software were used. 42 Images were captured 3–4 s after water was dropped onto the sample surface (at 25–26°C, under 65% RH) from 10 cm height.
Water absorbency
For the water absorbency tests, samples were vacuum dried at 85°C for 24 h to in order to remove the absorbed water and reach constant weight. Following that, plastic bottles were filled with 20 g of distilled water, films were immersed in water and caps were closed tightly (25°C, 65 RH). The water absorption test was performed for 288 h and periodically every 24 h samples were removed from water, surface water was gently dried with filter paper and weighed. Water absorption % (WA%) was calculated as follows: WA% = (Wa–W0/W0)*100 where W0, dried sample weight, Wa, weight of the sample after water absorption.
Results and discussion
Morphological analysis
The cross-sectional morphology analysis of the HNS filled composites were performed by FESEM. Filler distribution, filler aggregation, and filler-matrix interaction were compared in terms of filler concentration and matrix type. As can be seen from the Figures 5–7, PP, SEBS, and PP/SEBS were completely molten under given compression molding conditions and by increasing the filler concentration, the HNS amount increased in the scanned region. For 2.5 and 5 wt% HNS filler loading all sets showed homogeneous filler dispersion. Since fillers were in the particle form, no dominant filler orientation was observed for all composites. SEM images of HNS/PP composites at 1000x and 5000x a) 2.5HNS/PP, b) 5HNS/PP, and c) 10HNS/PP SEM images of HNS/SEBS composites at 1000x and 5000x a) 2.5HNS/SEBS, b) 5HNS/SEBS, and c) 10HNS/SEBS SEM images of HNS/PP/SEBS composites at 1000x and 5000x a) 2.5HNS/PP/SEBS, b) 5HNS/PP/SEBS, and c) 10HNS/PP/SEBS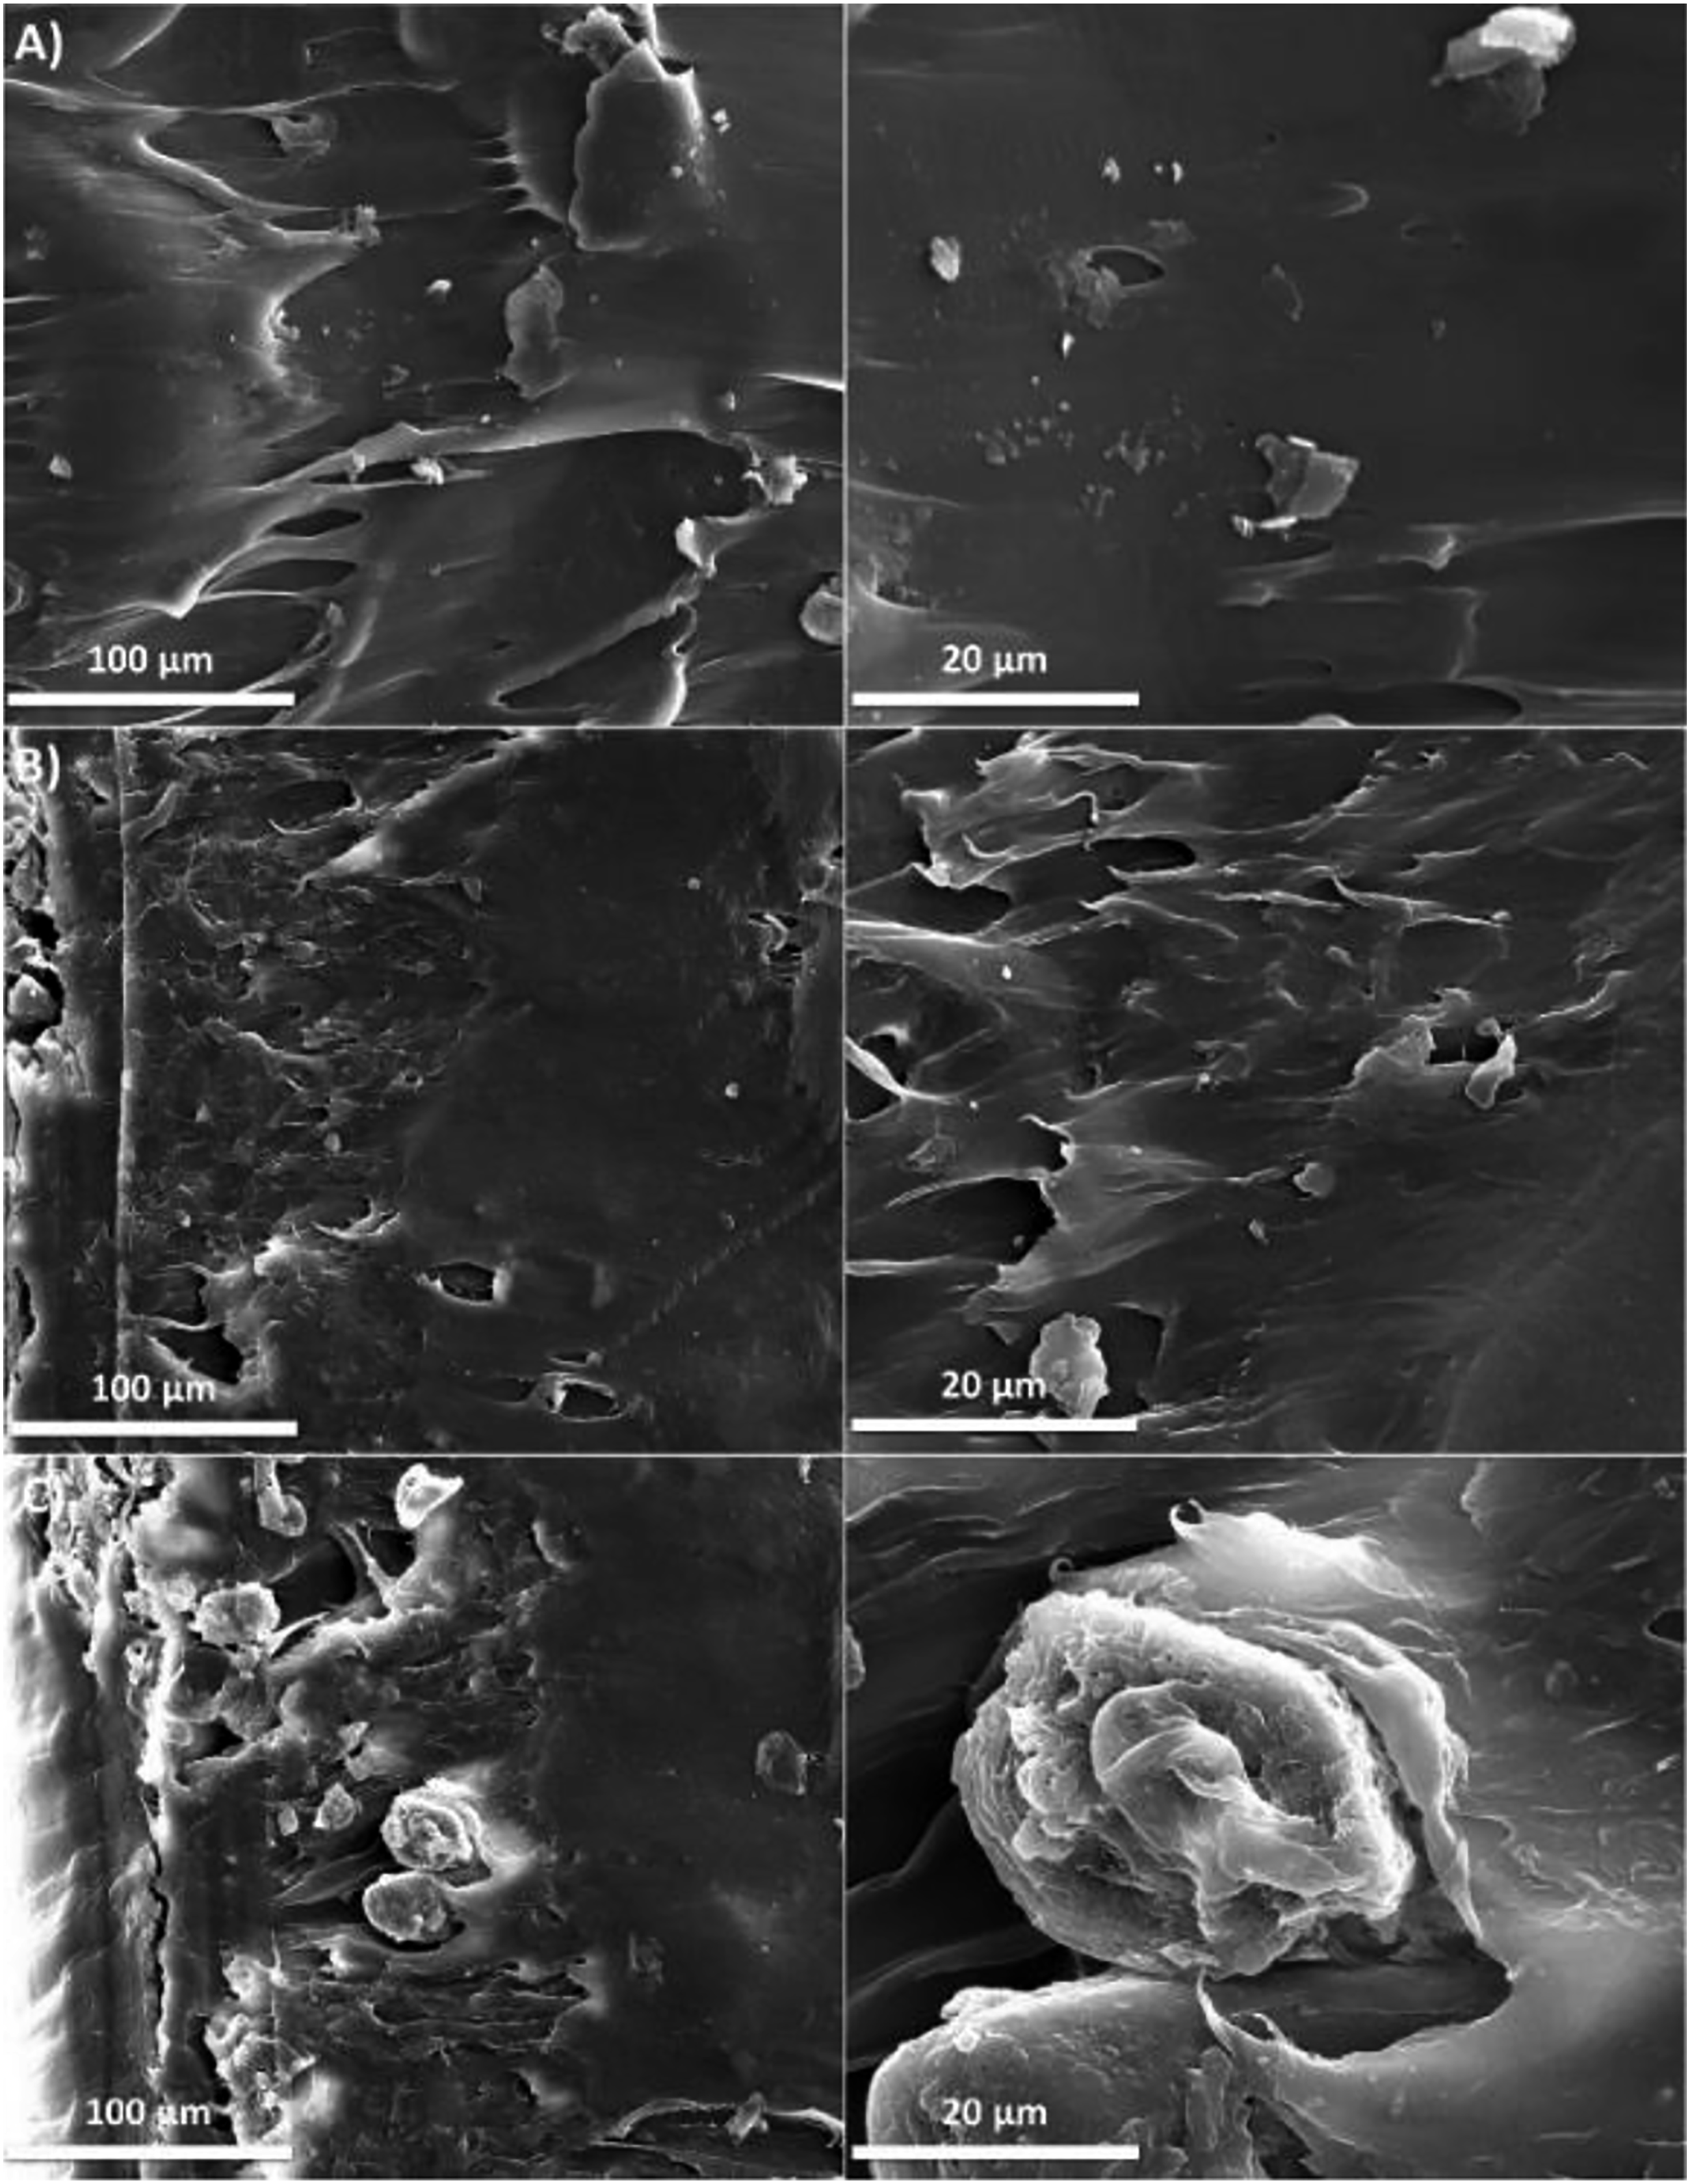
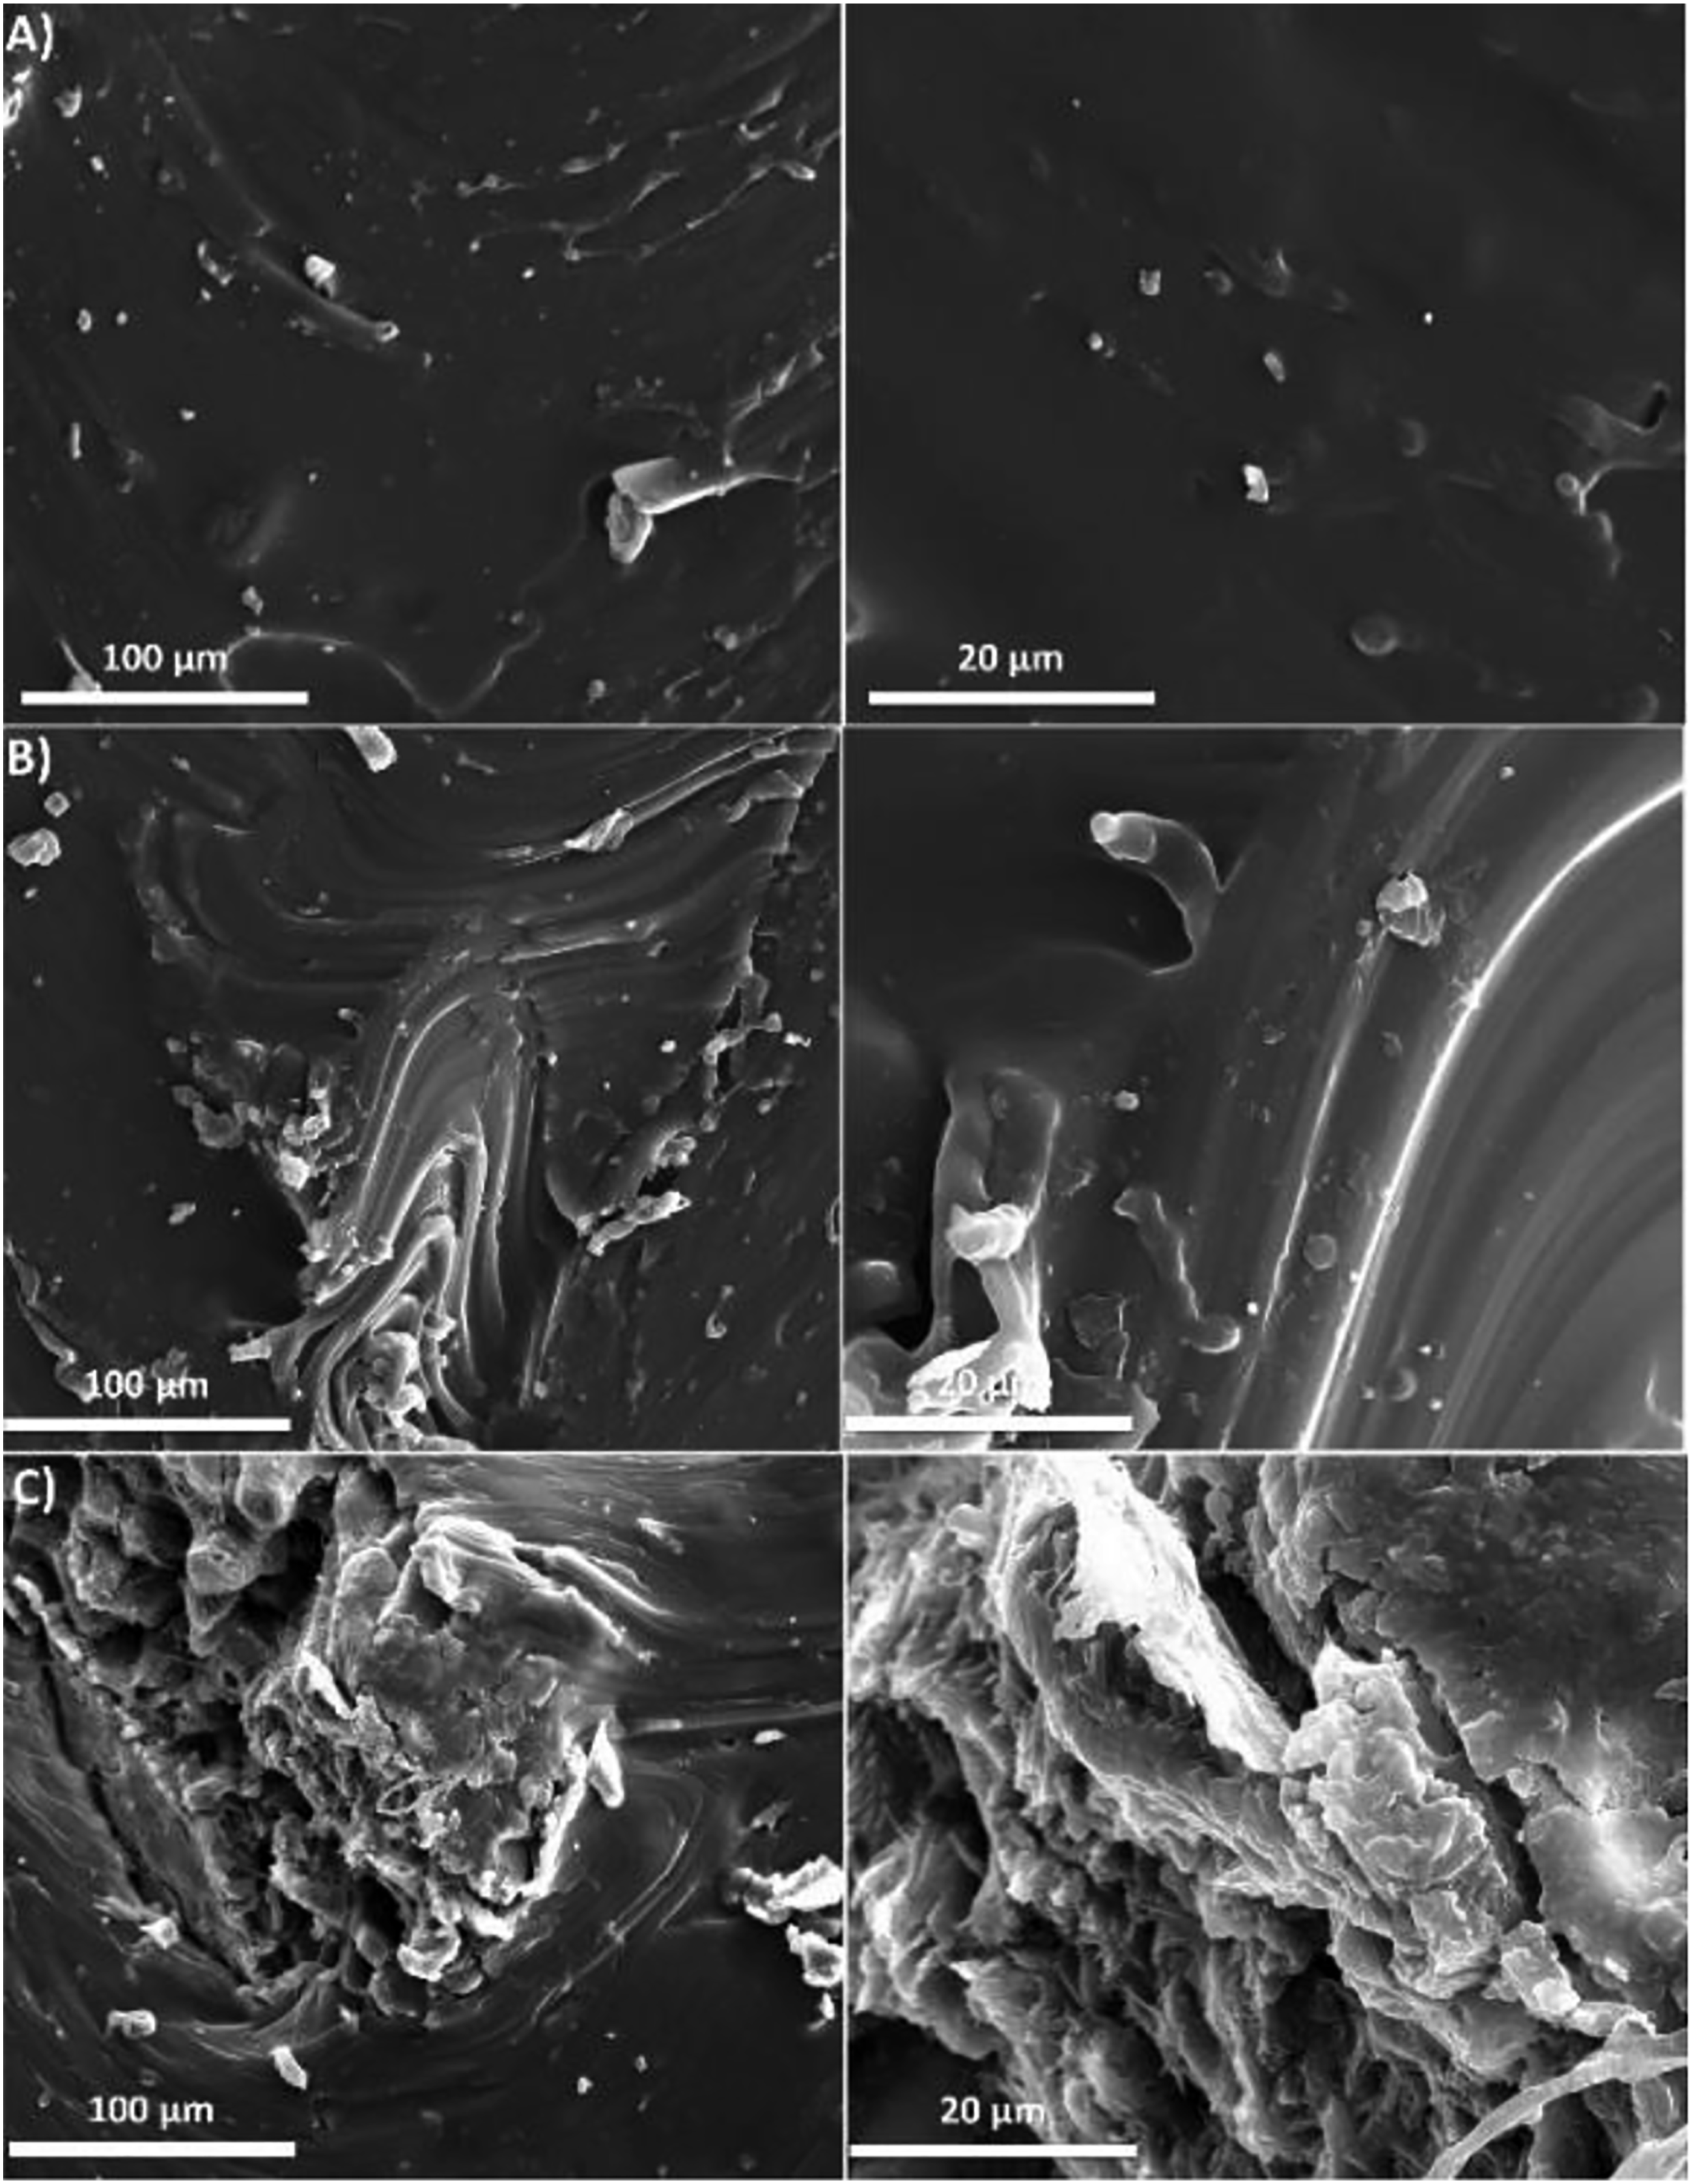
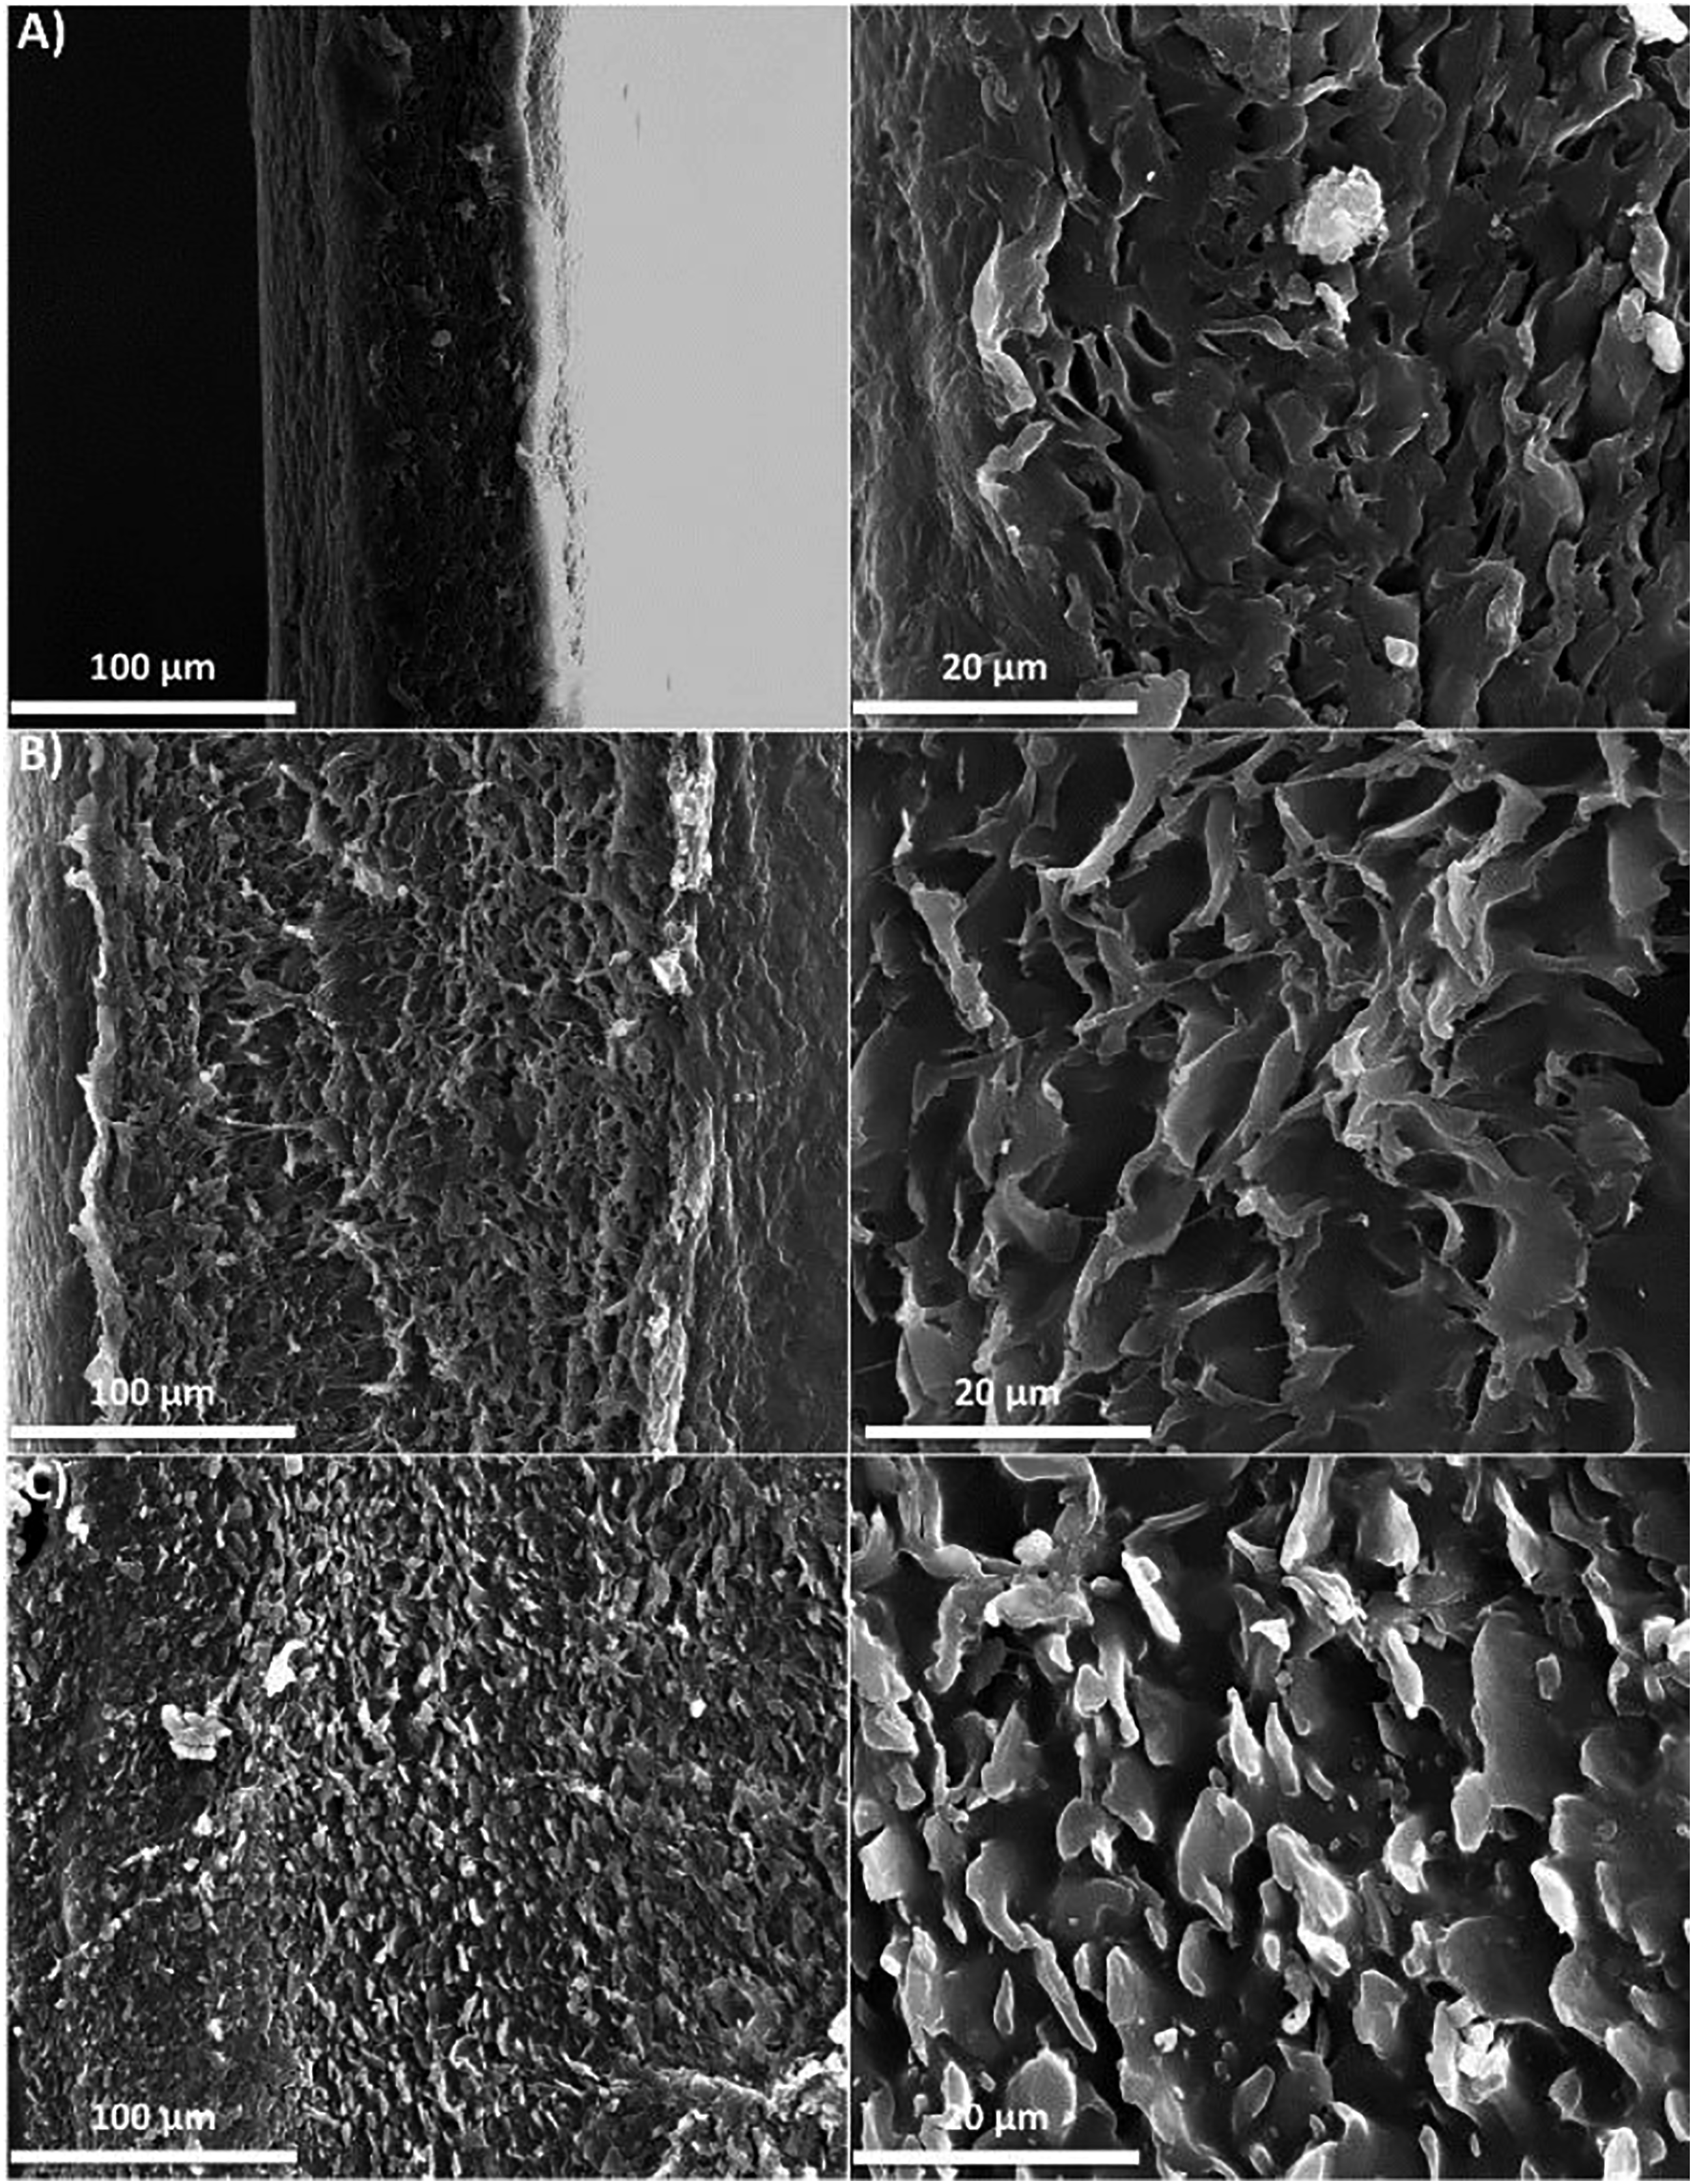
For PP and SEBS matrixes, at 10 wt% HNS loading aggregation was obvious, on the other hand for PP/SEBS blend fillers seemed to be well-dispersed throughout the composite and HNS wetting was also observed to be good. The PP/SEBS 50/50 blend showed an interconnected morphology as previously reported by Setz et al. 37 for all filler loadings.
FTIR analysis
The FTIR spectrum of PP, SEBS and PP/SEBS can be seen from Figure 8. The characteristic peaks of PP were observed as follows 2950 cm−1 (asymmetrical CH3 stretching), 2917 cm−1 (asymmetrical CH2 stretching),
43
2838 cm−1, (CH3 stretching),
43
1453 cm−1, 1375 cm−1, (symmetrical CH3 bending), 1167 cm−1, 997 cm−1, 972 cm−1, 840 cm−1, 808 cm−1 (wagging C-H, rocking, CH3 rocking C-H, stretching C-C).44–46 SEBS showed characteristic peaks around 2920 cm−1 and 2851 cm−1 (C-H stretching),47–50 1599, 1460 cm−1 (skeleton deformation vibration of aromatic ring moieties, benzene ring), 1378 cm−1 (–CH vibration of CH3),42,47,48,51 1028 cm−1 (C-H in-plane-deformation bending of aromatic ring),48,52 759 cm−1 (aromatic, styrenic-CH bending).45,53 Since PP and SEBS showed similar peaks between 4000-1600 cm−1, as given in Figure 8(b) and (c) PP/SEBS blend also showed peaks at 2952 cm−1, 2918 cm−1and 2850 cm−1. The peak at 2950 cm−1 observed for PP and 2960 cm−1 observed for SEBS shifted in between for PP/SEBS and observed at 2952 cm−1. The peak at 2917 cm−1 observed for PP and 2920 cm−1 observed for SEBS shifted in between for PP/SEBS and observed at 2918 cm−1. PP/SEBS blend showed homogeneous blend structure between 2870-2825 cm−1, both peaks belonged to PP and SEBS were observed with low intensity. Between 2800-1300 cm−1 both PP and SEBS showed similar behavior, as a consequence of this no significant difference was observed for PP/SEBS blend. Since between 1300-800 cm−1 SEBS did not show any significant peak intensity, in this range PP/SEBS blend showed the same peaks observed for PP. Likewise, 800-650 cm−1 PP did not show any significant peaks and for PP/SEBS blends same peaks were observed as in SEBS.45,53 FTIR spectrums of a) PP, SEBS and HNS, b) PP/SEBS, 10HNS/PP, 10HNS/SEBS, 10HNS/PP/SEBS composites, and c) zoom-in of 3200-2700 cm-1 and 1700-600 cm-1 spectral regions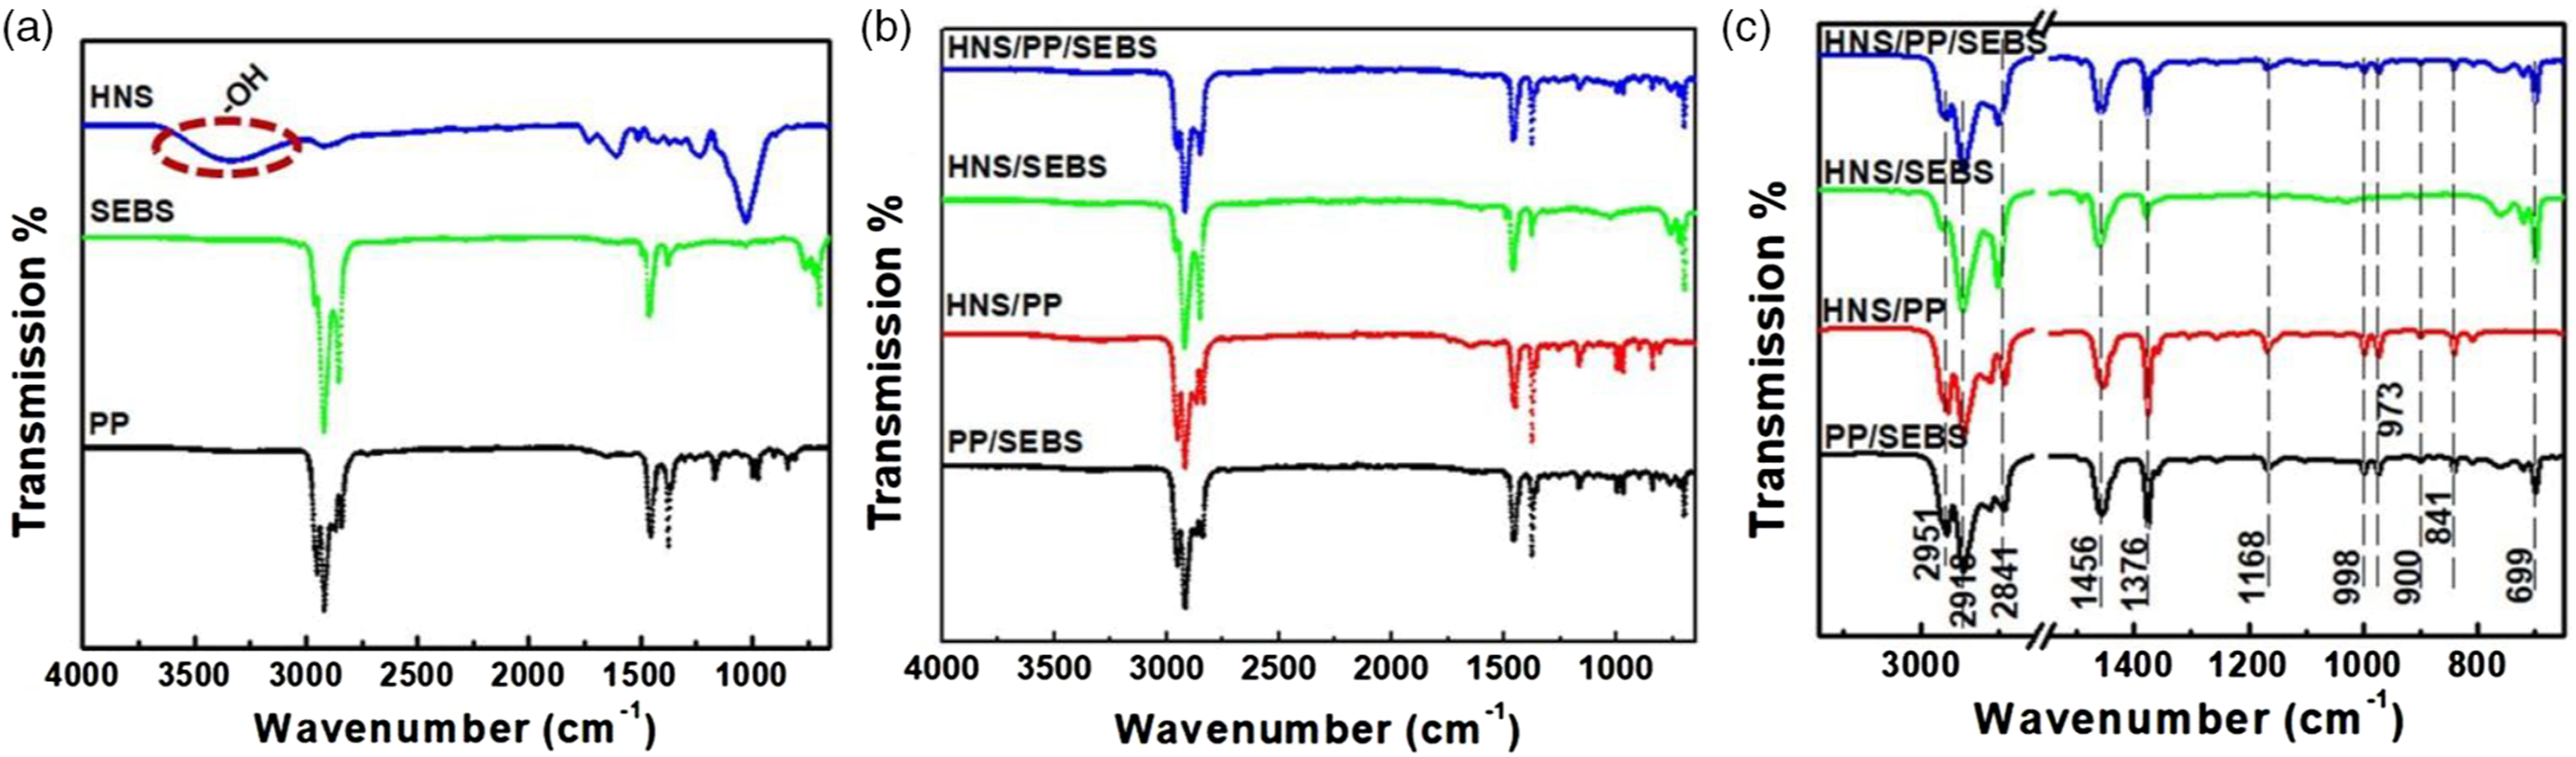
Major absorption bands and possible corresponding assignments in FTIR spectrum of the samples.
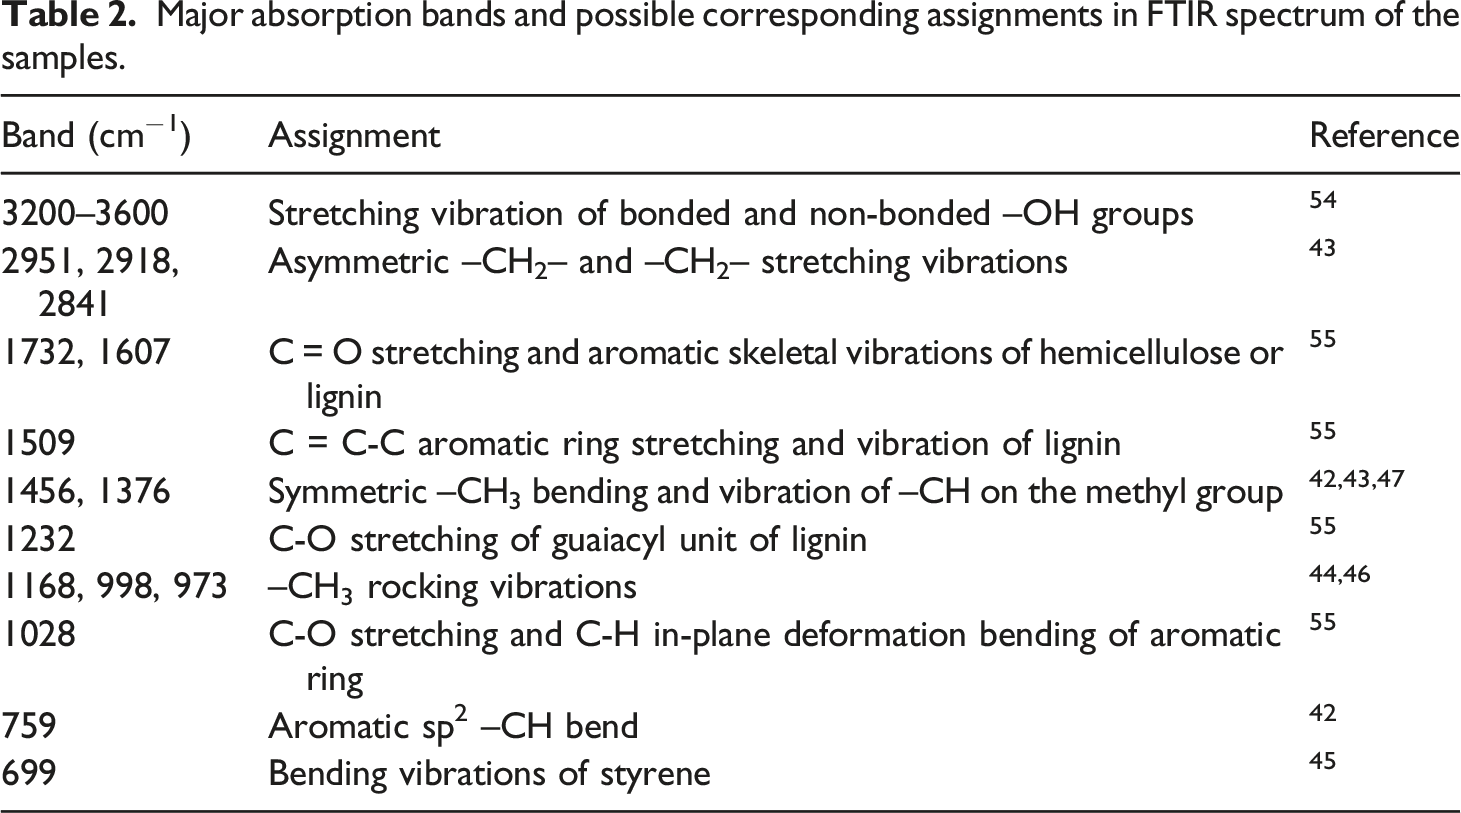
The stretching vibrations at 1732 cm−1 can be assigned for unconjugated C=O groups and related to carbonyl groups that are found in hemicellulose as polysaccharides and xylans. Also, broad band around 1509 cm−1 and 1606 cm−1 are associated with stretching vibrations of aromatic rings C = C stretching of lignin in HNS.56,57 After HNS addition the intensity increase was observed for these peaks for all composites. The peak at 1421 cm−1 belongs to C–H vibrations of aromatic aromatic ring vibration found in lignin. Symmetrical and asymmetrical bending peaks for C–H stretching in –CH2– and –CH3 groups at 1367 cm−1 belong to cellulose and lignin. The peak at 1231 cm−1 shows the stretching vibrations of C-O groups found in hemicellulose and lignin caused by Xylene and syringyl ring. The peak at 1027 cm−1 belongs to C–O stretching of guaiacyl and syringyl rings found in lignin.55,58 After HNS addition slight increase was observed for these peaks for all composites. 56 The peak related with b-glycosidic 1–4 linkage of the glucose ring in cellulose is observed at 895 cm−1 that represents the in-plane symmetric vibration of C-H. 56 It was also observed that aromatic sp2 –CH bend at 759 cm−1 (SEBS) was observed for HNS/SEBS and HNS/PP/SEBS composites.
Thermal gravimetric analysis
Figure 9 shows the TGA and DTG curves of the filler, matrixes, and 10 wt% filled composites between 25° and 610°C. The thermal degradation of hazelnut powder took place in three main steps that can be seen from both TGA and DTG curves. This type of TGA graph is common for other types of lignocellulose based natural biomaterials. The first step between 25–100°C is caused by the absorbed moisture. The weight loss was around 6 wt% at 100°C.
59
Between 100–200°C HNS showed almost stable behavior without any significant weight loss. The second degradation step was observed from 200 to 375°C and that was assumed to be caused by the thermal degradation of hemicellulose.
60
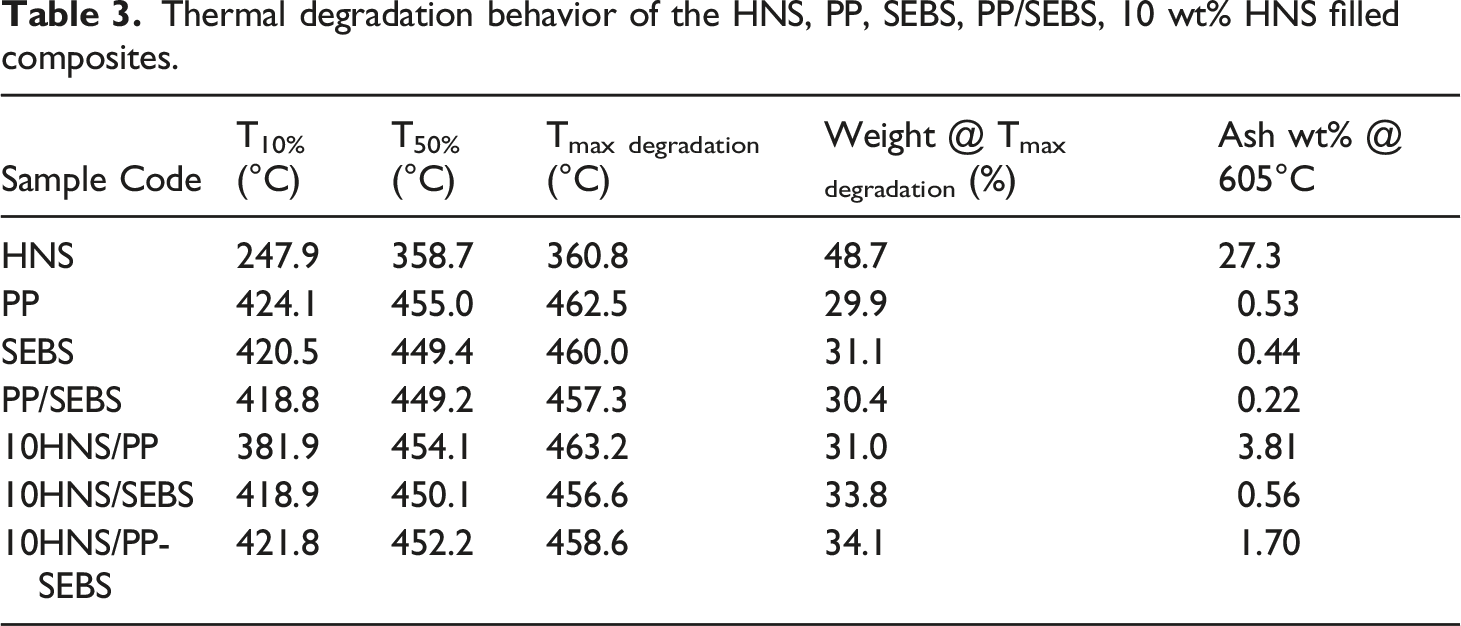
The maximum weight loss was observed around 360°C (Figure 9(b)) and the residual wt% was determined as 48.7. At this temperature, removal of volatiles were at the maximum. The third step was between 375 and 605°C. The ash content of HNS was determined as 27.3%. PP, SEBS and PP/SEBS blend showed almost similar thermal degradation behavior with small shifts. Parallel with that, addition of HNS thermal stability of the samples decreased and slight changes were observed in terms of T10%, T50%, Tmax degradation, and weight % at Tmax (Table 3). On the other hand, difference was observed for ash content % at 605°C. That might be caused by the size of the particles in the composite. As previously reported by Haykiri-Acma,
61
particle size was found significant in terms of ash content. As given in Figure 2 in our case, particle size ranged between 10-250 μm. a) TGA, b) DTG curves of HNS, PP, SEBS, PP/SEBS, and 10 wt% HNS filled composites between 25-610°C Thermal degradation behavior of the HNS, PP, SEBS, PP/SEBS, 10 wt% HNS filled composites.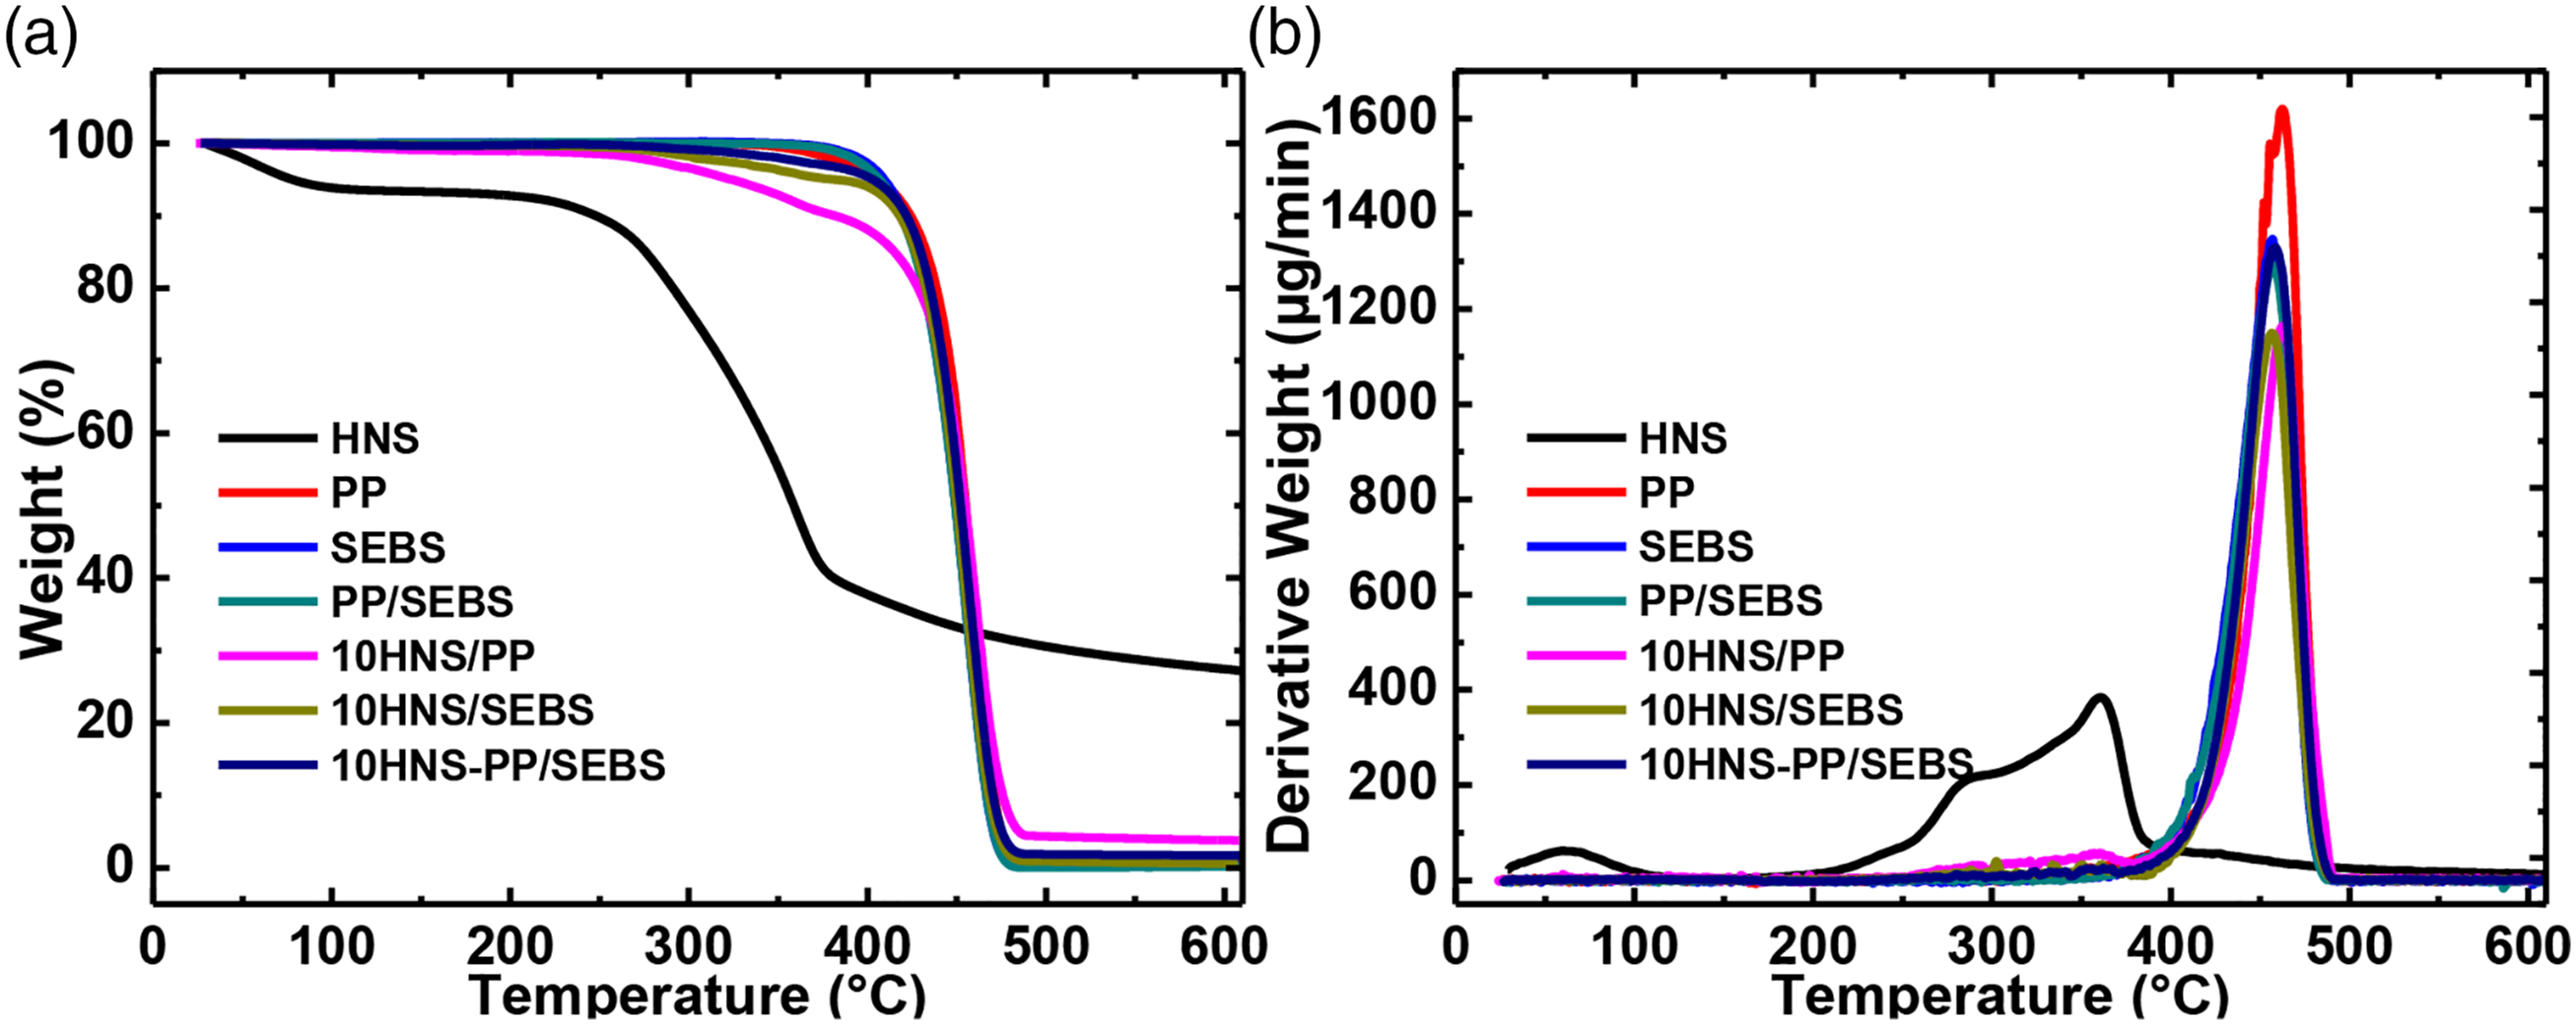
Mechanical analysis
Average tensile strength, tensile strain, elastic modulus with standard deviations and normalized values can be seen from Figure 10 and Table 4. Samples were evaluated based on the matrix type. The first group was PP-based samples, the second group was SEBS-based samples, and the third group was PP/SEBS-based samples. As can be seen from Figure 10, PP showed classical sharp, narrow yield peak with higher tensile strength and modulus compared to SEBS. SEBS showed traditional thermoplastic elastomer (TPE) response with the tensile strain more than 800% and relatively low elastic modulus. By incorporation of SEBS into PP, the narrow yield peak observed in PP became wider for PP/SEBS. As obvious from Figure 10, the mechanical behavior was in between PP and SEBS that is an indication of good blending.34,39,62 Stress-strain curves of PP, SEBS and PP/SEBS blend (Inset image: Strain value up to 150%) Some mechanical properties and contact angle values of the PP, SEBS, PP/SEBS films, and HNS filled composites (SD: Standard Deviation).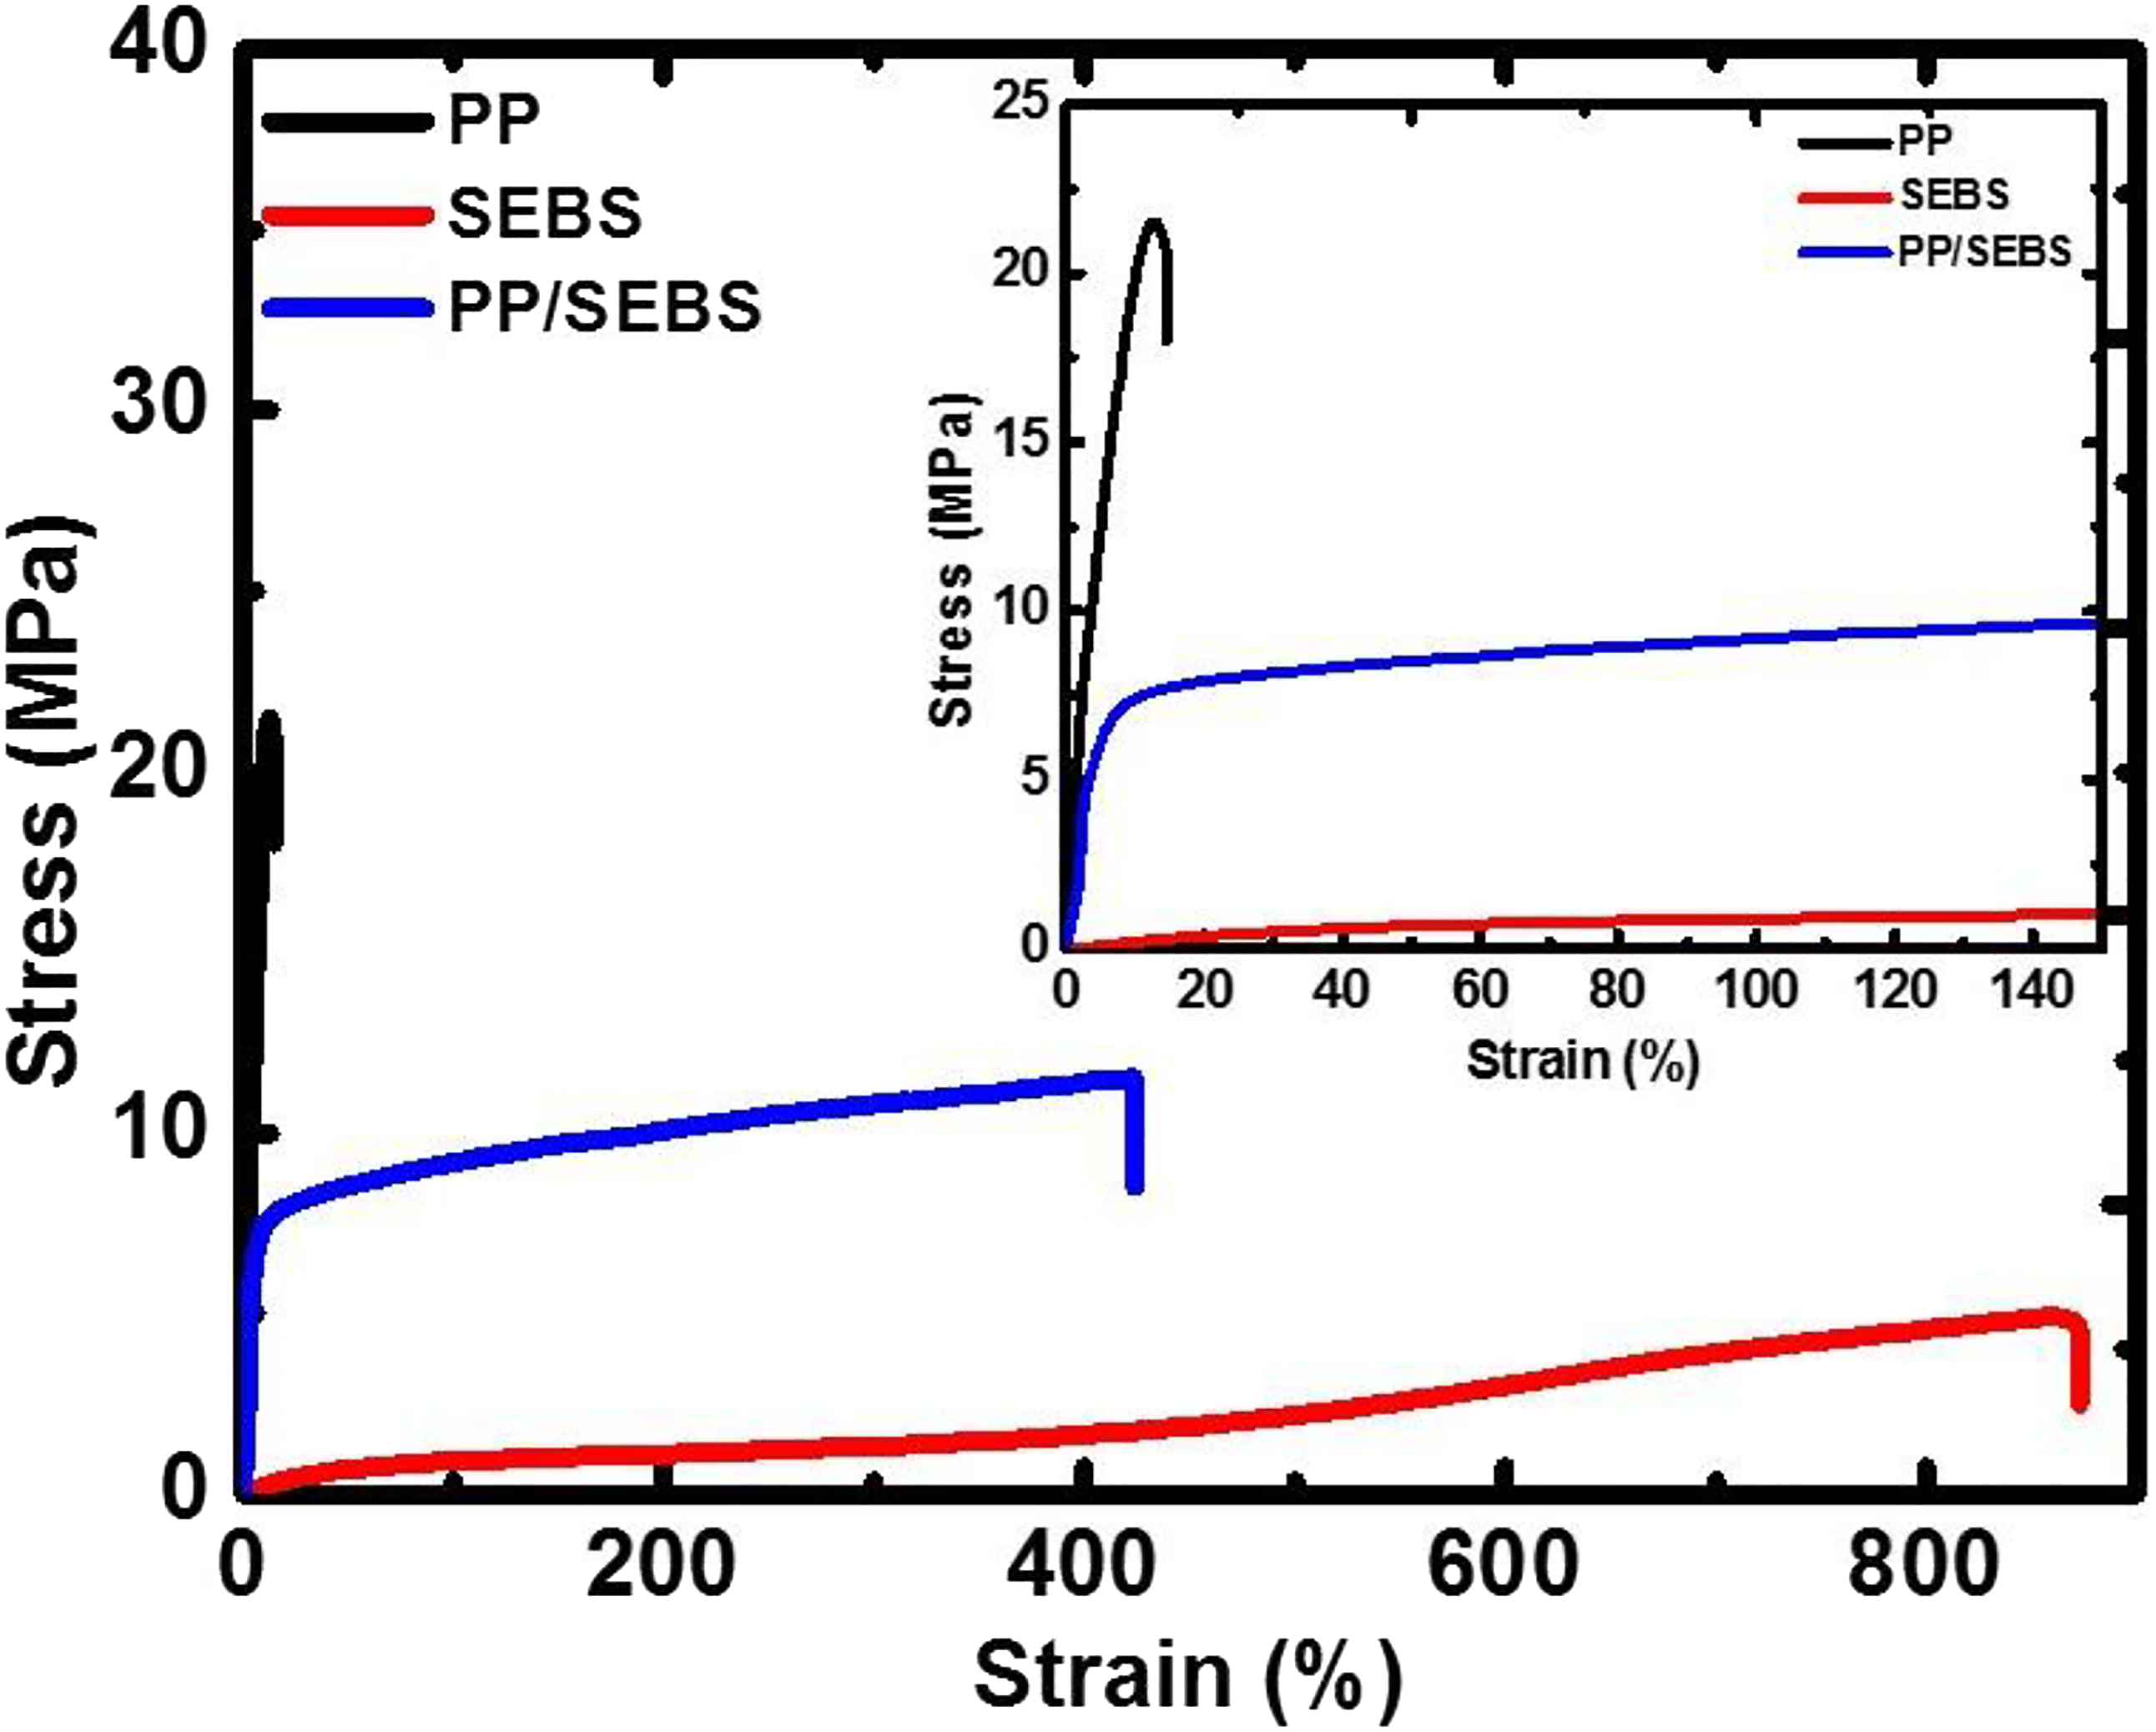
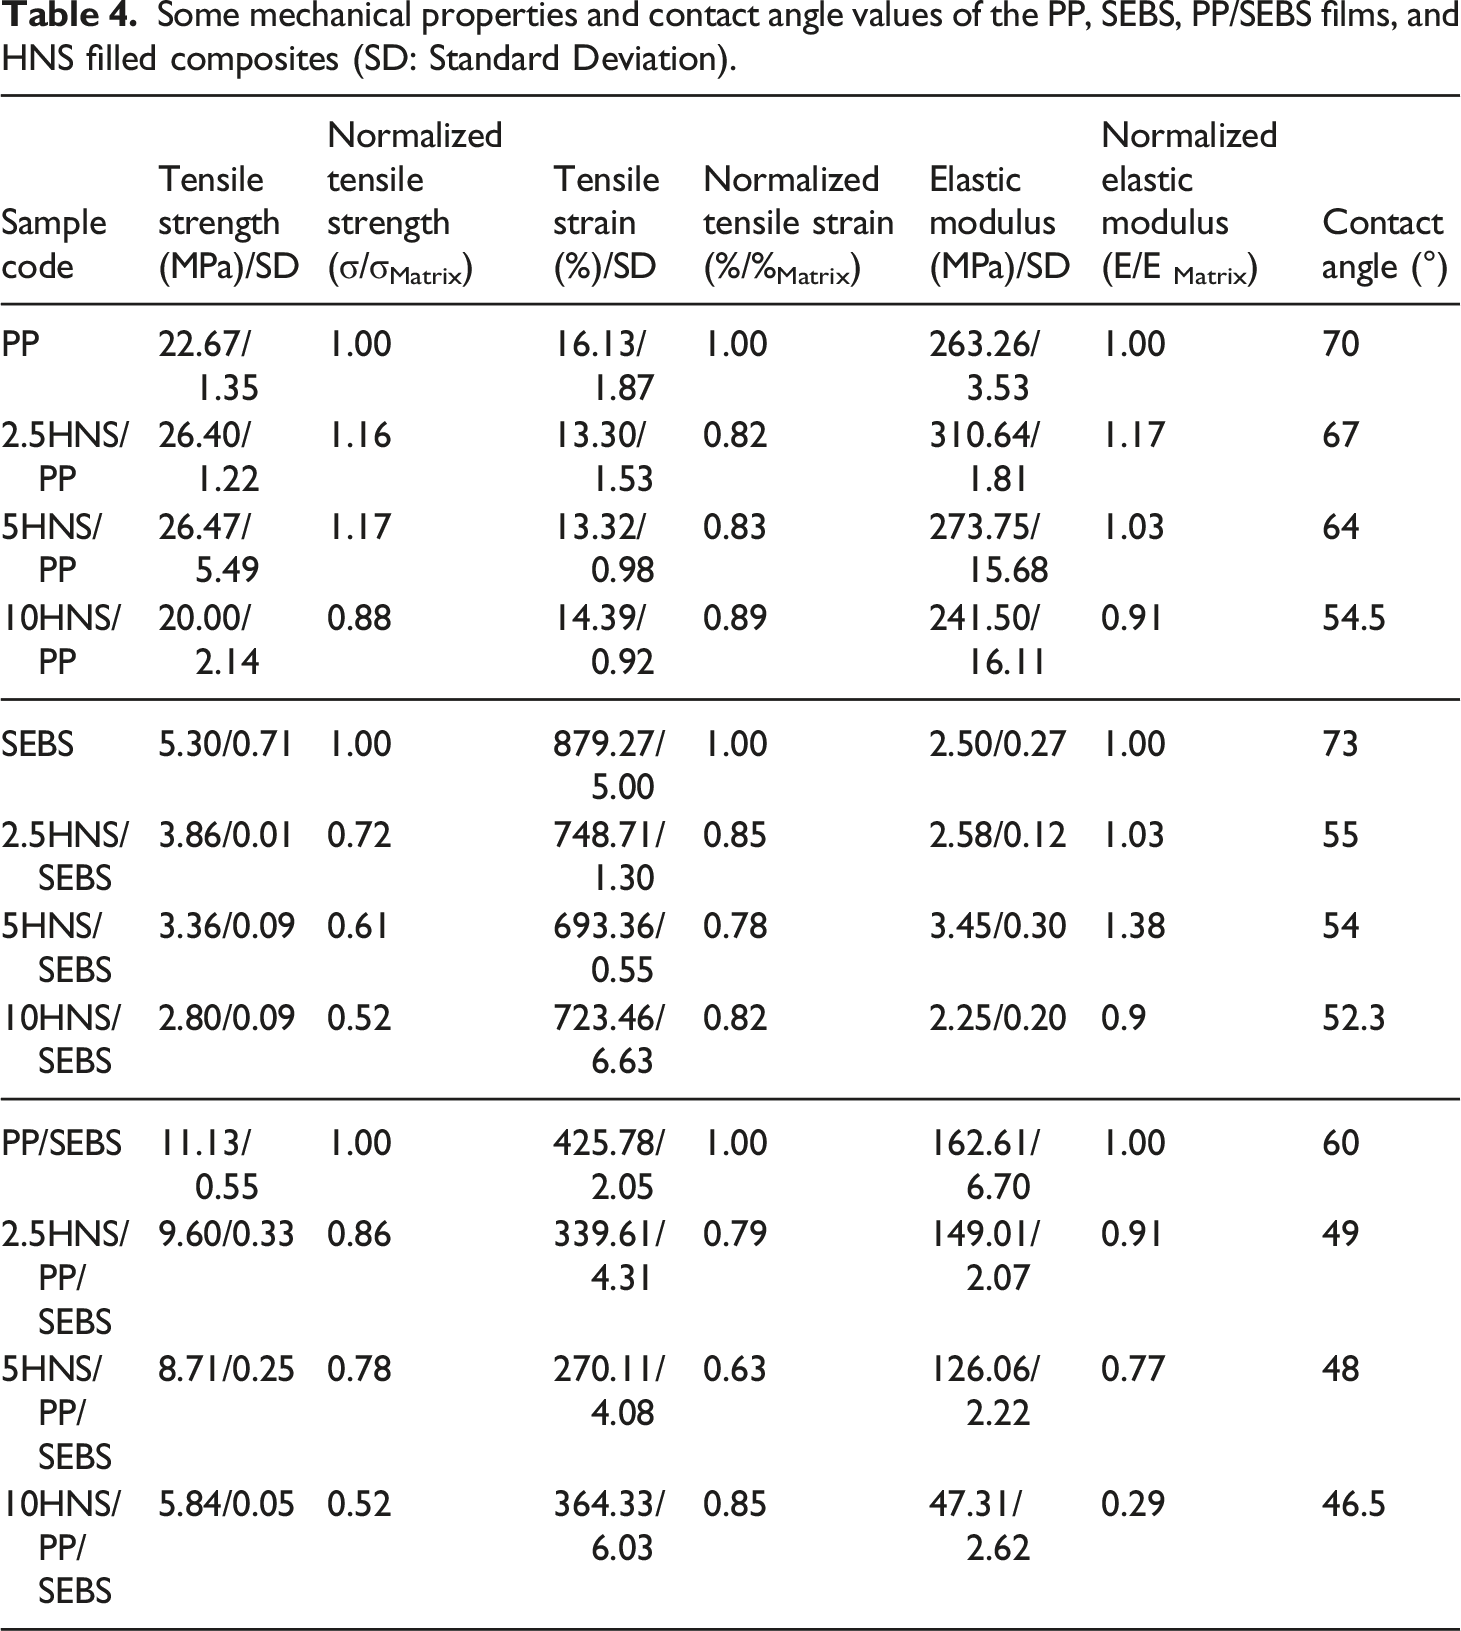
All PP composites showed similar stress-strain behavior as PP sample. The average tensile strength values of the PP, 2.5HNS/PP, 5HNS/PP, and 10HNS/PP were determined as 22.67, 26.40, 26.47, and 20.00 MPa, respectively (Figure 11(a)). The average tensile strain values were the lowest compared to other sets and the elastic modulus values were the highest for this group as expected. The average tensile strength values of the SEBS, 2.5HNS/SEBS, 5HNS/SEBS, and 10HNS/SEBS were determined as 5.30, 3.86, 3.36, 2.80 MPa, respectively (Figure 11(b)). SEBS-based samples showed classical TPE response with the lowest tensile strength, elastic modulus, and highest tensile strain between 720-880%. The average tensile strength values of the PP/SEBS, 2.5HNS/PP/SEBS, 5HNS/PP/SEBS, and 10HNS/PP/SEBS were determined as 11.13, 9.60, 8.71, and 5.84 MPa, respectively (Figure 11(c)). As obvious from these results, blends showed mechanical character between PP and SEBS. The composites at all filler loadings generally showed values between PP and SEBS composites in terms of tensile strength, tensile strain and elastic modulus as summarized in Figure 11(d). That behavior was an indication of good and proper blending. Stress-strain curves of neat and composites films a) PP, b) SEBS, c) PP/SEBS, and d) Tensile strength and elastic modulus of the all samples as a function of filler concentration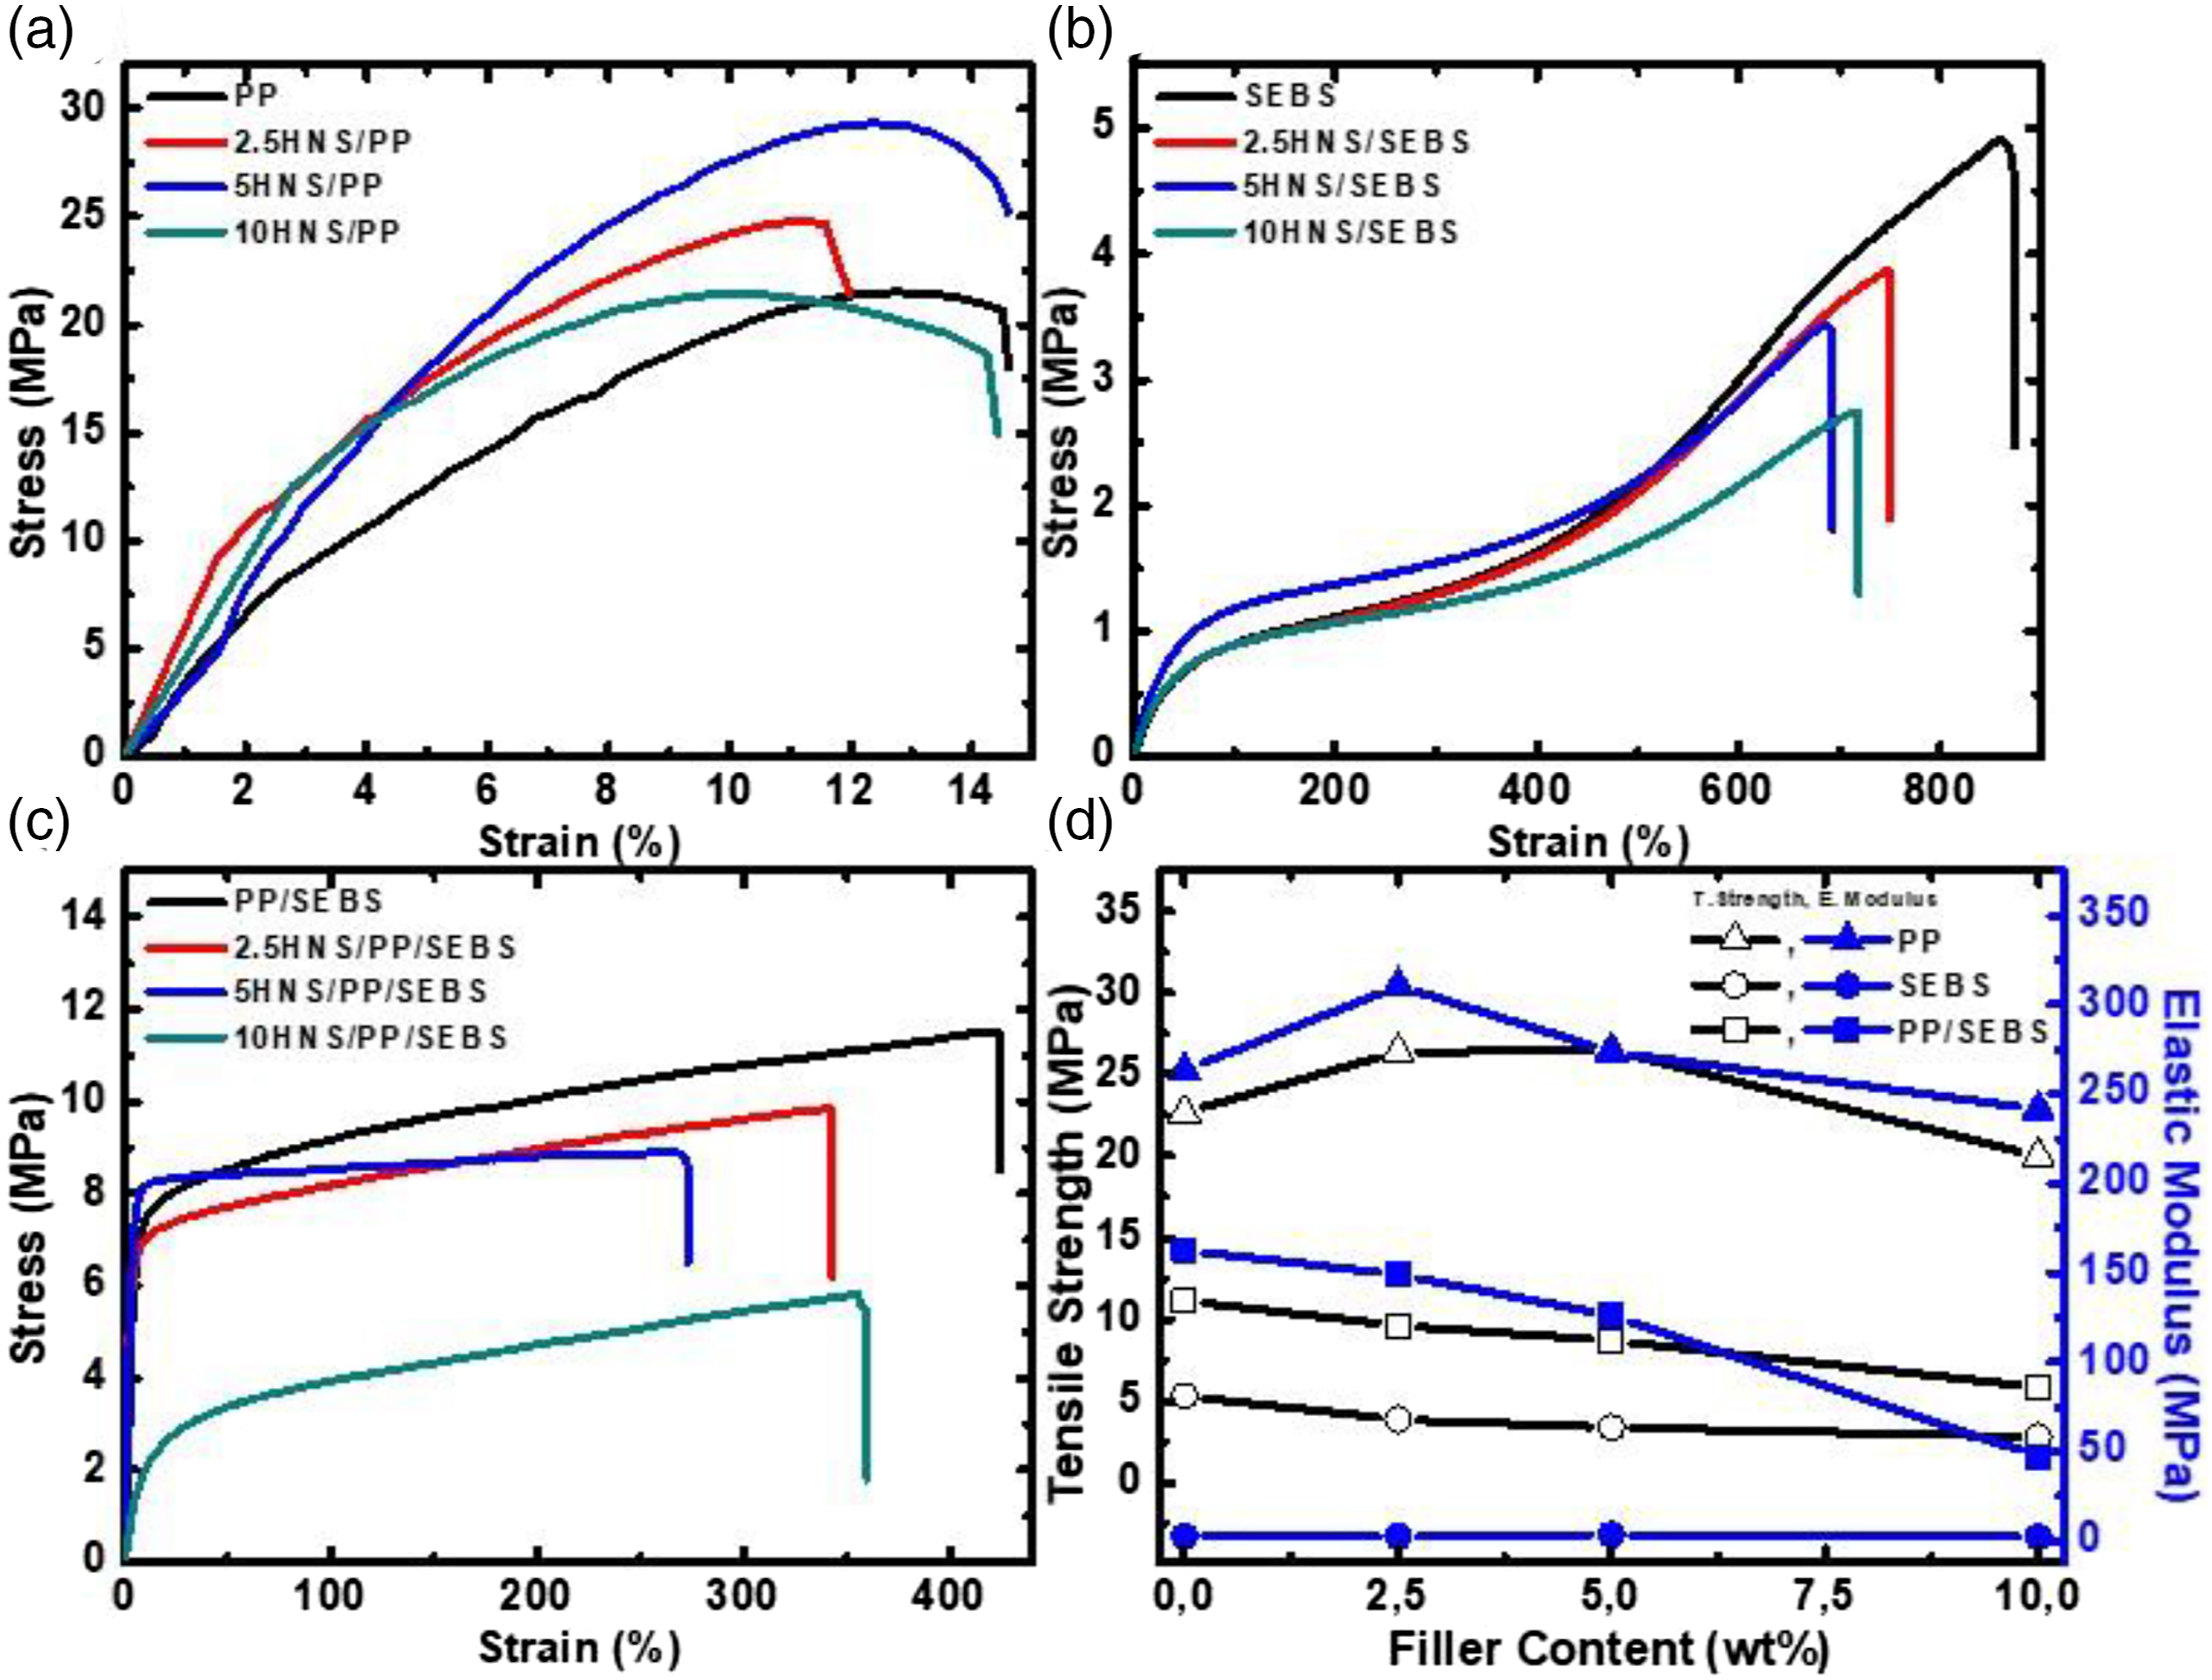
To summarize, the mechanical properties for PP/SEBS blends were between PP and SEBS and blending led to decrease in yield stress value, tensile strength, elastic modulus, and increase in yield peak width and tensile strain. In order to determine the effects of filler concentration and matrix type on mechanical properties, the outcomes were statistically analyzed using analysis of variance (significance level (α) = 0.05). Filler concentration and type of the polymer matrix were evaluated based on tensile strength, tensile strain, and elastic modulus. For all composites, increase in the filler content and matrix type didn’t have significant effect on mechanical properties statistically. The composites with 10% HNS content showed the lowest tensile strength that was also consistent with SEM images. At higher concentrations agglomeration formation was observed. Since agglomerations formed the weak regions, samples break at lower stress levels. Although the tensile strength values dropped with the incorporation SEBS into PP, PP/SEBS composites showed relatively high tensile strain values compared to PP composites.
Contact angle analysis
The contact angle values of the samples can be seen From Table 4. Contact angle is an indication of surface properties and hyrophilicity, wettability of the material and it is a useful tool for determination of the applications. In the case of higher HNS loading, the contact angle values drooped for all groups that was probably caused by both increased surface roughness and hygroscopicity (Figure 12). As known, HNS is a lignocellulosic filler and has -OH functional groups as shown in FTIR analysis, these functional groups can interact with water and form hydrogen bonds. That can be given as the reason for decrease in contact angle values.
58
When PP, SEBS, PP/SEBS based composites were compared, PP composites showed the highest values. SEBS and PP/SEBS blends showed similar trend in terms of decrease in contact angle that was assumed to be caused lower surface energy of PP.
63
Contact angle values of the samples.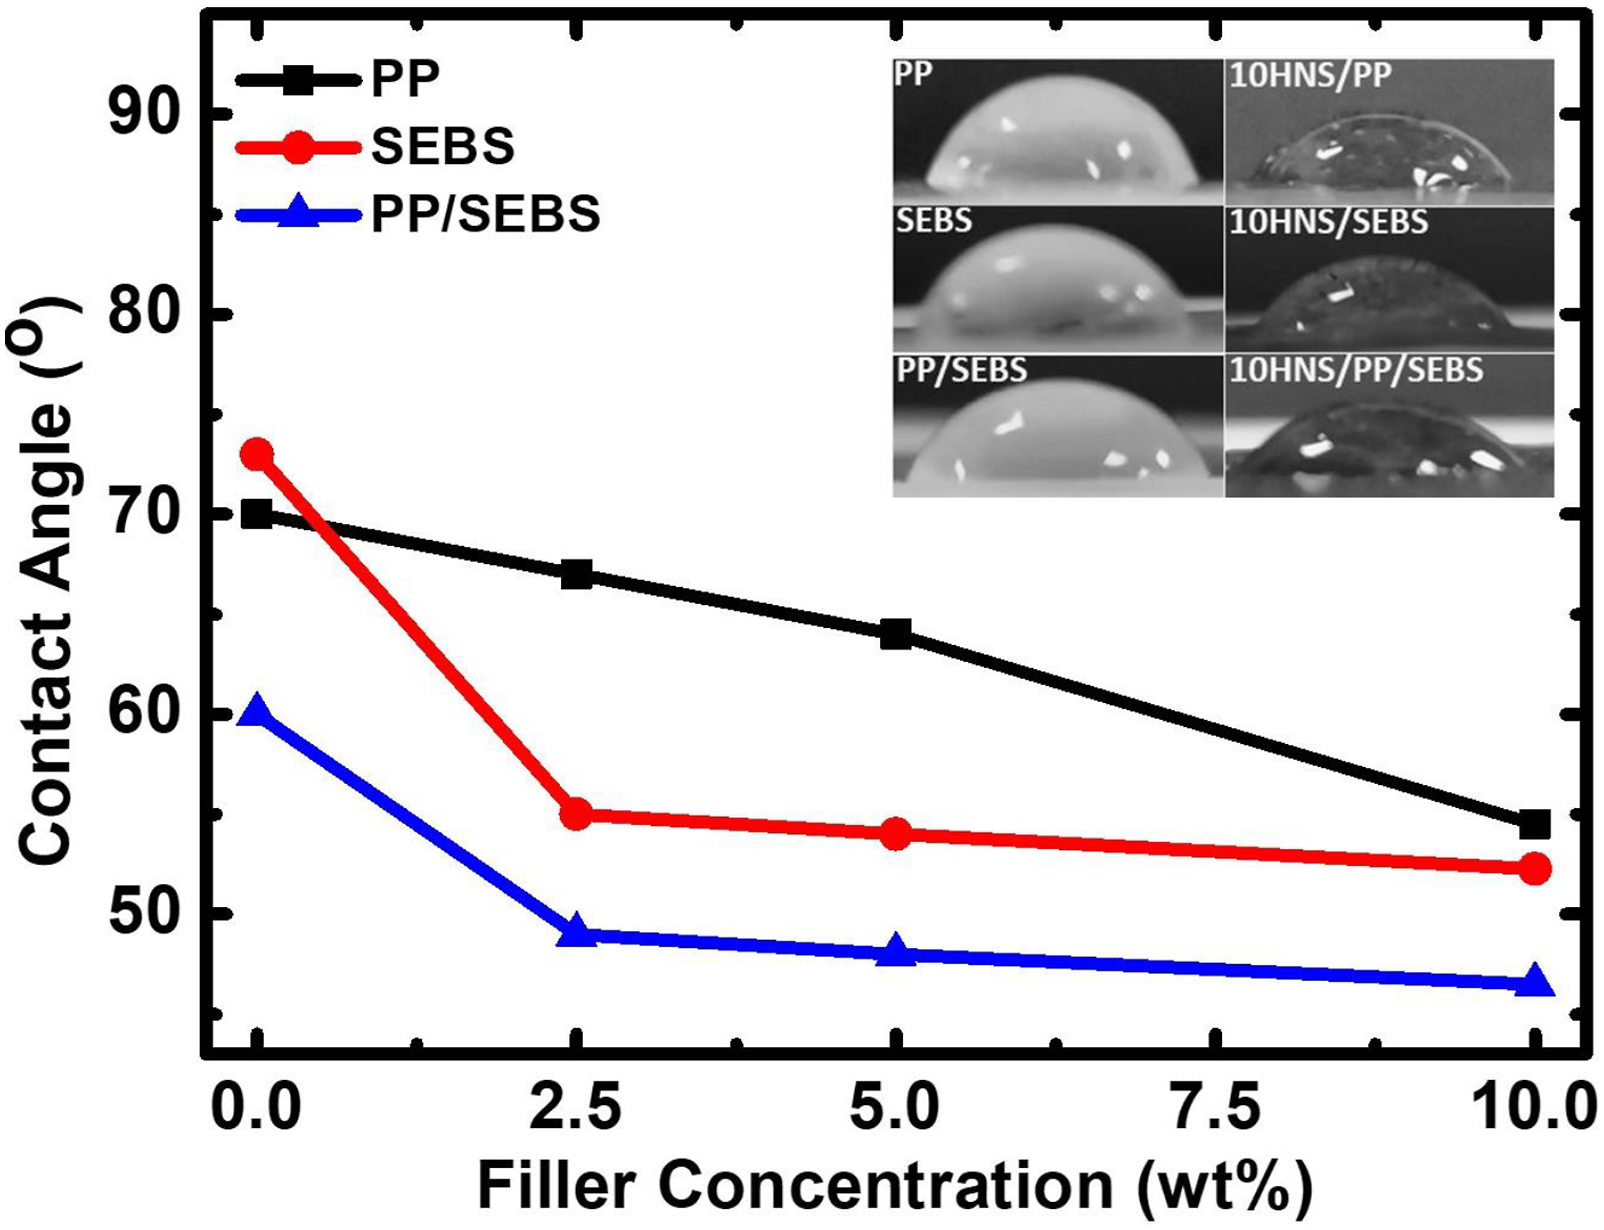
Water absorbency
The WA values are given as a function of time for all groups in Figure 13. For all samples water absorbency stabilized after 288 h regardless of the filler concentration and matrix type. As obvious from the results, water absorbency of the composites increased parallel with the filler concentration. The water absorption is generally observed for lignocellulosic composites because of their chemical structure. When HNS-filled composite is interacted with liquid water, water molecules can easily interact with the –OH groups of HNS.
58
WA can be given as 2.5HNS < 5HNS < 10HNS for all matrixes. This was also parallel with the FESEM images. As shown in Figures 5–7 at 10 wt% HNS loading, because of the agglomeration interphase was not perfect and water can be absorbed easily. Based on the polymeric matrix WA be given as PP < PP/SEBS < SEBS. As known PP is more hydrophobic than SEBS and the WA behavior of PP/SEBS blend was found between PP and SEBS. Water absorbency of the samples as a function of time.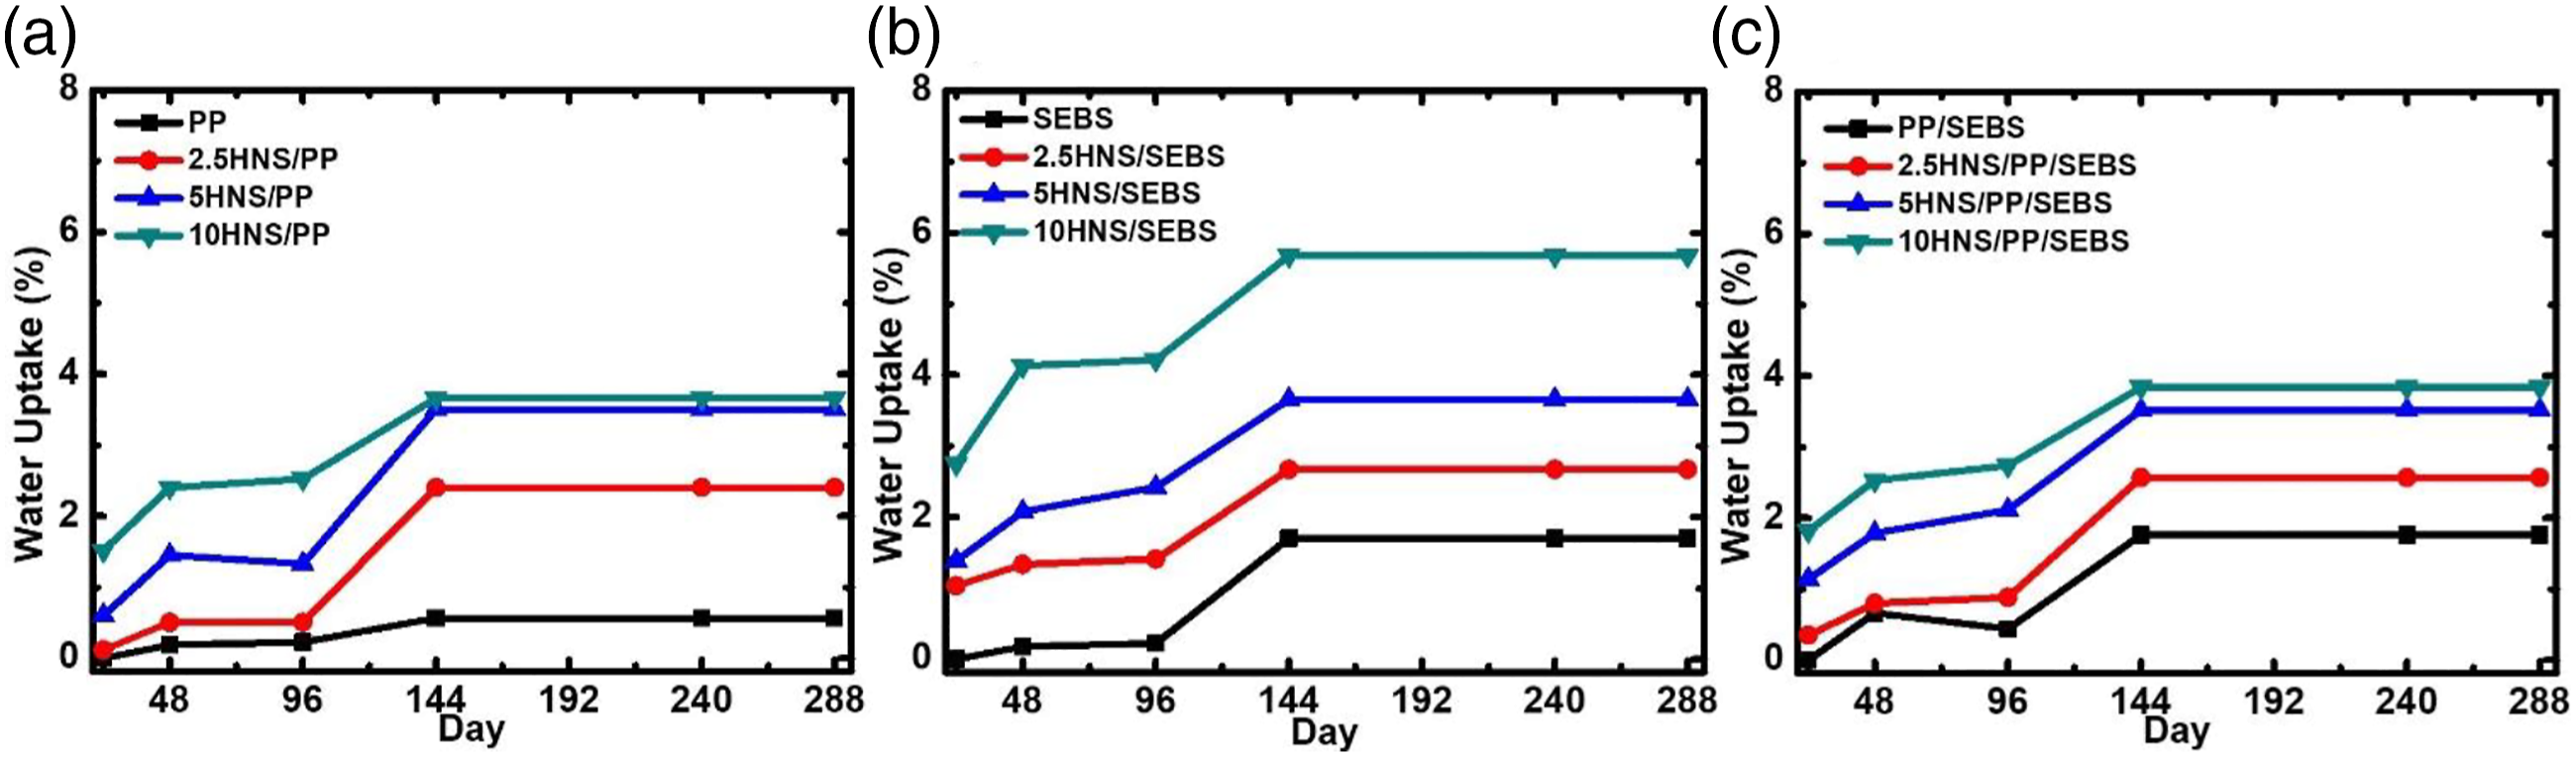
Conclusions
Non-sustainable and non-biodegradable products create a lot of environmental problems day by day and negatively affect the ecology throughout the world. To solve these problems, various solutions are offered from industry and academia. Sustainable product design and development is one of the most effective ways in terms of sustainable engineering applications. In this study, sustainable, low-cost polymer composites were designed and fabricated by using waste HNS powders. PP, SEBS, and PP/SEBS blend were used as the polymeric matrixes. By using the agricultural waste as a filler, the total amount of the synthetic raw material and cost were reduced and a new class of “greener material” was developed with a brown colored, natural appearance without any pigment addition. The color can be tuned by the HNS concentration that was determined as 2.5, 5, and 10 wt%. Polymer blend and composites were prepared by melt mixing in an extruder. To characterize the samples, polymeric films were prepared by compression molding. The morphological, structural, thermal, mechanical, contact angle, and water absorption analysis were performed. At 2.5 and 5 wt% filler loading only PP based composites showed increase in tensile strength, but all composites showed homogeneous morphology. However, at 10 wt% HNS loading for all composites agglomerations were observed and mechanical properties showed drop. PP/SEBS composites showed mechanical properties between PP and SEBS. The incorporation of SEBS into PP increased the flexibility of the composites. Fourier transform infrared spectroscopy analysis showed a good blend structure for PP/SEBS blends and composites. Thermal degradation properties of the samples showed similar behavior. By increasing the HNS content, contact angle values dropped and water absorbency of the samples increased.
Footnotes
Acknowledgements
We would like to thank Yalova University Central Research Laboratory for some of TGA and FTIR analyses. We would like to also thank Ibrahim Ekiz for hazelnuts.
Funding
The author(s) received no financial support for the research, authorship, and/or publication of this article.