
Abstract
Composites with differently shaped micro- and nanofillers show various, unique thermal, and physicochemical properties when mixed with carefully chosen polymer matrix. Selected composition holds strategic value in achieving desired properties that is biodegradability, thermoelectric conductivity, and shape memory for organic coating. The main aim of this work is to briefly examine structural changes after reaching percolation threshold and activating healing abilities within exploited (8–2 wt ratio) polyurethane–polycaprolactone thin films mixed up with different types of metallic and ferromagnetic microfillers. They, with applicable dosages of reduced graphene oxide nanoparticles, should enhance materials’ mechanical and conductive properties. Microscopic and spectroscopic techniques accompanied by extensive thermal analysis have been chosen to provide useful information about local changes in surface structure and morphology. Moreover, pristine, percolating surface with inner-formed, metallic structures shows moderate conducting properties within exploited materials which unfortunately diminish after thermal healing stimulus is being applied. This statement is supported by observing the coverage of regional defects and nearby pores with a concise, uniform layer of blend having different PU:PCL ratio. Including the additional fact that apparent filler migration is changing local dopant composition brings up an assumption that both phenomena have negative synergy effect on each other.
Keywords
Introduction
Graphene and its derivatives are a group of relatively new 2D materials that benefit from growing popularity among scientists and worldwide industry. It is so due to their unique properties and wide range of applicable modifications. 1 Production quality of graphene-like nanofillers is still improving while manufacturing cost is slightly decreasing. Graphene provides good electrical and thermal properties, while its modifications can improve applicability in newly discovered materials. 2 Furthermore, synthesis of this planar, honeycomb-shaped material can be pursued in many different ways, that is, modified Hummers’ method like in our case. 3 Those carbon-based nanofillers can be applied in ecological modified polyurethane (PU) nanocoatings, 4 biodegradable containers or in medical supplies such as hydrogels, 5 tissue engineering, 6 or bionanofiber scaffolds 7 which incorporate also polycaprolactone (PCL).
Conduction phenomena in polyurethane–polycaprolactone (PU-PCL) thin films is mainly exploited using metal-rich fillers reaching percolation threshold. For spherical particles like zinc (Zn), this concentration limit is slightly above 85 wt%, and for flake-shaped aluminum (Al) dust roughly 60 wt%. 8 Addition of thermally reduced graphene oxide (rGO) often improves conductivity and system barrier-ability—it could also work as a partial substitute for metallic fillers. 9 Synergy between percolation and process of heat-stimulated regeneration should show some interesting dependencies considering the properties of aforementioned dopants. Healing, however, could also be problematic considering diffusion and migration in so densely packed matrix. That phenomena could be controlled and further supported by incorporating ferromagnetic Fe3O4 particles which make composites prone to external magnetic field sweep. 10 Fe3O4 is also proved to effectively interact with rGO after proper treatment by creating bigger, more complex, conductive structures. 11 This article will briefly focus on showing the synthesis method, structure, and relations between healing and conduction properties in the obtained materials. To achieve this optimized, 8:2 wt ratio of PU-PCL matrix, composites were examined using microscopic and spectroscopic techniques assisted by few results from thermal, electrochemical, and X-ray analysis.
Experimental
Methods
Raman spectra were obtained on Renishaw via spectrometer with 514 nm laser. Exposition power was set to 4 mW with 1800 grooves per mm grating—spectral resolution was about 1 cm−1. The acquisition took two accumulations, 10 s each. Scanned area had roughly 1 µm2 and spectral range was set between 100 cm−1 and 3200 cm−1.
Fourier transform infrared (FTIR) spectroscopy was performed as a complementary source of information on a Nicolet spectrometer, model 8700 with Specac Heated Golden Gate module and diamond attenuated total reflection unit. Sixty-four scans, 1 s each, were gained from a single sweep in the range between 500 cm−1 and 4500 cm−1 at a resolution of 1 cm−1.
X-ray fluorescence (XRF) results were obtained using portable Ketek X-ray set from IF-FM PASci. The tube was operated at 40 kV and 1 mA. Samples were exposed for 120 s, and the beam was collimated at the spot of approximately 4 mm in diameter. The maximum range of detected elements was set from K (19) to U (92). Zirconium signals, present in each spectra, originate from the internal collimator of applied X-ray AXAS thermoelectrically cooled detector.
Scanning electron microscopic (SEM) images with energy-dispersive X-ray (EDX) spectra were made on Quanta FEG 250 microscope with an Everhart-Thornley detector provided by FEI with 500–50,000× magnification rate at 10 keV HV. All less-conductive composites were precoated with a thin nanolayer of gold to obtain good quality microphotographs.
Differential scanning calorimetry (DSC) was done on Netzsch Phoenix DSC apparatus, model DSC 204 F1. Temperature scan ranged from −80°C to 230°C at a heating rate of 10°C min−1. A three-staged, heating–cooling–heating system was performed, where results from the second heating period were further discussed upon.
Thermogravimetric measurements (TG/DTG) were performed in inert conditions—20 ml min−1 of nitrogen flow on Netzsch Tarsus, model TG 209 F3 at temperatures ranging from 35°C to 700°C. The heating rate was roughly 10°C min−1. Mass of each sample had approximately 5 mg.
Transverse conductivity of thin-film composites was measured according to the ASTM D257 standard using Keithley 6517A high-resistance multimeter which is automated by Keithley test software. Applied constant voltage was around 100 V. Samples measuring 4 cm in diameter were placed between 3.14 cm2 conducting disks. Material thickness was calculated as an average of 10 measurements. Relative humidity during research was 43% and temperature about 22°C.
Healing thermomagnetic stimulus was applied to damaged blends via B44YO magnetic block made from neodymium iron boron alloy and provided by K&J Magnetics Inc. Heated to roughly 58°C, 6 × 6 × 50 mm3 magnet was rotating (90 r min−1) approximately 3–4 mm above the sample. Surface magnetic field strength had been estimated to have 6500 Gs.
Synthesis
PU and PCL were mixed in 8:2 mass ratio inside a reactor using bulk solvent method by heating the granulate alongside with small amount of dimethylformamide (DMF) to 100°C at 800 r min−1. After full polymer dissolution weighted portions of pigments were manually added to the reactor which was left opened for about 1 h to homogenize the blend (constant mechanical stirring with ultrasonication) and to slowly evaporate the solvent. Then sol–gel mix was subsequently poured out on a preheated large petri dish to solidify under low-pressure conditions and to release the remaining DMF. A similar procedure has been described by Jing et al. 12
PU-PCL composites contained approximately 85 wt% of Zn or Al spherical fillers. Then, 2.5 wt% of rGO was introduced as a substitute to improve thermomechanical properties, homogeneity, barrier ability, and to reduce metallic filler aggregation problem apparent in the matrix during final solidification process. 4,7,12 The mentioned amount of rGO was also added to improve conductivity by creating separate, conducting tunnels and to mend some of the metallic filler vacancies in multidimensional, conductive chains inside the blend. It is known that Al flakes have lower percolation threshold and higher bulk density than standard Al droplets, therefore only 57.5 wt% of them with additional 2.5 wt% of rGO was needed to achieve percolating structure. Ferromagnetic Fe3O4 particles were added as a replacement for roughly 10 (Alflakes) to 15 wt% (Zn, Alspheres) of metallic fillers to achieve magnetic field support during healing of artificially cracked matrix. Adding more ferromagnetic particles had pronounced, negative effect on composites’ overall conductivity. All fillers were bought from Sigma Aldrich Ltd in a form of fine dust particles which had around 45 µm in diameter—325 mesh.
rGO was obtained from graphene oxide (GO)—an intermediate product synthesized using improved Hummers’ method briefly described by Marcano et al. 3 The initial component was Natural Crystalline Flake Micro 850 graphite (G) produced by Asbury Graphite Mills Inc (New Jersey, USA). It consisted of round-shaped 5 µm particles and was 98.5% pure. GO presented in Figure 1(a) was then thermally reduced (by smoldering) to rGO—Figure 1(b)—at 200°C, in an inert argon (Ar) atmosphere. The reduction time did not exceed 30 min, and the heating speed was approximately 20°C min−1. Ar flow was around 20 ml min−1. Detailed description of the synthesized rGO was already shown via X-ray diffraction and Raman spectroscopy in a separate report. 13
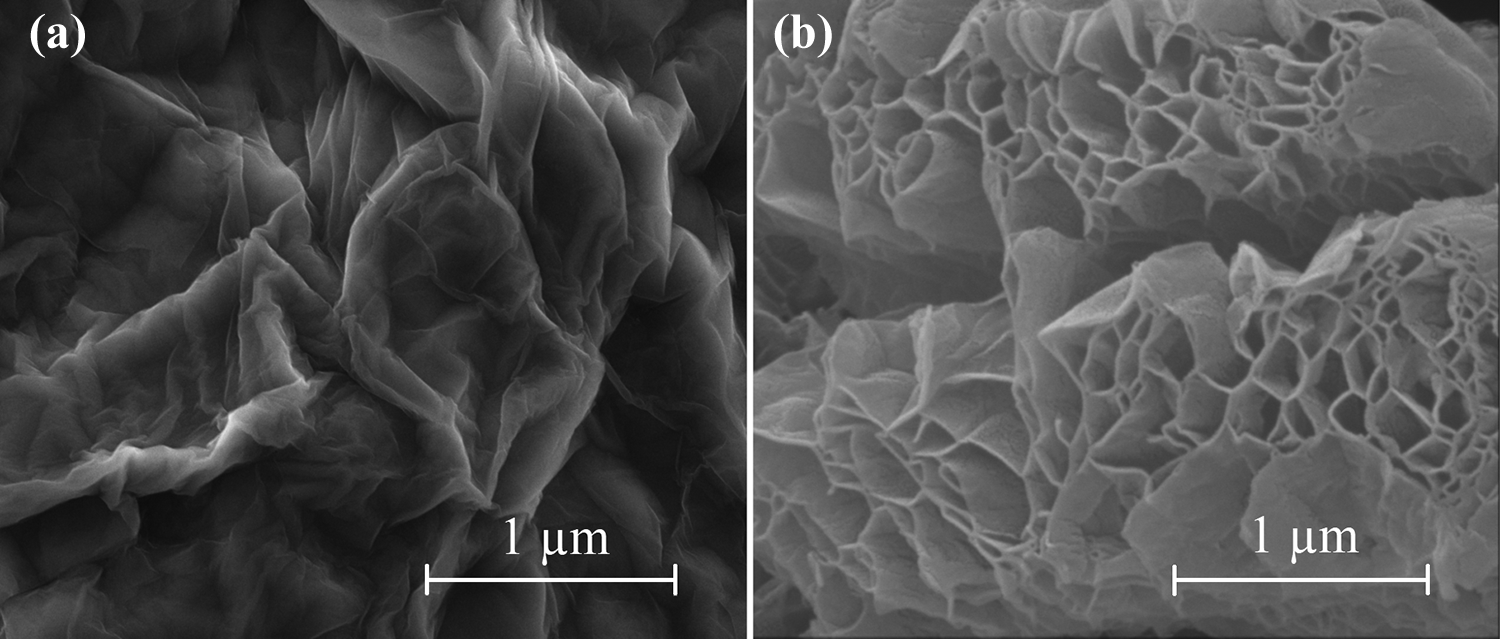
SEM images comparing: (a) GO flakes obtained from improved Hummers’ synthesis method and (b) rGO received after smoldering GO in inert Ar atmosphere. Magnification ×50,000. Image size is 3 × 3 µm2. SEM: scanning electron microscope; GO: graphene oxide; rGO: reduced graphene oxide; Ar: argon.
Materials were made in many different PU-PCL weight ratios and combinations of fillers to achieve adequate, mechanic, and physicochemical properties—a separate topic for future discussion.
Results and discussion
Scanning electron microscopy
Metallic filler size, percolating structures, and composite morphology before and after exploitation were studied using SEM imaging. After confirming the presence of conducting structures in each modified not-yet-exposed material (Figure 2(a)) further investigation could take place. The electron microscope was also useful in determining visible changes in the morphology of the samples after exposure to harsh urban Corrosivity 5 - Industrial (C5-I) conditions (according to EN ISO 12499 standard in temperate climate) and thermomagnetically induced healing (Figure 2(b)). Loss of color and microporous surface were noted due to disrupted filler migration with melting PCL—this initiated extensive, local XRF, and Raman/Fourier transform infrared (FTIR) research regarding changes in local PU-PCL composition where the cracks existed.
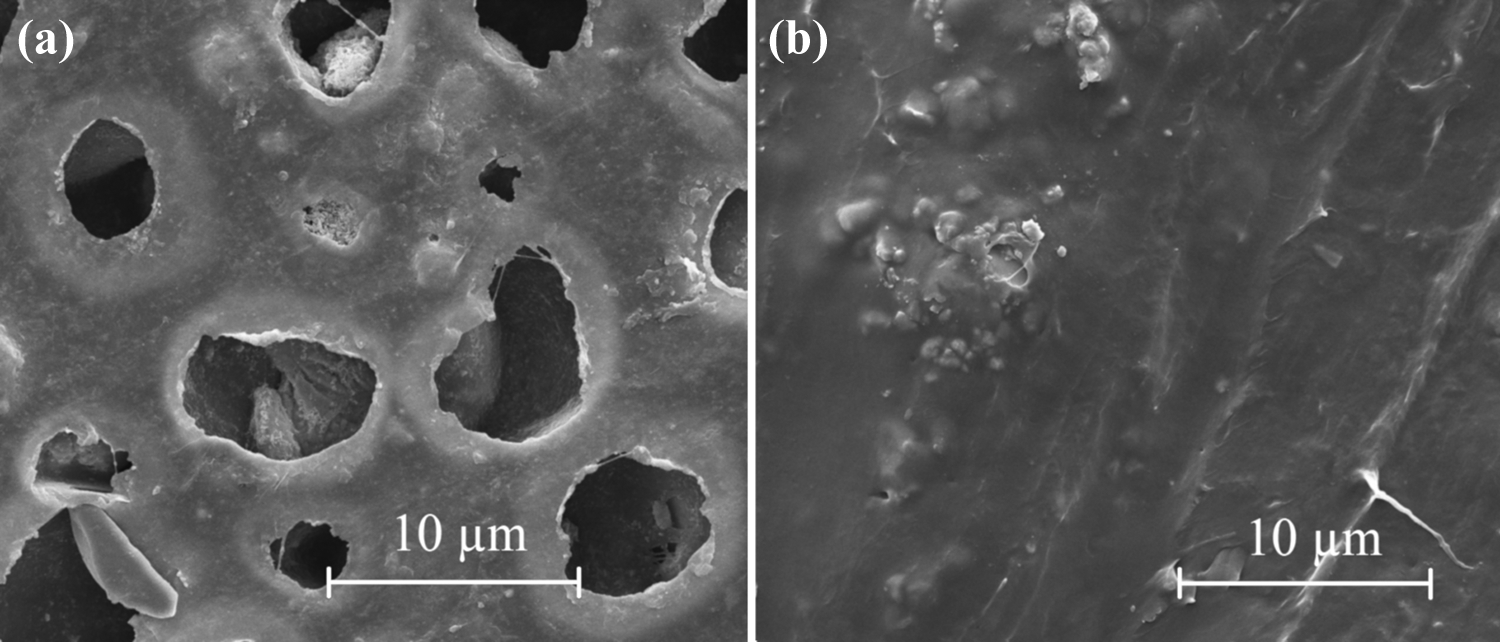
SEM images comparing: (a) percolating PU-PCL surface in composites containing 67.5 wt% of atomized Zn, 15 wt% ferromagnetic Fe3O4, and 2.5 wt% of rGO before exploitation; with (b) the same composite after thermo-magnetically induced healing. Structures resembling rGO flakes from Figure 1(b) are visible alongside Zn particles in the pores of percolating blends. Magnification ×2500. Image size is 30 × 30 µm2. SEM: scanning electron microscope; PU-PCL: polyurethane–polycaprolactone; rGO: reduced graphene oxide.
X-Ray analysis
XRF spectra of percolating composites qualitatively show that proper metallic fillers are truly present on the microporous surface of developed materials. If we compare them to Raman and EDX results, which are supporting each other to some extent, XRF could also show present contaminations in not-yet-mixed or already exposed metallic particles. However, some impurities could be hard to detect due to high dispersion and coverage from carbon-rich polymer matrix.
Nevertheless, XRF spectra could clearly display main heavy metal fillers—Fe and Zn—in dense, not exploited, percolating matrix shown in Figure 3(a). Raman spectral analysis was not capable of verifying the metallic filler content due to low polarization of pure metallic bonding. In contrary, XRF spectra of the Zn samples, before and after regeneration of the damaged area, confirm that morphology changes in the context of presented fillers (Figure 3(b)). The amount of Zn is clearly reduced and its level is surprisingly close to Cr and Ni which are classic impurities from ferromagnetic Fe3O4 particles. The aforementioned oxide was added to enhance filler migration and homogeneity inside the matrix after healing process was performed by simultaneously implementing external magnetic sweep with local heat stimulus. This filler is also responsible for the higher conductivity of the blend regenerated areas in comparison to those samples without it. The same XRF measurements were done for Al samples, however, in Figure 3(c), only Fe3O4 is visible due to the light atomic weight of the Al. Because of this fact other, more Al-sensitive techniques must have been taken into account, such as EDX spectra (Figure 4). This method could quantitatively show the amount of Al filler and even some traces of polymer matrix (Table 1). However, in contrary to XRF spectra, because of lowering surface tension—due to Al-stearin and rGO nanoflakes emerging at the surface—we could not see through to any Fe3O4 particles hidden deep inside the blend, and since EDX is considered one of the surface-investigation techniques, its opposing results on the same sample could only be explained by extensive shielding of the inner heavy Fe particles by outside-floating fillers. 14

XRF spectra of PU-PCL composites filled with: 67.5 wt% of atomized Zn droplets, 15 wt% Fe3O4, and 2.5 wt% of rGO (a) before and (b) after regeneration; Spectrum (c) represents PU-PCL composite filled with 47.5 wt% of Al flakes, 10 wt% Fe3O4 and of 2.5 wt% rGO before exploitation and thermomagnetic healing. XRF: X-ray fluorescence; PU-PCL: polyurethane–polycaprolactone; rGO: reduced graphene oxide.

EDX spectrum of the same PU-PCL composite showed in Figure 3(c)—filled with 47.5 wt% passivated Al flakes, 10 wt% Fe3O4 and 2.5 wt% rGO. EDX: energy-dispersive X-ray; PU-PCL: polyurethane–polycaprolactone; rGO: reduced graphene oxide.
Data obtained from EDX spectrum of the same composite presented in Figure 4.

EDX: energy-dispersive X-ray; C: carbon; O: oxygen; Al: aluminum.
Conductivity
Conductivity results of the investigated samples are presented in Table 2—general values are balanced in between semiconductor and insulator range. Best results were achieved for PU-PCL materials filled with 85 wt% of atomized Zn or Al, where 2.5 wt% was replaced by rGO. Adding carbon nanofiller was necessary to improve overall cohesion and mechanical properties. Furthermore, conductivity was also enhanced by around one order of magnitude, however, exchanging Zn for Al is not recommended because Al does not contribute so much to conductivity as Zn. Further replacing 15% of spherical metallic fillers with ferromagnetic Fe3O4 improved regeneration and filler-migration capabilities during healing but noticeably reduced conductivity in not damaged materials. Even the addition of extra rGO could not compensate the difference regarding improved thickness—it is worth noting that adding more than 2.5 wt% of rGO makes those blends difficult to operate with due to high density. Total removal of Fe3O4 ferroparticles from the sample shows that it may somehow contribute to overall conductivity inside the matrix but yet, not in such demeanor as atomized Zn or Al. Changing matrix from PU-PCL 8:2 wt ratio to pure PU had little to no effect for electron transport. However, the former composition seems to be a little bit more favorable. For most concentrated, percolating, Al flake materials, filled additionally with 2.5 wt% of rGO, charge transport was the least prominent. This phenomenon probably took place due to fillers stearin precoating (Al passivation) and its excellent barrier abilities originating from the general shape. Such a dopant tends to aggregate itself just under the surface of thin layer blend in a horizontal manner. This fact compromises the existence of opened pores and well-wired conductive tunnels, thus further investigation with these type of blends has been seized. Similar conductivity dilemmas were discussed by Jin et al. 15 and Galpaya et al. 16 in their respective articles.
Conductivity of few representative, percolating composites measured according to ASTM D257 before and after exposition to C5-I atmosphere with incorporation of crack-healing process.

PU-PCL: polyurethane–polycaprolactone; rGO: reduced graphene oxide.
Raman and FTIR spectroscopy
Raman and FTIR spectra were helpful in determining local changes in 8:2 PU-PCL composition after exploitation and healing. Both techniques show signals emanating from the predominant PU component—reference spectra are presented in Figure 5(a). As for pure PU-PCL blends, their results are exhibited in Figure 5(b). Data correspond well to blends’ overall properties and visual PU appearance. However, this could also suggest that diluted PCL is localized deeper inside the matrix. Specific PU and PCL signals, shown in Table 3, are in good correlation with information published by other authors. 17 -20 rGO bands, although organic, are not widely present on the surface of prepared composites (Figure 6(a)); however, they could be detected by Raman inside some individual pores (Figure 6(b)). This suggests that aggregation in more favorable locations, that is, alongside conducting, metallic, and metallic oxide fillers. 21,22 Since FTIR and Raman techniques do not show pure metal particles, XRF and EDX must have been taken into account. However, after exposure to urban C5-I conditions in temperate climate zone (EN ISO 12499 standard) not protected metallic fillers have been oxidized on the surface—this fact was visible in the form of thin, white layer coatings. Their composition was successfully confirmed by Raman spectra shown in Figures 7 and 8 after comparing them to respective reference data. Literature seems to also support these claims. 23 -25 Described metallic oxides alongside carbon nanofiller signals are presented in Table 4. Unfortunately FTIR spectra had too low spectral quality in the low-wave number region to confirm the presence of some highly fragmented inorganic fillers in such complex composites. Oxidation of pigments is an important phenomenon that significantly decreases conductivity and has crucial impact on samples cohesion, visual appearance, and biomechanical properties. 26,27 This could be a promising subject for another investigation if we include antibacterial aspects of these materials during exploitation in such harsh urban conditions. A similar topic was discussed by Saeed et al., 28 where oxidation of Zn to ZnO was caused solely by sunlight and moisture accumulated in the pores—there hydrogen peroxide was an intermediate product which affected local bacteria lacking appropriate enzymes to decompose this oxidizing agent.

Raman (bottom, blue) and FTIR (top, red) spectra acquired on uniform surface of: (a) pristine, reference PU thin film and (b) pure PU-PCL matrix mixed in 8:2 wt ratio. There is little or no visual difference between the peak positions. PU: polyurethane; PU-PCL: polyurethane–polycaprolactone.
Observable FTIR and Raman spectroscopic modes for PU and PCL components mixed in 8:2 wt ratio. PU bands are predominant, however traces of PCL are also detectable.

PU: polyurethane; PCL: polycaprolactone.
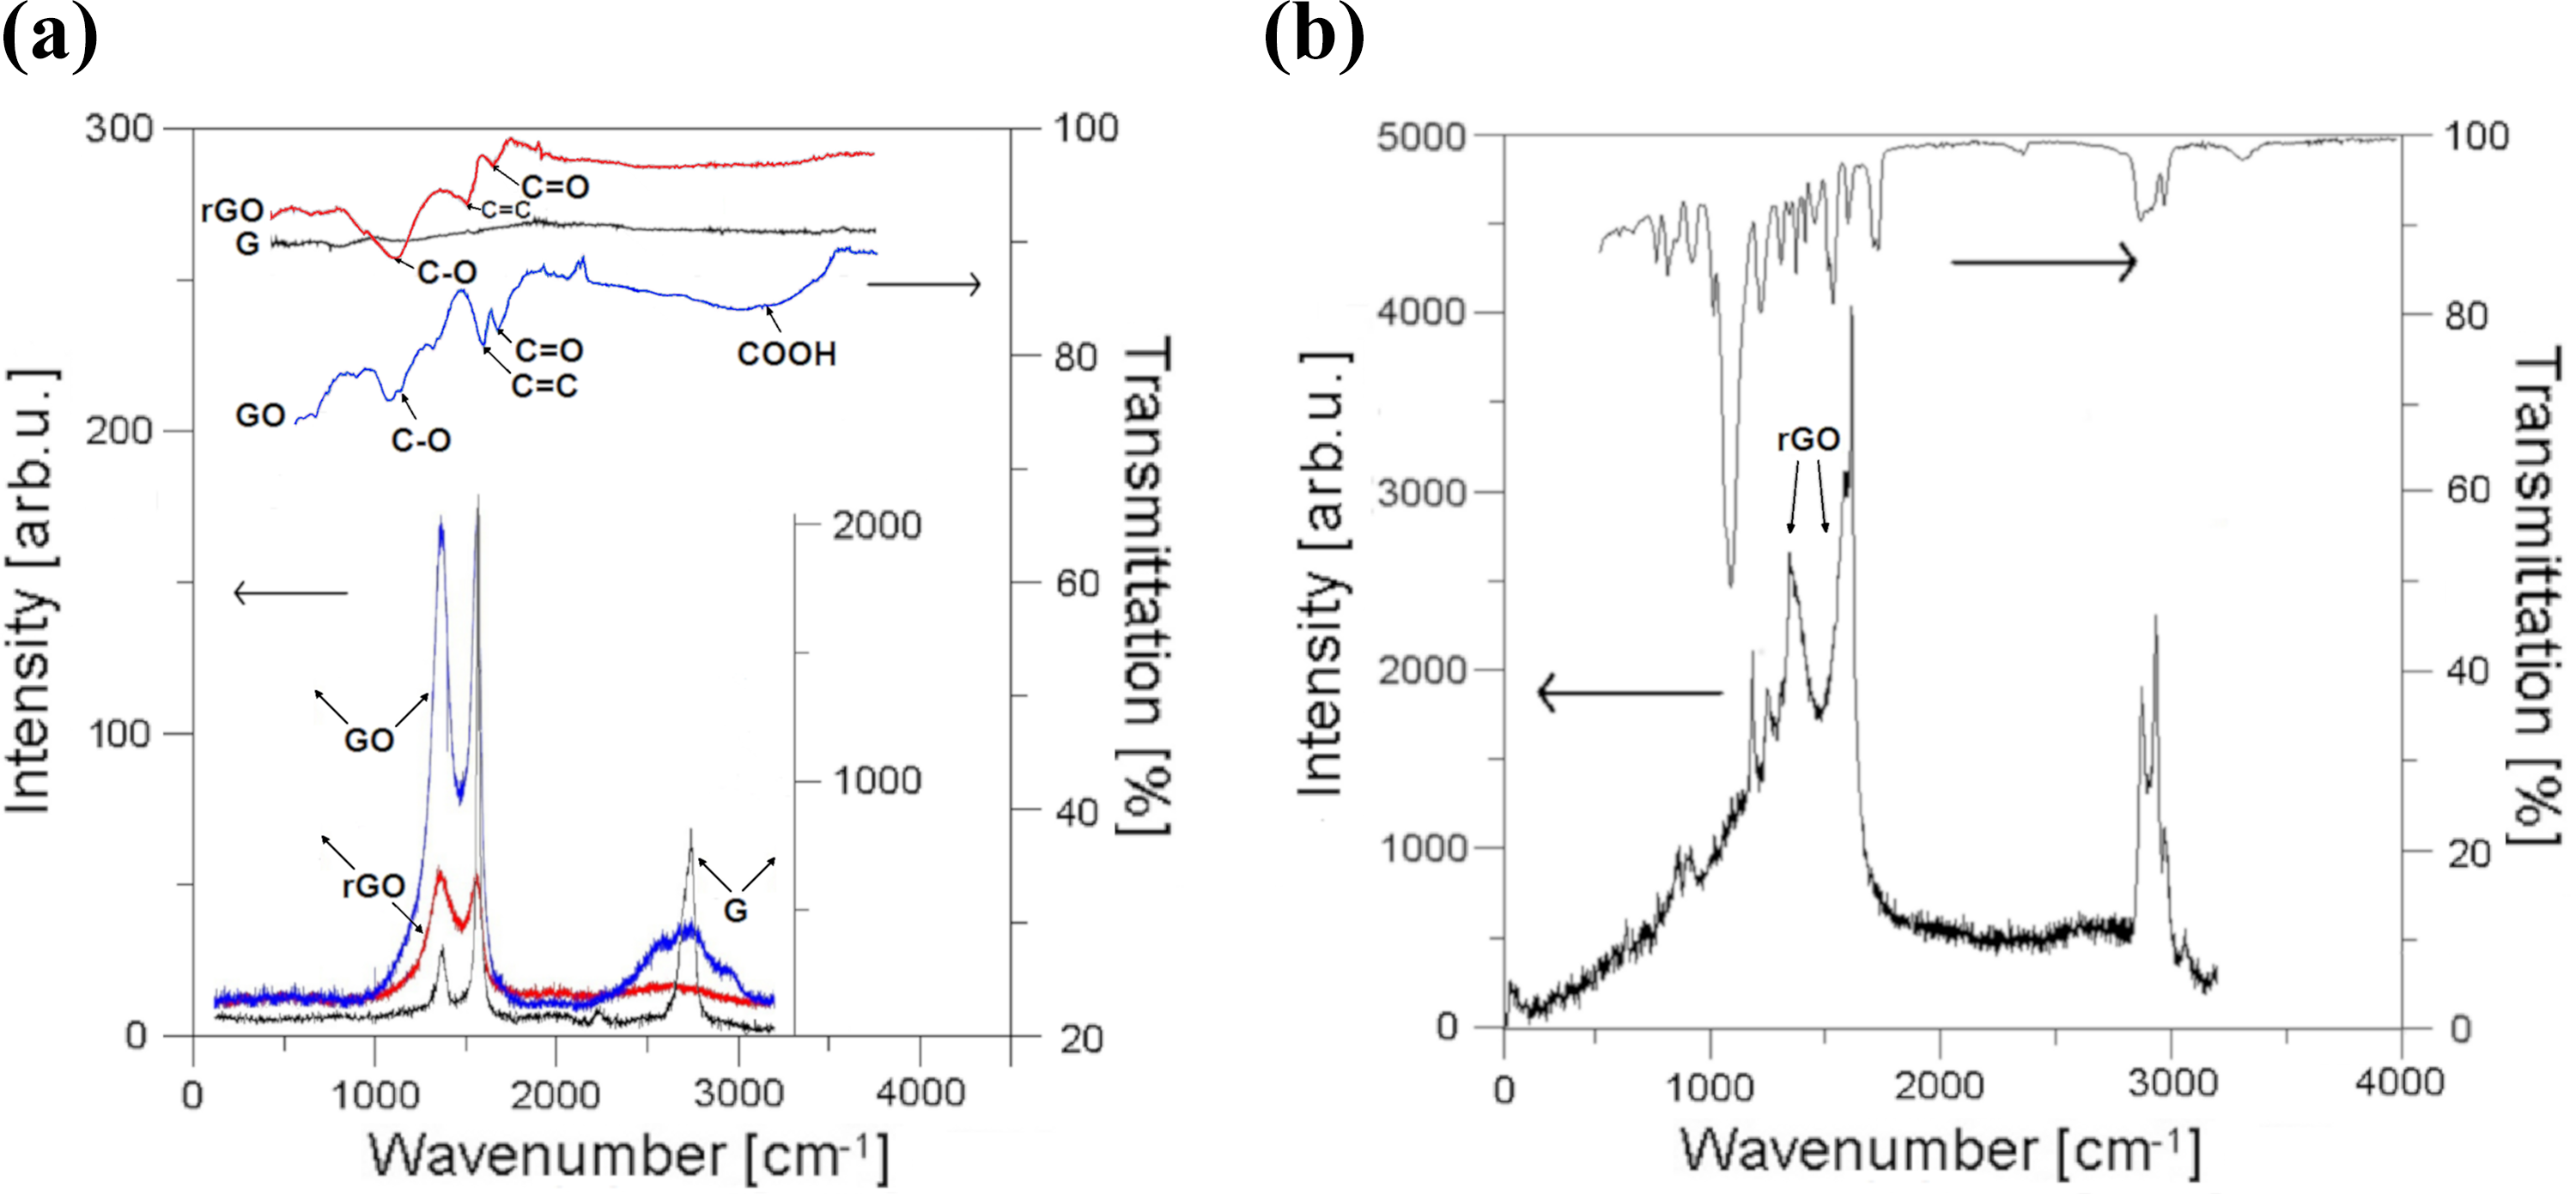
Raman (bottom) and FT-IR (top) spectra acquired from: (a) synthesized GO (blue curve), rGO (red curve) and their graphite (black curve) substrate; and (b) one of pores in percolating, PU-PCL composite filled with 2.5 wt% rGO, and 82.5 wt% Zn. GO: graphene oxide; rGO: reduced graphene oxide; PU-PCL: polyurethane–polycaprolactone.

Raman (bottom, blue) and FT-IR (top, red) spectra acquired on (a) percolating, microporous surface of PU-PCL composite filled with 82.5 wt% of Zn and 2.5 wt% rGO after 3-month exposure in C5-I atmosphere compared to (b) fully oxidized Zn filler. PU-PCL: polyurethane–polycaprolactone; rGO: reduced graphene oxide.
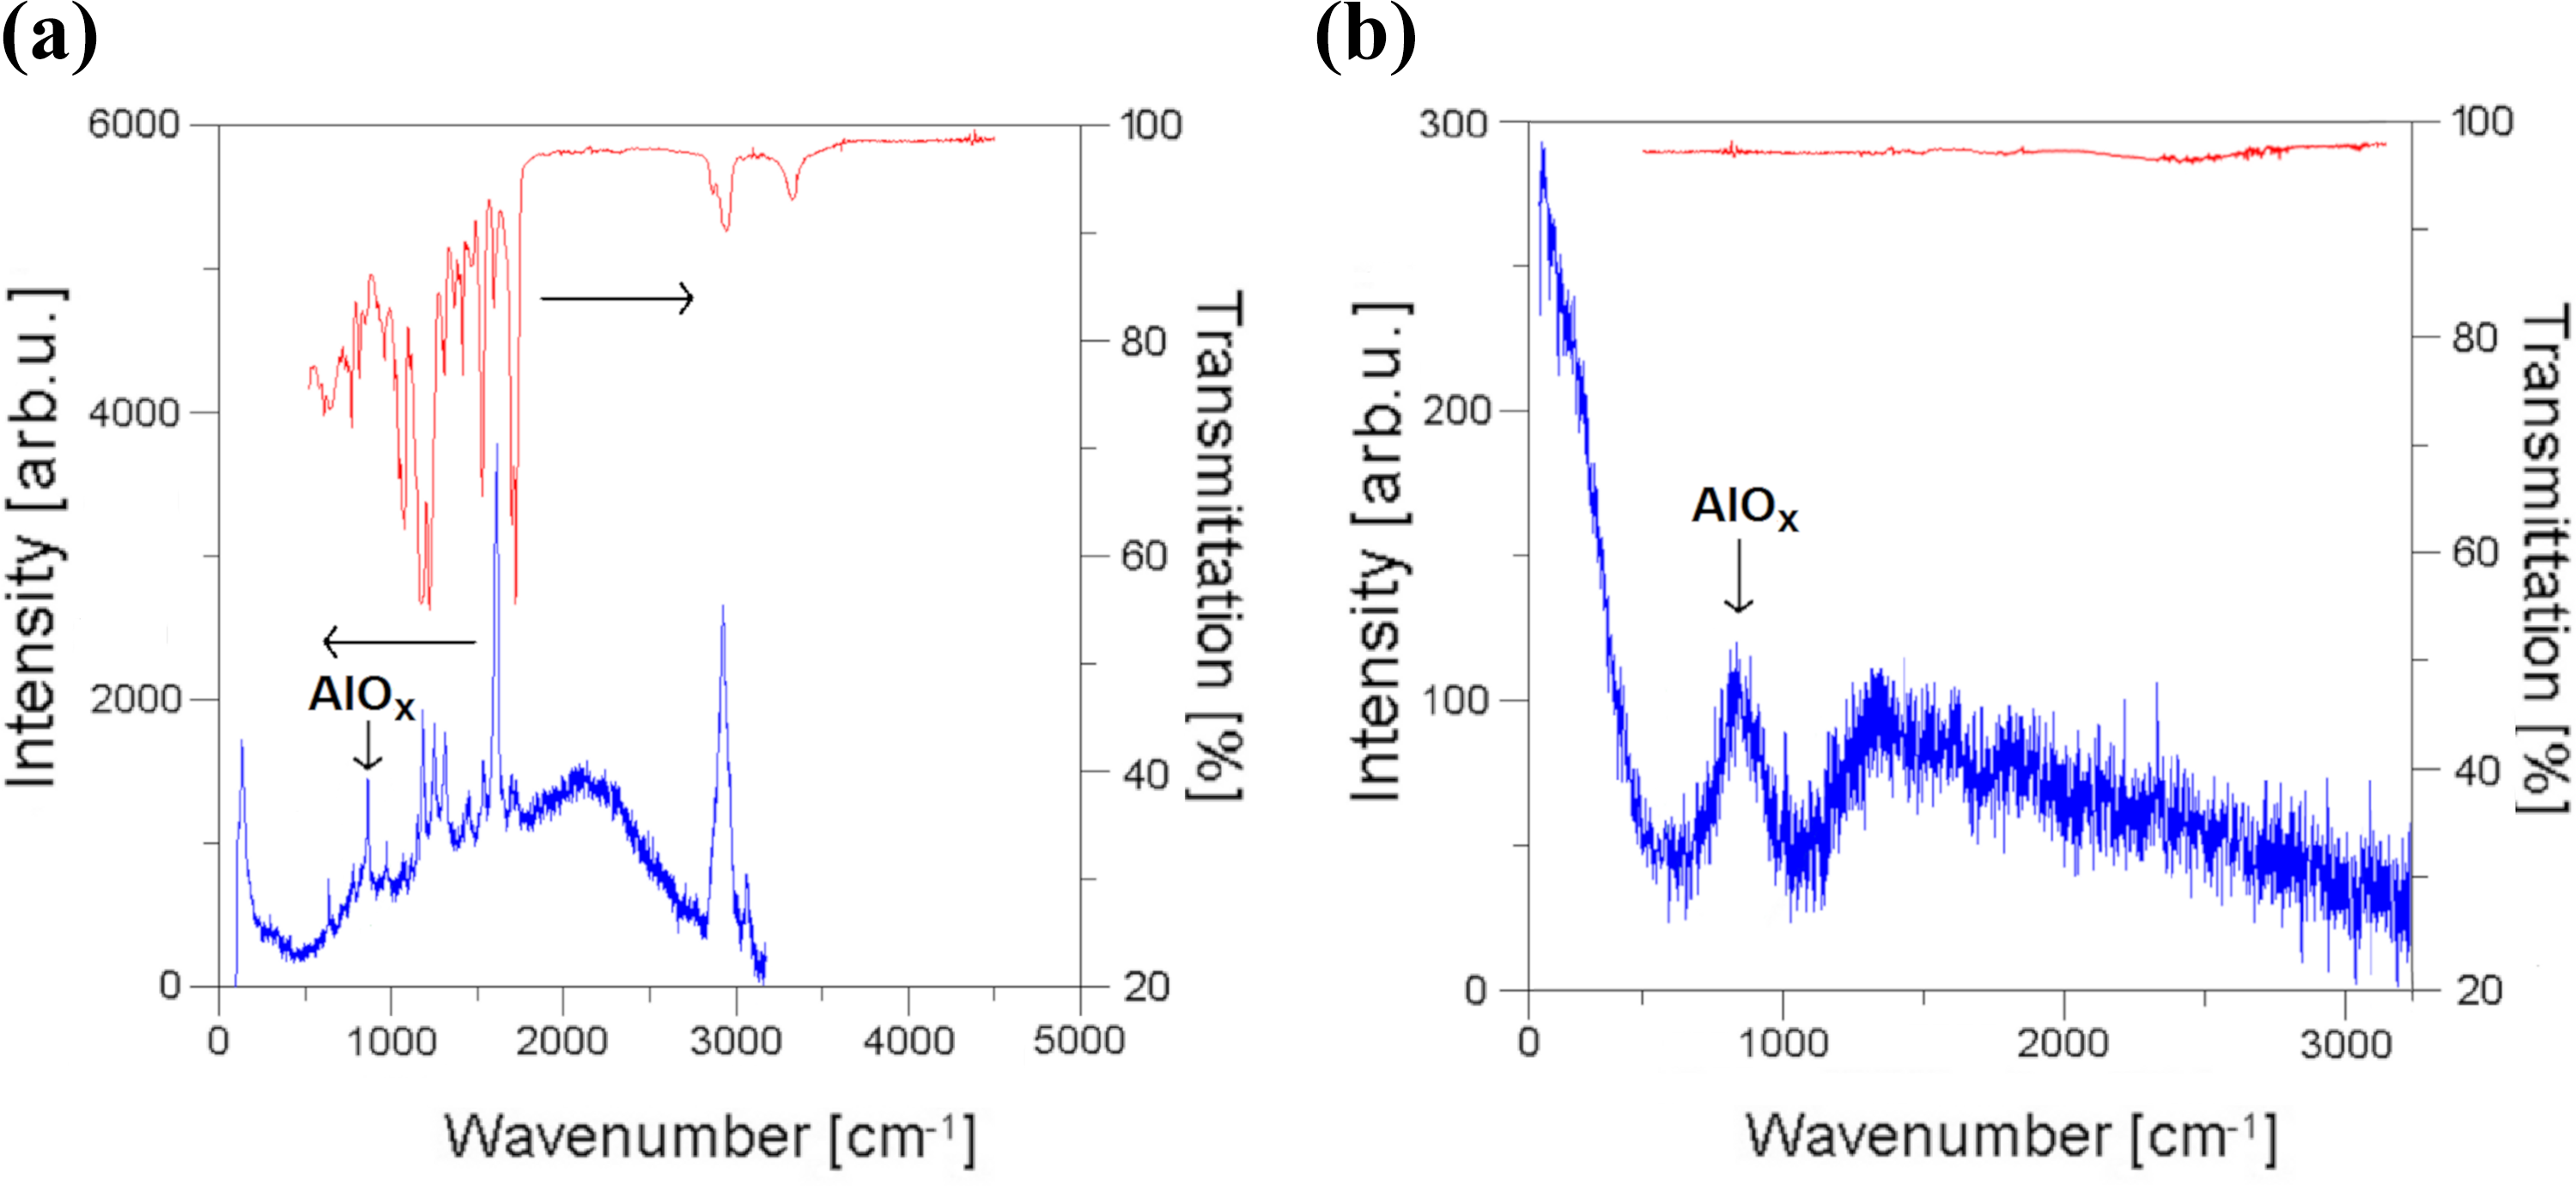
Raman (bottom, blue) and FT-IR (top, red) spectra acquired on (a) percolating, microporous surface of PU-PCL composite filled with 82.5 wt% of not passivated Al spheres and 2.5 wt% rGO after 3-months of exposure in C5-I atmosphere compared to (b) fully oxidized Al filler of the same type. PU-PCL: polyurethane–polycaprolactone; rGO: reduced graphene oxide.
FTIR and Raman vibration assignment for all investigated fillers.

GO: graphene oxide; rGO: reduced graphene oxide; G: graphene; unsat: unsaturated.
High background visible on Raman spectra is apparently due to the high porosity of investigation materials. Furthermore, the addition of glossy purely metallic fillers hinders the scattering phenomenon in already amorphous sample containing highly dispersed hard and soft segments.
After thermal regeneration of damaged samples, profile changes were visible regarding porosity and color shade around the scars. That suggested large differences in local structural composition, therefore, Raman measurements were made to determine to what degree the composition has been changed according to proper reference of PU-PCL spectra shown in Figure 9(a). Comparing the reference material to healed samples presented in Figure 9(b), it is evident that the regenerated areas indeed have different composition than the rest of the surface. PCL material is more apparent and its content is prominently greater—in between 6:4 and 4:6 PU-PCL instead of initial 8:2 wt ratio. That fact is not surprising due to PCLs low-melting point. These areas were also enriched in Fe3O4 particles, if the sample contained them—the filler became visible due to simultaneous magnetic sweep that was intended to help the mending process in most of the cracks during subtle heating. Further investigation is considered to determine changes in mechanical and biological properties of those locally healed areas knowing that PCL-enriched matrix is more prone to environmental damage 12,29 and attacks from nearby coexisting microorganisms. 30
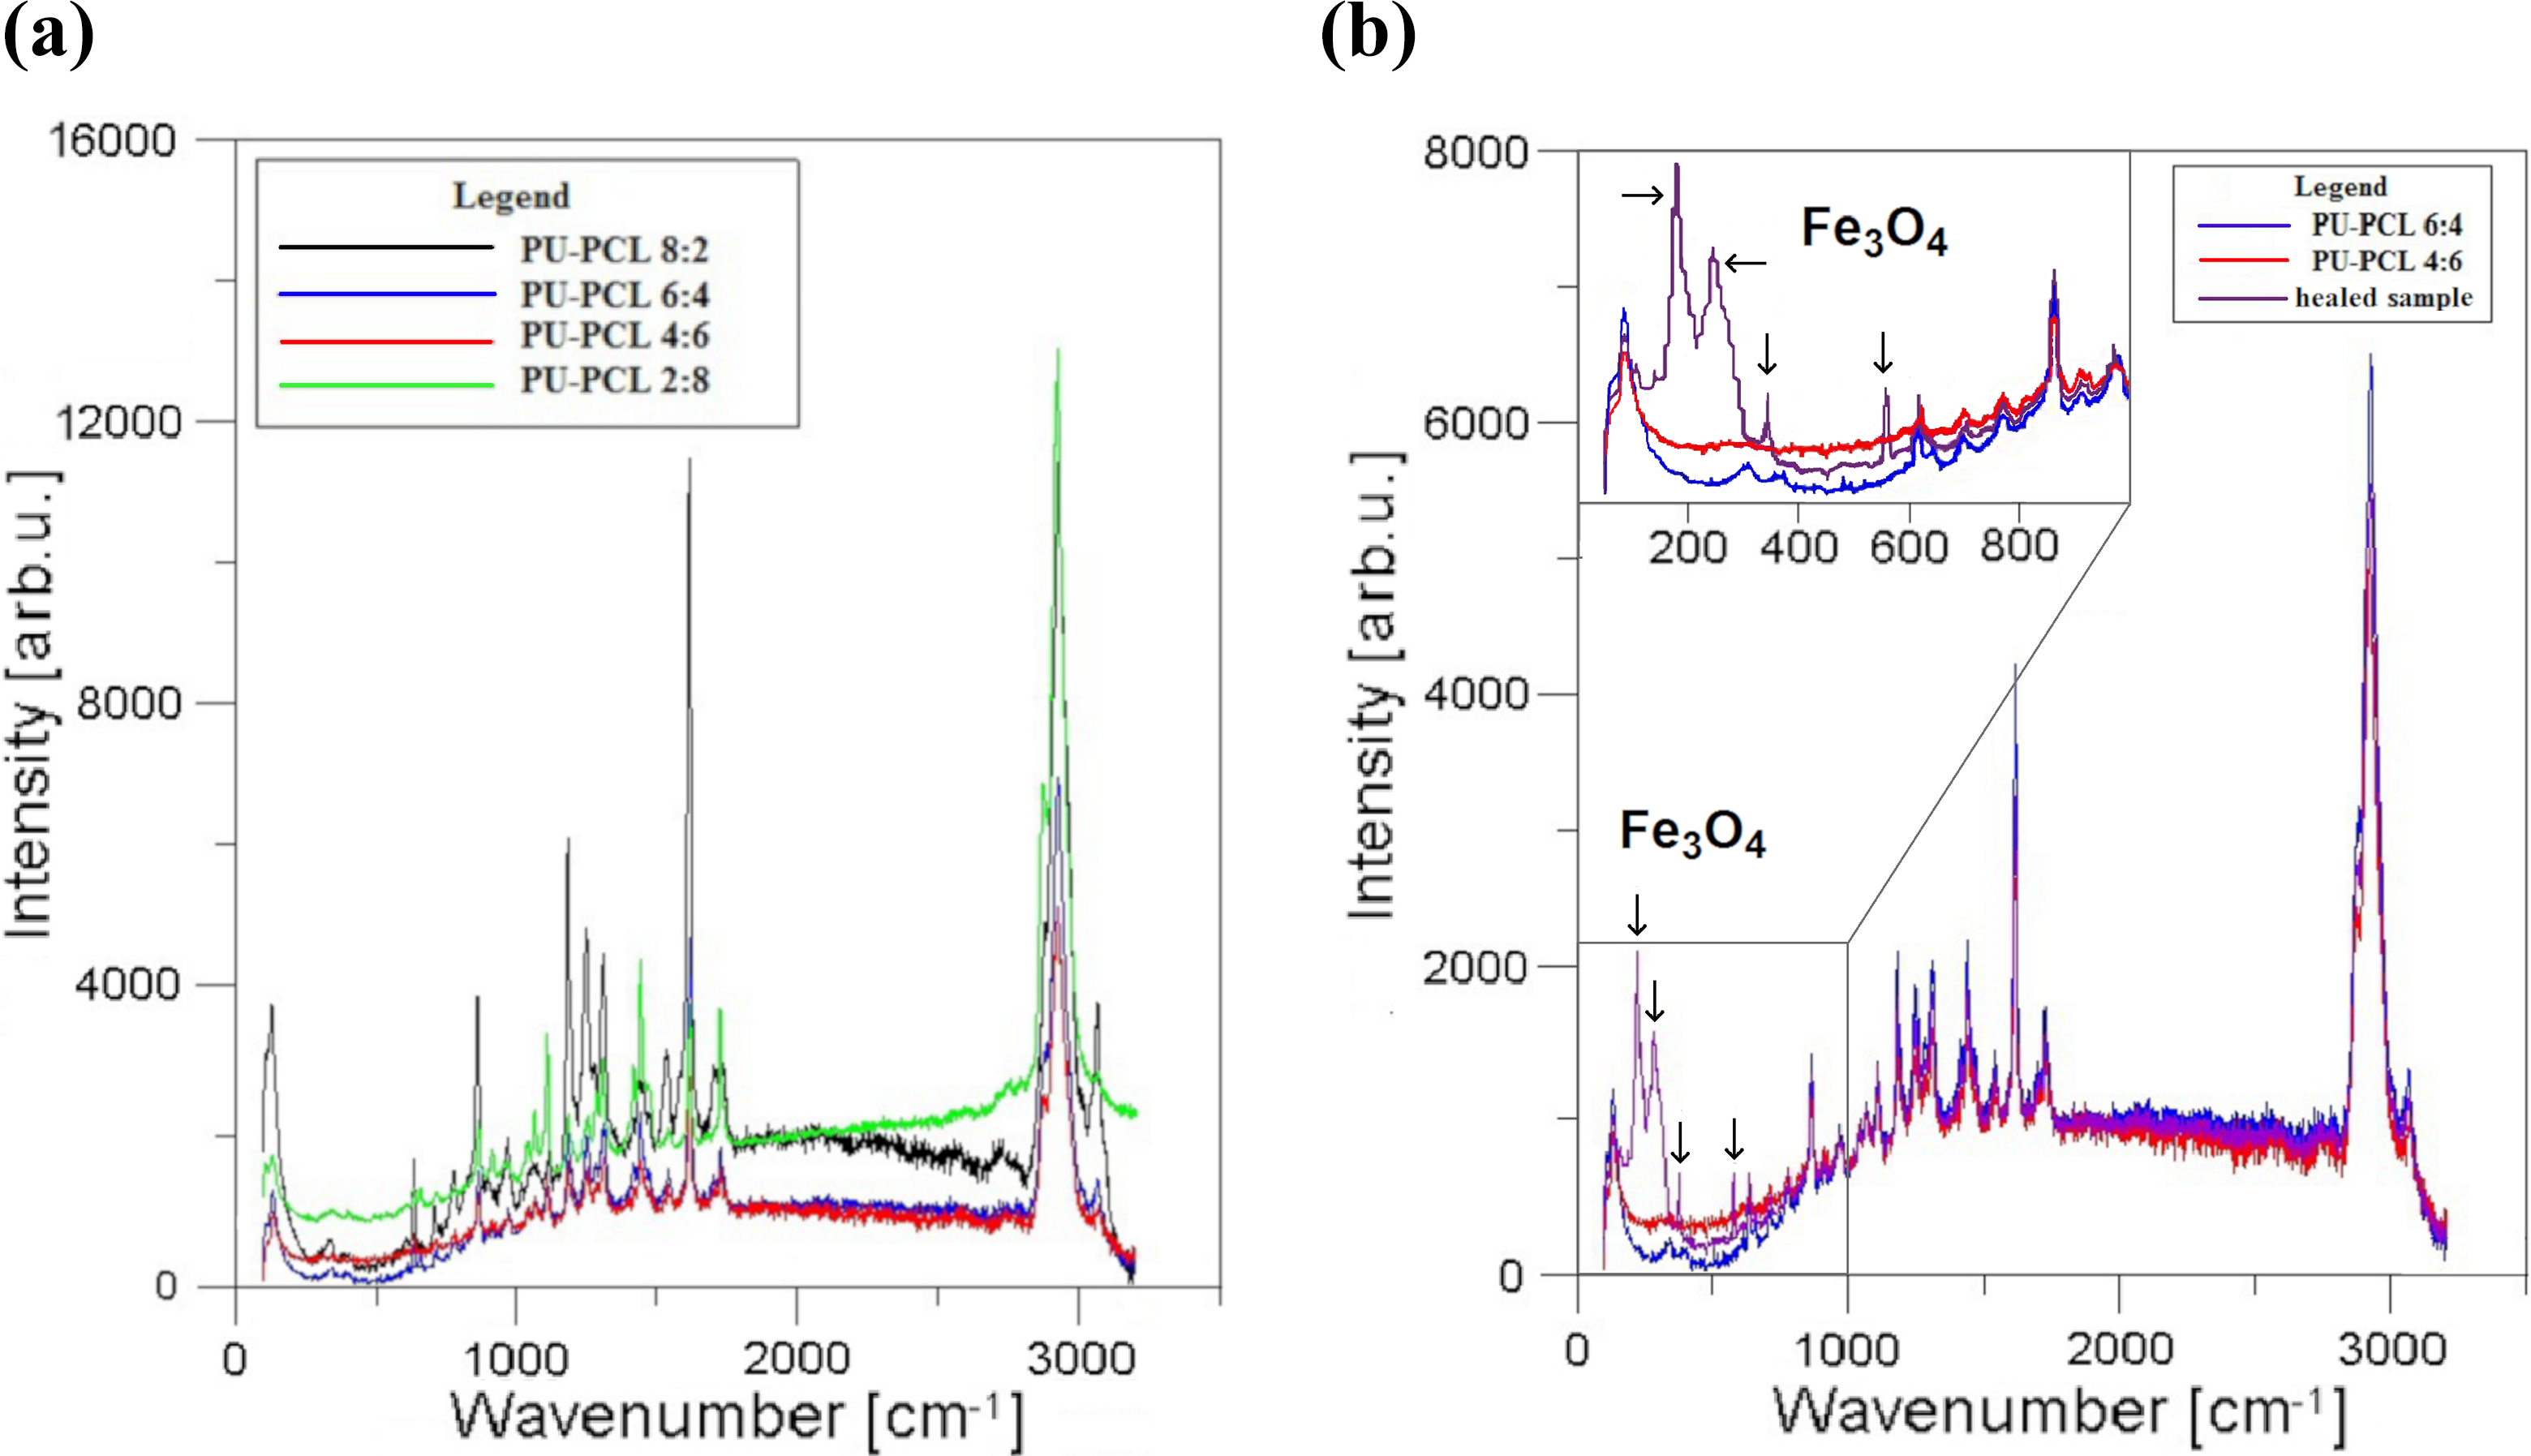
Raman spectra of: (a) non-filled, PU-PCL blends having different wt ratio of matrix components in correlation to (b) thermomagnetically healed area at the surface of 8:2 PU-PCL composite initially filled with 67.5 wt% Zn, 15 wt% Fe3O4, and 2.5 wt% of rGO. PU-PCL: polyurethane–polycaprolactone; rGO: reduced graphene oxide.
Thermal analysis
DSC analysis has proved useful in showing thermal characteristics, healing, and melting points of composite matrices. Healing effect is mainly attributed to the low melting point of PCL in PU-PCL blends. Comparing the position of melting peaks between pristine PCL (Figure 10(a)) and filled blends (Figure 10(b)), it is apparent that they shift toward lower temperatures with increasing filler content from 59°C to 53°C. Peaks are getting smaller and broader at the same time which means reduction of energy is needed to melt these materials, this is especially visible when rGO is present inside the matrix. Weakening signal can be observed not only for melting but also at the recrystallization process in Figure 10(a), where peak position shifts from 33°C to 32°C, to approximately 27–26°C evident in Figure 10(b). Ferromagnetic particles added to the composite physically helped during crack healing, but unfortunately they also increase heat required for melting. It is also worth noting that the PCL phase transition takes place in the wider range of temperatures (changes observable in Figure 10(a) are broader than usual) since molar mass might slightly differ from precisely ascribed (average) 45,000 g mol−1that essentially renders these materials not applicable in a very hot and sunny environment. 31,32 Further investigation shows PU hard-segment melting point at around 205–210°C which is in good correlation with data obtained by Wu et al. 33 Two peaks were often visible at the far-right end of DSC heating curve due to possible presence of two different hard-segment structures relaxing within the PU matrix. Analysis of those PU signals alongside with other components such as PCL are being presented in Table 5. All percolating composites have similar changes in characteristics regarding peaks position, their broadness, and shifting enthalpy taking of course into account types of introduced fillers with their respective levels of concentration. However, some higher signals, that is, complex heat-transfer peak above 215°C—partially apparent in Figure 10—are often attributed to decomposition of the matrix which is thoroughly investigated further by thermogravimetric (TG)/derivative thermogravimetric at much higher temperatures.

DSC thermodiagrams for (a) pristine PU and PCL materials used to synthesize PU-PCL matrices, and for (b) PU-PCL composite filled with 67.5 wt% of Zn, 15 wt% Fe3O4, and 2.5 wt% of rGO. DSC: differential scanning calorimetry; PU: polyurethane; PCL: polycaprolactone; PU-PCL: polyurethane–polycaprolactone.
DSC data obtained from analyzing first cooling and second heating (melting) curve for reference materials and few representative composites.

DSC: differential scanning calorimetry; PCL: polycaprolactone; PU: polyurethane; PU-PCL: polyurethane–polycaprolactone; rGO: reduced graphene oxide.
Lack of weight loss after melting—before slopes descent occurs at 293°C in Figure 11 left onset—indicates slow decomposition of PU to polyol and polyisocyanate oligomers. 33 Normally, slightly above 220°C, GO is being smoldered into rGO during synthesis at inert conditions, so some additional reaction from unreduced GO might take place inside the matrix. 3 At 280°C, small R–NCO particles start to evaporate alongside water emerging from decomposing oligocyanates and oligomerols. The main slope at 330°C is related to fast urethane and ester degradation resulting in rich carbon dioxide (CO2) emission. This reaction is responsible for the main mass loss of the blends. Often, after CO2, short volatile R–NH2 and R–NH–R evaporate. These first two reactions (close-up in the upper right corner of Figure 11) could occur at higher temperatures depending on the materials segment-filler interaction, type of introduced dopants, and their overall concentration. All aforementioned facts were verified in experiments (Table 6) and literature. 29,34 Mass balance in TG after thermal analysis is in good correlation with the weight amount of added fillers which means that the most of polymer matrix has evaporated. However, weight loss might be bigger due to partial rGO reduction. In contrary, all Zn samples might show a-little-higher-than-estimated final weight due to partial Zn oxidation or carbonization—that process is represented by third peak on Figure 11—close to 375°C. The bonding of Zn with emerging, gaseous CO2 and H2O particles corresponds well with the composition of degrading material—this process occurs with high efficiency between 350°C and 400°C, even in inert TG atmosphere. 34 Despite Zn’s weaker thermoxidative resistance, composites with it show similar change in parameters to those doped with non-passivated Al—comparable enthalpy and peak positioning regardless of ferromagnetic Fe3O4 presence. The only visible change is in energy needed for physical phase transitions—it is roughly 0.4 ÷ 1.0 J g−1. However, addition of rGO carries a significant impact by greatly reducing required heat. It also helps by improving mechanical properties but again one must take into account other fillers concentration and barrier ability to estimate proper filler-matrix interactions maintaining in the same time blends overall cohesion. 35 Passivated Al flakes pose similar behavior, but they also greatly limit conductivity during the exchange. Eventual oxidation and carbonization of Fe3O4 to Fe2O3 or Fe2(CO3)3 were ruled out during TG since inert (N2) conditions were implemented, and these reactions require sufficient amount of energy at much higher temperatures—in between 600°C and 900°C. 36 The same remark relates to all Al fillers. 34 Furthermore, carbonization is also not likely to occur since material weight should increase much more during the experiment what was not observed.

TG/DTG diagrams for PU-PCL composites filled with: (blue) 67.5 wt% of Zn, 15 wt% Fe3O4, 2.5 wt% of rGO, and for (red) 57.5 wt% of Al flakes with 2.5 wt% of rGO. TG/DTG: thermogravimetric/derivative thermogravimetric; PU-PCL: polyurethane–polycaprolactone; rGO: reduced graphene oxide.
Temperatures and remaining total weight values obtained for composites investigated via TG/DTG method shown in Figure 11.

TG/DTG: thermogravimetric measurements; PU-PCL: polyurethane-polycaprolactone; rGO: reduced graphene oxide.
Conclusions
It is prominent that healing and conductivity are antagonistic phenomena showing negative synergy within the investigated composite group. Transverse conductivity, measured according to the ASTM D257 method, confirmed that samples achieve values above the semiconductor–insulator limit (10−6–10−8 S cm−1). Ferromagnetic particles (Fe3O4) help cracked preheated PU-PCL composites in the regeneration process when the magnetic sweep is applied, however, they are not promising as a conducting medium—they contribute somehow to the electron transfer but cannot be used as a good matrix. 3 replacement for Al or Zn particles. Furthermore, magnetic stimulus applied via migrating Fe3O4 particles reinforced the whole thermally induced regeneration. Those dense materials were able to mend alongside generated cracks with the matrix locally enriched with PCL component. However, at the same time, this process contributed to closing of all nearby percolation pores reducing local conductivity. Changes in local matrix composition were confirmed on the healed scars by Raman spectroscopy and XRF—places were noticeably thicker, enriched in PCL, and had altered filler content showing different biomechanical properties which still await further investigation. Added amount of rGO improved homogeneity and transverse conductivity. Compared to other fillers, this carbon-based dopant also significantly decreased the required amount of energy and temperatures at which physical phase transition occurred. Also, rGO seems to stay in the same form compared to other, more abundant metallic fillers. Namely, Zn and uncoated Al slowly oxidize on the surface during exposition to the industrial C5 atmosphere (briefly described by EN ISO 12499 standard referring to temperate climates). The only exception occurs at highly elevated temperatures when the temperature exceeds 210°C. At that point, TG measurements show gradual degradation of exposed rGO interacting with the environment after fully melted polymer blend starts to decompose. Yet all of these changes and observations in intentionally filled blends lead to interesting aberrations in local biomechanical properties. We hope that this work will stimulate further investigations in matters of optimizing or finding the true balance between percolation and regeneration. It seems, however, that healing process would be a more promising subject if we take into account synergy effects presented above with all recent trends in polymer science and technology. 37,38
Footnotes
Acknowledgements
Special thanks to Prof. Dr hab. Andrzej Miszczyk, Prof. Dr hab. Stefan Krakowiak, and Prof. Dr hab. Andrzej Suchocki for valuable discussion and guidance.
Declaration of conflicting interests
The author(s) declared no potential conflicts of interest with respect to the research, authorship, and/or publication of this article.
Funding
The author(s) received no financial support for the research, authorship, and/or publication of this article.