
Abstract
Waste tire disposal is a growing challenge among major cities worldwide because each year, a huge number of end-of-life tires is generated. The current study aimed to evaluate the potential of ground rubber tire (GRT) and waste rubberwood sawdust (RWS) as materials for developing wood-polymer composites (WPCs). The effects of the compositions’ contents and rubber types on the mechanical and physical properties, as well as the morphology of the thermoplastic elastomer (TPE)/RWS composites were investigated. The results revealed that the addition of about 30–60 wt% of RWS improved the modulus of elasticity, compressive modulus, and hardness of the TPE composites based on both the GRT and natural rubber (NR). With the same RWS content and rubber type, the TPE/RWS composites with rubber/plastic blends of a 30/70 ratio clearly yielded better mechanical and physical properties than those blends with a 40/60 ratio. The addition of about 2–4 wt% of maleic anhydride-grafted polypropylene (MAPP) improved all the properties of the TPE/RWS composites. Overall, the composites based on the GRT gave superior strength, rigidity, and dimensional stability than that based on NR. It is therefore suggested that the eco-friendly TPE composites made from GRT and waste rubberwood could be a suitable replacement for the inorganic filler-natural rubber composites for saving costs and the environment.
Keywords
Introduction
Nowadays, waste tire disposal has received increased interest among major cities worldwide because one billion of waste tires are produced every year. 1 Reuse and sustainable recycling of rubber tires are eco-friendly and economic techniques for solid waste management. However, due to the crosslinked structure from the vulcanization process, a rubber tire cannot be easily disposed, so it is often utilized in footwear, vehicle components, playground equipment, highway crash barriers, and sealing applications. 2 Furthermore, another interesting disposal method is the blending of ground rubber tire (GRT) with plastics to reduce the raw material costs of the final product 3 and to obtain impact resistant plastics, as well as generate novel thermoplastic elastomer (TPE) material.
Normally, the TPE is often blended between natural rubber (NR) and thermoplastic; such as, high-density polyethylene (HDPE), polypropylene (PP), polyvinyl chloride (PVC), polyurethane (PU), and polystyrene (PS) due to their low cost and ease of processing. Therefore, this presents intermediate properties between rubber and plastic, which offers flexibility in shaping, low production cost, and advantageous recyclability of scrap.4,5 On the other hand, the addition of virgin rubber into the TPE increases the cost and significantly decreases the hardness and modulus because of the absence of carbon black and uncrosslinked structure of the rubber matrix when compared with a rubber tire that is vulcanized. 6 Rocha et al. 7 reported that blends between the rubber tire and linear low-density polyethylene (LLDPE) as TPE was possible, whereas insufficient bonding between the plastic matrix and the rubber particles at the interphase resulted in poor mechanical properties. In another study, the stiffness and stress levels reduced with increment of waste tire rubber content in TPE. 8 Additionally, Ramarad et al. 9 stated that new emerging studies were developing the composites from GRT/plastic (TPE) to be reinforced with fillers, and the polymer system’s strength was increasing with the reinforced fillers. Many types of inorganic fillers; such as, short glass fiber, short nylon fiber, and carbon black were used for the investigations, 9 while the utilization of organic fillers for the TPE composites was limited.
Organic fillers; such as, natural fiber, waste paper, and wood sawdust, are interesting reinforcements for the TPE composites. For Thailand, rubberwood (Hevea brasiliensis) sawdust (RWS) is an appropriate waste material for utilizing as the reinforcement in TPE composites as it is generated largely from the sawmill and furniture industries. 10 Phakdee and Boochathum 11 used RWS-reinforced TPE that had been blended from PP and NR. They found that the tensile and flexural strength of the TPE composites decreased with the RWS loading. In contrast, Homkhiew et al. 5 reported that the modulus of the rupture and tensile strength of the TPE composites blended with the NR/HDPE ratios of 60/40 and 50/50, respectively, were improved with the addition of about 30–50 wt% of RWS. In other natural fibers, Noor Azammi et al. 12 filled kenaf fiber to reinforce the TPE blended from NR and PU, and found an improvement in the impact, flexural, and tensile strength for the NR/PU composites with the kenaf. Piah et al. 13 used mengkuang fiber as the reinforcement in the TPE blended from NR and HDPE. They revealed that the optimal mengkuang fiber content was 20 wt% for the TPE composites blended with the NR/HDPE ratios of 40/60. Likewise, Mohamed et al. 14 blended the NR/HDPE ratio of 40/60 with mengkuang fiber sizes of 125, 250, and 500 μm, and found that the composites with 20 wt% of fiber and 250 μm fiber size yielded the maximum tensile strength and modulus. Furthermore, despite other research about the TPE composites reinforcing the natural fiber having been extensively studied, few investigations had utilized RWS to reinforce the TPE based on virgin natural rubber.
A limited number of investigations had been performed toward the natural fiber-TPE composites based on GRT by studying the potential of natural fiber materials as the reinforcement. Shao et al. 15 used waste rubber tire to partially replace the rubber compound in producing the composites from wood fiber and rubber. They reported that mechanical properties, water absorption, and processability were improved when the waste rubber tire with less than 20% was added to the composites. In another study, Kakroodi et al. 6 added GRT as an impact modifier in composites made from natural fiber and malleated polyethylene, and found that the impact strength increased up to 50% when adding 10% of GRT into the composites. However, from the literature, there has been no previous study on RWS-reinforced TPE based on GRT that the current work emphasized.
Increasing the utilization of waste materials, both GRT and wood sawdust, by turning them into low-cost wood-polymer composites would be a prospect in decreasing solid waste disposal. In developing the novel material, the composition and loading would significantly affect the mechanical and physical properties. Hence, the effects of RWS, blended ratios between GRT and plastic and blended rubber types, as well as the coupling agent on the properties of the TPE composites were needed to be further investigated. In the current work, the effects of the compositions’ (RWS, GRT, NR, PP, and MAPP) contents and rubber types (GRT and NR) on the mechanical and physical properties, as well as the morphology of the TPE/RWS composites were studied. The new information obtained would facilitate the potential development to replace some product materials in the future.
Materials and Methods
Materials
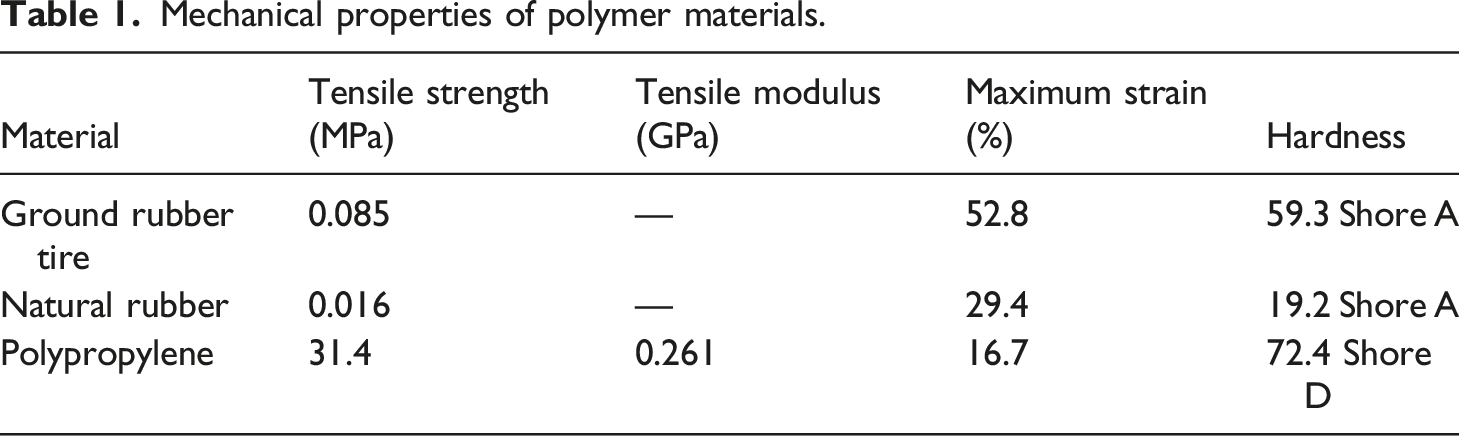
Mechanical properties of polymer materials.
Preparation of the rubber/polypropylene blends
The TPE was prepared by blending the GRT/PP ratios of 30/70 (R3P7T) and 40/60 (R4P6T), as well as the NR/PP ratios of 30/70 (R3P7L) and 40/60 (R4P6L) in a co-rotating twin-screw extruder (Model CTE-D25L40 from Chareon Tut Co., Ltd., Samut Prakan, Thailand). The seven-barrel temperatures of the twin-screw extruder were set to a profile in the range of 180–200oC, while the screw rotating speed in the blending was controlled at 60 r/min. The extruded TPE strands were then blown to cool them and were subsequently pelletized.
Preparation of the TPE/RWS composites
Formulation of TPE/RWS composites in experiment.
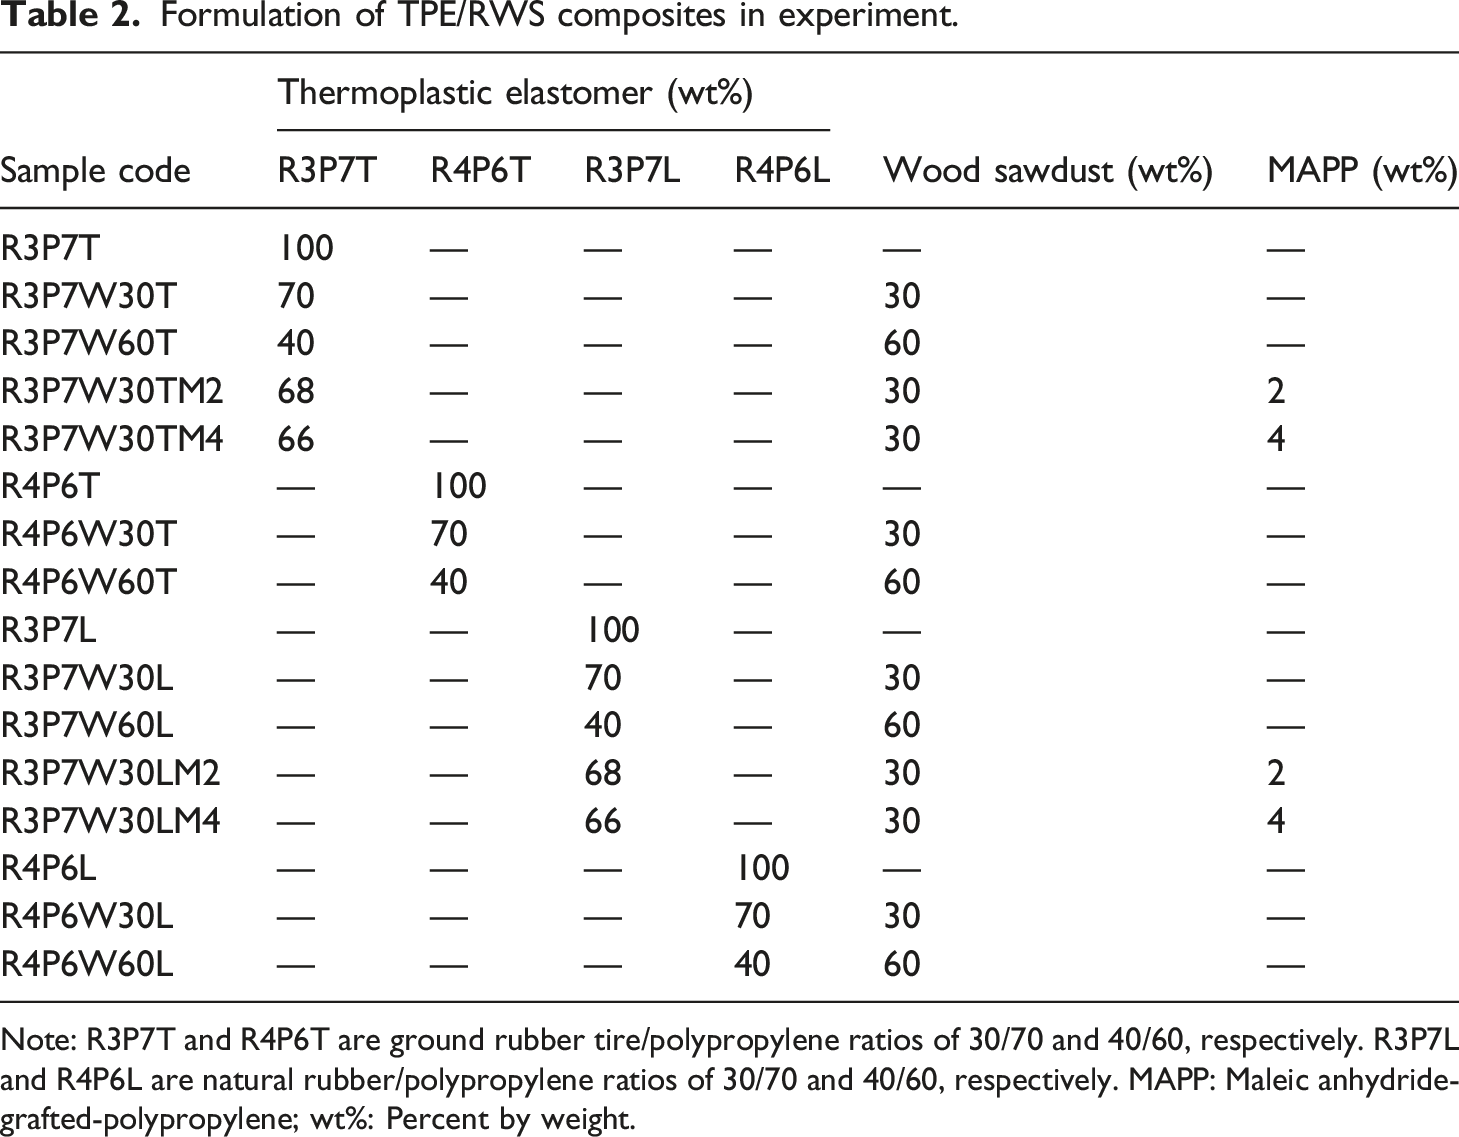
Note: R3P7T and R4P6T are ground rubber tire/polypropylene ratios of 30/70 and 40/60, respectively. R3P7L and R4P6L are natural rubber/polypropylene ratios of 30/70 and 40/60, respectively. MAPP: Maleic anhydride-grafted-polypropylene; wt%: Percent by weight.
Analytical methods
Statistical analysis
The experimental results from the six specimens of each characterization were analyzed. The effects of the RWS and MAPP contents on the mechanical properties of the TPE/RWS composites were assessed by the analysis of variance (ANOVA) and Tukey’s multiple comparison test. The ANOVA indicated the significant differences of the sawdust and MAPP contents while Tukey’s test revealed a comparison between the mean values. The effect of the rubber types was also analyzed with a two-sample t-test to detect the significant differences. A 95% confidence level (α = 0.05) was applied for all statistical analyses.
Morphological analysis
A scanning electron microscope (SEM) (Model FEI Quanta 400 from FEI Company, Oregon, USA) was used to observe the voids, interfacial morphology, and phase dispersion of the wood sawdust in the polymer matrix. Prior to the evaluation by the SEM, all specimens of the TPE/RWS composites were broken down in liquid nitrogen to avoid the phase deformation and any damage. All sample surfaces were then coated with gold to prevent electron charging during the observation. The composite surfaces were imaged at an accelerating voltage of 20 kV with a magnification of ×500.
Characterizations
Mechanical tests
Bending properties; such as, the modulus of rupture (MOR), modulus of elasticity (MOE), and maximum flexural strain (MFS), were determined in a three-point flexural test. The flexural testing was conducted according to the ASTM D790 standard at a crosshead speed of 2 mm/minute, a span of 80 mm, and specimens with nominal dimensions of 4.8 mm × 13 mm × 100 mm. For the compressive properties, the prism specimens (6 mm × 6 mm × 12 mm) were used to measure the compressive strength (CS) and modulus (CM). The compressive testing was performed according to the ASTM D6108 standard with a constant displacement rate of 5 mm/minute. Both the flexural and compressive tests were carried out on a Mechanical Universal Testing Machine (Model NRI-TS500-50 from Narin Instrument Co., Ltd., Samut Prakan, Thailand) at room temperature (25°C) with six replications for each composite formulation.
The hardness of the TPE/RWS composites was measured according to the ASTM D2240 standard. Specimens with nominal dimensions of 30 mm × 30 mm × 6 mm were tested by using Durometer Shore D scales (Model GS-702G from Teclock Corporation, Nagano, Japan). Six specimens of each formulation were characterized at room temperature (25°C).
Water absorption test
The measurement of the water absorption (WA) of the TPE/RWS composites was carried out according to the ASTM D570. Prior to starting the WA test, six specimens with nominal dimensions of 10 mm × 20 mm × 6 mm of each formulation were placed in an oven at 50°C for 24 h. The weight and thickness of the dried specimens were then measured with a precision of 0.001 g and 0.01 mm, respectively, before being submerged in water at room temperature (25oC). After immersing for 24 h, the specimens were removed from the water and placed vertically to allow the water to drain for 1 minute. Then, the excess surface water was meticulously dried with tissue paper and immediately weighed and measured to determine the weight and thickness of the wet specimens.
Wear Resistance
The wear resistance of the TPE/RWS composites was evaluated using the Taber abrasion tester (Model 5155 from Taber Industries, USA), according to the ASTM D4060. Disk shaped specimens with a diameter of 10.5 mm and thickness of 2 mm were prepared and placed on the turntable platform of the machine. A contact load of 500 g was gripped on a set of two rotating abrasive wheels. The testing was conducted for 1000 cycles to determine the weight loss of the specimens.
Results and Discussion
Statistical analysis of the effects of the compositions’ content and rubber types
Results of statistical analysis for the mechanical properties of thermoplastic elastomer composites with different RWS contents and rubber types.
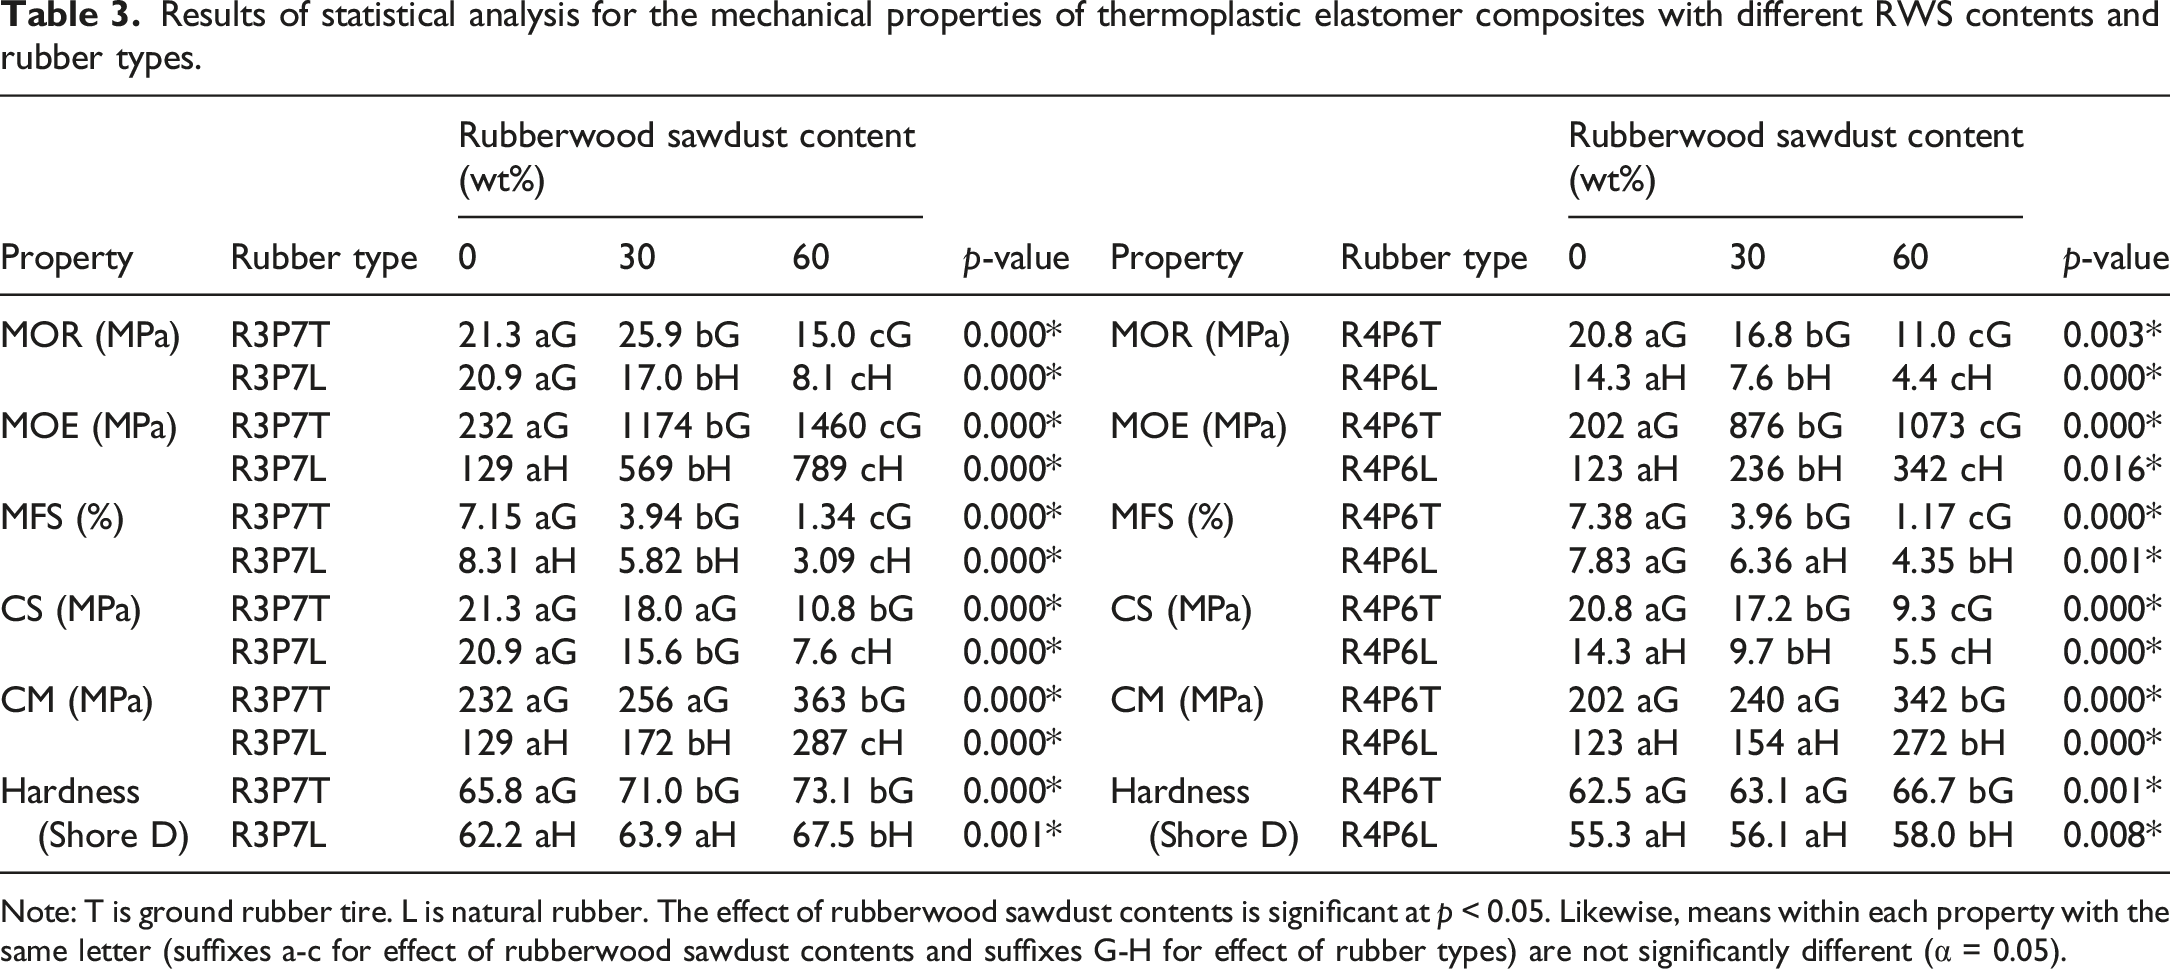
Note: T is ground rubber tire. L is natural rubber. The effect of rubberwood sawdust contents is significant at p < 0.05. Likewise, means within each property with the same letter (suffixes a-c for effect of rubberwood sawdust contents and suffixes G-H for effect of rubber types) are not significantly different (α = 0.05).
Results of statistical analysis for the mechanical properties of thermoplastic elastomer/rubberwood sawdust composites with different maleic anhydride-grafted polypropylene contents and rubber types.

Note: T is ground rubber tire. L is natural rubber. * The effect of MAPP contents is significant at p < 0.05. Likewise, means within each property with the same letter (suffixes a-c for effect of MAPP contents and suffixes G-H for effect of rubber types) are not significantly different (α = 0.05).
Table 4 exhibits the ANOVA result of the effect of the MAPP contents on the mechanical properties of the TPE/RWS composites. The MAPP contents significantly (p<0.05) affected all the mechanical properties of the TPE composites reinforced with 30 wt% of RWS, except the MFS and hardness of the TPE/RWS composites based on the NR and GRT, respectively. Furthermore, Tukey’s test indicated that the TPE/RWS composites without the addition of MAPP (suffix a) presented a significantly lower MOR and MOE than the composites that added 2 wt% and 4 wt% of MAPP (suffix b), but the composites with 2 wt% of MAPP (suffix b) had an insignificantly lower MOR and MOE than the composites that added 4 wt% of MAPP (suffix b).
In addition, Tables 3 and 4 show the effects of the rubber types on the mechanical properties of the TPE and the TPE/RWS composites with and without the addition of MAPP. A two-sample t-test indicated that the TPE based on the GRT (suffix G) with the ratios of R3P7 showed a significantly higher MOE, CM, and hardness than those based on NR (suffix H). In contrast, those with the ratios of R4P6 of the TPE based on the GRT (suffix G) gave significantly larger mechanical properties than those based on NR (suffix H), except the MFS that the TPE based on NR exhibited an insignificantly superior property. Likewise, the TPE/RWS composites made from the GRT (suffix G) revealed significantly better MOR, MOE, CS, CM, and hardness than those made from NR (suffix H) for the same RWS contents. Moreover, for the TPE/RWS composites with the added MAPP in Table 4, the composites based on the GRT (suffix G) displayed significantly greater MOE and CM and lesser MFS than those based on NR (suffix H), whereas the rubber types insignificantly affected the MOR and hardness of the composites with 4 wt% of MAPP.
Micromorphology analysis
The compatibility, interaction, and phase dispersion of the RWS filler in the polymer matrix were investigated using an SEM. The morphologies formed during the process highly affected the mechanical and physical properties of the multiphase polymer composites.
17
The effects of the compositions’ content and rubber types on the morphological features of the TPE/RWS composites based on the GRT and NR are displayed in Figures 1 and 2, respectively. In the TPE ratio of R3P7, the SEM images of the composites based on the GRT and NR showed that the fractured surface of the TPE composites with 30 wt% of RWS presented lower cavities in the composite structures and smaller gaps between the polymer matrix and reinforcing filler than the composites with 60 wt% of RWS. This occurrence was due to the incompatibility problem between the polymer matrix and wood sawdust. Likewise, the composites reinforced with 60 wt% of RWS showed an obvious agglomeration of the RWS in the composite structures. The agglomeration of the filler particles in the composites structure indicated that the interaction between the polymer matrixes and the filler particles was weak.18,19 Wu et al.
20
also mentioned that the increasing agglomeration, gaps, and cavities would accelerate the moisture absorption and reduce the mechanical properties of the polymer composites, while Obada et al.
21
reported that the good dispersion of fillers in the polymer matrix could significantly improve the mechanical properties of the polymer composites. In addition, the TPE/RWS composites with a GRT/PP blend of a 30/70 ratio (Figure 1(a)) exhibited rougher fractured surfaces and more porosities than the composites blended with a 40/60 ratio (Figure 1(d)), whereas the composites with a NR/PP blend of a 30/70 ratio (Figure 2(a)) showed lower micro porous than blending with a 40/60 ratio (Figure 2(d)). Tanrattanakul et al.
22
also found that small holes in the thermoplastic natural rubber (TPNR) matrix reduced in size with an increase of the PP content. SEM micrographs of R3P7T composites with (a) 30 wt% RWS, (b) 60 wt% RWS, (c) 30 wt% RWS and 4 wt% MAPP and R4P6T composites with (d) 30 wt% RWS. SEM micrographs of R3P7L composites with (a) 30 wt% RWS, (b) 60 wt% RWS, (c) 30 wt% RWS and 4 wt% MAPP and R4P6L composites with (d) 30 wt% RWS.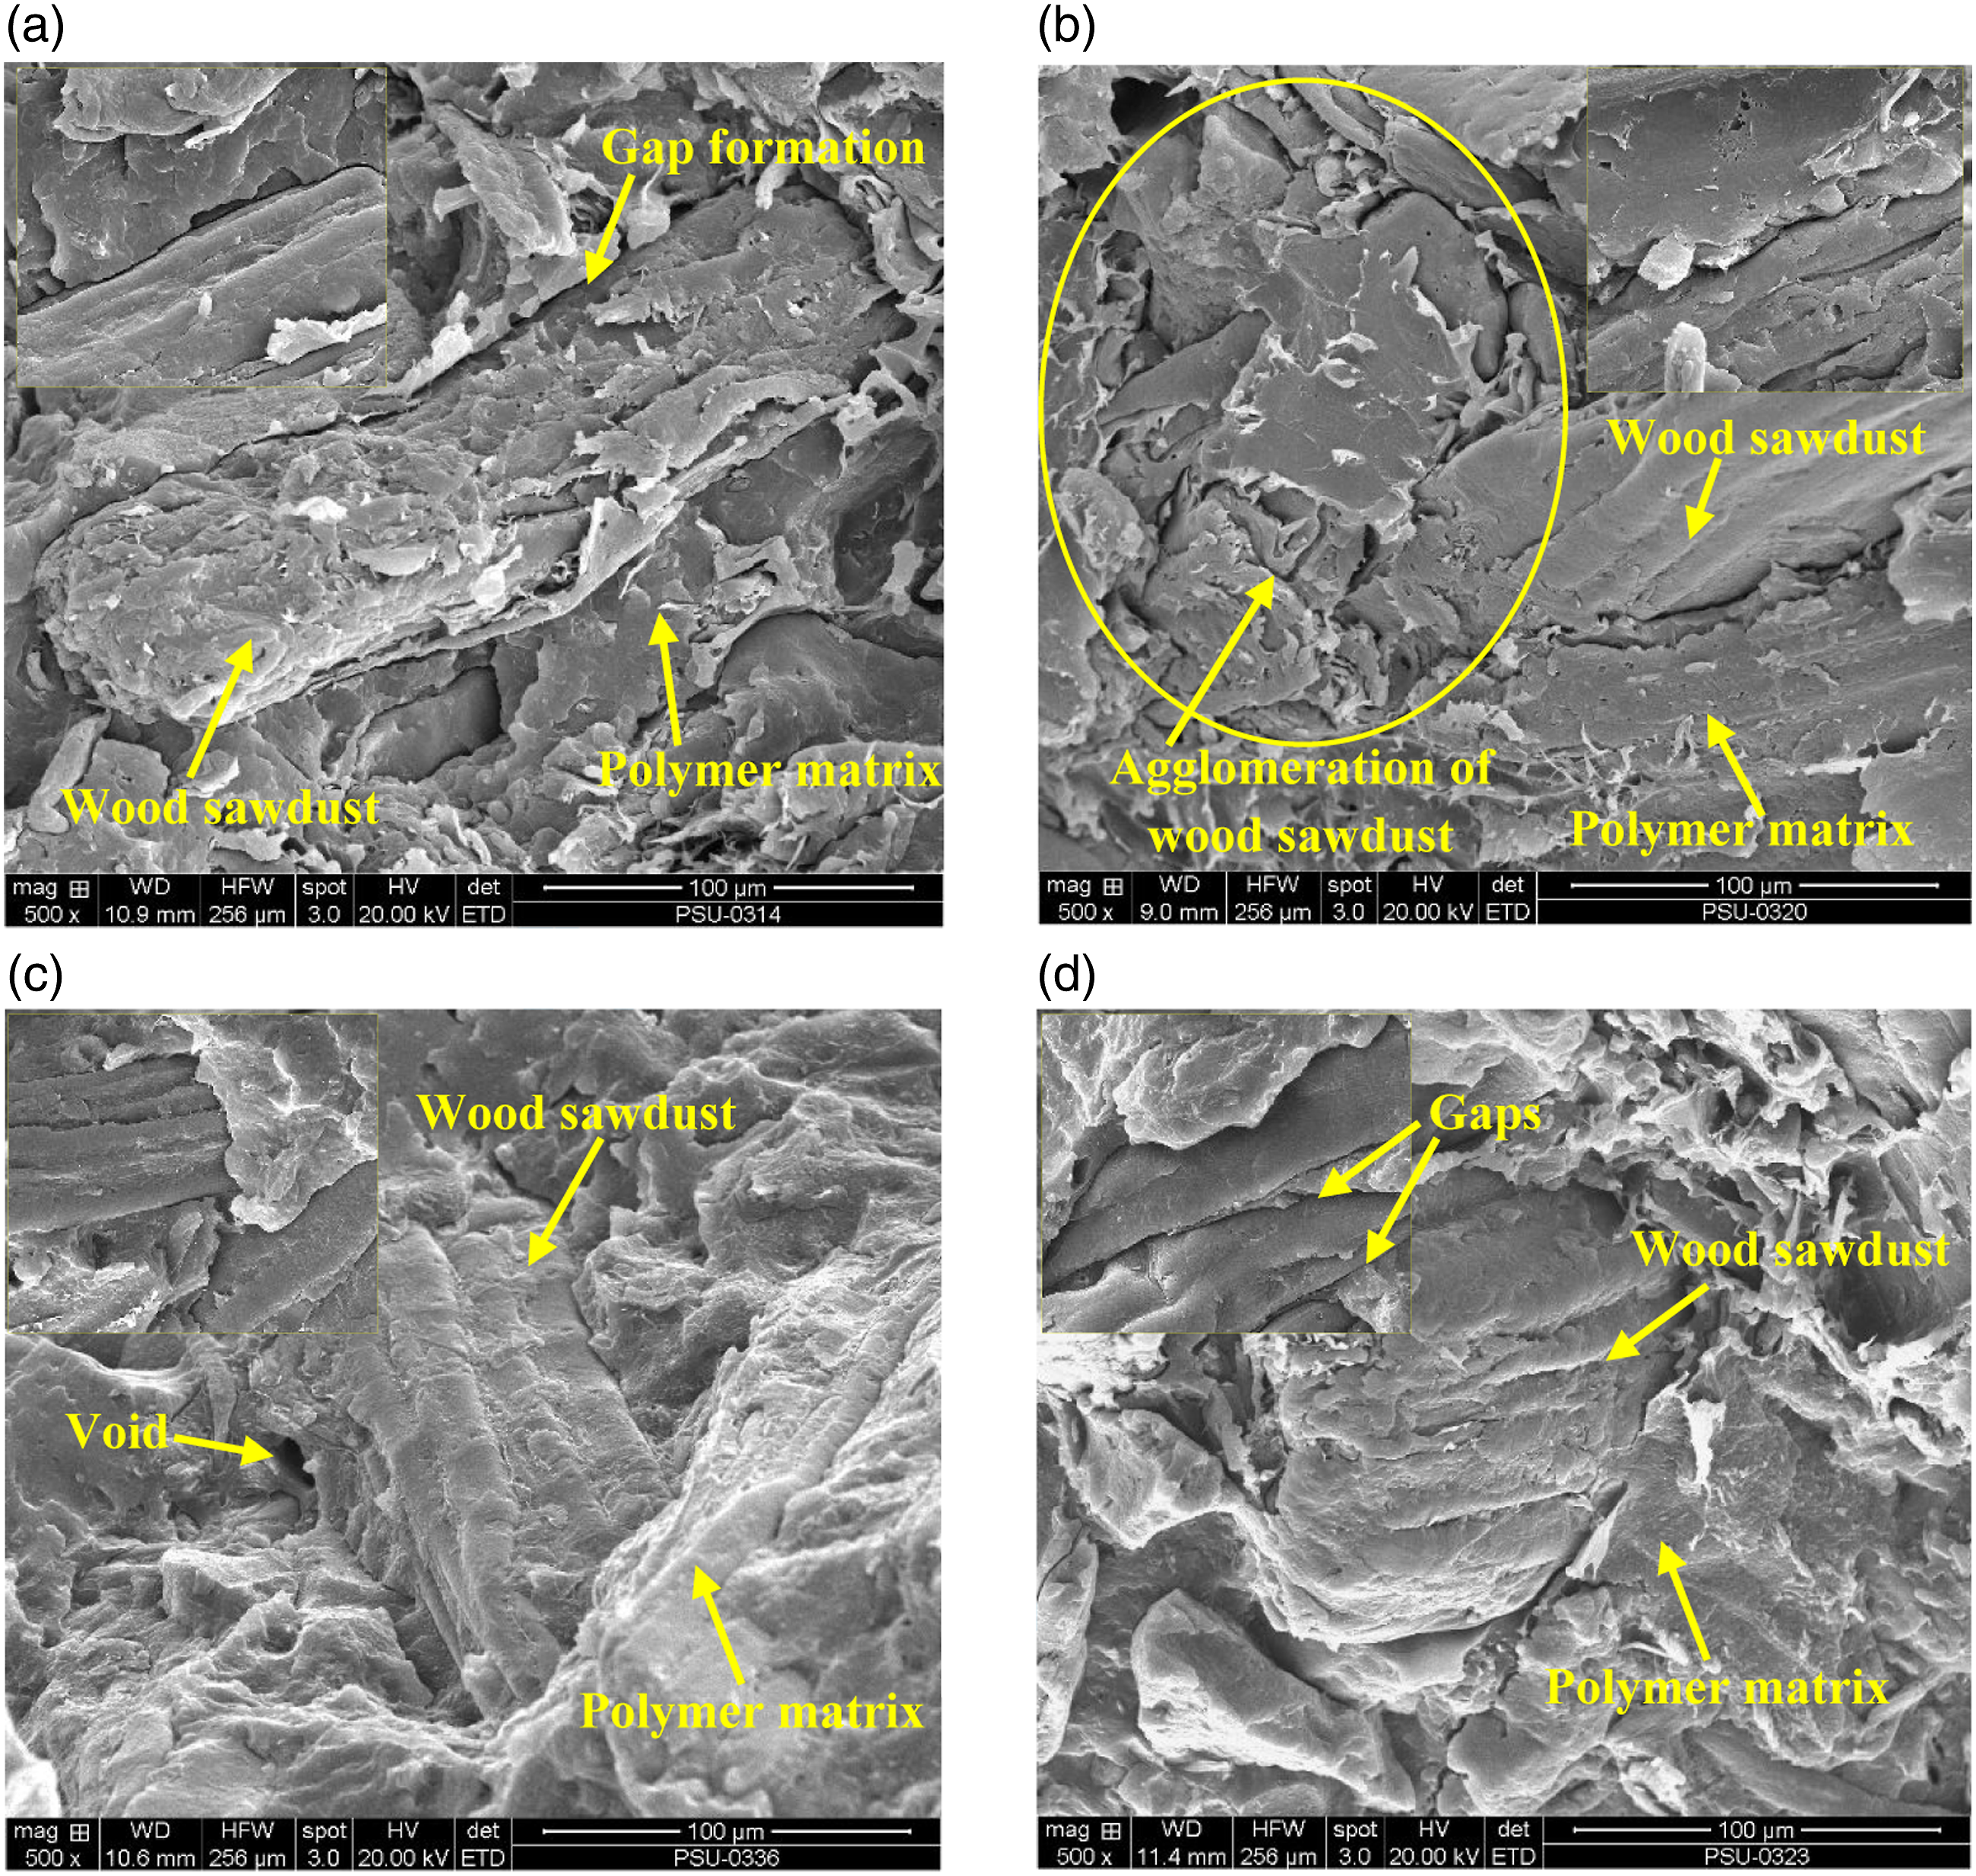
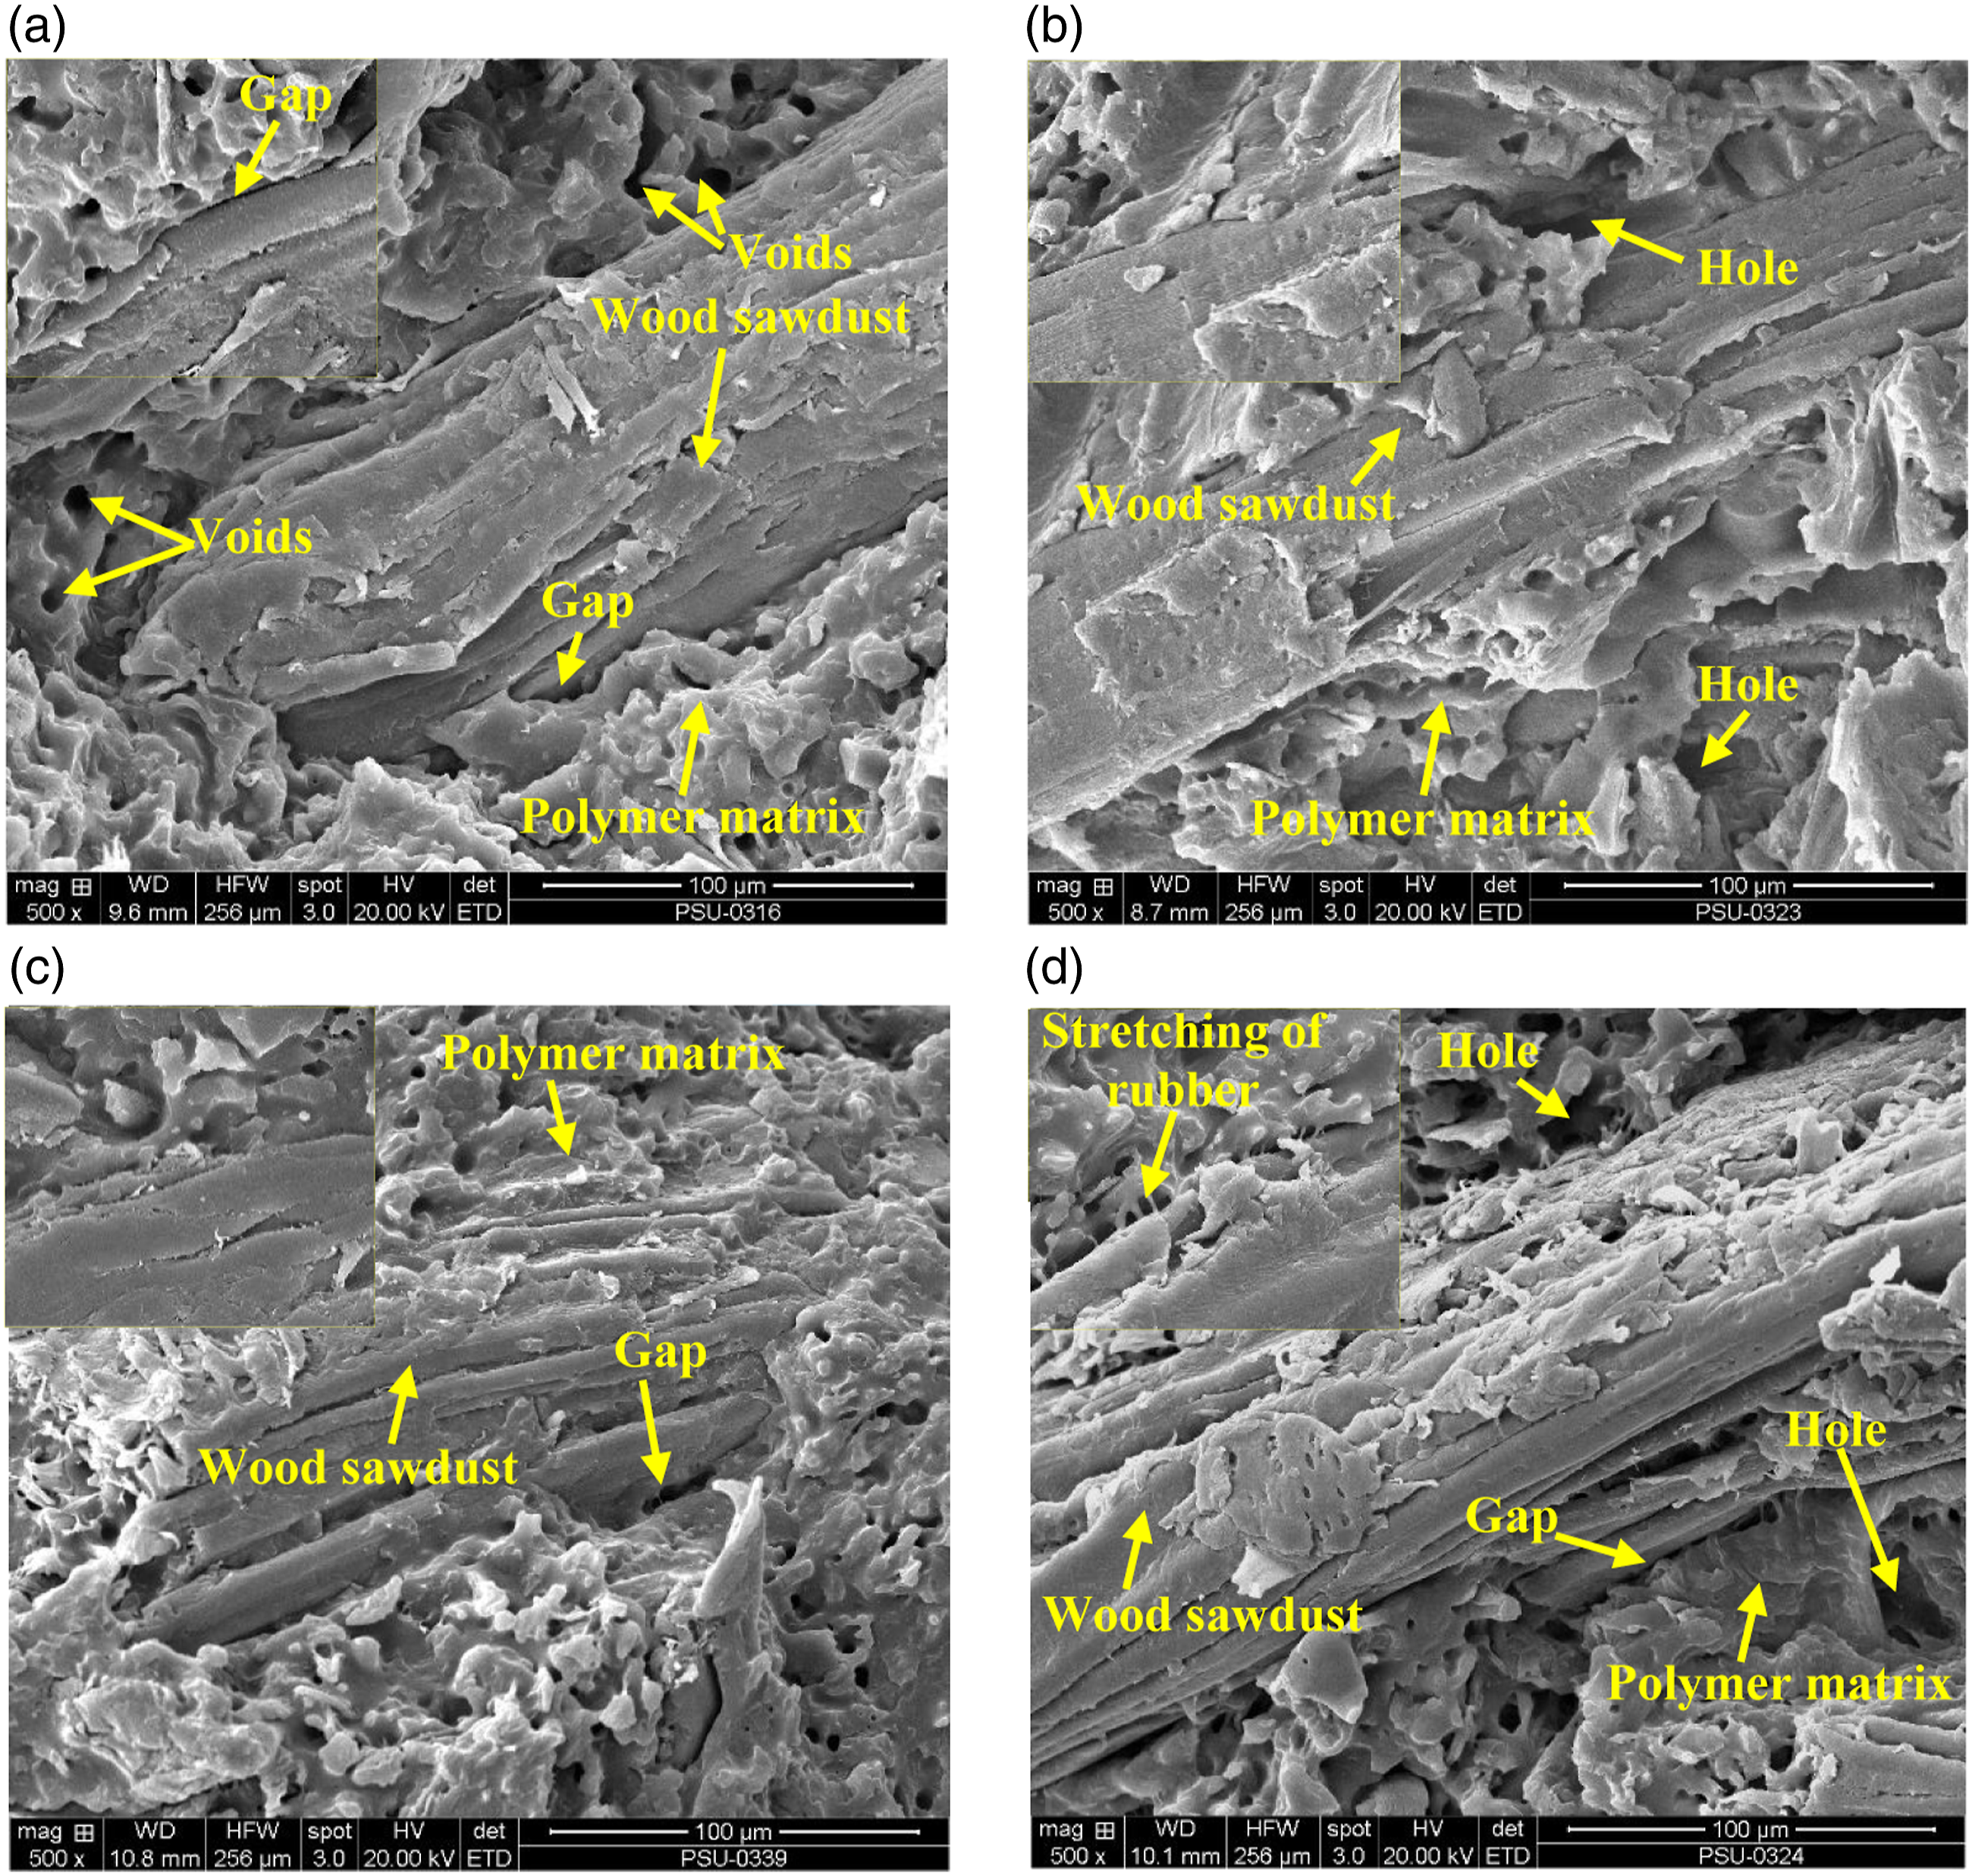
The SEM micrographs in Figures 1(a) and (c), 2(a), and 2(c) also showed the effect of the coupling agent contents for the TPE/RWS composites made from the GRT and NR, respectively. Thus, it could be seen that the addition of 4 wt% of MAPP clearly improved the interfacial bonding and compatibility between the TPE matrix and RWS when compared with the TPE/RWS composites without MAPP. This was because MAPP created the chemical bonds between the wood filler and polymer matrix. Therefore, the composites mixed with MAPP had a smoother fractured surface, stronger coupling, lower number of porosities, and better dispersion of the RWS in the TPE matrix based on the GRT and NR. These phenomena would encourage the stress transfer from the polymer matrix to the wood filler 23 resulting in the improvement of the mechanical and physical properties of the composites. Furthermore, the TPE/RWS composites made from GRT exhibited fewer voids in the composite structures and smaller gaps between the RWS and TPE matrix than the composites based on NR for the same RWS and rubber contents. Because the GRT had a crosslinked structure of the rubber phase due to the vulcanized rubber, this SEM evidence would further support the discussion of the results of the mechanical and physical properties.
Flexural properties of the TPE/RWS composites
In applications of wood-polymer composites (WPC), flexural property is one of the important characteristics in the decision-making.
24
The effects of the compositions’ content and rubber types on the MOR and MOE of the TPE/RWS composites are shown in Figure 3(a) and (b), respectively. The MOR of the composites based on the GRT and NR of both rubber ratios was steadily decreased with the increasing RWS loading. This could be attributed to poor compatibility between the wood sawdust and the polymer matrix. Most polymers have a hydrophobic nature, whereas wood fibers are hydrophilic; thus, their surfaces are naturally incompatible.
25
This weak adhesion contributed to the inefficient stress transfer leading to a decrease of the strength.
26
However, the addition of 30 wt% of RWS in the composites with the GRT/PP blend of a 30/70 ratio improved the MOR of the composites. This was probably because the optimal RWS content in the GRT/PP blend of the 30/70 ratio was about 30 wt% for the MOR. In contrast, an increment of the RWS contents in the TPE composites (both based on the GRT and NR) clearly increased the MOE. This implied that the rigidity of the TPE enhanced the increment in the percentage of the reinforcing filler. The addition of 60 wt% of RWS into the TPE composites increased the MOE by about 529.3% and 511.6% for the blend of the 30/70 ratio and about 431.2% and 178.1% for the blend of the 40/60 ratio, respectively, when compared with the TPE. Because the polymer matrix had a lower modulus or rigidity when compared to wood, an increment of the wood sawdust content in the polymer composites increased the modulus or rigidity.
27
Previous studies revealed that an increase of the modulus or rigidity caused a reduction in the elasticity or flexibility of the polymer matrix.5,28 Additionally, the TPE composites based on the GRT revealed a higher MOR and MOE than those based on NR for the same polymer to the sawdust ratio. For example, with a blend of a 30/70 ratio, the TPE composites made from the GRT with 60 wt% of RWS showed a larger MOR and MOE of about 85.2% and 85.1%, respectively, than those of the composites made from NR. One reason could be that the GRT had a higher strength and rigidity than NR due to the vulcanized rubber and blending with carbon black as a filler; thus, this would improve the load resistance of the composites. Flexural properties of TPE composites with different RWS contents and rubber types: (a) modulus of rupture and (b) modulus of elasticity.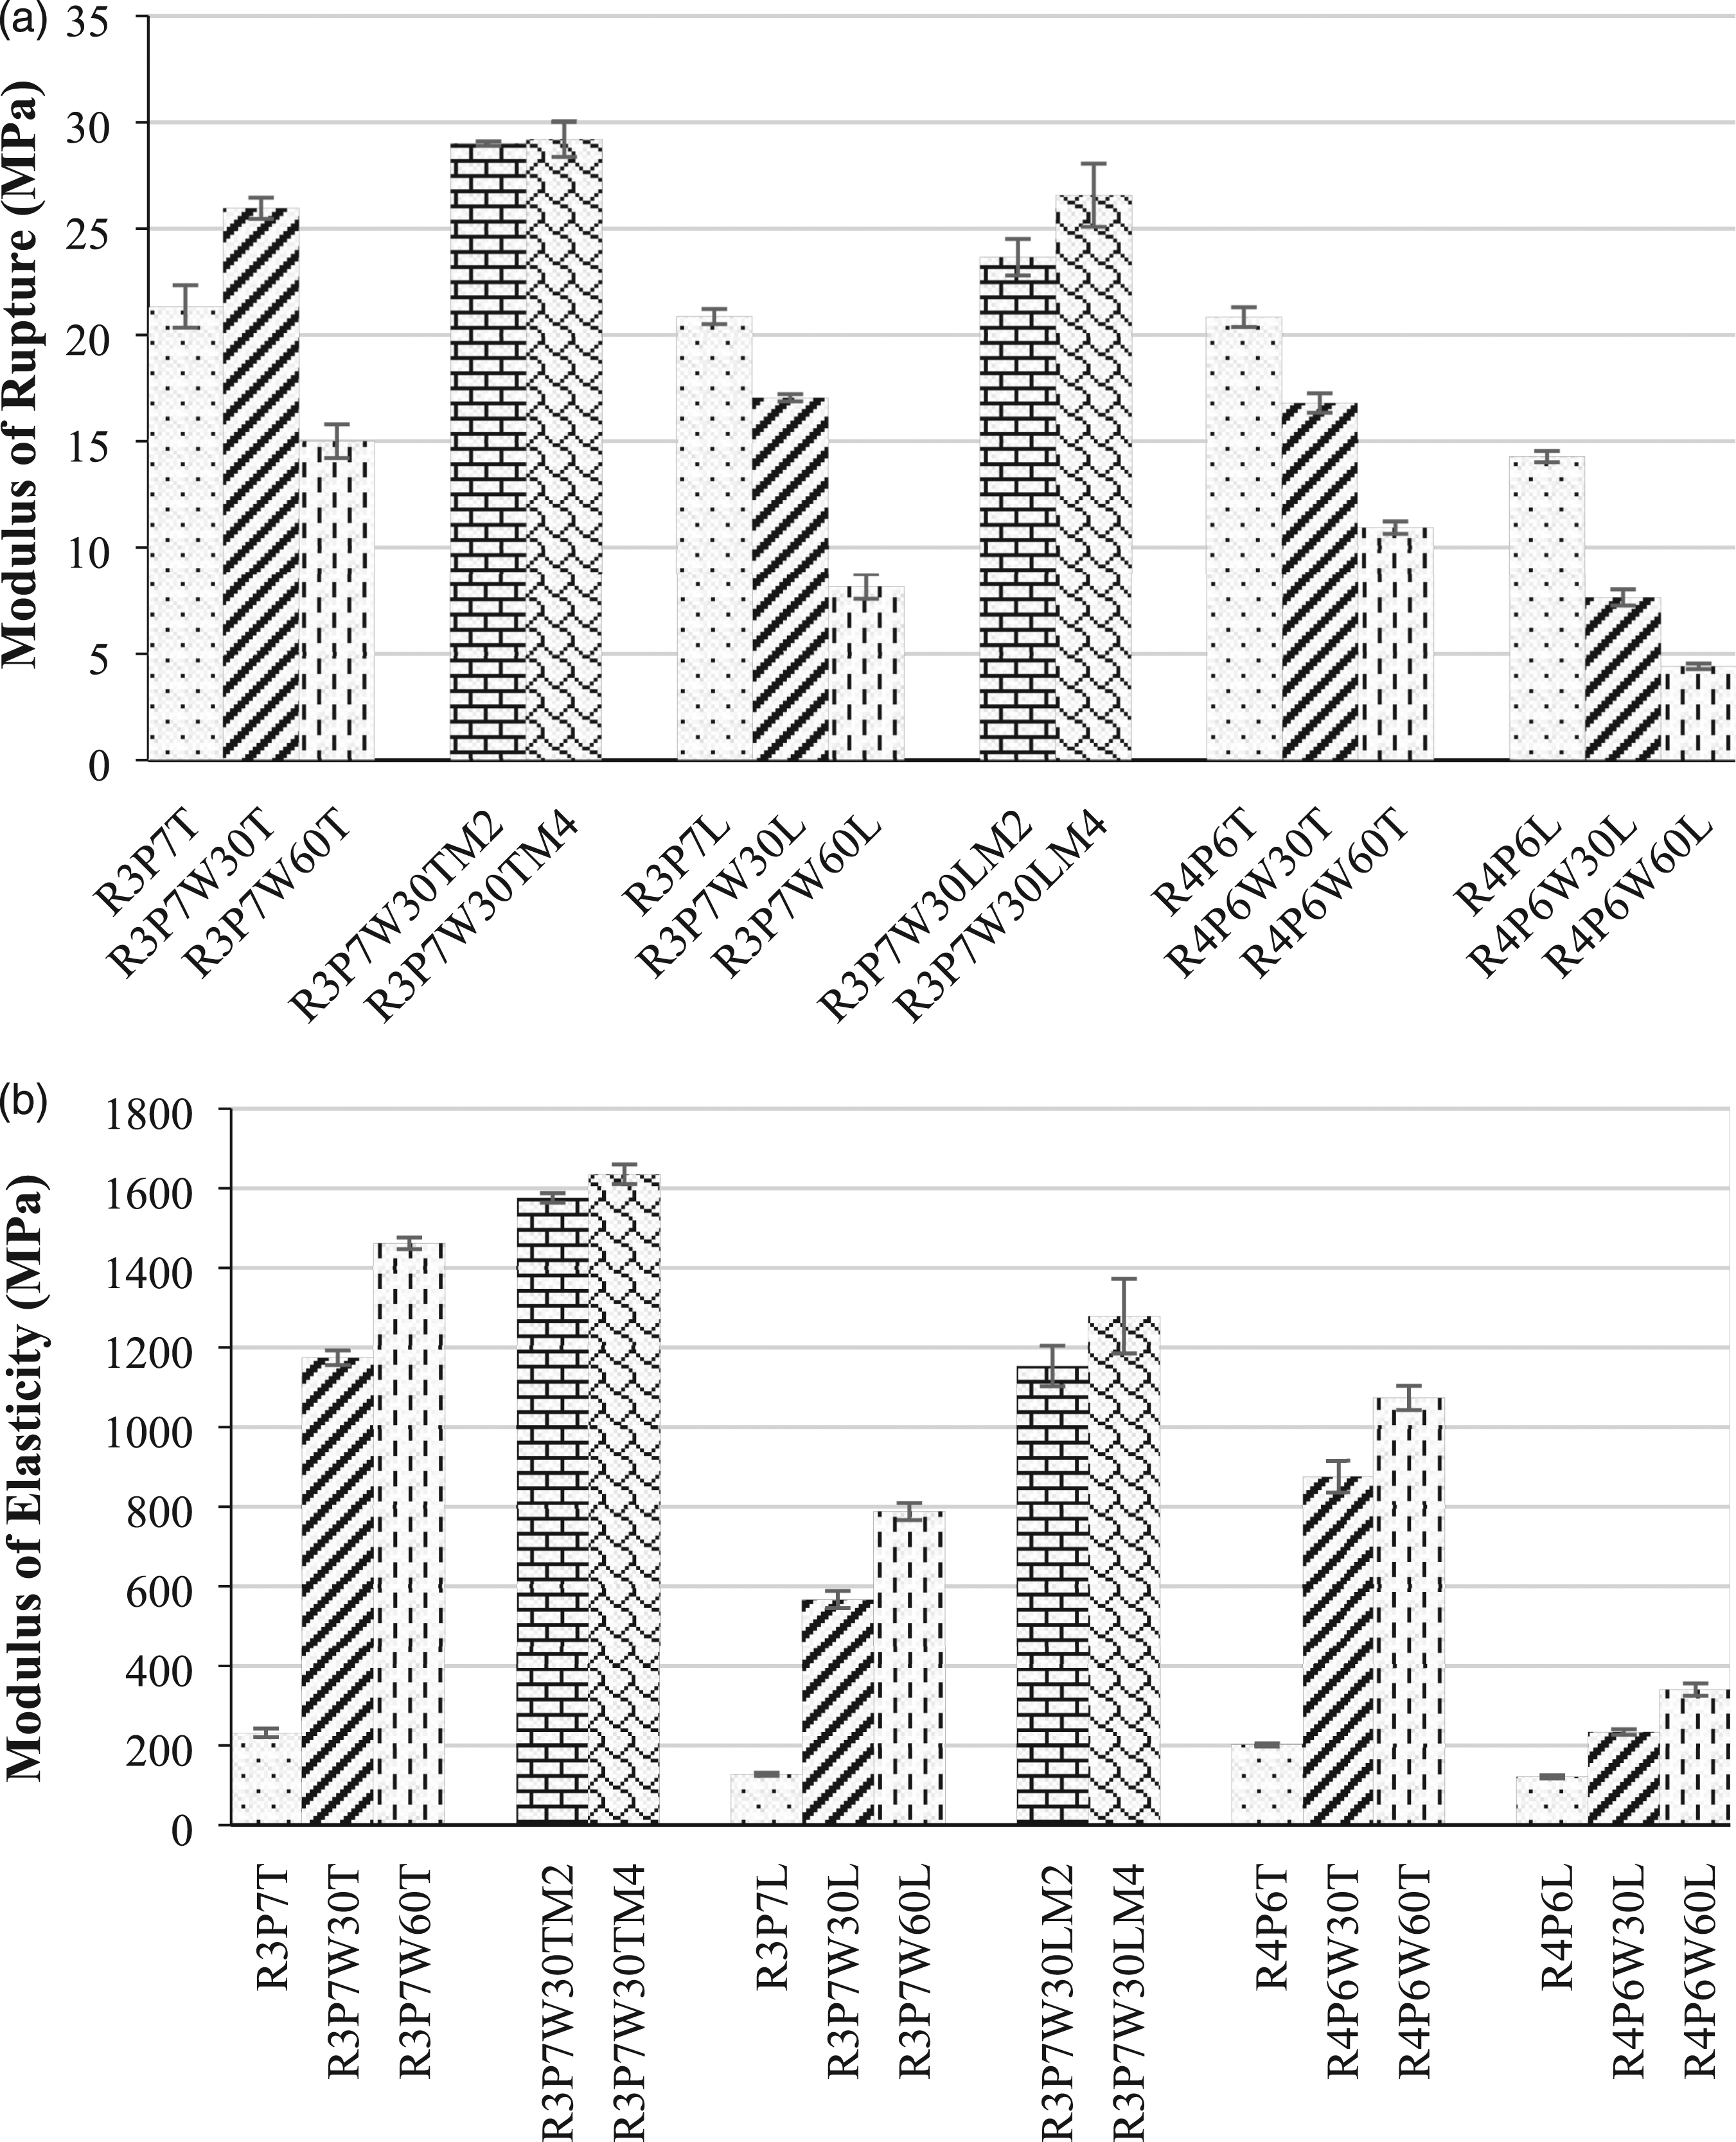
Figure 3 also displays the effect of the MAPP contents on the MOR and MOE of the TPE/RWS composites. It can be seen that the MOR and MOE of the composites based on the GRT and NR and reinforced with 30 wt% of RWS were improved with the increasing concentrations of MAPP in the range of 2–4 wt%. The MOR and MOE of the composites based on the GRT increased by about 12.7% and 39.1%, respectively, when adding 4 wt% of MAPP. This improvement was attributed to the improved adhesion between the wood sawdust and polymer matrix, as well as improved stress transfer from the matrix through MAPP to the sawdust. The maleic anhydride also increased the polarity that reacted with the hydroxyl group on the wood’s surface, and thus promoted the adhesion in the RWS.29,30 For the same RWS content and rubber type, the TPE/RWS composites with blends of a 30/70 ratio clearly showed a larger MOR and MOE than those blends with a 40/60 ratio. The polypropylene was stronger and more rigid than both the GRT and NR; thus, the TPE composites blended with more plastic content gave higher strength and modulus. 23
The maximum flexural strain (MFS) of the TPE composites with different RWS contents and rubber types is illustrated in Figure 4 The MFS was greatly decreased with the increasing addition of the RWS in the TPE matrix. For the blend with a 30/70 ratio, the addition of 60 wt% of RWS into the TPE composites based on the GRT and NR reduced the MFS by about 81.3% and 62.8%, respectively. Similar results were found by Munusamy et al.
18
who reported that the elongation at the break was reduced owing to the demobilized polymeric chain on the RWS particles, which decreased the flexibility of the chain. As such, it was noticed that a decrease in the MFS of the composites based on NR was less than that based on the GRT. The addition of wood sawdust significantly decreased the ductility of the polymers; hence, the TPE/RWS composites became more brittle and their deformability was reduced.31,32 Kajaks et al.
32
also stated that wood dust strongly affected the mobility of the polymer matrix macromolecules that was restricted on the wood flour surfaces. Likewise, the TPE composites based on NR clearly exhibited a higher MFS than those based on the GRT. Because NR had a larger elongation ability than the vulcanized rubber tire, this resulted in less reduction of the strain in the composites. Maximum flexural strain of TPE composites with different RWS contents and rubber types.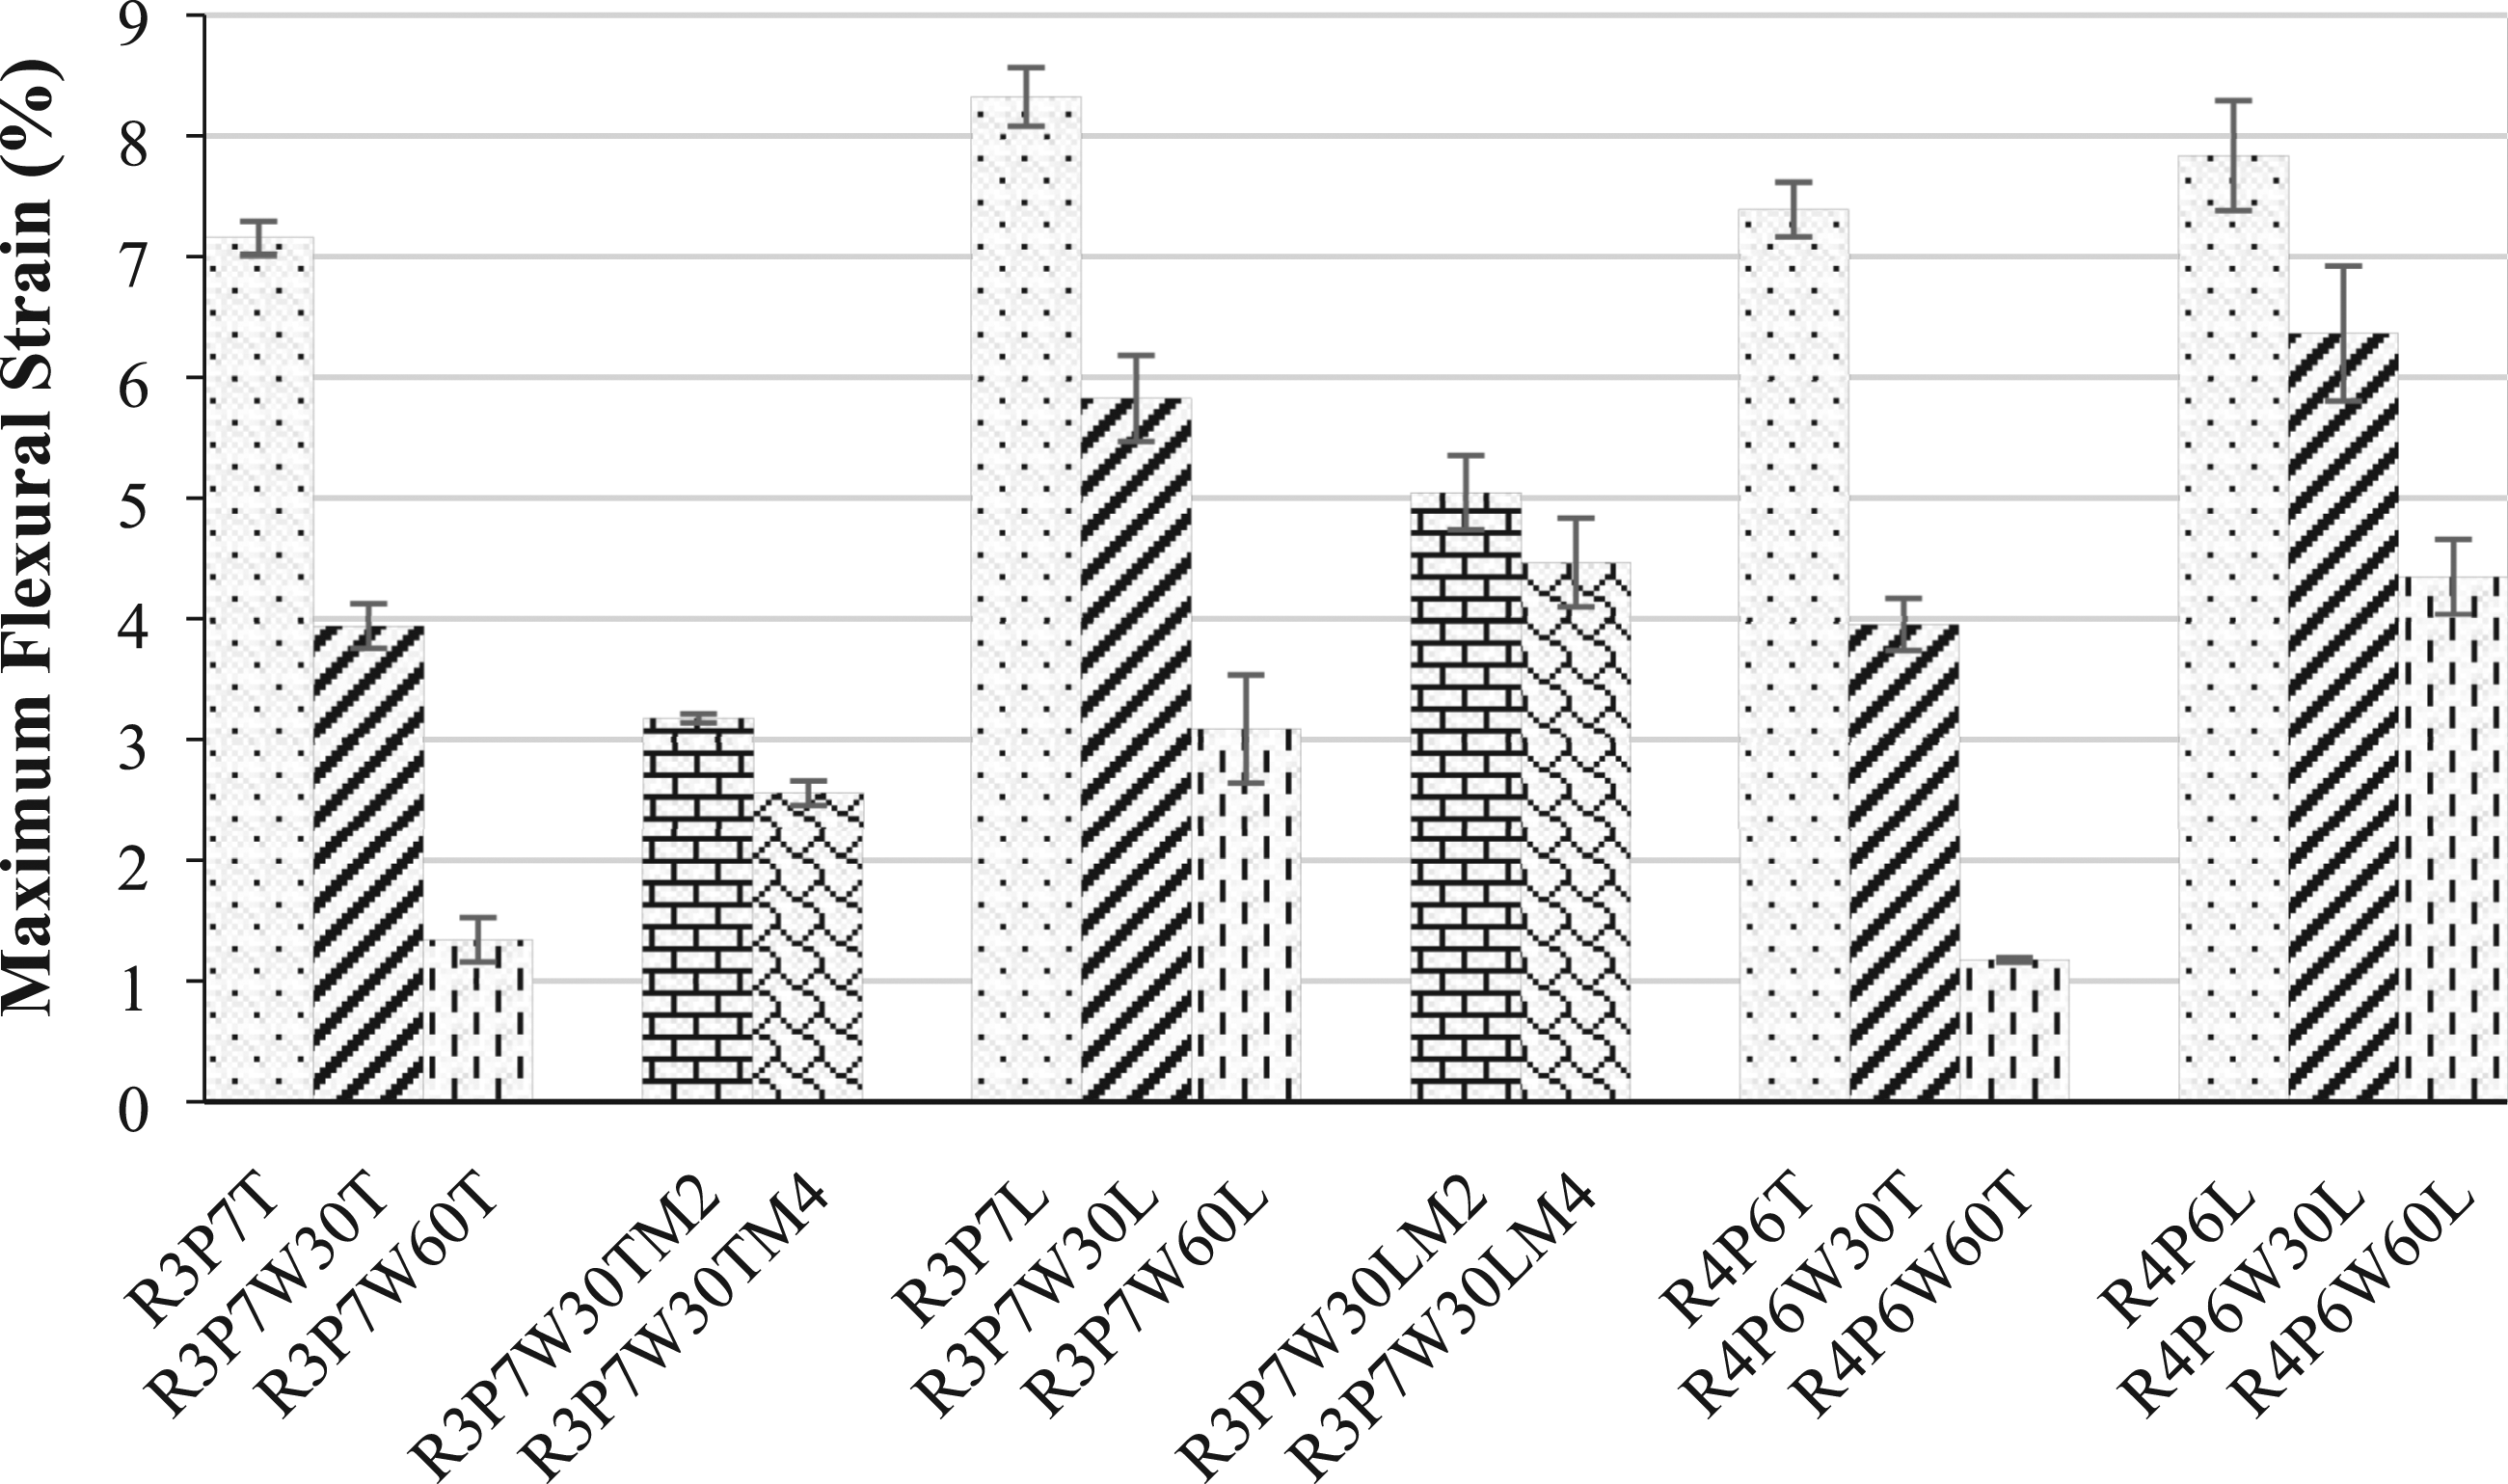
Non-linear stress–strain behavior of the TPE/RWS composites under flexural loading is also displayed in Figure 5. The composites based on the GRT and NR become stiffer with the increasing RWS loading, which the responding strain at failure reduces, and it has relatively high initial slopes. This is because the ductility of the composites reduced, and the weak interfacial adhesion between TPE matrix and sawdust led to the embrittlement of the composites. Further, the TPE composites based on the NR showed higher ductility but lower slopes than those based on GRT. This means that the composites based on the GRT are more brittleness and stiffness. Stress-strain curves of TPE composites with different RWS contents and rubber types.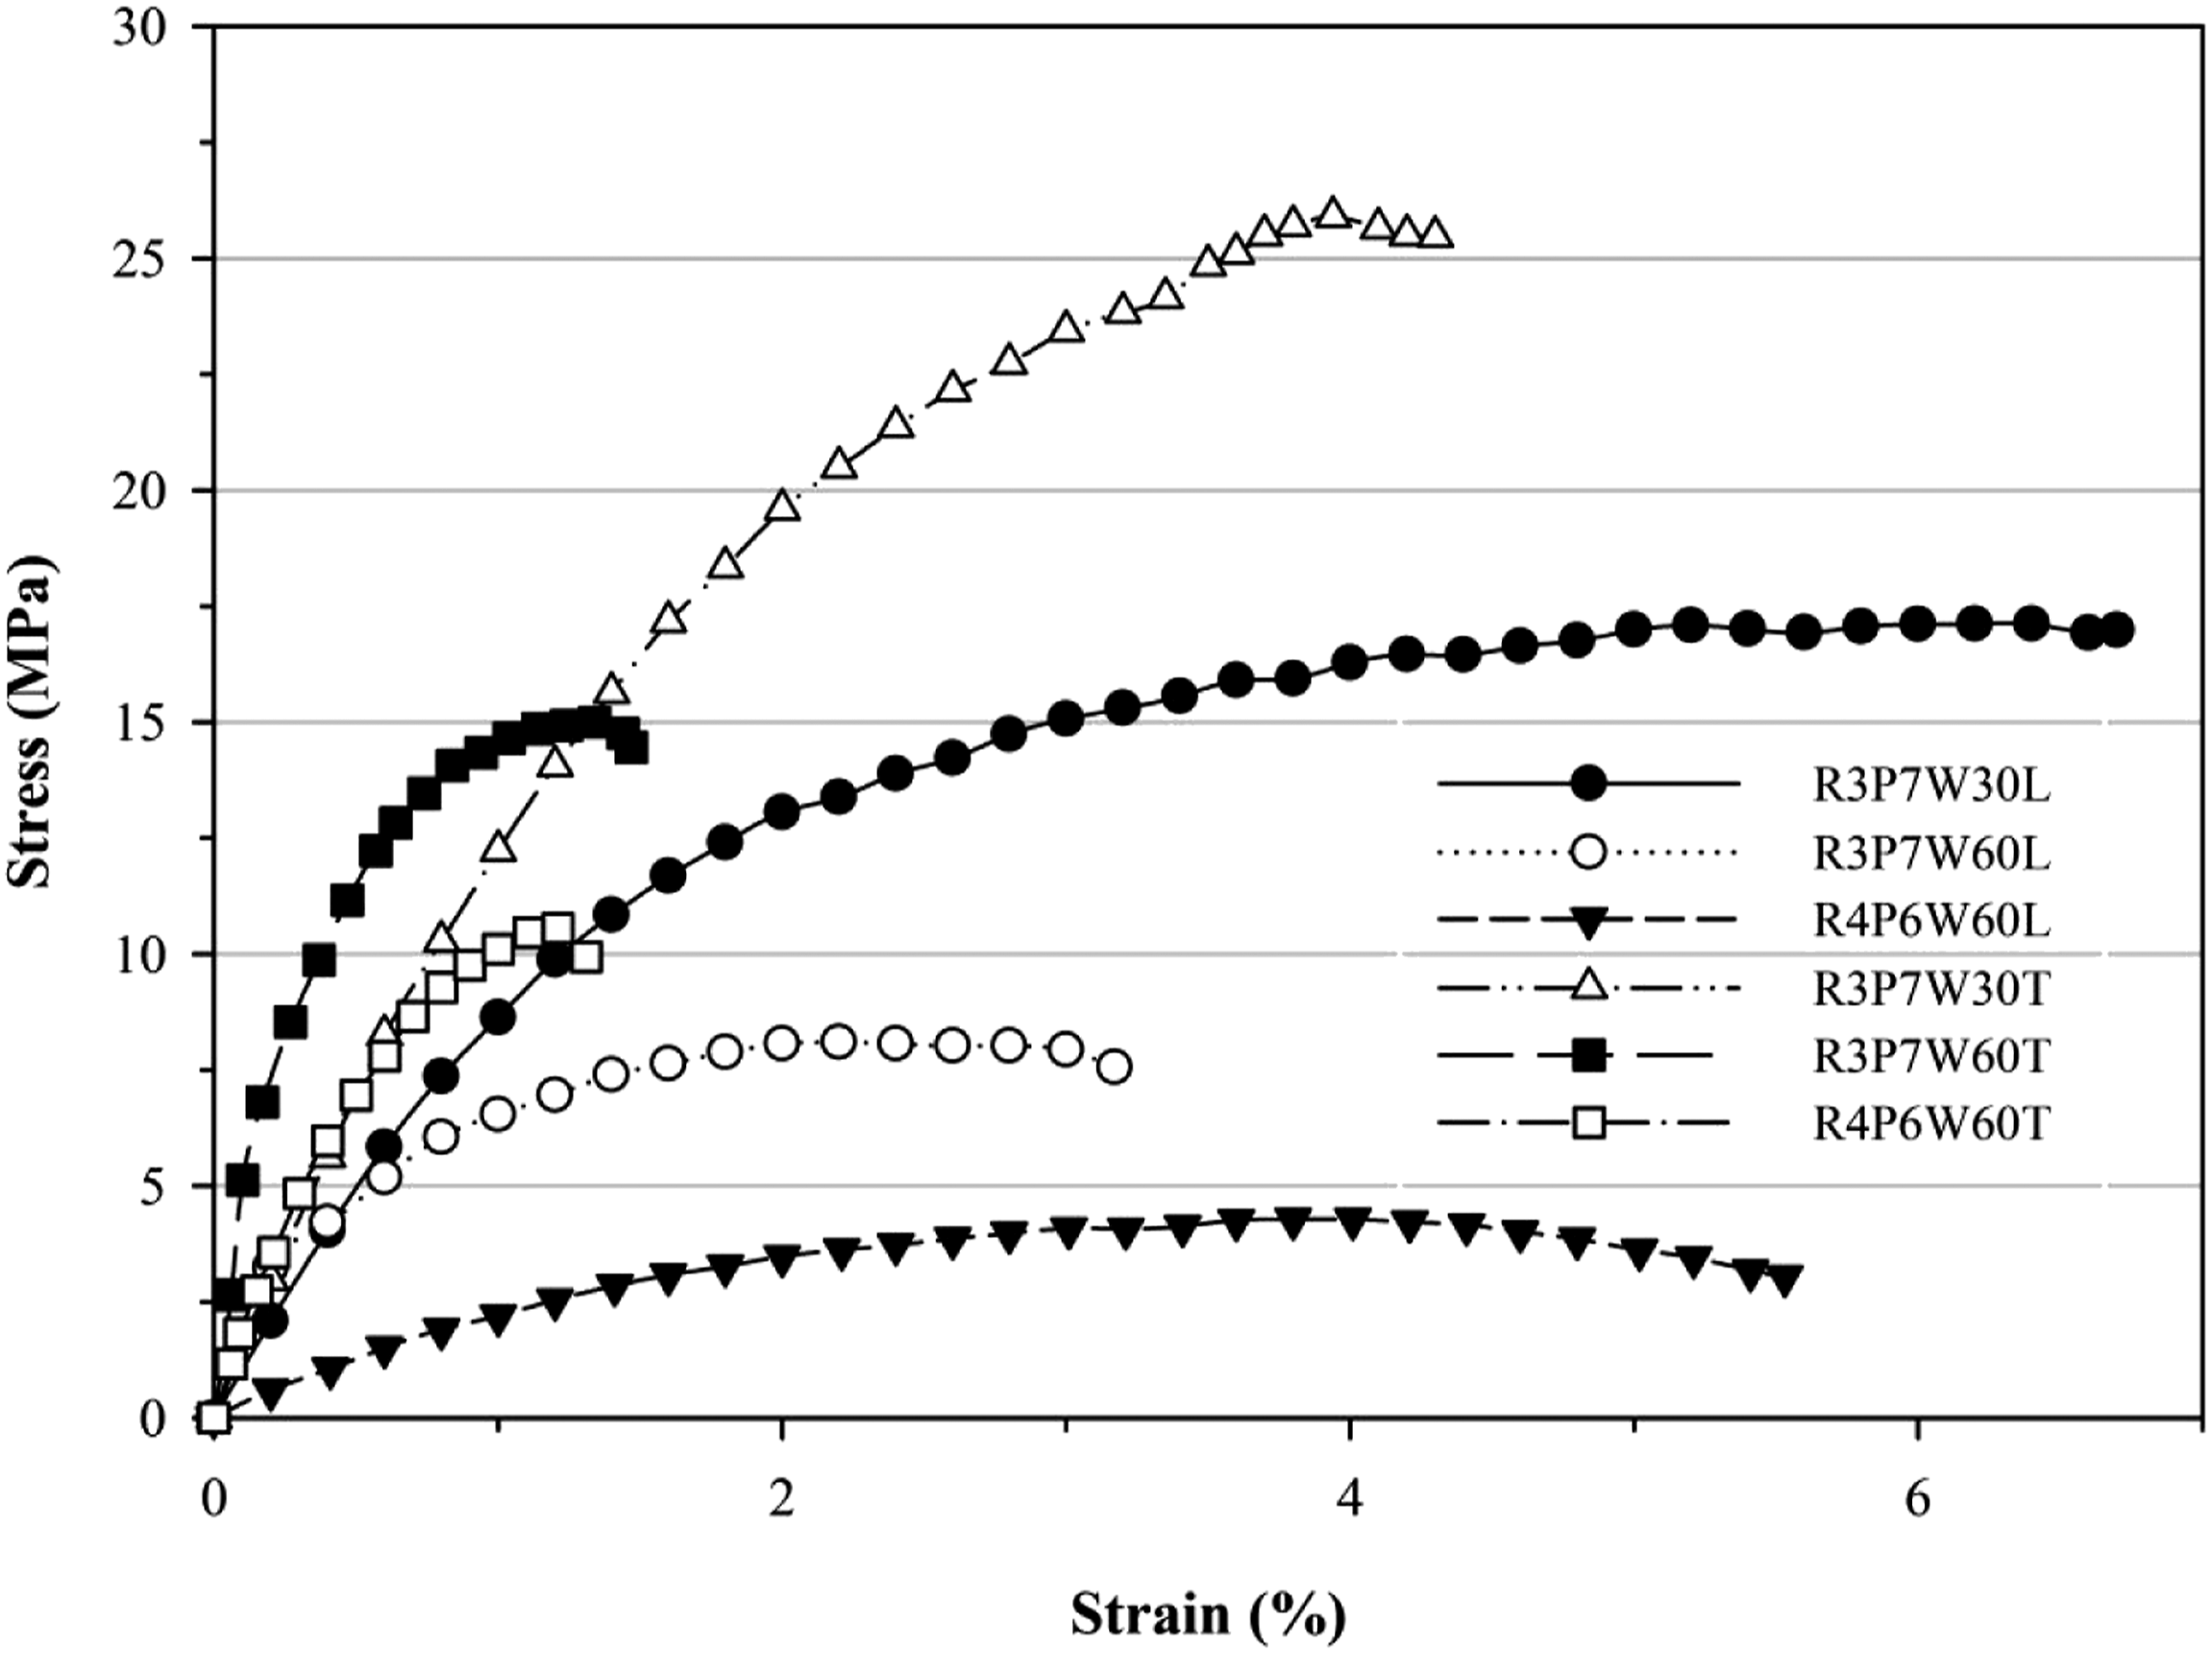
Compressive properties of the TPE/RWS composites
The compressive property is often used to design products from WPC, particularly the application of compressive structural loads.
33
Figure 6(a) and (b) show the effects of the RWS content and rubber type on the compressive strength (CS) and compressive modulus (CM), respectively, of the composites from the rubber/PP blends with 30/70 and 40/60 ratios. The CS of the TPE composites based on the GRT and NR was reduced with an increase of the RWS content in the range of 30–60 wt%. For example, with the blend of a 30/70 ratio, the TPE composites based on the GRT and NR reinforced with 30 wt% of RWS gave a higher CS of about 66.6% and 105.3%, respectively, than that of the composites with a 60 wt% of RWS. These results could be proved by considering the SEM images in Figures 1 and 2 (Figures 1a and 2a for the 30 wt% of RWS, and Figures 1b and 2b for the 60 wt% of RWS). The TPE composites containing 30 wt% of RWS had fewer voids, less agglomerations, and smaller gaps between the polymer matrix and the wood sawdust. These voids, agglomerations, and gaps acted as points of high stress concentration, which decreased the stress transfer efficiency from the polymer chains to the reinforcing filler.
18
Therefore, the stress transfer mechanisms were contributed by these low wood sawdust loadings. However, the CM of the TPE/RWS composites increased greatly with the RWS content, which revealed a similar trend to the MOE. The dispersion of stiff wood sawdust encouraged an increment in the modulus of the TPE composites when compared to the neat TPE. For the blend of the 30/70 ratio, the CM of the TPE composites based on the GRT and NR with a 60 wt% of RWS increased by about 56.5% and 122.5%, respectively, when compared with the TPE. This finding was in agreement with García et al.,
34
who reported that the increment of the compressive modulus attributed to the wood fiber being more rigid than the neat polymers. In fact, the wood fiber had the tensile modulus of about 40–60 GPa,
34
while the average tensile modulus of polypropylene (Table 1) was 0.261 GPa, respectively. Therefore, the composites with a higher wood fiber loading had a higher modulus. Moreover, the CS and CM of the TPE composites based on the GRT were higher when compared with that of the composites based on NR. In the blend of the 60/40 ratio, the TPE composites based on the GRT with a 60 wt% of RWS exhibited more CS and CM by about 69.1% and 25.7%, respectively. This was because the rubber tire had higher strength and rigidity than NR (Table 1). Thus, the TPE/RWS composites based on the GRT had a larger load for the same failure. Compressive properties of TPE composites with different RWS contents and rubber types: (a) compressive strength and (b) compressive modulus.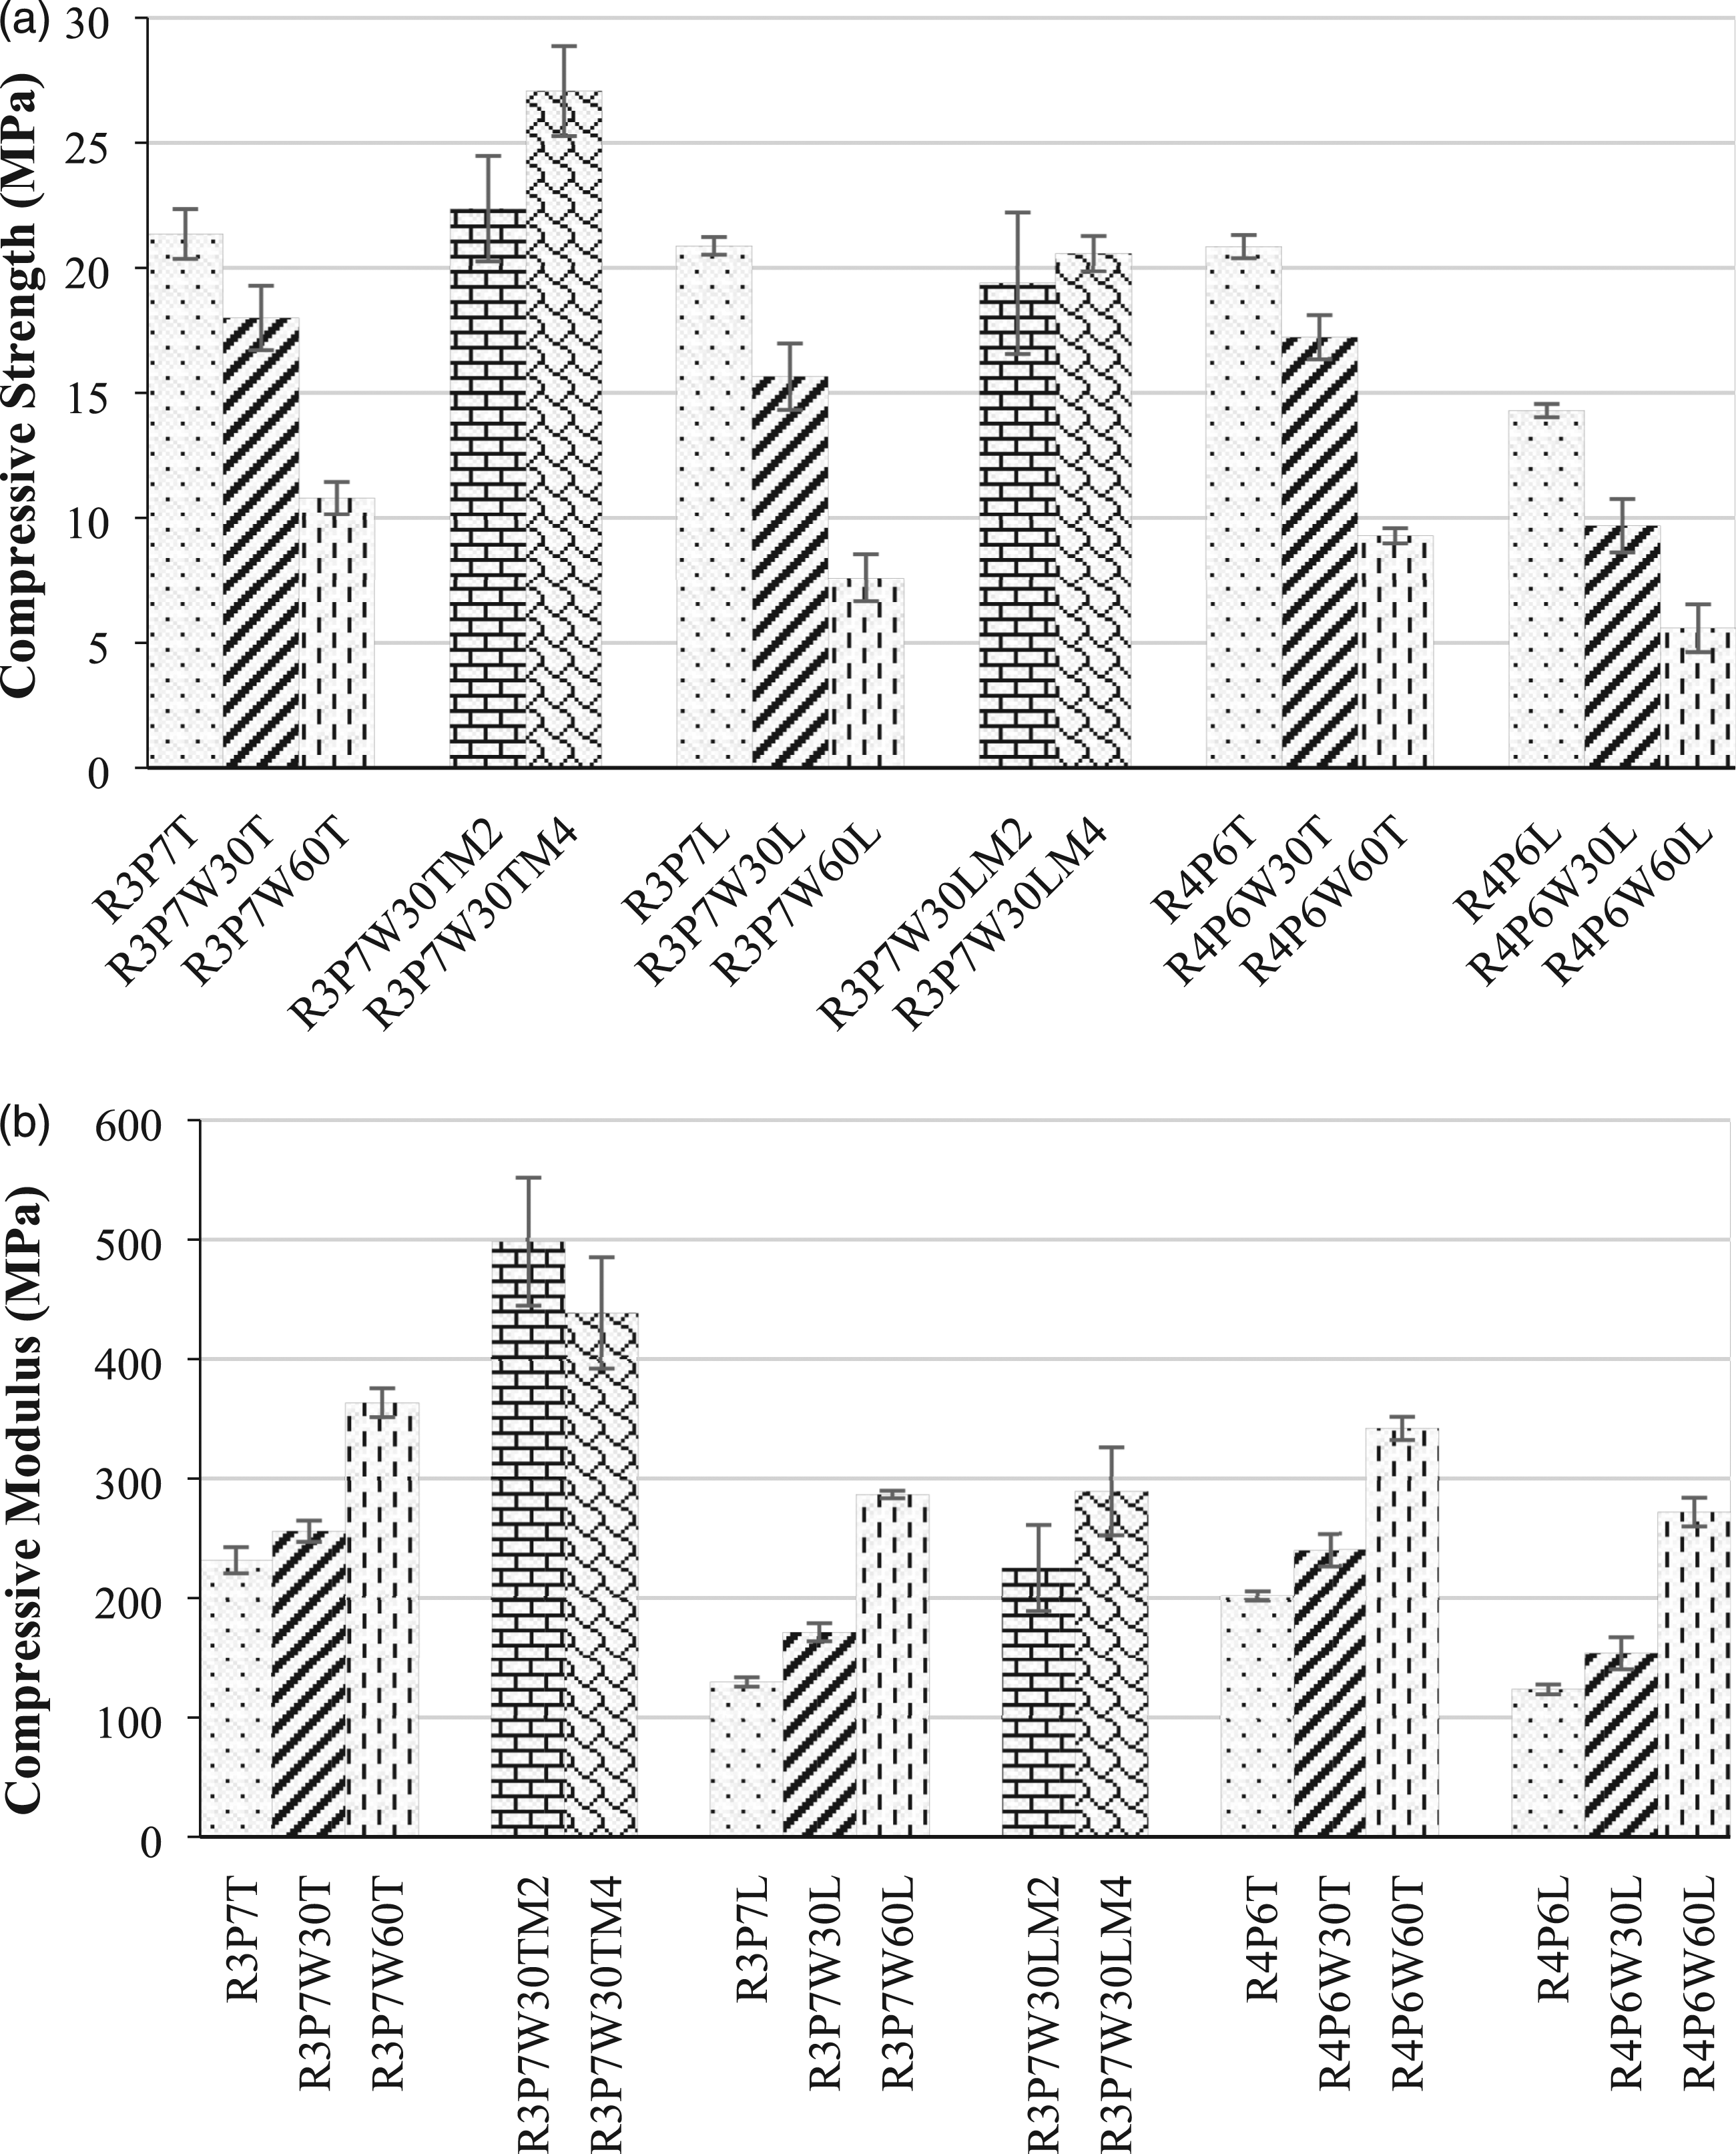
Figure 6 also illustrates the effect of the rubber and MAPP contents on the CS and CM of the TPE/RWS composites. The result indicated that the TPE/RWS composites with a larger PP ratio yielded higher values of CS and CM. It was observed that, for the 60 wt% of RWS, the TPE/RWS composites containing the GRT/PP blend of a 30/70 ratio showed more CS and CM by about 16.1% and 6.14%, respectively, when compared with the composites blended with a 40/60 ratio. Furthermore, the addition of 2–4 wt% of MAPP in the TPE/RWS composites based on both the GRT and NR evidently improved the CS and CM. The addition of 4 wt% of MAPP also increased the CS and CM by about 50.0% and 71.1%, respectively, for the composites based on the GRT and reinforced 30 wt% of RWS, compared with the composites without the addition of MAPP. This was because of the formation of the ester bonds between the anhydride groups of the MAPP and the hydroxyl groups of the wood fiber, as well as the tail of MAPP that was entangled with the TPE resulting in the improvement of the interfacial bonding between the hydrophobic TPE and hydrophilic wood. 35 The earlier SEM images also proved that the addition of MAPP in the composites improved the compatibility between the TPE matrix and the wood sawdust resulting in an increase of the mechanical properties.
Hardness of the TPE/RWS composites
Figure 7 presents the hardness values of the TPE/RWS composites with the different compositions’ content and rubber types. The hardness value of the composites, both based on the GRT and NR, consistently improved with an increase of the RWS content, which demonstrated the formation of more rigid TPE composites because of the addition of the rigid reinforcement materials into the polymer matrix.
36
For example, with the blend of the 30/70 ratio, the hardness values of the TPE composites based on the GRT and NR enhanced by about 11.1% and 8.5%, respectively, when adding 60 wt% of RWS. The morphological surfaces in the previous SEM images indicated that the number of visible fillers on the scanned surface enhanced the increase of the RWS content. As wood sawdust is naturally rigid, this resulted in an increment in the surface hardness of the polymer composites. Likewise, the TPE/RWS composites made from the GRT gave a larger hardness value than those composites made from NR. With the addition of 60 wt% of RWS, the composites based on the GRT yielded a higher hardness value by about 8.3% and 15% for the blends of the 30/70 ratio and 40/60 ratio, respectively, than that based on NR. This was caused by the fact that the GRT had a higher hardness than the weak NR (Table 1) owing to its vulcanization process, and adding the GRT reduced the flexibility (considered from the MFS in Figure 4) leading to more rigid composites. Hardness of TPE composites with different RWS contents and rubber types.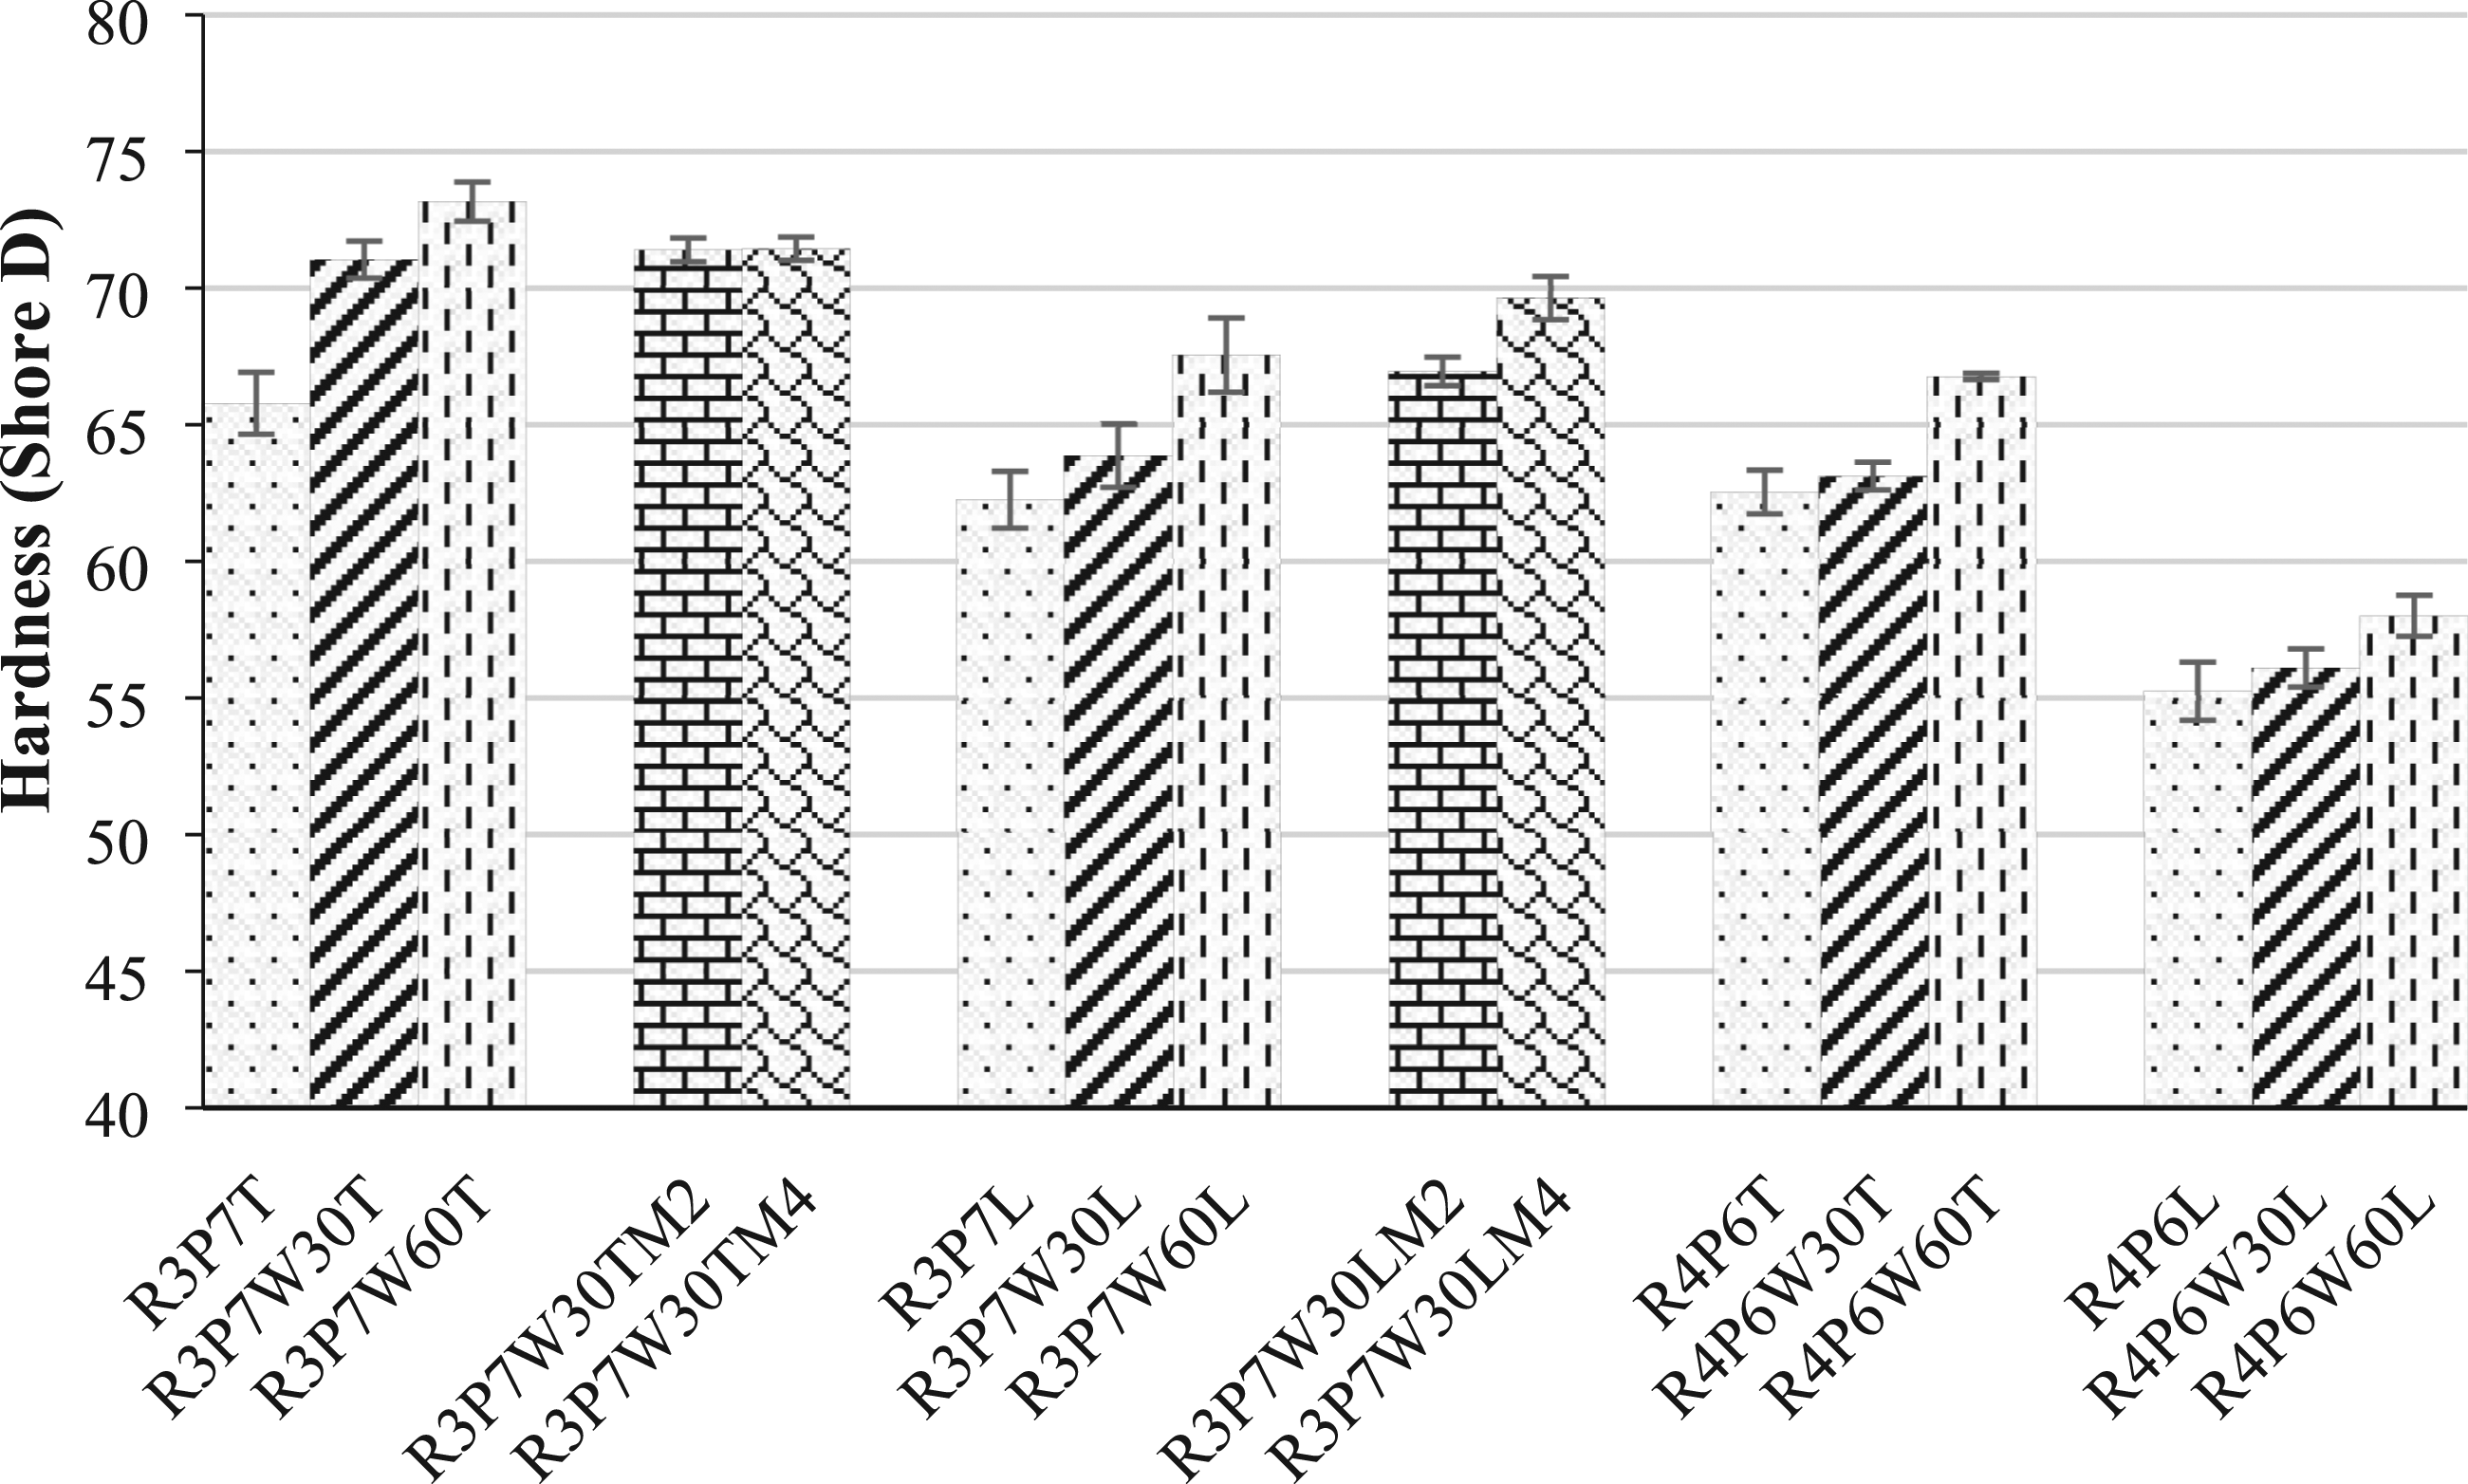
Moreover, the composites produced from lower rubber content seemed to have a much higher hardness value. It was observed that for the addition of 60 wt% of RWS, the composites based on the GRT and NR with a blend of a 30/70 ratio exhibited a higher hardness value by about 9.6% and 16.4%, respectively, when compared with the composites with a blend of a 40/60 ratio. In fact, the pure PP had a higher hardness value than both the GRT and NR (Table 1); thus, the increasing addition of the rubbers resulted in a decrease in the hardness of the TPE composites but led to larger flexibility. Furthermore, the hardness value of the TPE composites containing 30 wt% of RWS was improved with the additions of 2 wt% and 4 wt% of MAPP, respectively, where the hardness rose with the increase of the MAPP loadings. The hardness of the composites based on the GRT and NR increased by about 0.99% and 9.39%, respectively, when mixed with 4 wt% of MAPP. The obtained result indicated that the presence of MAPP increased the interaction between the wood sawdust and TPE matrix resulting in an improvement of the hardness values. Edoziuno et al. 37 also stated that the increased hardness of the composites was influenced by the stronger interfacial bonding between the filler and matrix, as well as homogeneous dispersion of the particulate reinforcements.
Water absorption of the TPE/RWS composites
Water absorption (WA) is an important property for the WPC that would need to be measured due to their high sensitivity to water. The TPE/RWS composites were monitored by full water immersion by providing the percentage of WA and thickness swelling (TS) (Figure 8(a) and (b)). It was found that the WA and TS of the TPE/RWS composites displayed a similar trend. Both the WA and TS of the composites steadily rose with the increasing RWS content from 30 to 60 wt%. Due to the wood’s hydrophilic nature, the amount of absorption and swelling increased. With a blend of a 30/70 ratio, the TPE composites based on the GRT with a 60 wt% of RWS yielded a higher WA and TS by about 272.7% and 489.1%, respectively, than that of the composites with a 30 wt% of RWS. The increasing addition of RWS in the TPE composites caused an inferior interaction between the wood sawdust and polymer matrix resulting in a large number of voids and poor interfacial adhesion as shown in the SEM images, thus enabling more water to accumulate in the gaps; consequently, the composite weight increased.
38
In addition, the TPE composites with blend ratios of larger rubber content gave a higher WA and TS for the same RWS content and rubber type. The GRT/PP blend and NR/PP blend of a 40/60 ratio reinforced with 30 wt% of RWS revealed more WA by about 51.1% and 144%, respectively, as well as more TS by about 123.9% and 97.4%, respectively, than that of the 30/70 ratio. In general, the increasing WA in the WPC could be attributed to the capillary transport, diffusion, and permeability of the water molecules in micro cracks between the polymer chains formed during the processing.39–41 Ashori and Sheshmani
42
also mentioned that the distribution capability of the natural fibers affected the WA and TS of the WPC. Physical properties of TPE composites with different RWS contents and rubber types: (a) water absorption and (b) thickness swelling.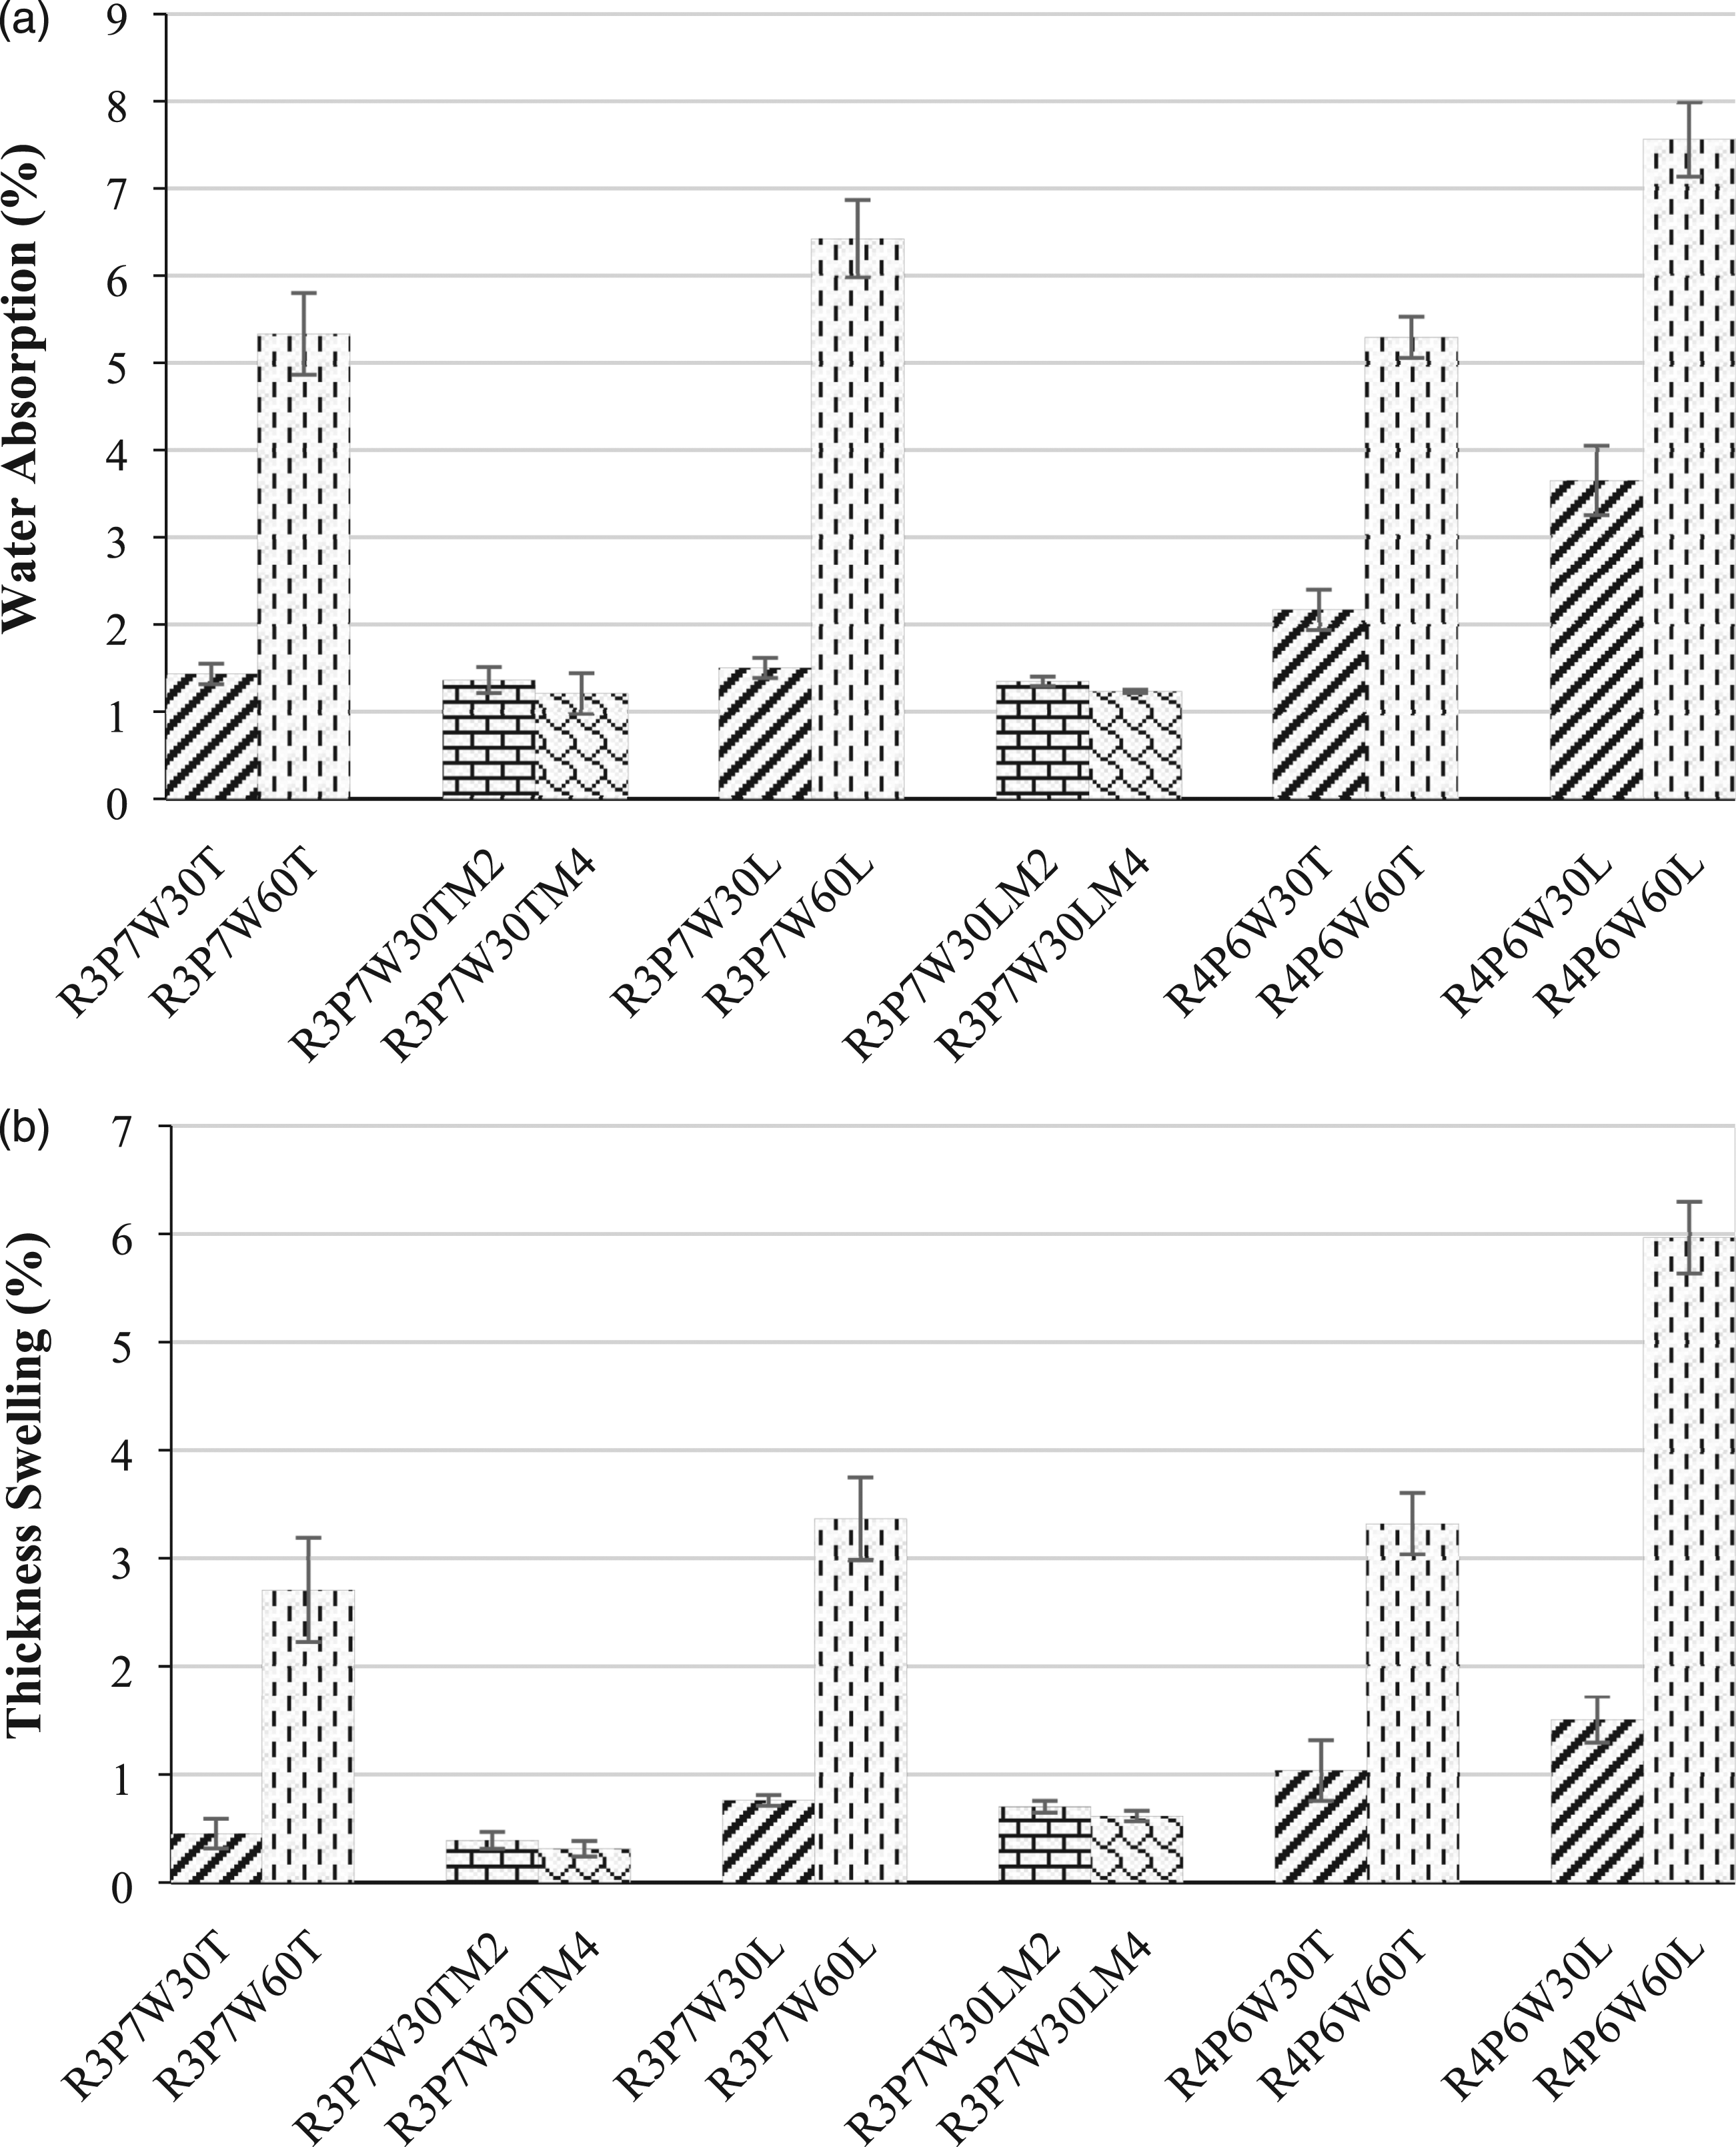
The effect of the rubber types on the WA and TS of the composites is also exhibited in Figure 8. As can be seen, the TPE/RWS composites based on the GRT had lower WA and TS than the composites based on NR. With the blend of a 40/60 ratio and containing 60 wt% of RWS, the TPE composites made from the GRT presented lower WA and TS by about 42.9% and 79.5%, respectively, than that of the composites made from NR. The reason of this result was supported with the SEM micrographs, which the composites based on the GRT showed fewer voids and smaller gaps between the phases; thus, this revealed less WA and TS. In addition, the TPE/RWS composites added with MAPP absorbed less water and swelled less thickness when compared with the composites without the addition of MAPP. It was found that the addition of 4 wt% of MAPP into the TPE composites based on the GRT and NR containing 30 wt% of RWS reduced the WA by about 15.4% and 18.0%, respectively, and decreased the TS by about 30.4% and 18.4%, respectively. Less water absorption and thickness swelling of the coupled composites were attributed to the fact that there was stronger adhesion bonding between the RWS and TPE matrix, hence resulting in smaller spaces at the interfacial region.18,42 Thus, the infiltration of water into the composite structures and water residence sites were decreased.
Wear Resistance of the TPE/RWS composites
Abrasion or wear resistance is another important characteristic of the polymer composites that was evaluated because of the applications exposed to severe wearing actions; such as, flooring and decking.
43
In general, the wear resistance of the polymer composites is presented in forms of weight loss, which the decrease in weight loss is the increase in the wear resistance.
44
Figure 9 shows the effects of the compositions’ content and rubber types on the wear resistance of the TPE/RWS composites. It was clear that the weight loss of the TPE composites based on both the GRT and NR rose with the increasing addition of the RWS. With the blend of a 30/70 ratio, the addition of 60 wt% of RWS into the TPE composites based on the GRT and NR considerably increased the weight loss by about 267.7% and 225.9%, respectively. This result was in agreement with El-Shekeil et al.,
27
who revealed that the addition of 30% of fiber into thermoplastic polyurethane produced six times more weight loss. This was probably owing to an increase in the hardness and rigidity of the polymer composites, as the wood sawdust was filled into the polymer matrix,
43
which there was a proportional correlation between the hardness and the weight loss. Furthermore, the WPC with lower surface roughness yielded higher wear resistance (ibid). However, at the same RWS content, the TPE/RWS composites with blend ratios of lower GRT content gave less weight loss, whereas the TPE and the composites based on lower NR with 30 wt% of RWS showed more weight loss. In general, the wear of the WPCs progresses in four stages: polymer wear, wood wear, wood fracture, and wood matrix debonding.
45
Weight loss of TPE composites with different RWS contents and rubber types.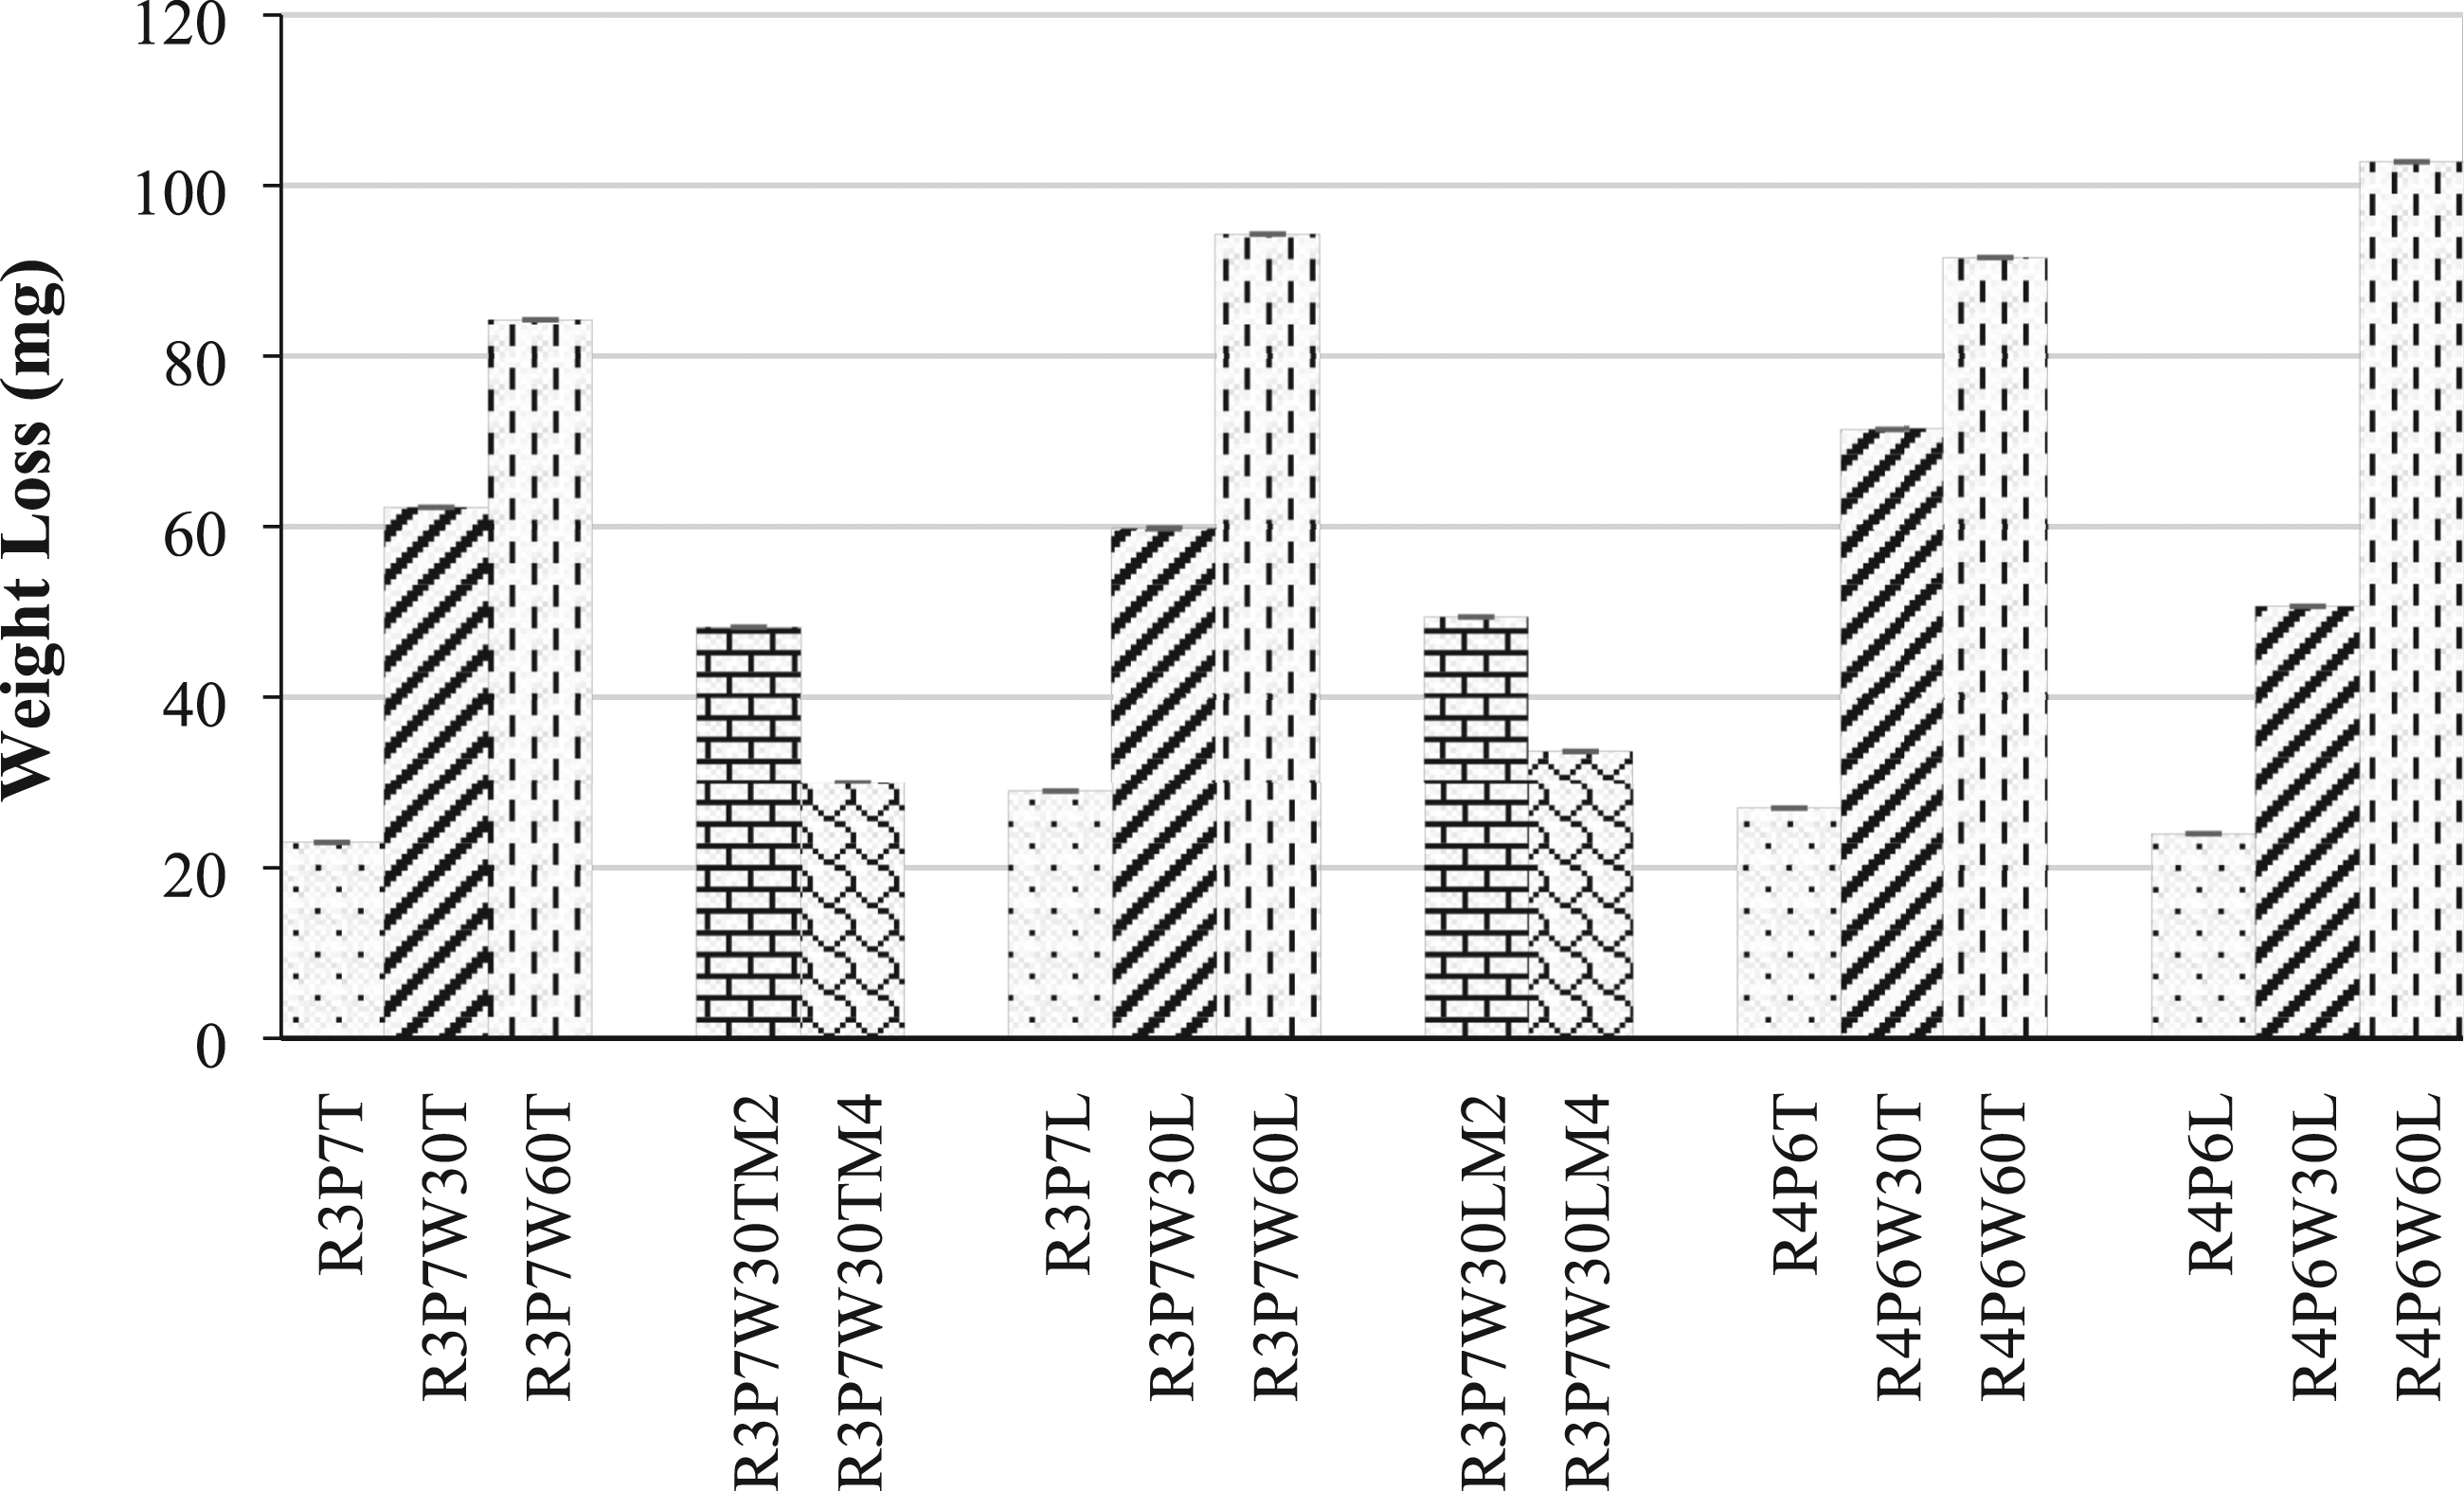
Figure 9 also displays that with the blend of a 30/70 ratio, the TPE/RWS composites based on the GRT gave less weight loss than those composites based on NR, but with a blend of a 40/60 ratio, the composites made from the GRT yielded more weight loss. Furthermore, the weight loss of the TPE composites with 30 wt% of RWS was decreased with the increasing addition of 2–4 wt% of MAPP. The addition of 4 wt% of MAPP into the composites based on the GRT and NR reduced the weight loss by about 106.9% and 76.9%, respectively. This was because a strong interfacial bonding between the polymer matrix and wood filler helped the exertion of the force resistance on the surface of the composites resulting in a decrease of the weight loss. Chand and Dwivedi 45 also stated that the addition of a coupling agent could reduce the wear of the composites because of less natural fiber matrix debonding and a decrease in fiber pull-out.
Conclusions
This research investigated the effect of the compositions’ contents and two rubber types (NR and GRT) on the mechanical and physical properties of the TPE/RWS composites. Based on the current experiment, the results revealed the following: i. SEM micrographs displayed that the TPE/RWS composites with a GRT/PP blend of a 30/70 ratio had rougher fractured surfaces and more porosities than the composites blended with a 40/60 ratio. The TPE/RWS composites based on the GRT had fewer voids and smaller gaps between the phases than the composites based on NR due to the crosslinked structure of the rubber phase for the GRT. ii. The increasing addition of RWS in the range of 30–60 wt% consistently increased the MOE, CM, hardness, WA, TS, and weight loss of the TPE/RWS composites based on both the GRT and NR. The addition of 30 wt% of RWS in the composites with the GRT/PP blend of a 30/70 ratio improved the MOR of the composites. This was probably due to 30 wt% of RWS was the optimal loading for the GRT/PP blend of the 30/70 ratio. iii. With the same RWS content and rubber type, the TPE/RWS composites with blends of a 30/70 ratio clearly yielded better MOR, MOE, CS, CM, WA, TS, and hardness than those blends with a 40/60 ratio due to the plastic being stronger and more rigid than both rubbers. iv. The mechanical and physical properties of the TPE/RWS composites made from both the GRT and NR were improved by adding the coupling agent (MAPP) because of improving the interfacial bonding between the wood sawdust and polymer matrix. However, the amount of 2 wt% of MAPP was recommended for the economic benefit. v. Overall, the mechanical and physical properties of the TPE/RWS composites based on the GRT were better than the composites based on NR, which showed superior strength, rigidity, and dimensional stability. Hence, for saving costs and the environment as well as giving high performance, it is here by suggested that eco-friendly TPE composites made from GRT and waste wood could be a suitable replacement for the NR composites. It would also be appropriate for non-structural applications; such as rubber tile, boardwalk, flooring, wall, and park furniture.
Footnotes
Acknowledgments
Authors would like to thank the Rajamangala University of Technology Srivijaya (RMUTSV), Thailand and National Research Council of Thailand (NRCT) for the research financial support under the Government budget Fund (Research Grant Code: 2561A17102555).
Declaration of conflicting interests
The author(s) declared no potential conflicts of interest with respect to the research, authorship, and/or publication of this article.
Funding
The author(s) disclosed receipt of the following financial support for the research, authorship, and/or publication of this article: This work was supported by the National Research Council of Thailand (NRCT) for the research financial support under the Government budget Fund (Research Grant Code: 2561A17102555).
Data availability
The data is available from the authors upon reasonable request.
Ethical approval
The submission of this work for publication has been approved by all authors and institutions.
Informed consent
All authors are consent to participate in the study and all persons entitled to authorship have been so named.