
Abstract
In this research, an innovative task of printing speed optimization for continuous fiber composites is examined. Employing continuous fibers is a new method to reinforce samples made by fused filament fabrication (FFF) technology. The printing speed is pivotal in the printing process of composites with continuous fibers because of its significant effect on the geometric shape of the samples, especially their corners. In the experimental part of study, continuous glass fiber (CGF) and polylactic acid (PLA) filaments are utilized during optimization as reinforcing phase and matrix, respectively, and are simultaneously fed into the extrusion-based polymer 3D printer to make PLA/CGF composites. Through the optimization, temperature changes of the deposited rasters in the presence and absence of fibers are calculated at the first step, and then the special relationship between the printing speeds and rasters’ temperature changes is determined. Finally, the optimal printing speed is computed based on a hypothesis, which is proved by the results of high-quality printed composites with different geometric shapes.
Introduction
Additive manufacturing (AM) is a suitable name used to describe the technologies that make 3D objects by adding layer-upon-layer of material, such as metals, plastics, ceramics etc. Various methods are available for printing polymeric products like stereolithography and digital light processing for liquid photopolymers, fused filament fabrication (FFF) for polymer filaments, selective laser sintering method for polymeric powders and laminated object manufacturing for polymer sheets.1–4 Among all methods, FFF is one of the most commonly used 3D printing technologies with different industries due to low cost and easily accessible.5–7 The production of very complex shapes, less waste generation, high flexibility, no need for jigs and fixtures and changing materials with relative ease are other great advantages. Also, it has entered many areas of applications such as medicine, dentistry, aerospace, food industry, consumer products, etc.8–11
The main challenge in manufacturing parts with FFF process is the low mechanical properties of products due to the nature of thermoplastic polymers in comparison with metallic and ceramic materials.3,12 The mechanical properties of FFF samples are usually weaker than other parts, which are made by plastic injection molding or compression molding. In those traditional processes, materials are shaped under pressure to form final parts, but during FFF process a sample is produced by bonding rasters and layers together without any external pressure or compression.13–16 Therefore, improving the mechanical properties of FFF samples has always been important for researchers to achieve final parts with better mechanical properties.9,17,18
The most effective way to dramatically increase the tensile mechanical properties is utilizing continuous fibers, which affect the tensile strength and modulus of final products.19,20 Extensive researches have been done on 3D printing of continuous fiber composites and their main focus was on experimental evaluation of mechanical properties of 3D printed products. Most of the printed products had low quality with simple or shell-like geometric shapes. 21
Based on previous studies, Mori et al. 22 improved the tensile strength of acrylonitrile butadiene styrene (ABS) products approximately four times, with 1.4% volumetric continuous carbon fiber (CCF) and a heat-treatment process. Printed specimens are standard specimens of tensile and fatigue tests (dog-bone) and their surface quality are low. Van der Klift et al. 23 employed a Mark One 3D printer from Markforged company and investigated the tensile strength of polyamide (PA)/CCF composites. Matsuzaki et al. 24 utilized polylactic acid (PLA)/CCF and PLA/Jute composites by the simultaneous impregnation system to evaluate the mechanical properties of composite samples. Printed specimens are standard specimens of tensile test (dog-bone) and rectangular shape and undesirable in appearance, dimensional accuracy, and surface quality. Tian et al. 25 employed the simultaneous impregnation method to print PLA/CCF and evaluated the effect of process parameters on the flexural strength modulus of composites. Printed samples are in shell form. They examined the layer height, nozzle temperature, filament feed, bead width, and printing speed at different levels. It should be noted that the effect of the mentioned parameters on mechanical properties was predictable. In the light of nozzle temperature, as the melt flow index increased, fibers’ impregnation with polymeric materials was more favorable and the bonding between layers and rasters for the matrix phase was also higher; therefore, the strength of the composite samples improved. Moving on layer height, fibers’ diameter was constant, but as the layer height increased, the strength of the composites became weaker due to the reduction in fiber percentage. In case of the filament feed, the lower rate meant better impregnation, leading to a higher composite strength. For bead width, the effect was similar to the layer height. With the reduction in bead width, there was an increase in the fiber percentage, improving the mechanical properties. The effect of the printing speed is similar to filament feeding rate and the low speed resulted in better impregnation with increasing the composite strength. 21
Malenka et al. 26 employed a Mark One 3D printer and evaluated the tensile modulus of PA/Kevlar composite samples. Printed specimens are standard specimens of tensile test (dog-bone) and the radius of the fibers at the corners is clear. Li et al. 27 improved the bonding between fibers and matrix of PLA/CCF composite by the simultaneous impregnation method to print; they put fibers in methyl dichloride solution with 8 wt% of PLA before print process. Printed samples have low surface quality and the radius of the fibers at the corners is clear. Yang et al. 28 investigated the mechanical and tensile properties of ABS/CCF by the simultaneous impregnation system. Printed samples are in shell form. Dickson et al. 29 evaluated the tensile and flexural properties of Nylon/continuous glass fiber (CGF), Nylon/CCF, and Nylon/Kevlar composites. Bettini et al. 30 succeeded in producing PLA/aramid composite by simultaneously feeding the aramid fibers and PLA through the feeding section. Printed samples are in shell form. Ishii et al. 31 investigated PA/CCF composites fracture behavior before and after bending test with different radiuses of curvatures. Lack of truly adjacent fibers is also seen in circular paths.
Ibrahim et al.
32
examined the tensile properties of metal/wire reinforced composites. Parandoush et al.
33
examined mechanical bending properties by using a 3D printer based on laminated object manufacturing technology with Prepeg composite sheets of CCF composites (PA6/CCF). Matsuzaki et al.
34
investigated the effect of curvature radius and fibers size on the accuracy in printing continuous fiber composites (PLA/CCF). Printed samples are circular and in a small number of layers. Akhoundi et al.
35
investigated the effect of layer height and printing width on fibers-volume percentage. They achieved different volume percentages (up to 49%) for the PLA/CGF composites and also succeeded in printing composites (PLA +/CGF, PLA + wood/CGF, thermoplastic polyurethane (TPU)/CGF, polyoxymethylene (POM)/CGF, PA/CGF) with the fiber-volume percentage of about 30% and evaluating their tensile mechanical properties.
2
Heidari-Rarani et al.
36
investigated the tensile and flexural properties of PLA/CCF composites. The quality of printed samples is very poor in terms of appearance, dimensional accuracy and surface smoothness. Kousiatza et al.
37
monitored the temperature profile and residual strain for nylon/CGF and nylon/CCF composites with different printing patterns (0, ±45 and 90
In the field of thermoplastic composites, Pitchumani et al. 44 investigated the interfacial bonding and void dynamics during thermoplastic two-placement. Eduljee et al. 45 predicted macroscopic thermal residual stress in short-fiber reinforced polyetheretherketone. Bastien and Gillespie 46 investigated the influence of processing on the fusion bonding of graphite (AS4) and Polyether ether ketone (PEEK) thermoplastic composites (BASF commingled PEEK/graphite NCS woven fabric) using a polyetherimide (PEI) film at the interface is presented. Pitchumani et al. 47 presented a methodology for practical design and optimization of a thermoplastic two-placement using the available theoretical process model. Butler et al. 48 presented an analysis of the mechanism governing fusion bonding of thermoplastic composites. Heidar et al. 49 modeled the automated thermoplastic composite two-placement system using an artificial neural network. Tierney and Gillespie 50 predicted the heat transfer and void dynamic within the laminate in thermoplastic composite using series of integrated sub-models. Tierney and Gillespie 51 studied the crystallization kinetics of PEEK-based composite under isothermal conditions. Tierney and Gillespie 52 presented a model for predicting through-thickness heat transfer and bond strength development based on intimate contact and healing at the ply interface in thermoplastic composites. Levy et al. 53 investigated the contact between layers in the forming process of composite laminates.
In most of the previous studies, the printed samples had simple geometric shapes with certain radiuses at the corners and the surface quality of samples was often undesirable. In addition, products were often in the form of shells due to the big challenge of printing solid parts with sharp corners. It is necessary to have a complete understanding of FFF process and the proper adjustment of its pertinent parameters for printing desirable continuous fiber composites. The main parameter that affects this process is the filament feed, which must be reduced when using continuous fibers and this parameter was discussed in previous studies.2,35 The next important parameter is the printing speed, which affects the process and the quality of final products, especially at the corners. Therefore, the purpose of this study is to investigate the printing speed in FFF process to obtain high-quality products.
Methodology
Hypothesis
In printing composites with continuous fibers, there is always a solid fiber in the nozzle outlet which is not affected by the melting and solidification process of the polymeric matrix. In this section, a hypothesis for examining the printing speed for composites is presented as follows: When continuous fibers are present at the nozzle outlet, there is a speed limitation to perform the correct printing process because of the nozzle movement from end of a path to new one. At critical point, the solidification process of the polymer at the end of the previous path must be completed, and then the nozzle can start the new printing path. Otherwise, due to changes in the speed gradient, it is possible to observe a separated fiber or form an undesirable radius at the path corner. The deposited raster temperature in one path must be below the melting or glass transition temperature in order to properly print the next path. Also, it is important to calculate the temperature variations of the deposited raster and examine their relations with the printing speed, which is expressed in the G-code system after the letter F in millimeters per minute.
Heat transfer in FFF process
Based on Figure 1 that adapted from, 13 it is supposed that a raster with a specified length deposits on the bed and then an element is chosen to calculate the temperature at various points by thermal analysis. We suppose that the cross-section of the element and deposited raster are like a rectangle. So, we skip the corners of round raster because they do not have noticeable influence on the cross-section size and analysis. 13
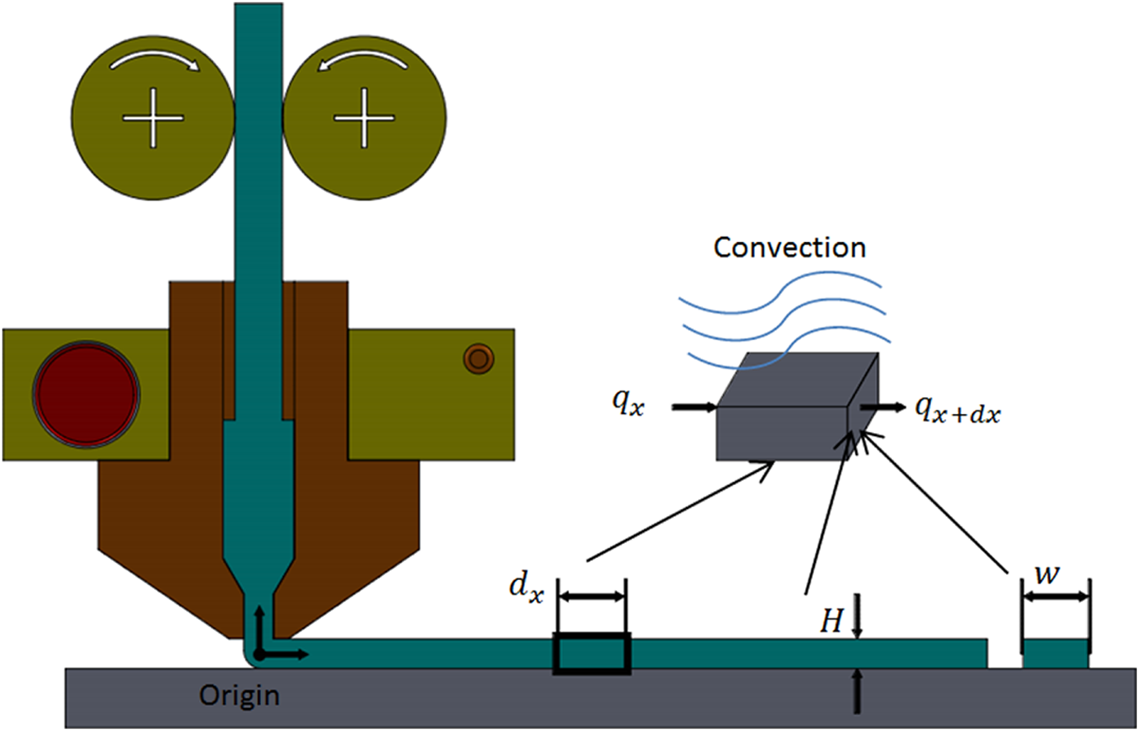
The element for thermal analysis.
Indeed, it is presumed that the coordinate origin is at the nozzle outlet, and the heat transfer is one-dimensional along the x-axis. The temperature is defined at the starting point of the process and can be measured after a certain distance. Obviously, the element length is equal to

where qx,

In this equation:
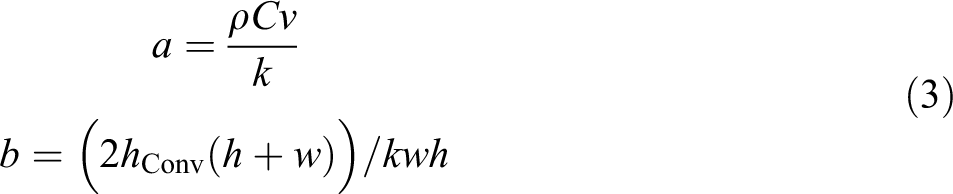
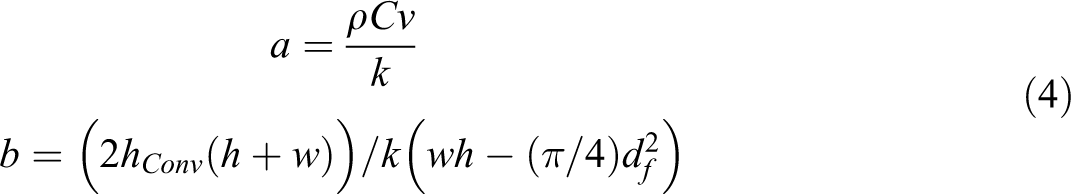
v and k indicate printing speed and conduction heat transfer coefficient respectively. If there is a fiber with df diameter at the nozzle outlet, and layers have a height equal to the fiber diameter, the values of a and b in Equation (2) are:
Speed calculation with continuous fibers
The maximum printing speed is a function of the extrusion width, the layer height, the nozzle temperature, the filament material, and the feed of the filament in FFF process. The print speed must be such that the raster can deposit properly on the bed. In general, 3D printers have a speed limitation based on stepper motors, and most machines’ maximum speed is 400 mm/s, which can print properly at high temperatures and low layer heights. If Equation (2) is solved at different speeds, the resulting graphs show the temperature drop in terms of the distance from the nozzle at various speeds. Also, if the length of each printing path is constant, the maximum printing speed can be determined according to the melting or glass transition temperature of the polymer and other printing conditions.
Materials and equipment
In this research, the FFF Quantum 2020 3D printer made in Iran was used (with 195 × 195 × 200 mm3 building dimensions) which was modified in its nozzle for printing composite materials, that the details were given in. 21 PLA filament with diameter of 1.75 mm, provided from Digimaker, Canada, was employed as the polymer feedstock material for 3D printing. E-glass fiber Yarn was supplied by Jiahe Taizhou Co. (China), with the mass per length of 0.1 g/m. The Dino-Lite digital microscope (Taiwan) with a magnification of 200× was used to detect the fibers yarn placement in the matrix and measuring the radius of corners.
Results and discussion
Calculating printing speed
Using the values in Table 1 for the PLA matrix, the solution of Equation (2) is:

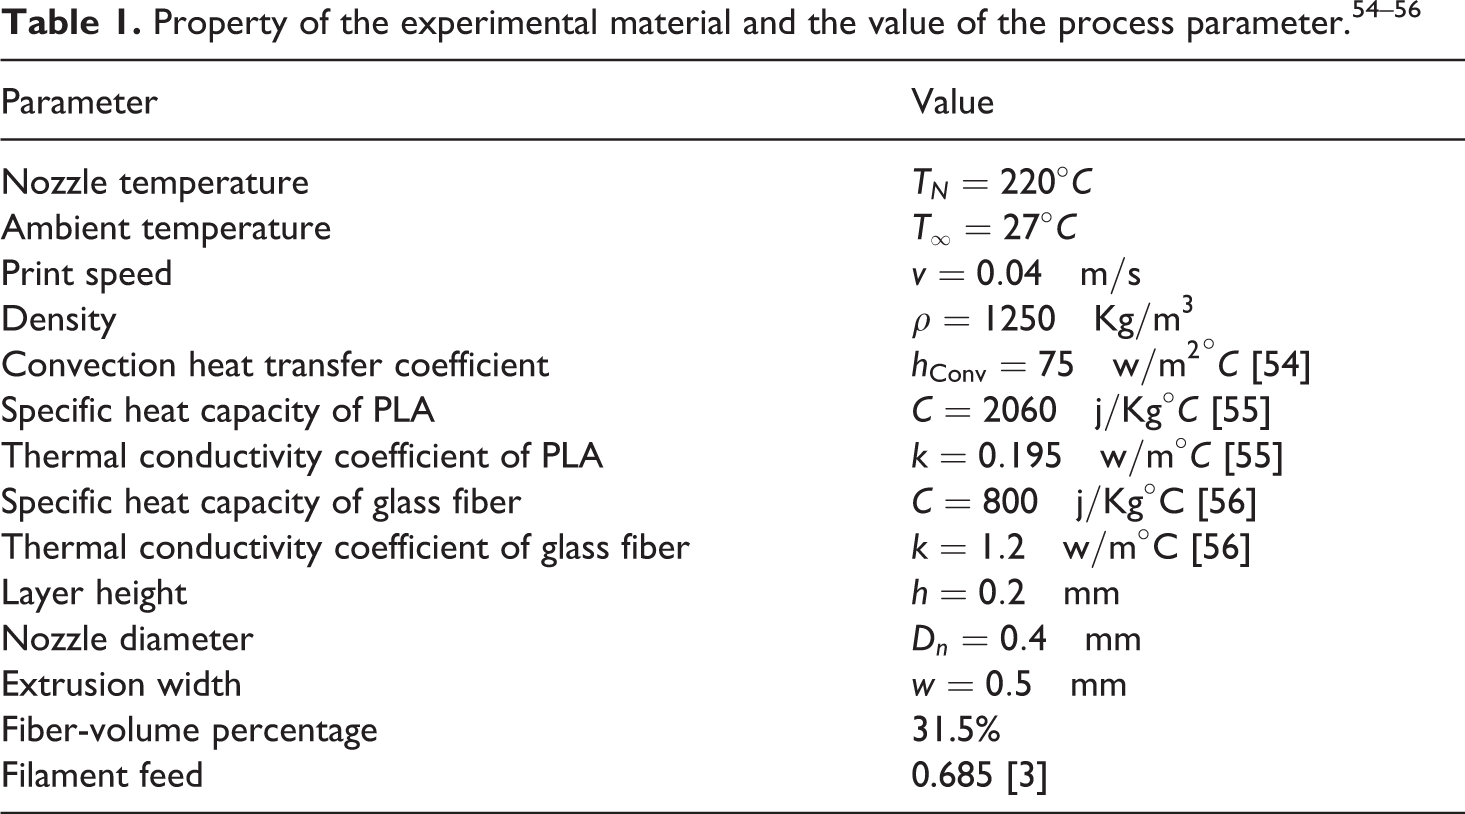
Figure 2 shows the diagram of temperature changes in deposited raster versus the nozzle motion and the 3D printer used in this study. It is evident that when the nozzle goes away, the filament temperature decreases. By using the data in Table 1 and assuming continuous glass fibers with a diameter of 0.2 mm at the nozzle outlet, the final solution of the Equation (4) is:

Figure 2 shows the temperature changes in the deposited raster.
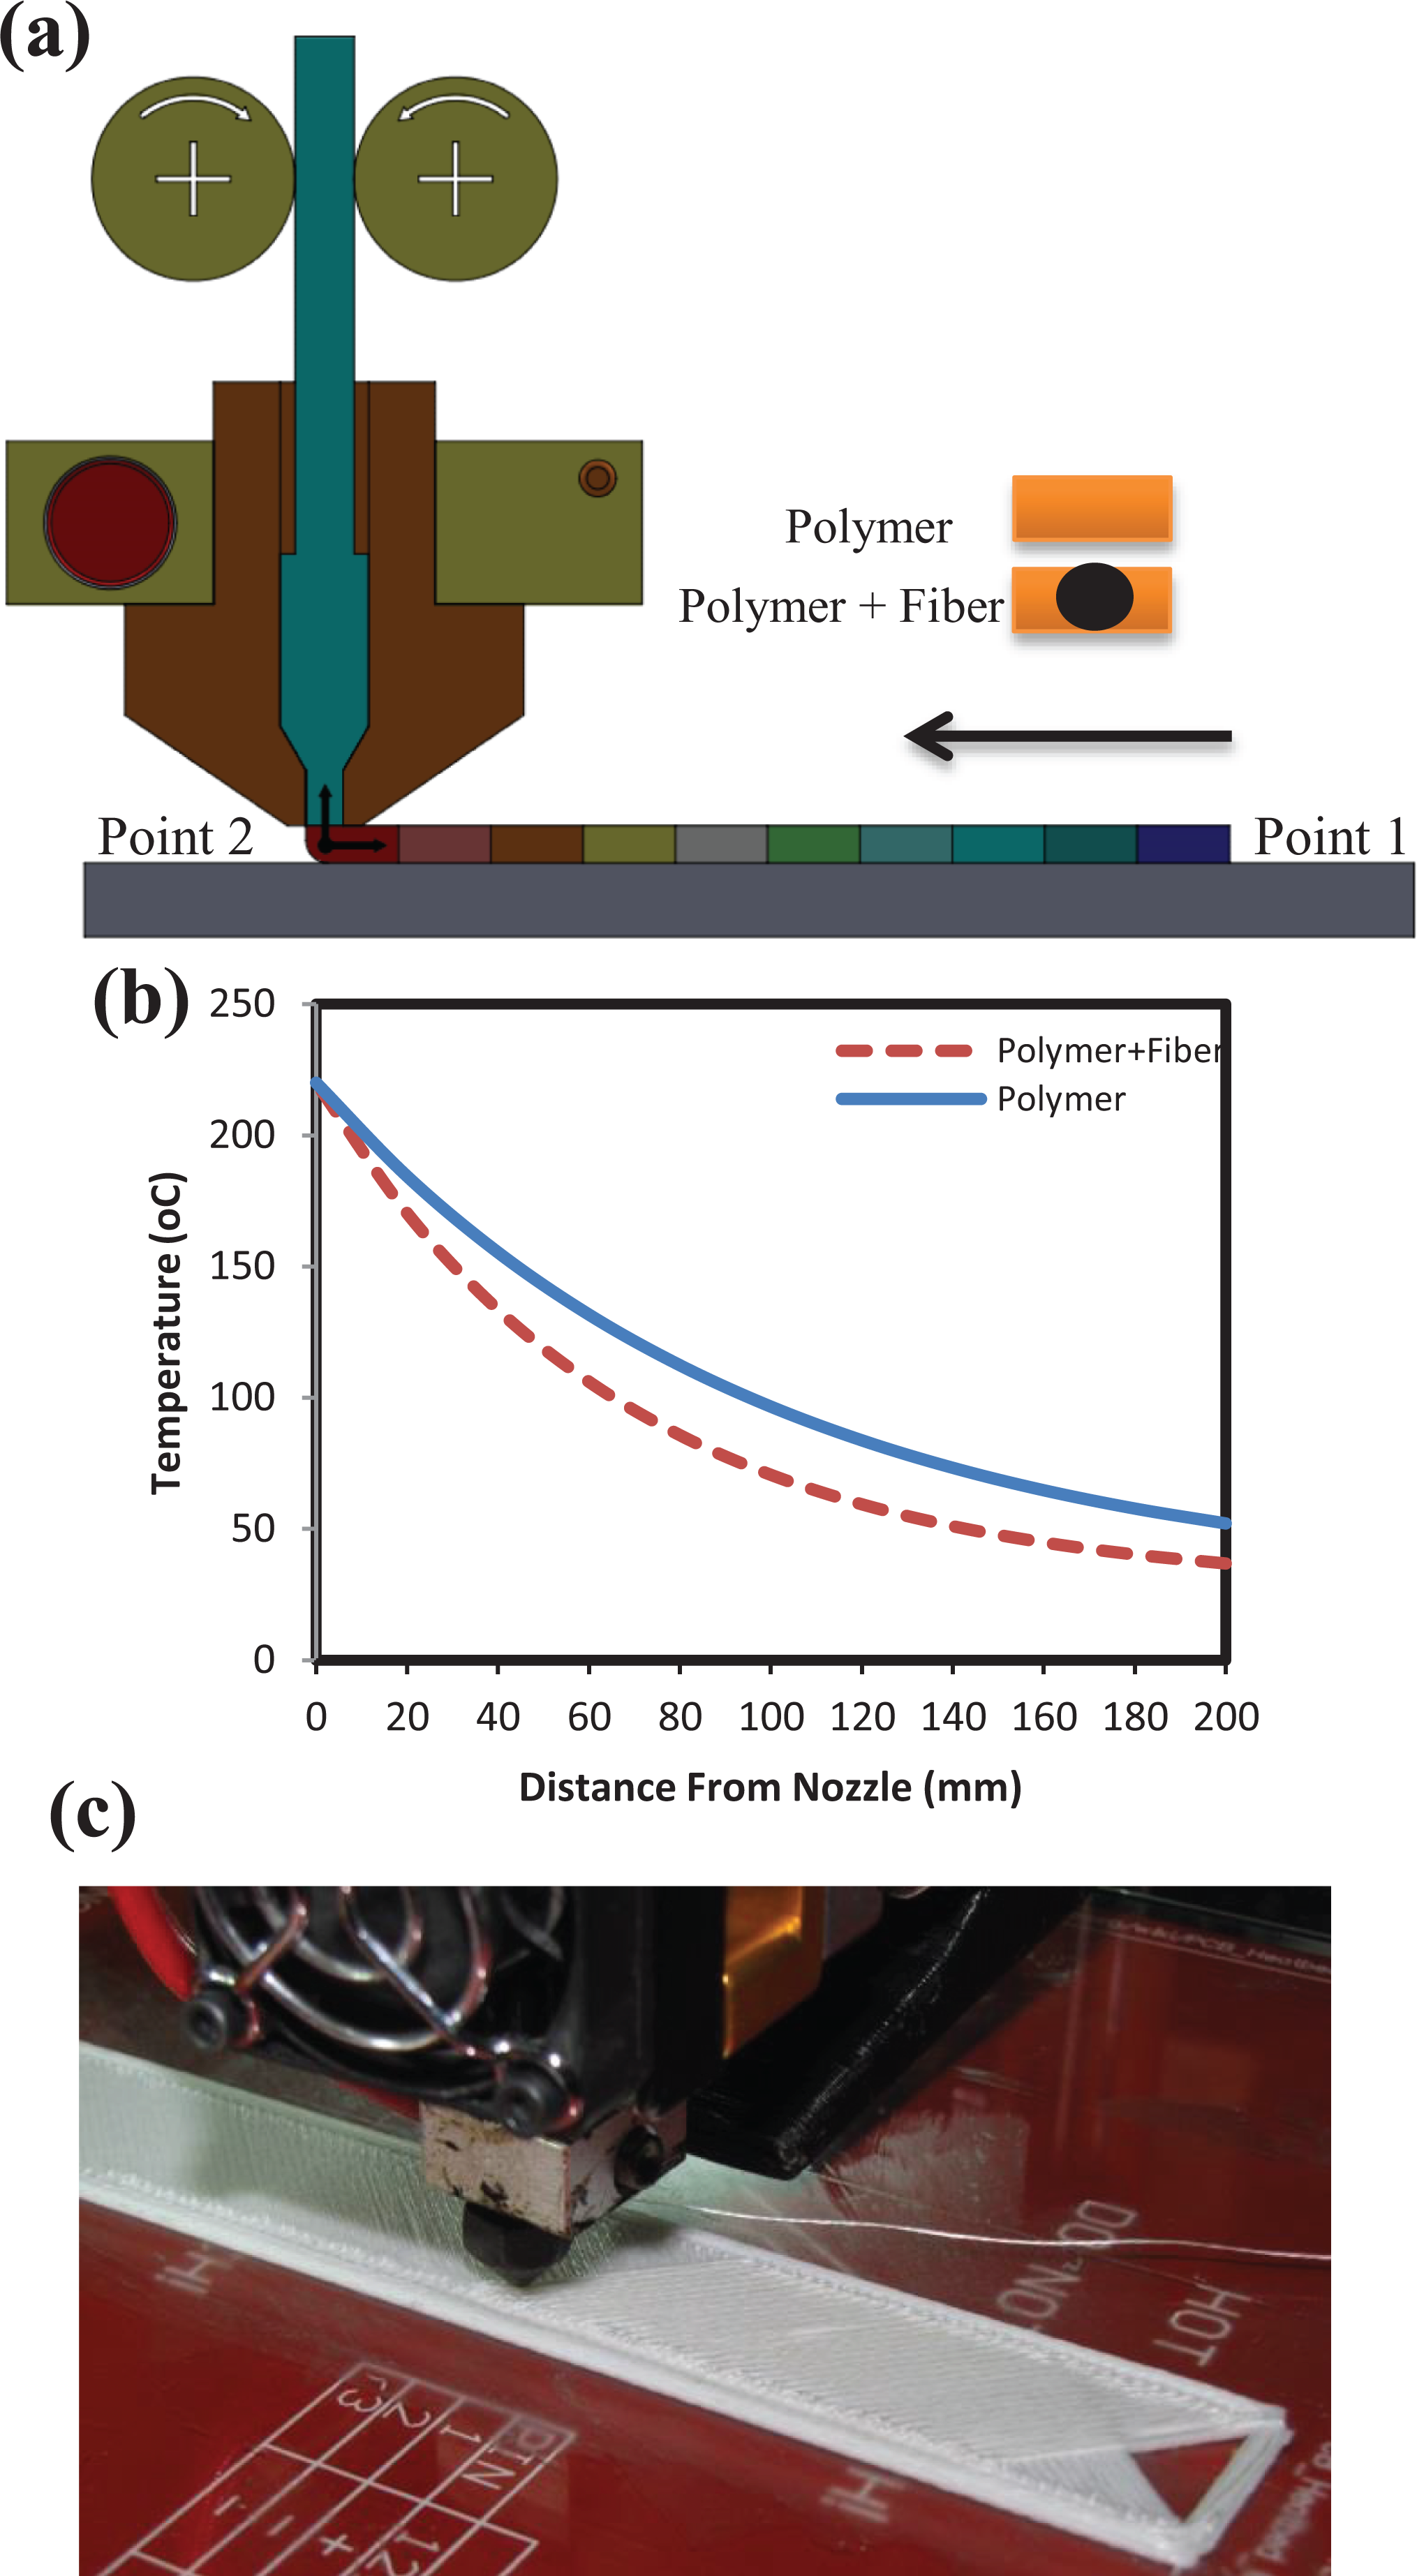
(a) Temperature changes in the deposited raster. (b) Effect of the travel distance from the nozzle on the temperature of the composite and non-composite deposited raster. (c) The 3D printer used in this study.
As shown in Figure 2(a), the nozzle starts at point 1, and prints a distance of 200 mm. As the nozzle moves, the temperature of the deposited filament changes according to Figure 2(b) for the neat polymer and composite material. It is observed that in presence of the fibers, the heat transfer rate and the heat loss rises because of the reduction in the polymer. If Equation (2) is solved for different velocities (4, 40 and 400 mm/s), Figure 3 is obtained using the data presented in Table 1 and continuous fibers with 0.2 mm diameter. The data in Table 1 is shown for PLA, and the glass transition and the melting temperature are 80°C and 180°C, respectively.
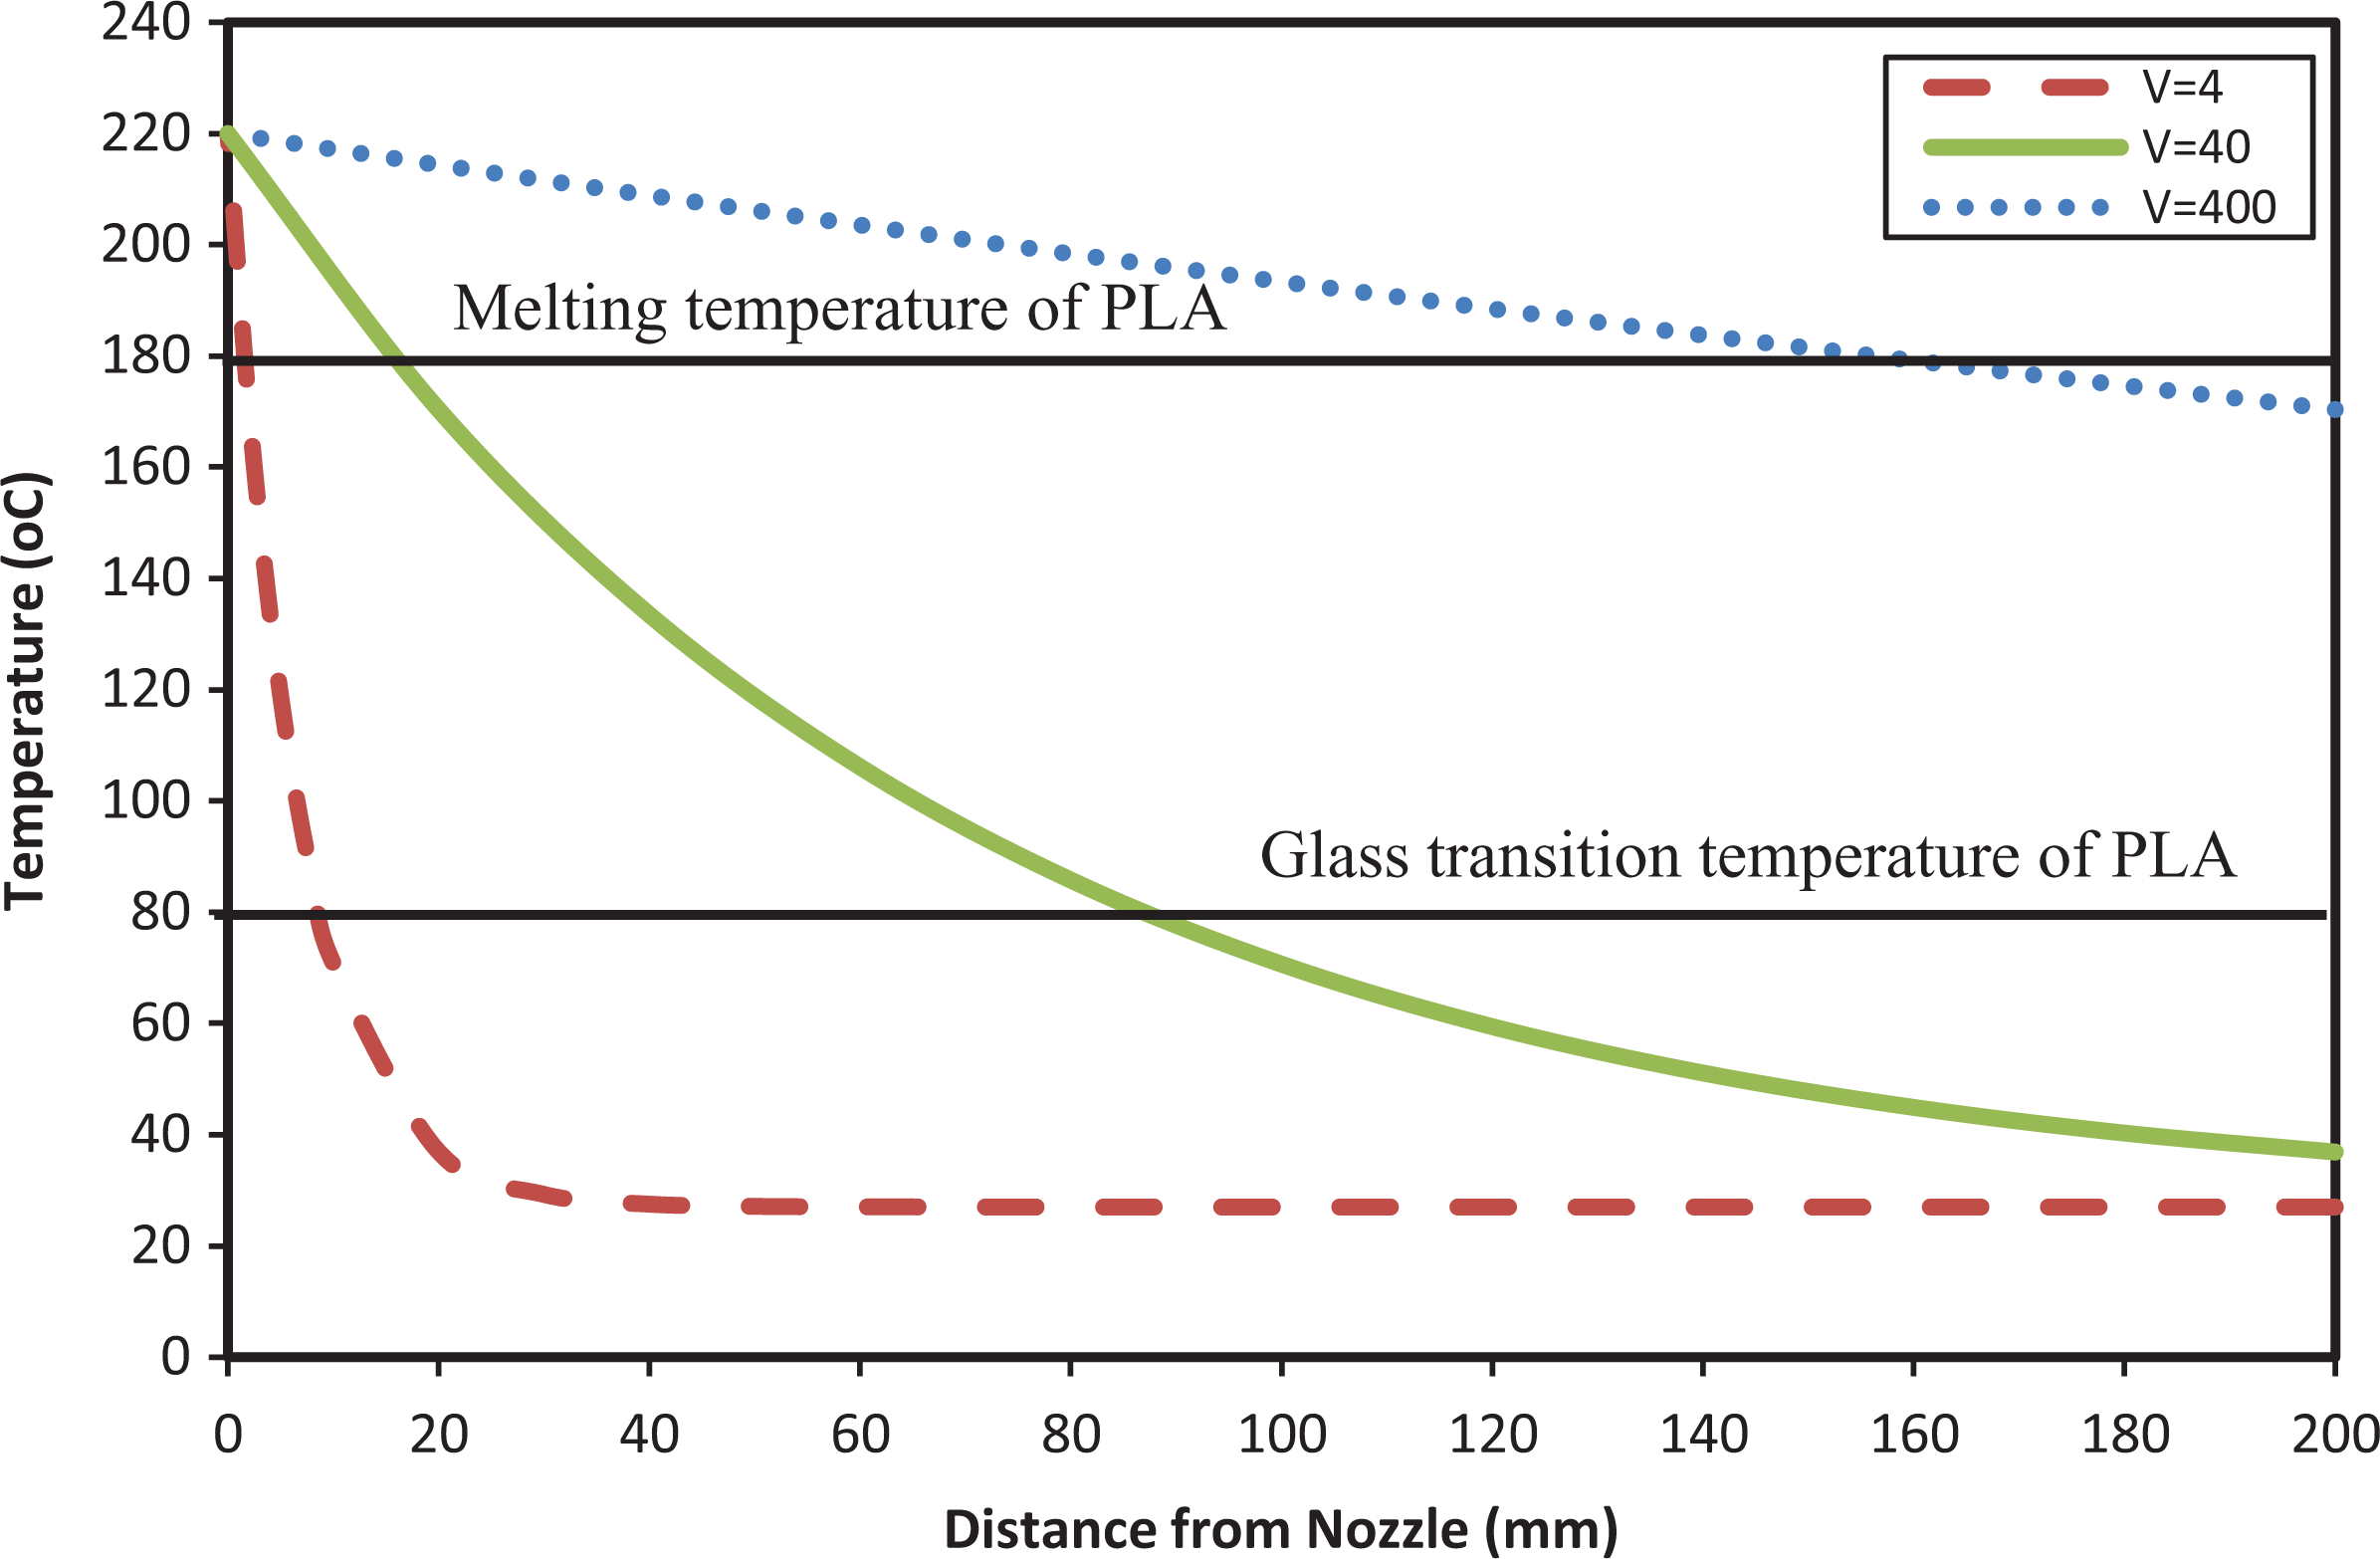
Temperature as a function of the travel distance from the nozzle at different print speeds.
As shown in Figure 3, at the low printing speed (4 mm/s), the temperature drops below the glass transition or melting point in short paths (about under 20 mm). When there is a direction change at the end of a printing path, the temperature must drop below the melting or glass transition temperature. At the end of the current path or at the beginning of the new one, the speed can be determined based on graphs such as those shown in Figure 3 in terms of path length.
For example, with a printing temperature of 220°C and printing speed of 40 mm/s for a direct path, the temperature reaches below the melting line if the distance equals to 20 mm from the nozzle. By reducing speed to 4 mm/s and assuming that the temperature is lower than the melting line, the distance equals to 4 mm. So, it is necessary to drop the amount of printing speed at the beginning of a curved path to achieve printing process with excellent radius at corners. Also, with lower printing speed (4 mm/s), the radius at the intersection of the two paths is minimized. Otherwise, without a reduction in the printing speed like in Figure 4 that adapted from, 27 the intersection of the two paths have an undesirable radius, and higher printing speeds lead to greater radiuses.
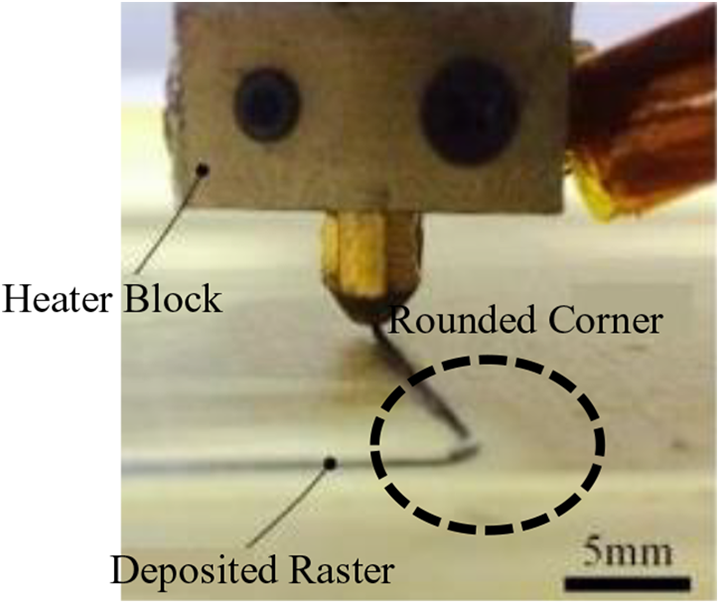
Creating rounded corners at a high printing speed.
The deceleration at the end of the current path and at the beginning of the next path is important for printing circular and arc paths because they are approximated by straight lines in FFF printers. Therefore, for printing curved and circular paths with continuous fibers to perform the printing process correctly, the printing speed must be determined based on approximated short paths. This estimation becomes more critical when the radius of the circle or arc decreases.
Effect of fiber-volume percentage on printing speed
Using the data in Table 1 and the fiber diameter of 0.2 mm, the fiber-volume percentage in Equation 6 and Figure 3 equals 31.5% based on Equation 7. 2
According to previous studies, the maximum volume of fibers obtained through this method is 50% 2 by deeming changes in the volume of fibers resulting from changes in the extrusion width. Figure 5 is achieved by solving Equations 2 for the data in Table 1 on the basis of different extrusion width (which represents different volume percentages).
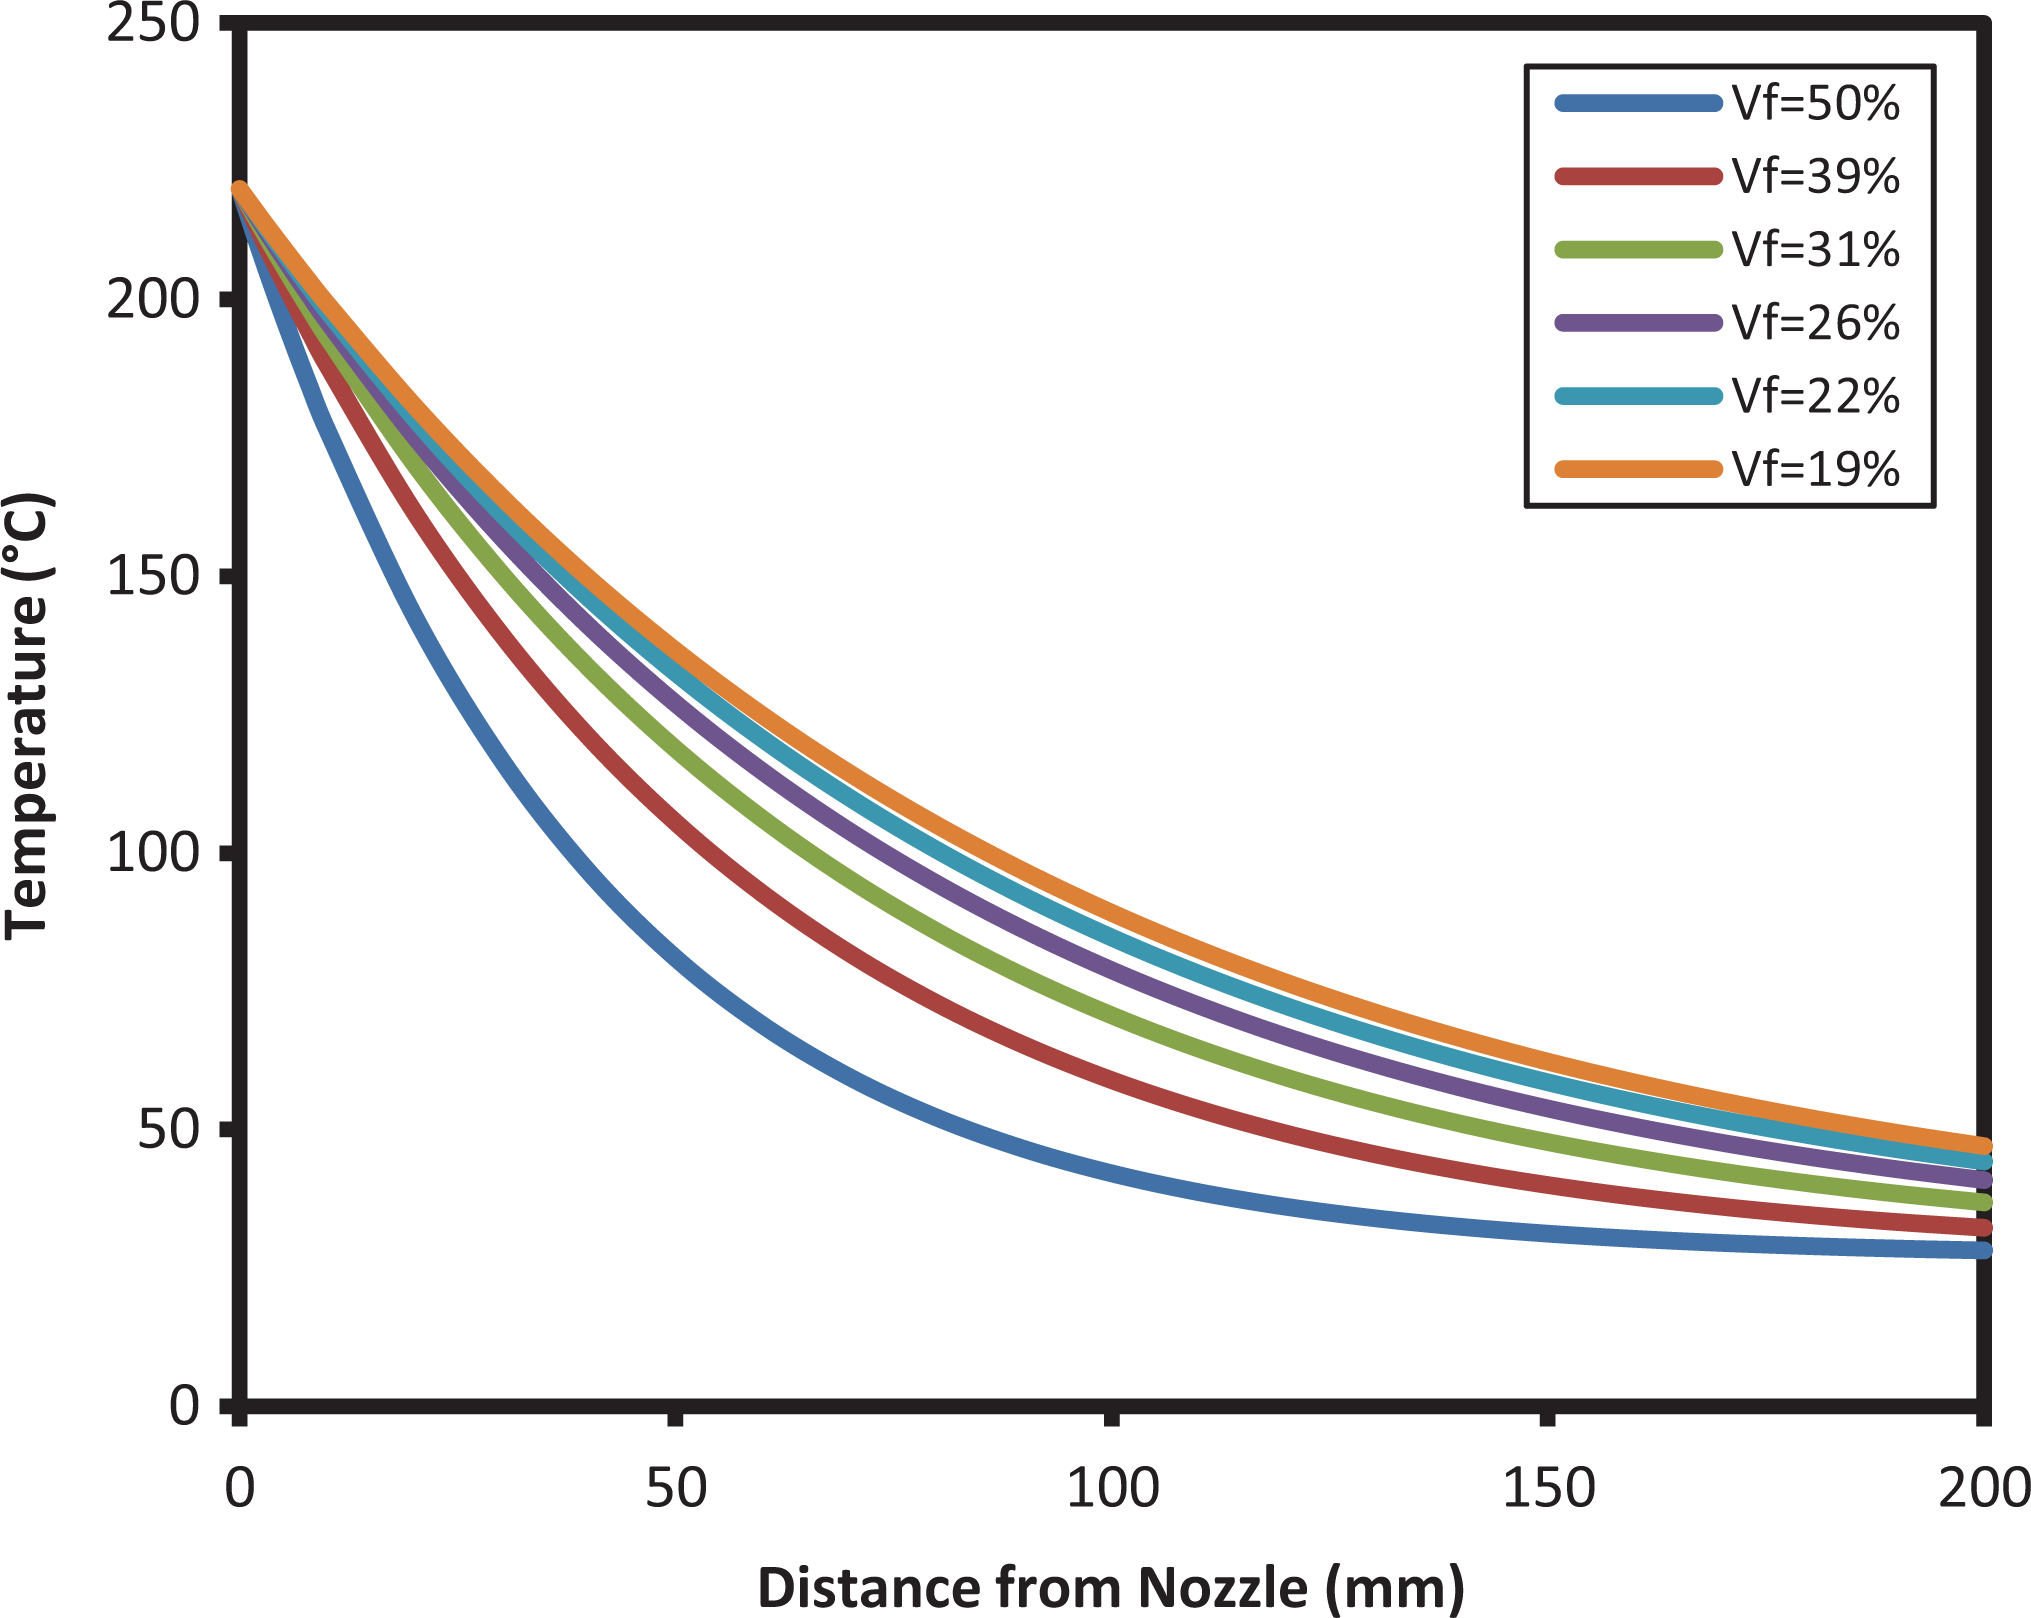
Temperature variations as a function of distance from the nozzle at different fiber-volume percentage.
Figure 5 demonstrates that at a constant printing speed, the temperature’ drop rate is increased when there is more fiber in the nozzle outlet (growth in the fiber volume) because of reduction in polymer material.
Experimental tests
This section investigates the effect of printing speed on the sample’ quality and the radii created at the corners. At first, some squared specimens are printed at 50 mm sides with different printing speeds (2, 4, 6, 8, 10, 15, and 20 mm/s) and various parameters mentioned in Table 1, and then the radii of their corners are measured. Table 2 shows the mean radius created at the corners and the printing time of each sample for all printing speeds. The values are presented for five samples and mean the results are reported.
Corner radius values and printing time for different constant speeds.
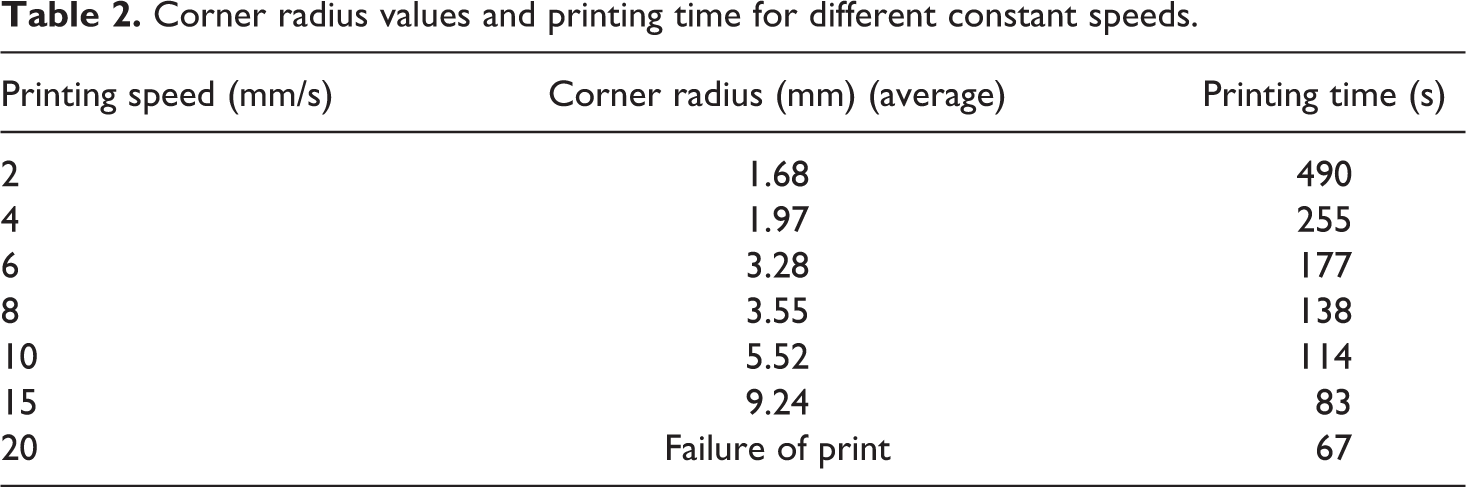
As it is evident that when printing speed increases, the radius created at the corners has an upward trend in contrast with printing time. Figure 6 shows the pictures of printed samples; only the samples printed at 2 and 4 mm/s have the correct shape, the radius value is high at 6 and 8 mm/s and is not desirable at 10 and 15 mm/s.
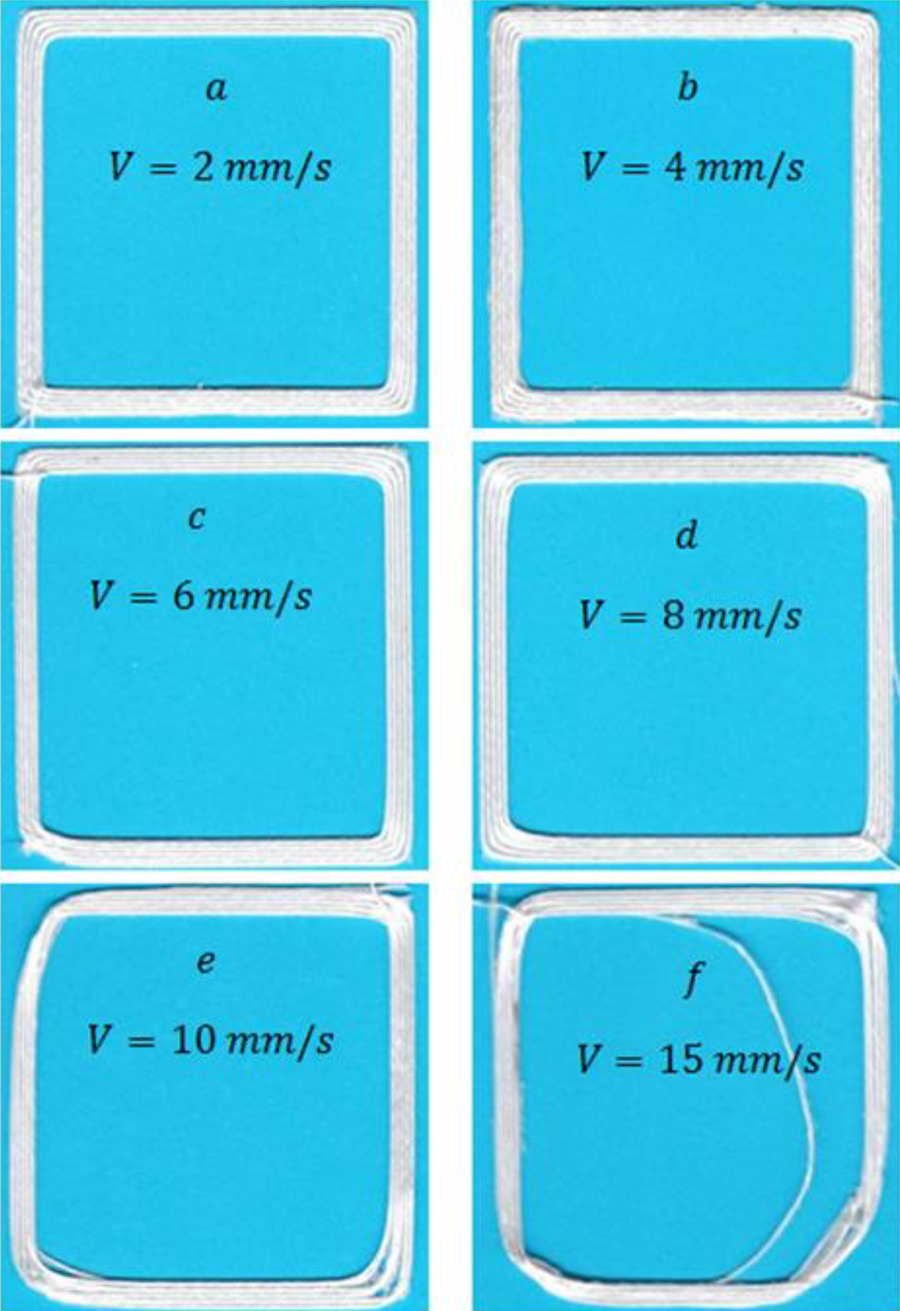
Printed samples at printing speeds of (a) 2, (b) 4, (c) 6, (d) 8, (e) 10, and (f) 15 mm/s.
If the intersection point of 4 mm/s (and lower velocities if plotted) and the PLA melting point are considered in Figure 3, it can be seen that in paths less than 2 mm the temperature of the polymer falls below the melting point and the solid polymer prevents the formation of fiber radius at the corners. Therefore, at printing speeds of less than 4 mm/s, the radius created at the corners is less. As the print speed increases (for example, 10 mm/s), the filament reaches below the melting point over a distance of 10 mm. Then if the nozzle direction changes, the fibers are separated from the polymer because of the not frozen polymer and the tension of the fibers. So, the radius of the fibers at the corners becomes larger.
According to Figure 7, the speed decreases in the specified areas based on the hypothesis described in the 3.1 section.
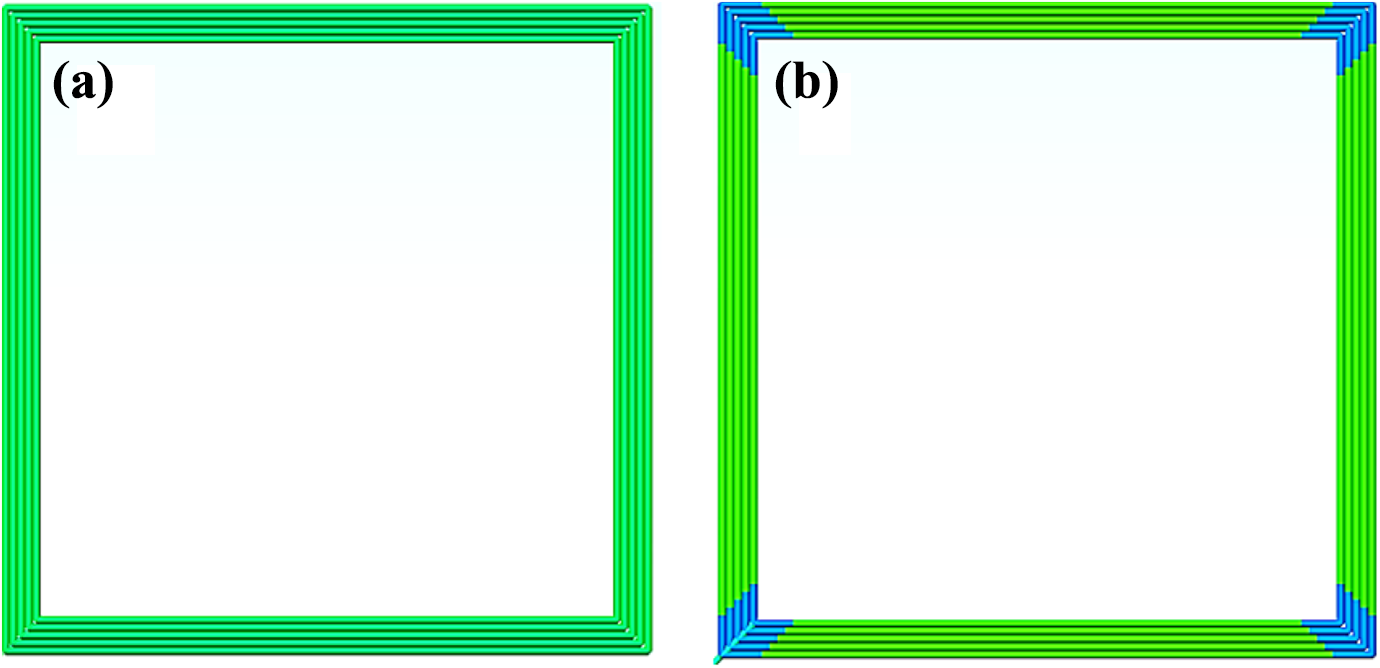
Printing samples at (a) constant and (b) variable speeds in corners.
The printing speed in these samples is 15 mm/s (the maximum speed for printed samples) at direct paths, and 0.1, 0.25, 0.5, 1, and 2 mm/s are chosen for highlighted areas. Table 3 shows the mean radius vreated at the corners and the printing time of each sample for various printing speeds. The values are presented for the five samples and the mean results are reported.
Corner radius and print time values for samples with variable speed printing.
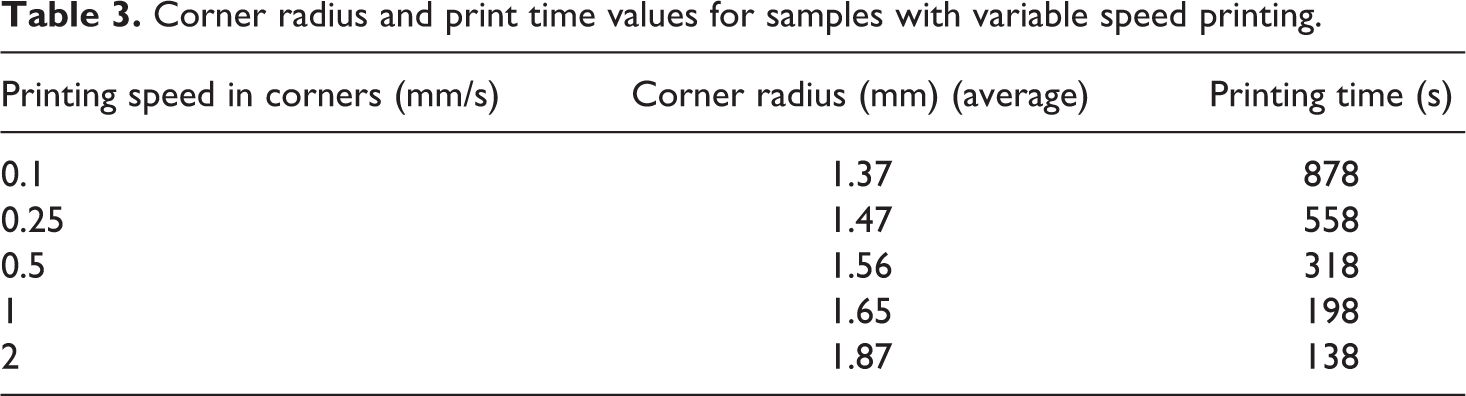
With the decrease in printing speed at the corners, there is drop in the turn radius rapidly, but the reduction is not considerable. Moreover, the printing time can be significantly reduced. The pictures of correctly printed samples are shown in the Figure 8.
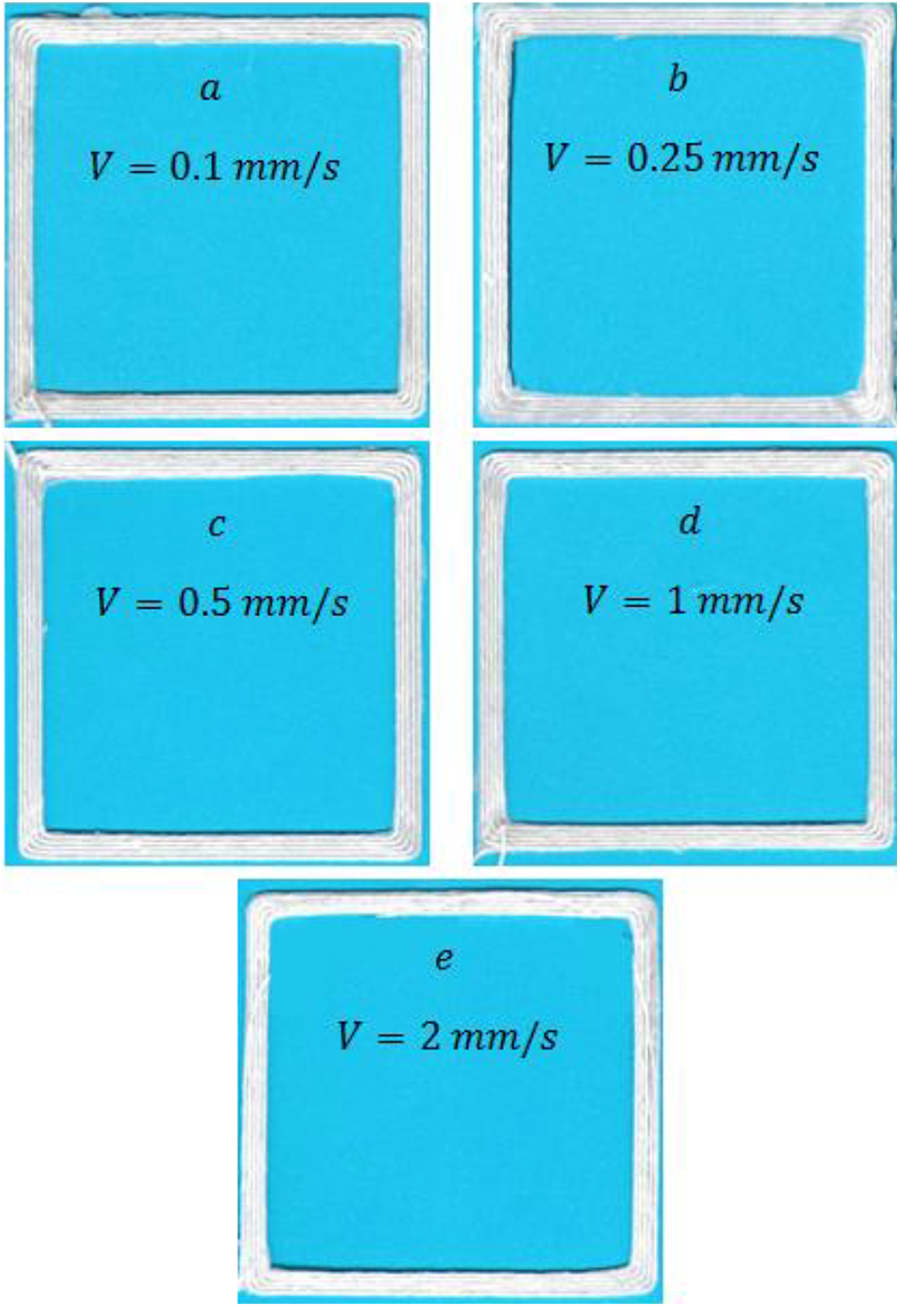
Printed samples at printing speeds of (a) 0.1, (b) 0.25, (c) 0.5, (d) 1, and (e) 2 mm/s at corners and 15 mm/s at other paths.
Figure 9(a) shows corner radius versus printing time and Figure 9(b) demonstrates printing time versus printing time for samples with constant and variable speeds. According to the plots, with increase in printing speed at the corners, the radius of the corners has a similar trend in contrast with printing time.
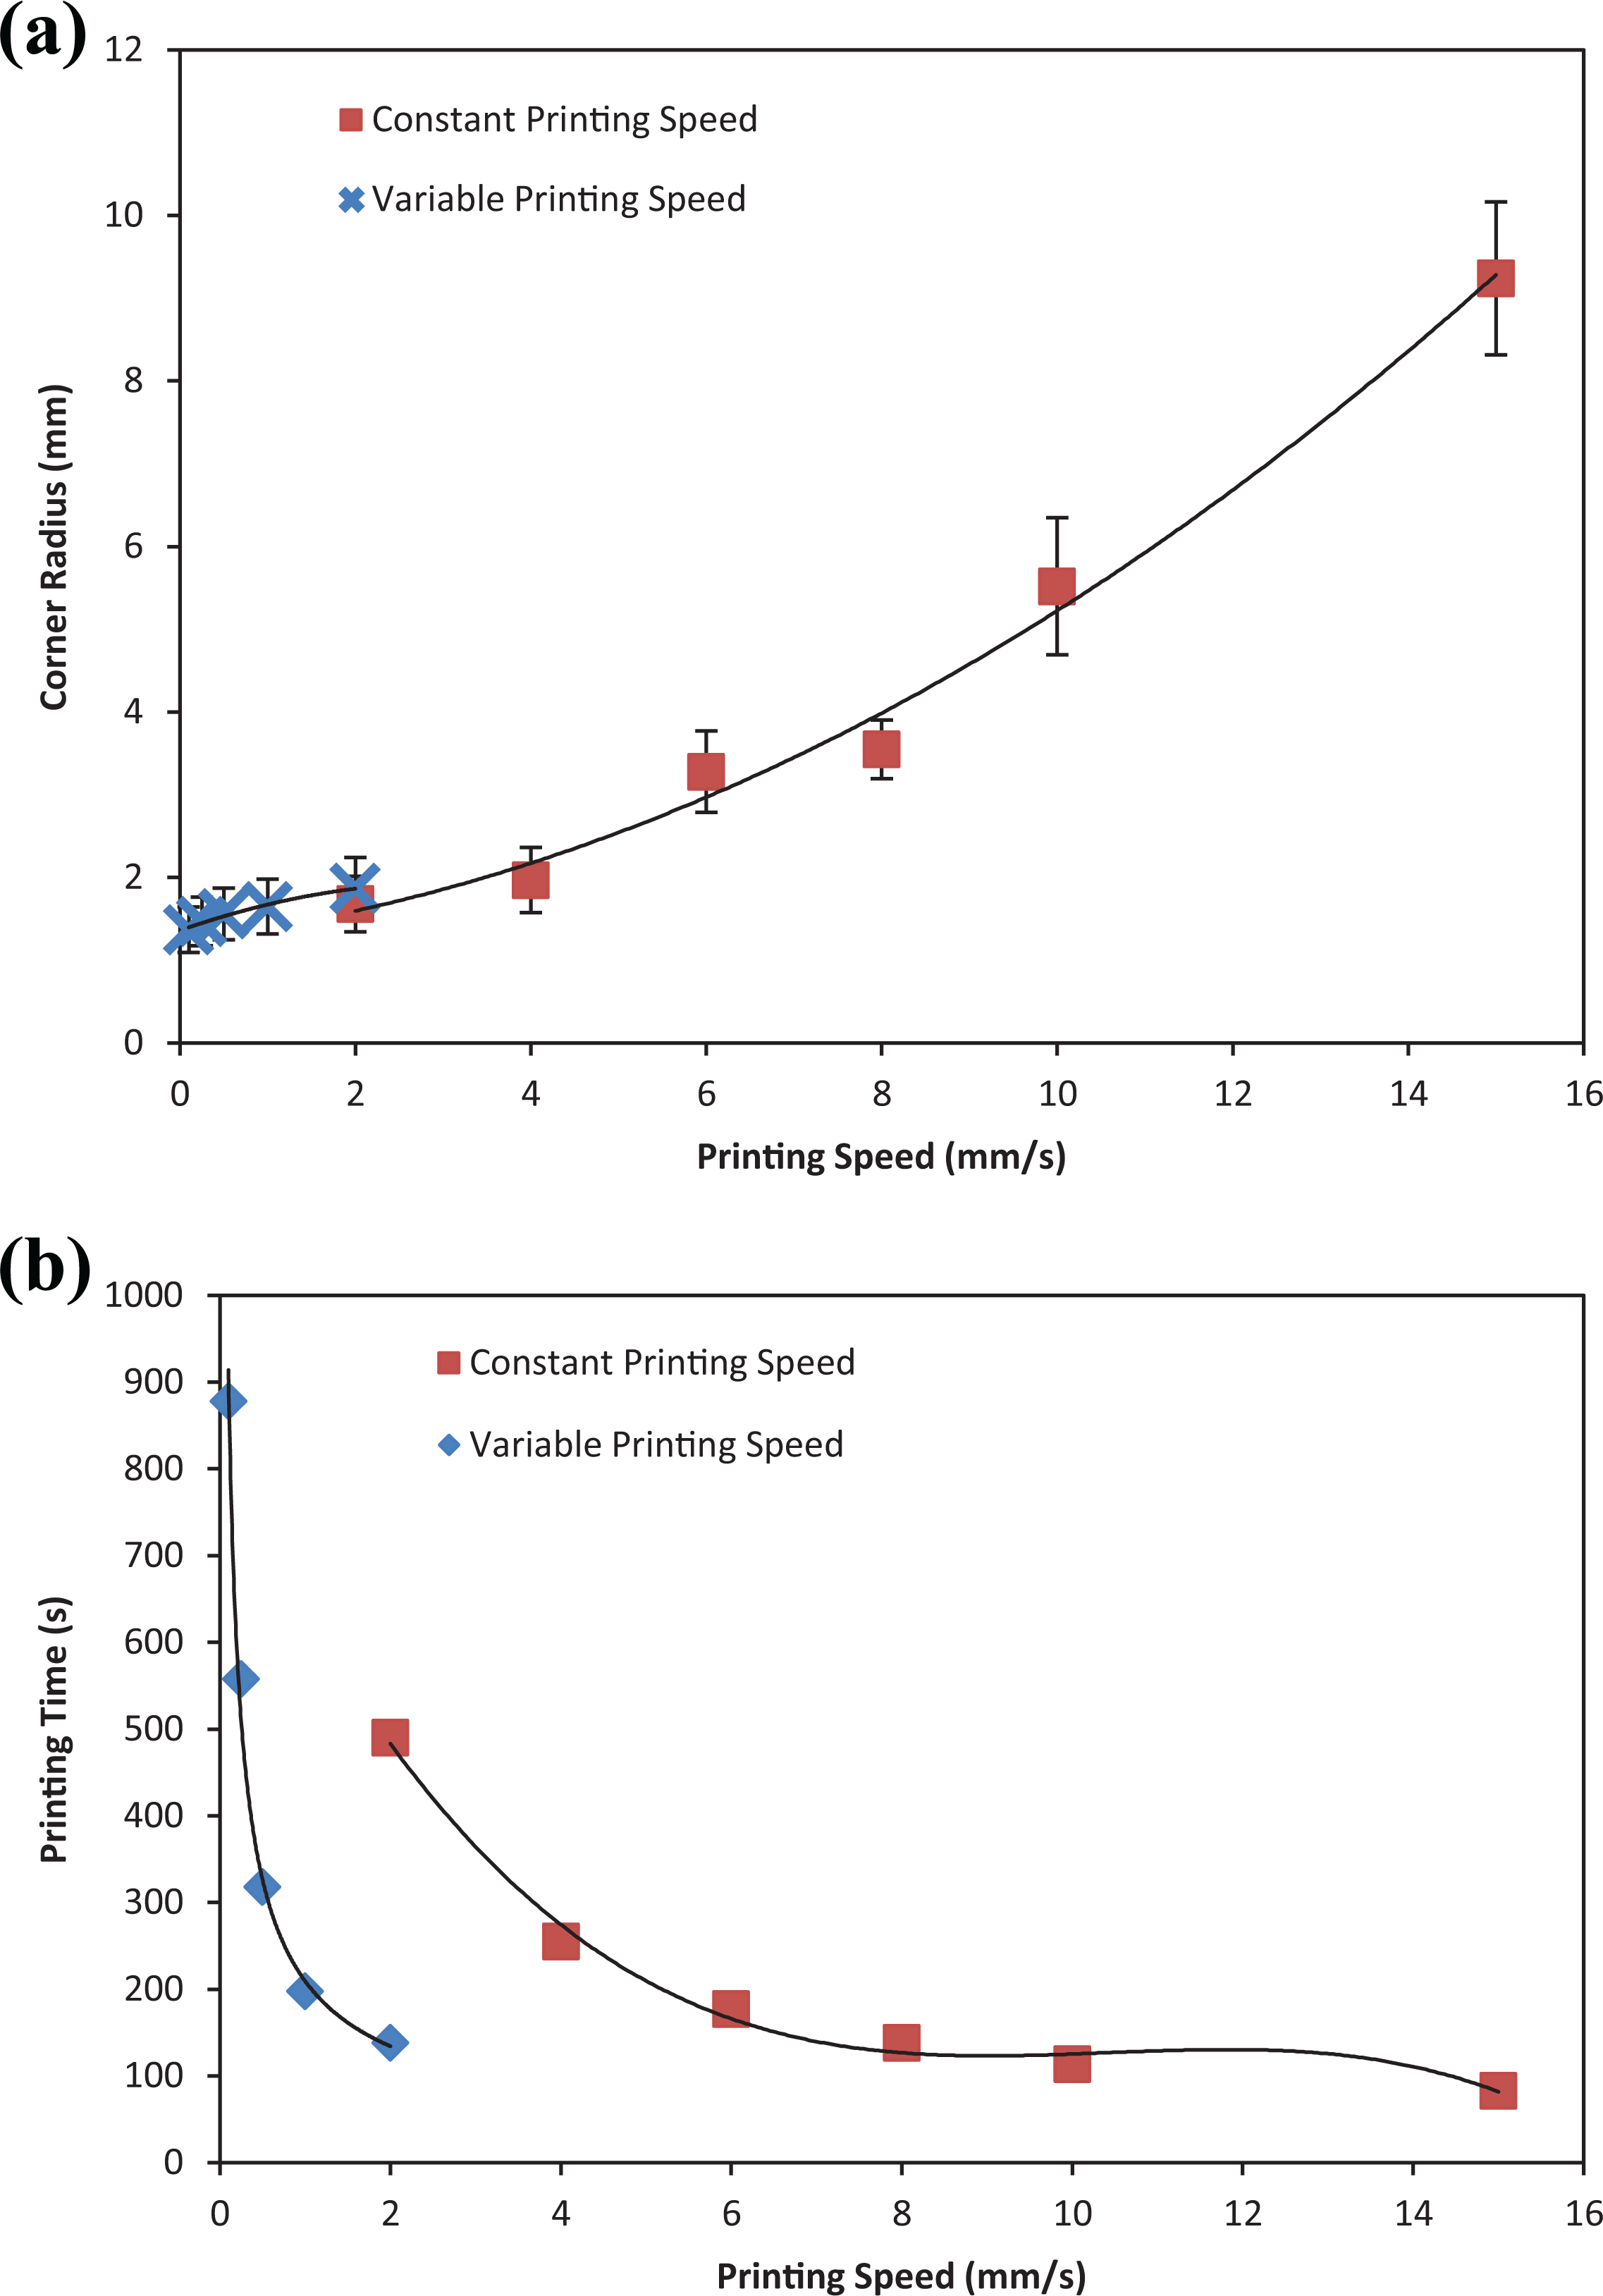
(a) Corner radius and (b) printing time variations according to printing speed.
As shown in Figure 9(a), if the print speed is constant, the amount of radius created in the corners increases with increasing print speed, while if the print speed in the corners decreases, the amount of radius created in the corners decreases, and as the print speed in the corners decreases, the amount of radius created in the corners also decreases in the same proportion. The reason for this is that by slowing down the printing speed, the deposited layer has enough time to cool down and this prevents the fibers from separating in the corners. It can also be seen in Figure 9(b) that the printing time increases as the print speed decreases. This can be seen both in samples that are printed at a constant speed and a variable printing speed in the corners. The main reason for increasing the printing time is to reduce the speed of the nozzle in the direction of the coordinate axes.
It is clear that with increasing printing speed at the corners, the radius of the corners rises too and the minimum printing speed is observable at the corner of arcs, which in this study has a minimum radius of 1.37 mm. Furthermore, modification of the program and the speed at the corners will result in desirable products.
Sample production strategy
In this research, the following algorithm is employed to modify the G-code and printing speed at the corners. Reading the program Calculating the path length of each program line where a layer is deposited. (Lines of the program beginning with G1 code) Defining the path length during the solidification process for the deposited raster. (L)
If the path length in each line of the program is greater than the specified length, that path must be divided into two paths; a path with length of L at the end and a path from beginning to the distance of L from it. Creating new paths Measuring new lengths Calculating the filament feed for each path and put it after the letter E in each line of the program Creating a database of the speeds required for each path according to the length, process conditions and filament material Adding the speed based on the length of each path after the letter F in the related line. running the program
Using the strategy with a fiber cutting system is vital for manufacturing high-quality products. Figure 10 indicates some desirable printed parts with this strategy.
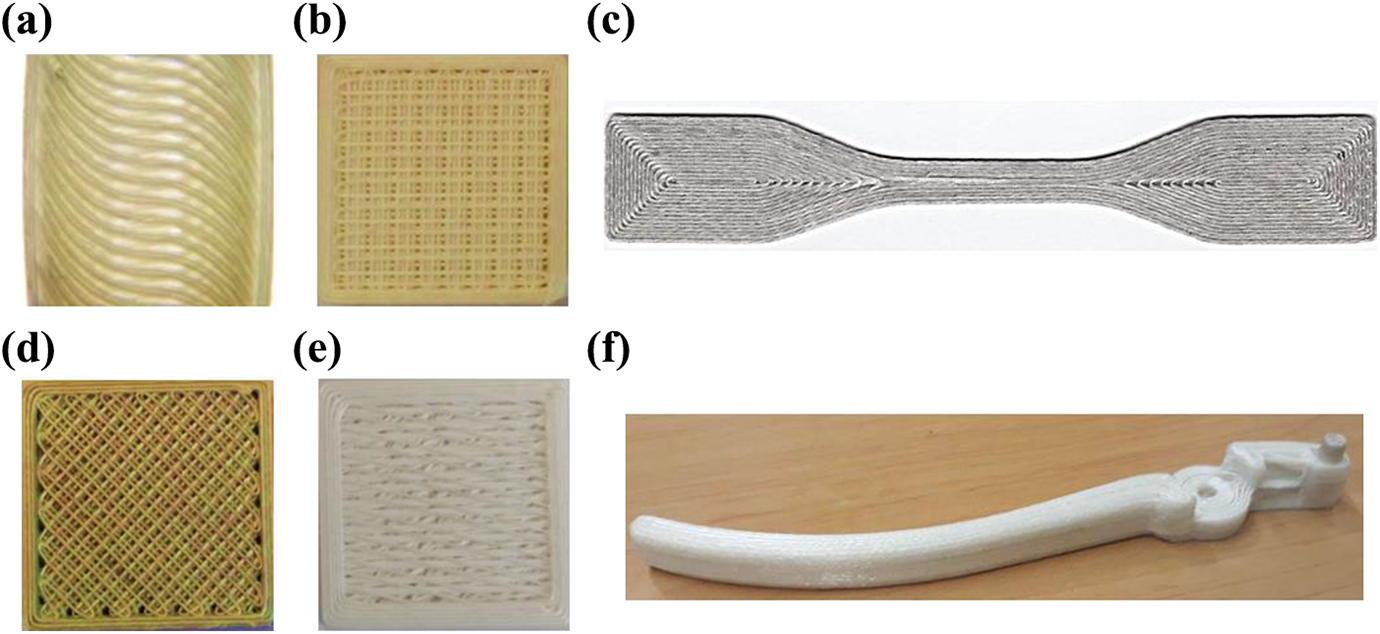
Printed parts with the proposed algorithm. (a) Composite material with continuous fibers in the curved path, (b) composite material with continuous fibers 0/90, (c) standard specimens of tensile test (dog-bone), (d) composite material with continuous fibers ±45, (e) composite material with continuous fibers
Conclusion
In this study, the maximum printing speed for continuous fiber composites by the FFF process was determined. For this purpose, firstly, the relationship between the temperature changes in the deposited fiber was calculated, and then based on the presented hypothesis; the maximum printing speed was obtained for different paths. The hypothesis is that there is a speed limitation for the correct printing process when there is a continuous fiber in the nozzle outlet. The limitation emerges when the nozzle is moved from one end of the path to the new one, so the solidification process of the polymer material must occur at the end of the previous path and then the nozzle can move through the new one. Otherwise, due to changes in the speed gradient, separating of fibers or incorrect printing of corners is possible to happen. The assumed hypothesis presents the relationship between the radius of corners and printing speed, and as a result, the minimum printed radius is 1.37 mm at 0.1 mm/s printing speed. It was also found that at a constant print speed, the radius of the corners increases with increasing speed, and it is not possible to print the sample by increasing the speed from a certain limit (here 20 mm/s) that depends on the path length. Also, as the speed decreases, the radius of the corners decreases, and the printing time increases. Therefore, to reduce the printing time, it is necessary to reduce only the printing speed at the corners. Determining the printing speed at the corners is a function of the thermal properties of the materials and the length of the depositing path. In this study, all calculations are for CGF/PLA composite material. Finally, correct printed samples indicated the validity of the proposed hypothesis and strategy to achieve high-quality products with continuous fibers.