
Abstract
During impact, thermoset composites show brittle behaviour, whereas thermoplastic composites show a relatively ductile behaviour with higher absorption of impact energy. The research on the investigation of the impact performance of composites with thermoplastic resin and/or with a blend of thermoplastic and thermoset resins found rare. In the present study, both thermoset (phenolic, vinyl ester) and thermoplastic (Polyvinyl butyral – PVB) matrices were used with Para-aramid reinforcement for the development of five-layered composite samples. Drop weight impact, Charpy impact, flexural (three-point), and hardness tests were conducted to assess the performance of the composite samples. The developed thermoplastic composites showed superior impact properties as compared to thermoset composites except for out-of-plane deformation (trauma). This deformation was reduced using a blend of PVB and Phenolic. The composite made with blend absorbs 8–9% more energy as compared to Phenolic composites with almost the same value of trauma. Overall, damage area is also lesser in the case of composite made using a blend. The experimental results are validated by one-way ANOVA (Tukey) statistical analysis.
Keywords
Introduction
In recent years composite materials gained an attraction to be used in different applications. A wide range of materials are used for protection from various kinds of treats. High-performance fibres were used along with different matrices to get the required level of protection. As reinforcement is woven, non-woven and knitted structures are used with different fabric patterns such as 2D, 3D and UD’s are used to place fibres in a specific structure to achieve optimum protection. As far as matrix concern, thermoplastic and thermoset both resins reported in the literature as matrix materials, with different advantages and disadvantages.
Fibre-reinforced polymer (FRP) composite become an important material for different kind of applications like aerospace, impact, military applications, and other application which requires better through-thickness properties. FRP has two main parts one is reinforcement and the other one is a matrix. The main component of the composite that is inserted into the matrix is reinforcement. It is a stiff material that offers strength. The liability for carrying loads can be fibre, cloth, or particulate matter. In providing mechanical properties in composites, the distribution, orientation, length and shape of fibres, yarn, or fabrics play an important role. Reinforcement materials with various grades and properties have been used for composite fabrication. Reinforcement can be natural or high-performance synthetic fibre. 1 Polypropylene and polyethylene co vinyl acetate matrices are used to manufacture the particulate composites. The samples were then tested for mass loss and tensile strength and it was found that the composite with a smaller size of alumina particles perform better than other composite samples. 2 The different type of reinforcements like kapok, glass, carbon, and Para-aramid was used for manufacturing of composites in various structures depending upon the end-use and properties required in the final product. There are two major types of matrix, i.e. thermoset and thermoplastics. Epoxy is the most frequently used thermoset matrix. 3 Green epoxies, polyester, phenolic resins and vinyl ester, etc. are some examples of these polymers. 4 Mostly used thermoplastic matrices examples are polypropylene (PP), polyester (PET), polyethylene (PE), polycarbonate (PC), Nylon 6, 66, PEKK, PEEK and Polyvinyl butyral (PVB). Thermoplastic matrices performance is better in some aspects as compared to thermosets. 5
The selection of matrix for composite manufacturing is very important regarding the final properties of a composite. These matrices are used for the manufacturing of composites for improvement in through-thickness and in-plane mechanical properties. A new variety of materials have arisen from FRP composites. To deliver significant advantages in terms of density and fatigue compared to typical metallic materials. Most of the structural mass of certain civil and military aircraft has recently been taken up by the FRP composites.6–9 FRP properties are dependent upon the various factors like the types of fibre and matrix used, fibre volume fraction and orientation of reinforcement, as well as the method of production used for composite fabrication. 10
Karahan et al. 11 used polyethylene films for binding of para-aramid woven and UD fabrics for impact applications and results shows that the hybrid sample made from woven and UD para-aramid have 4.48% less trauma, 13.9% less energy transferred and 8.48% more energy absorbed per unit weight in comparison to woven sample. The effect of injection moulding temperature on the mechanical properties of polyamide and glass fibre composite. The results show that the lower mass temperature produced polyamide gives better mechanical properties as compared to higher temperatures injection-moulded polyamide. 12 Nawab et al. 13 used green epoxy along with jute 3D four-layer fabric to manufacture the composite and checked its performance by changing the weave structure. Daniel et al. 14 used carbon and epoxy to manufacture the composite and characterize it for through-thickness properties. Different natural fibres like jute, flax, pure cellulose and wood pulp were used to manufacture composite with polyamide 6. It was concluded that these natural fibre composite provide comparable mechanical properties to glass fibre composite, so the natural fibre can be used in various applications along with PA 6. 15 Aurilia et al. 16 used PP matrix along with micro and nano sized particles of CaCO3 to check its effect on mechanical properties of composites and found that by adding micro/nano sized particles the flexural modulus and flexural strength was increased by 60% and 130% respectively as compared to samples produced without particles. Abot and Daniel 17 manufactured a composite by using carbon fabric as reinforcement and epoxy as a matrix to study the through-thickness mechanical properties. Flax fibre was used to manufacture the composite by using a thermoset as well as a thermoplastic matrix to check its stiffness and strength. It was concluded that the addition of maleic anhydride grafted PP (MAPP) increased the strength. 18 Compston et al. 19 investigated the effect of matrix toughness by using glass fabric as reinforcement and vinyl ester as matrix and concluded that there is no effect of matrix toughness on fracture toughness of the composite. By using the glass fibre along with vinyl ester and oil palm, the mechanical properties of the composite were investigated. It was concluded that hybrid composite performs better in terms of mechanical properties. 20 Carbon fabric treated with different percentages of silane was used to manufacture composites with a mixture of vinyl ester and epoxy and it was found that hybrid matrix composite mechanical properties were improved with silane treatment. 21
Jiang et al. 22 used different content of polyimide fibre with polyamide-6 matrix and found that by adding 12% by weight polyimide fibre the impact strength was increased by a factor of five. The split Hopkinson pressure bar (SHPB) was used to test the compression strength of E-glass and vinyl ester composite. It is concluded that the compression strength is increased from 417 MPa to 462 MPa as compared to quasi-static tests due to controlled strain rate variation during the test. 23 Addition of carbon nanotubes in a composite of glass fibre and vinyl ester resin to investigate the change in shear strength of the composite. It was observed that with a little addition of carbon nanotubes (0.015%), there is an increase of 45% in shear strength as compared to the controlled sample. 24 The use of natural fibres and their wastes to produce the composites by using oil-based polymers are used in various applications like automotive to make the composites environment friendly. 25 Warrior et al. 26 used different resins to check the specific energy absorption of the manufactured samples. The results shows that the sample manufactured with epoxy absorbed more energy than vinyle ester and polyester respectively. Through-thickness compression strength (TTCS) of carbon fabric and epoxy was tested by using different weave designs, the sequence of stacking and cutting direction from the laminate. It is concluded that unidirectional cylindrical laminate and woven fabric cubical laminate gives the best results of TTCS. 27 Composites were fabricated by using glass fibre in the direction of ±45° and 0/90° and polyester as resin. It is concluded that with low-velocity impact, the tensile properties of 0/90° composite was better than ±45°. 28 The mechanical properties of 2D woven thermoplastic composites have been studied by Kumar et al. 29 Carbon fibre was used to manufacture the composite with polyamide six and nickel powder to improve its electromagnetic shielding and mechanical properties.30,31 There were three types of reinforcement fabrics made. Two fabrics were homogeneous Kevlar and basalt plain-woven fabrics, and the third fabric was made of mixed yarns (Kevlar and basalt yarns). Their composites were then made using a matrix of polypropylene. Hybrid yarn composites have stronger properties of tensile and in-plane compression than others. Salman et al. 31 have studied the effect of various kenaf fibre configurations on energy absorption impact and back-face signature depth. Kevlar fabric, Kenaf fabric and hybrid yarn fabric (Kevlar and kenaf fibres) were used as reinforcements and their composites were made using the PVB matrix. Then they compared findings of all composites. They noticed that reinforcement arrangements such as 15 layers of aramid and then four layers of kenaf were very successful in achieving the fourth level of development as per NIJ standard. They concluded that yarn hybridization has a positive effect on the absorption of energy and trauma depth. It is stated that the effect of hybrid thermoplastic composite material under high-velocity impact is hybridized and stacked series. The findings show that a lot of ballistic efficiencies are affected by the stacking sequence. They also identified suitable kenaf fibre, reinforcement construction and resin patterns to meet traditional PASGT helmet specifications at the lowest cost. 32
Green epoxy was used to fabricate the composite with 3D woven preforms by different interlacement patterns. It is seen that composite fabricated from tightly woven preform has higher bending stiffness harvester. 33 Composites were fabricated by para-aramid/epoxy as well as by using the auxetic structure of para-aramid and it was concluded that the auxetic structure absorbs more energy than all other structures regardless of the material composition. 34 Vinyl ester resin was modified by adding biodegradable polymer with different weight ratios and its characterization was done. It was seen from the results that by adding polycaprolactone Tg was decreased as compared to neat vinyl ester resin. Also, by increasing the percentage of polycaprolactone the flexural properties of vinyl ester were decreased. 35 The addition of carbon nanotubes and silica nanoparticles in E-glass/epoxy composite increases impact resistance. It is also seen that the addition of carbon nanotubes is better than silica nanoparticles in terms of energy absorption. 36
Mainly the thermoplastic matrix has high toughness but cannot be mixed with the thermoset matrix due to their passive nature (no-functional group). But the PVB is very different case as it is thermoplastic matrix with hydroxyl functional group. So, it can be blended with thermoset matrix to increase their toughness. As PVB can form bond with the vinyl ester and phenolic. Due to these reasons the blend of PVB with thermoset matrix was investigated.
In literature not, enough data available for matrix optimization regarding through-thickness properties of para-aramid composites. In the current work thermoset, thermoplastic and their blends were used to fabricate the five layers para-aramid composite samples by compression moulding. The Charpy impact, drop weight impact flexural (three-point) as well as hardness testing of the fabricated samples were performed, and their results were compared. One-way ANOVA (Tukey) statistical analysis was used to check the significance of the results.
Materials and methods
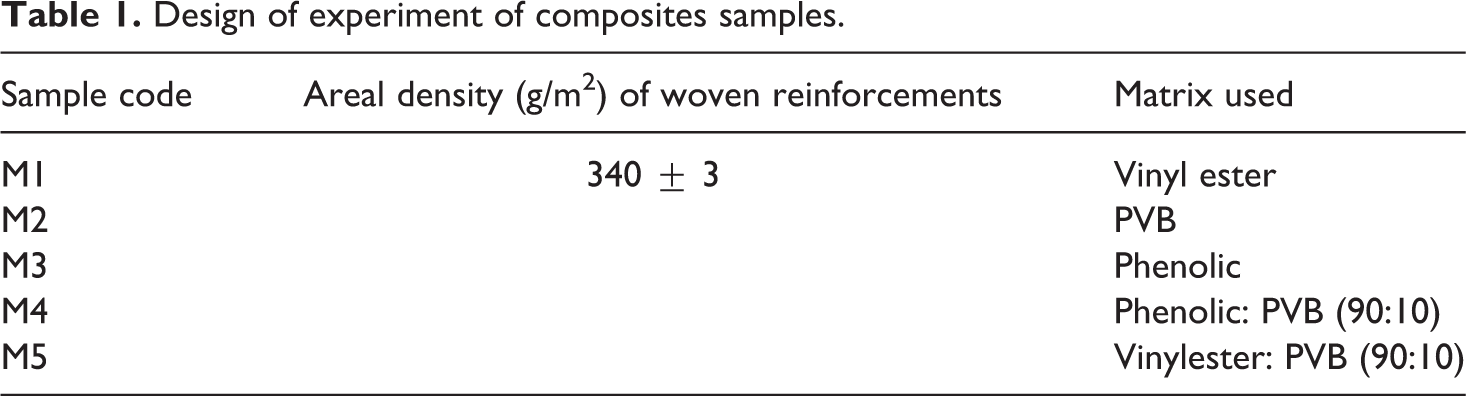
Taparan (Para-aramid of Yantai Tayho Advanced materials Co. Ltd) was used as reinforcement to manufacture the composite samples. The count of used para-aramid was 1000 Denier for both warp and weft. The construction of the fabric used was equal to 15 ends/cm and 15 picks/cm. The final areal density of this ballistic grade Para-aramid fabric was 340 grams/square metre (g/m2) and the interlacement pattern was 1/1.
Five different matrices are used for the manufacturing of composite samples, which were Vinyl ester, Polyvinyl butyral (PVB), Phenol, Phenol, PVB blend and vinyl ester, PVB blend. Vinyl ester resin was used with viscosity 350 cps, the specific gravity of 1.2, tensile strength 76 MPa and tensile modulus 3.2 GPa. Thermoplastic resin Polyvinyl Butyral (PVB) was supplied by Tanyun Junrong (Liaoning) Chemical Research Institute New Materials Incubator Co., Ltd. China. PVB is in white powder form and the viscosity of PVB is 100–200 cps; it contains 72–82% butyral content, 18–25% hydroxyl content, maximum 3% acetate content and its glass transition temperature is 60–70°C. Phenolic resin is a thermoset polymer. A phenolic resin trade name is phenolic resole NR 9430 and PH is 6.5–7.5. The viscosity of phenolic resin between 400 and 700 cps at 25
An electronic cutter was used to cut the Taparan (para-aramid) fabric in 25 cm × 25 cm size, for vinyl ester recipe includes 100 g Vinyl ester, 1.5 g MEKP and 0.1 g Cobalt. The ratio of MEKP and cobalt was 1.5% and 0.1%, respectively. The sample was made by hand layup technique and curing started in 20 minutes. After hand layup and initial curing, the sample was placed in a hot curing press with temperature 145
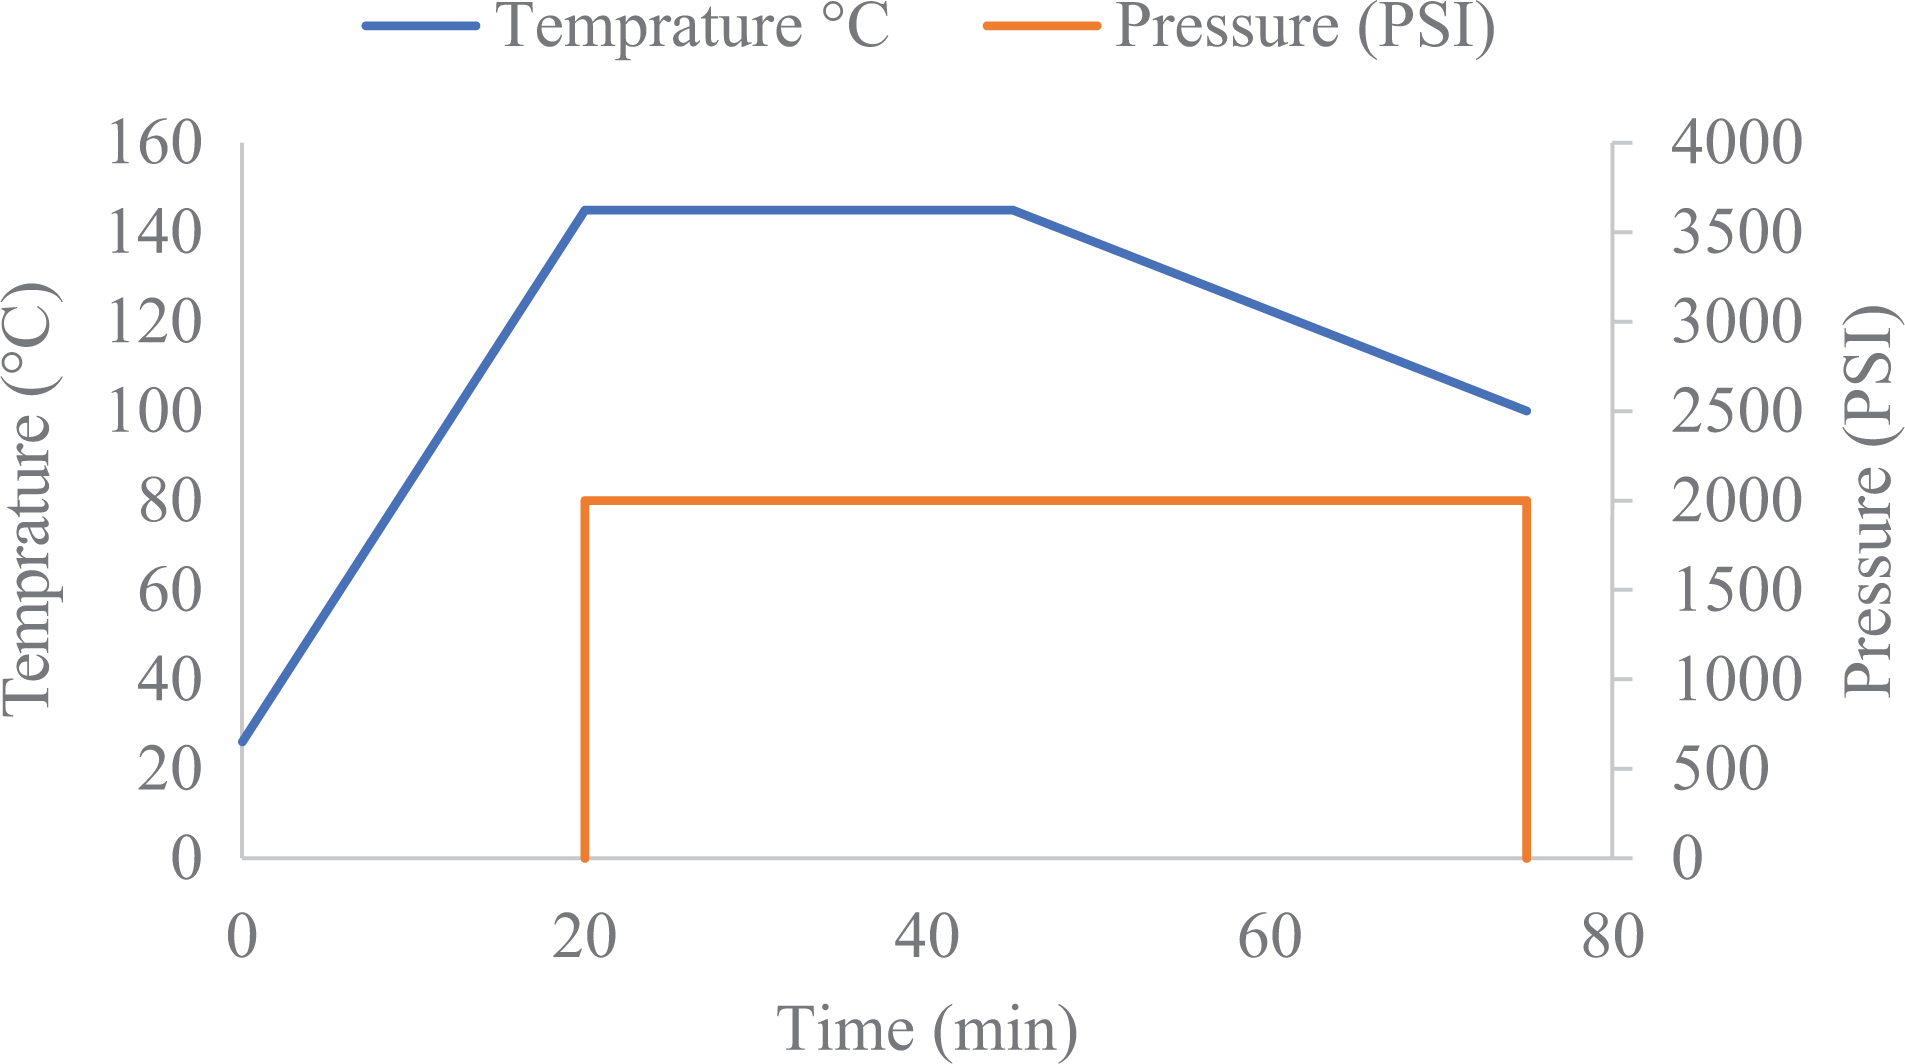
Compression parameters graphical representation.
The flow chart for the manufacturing of composite samples is shown in Figure 2.
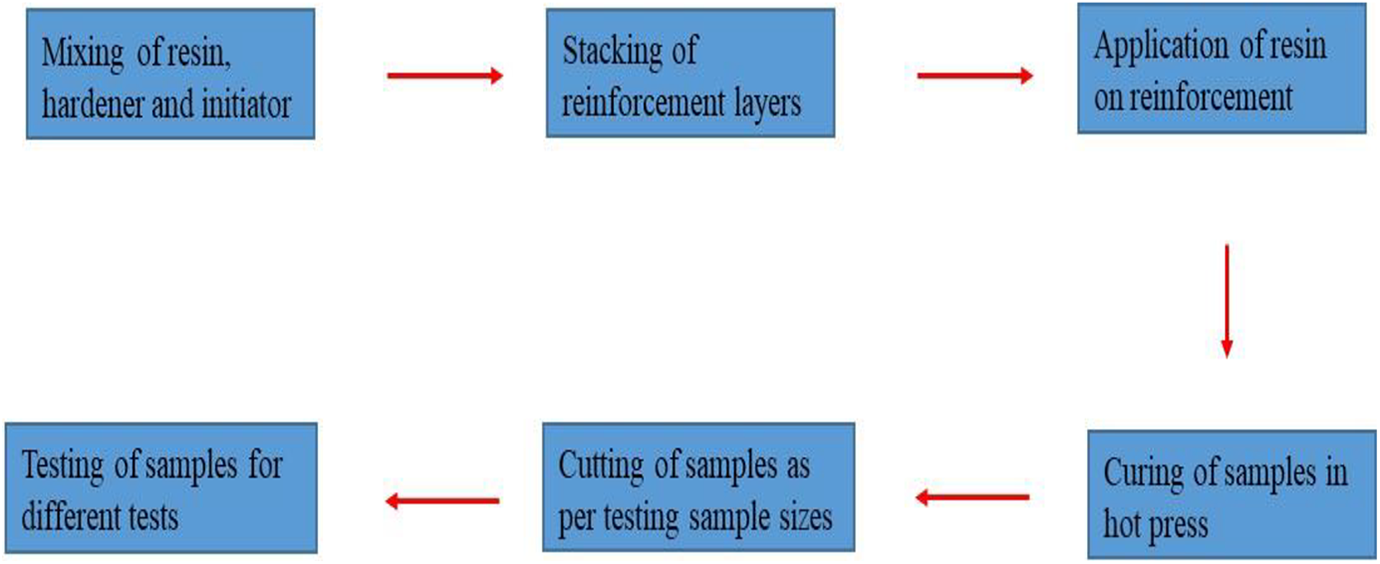
Flow chart of composite manufacturing and testing.
In the case of PVB, the solution of PVB was made in dimethylformamide (DMF) with 100 grams PVB and 300 grams of solvent. The solution was applied to the fabric layers by hand layup technique and put in hot press for curing at a temperature of 180
Design of experiment of composites samples.
The final thickness obtained was 2 mm and the fibre volume fraction obtained was calculated by below Equation 1.
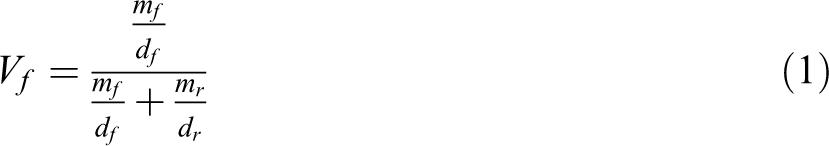
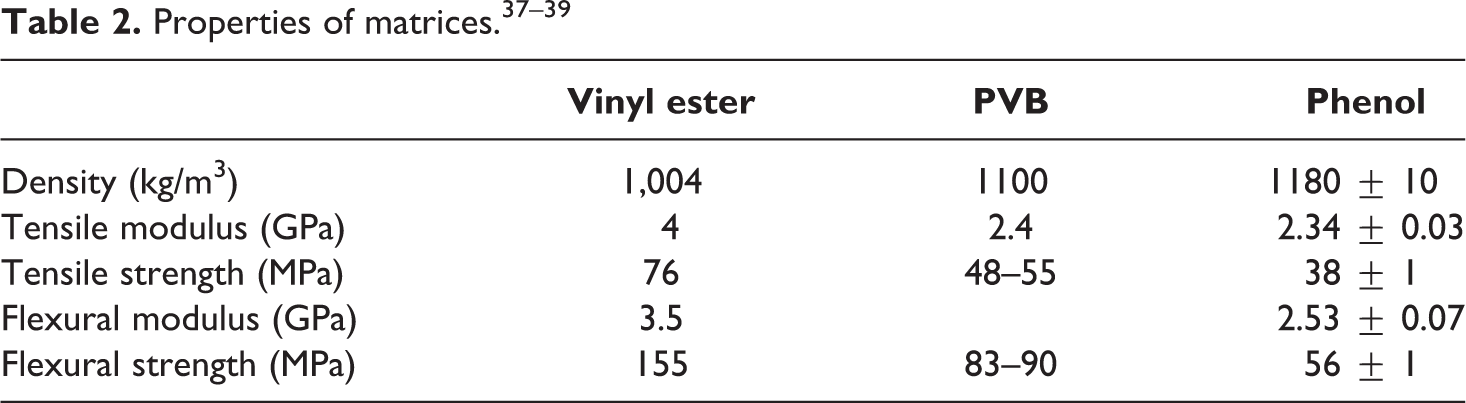
Vf shows the volumetric fraction of fibres, the mass of fibre by mf, the mass of resin by mr, while df, and dr shows fibre density and resin density, respectively, in the final composite manufactured. The properties of matrices used are shown in Table 2.
Testing
Composite samples were tested for impact properties on a drop weight testing machine with a sample of 6 inches × 4 inches as per standard ISO 6603. The machine and fixtures are shown in Figure 3.
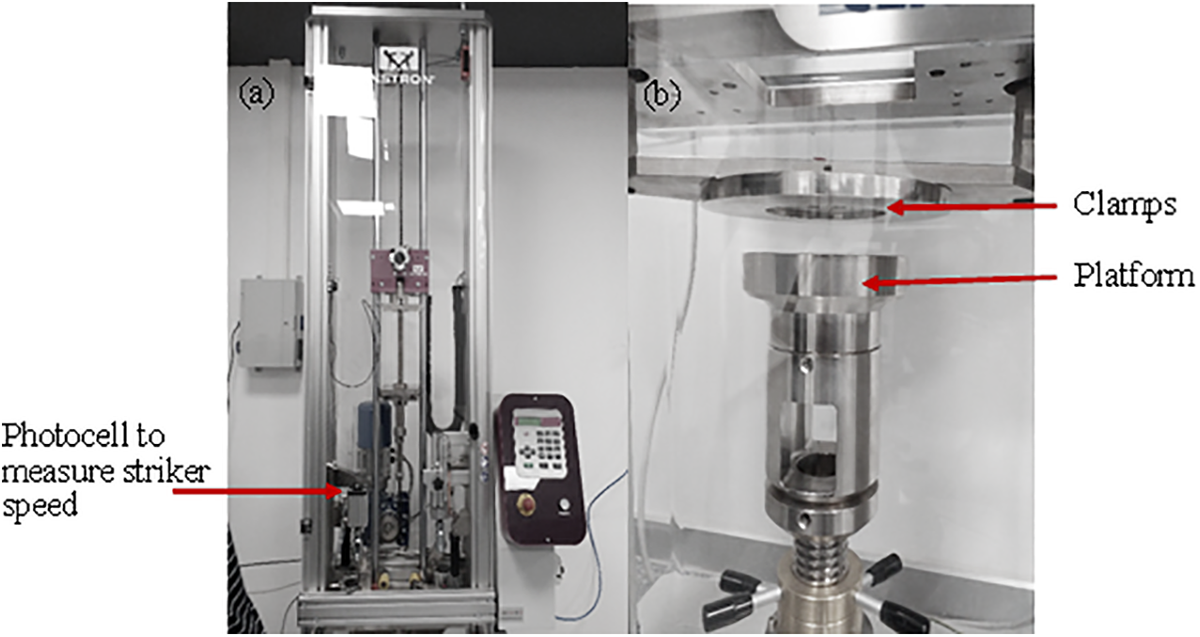
(a) Drop weight machine and (b) clamping jaws.
Charpy impact (test form) tester was used to check the samples impact strength with 80 mm × 10 mm sample size according to standard ISO 179. The machine and fixtures are shown in Figure 4.
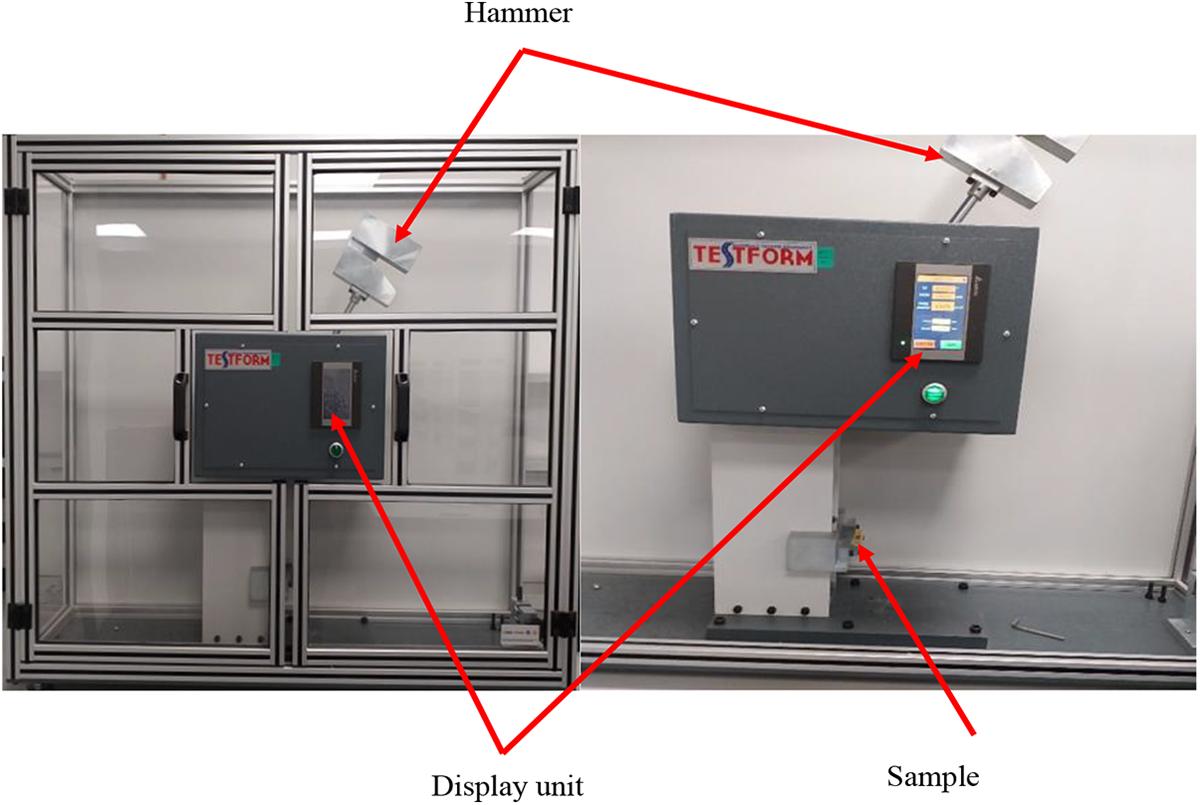
Charpy impact testing machine.
To check the Flexural properties of the manufactured composite samples, flexural strength was checked according to ASTMD 7264 with a sample size of 120 mm × 13 mm on Universal Testing Machine (Z100 all-round, Zwick). The machine used and fixtures are shown in Figure 5.
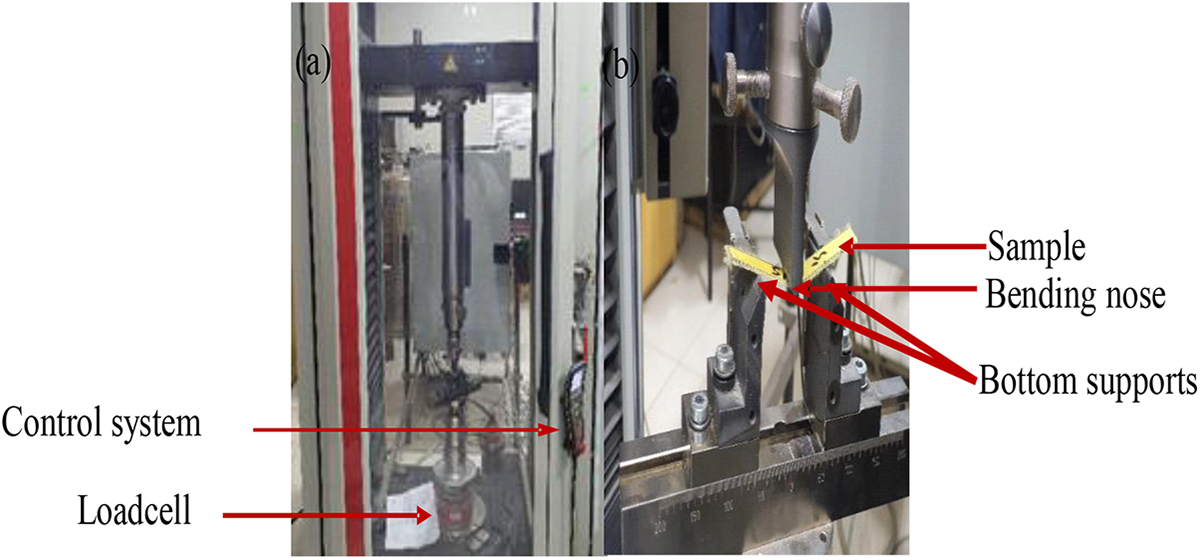
(a) Universal testing machine and (b) flexural testing jaws.
The hardness of the composite sample was tested on the Zwick Roell hardness tester; its picture is shown in Figure 6. The samples were placed in the hardness tester and the upper jaw is pushed by the handle to press the samples. The corresponding value of hardness was noted from the display of the machine. The samples were tested as per ASTM D2240.
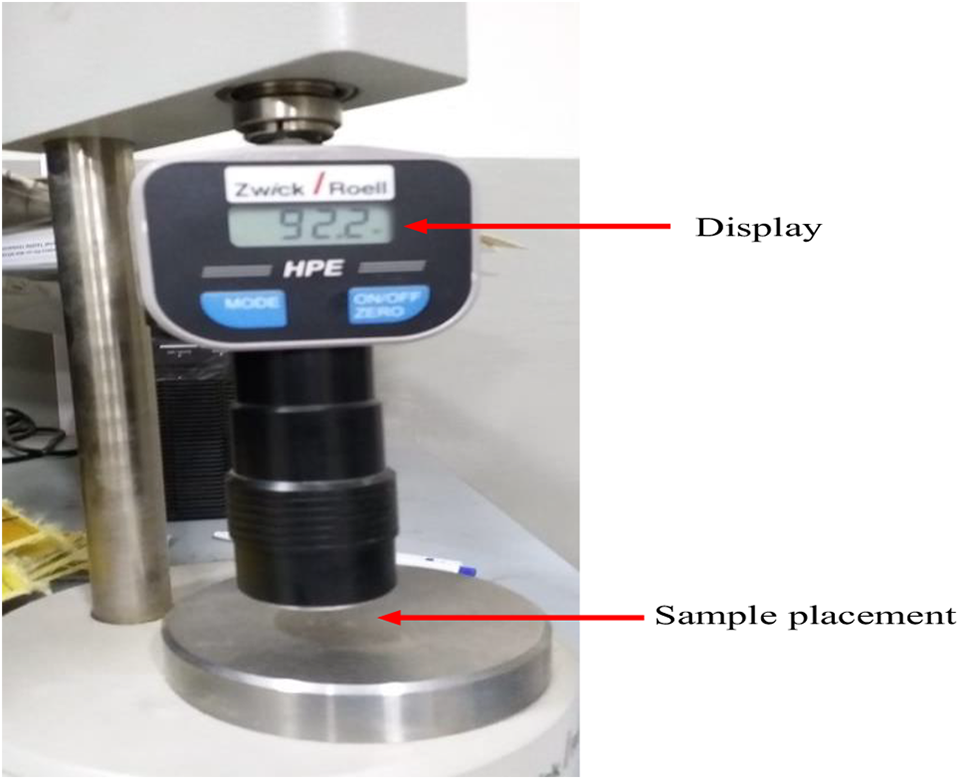
Zwick Roell hardness tester.
Results and discussion
Drop weight impact testing
Despite the fact that the composite samples were tested at maximum available energy (165 J) at drop weight tester, none of the samples were damaged. A dome-shaped permanent deformation (trauma) can be observed in all the tested samples. The size trauma was found different for samples made from different matrices. The diameter and depth of trauma were measured using Vernier calipers. As samples did not break, the values of impact energy correspond to the energy absorbed to create trauma, depth and diameter of trauma and images of samples with trauma are given in Table 3 during the drop weight impact test.
Diameter, depth of dome produced in sample and energy absorbed.
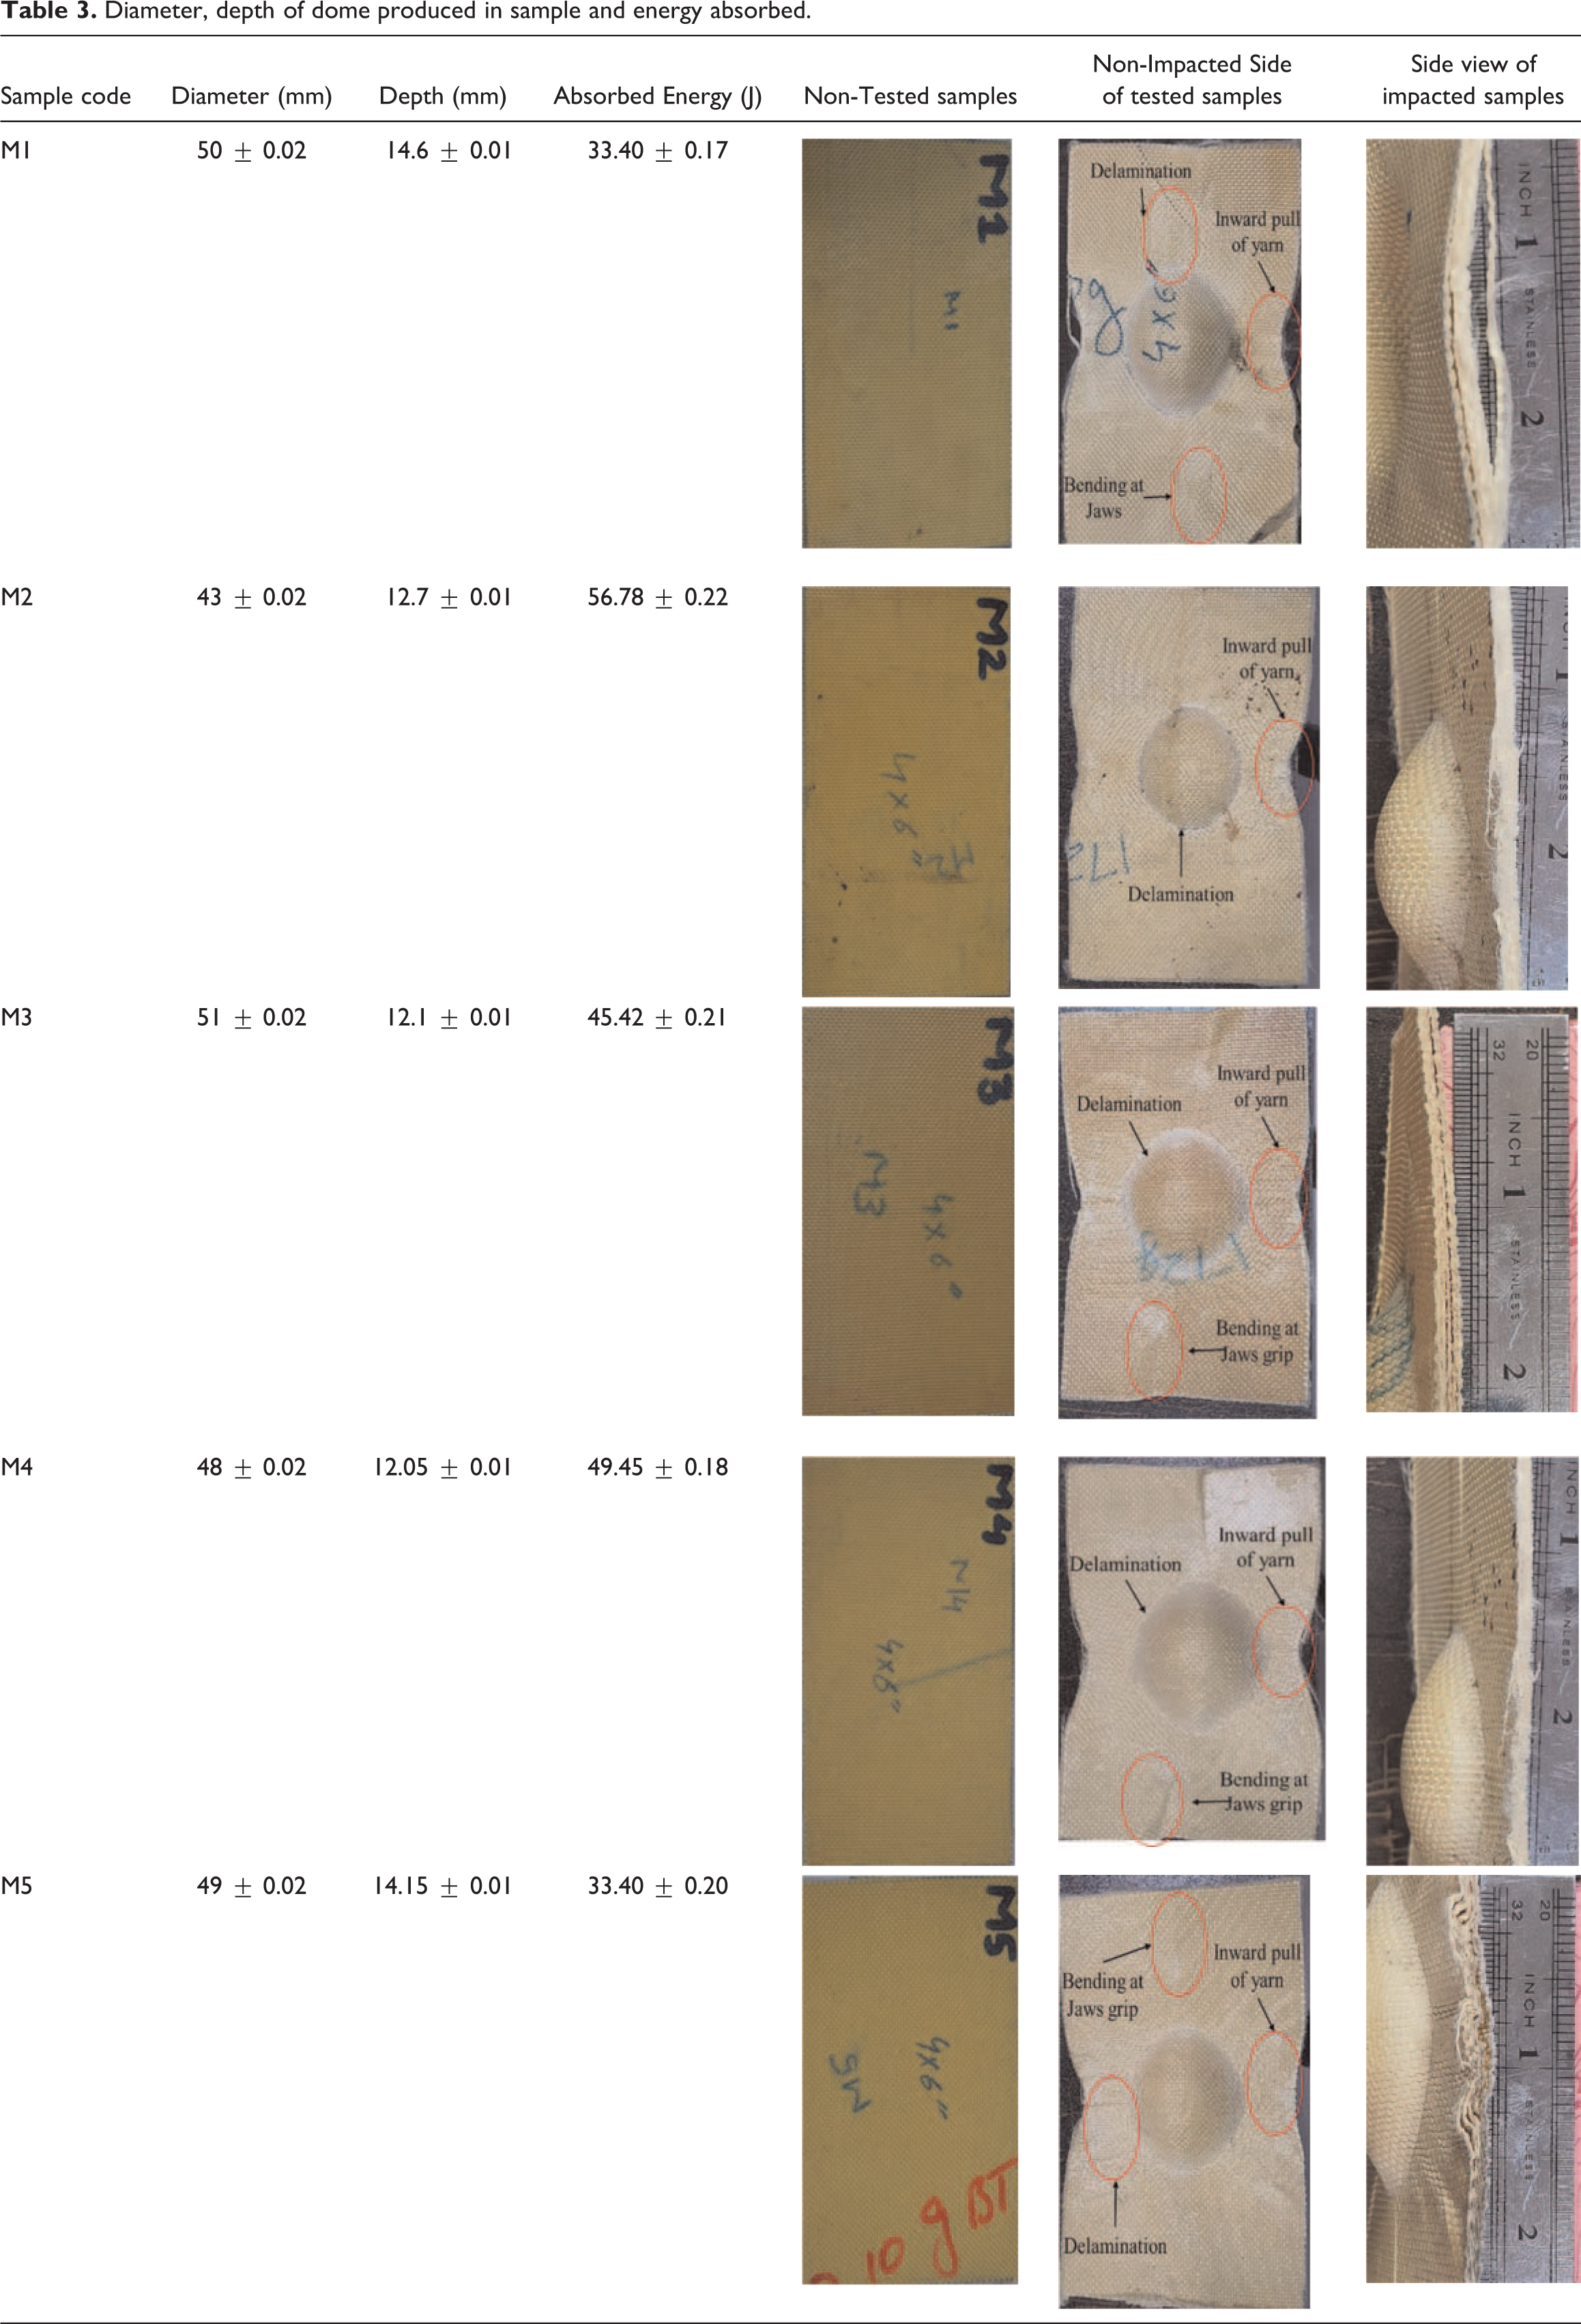
The graphical representation of the depth and diameter of the dome is shown in Figure 7. In Figure 7, it is clear that the depth of all the samples is almost the same while the diameter of M2 was less as compared to all other samples, so its trauma was also less that is an advantage to be used for impact applications.
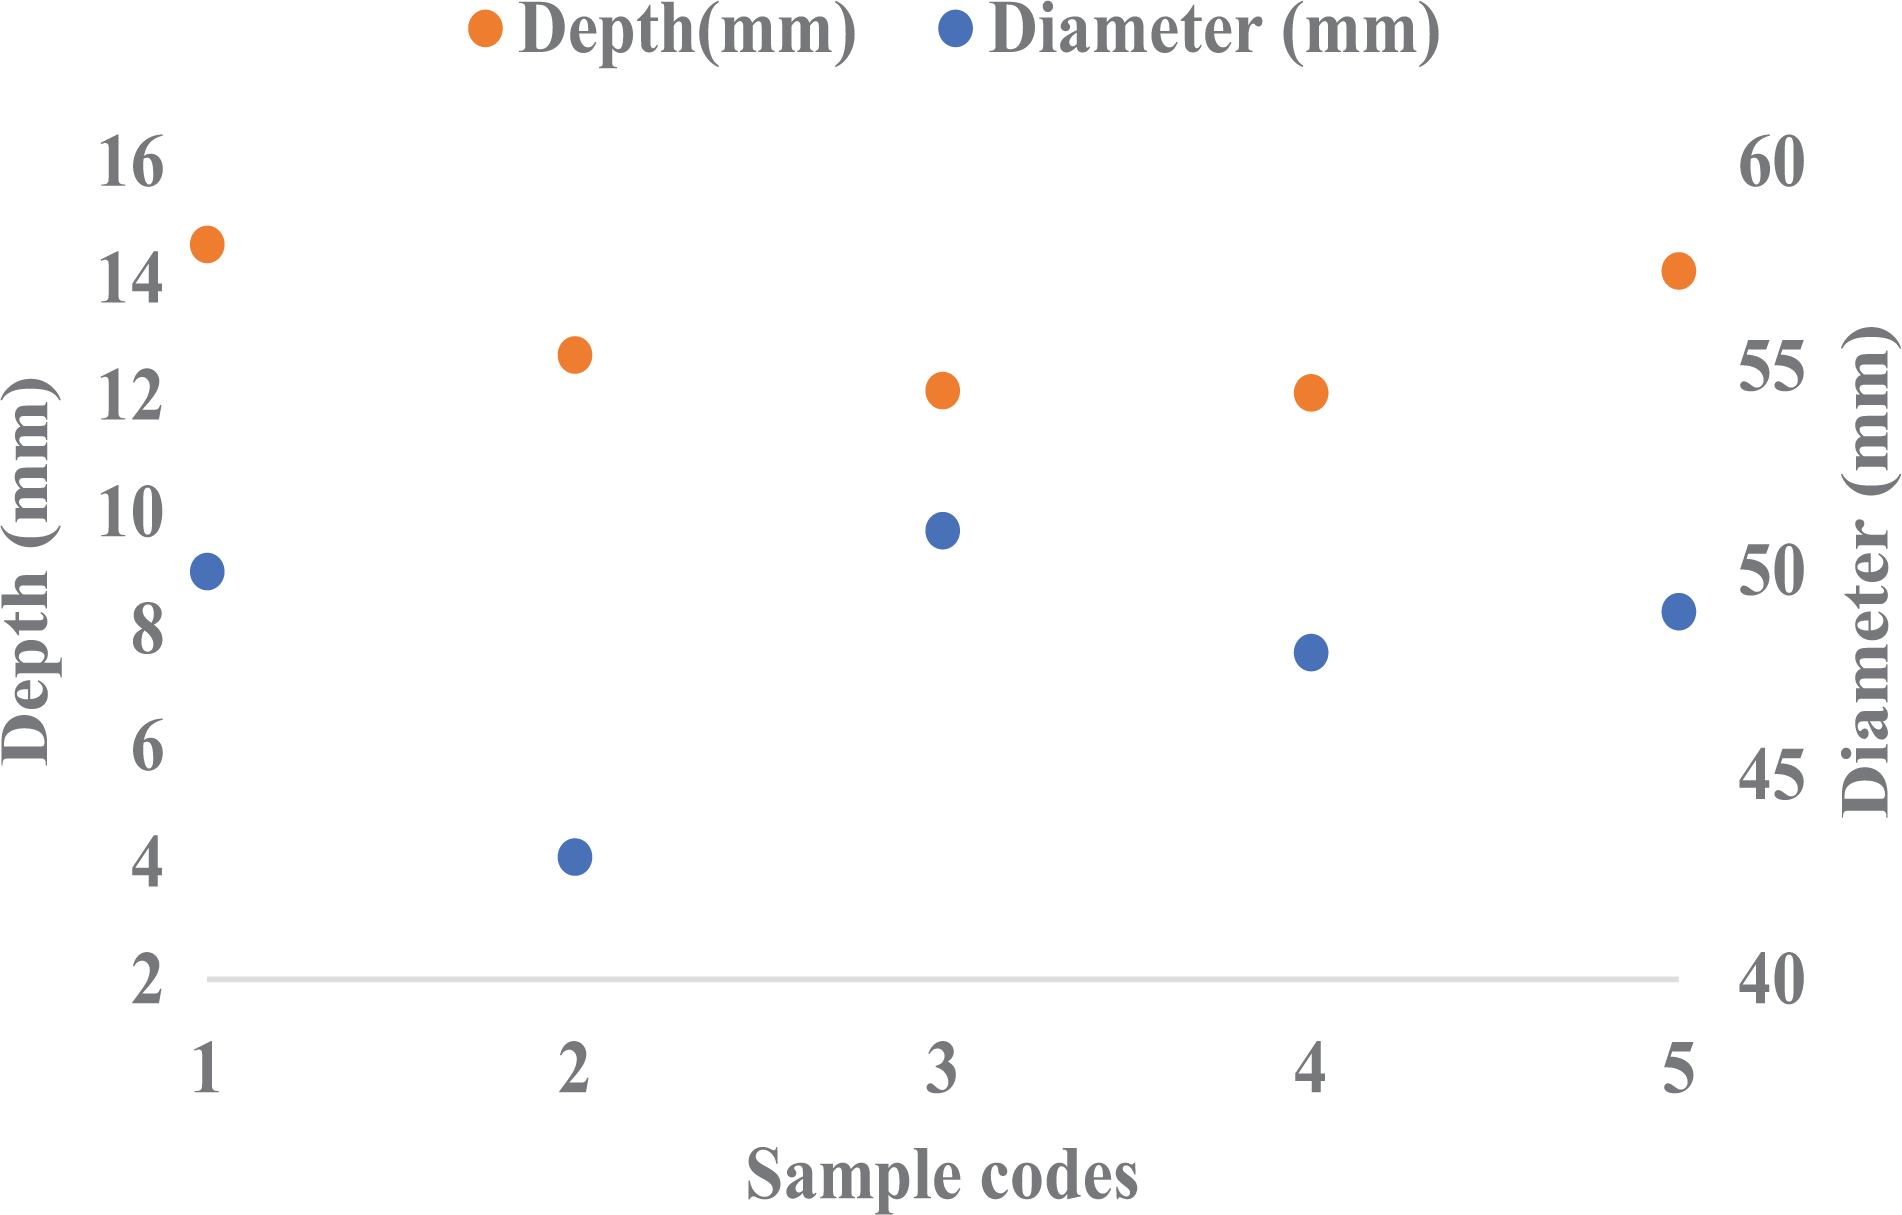
Diameter and depth of dome after drop weight testing.
Force vs. displacement curves obtained from the drop weight test of the tested composite made from five matrices and their blends is shown in Figure 8. The curves show almost linear (excluding peaks) behaviour, and no fracture/ puncture is observed, as discussed earlier. If we compare the maximum value of force achieved by samples during the test, the M1 sample achieved a minimum value of force (5929 N) and M2 achieved maximum force (9523 N) in comparison to other samples. M3 achieves 7781 N, M4 achieves 7602 N, and M5 achieves 6342 N force during the test.
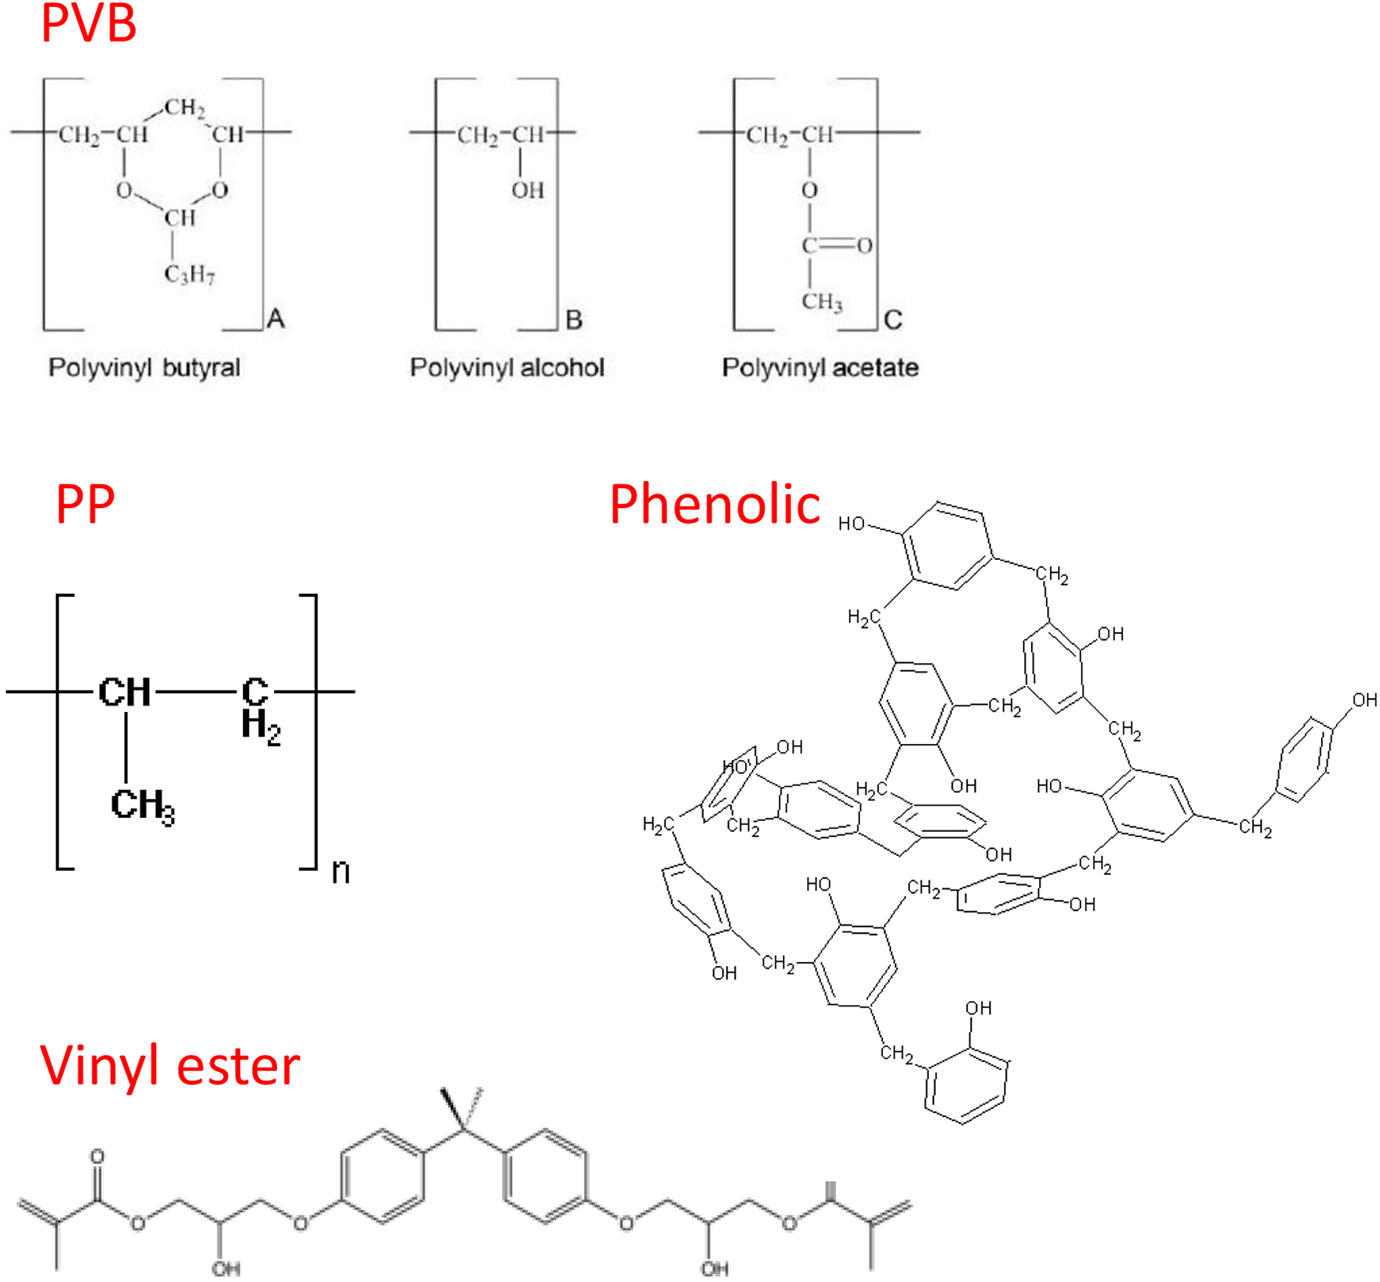
Structures of different matrix.
It is clear from the curves that M2 performs best against impact in all the five matrices so, it can be used in impact applications. The PVB is a thermoplastic matrix with very unique features. It has ability of viscoelastic deformation in case of impact and then dissipate the excess impact energy. So, the layer of PVB act as barrier layer which does not concentrate the impact energy rather dissipate with viscoelastic deformation. Due to this property the PVB is used as an interlayer in laminated glass. So due to this reason PVB has overall better impact performance. While in case of blend of phenolic: PVB and Vinyl ester: PVB the performance was better due to addition of PVB as compared to phenolic and Vinyl ester alone. The PVB has hydroxyl functional groups as shown in Figure 8 on it which form bond with these thermoset resins, so new blend of thermoset with PVB provide additional energy absorption characteristics due to increase in toughness due to PVB. These characteristics results in high impact performance of PVB based composites. 40 The graphical representation of the results was shown in Figure 8. In a comparison of two thermoset resins, M3 performs better than M1, which achieves 1852 N force more than the M1 matrix. While comparing thermoplastic resin and their blends with thermoset best performance was given by M2, which achieves 25.29% more force than the M4 composite sample and 50% more than the M5 composite sample. The curves are almost straight only at one place, as highlighted by the circle in Figure 8 shows a downward peak that may be due to some matrix breakage at that point. The values of force achieve each sample was shown with each curve. Also, these curves show only the elastic region as the samples did not break.
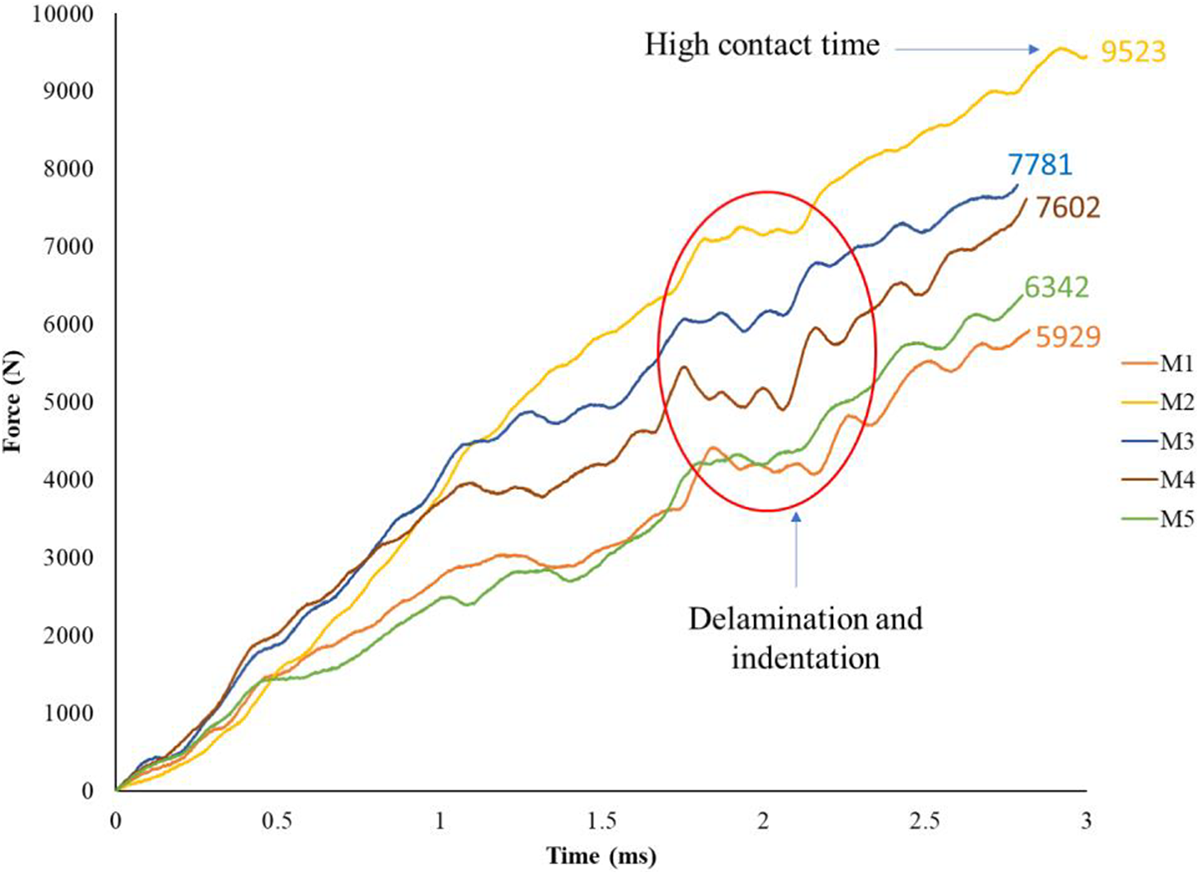
While in the case of force versus time graph, it is showing a similar trend as force versus displacement. In this graph also the M2 matrix gives the best results as compared to all other matrices used in the current study. The graphical representation was shown in Figure 9.
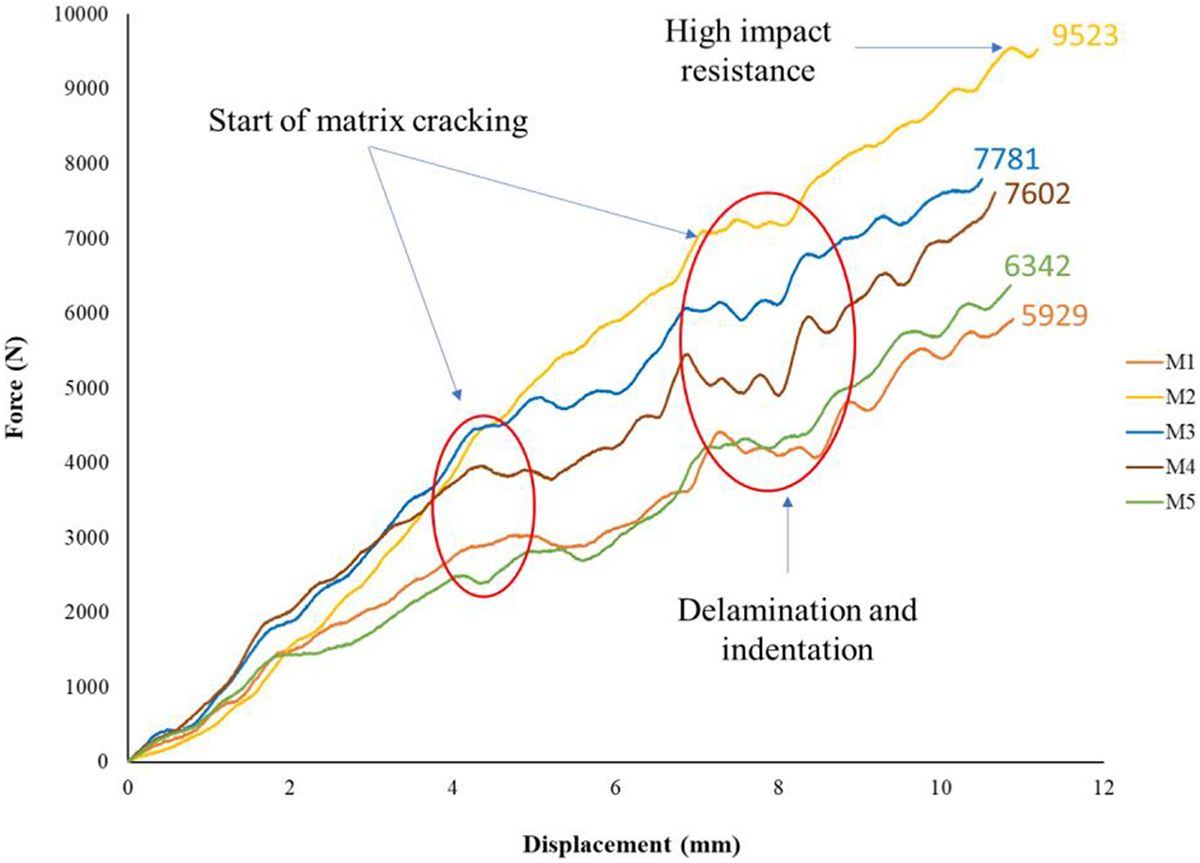
Force versus displacement curves of composites during drop weight impact test.
For the low-velocity impact test the deformation start with matrix crack at micro-level which than pave way to delamination and ultimate fibre failure. The matrix cracking since the first phenomenon of failure so the first slight drop relates to matrix cracking subsequent delamination shows further slopes in the curve. Since there was no rupture or perforation so there was no major drop in the curve was observed. The drop in the curve due to matrix crack often not cause any major dip so it usually relates to slight oscillations.
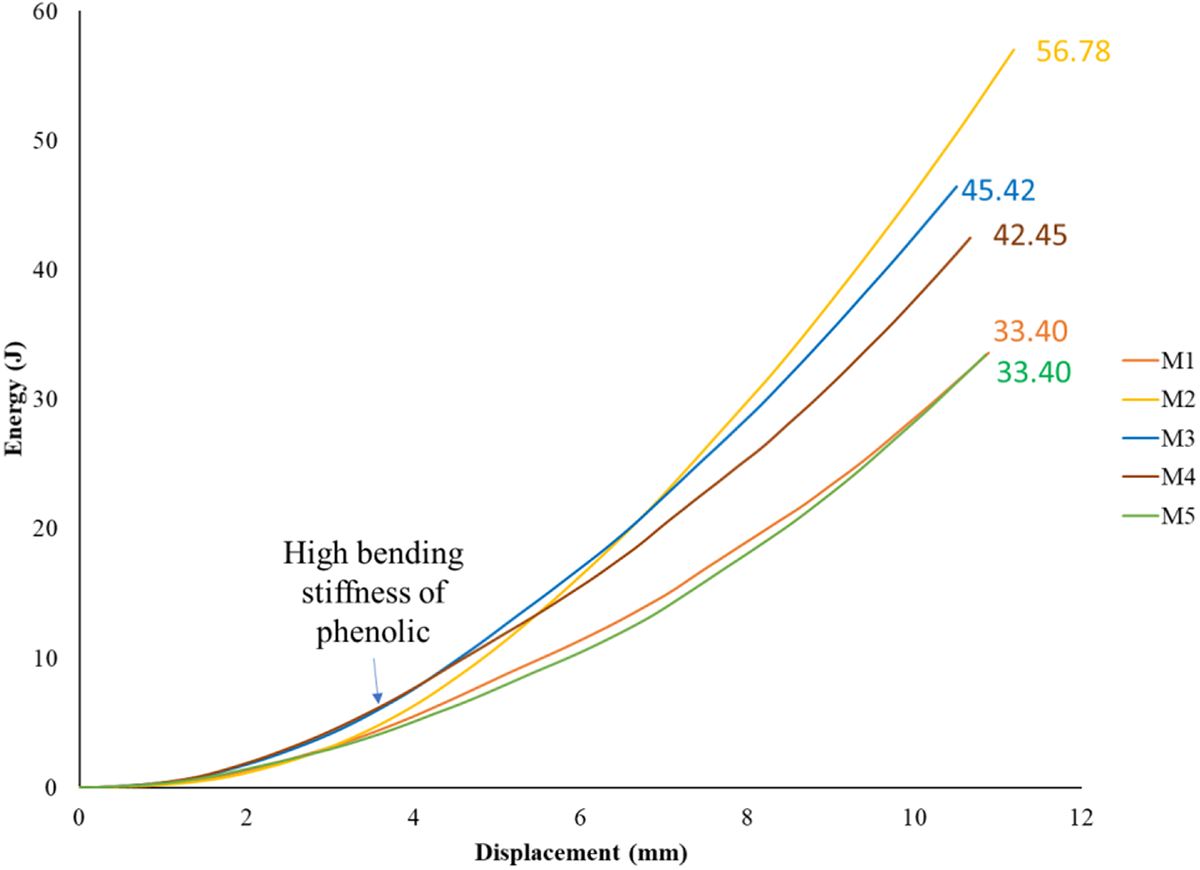
The results of energy versus displacement were shown in Figure 10. It is clear from the curves that the M2 matrix absorbs maximum energy, which is 56.78 J, while M1 and M5 absorb minimum energy, which is 33.40 J. While M3 and M4 absorb 45.42 J and 49.45 J, respectively. In the comparison of thermoset matrices, M3 performs better than M1 and it absorbs 45.42 J energy, which is 35.98% more than M1. While comparing thermoplastic and their blends with thermoset, M2 absorbs maximum energy of 56.78 J, which is 14.82% more than M4 and 70% more than M5. Initially, the M2 requires less energy as compared to other samples due to its matrix better bending properties. The region is circled in Figure 11 and the corresponding energy is marked against the curve of each sample.
Energy versus displacement curves of composites during drop weight impact test.
Force versus time curves of composites during drop weight impact test.
The graphical representation of energy absorbed, and time is shown in Figure 12. Again, the maximum energy absorbed by M2 56.78 J with a maximum time duration of 3 ms and the minimum was by M1 and M5, 33.40 J with a time duration of 2.80 ms. By comparing thermoset and thermoplastic matrices used in this study, thermoplastic matrix M2 absorbed 70% more energy than M1 and M5 while 25% more than M3 and 14.82% more than M4. The highest contact time was achieved in case of M2, which shows its highest impact resistance.
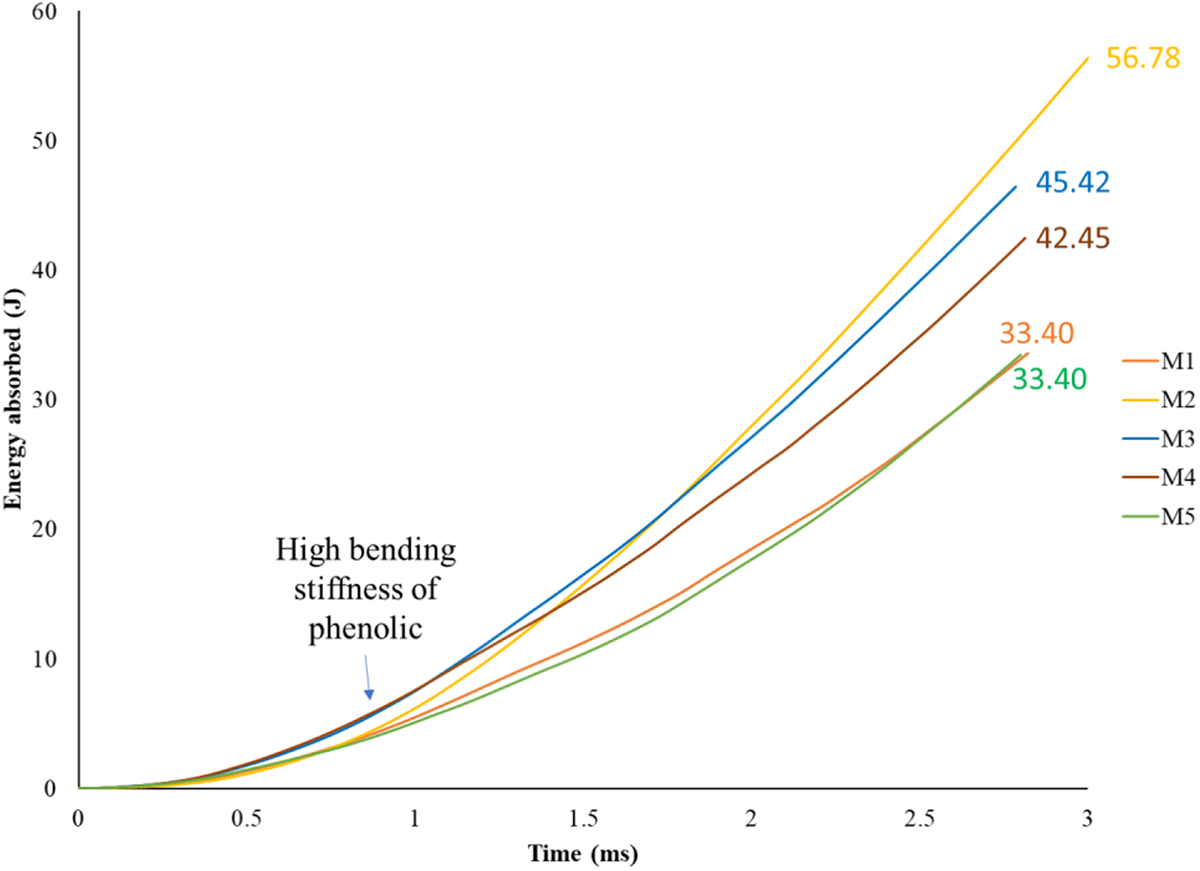
Energy absorbed versus time curves of composites during drop weight impact test.
The PVB matrix is thermoplastic matrix with distinct characteristics. It has ability of viscoelastic deformation in case of impact event. In case the impact energy exceeds the certain limit, it will dissipate that energy by absorbing rather concentration (thermoset). The PVB has high toughness so this characteristic can be incorporated in thermoset matrix (Vinyl ester and phenolic) which are brittle with poor energy absorption characteristics, by blending it with thermoset resin. As both PVB and thermoset matrix (Vinyl ester and phenolic) has functional groups so they can form bond easily. The new blend will have high toughness as compare to simple thermoset matrix.
Statistical analysis
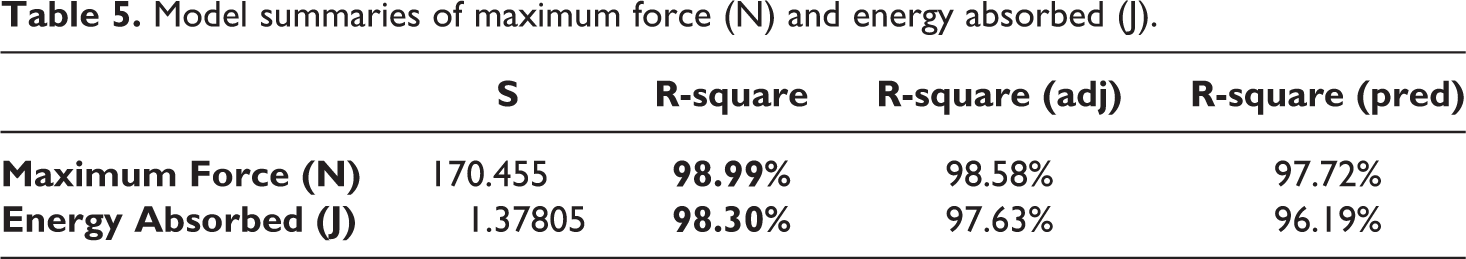
Analysis of variance results and model summaries (R-squares) of One-Way ANOVA (Tukey) statistical analysis of maximum force and energy absorbed during drop weight impact testing are given in Tables 4 and 5, respectively. P-values showed that with the change in matrix type, drop weight impact testing results, i.e. maximum force and energy absorbed, were also changed. This change in the results was statistically significant because the p-value for each response was less than 0.05. Furthermore, the p-value for each drop weight impact testing result was equal to zero, which showed that the effect of change in matrix type on each test result was highly significant. Moreover, R-square percentages against each result were more than 98%, as given in Table 5. R-square is the variation % in the response as per model. So, the higher the percentage of R-square during statistical analysis, the higher will be the accuracy and dependency of the model.
Analysis of variance results of maximum force (N) and energy absorbed (J).
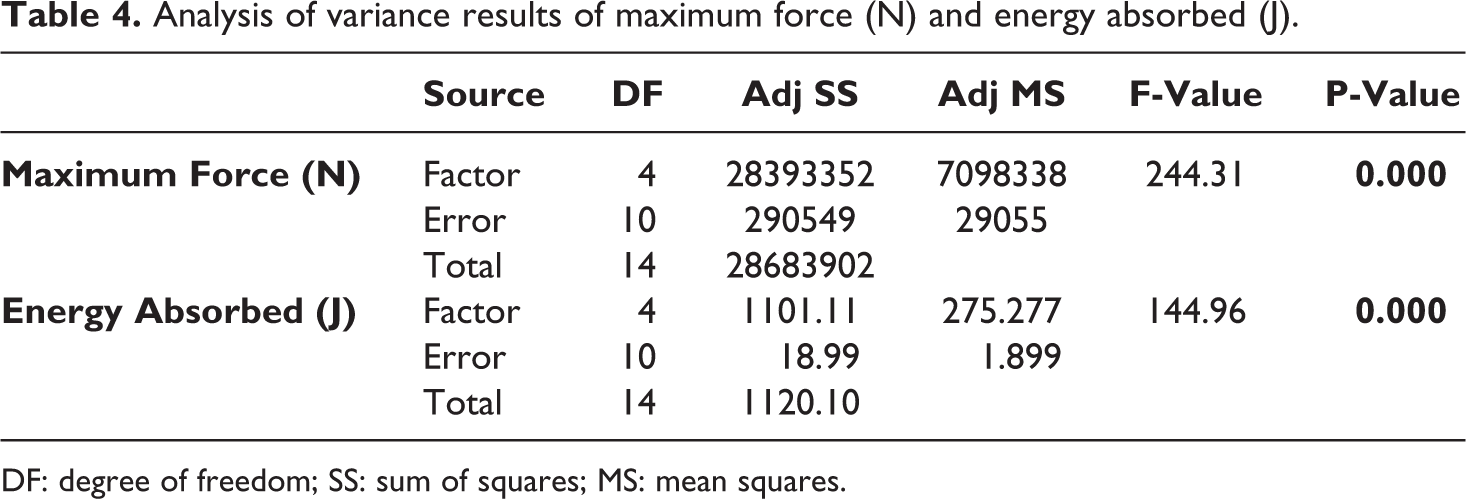
DF: degree of freedom; SS: sum of squares; MS: mean squares.
Model summaries of maximum force (N) and energy absorbed (J).
Interval and Tukey simultaneous plots for maximum force and absorbed energy are shown in Figures 13 and 14, respectively. The Interval plot showed the range of results for the drop weight impact test, while Tukey comparison results are used to testify the significance difference between a pair of groups. The Tukey plot showed that the confidence intervals for those differences between the means, which do not include zero in their range, are significant.
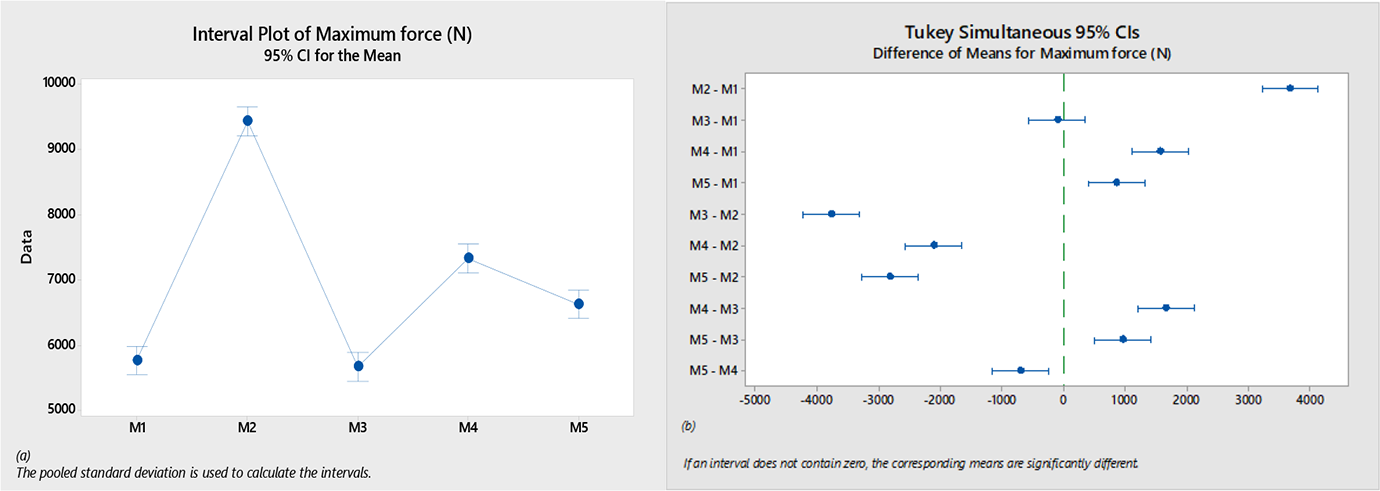
Maximum force (drop weight): (a) interval plot and (b) Tukey simultaneous plot.

Energy absorbed (drop weight): (a) interval plot and (b) Tukey simultaneous plot.
The interval plot showed that out of five (5) intervals, only first (M1) and third (M3) intervals in maximum force overlap each other showing the differences between the means were not statistically significant. While all remaining intervals in maximum force did not overlap with anyone, therefore, the difference in their means was significantly different, as shown in Figure 13(a). Similarly, Tukey plot showed that the one (01) pair in maximum force include zero in the mean values of their confidence intervals as shown in Figure 13(b), which showed that the differences between the means of these pairs were not significant. All remaining confidence intervals did not include zero in the pair of means, which showed that the differences between the pair of means were significant.
Similarly, the interval plot of absorbed energy showed that out of five (5) intervals; first (M1) and third (M3), and fourth (M4) and fifth (M5) intervals in absorbed energy overlap each other, showing the differences between the means were not statistically significant. While remaining second (M2) interval in absorbed energy did not overlap with anyone. Therefore, the difference in their means was significantly different, as shown in Figure 14(a). Similarly, Tukey plot showed that the two (02) pairs in absorbed energy include zero in the mean values of their confidence intervals as shown in Figure 14(b), which showed that differences between the means of these pairs were not significant. All remaining confidence intervals did not include zero in the pair of means, which showed differences between pair of means were significant.
Pendulum (Charpy) impact testing
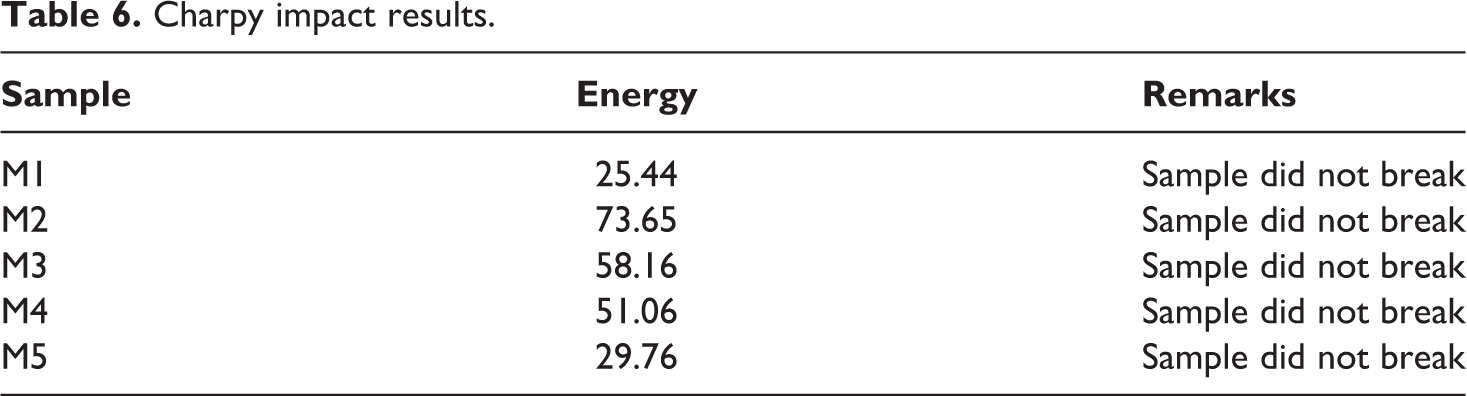
The results of the Charpy impact test are shown the Figure 15. From the graph, it is clear that M1, M2, M3, M4 and M5 absorb 25.44 kJ/m2, 73.65 kJ/m2, 58.16 kJ/m2, 51.06 kJ/m2 and 29.76 kJ/m2, respectively. It is seen that by comparing the thermoset matrices, the M3 absorbs 128.61% more impact energy than M1. While comparing thermoplastic matrix and their blend with thermoset, the M2 thermoplastic matrix absorbs 44.24% more than M4 and 147.47% more than M5. So, in both the thermoset and thermoplastic matrices, the M2 thermoplastic matrix performs the best from all the matrices used in the current study.
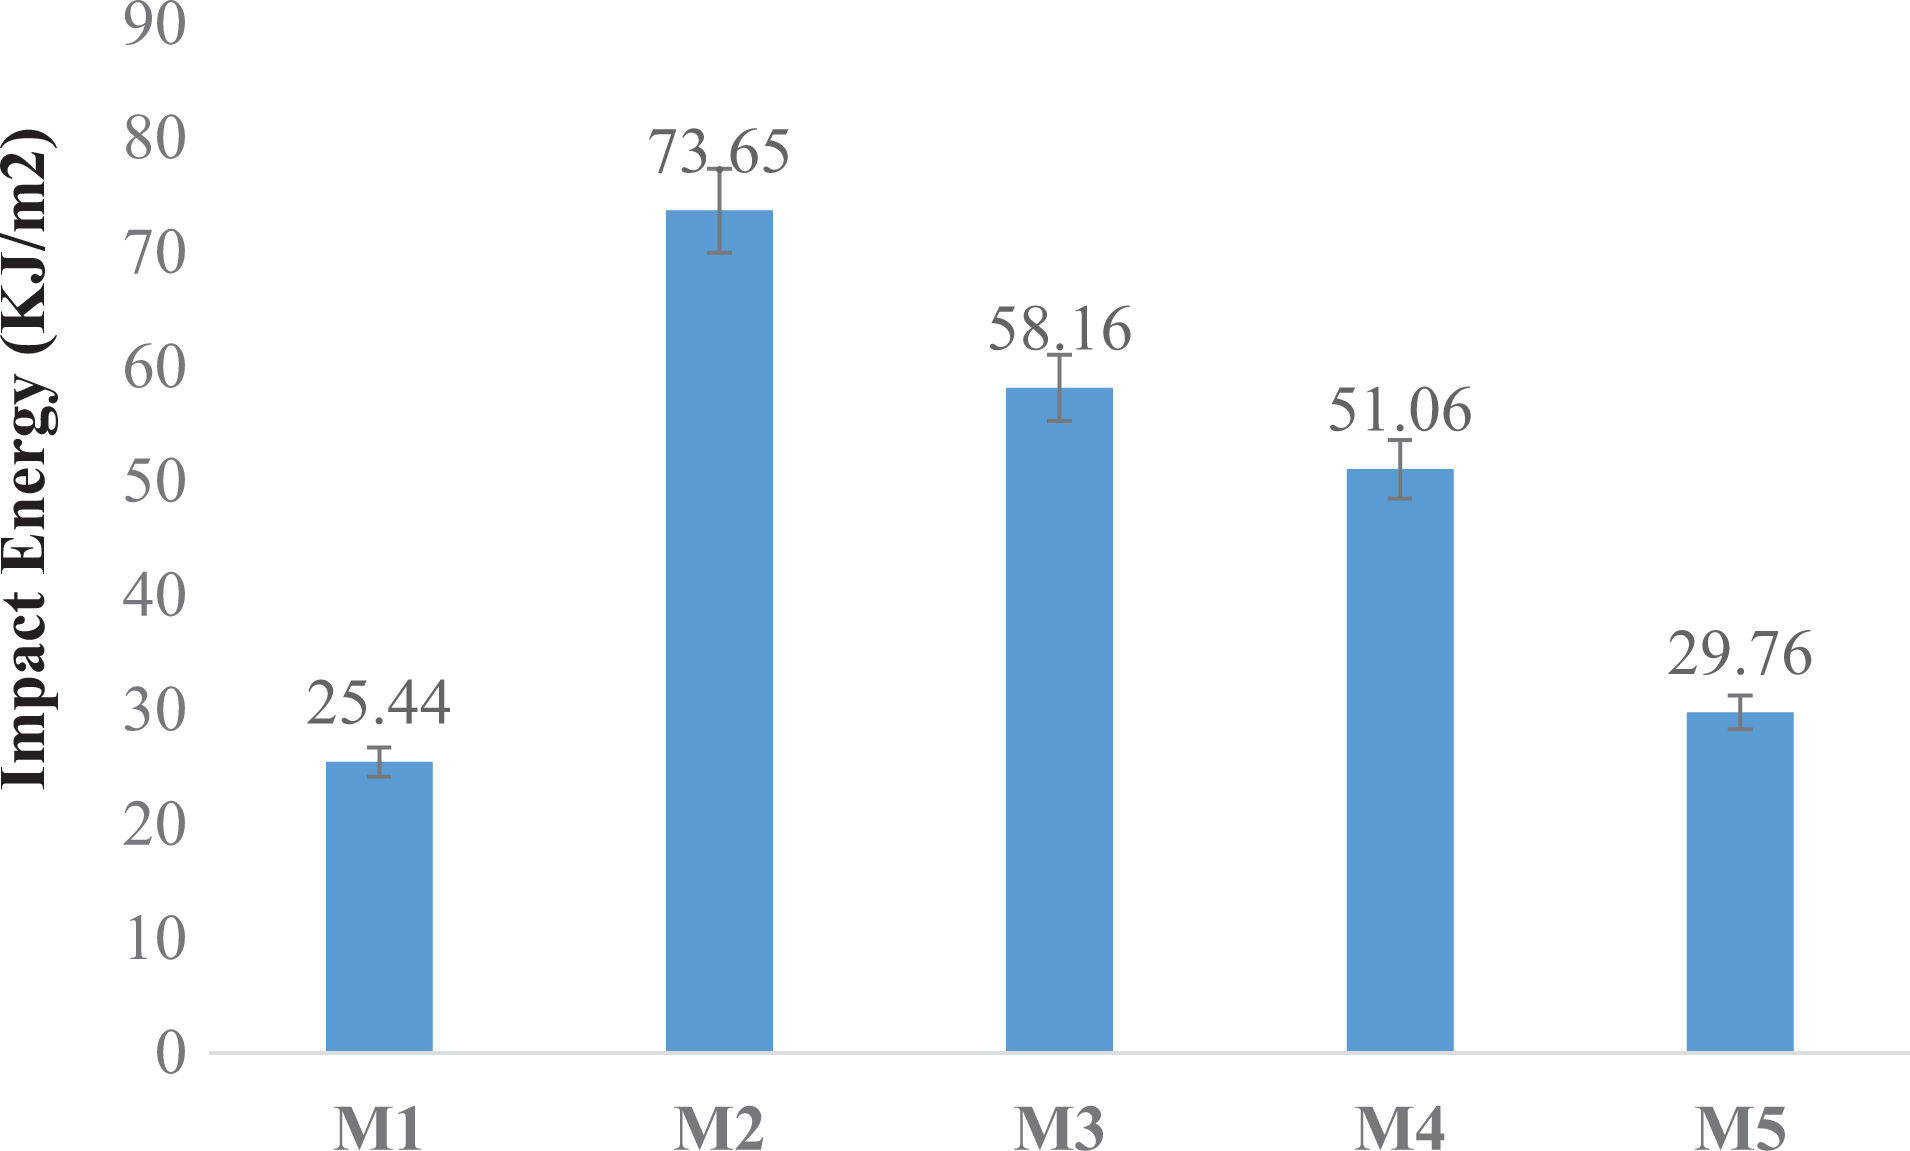
Impact energy absorbed by different matrices during Charpy impact test.
The pictures for Charpy impact samples after testing was shown in Figure 16. From the picture, it is clear that after hitting the Striker pendulum of the Charpy impact machine, there is delamination of layers as well as bending of the sample from the original position. This delamination and displacement from the original position result in energy absorption. The energy absorbed during the Charpy impact test is given in Table 6.
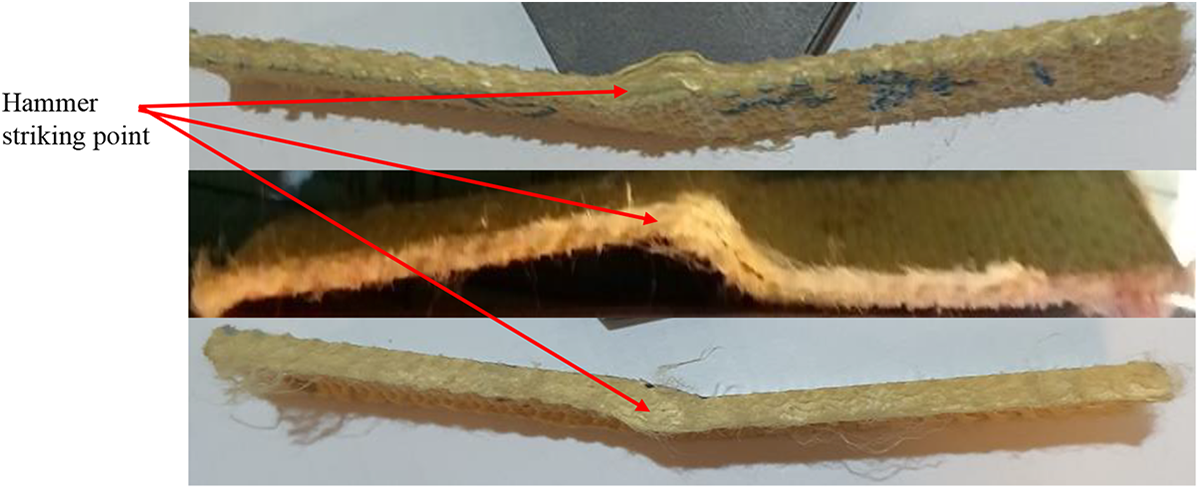
Morphology of samples after Charpy impact testing.
Charpy impact results.
Statistical analysis
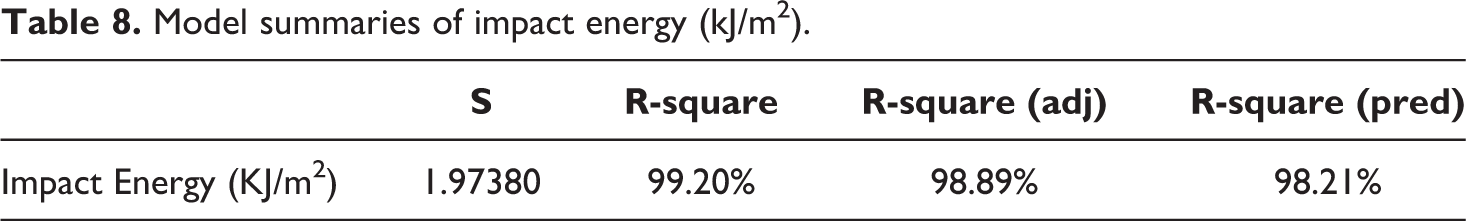
Analysis of variance results and model summaries (R-squares) of One-Way ANOVA (Tukey) statistical analysis of Charpy impact energy are provided in Tables 7 and 8, respectively. P-values showed that with the change in the matrix type, impact energy values were also changed. This change in the results was statistically significant because the p-value was less than 0.05. Furthermore, the p-value was equal to zero, which showed that the effect of change in matrix type on impact energy of composites was highly significant. Moreover, R-square percentages against impact energy were more than 99%, as given in Table 8. The higher the percentage of R-square during statistical analysis, the higher will be the accuracy and dependencies of the model.
Analysis of variance results of Charpy impact energy (kJ/m2).
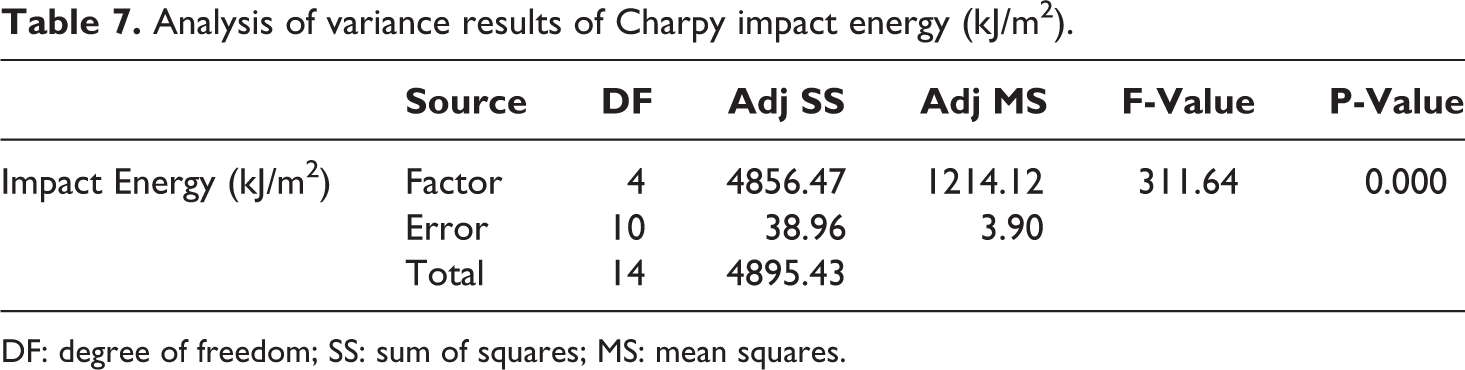
DF: degree of freedom; SS: sum of squares; MS: mean squares.
Model summaries of impact energy (kJ/m2).
Interval and Tukey simultaneous plots of Charpy impact energy for different matrix types are shown in Figure 17. The interval plot for impact energy in Figure 17(a) showed that none of the five (5) intervals was overlapping with each other highlighting the difference in means of all these intervals was significantly different. The Tukey plot for impact energy is shown in Figure 17(b). The all, the confidence intervals for different matric types, did not include zero in the pair of means, which showed that the differences between the pair of means were significant. So, the effect of change in matrix type on the impact energy was statistically significant.
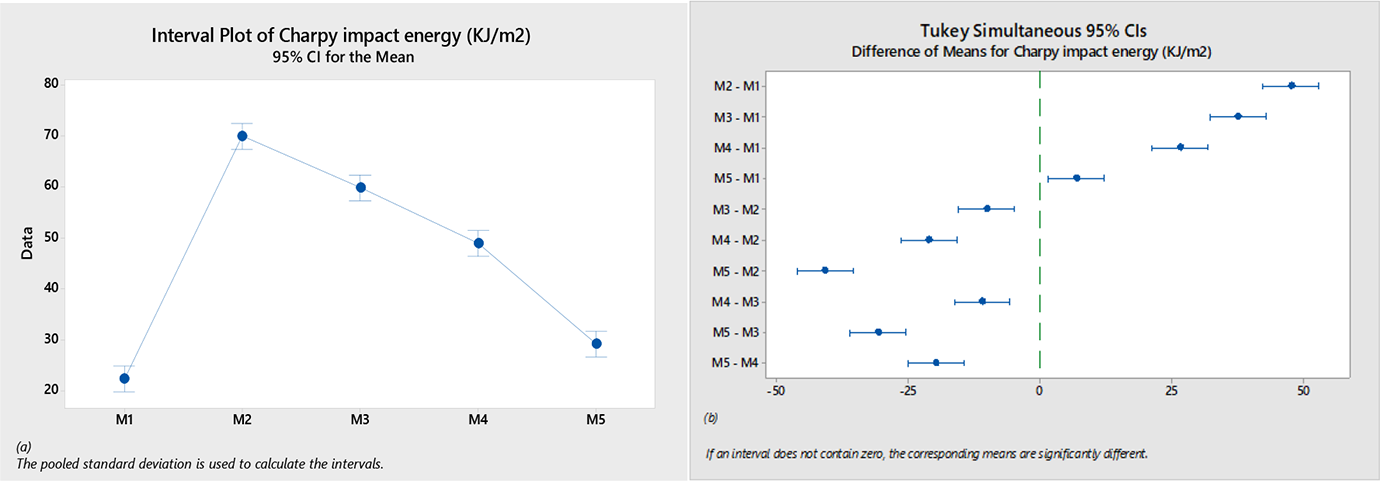
Impact energy (Charpy): (a) interval plot and (b) Tukey simultaneous plot.
Flexural (three-point) testing
The flexural strength of M1, M2, M3, M4 and M5 was found equal to 21 MPa, 80 MPa, 52 MPa, 58 MPa and 33 MPa, respectively. By comparing only thermoset resins used, the M3 has 147% more flexural strength than M1, while comparing thermoplastic and their blends with thermoset, M2 has 37.93% more flexural strength than M4 and 142.42% more than M5.
The reason behind the better flexural strength of the M2 sample was its bending properties. So again, the M2 matrix gives the highest flexural strength results as compared to all other matrices used in the current study. The graphical representation of the flexural strength results is shown in Figure 18.
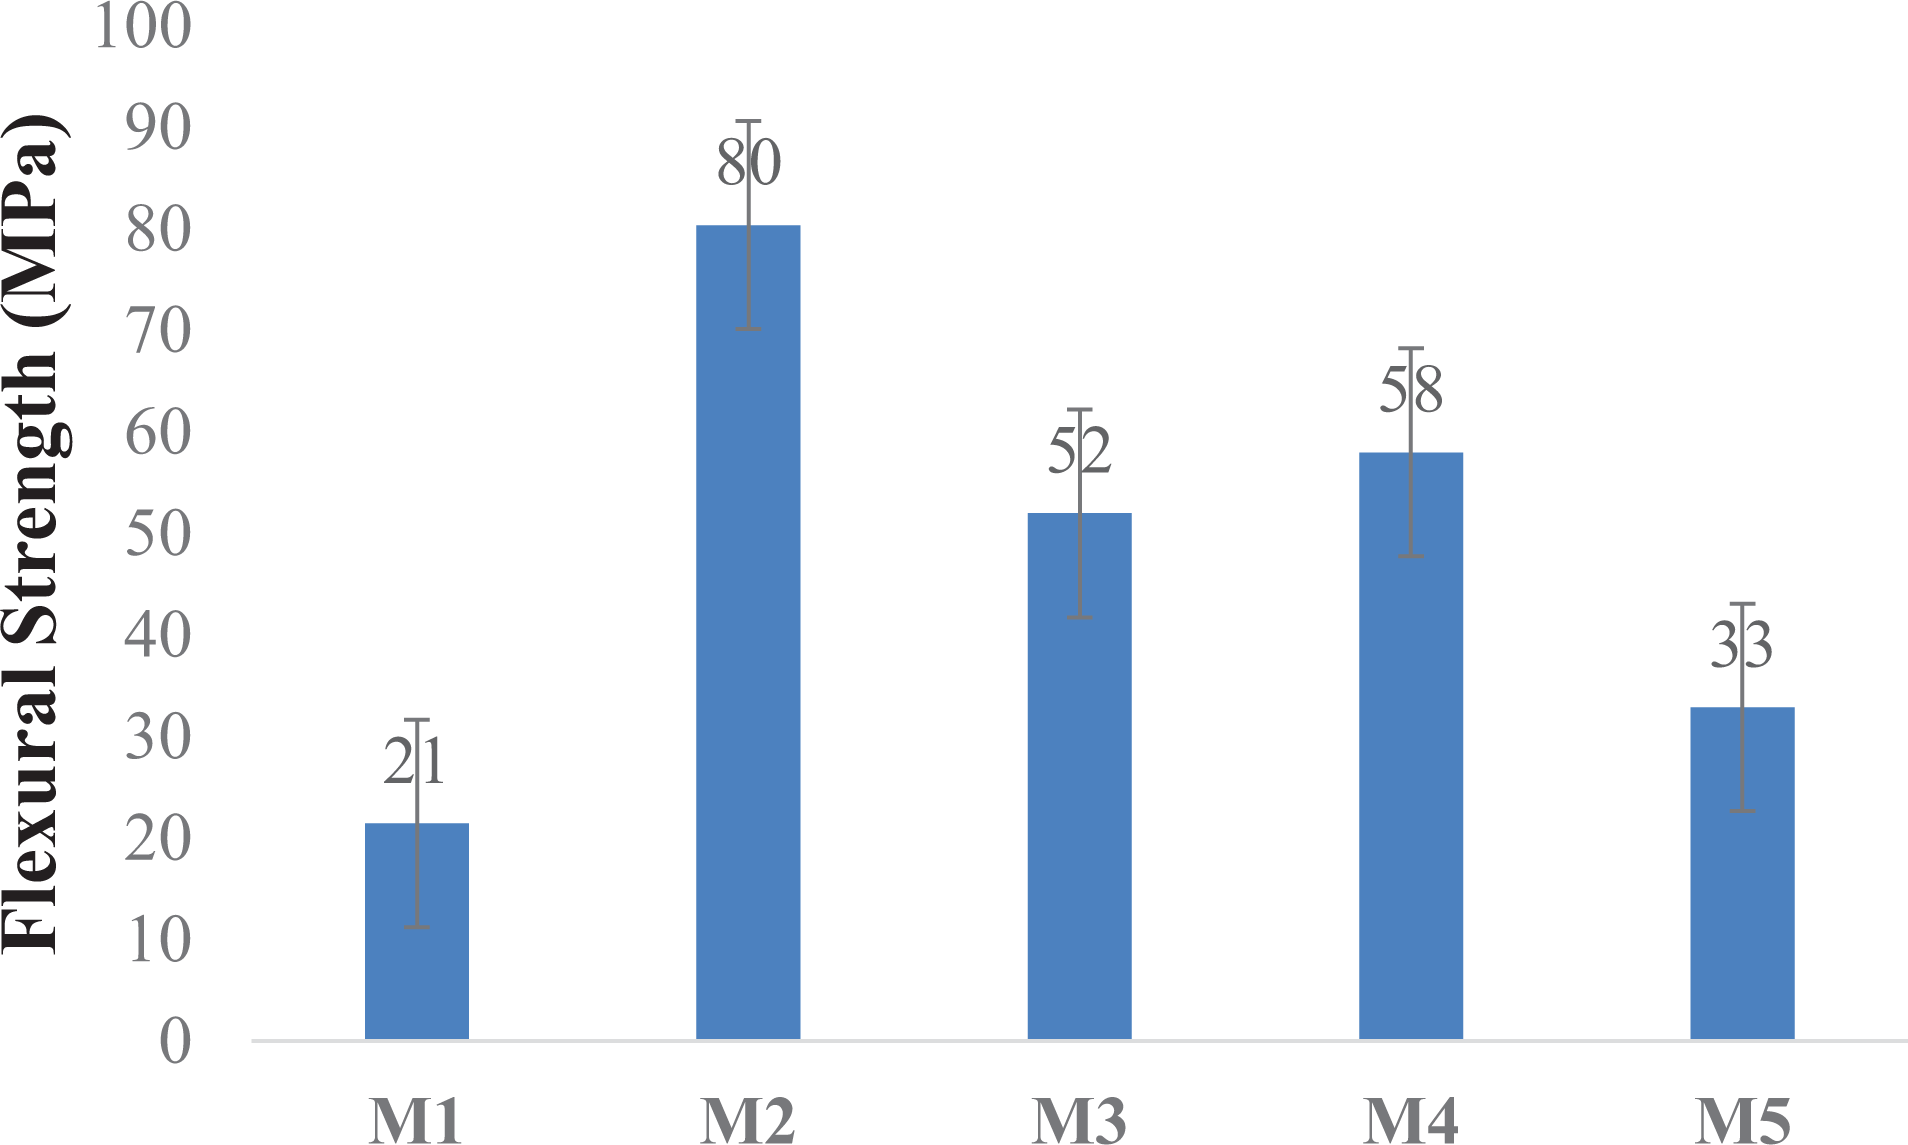
Flexural strength of composites samples.
While the flexural modulus was 1600 MPa, 5186 MPa, 3809 MPa, 3264 MPa and 2756 MPa for M1, M2, M3, M4 and M5, respectively, again, by comparing thermoset matrices, the M3 has 138% more flexural modulus than M1. By comparing thermoplastic matrix and their blends with thermoset matrices, M2 has 58.88% and 88.17% more flexural modulus than M4 and M5, respectively. The graphical representation of flexural modulus was shown in Figure 19.
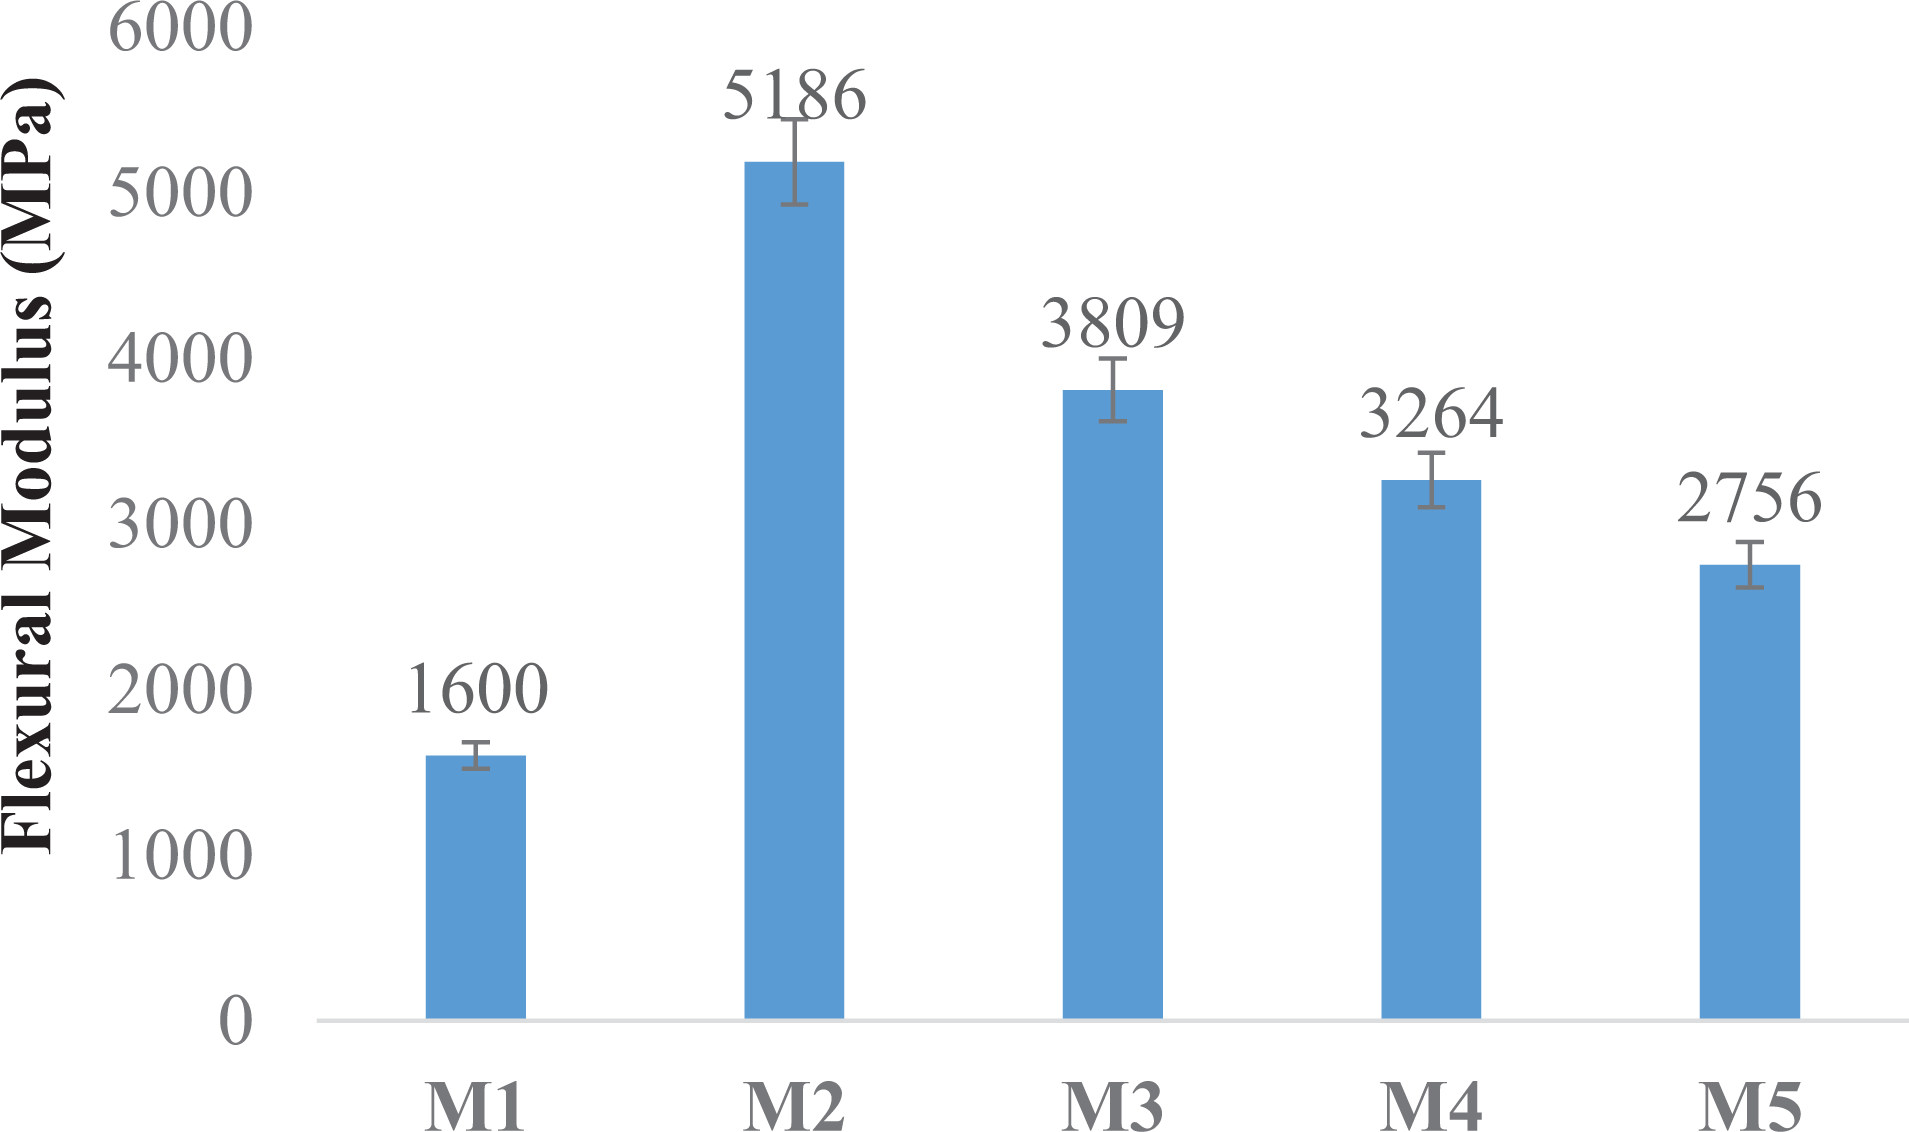
Flexural modulus of composite samples.
Flexural testing sample pictures before and after testing, as well as microscopic images after testing, were shown in Figure 20. It can be seen in pictures that the samples absorb the bending force by delamination of composite layers and displacement from the original position. More energy is absorbed by the sample, which delaminates more and whose displacement is more from the original position.
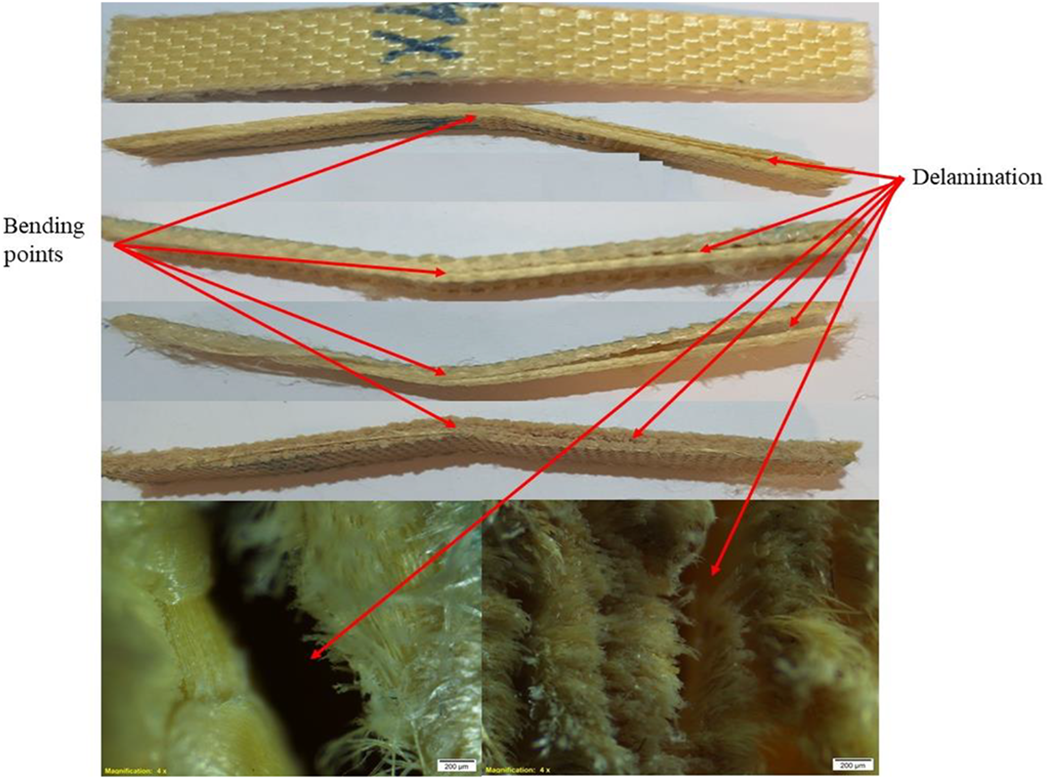
Morphology of composite samples after flexural testing.
Statistical analysis
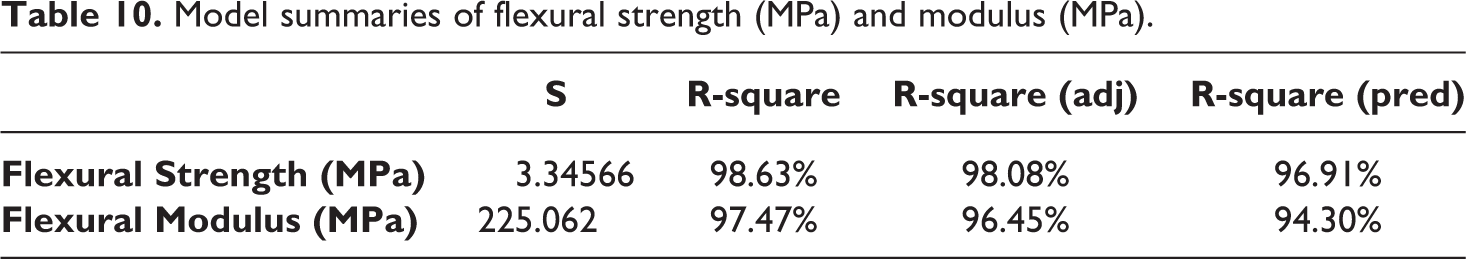
Analysis of variance results and model summaries (R-squares) of One-Way ANOVA (Tukey) statistical analysis of flexural strength (MPa) and modulus (MPa) are given in Tables 9 and 10, respectively. The analysis was performed against each test result separately and outcomes were recorded. P-values showed that with the change in the matrix type, flexural testing results, i.e. flexural strength and modulus, were also changed. This change in the results was statistically significant because the p-value for each response was less than 0.05. Furthermore, the p-value for each flexural testing result was equal to zero, which showed that the effect of change in matrix type on each test result was highly significant. Moreover, R-square (coefficient of determination) percentages against each result were more than 97%, as given in Table 10. The R-square is the variation % in the response as per model. So, the higher the percentage of R-square during statistical analysis, the higher will be the accuracy and dependencies of the model.
Analysis of variance results of flexural strength (MPa) and modulus (MPa).
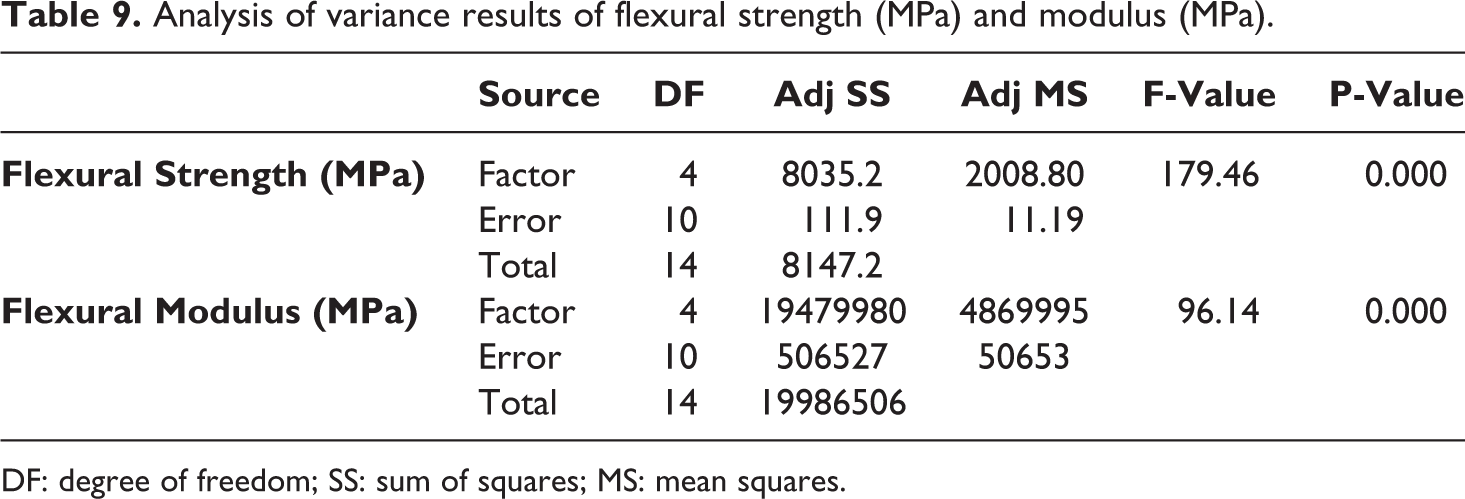
DF: degree of freedom; SS: sum of squares; MS: mean squares.
Model summaries of flexural strength (MPa) and modulus (MPa).
Interval and Tukey simultaneous plots for flexural strength and modulus for different matrix types are shown in Figure 21 and Figure 22, respectively. The interval plot for flexural strength in Figure 21(a) showed that none of the five (5) intervals was overlapping with each other highlighting the difference in means of all these intervals were significantly different. The Tukey plots for flexural strength are shown in Figure 21(b) showed that the confidence intervals for those differences between the means, which do not include zero in their range, are significant. All the confidence intervals did not include zero in the pair of means, which showed that the differences between the pair of means were significant. So, the effect of change in matrix type on the flexural strength was statistically significant.
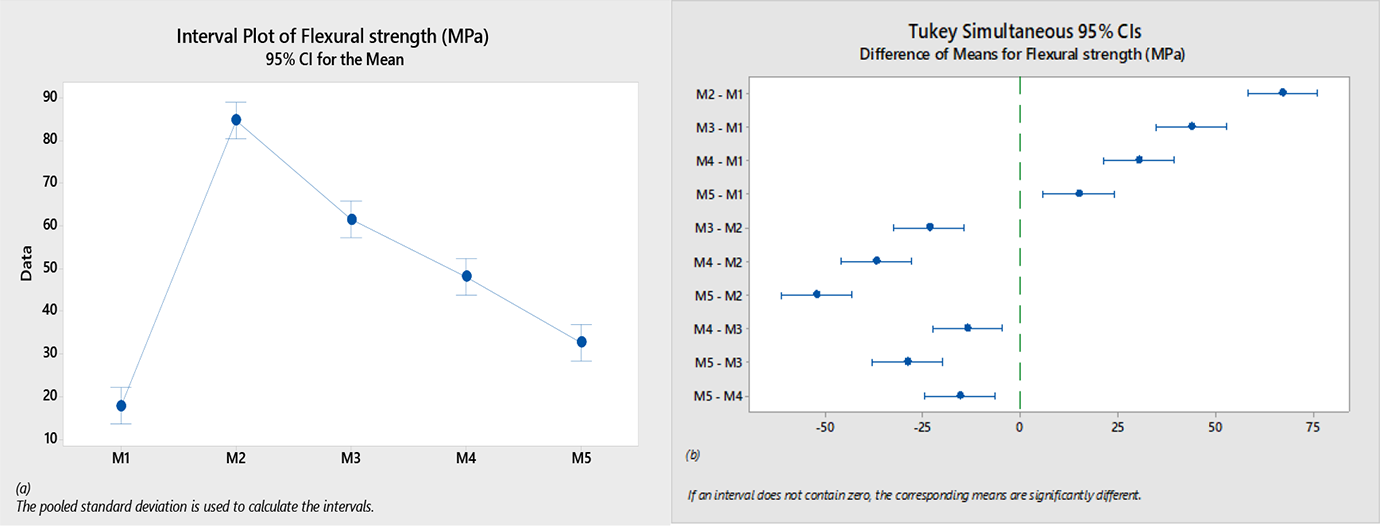
Flexural strength: (a) interval plot and (b) Tukey simultaneous plot.
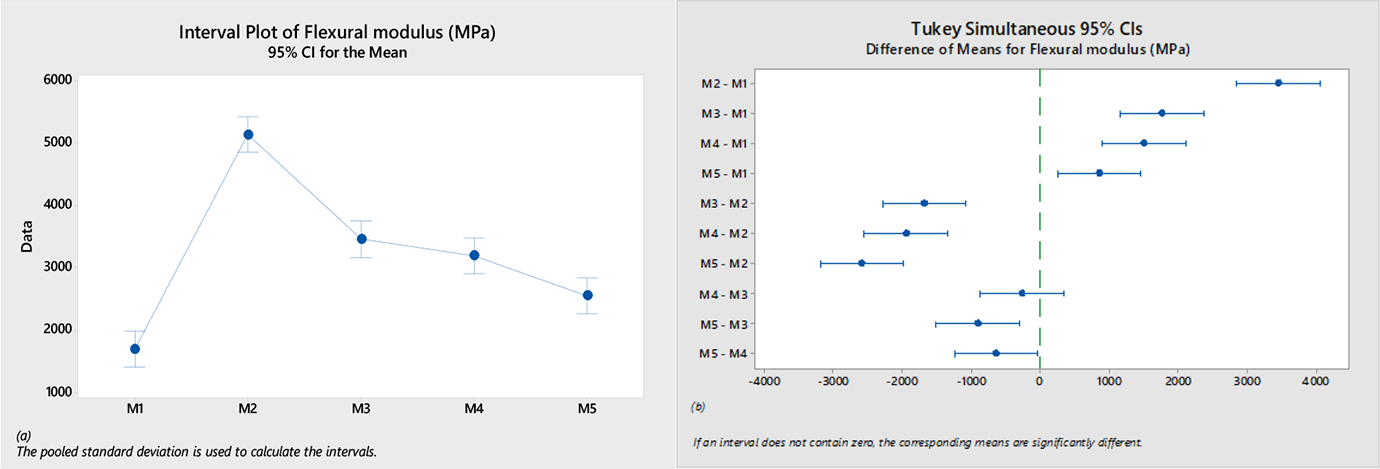
Flexural modulus: (a) interval plot and (b) Tukey simultaneous plot.
Interval and Tukey simultaneous plots of flexural modulus are shown in Figure 22(a) and 22(b), respectively. The interval plot showed that out of five (5) intervals, third (M3) and fourth (M4), intervals in overlap each other showing the differences between the means were not statistically significant. While remaining intervals in flexural modulus did not overlap with anyone, therefore, the difference in their means was significant, as shown in Figure 22(a). Similarly, Tukey plot showed that the one (01) pair include zero in the mean values of their confidence intervals as shown in Figure 22(b), which showed that the differences between the means of these pairs were not significant. All remaining confidence intervals did not include zero in the pair of means, which showed that the differences between the pair of means were significant.
Hardness testing
Hardness testing of the composite sample was done produced by using different thermoplastic, thermoset resins and their blends and results are shown in Table 11.
Hardness of composite samples.
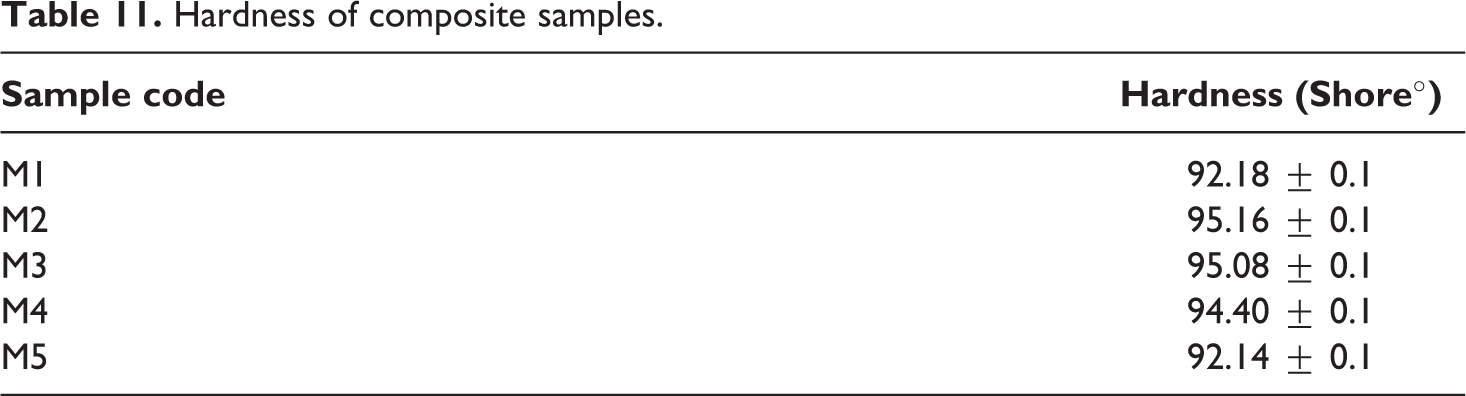
The hardness of composite made from PVB matrix (M2) is higher from all other thermoset composites as well as from the composites made using the blends of thermoset (vinyl ester, phenolic) and thermoplastic (PVB) matrices with a value of 95.16 shore°. The lowest hardness obtained was 92.14 shore° of the M1 composite sample, which was made by using a thermoset matrix. If we talk about thermoset matrices only, then the M3 have the highest hardness with a value of 95.08 shore°.
Conclusions
In the present study, impact properties of composite samples of Para-aramid (PA) fabric made with thermoset resins (phenolic, vinylester), thermoplastic (Polyvinyl butyral) resin and their blends were tested. It is concluded that impact energy absorption of thermoplastic/PA composites is significantly higher than thermoset/PA composites. Thermoplastic composite sample M2 (made with PVB) have an impact energy value equal to 56.78 J during drop weight impact test which is 14.82% higher than M3 composite (made using phenolic resin) and 70% higher than M1 composite (made using vinyl ester resin). For Charpy impact testing the (M2) sample (made with PVB) has an impact energy value of 73.65 kJ/m2 which is 189% and 26.63%, higher than thermoset composites M1 composite (made using vinyl ester resin) and M3 (made using phenolic resin).
The trauma depth of composite made using PVB (drop weight impact test) was 4.96% higher than Phenolic composite. It was found that using blend of PVB and Phenolic as matrix, almost same value of trauma can be achieved with 8–9% more energy as compared to Phenolic composites.
Flexural strength of composite made with PVB resin and its blend with phenolic resin was found 53.84% and 11.53% higher than phenolic resin, respectively. Similarly, the flexural strength of composite made with PVB resin and its blend with vinyl ester resin was found 280% and 57.14% higher than composite made using vinyl ester resin, respectively.
In general, it can be concluded that PA composite made using blend of PVB and phenolic achieve impact energy similar to thermoplastic composite and trauma value similar to thermoset composites and can be a good choice as composite materials for ballistic applications.
Footnotes
Funding
The author(s) disclosed receipt of the following financial support for the research, authorship, and/or publication of this article: Authors are thankful to the Higher Education Commission of Pakistan for Funding this research work under National Research Program for Universities (NRPU-12477).