
Abstract
This paper focused on the establishment of performance level and cost of plantain fibers reinforced High Density Polyethylene (HDPE) matrixes as gas pipeline material using pressure containment of the new materials as performance criterion. The cost of modified plantain fibers, the cost of plantain fibers reinforced HDPE (PFRHDPE) and the cost of PFRHDPE master batch (HDPE resin + plantain fiber particles + stabilizer, plasticizer) for pipes extrusion production and pipelines fittings injection productions were established. The burst pressure evaluated for available standard outside diameter ratio (SDR) using the ultimate tensile strength of PFRHDE is very much greater than the standard SDR design pressures even when the temperature derating factors were applied. The Maximum Allowable Operating Pressure (MAOP) of PFRHDPE and induced stresses of pressurized pipes established indicated that the new material is suitable for pipeline design for natural gas and liquid petroleum (LPG) lines. The PFRHDPE developed has better specific properties than the conventional steel and HDPE pipe material in terms of yield strength, elastic modulus and density of the new material. But in terms of cost, steel and HDPE has approximate desirability for selection with PFRHDPE. The energy required to manufacture and process steel products is about 480 MJ/m2, while that of plastics is about 320 MJ/m2. The study further established that PFRHDPE can be applied in the design of oil and gas gathering, transportation and distribution lines.
Keywords
Introduction
Natural fibers primarily consist of Cellulose, Hemicelluloses, Pectin and Lignin, with a small quantity of extractives.1–4 While cellulose is a semi crystalline polysaccharide responsible for the hydrophilic nature of natural fibers. 3 The tendency to form aggregates during processing, low thermal stability, low resistance to moisture and seasonal quality variations (even between individual plants in the same cultivation), greatly reduce the potential of natural fibers to be used as reinforcement for polymers.5,6 The high moisture absorption of natural fibers leads to swelling and the presence of voids at the interface, which results in poor mechanical properties and reduces the dimensional stability of composites. One of the major disadvantages of natural fibers is the poor compatibility exhibited between the fibers and the polymeric matrices, which results in non-uniform dispersion of fibers within the matrix and poor mechanical properties.
Most polymers, especially thermoplastics, are non-polar (“hydrophobic,” repelling water) substances that are not compatible with polar (“hydrophilic,” absorbing water) wood fibers and, therefore, this can result in poor adhesion between polymers and fibers in WPC. 7 To improve the affinity and adhesion between fibers and thermoplastic matrices in production, chemical “coupling” or “compatibilizing” agents have been used. 6 Scholars that studied the coupling modification of natural fibers include Tabari et al. 8 and Lu et al. 9 while others that worked on the improvement of natural fibers through mercerization, acetylation and coupling include Lee et al., 10 Panigrahy et al., 11 Santos et al., 12 Hu and Lim, 13 and Li et al. 14
The properties of natural fiber composites can be tailored to achieve the desired end product depending on the type of fibers, type of resin, the proportion of fiber-resin, manufacturing conditions and the type of manufacturing process.15–17 Recently, researchers have examined various applications of natural fiber reinforced thermoplastics. For instance, physical and rheological properties of biodegradable composites, 18 application of eco-friendly composite materials in automotive industries, 19 non-structural facilities, 20 and biomedical, energy and sports. 21
Other recent studies on natural fibers and natural fiber reinforced plastics are well documented.4,22–28 Practically, studies covering integrity and cost evaluation of these natural fiber composites for piping applications are missing in literature. Although, Kiani et al. 29 has developed nano-composite pipes for oil and gas applications, effective deployment of these new materials in oil and gas industries require exhaustive cost and integrity assessment. This is because polymer products used in Oil and Gas Pipelines are innately vulnerable to continuous harm because of creep, handling deformities, fatigue and installation defects. 30 Some researchers have advocated for the application of composite pipes as a cost efficient substitute to carbon steel citing high corrosion resistance and flexibility of usage.31,32
It is a popular misconception that plastics are cheap materials but on a weight basis, most plastics (polymers to which additives have been added) are more expensive than steel and only slightly less expensive than aluminum. However, it should always be remembered that is a bad design practice to select materials on the basis of cost per unit weight. 33 In the mass production industries in particular, the raw material cost is of relatively little importance. It is the in-positions cost which is all important. The in-position cost of a component is the sum of several independent factors that is raw material costs, fabrication cost and performance costs. Fabrication costs include power, labor, consumable, etc. In terms of the overall energy consumption, plastics come out much better than metals. Performance cost relates to servicing, warranty claims, etc. On this basis, plastics can be very attractive to industries manufacturing consumer products because they can offer advantages such as color fastness, resilience, toughness, corrosion resistance and uniform quality. However, in general these fabrication and performance advantages are common to all plastics and so a decision has to be made in regard to which plastics would be best for a particular operation. Rather than compare the basic raw material costs it is better to use a cost index on the basis of the cost to achieve a certain performance.
This report is focused on performance evaluation of a composite material made by reinforcing high density polyethylene with plantain fibers particles (PFRHDPE) with the purpose of using the PFRHDPE for production of pipeline (pipes and fittings). Because PFRHDPE is a composite new material, the material costing processes involving job and process costing approaches were applied to arrive at cost of the composite material. The production of PFRHDPE passes through series of manufacturing processes such as gathering, fiber retting and extraction, drying and compounding. Some of these processes of composite development are associated with fixed and variable costs and some of the stages need depreciable capital facilities. Also some relevant mechanical properties such as tensile strength and yield strength of the material were used to assess the pressure and cost integrity of the material.
Review of related literature
Standard requirements for polyethylene (PE) piping materials
The Minimum Required Strength (MRS) according to ISO4427 for different materials is reported by The Engineering ToolBox. 34 The pressure of pipes estimated for operations at room or laboratory conditions need to be modified by multiplying the room temperature pressure with the derating factor as reported by The Engineering ToolBox. 35 The American Society of Testing and Materials (ASTM) issued standard D3350, “Standard Specification for Polyethylene Plastic Pipe and Fittings Materials.” 36 This standard perceives six properties that are viewed as significant in the production of polyethylene piping, in the warmth combination joining of the material and, in characterizing its drawn out abilities. These properties are the density, melt index, flexural modulus @ 2% secant, tensile strength at yield, slow crack growth resistance (ESCR) and hydrostatic design strength (HDS) or minimum required strength (MRS) @ 20°C.37,38
Pressure testing of newly installed pipelines and pipe quality tests
In 1970, the government guidelines embraced a current designing agreement standard from American Society of Mechanical Engineers (ASME) necessitating that recently introduced flammable gas transmission lines be pressure tested to affirm its integrity prior to being put into use (Interstate Natural Gas Association of America). 39 This test is performed by filling the pipe segment with water or inert gas and pressurizing the pipe 10 to 50% higher than the proposed maximum allowable operating pressure. 39 The hydrostatic strength test procedures are also reported by NEXOR.40–43 The mechanical properties of pipe material (ultimate tensile strength, yield strength, Poisson’s ratio) and water (density) will be used to carry out pipe pressure tests to establish von Mises stress as a result of internal pressurization.
Newly manufactured pipes are usually subjected to quality tests which include hydrostatic strength test, longitudinal reversion, oxidative induction time (OIT) and Stresses caused during pipes manufacture test. 40 The hydrostatic strength test follows closely the specifications of ISO4427 and ISO1167.41,44,45 The longitudinal reversion test which takes care of residual stresses inherent in the extrusion of plastic pipe follow ISO2505.44–47 Oxidative induction time (OIT) which measures the resistance of polyethylene pipes to oxidation is measured following ISO/TR 10837.44,47,48 The stresses caused during manufacture of pipes are estimated following the literature.45,47,49,50 These tests are carried out to ensure that plastic pipes attain service life of 50 years as required by ISO 4427 47 and ISO 9080. 51
Materials and methods
Materials
The basic materials are ground plantain fiber particulates, High density polyethylene, compatibilizer and additives (lubricants, stabilizer, and plasticizer). The plantain Pseudo stems were obtained from a local plantation in Awka, Anambra State, Nigeria. The Malaiec anhydride grafted polyethylene used in this study was supplied by Hebei Jintian Plastic New Material Company Limited, China and the High density polyethylene was supplied by Indorama Eleme Petrochemicals Limited, Port Harcourt, Nigeria.
Experimental
Plantain Pseudo Stem Fiber was retted for 28 days before extraction and was subsequently modified using 2% concentration of sodium hydroxide followed by 1% acetic acid treatment to neutralize the sodium hydroxide solution. The treated plantain fibers were dried to constant weight using a laboratory scale ovum for 150 minutes at 80°C. The dry strands were ground to a fine powder utilizing laboratory scale comminution device and lastly sieved in accordance with ASTM200 and ASTM100.
The compatibilizer (Malaeic Anhydride Grafted PE (MAPE)) was utilized at 1.5% to diminish hydrophilicity of strands and improve the compatibility of fiber and matrix. Capital equipment such as mixer, crusher, pelletizer, weighing scales, measuring cylinders were utilized during material compounding process. The compounded composite mixture consists of ground plantain fiber (20% weight fraction), compatibilizer (3% weight fraction), High density polyethylene (80% weight fraction), stabilizer (1% weight fraction) and lubricant, wax (1%). The compounded composite mixture was then routed into injection molding facility to produce the test samples as per ASTM standard D638 for Tensile tests. Tensile strength of the material was thereafter assessed utilizing Universal Testing Machine.
Pressure integrity and pipeline material design
The design pressure and maximum operating pressures were evaluated for the pipeline material. To establish the maximum operating pressures of the new material, equation (12) was applied with associated design factors. Pipe quality tests for HDS was carried out using standards specified by ASTMD3350 for PE pipes and procedure of Vinidex for hydrostatic strength. ASTM D3350 specified HDS was used to estimate the MAOP of water used to test the new pipe induced stress. The material properties of the new material were used to evaluate the induced tangential stress due to internal pressurization at 1.5 MAOP. The induced stresses of various HDS were compared with the HDS for water @ 20–23°C as specified by ASTM D3350. Also for natural gas pipeline, the minimum required strength as specified for water at 20°C was used with appropriate design factors to evaluate the appropriate HDS of gas pipelines that will be used to compare with the induced stress of our new pipeline. Also the HDS for LPG was evaluated at some MRS to be compared with the induced stress of our new pipeline material induced stress.
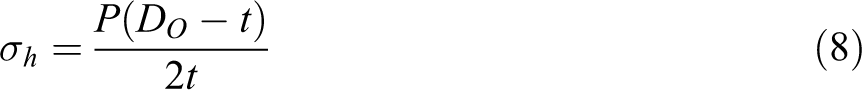
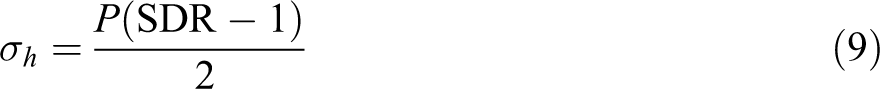
For PE pipe design, it has been assumed that hoop stress is uniform in the wall thickness of pipe, hence the thin wall hoop stress equation is accepted as a satisfactory equation and it has been adopted by standards which cover thermoplastic. ISO 52 adopted the hoop stress equation to evaluate the hoop stresses of plastic pipes as
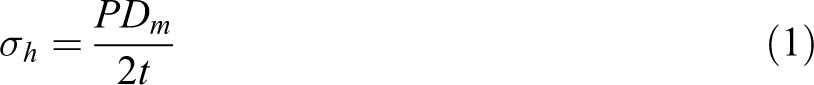
where σh = hoop stress, P = internal design pressure, Dm = mean diameter, t = wall thickness of the pipe.
Also because PE pipes are made either in controlled outside diameter or controlled inside diameter, equation (1) has been classically expressed in various standards as
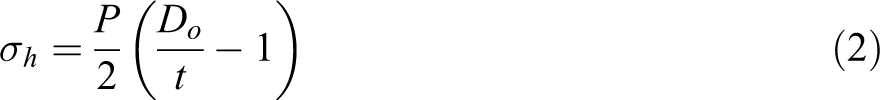
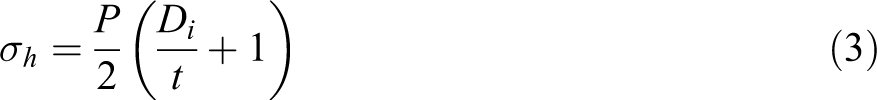
where Do is the outside diameter and Di is the inside diameter of the pipe.
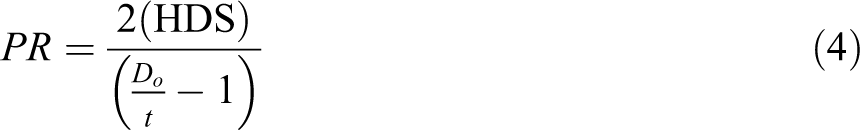
During the design of pressure pipes, the line’s pressure rating (PR) is controlled by the Hydrostatic stress (HDS) that is allotted to the material from which the line is made. Therefore by limiting the hoop stress to the value of HDS and taking PR as P in (2) and (3)
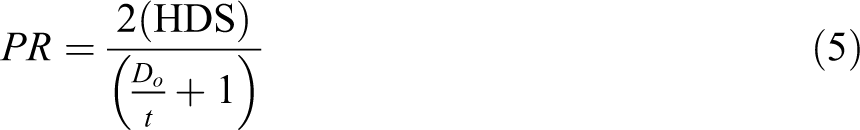
Equations (4) and (5) are also written in ASTM format as
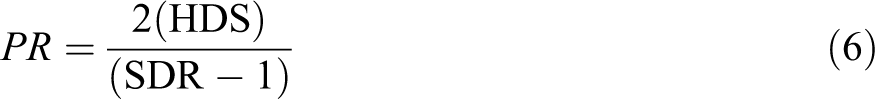
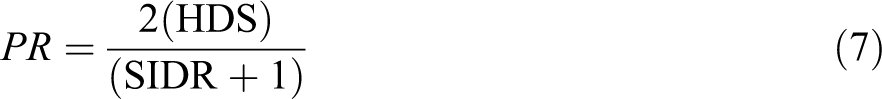
where SDR is the standard outside diameter ratio and SIDR is the standard inside diameter ratio.
The average value of stress that is generated in the thermoplastic can be calculated using the classical thin wall pressure vessel equation,
Similarly, the burst pressure of pipe can be evaluated using the following equations


where Sut is the ultimate tensile strength of the material.
Other equations and design factors for natural gas and LPG pipeline pressures and strength are reported in the following equations, 53

where HDS = hydrostatic design stress, MRS = minimum required strength, MAOP = maximum allowable operating pressure, C = design factor, f0 = factor related to fluid type, f1 = factor related to operating temperature, f2 = factor related to installation method, f3 = factor related to population density.
Finite element thermal analysis of PFRHDPE pipes
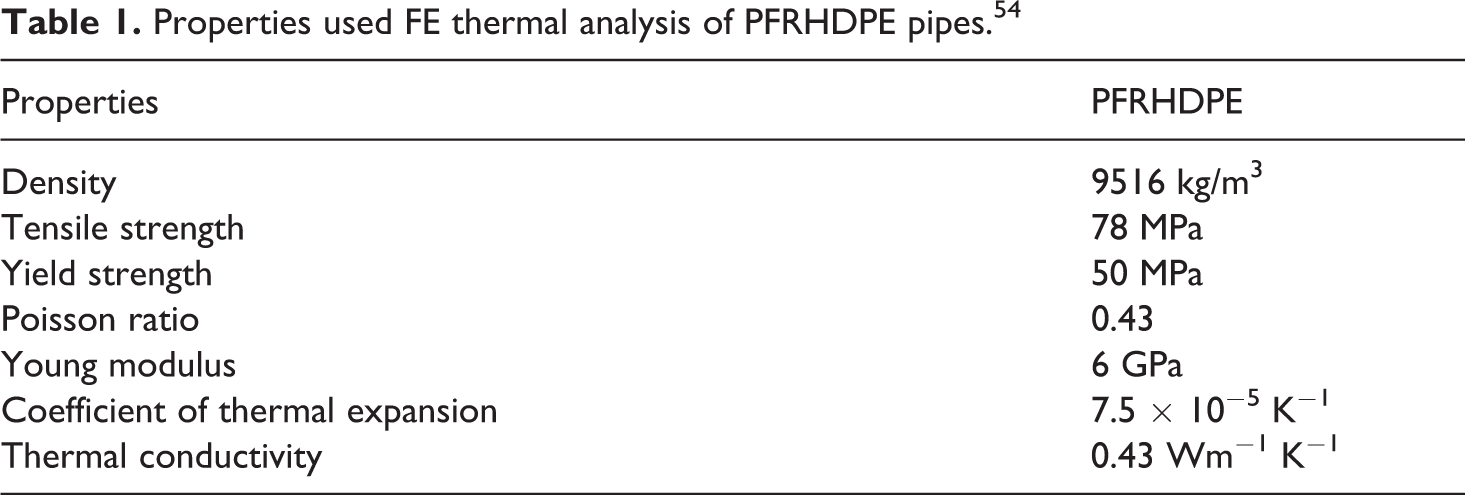
The Hydrostatic Design Basis of thermoplastic material is a standard method of testing strength of HDPE pipe. The 3D model of the 2-inch, 4-inch and 6-inch pipes were modeled in Creo-Elements and imported into ANSYS for transient thermal stress analysis. The material properties of the developed PFRHDPE as shown in Table 1 were added to the ANSYS material library, which was assigned to the pipe.
Properties used FE thermal analysis of PFRHDPE pipes. 54
The model was discretized into a meshed FE model with Tetrahedron mesh and 5 mm mesh size was used which resulted to 2989 elements and 6087 nodes. Figure 1 shows FE meshed models for 2 inches (Figure 1(a)), 4 inches (Figure 1(b)) and 6 inches (Figure 1(c)) pipes.
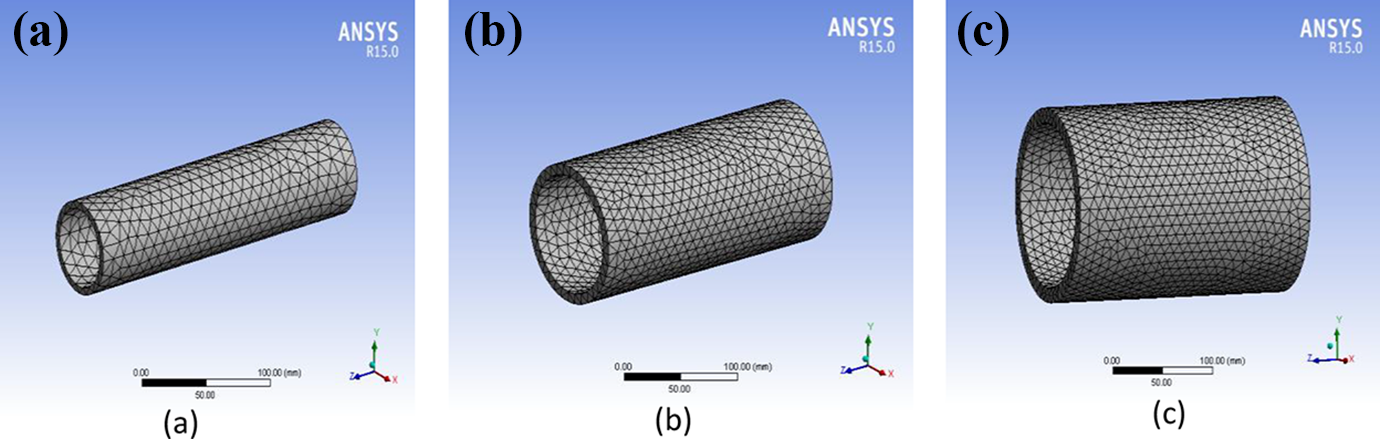
Depiction of FE meshed models of (a) 2, (b) 4 and (c) 6 inches pipes of PFRHDPE.
The boundary conditions considered for the transient thermal analysis were temperature at 20°C, and Convection 1.2e−003 W/mm oC (stagnant water simplified case) was considered for 5 seconds for the virtual model to attain an equilibrium temperature. The material property, geometry, FE mesh was shared between the thermal and structural analysis. Moreover, the solution of the thermal analysis was used in the structural analysis to take account of the model temperature.
The boundary conditions for structural analysis were the imported model temperature, internal pressure of 1.92 MPa, 2.4 MPa and fixed constraint. Finally, the Von Mises stress of each pipe at different temperature and pressure were solved and results obtained.
Cost categories and models
The methods used to develop cost evaluations fall into three categories: methods engineering, costs by analogy, and parametric analysis of historical data. In this work, methods engineering (industrial engineering approach), where separate elements of work are identified in great detail and summed into the total cost per part was employed. The major aspects of the costs categories include Fixed costs (depreciation on capital investment, interests on capital investments and inventory, property taxes and insurance, overhead costs (technical services, product design and development, rental of equipment), management and administrative expenses) and variable costs (material cost, labor cost, direct production supervision, maintenance costs, power and utilities, scrap losses and spoilage, royalty payment, and quality control costs). The variable costs and fixed costs associated with new material development were quantified. The cost of fiber, the cost of PFRHDPE with compatibilizer, the cost of PFRHDPE with extrusion additives and the cost of pipe material on SDR 13.5 were also evaluated.
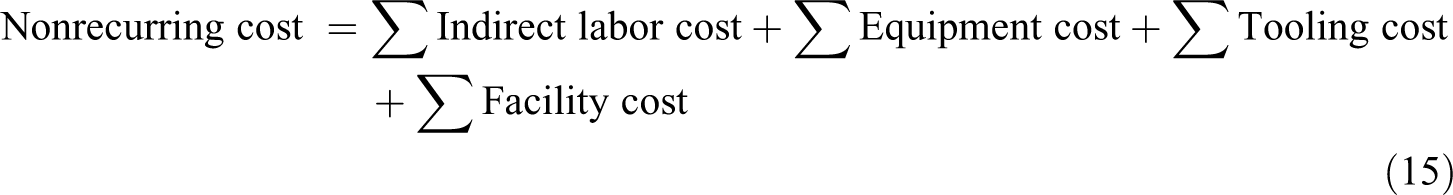
The Costs that are encountered in manufacturing industries are broadly classified into recurring and nonrecurring costs. The nonrecurring costs (capital costs) include capital costs of depreciable facilities (plant building, manufacturing equipment, tools, etc.) and capital costs of non-depreciable assets such as land. The recurring costs are usually called operation or manufacturing costs and they include material cost, direct labor cost, energy cost, etc. Costs are also categorized as fixed costs and variable costs. Fixed costs include indirect plant costs such as investment costs (depreciation on capital investment, interest on capital investment and inventory, property taxes and insurance), and overhead or burden costs (technical services, product design and development, nontechnical services, general supplies, rental of equipment), management and administrative expenses and selling expenses). The variable costs (materials, direct labor including fringe benefits, direct production supervision, maintenance costs, power and utilities, quality control staff, royalty payment, packaging and storage costs and scrap losses and spoilage). 55 The equation relating the cost categories and the associated variables are expressed in equations (13) to (15).


The above equations were used in the estimation of the costs of the individual materials that made up the new composite material.
Material cost and material selection
In gas transmission lines, 50–55% of the cost of the project is the weight of steel used in the construction of the pipeline. 56 Therefore, it is important to have a good estimate of the amount of material that will be required in any manufacturing operation. The approximate mass of pipe is estimated using the properties of resin, filler and geometry of pipe. The mass of material needed for a length of a cylindrical pipe can be estimated from the fundamental equation that the mass of material is related to its density and volume as

By considering a cylindrical pipe, equation (16) reduces to


where Mp = mass of pipe, Lp = length of pipe, ρ p = density of pipe, t = thickness of pipe, Di = inside diameter of pipe, DO = outside diameter of pipe.
From the equation (18), it is obvious that the pipeline thickness has a significant impact on the weight of material. Consequently, for high-pressure gas transmission lines, designers may spend more money to use a high grade of pipe. The higher grade of pipe permits a smaller wall thickness, and the savings on weight of material greatly outweigh the money spent on advanced grade of pipe. 56 It is therefore better to use an advanced grade of pipe.
Crawford 33 derived equations for a beam of a material that considered performance as a function of cost, yield strength, stiffness and density of material. These equations are expressed as,
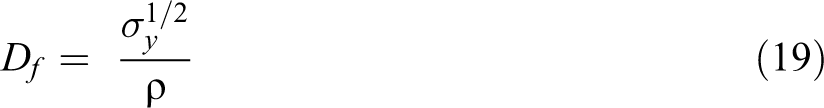
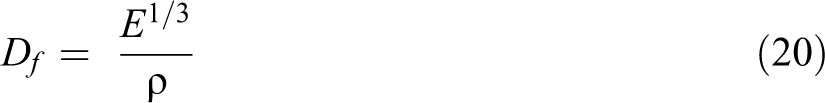
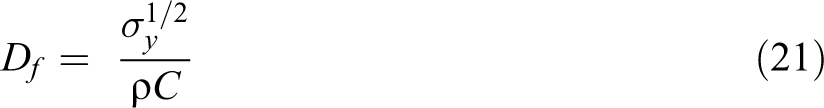
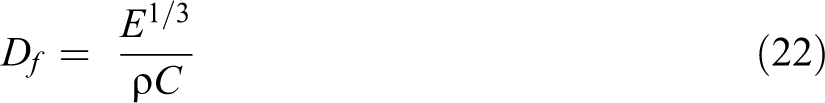
For thin wall cylinders under pressure the desirability factor is also given as
The higher the desirability of material Df the better is the material
where Df = desirability factor, σy = strength of material, ρ = density of material, E = Modulus of elasticity of material, for plastic the creep modulus is usually used instead of short time modulus, C = cost of material per unit weight.
Results and discussion
Integrity assessment
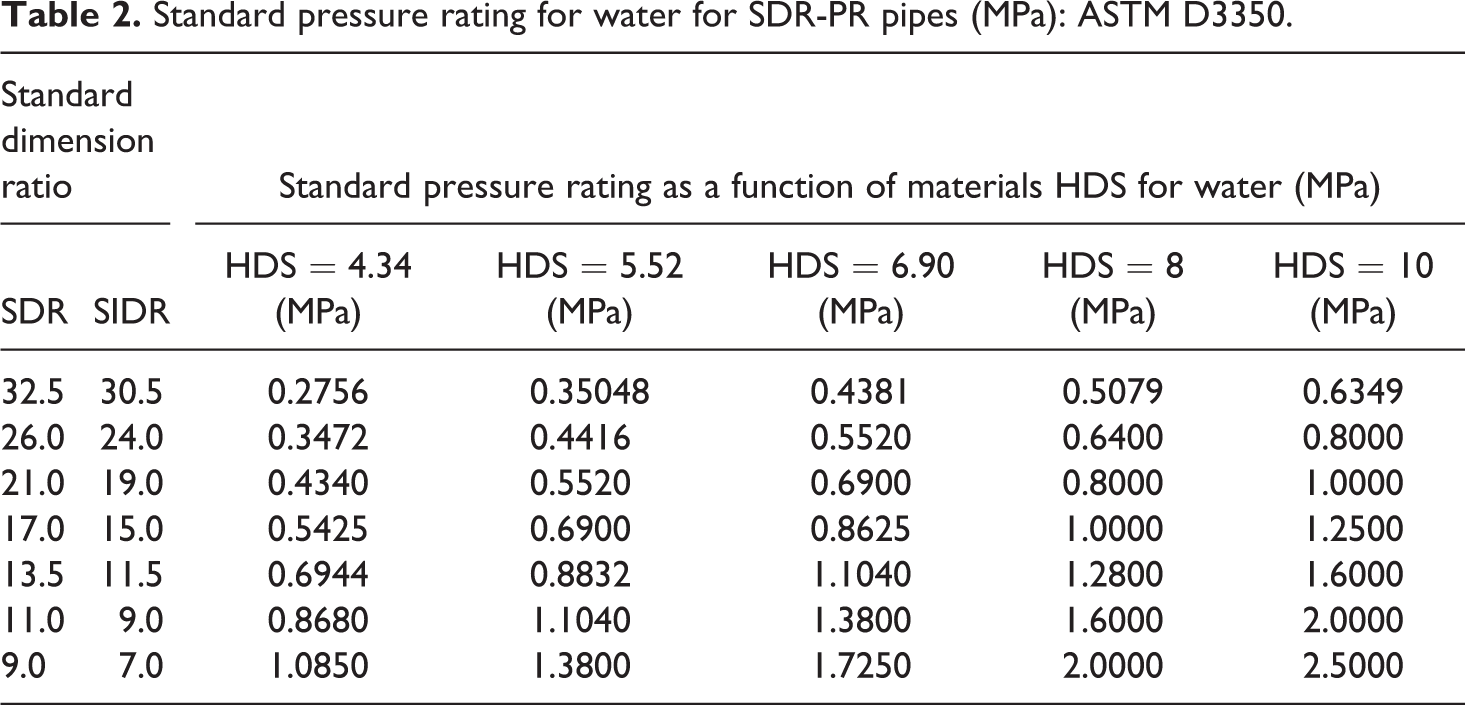
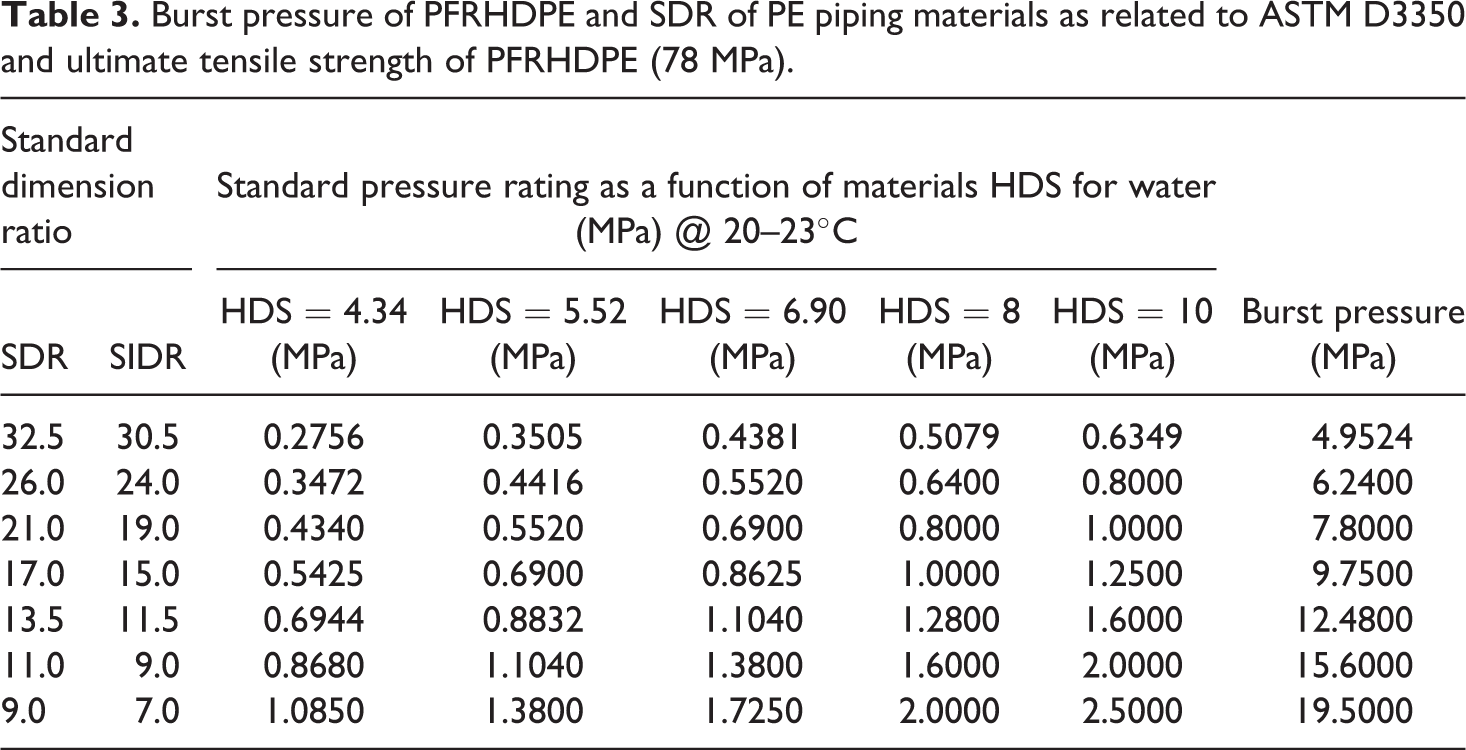
The standard rating of PE pipe pressures is reported in Table 2 while burst pressure of the new material is evaluated for PE SDR rating and presented in Table 3. In accordance with ASTM D3550 standard the values of standard pressure ratings as a function of materials HDS for water at 20–23°C and at various SDRs were evaluated as shown in Table 2, by the application of equations (6) and (7). Through the application of the new material’s ultimate tensile strength, the burst pressures of this material were calculated at various SDRs using equations (10) and (11). These established values were compared with those of standard pressure ratings in Table 3. The result shows that the new material has quite high bursting pressures at various SDRs compared with standard PE pipes pressure ratings making the new material sufficient for oil and gas pipeline applications.
Standard pressure rating for water for SDR-PR pipes (MPa): ASTM D3350.
Burst pressure of PFRHDPE and SDR of PE piping materials as related to ASTM D3350 and ultimate tensile strength of PFRHDPE (78 MPa).
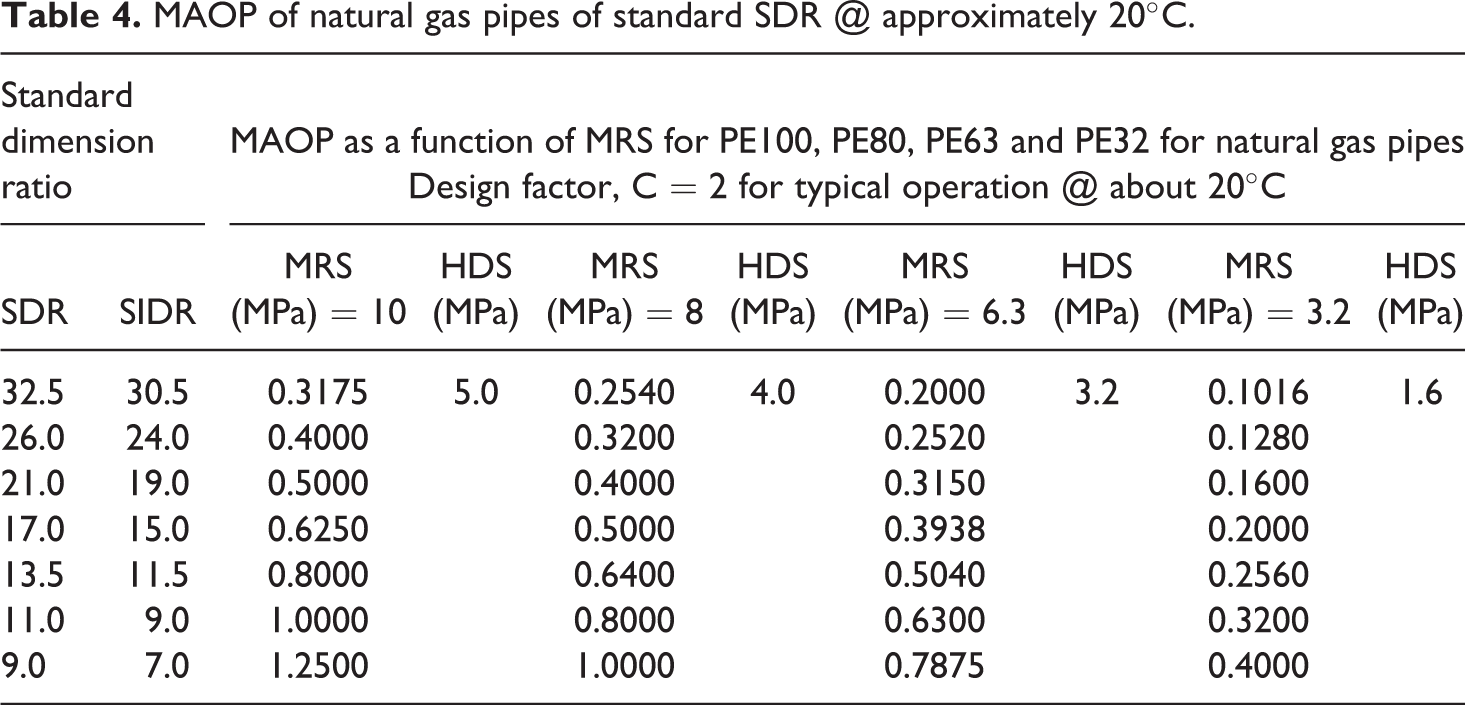
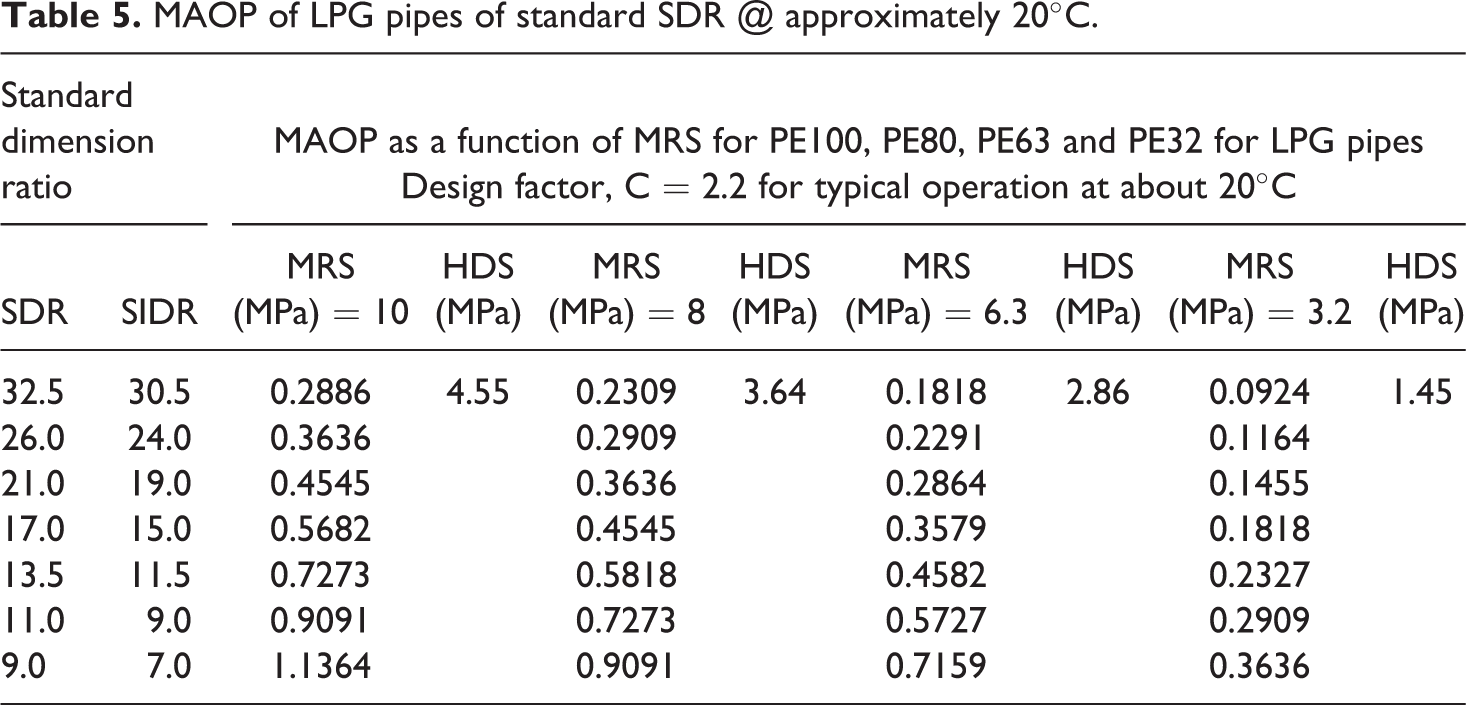
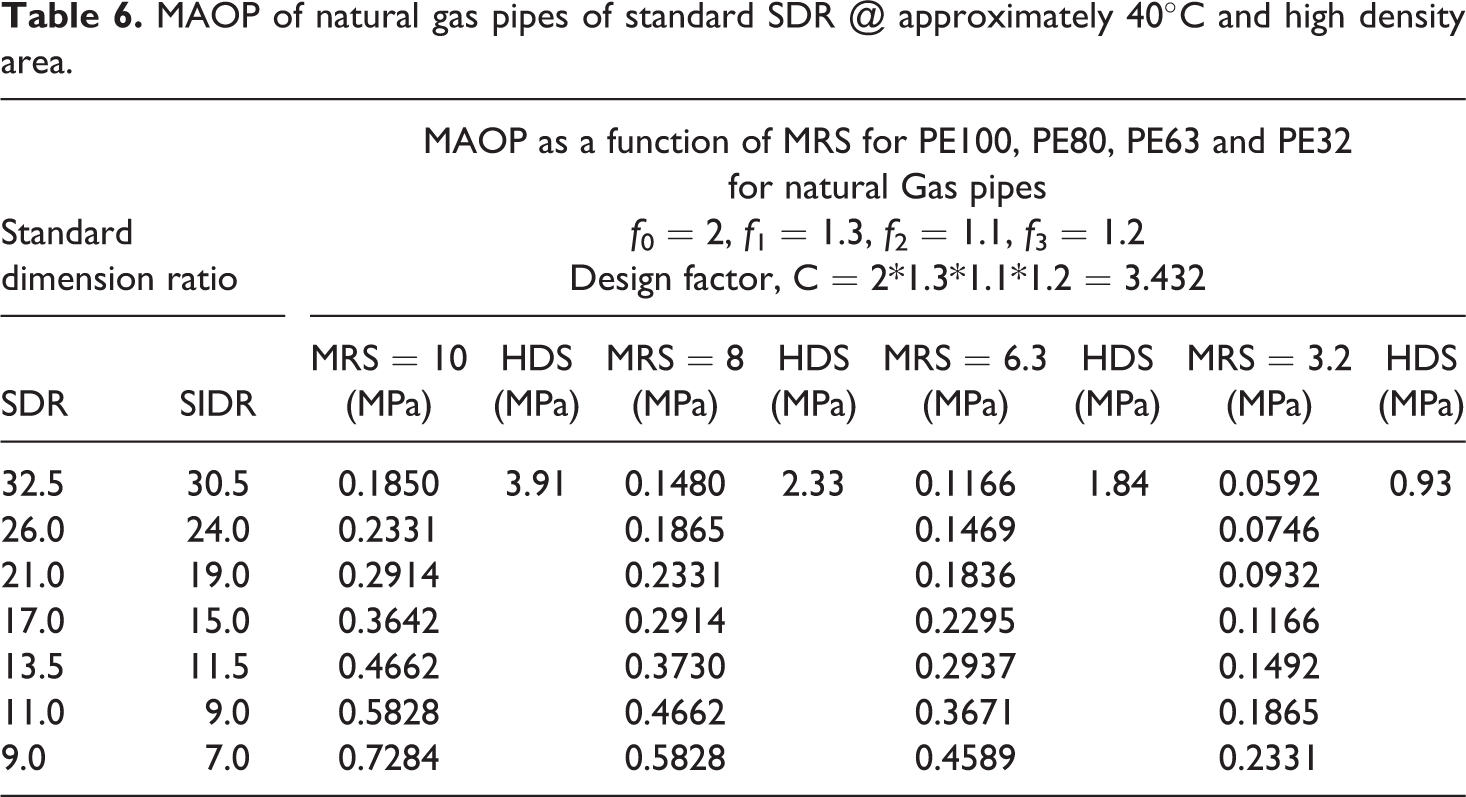
The MAOP and HDS of natural gas piping material is evaluated with equation (12) and presented in Table 4. The MAOP and HDS values were calculated at the design factor (C) of 2.0 (Table 4) and C of 2.2 (Table 5) both at 20°C. These were also evaluated for standard natural gas (LPG) pipes at the operating temperature of 40°C at the design factor (C) of 2.0 and 2.2 as shown in Tables 6 and 7 respectively. When the material is to be used to carry natural gas, the applicable design factor is 2 so that according to equation (12) the HDS for normal operation of gas pipeline becomes 5 MPa as specified in Table 4, this is also higher than 4.23 MPa. The new material is therefore good as natural gas pipeline. For utilization of the new material as LGP pipeline, the applicable design factor is 2.2 and HDS for PE100 becomes 4.55 MPa as in Table 5. This is also greater than 4.23 MPa confirming that the new material is good for LPG pipeline. Pressure testing was carried out according to standard specifications as contained in ISO 4427, 47 ASTM D3350-14, 50 and ISO 9080, 51 that new pipes must be tested for integrity by pressurizing the section of pipe with pressure 110–150% of normal pressure rating of the SDR.
MAOP of natural gas pipes of standard SDR @ approximately 20°C.
MAOP of LPG pipes of standard SDR @ approximately 20°C.
MAOP of natural gas pipes of standard SDR @ approximately 40°C and high density area.
MAOP of LPG pipes of standard SDR @ approximately 40°C and at high density area.
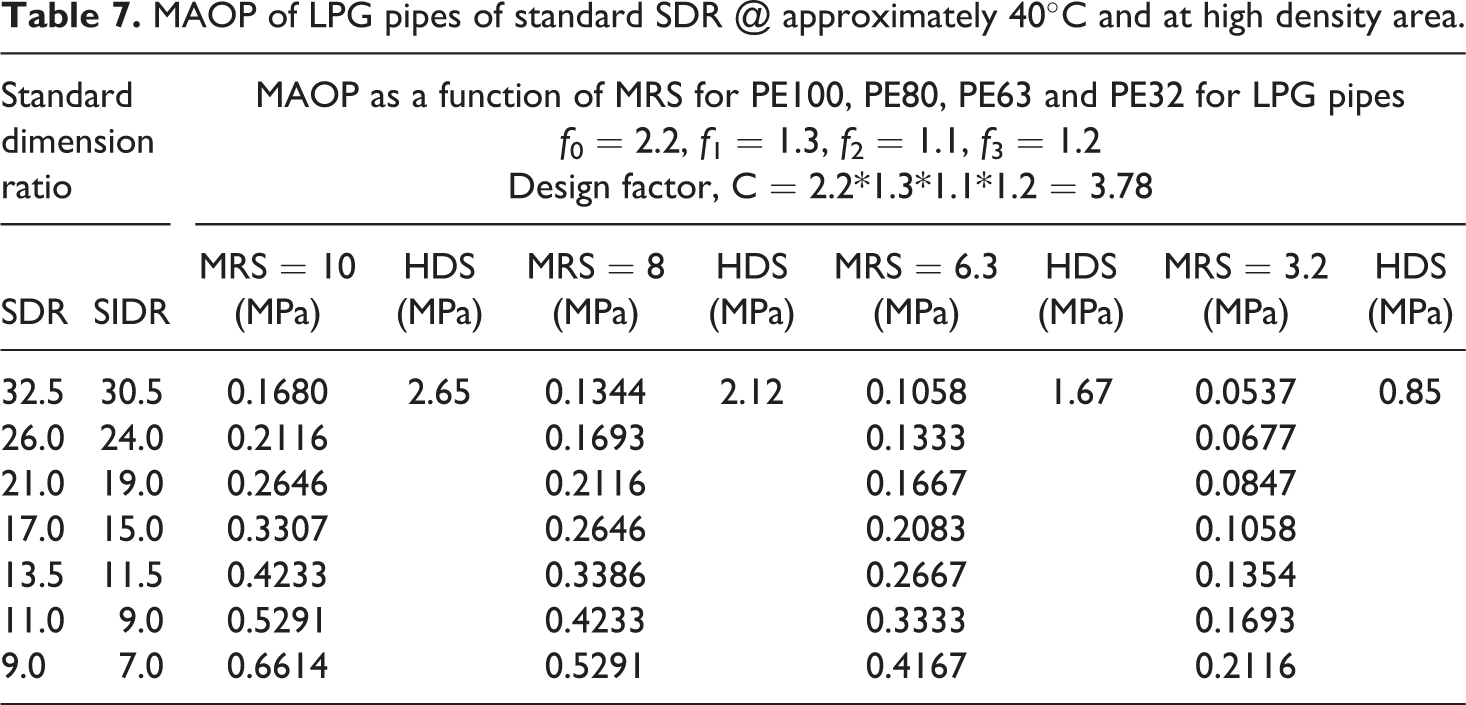
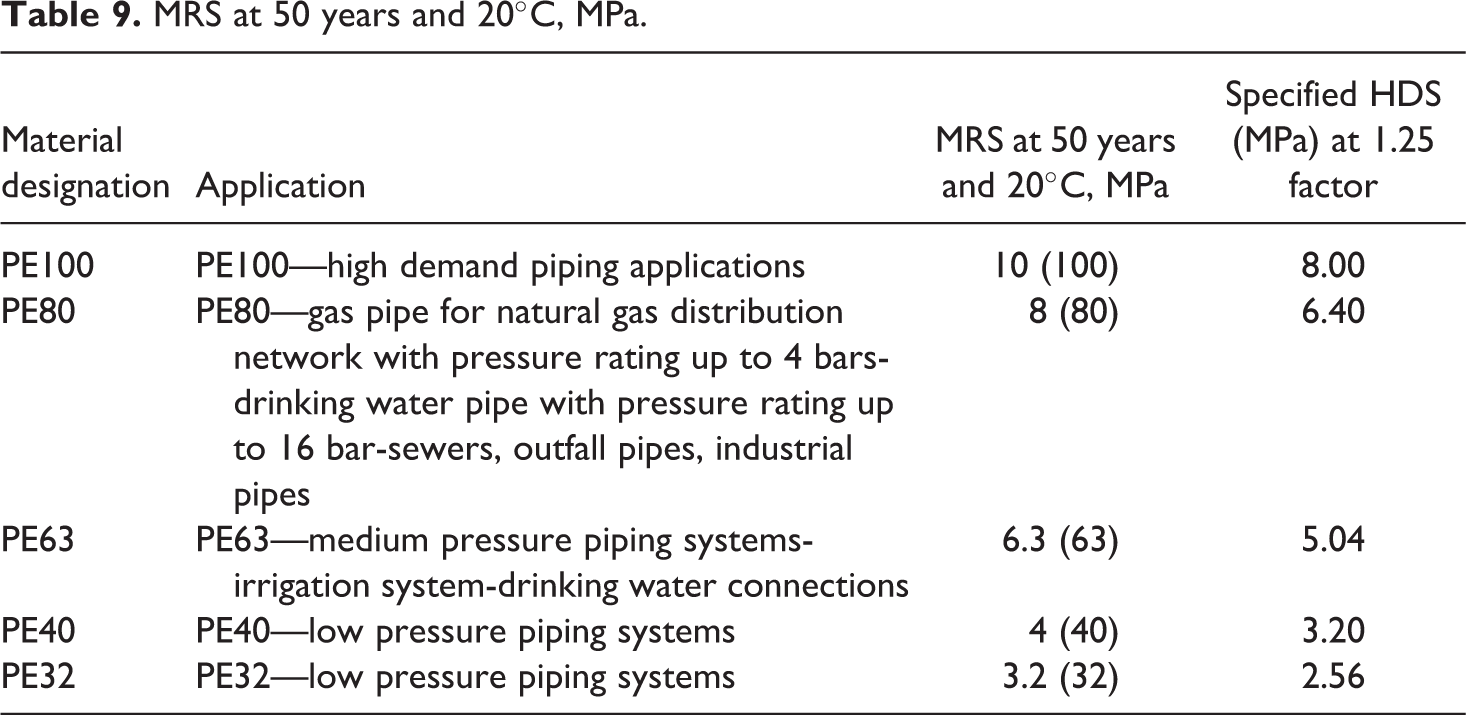
Table 8 depicts experimental results of induced tensile stress (TS) as a function of material properties and MAOP at operating water temperature of 23°C. Table 8 shows that PE100 with MRS and HDS has the maximum induced stress of 4.23 MPa, which is less than the material class HDS of 5 MPa as specified in ASTM D3350. The induced tensile stresses of Table 8 show that the new material can be used for PE125, PE100, PE80 up to PE32 as the estimated induced stresses are less than the material class HDS. Figures 2 to 4 show pressurization of SDR 13.5 of MRS of 8 MPa and 10 MPa of PE100 and PE125 with pressure ratings of 1.28 and 1.6 MPa respectively. The MRS at 50 years and 20°C and HDS at 1.25 design factor for classing PE usage ratings are shown in Table 9.
Tangential stresses of tested PFRHDPE pipes on 1.5 MAOP.
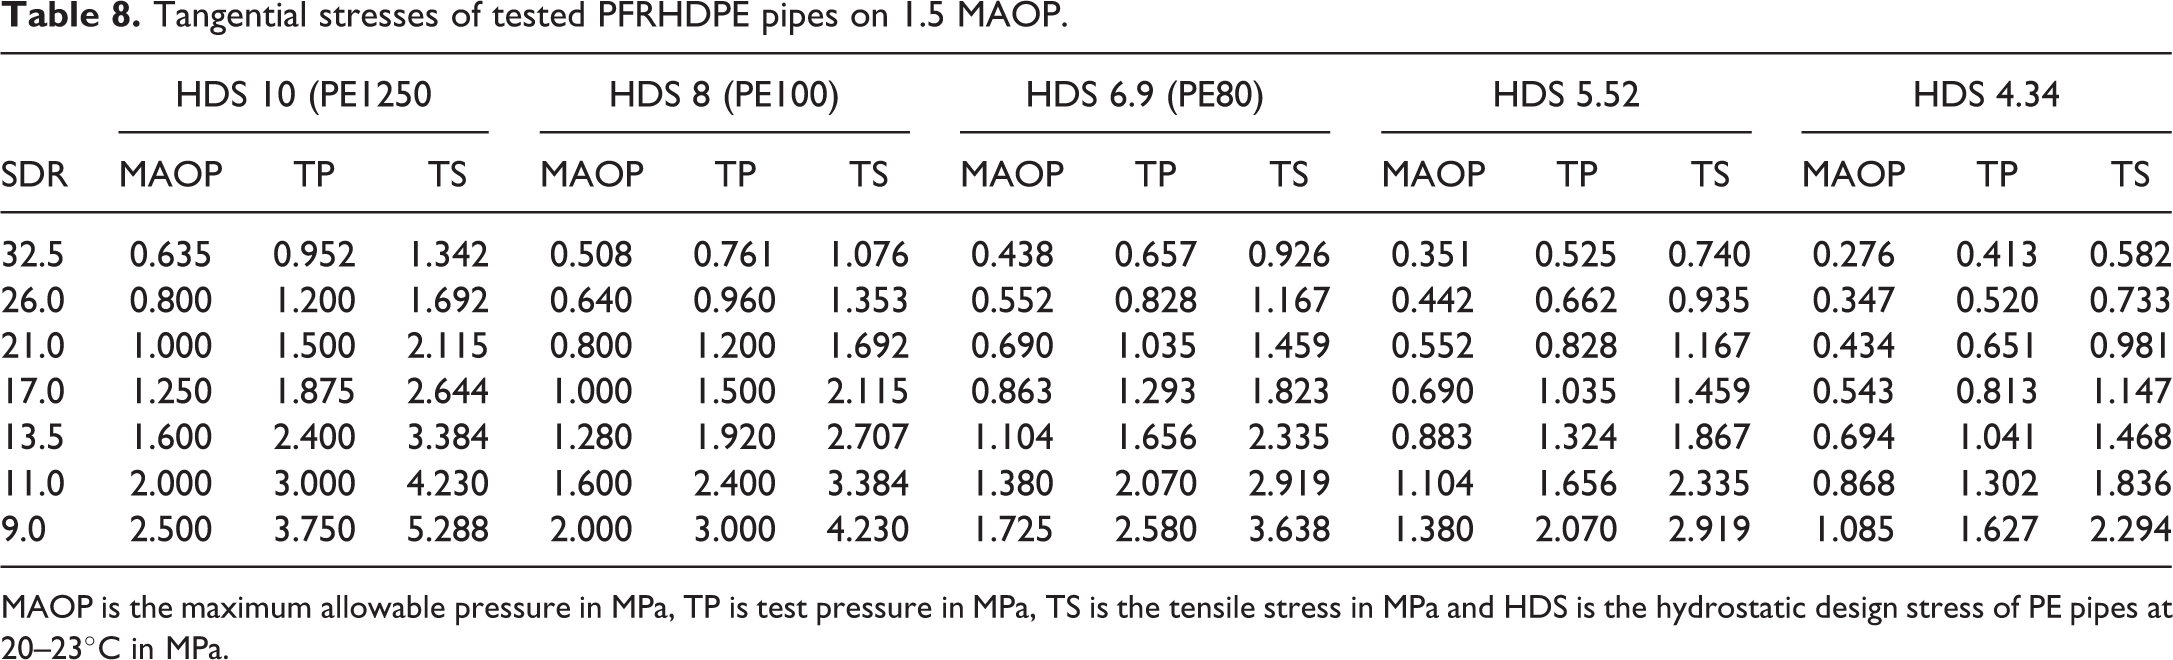
MAOP is the maximum allowable pressure in MPa, TP is test pressure in MPa, TS is the tensile stress in MPa and HDS is the hydrostatic design stress of PE pipes at 20–23°C in MPa.
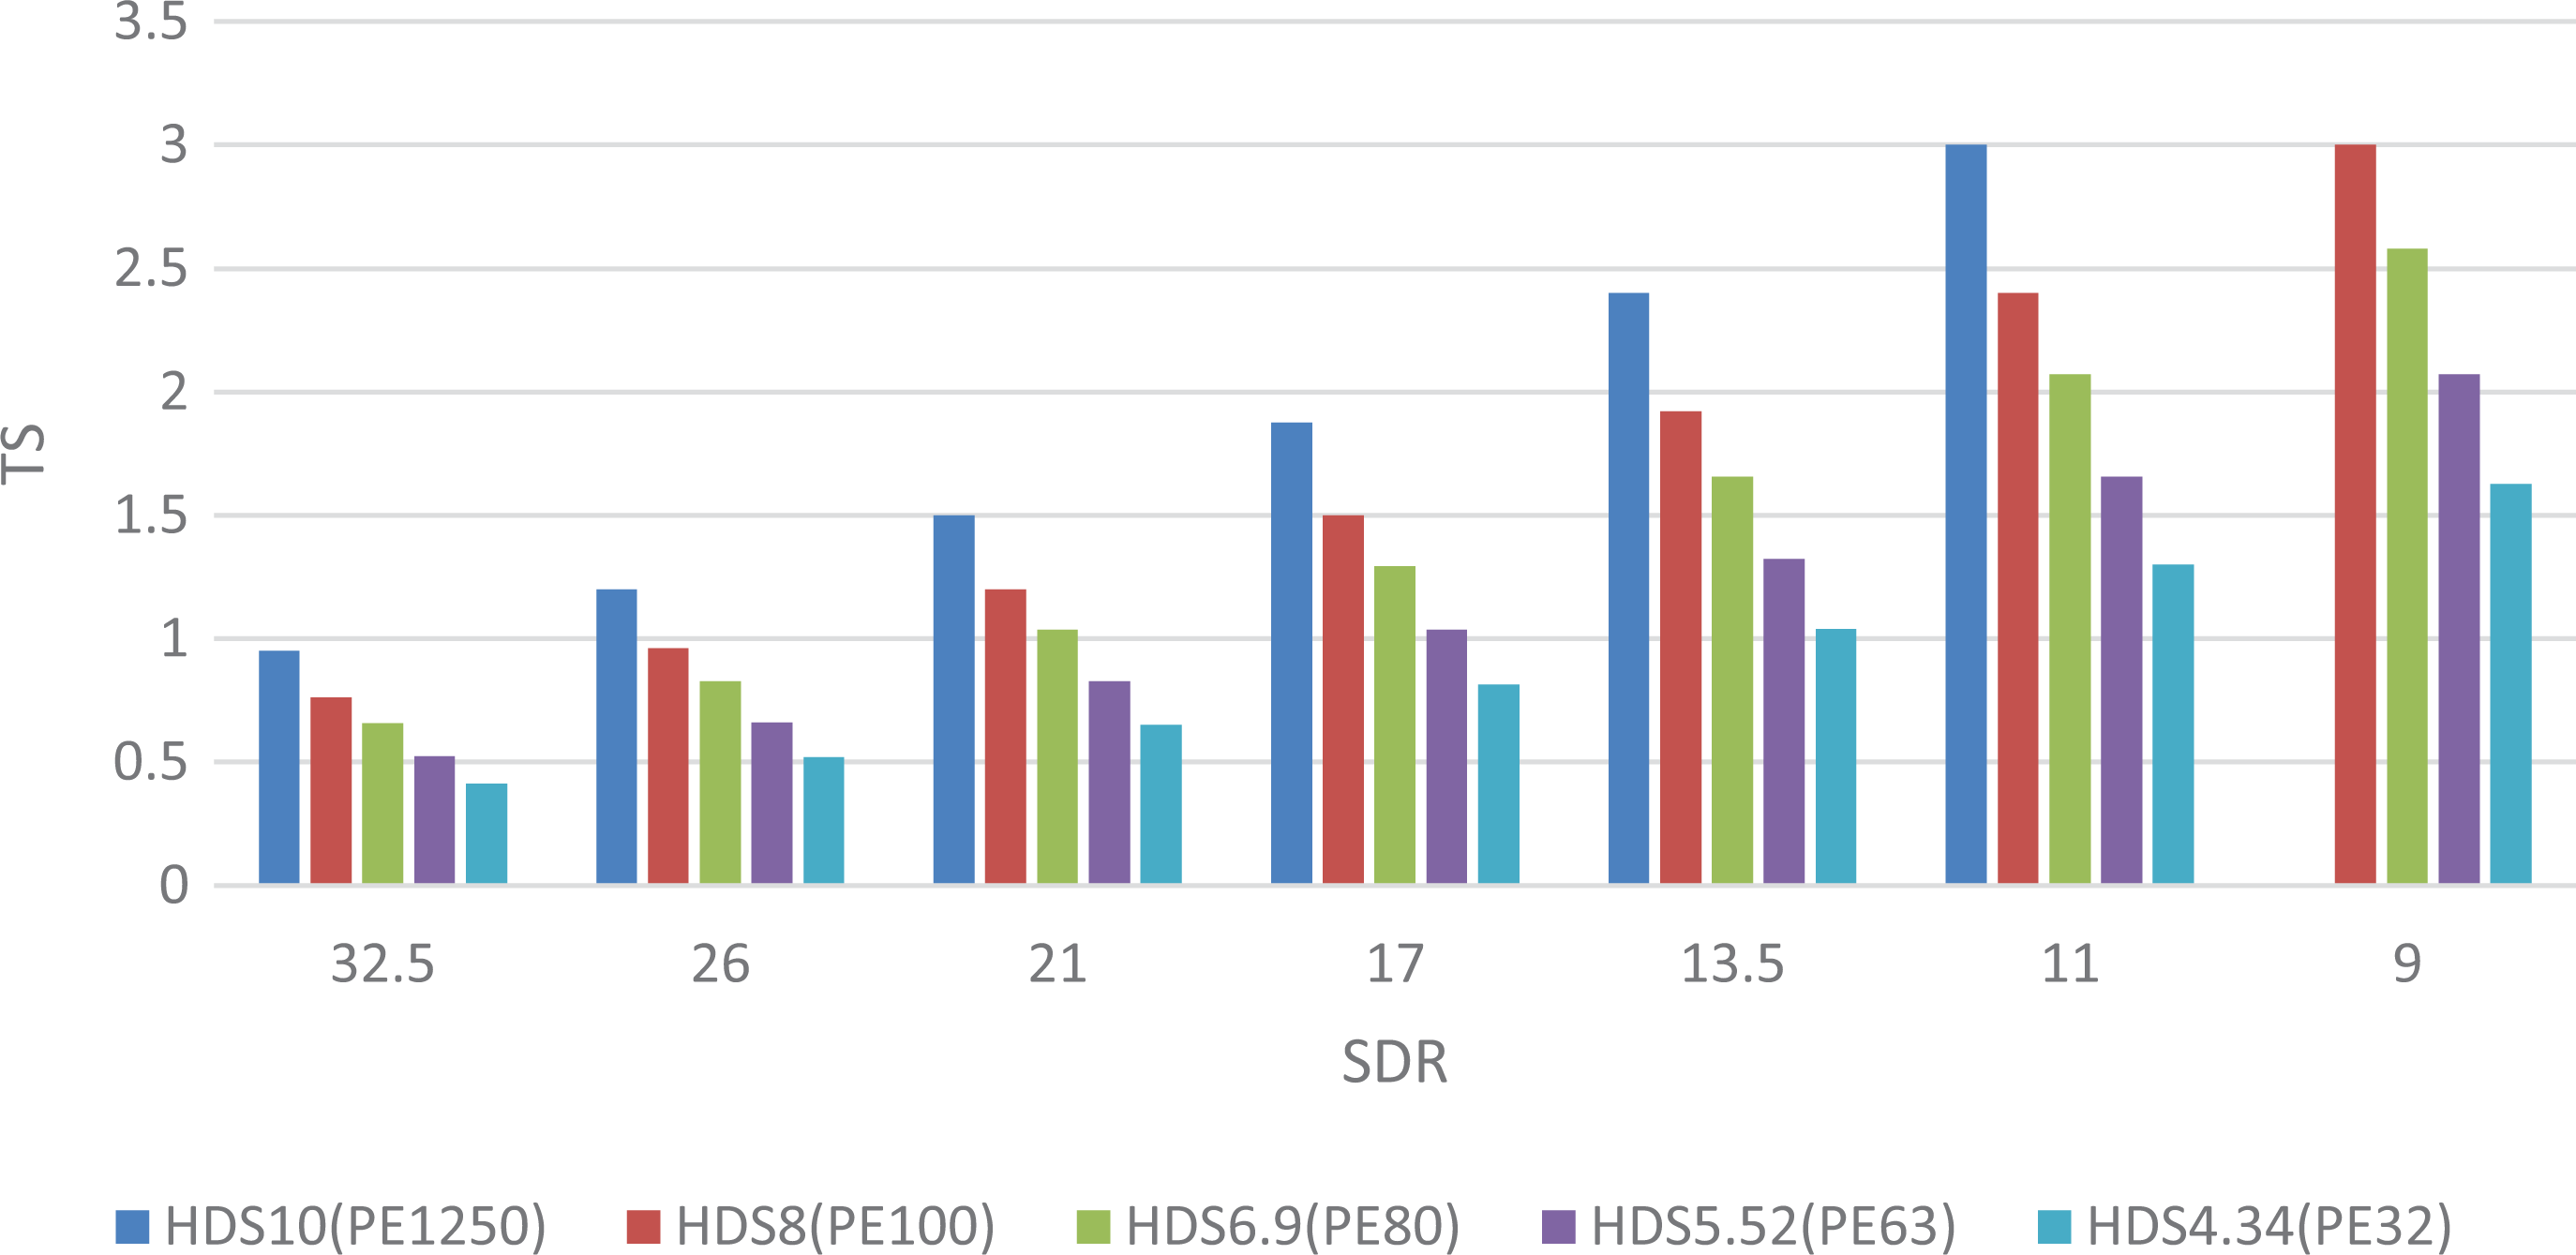
Depictions of equivalent tangential stresses (TS) developed in PFRHDPE pipes of different SDRs.
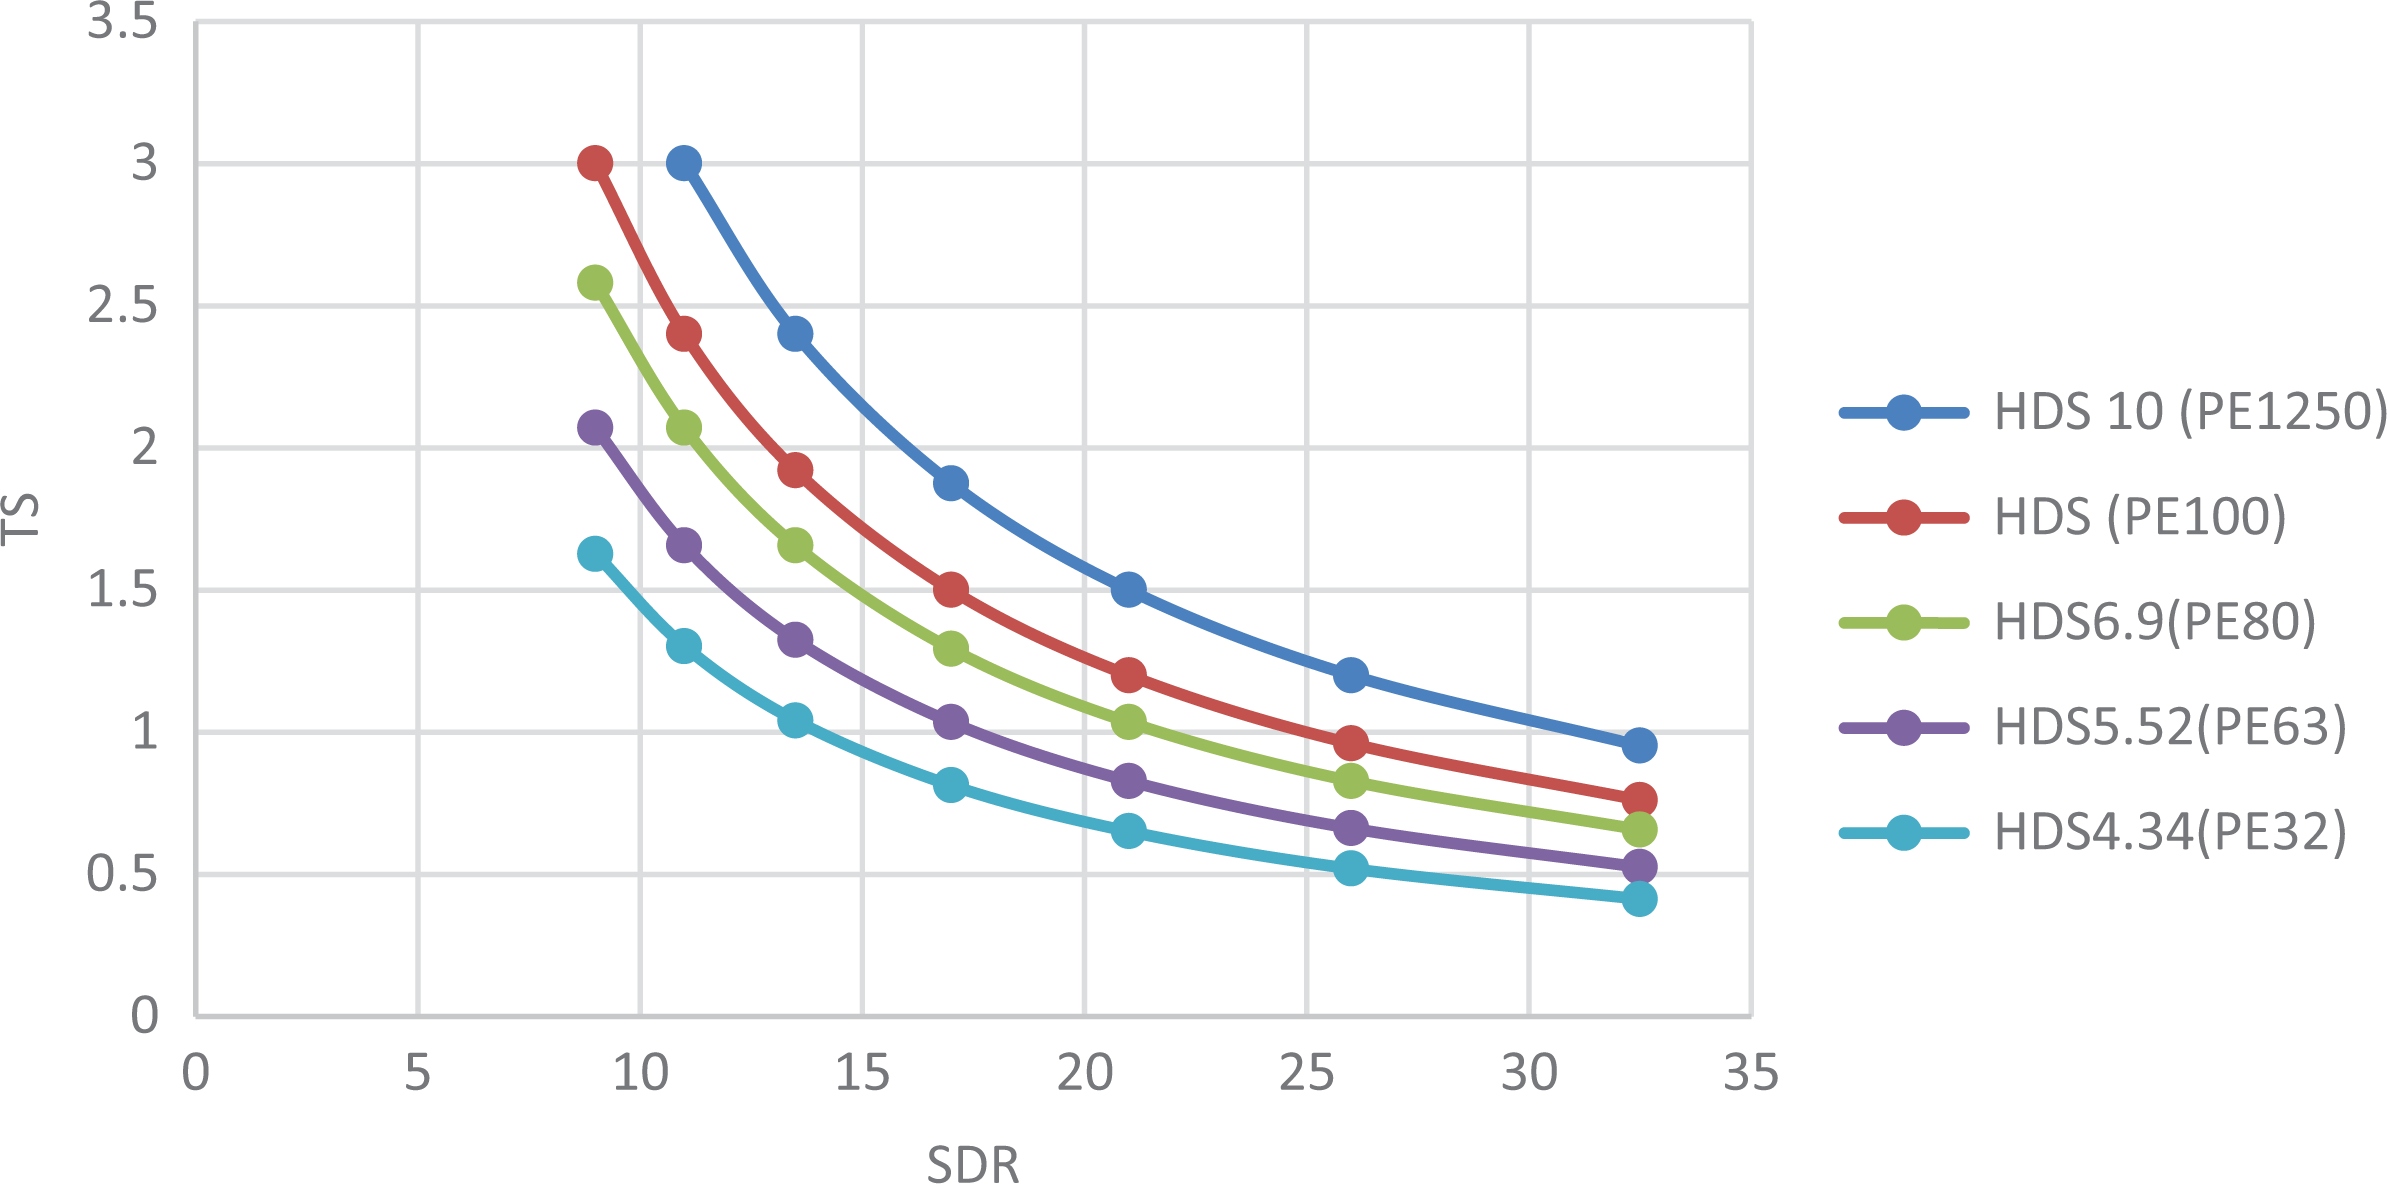
Depictions of equivalent tangential stresses (TS) developed in PFRHDPE pipes of different SDRs.
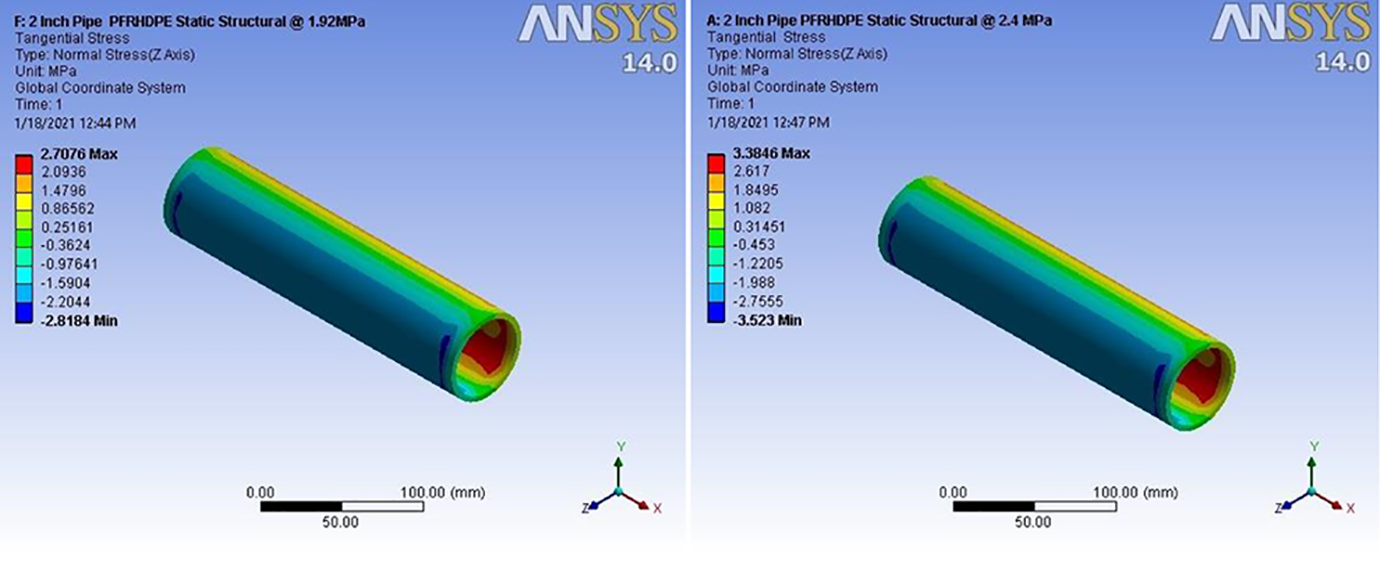
Pressure tests at 1.92 and 2.4 MPa for SDR 13.5 on 2 inches pipe.
MRS at 50 years and 20°C, MPa.
The induced stresses on SDR 13.5 at varying pressures and temperatures reported in Table 8 are also further explained with the graphics of Figures 2 and 3. Figures 2 and 3 show that the induced tangential stress reported in Table 8 decreases with increasing SDR and that the induced tangential stresses never exceeded the yield strength of the material tested which is 50 MPa.
Finite elements analysis results
Figures 4 to 6 show pressurization of SDR 13.5 of MRS of 8 and 10 MPa of PE100 and PE125 with pressure ratings of 1.92 and 2.4 MPa respectively. The HDSs of Table 9 (the classical PE ratings) were compared with induced hoop stresses of Figures 4 to 6.
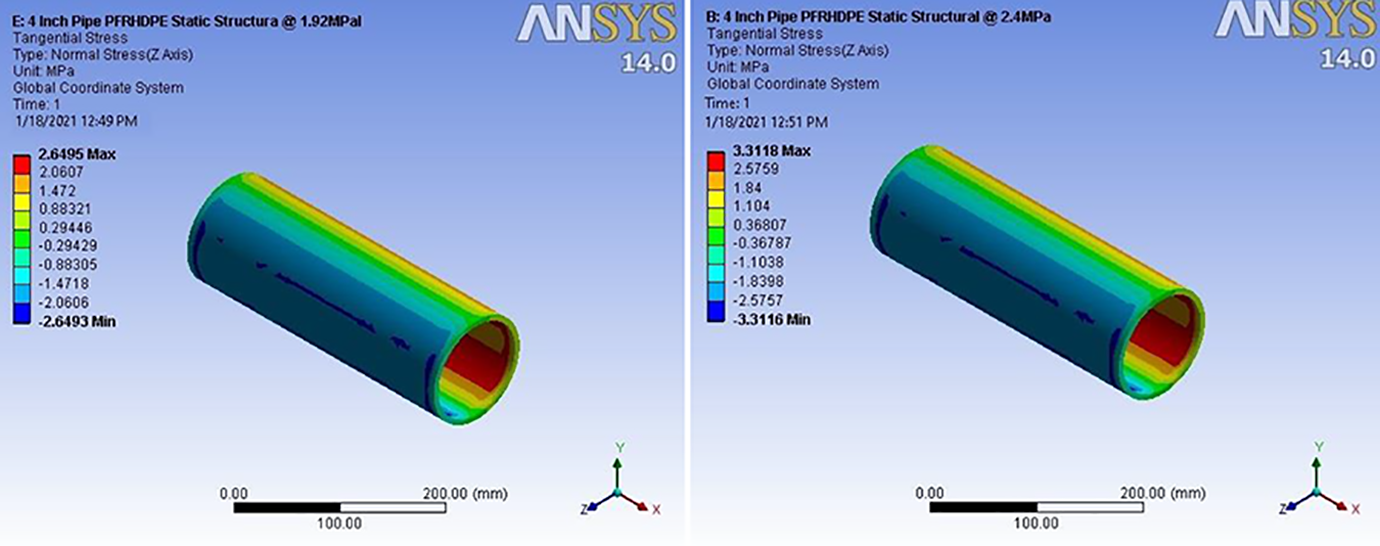
Pressure tests at 1.92 and 2.4 MPa for SDR 13.5 on 4 inches pipe.
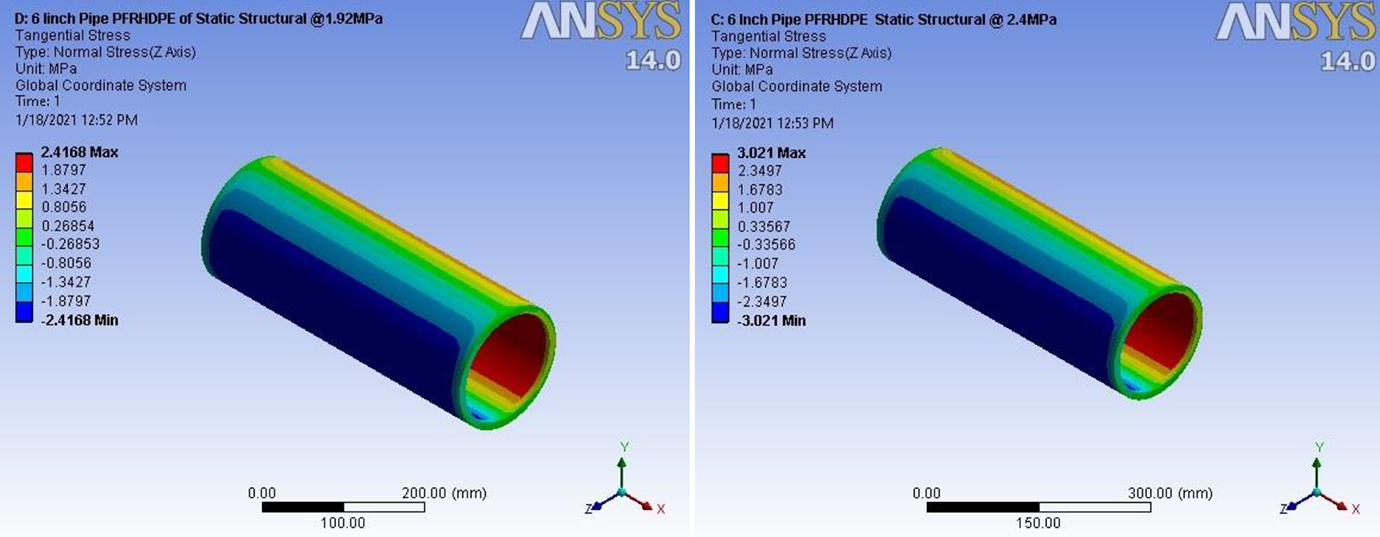
Pressure tests at 1.92 and 2.4 MPa for SDR 13.5 on 6 inches pipe.
Table 10 shows the nonlinear FEA transient thermal analysis of SDR 13.5 at various test pressures and temperatures for 2 inches, 4 inches and 6 inches pipes respectively. The nonlinear FEA transient thermal analysis report of Table 10 clearly show that the stresses increase with temperature and test pressure, but temperature has more effect than the test pressure and pipe size.
Transient thermal analysis of SDR 13.5 at varying test pressures and temperatures.
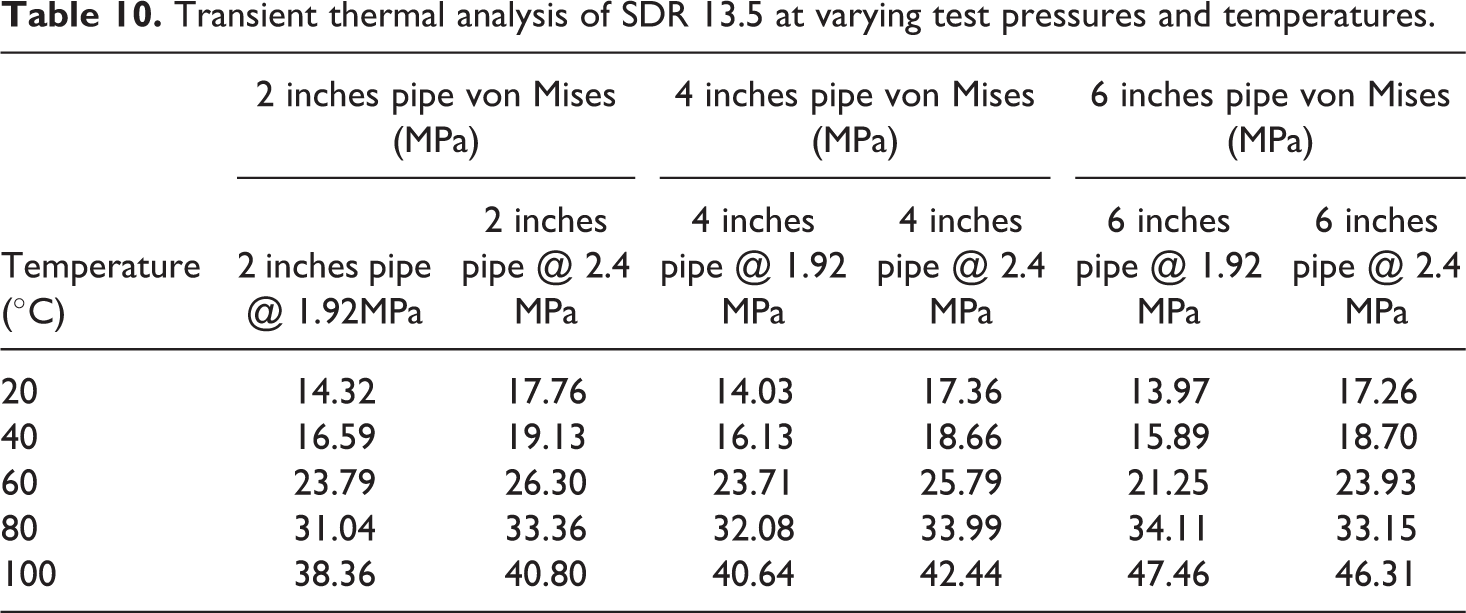
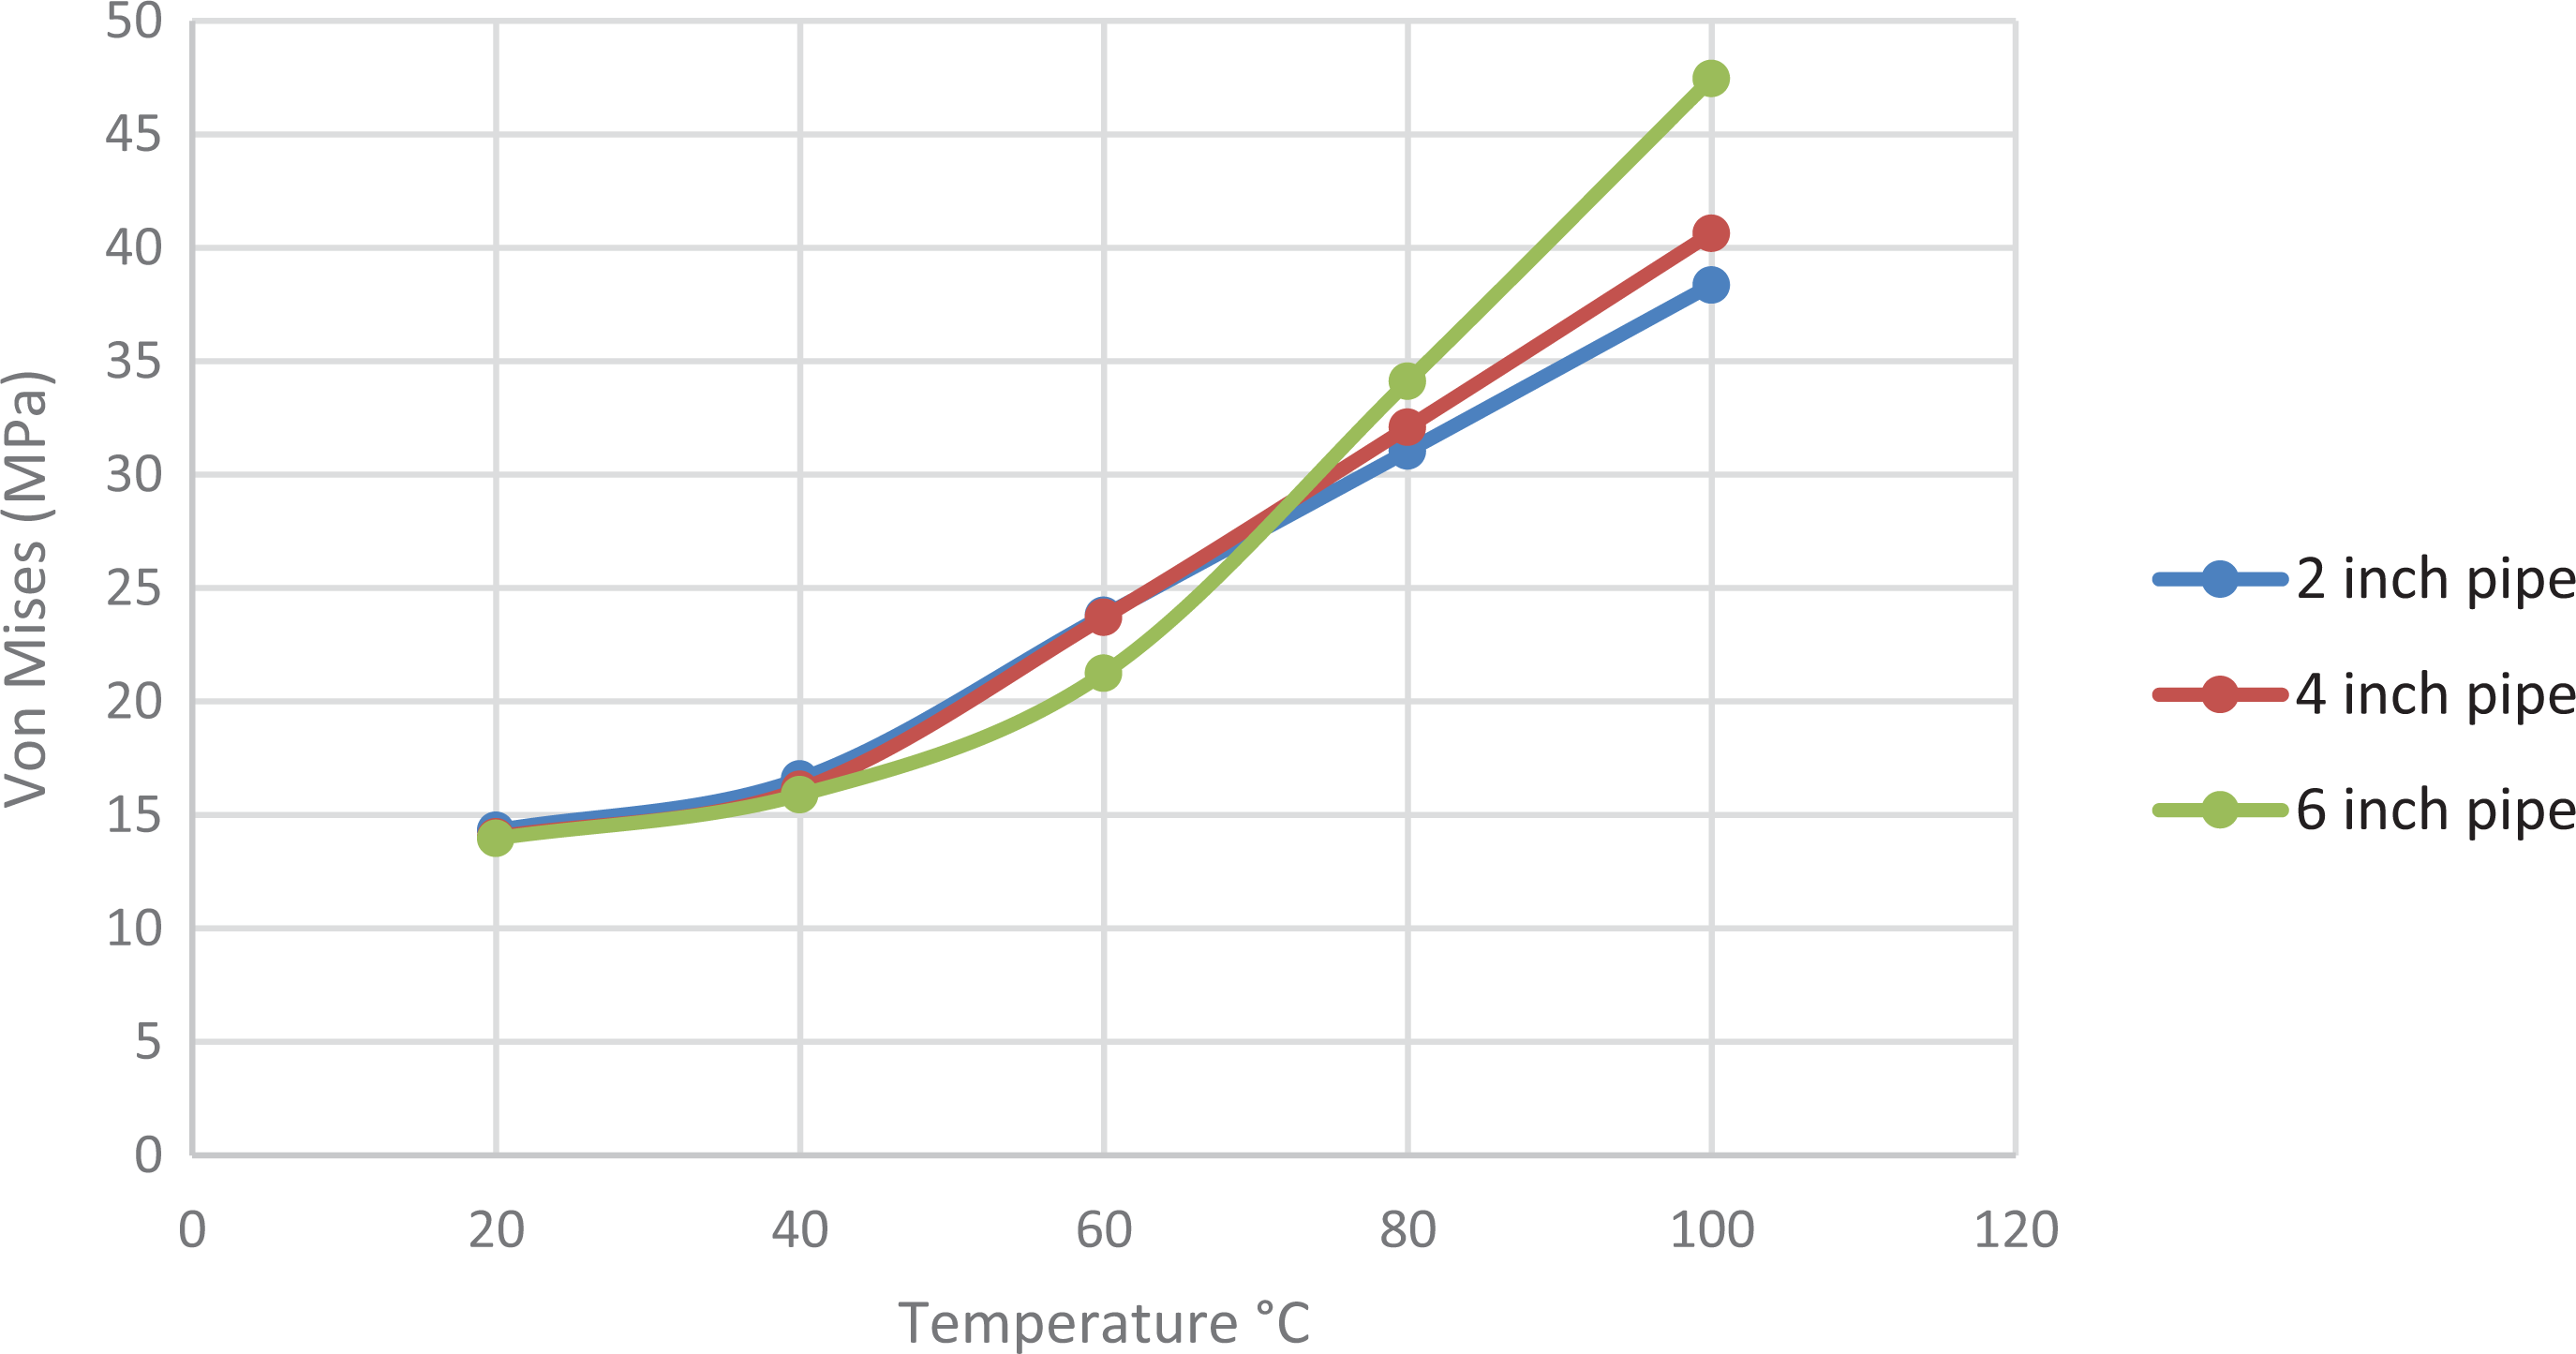
Figures 7 and 8 further explained the extent to which thermal stresses could contribute to the failure of PFRHDPE pipes. On the whole, the induced thermal stresses never exceeded the yield strength of the material.
Transient thermal analysis of SDR 13.5 at varying test temperatures and pressure 1.92 MPa.
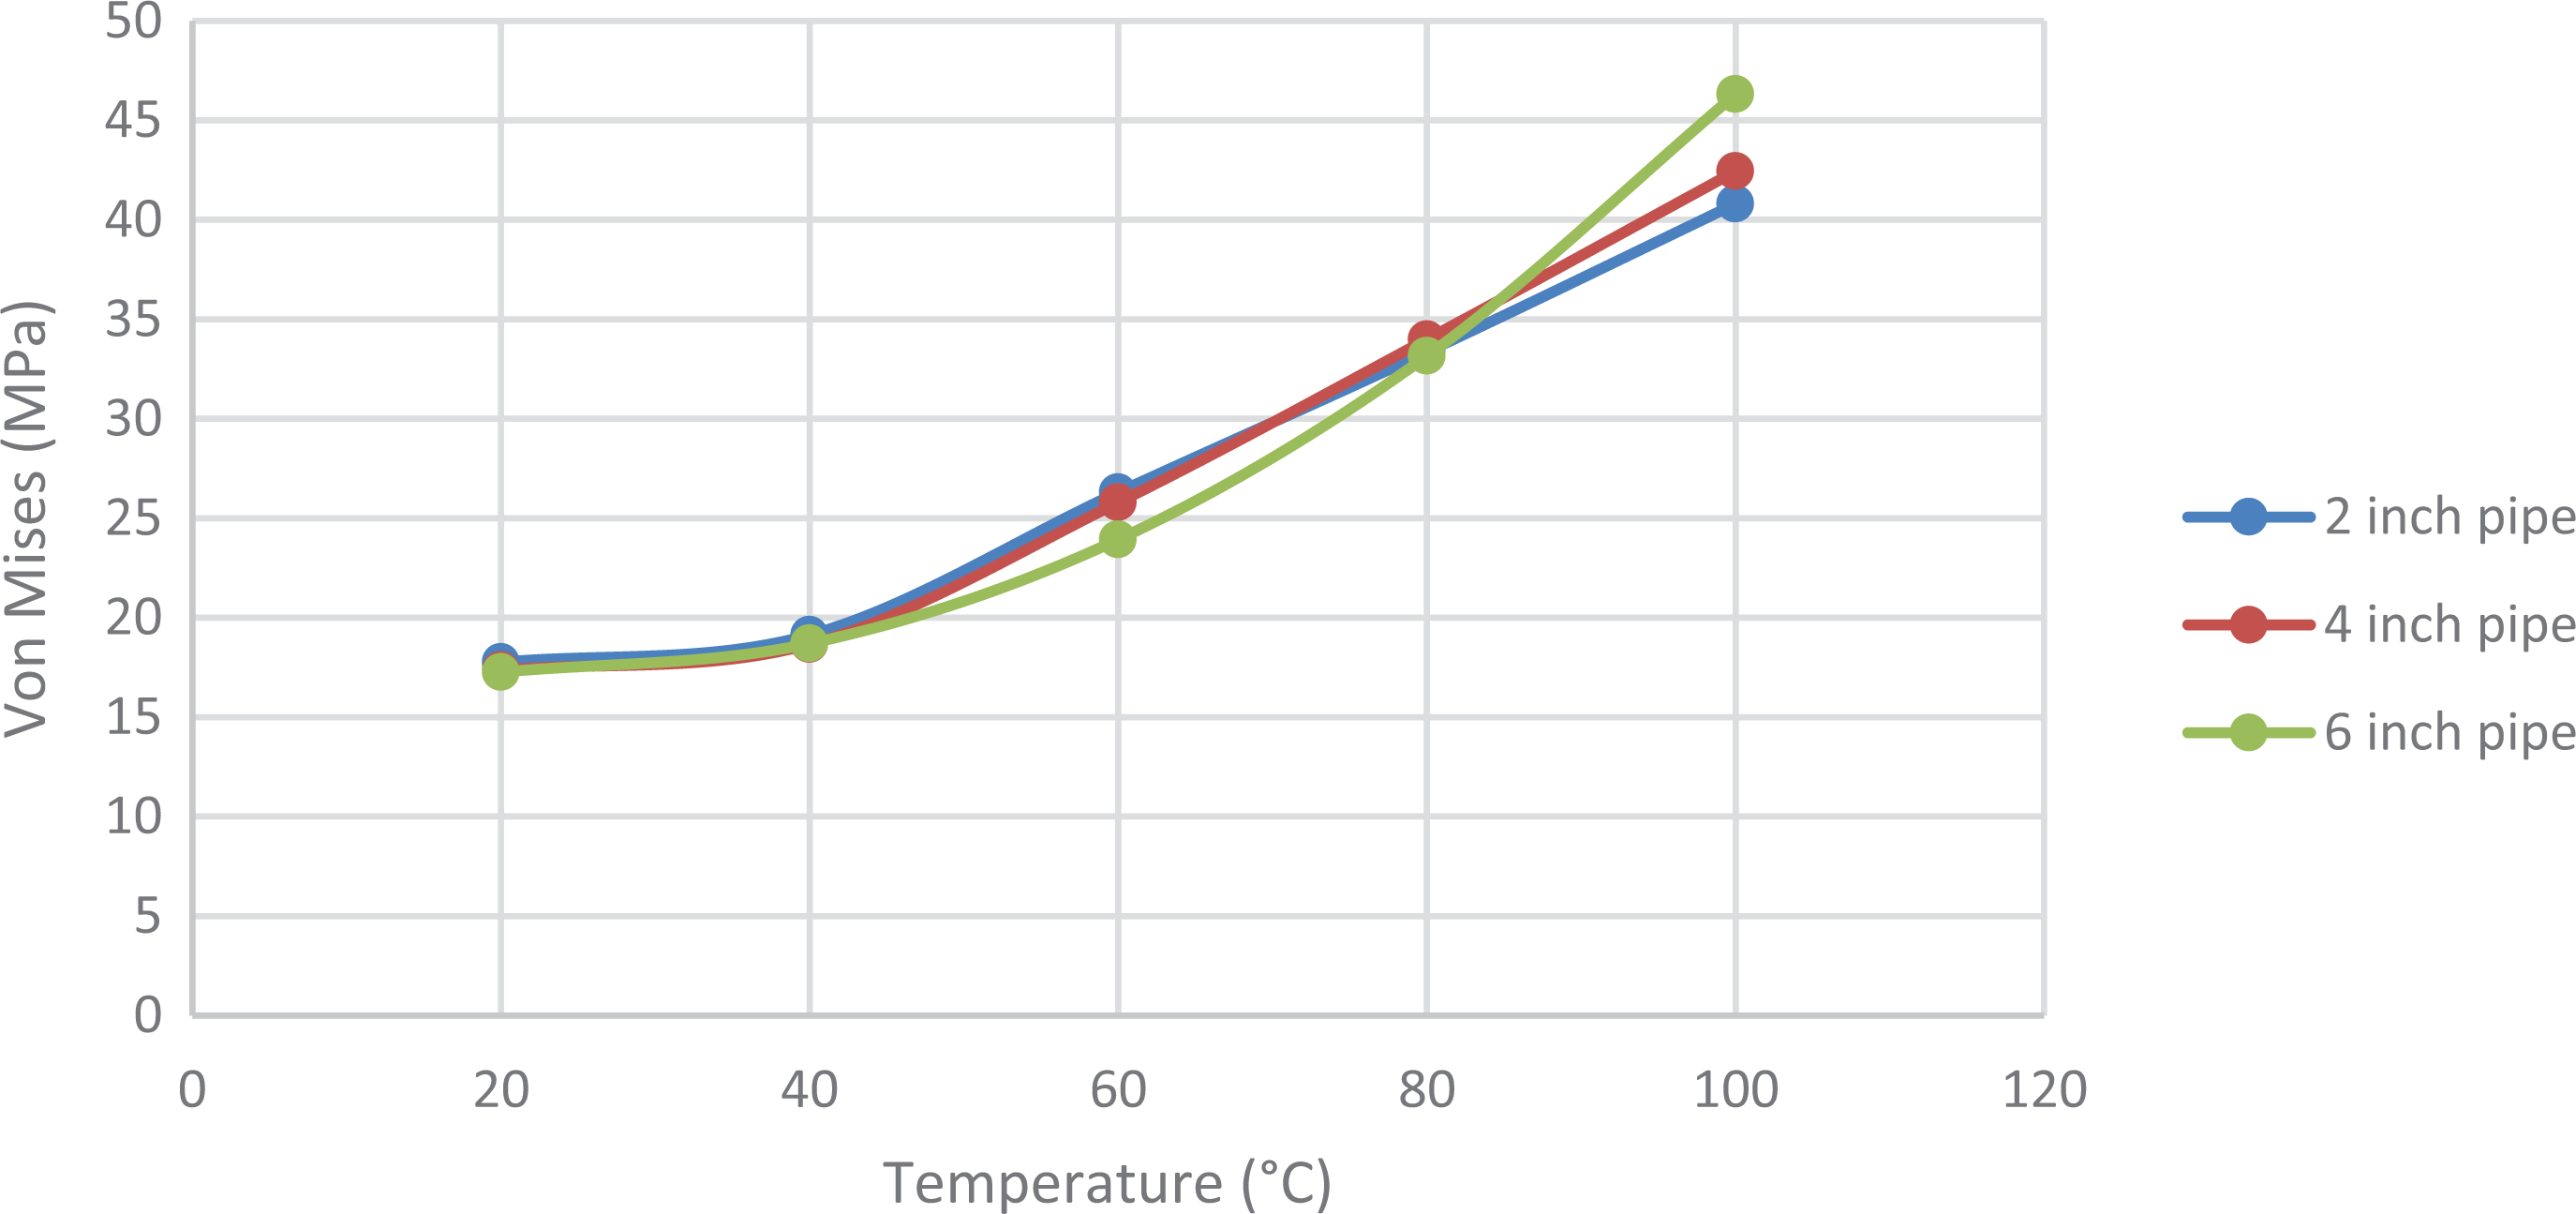
Transient thermal analysis of SDR 13.5 at varying test temperatures and pressure 2.4 MPa.
Figure 9 shows that the polyethylene matrix material is not recommended to be used beyond temperature of 60°C, Table 10 and Figures 7 and 8 showed that PFRHDPE can be used beyond 60°C since at 100°C the von Mises stresses are still below the yield strength of the composite material which is 50 MPa. The user of information of Table 10 should be guided with temperature derating factors of Figure 9.
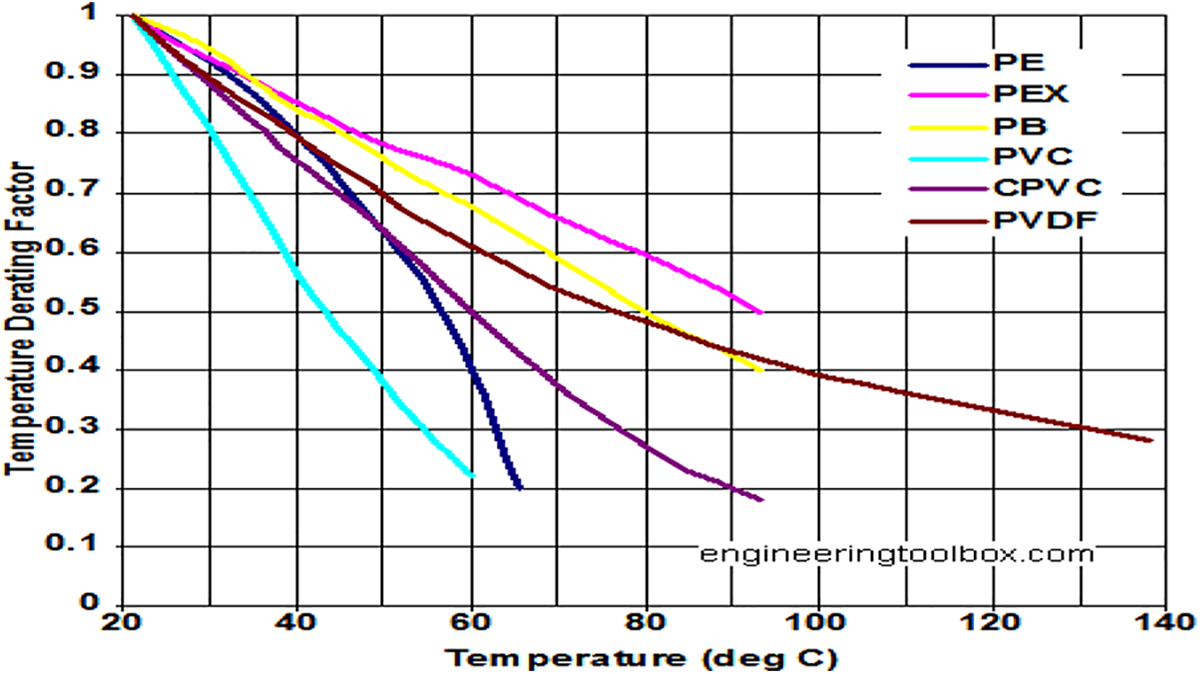
Plastic temperature and temperature derating factors. 34
The operating pressures of material at elevated temperatures can also be established by applying temperature and pressure derating factor 34 as depicted in Figure 9 to MAOP established in Table 8 for varying SDRs. Thermoplastic materials loose strength to pressure and tension with increasing temperature as depicted in Figure 9. The pressure of pipes estimated for operations at room or laboratory conditions needs to be modified by multiplying the room temperature pressure with the derating factor. The derating factors 1, 0.9, 0.9, 0.8, 0.8, 0.7, 0.5, 0.4 and 0.2 are for operations at 20°C, 21°C, 27°C, 32°C, 38°C, 43°C, 49°C, 54°C, 60°C and 66°C as depicted in Figure 9. Thermoplastics are not resistant for long term service at temperatures 71°C–138°C.
Material costing
Fiber particles cost estimation
We need to know the quantity of materials needed for the yearly production by knowing our extrusion rate (extrusion line capacity). Some basic data employed include: the extrusion rate is 50 kg/hr, the number of working hours in a day is 8 hrs, the number of working days in a month is 22 days, the number of working hours in a year is 2112 hrs and the total production quantity is 44235.92 kg. The equation employed for depreciation is the Modified Accelerated Cost Recovery System (MACRS) method expressed by Dieter 55 as;

where D = depreciation, Ci = initial cost, q = recovery rate.
PFRHDPE composite cost estimation
Various inputs for pipe extrusion including fixed and variable costs were considered in the evaluation of the unit cost of new pipe material mixture. The cost of composite comprising resin, compatibilizer, depreciation, modified ground plantain fibers at 20% weight fraction were considered.
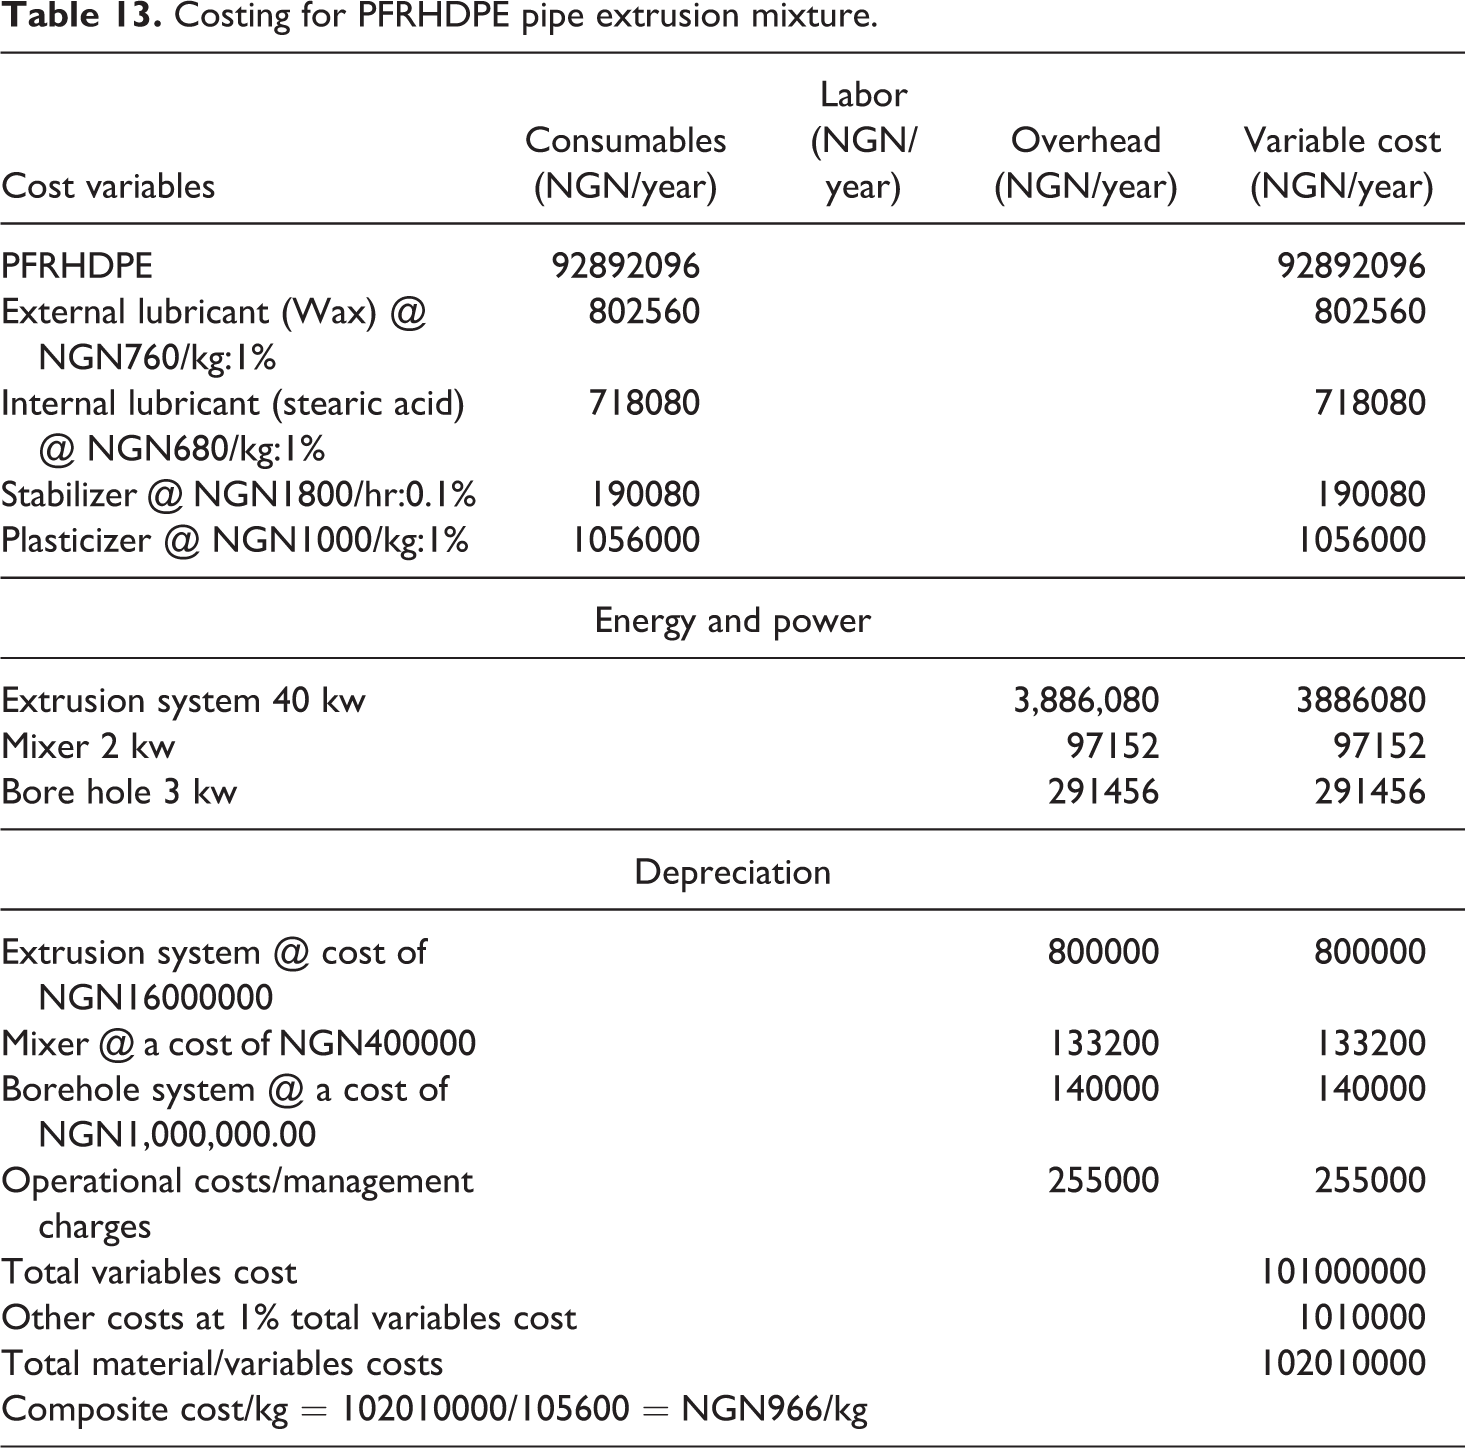
Formulation and costing for PFRHDPE pipe extrusion
The fixed and variable costs associated with pipe extrusion were considered for the developed PFRHDPE composite. This involves estimation of cost of mixture per kilogram. One year production basis is considered to quantify the inputs costs. Extrusion rate is 50 kg/hr, the number of working hours per year is 2112 hrs on one shift and the quantity of production is 105600 kg.
Costing injection of PFRHDPE
Injection machine data and basis: short size is 221 cm3, injection weight is 201 g, injection rate is 105 g/s, cycle time is 30 seconds, the number of working days in a month is 22, the daily working hours is 8 hrs (8*60*60 = 28800 secs), the number of daily cycles = 28800/30 (960 cycles), the number of cycles for the 22 working days in a month = 960*22 (21120 cycles), the number of yearly cycles = 21120*12 (253440 cycles). But, injection weight per cycle is 201 g/s, quantity of PFRHDPE needed in a year = 253440*201 = 50941440 g/year (50941.44 kg/year = 51 ton/year).
Evaluation of pipe material cost for SDR 13.5 of PFRHDPE for pipeline
Some basis was employed to estimate the cost of PFRHDPE mixture for production of pipes of SDR 13.5. Design pressure, PR
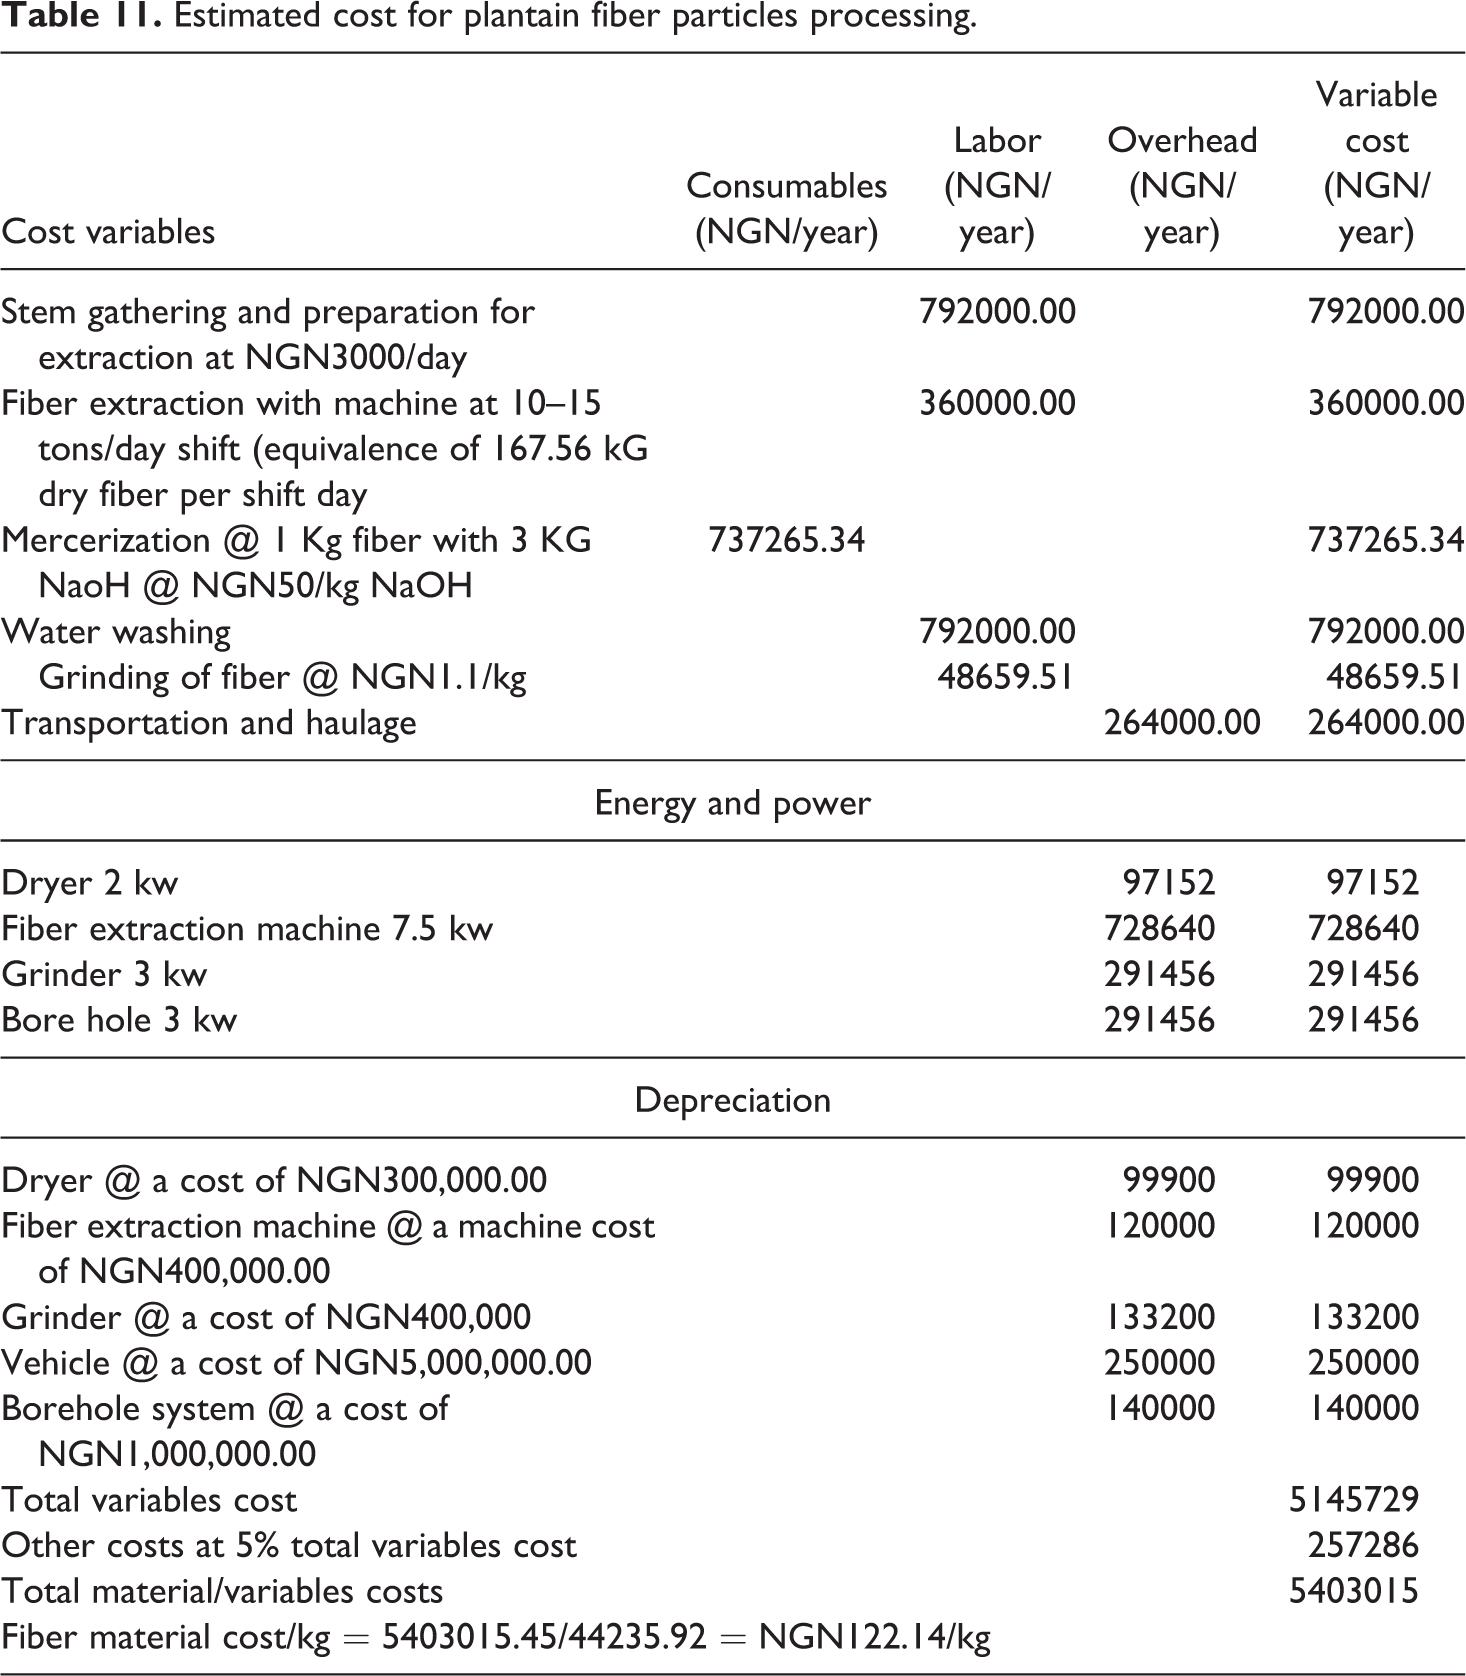
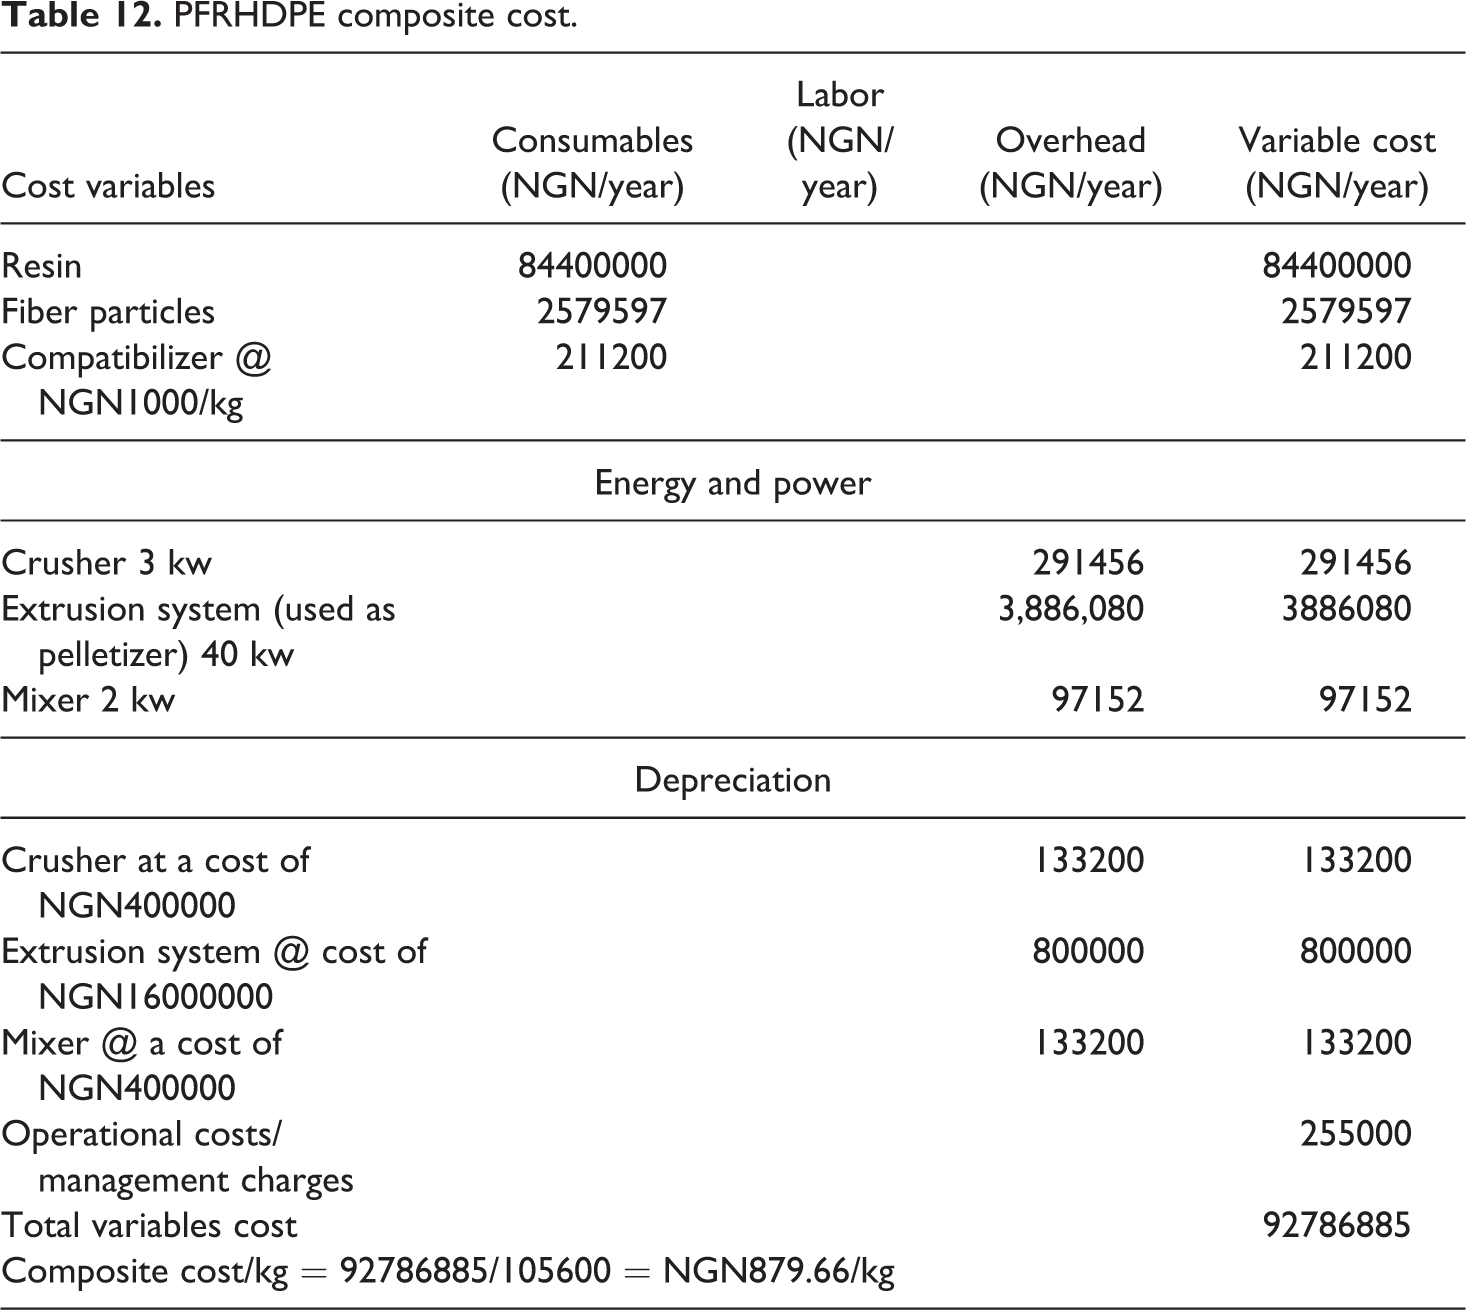
Table 11 depicts the estimated cost of processing plantain fiber particles, showing all the processes/machines involved and the associated costs. It shows that the cost of processing of 1 kg of plantain fiber particle is NGN122.14. Using the cost of fiber already computed in Table 11 and the cost variables in Table 12, the cost of PFRHDPE composite was computed as NGN879.66/kg as shown in Table 12. The composite cost of Table 12 (NGN879.66/kg), was used with the cost variables of Table 13 to estimate the cost of pipe extrusion mixture depicted in Table 13 as NGN966/kg. The cost of extrusion mixture estimated in Table 13 as NGN966/kg was used with specifications of SDR 13.5 to estimate the material cost of the nominal pipe sizes of SDR 13.5 as depicted in Table 14. The production cost of the pipes class can now be evaluated when the other cost categories are considered. In a gas transmission line, 50–55% of the cost of the project accounts for the weight of steel. 56
Estimated cost for plantain fiber particles processing.
PFRHDPE composite cost.
Costing for PFRHDPE pipe extrusion mixture.
Costing for PFRHDPE injection mixture.
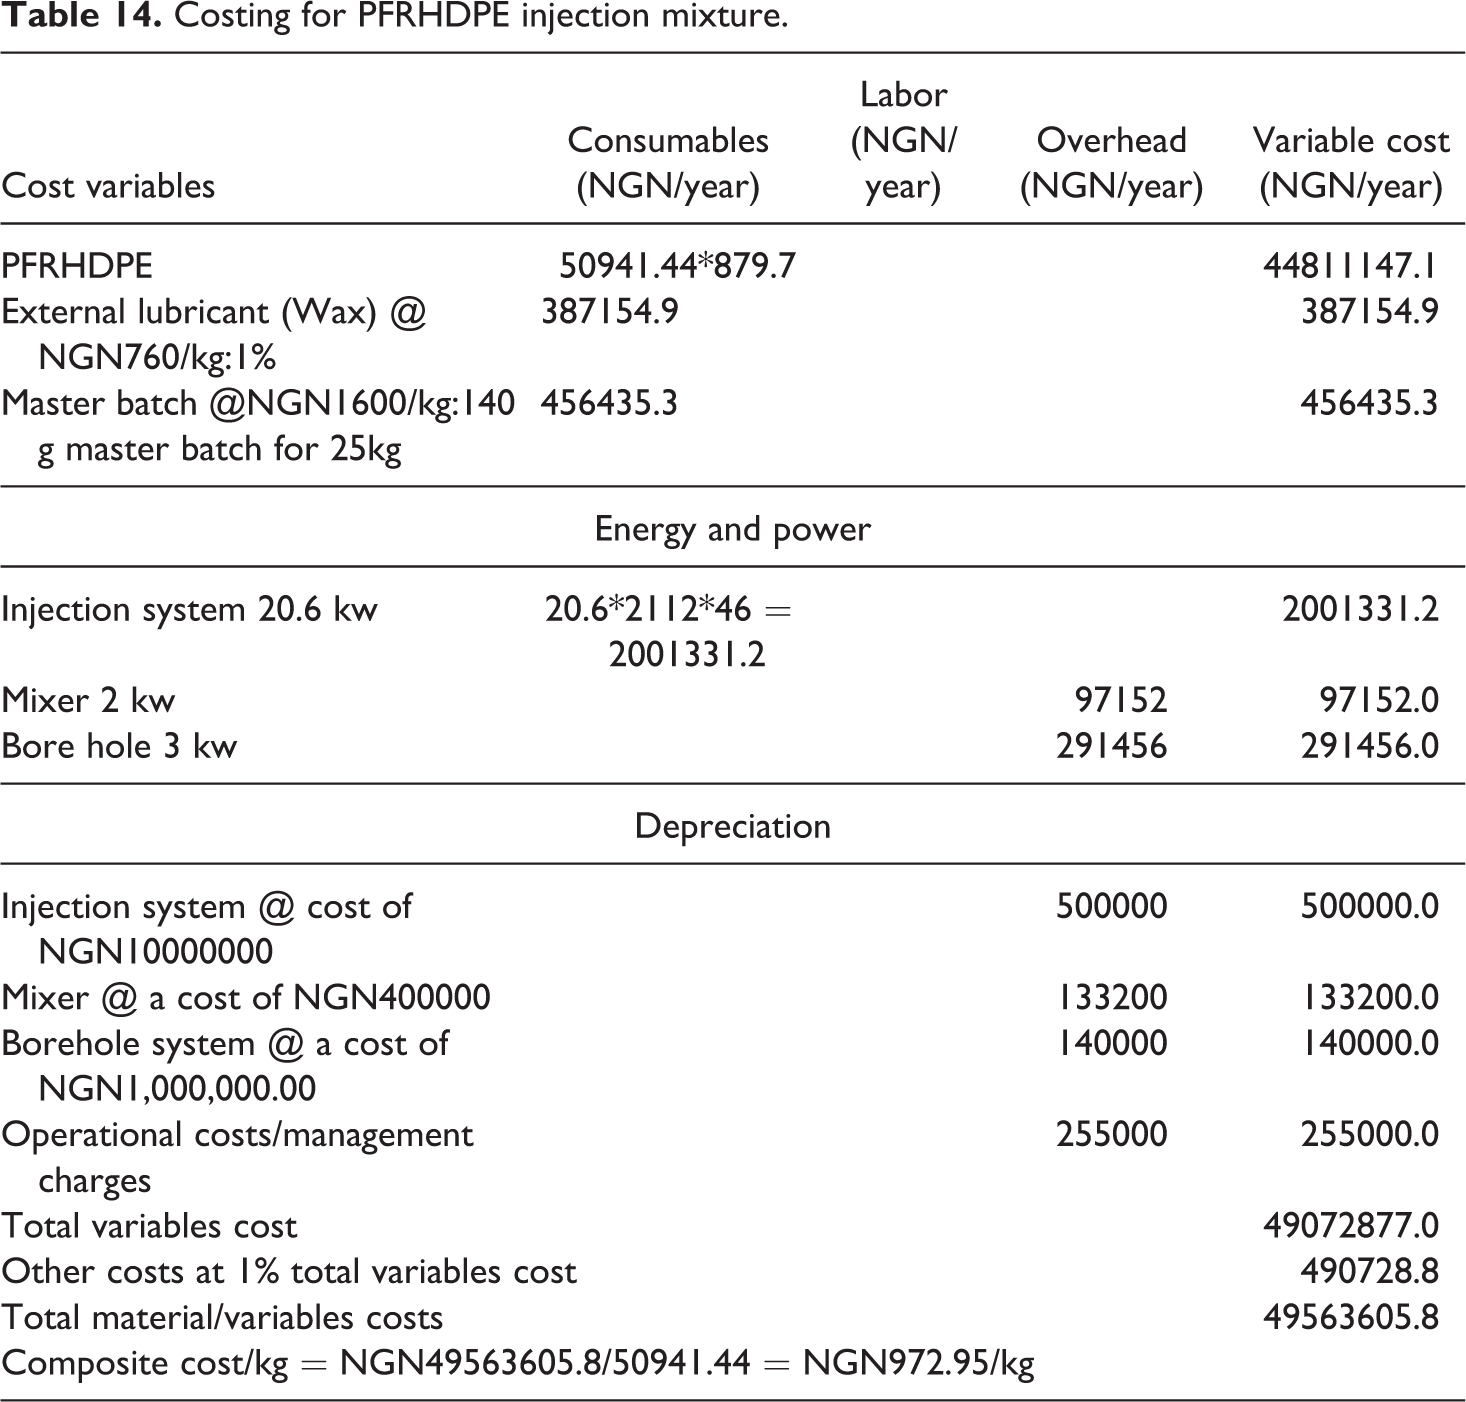
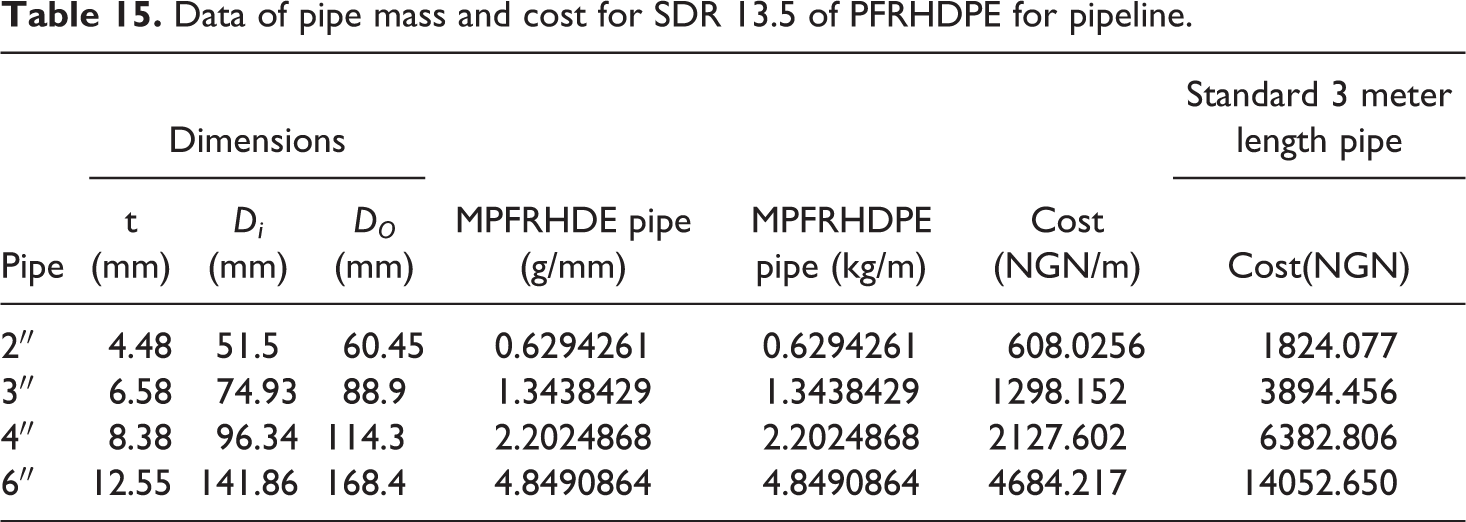
Table 15 depicts the material costs of pipes made with PFRHDPE pipes on SDR 13.5. It further shows that the material costs increase with pipe size. By considering ASME standard steel pipe sizes and for 4 inches’ nominal size of schedule XS with wall thickness 8.56 mm, outside diameter 114.3 mm and weight per unit length of 22.32 kg/m. 57 If the cost of steel is NGN260/kg, the material cost of 4 inches pipe of SDR 13.5 becomes 22.32*260 = NGN5803.2 which is lower than NGN6382.806 of Table 15 for PFRHDPE new material. It is a popular misconception that plastics are cheap materials.
Data of pipe mass and cost for SDR 13.5 of PFRHDPE for pipeline.
On a weight basis most plastics are more expensive than steel and only slightly less expensive than aluminum. However, it should always be remembered that is a bad design practice to select materials on the basis of cost per unit weight. 33 In the mass production industries in particular, the raw material, cost is of relatively little importance. It is the in-positions cost which is all important. Crawford 33 reported that, the in-position cost of a component is made of the raw material costs, fabrication cost and performance costs where the fabrication costs include power, labor, consumable, etc and that the energy required to manufacture and process steel products is about 480 MJ/m2, while that of plastics is about 320 MJ/m2. In terms of the overall energy consumption, plastics come out much better than metals. Performance cost relates to servicing, warranty claims etc. On this basis plastics can be very attractive to industries manufacturing consumer products because they can offer advantages such as color fastness, resilience, toughness, corrosion resistance and uniform quality.
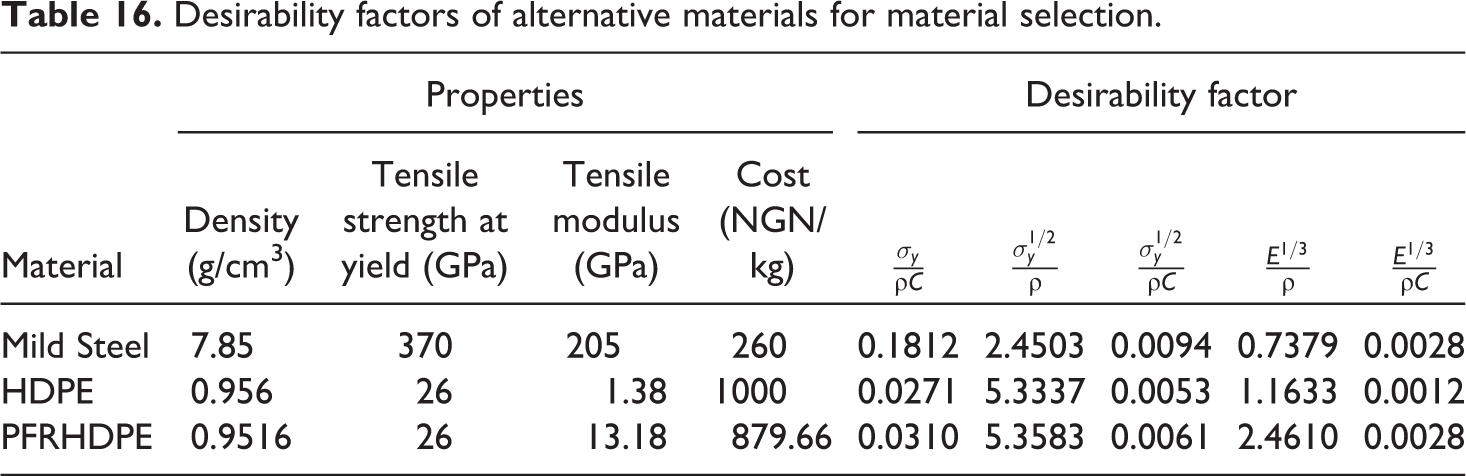
Table 16 with highest desirability values for specific properties of PFRHDPE confirms that PFRHDPE is a better pipeline material than steel and HDPE. Table 16 shows that in terms of cost, steel is fairly better without margin. It is not a good practice to select engineering material on the basis of cost per unit weight alone.
Desirability factors of alternative materials for material selection.
Conclusion
This study established the performance level and cost of plantain fibers reinforced High Density Polyethylene (HDPE) matrixes as gas pipeline material using pressure containment of the new materials as performance criterion. This study established the following: The burst pressure evaluated for available SDR using the ultimate tensile strength of PFRHDE is very much greater than the standard SDR design pressures even when the temperature derating factors are applied. The MAOP of PFRHDPE and induced stresses of pressurized pipes established indicated that the new material is suitable for pipeline design. The cost of modified plantain fibers, the cost of plantain fibers reinforced HDPE (PFRHDPE) and the cost of PFRHDPE master batch (HDPE resin + plantain fiber particles + additives including, stabilizer, plasticize) for pipes extrusion production and pipelines fittings injection productions were established. The PFRHDPE developed has better specific properties than the conventional steel and HDPE pipe material in terms of yield strength, elastic modulus and density of the new material. But in terms of cost, steel and HDPE have approximate desirability for selection with PFRHDPE. The energy required to manufacture and process steel products is about 480 MJ/m2, while that of plastics is about 320 MJ/m2 as reported by Crawford.
33
The new material, PFRHDPE is recommended since it has approximately the same desirability function value with steel and HDPE and higher desirability function values for specific properties. The study also established that PFRHDPE can be applied in the design of oil and gas gathering, transportation and distribution lines for natural gas and LPG lines.
The performance qualities such as environmental effects resistance (corrosion resistance, environmental stress corrosion resistance (ESCR), and creep strength) need to be considered during material selection. Further studies on this new composite material, PFRHDPE, will involve studying the above listed quality characteristics and comparing the results with the already established materials in Oil and Gas Pipeline. Also, energy and power required to process the material need to be considered as well as the specific properties and availability etc. need to be considered.
Footnotes
Funding
The author(s) disclosed receipt of the following financial support for the research, authorship, and/or publication of this article: This work was supported by the Tertiary Education Trust Fund (TETfund), through Institution Based Research grant (IBR). Years 2016–2017 Merged TETfund Research Projects (RP) Intervention Funds 12th Batch of August 2018.