
Abstract
Silica-based (SiO2) poly(3-hydroxybutyrate) (PHB) nanocomposites were obtained via an in situ sol–gel route in three distinct particle concentrations (1, 5, and 7.5% by weight of PHB). The polymer hybrids formed were analyzed via wide-angle X-ray diffraction (WAXD), small-angle X-ray scattering (SAXS), Fourier transform infrared (FTIR) spectroscopy, and time-domain nuclear magnetic resonance relaxometry (TD-NMR). The SiO2 inorganic structure displayed surface fractal features at low concentration (1 wt%) and denser agglomerates at higher concentrations (5 and 7.5 wt%). FTIR and SAXS results confirmed the formation of the inorganic matrix amid the polymer chains with different levels of distribution and organization. WAXD and TD-NMR results suggested the SiO2 influence on the PHB crystallinity degree, which was reflected on the polymer’s molecular dynamics with a nonlinear dependence of particles concentration in the PHB matrix.
Introduction
Poly(3-hydroxybutyrate) (PHB) is an aliphatic biodegradable polyester that can be obtained through several sources such as bacterial,1,2 vegetables,3,4 and oils.5,6 There have been extensive studies on PHB over the years due to the fact that this polymer has physical properties similar to polypropylene. 7 This polymer also presents extensive attractive features, such as biocompatibility, extremely high biodegradability rates, and can be converted to carbon dioxide and energy by common microorganisms, such as bacteria, fungi, and algae. 8
With properties such as high crystallinity degree (50–70%), excellent gas barrier (H2O vapor permeability ≈ 560 g.µm m−2 day−1), and notable mechanical properties (elastic modulus of 3 GPa and tensile strength at break of 25 MPa), PHB is well sought after in the industry. However, PHB presents a technological challenge: it is a brittle polymer, with low elongation at break, low thermal stability when above its melting point, and low degradation temperature. 9 To enhance PHB degradability rates, Silva et al. 10 created blends of PHB/polyethyleneglycol (PEG) and nanocomposites through solution casting method containing different amounts of vermiculite clay (VMT). The group concluded that the addition of both PEG and VMT created a more ideal environment for increasing water permeability and, consequently, a quicker hydrolytic degradation. The use of PHB with 5 wt% Nanomer I44.P, an organically modified clay with dimethyl dialkyl (C14–18) ammonium, 11 presented the same quick hydrolytic reaction.
PEG-grafted silica (SiO2) nanoparticles were inserted on a PHB matrix, which yielded a better nanoparticle distribution due to good interaction between PEG/PHB matrixes and slowed the crystallization rate and the crystallinity degree of the nanocomposites, thereby broadening the degradation rate of this polymeric matrix. 12 Lan and Sun 13 reported several cases of different SiO2 nanoparticles which highlighted the influence of the type and source of a given filler (viz neat commercial SiO2 (S5130 and R812) vs. sol–gel obtained SiO2 nanoparticles) upon the properties of the obtained material. Whereas commercial SiO2 had the tendency of forming aggregates, sol–gel synthesized PEG-grafted silica nanoparticles showed themselves better distributed through the polymeric matrix.
SiO2 present many advantages, namely high surface area, reliable thermal stability, and increased biocompatibility. SiO2 is cheap and easy to synthesize, which makes it even more attractive. 14 Wu et al. 15 obtained flame-retardant/ethylene–octene copolymer/polypropylene composites, enhancing its flame-retardant properties by increasing the SiO2 content. Mechanical properties of this nanocomposite were also increased when increasing the SiO2 content. Similarly, when used in a cross-linked polylactide (PLA) hydrogel, SiO2 greatly improved the thermal resistance of this material, but decreased its mechanical properties when compared to the neat hydrogel. 16
Sol–gel chemistry represents a widely popular synthesis strategyfor a large range of popular organic/inorganic materials because of its convenience and versatility. This method consists of a generation of colloidal suspensions (the sol phase, with particles in the range between 1 nm and 100 nm) which gains viscosity, though the formation of the covalent bonds, leading to a gel material. 17 The first step generally consists of mixing the desired alkoxide or organometallic precursors, followed by hydrolysis and polycondesantion of the inorganic network. 18 Several sol–gel products are used as biomaterials, since this route yields compounds with notable biocompatibility and lower toxicity.19,20 Furthermore, there are already sol–gel materials applied in soil and pollution control, 21 sensors, 22 and other applications. Huang and Chen 23 obtained poly(vinylidene fluoride)(PVDF)/sol–gel SiO2 composites. These composites displayed well-distributed SiO2 particles through the polymeric matrix, which decreased PVDF crystallinity degree due to the in situ insertion of SiO2 particles. Bioactive SiO2 materials were created with copolymers of methyl methacrylate, 3-(trimethoxysilyl)propyl methacrylate, and sol–gel synthesized SiO2. The hybrids, when compared to their non-loaded counterparts, became tougher, more flexible, and exhibited lower toxicity in MC3T3 cell cultures. 24 Sol–gel obtained poly(ether imide)(PEI)/SiO2 hybrids were used to coat magnesium bone implants, since those materials tend to degradate extremely fast. The coating increases their hydrophilicity by 15%, which might have lead to a better cellular interaction and decreased the corrosion rate of the metallic implants. 25 Catauro et al. 26 also used sol–gel synthetized hybrids for implant coatings. Titanium implants were dipped into polycaprolactone/SiO2 hybrids solutions. The materials displayed premature biomineralization when immersed in simulated body fluid and increased cellular viability. Carbon nanotubes (CNTs)/SiO2 sol–gel-derived nanoparticles were incorporated into poly(vinyl alcohol)(PVA) and polyurethane (PU), and both the PVA/CN/SiO2 and PU/CNT/SiO2 nanocomposites displayed higher thermal stability when compared to their neat counterpart. 27
Taking into account the versatility of sol–gel SiO2-based materials, in this work, we sought to obtain SiO2 structures in situ through this method in a PHB matrix and characterize the properties of the hybrids through Fourier transform infrared spectroscopy (FTIR), wide-angle X-ray diffraction (WAXD), small-angle X-ray scattering (SAXS), and time-domain nuclear magnetic resonance (TD-NMR) methods.
Experimental
Preparation of the samples
PHB (10 wt%) solutions were prepared in Schott flasks using PHB (Biocycle Inc., São Paulo, Brazil, weight-average molecular weight 375.831 g mol−1) and chloroform (Sigma-Aldrich, São Paulo, Brazil, 99% purity) under magnetic stirring for 24 h and were heated until complete solubilization of the polymer. After solubilization, sufficient amounts of tetraethyl orthosilicate (TEOS; 98%, Sigma-Aldrich) were added to the polymer solutions to obtain hybrids containing 1, 5, and 7.5 wt% of SiO2. After stirring, the solutions were poured into petri dishes and left in a fumehood at room temperature for a week. The hybrid PHB films were taken to a vacuum oven to remove the residual chloroform and unreacted TEOS. The samples were then kept in a desiccator and thereafter hydrolyzed with a 10 wv% sodium hydroxide aqueous solution at 50°C for a certain amount of time, then washed with deionized water until neutral pH, and stored in a desiccator for characterization.
Infrared spectroscopy (FTIR)
The infrared spectra of the samples were recorded on a Varian 3100 spectrometer using an attenuated total reflectance accessory (Varian Inc., São Paulo, Brazil, ZnSe crystal), between 4000 cm−1 and 600 cm−1, with 120 scans and a resolution of 4 cm−1.
Wide-angle X-ray diffraction
WAXD profiles of samples were obtained on a Rigaku Ultima IV equipment (Japan). The parameters set were copper Kα (λ = 0.154 nm) radiation, at 40 kV and 30 mA, and the 2θ angle was varied between 1° and 50° by 0.01° steps. The crystallinity degree (% Xc, equation 1) of the sample was calculated through the Ruland-Vonk method 28 with the aid of the Fityk® 0.9.8 software.
Small-angle X-ray scattering
SAXS measurements were carried out on a laboratory SAXS instrument Bruker-Nanostar™ (Bruker Inc., São Paulo, Brazil), located at the Institute of Physics at University of São Paulo (USP), Brazil. This equipment is improved by the use of microfocus source Genix 3D coupled with Fox 3D multilayer optics and two sets of scatterless slits for beam definition, all provided by Xenocs™. The film samples were cut in the adequate shape and kept at sealed plastic holders until needed. A Hi-Star detector (Bruker) was used to record the SAXS intensity, I(q), as a function of modulus of scattering vector q, q = (4π/λ) sin (θ/2), with θ being the scattering angle and λ = 0.15418 nm. Each SAXS pattern corresponds to a data collection time of 2 h. The range of the scattering vector, q, was from 0.009 Å−1 to 0.48 Å−1. The scattering intensity was normalized by subtracting the background scattering.
Time-domain nuclear magnetic resonance
A film of sample was taken to a Maran Ultra equipment, operating at 0.54 T (23.4 MHz proton Larmor frequency) equipped with a 18-mm diameter probe and an air flow temperature control unit (±0.1°C). Measurements were performed at 27°C using the Solid Echo pulse sequence
The Solid Echo pulse sequence was employed to eliminate the influence of the probe dead time on the signal acquisition, thus affording better interpretation of the contributions to the NMR signal arising from intensely coupled proton nuclei, such as those likely to be found in the polymeric crystalline phase. The total NMR signal can be fitted by a function combining a Gaussian and an exponential decay, accounting for rigid and mobile phases, respectively. Such function shown given in equation (2):
where Ag is the signal amplitude of the rigid fraction and Ae is the signal amplitude of the mobile fraction. Each fraction decays with a characteristic
The percentage contribution of each fraction of the total signal is given by equation (3):
Where Ax is the desired fraction (either Gaussian or exponential) and IFID is the total signal intensity of the sample.
Results and discussion
Opaque, off-white, self-sustained polymeric films were obtained after complete solvent evaporation. The samples showed good stability upon handling, with no sign of brittleness. The alkaline hydrolysis step was employed to accelerate the polycondensation of the remaining unreacted TEOS on the polymer’s surface, thus affording SiO2 nanoparticles amid PHB chains.
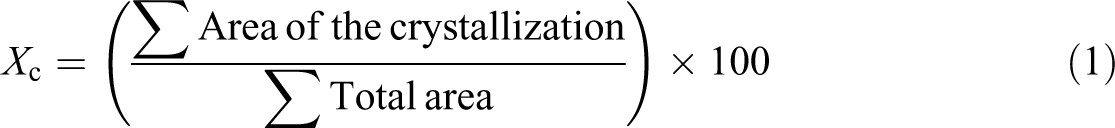
The efficiency of the hydrolysis step was gauged via TD-NMR by measuring the magnetization (M0) arising from the hydrogen nuclei in the sample before and after the treatment with the alkaline solution (Figure 1).
Comparative analysis of the samples before and after alkaline treatment. The reduction in signal intensity is related to the consumption of TEOS by the sol–gel reaction.
For better comparison, the TD-NMR signals were normalized by the mass of each sample. The results indicate an overall reduction of the signal intensity after the hydrolysis step, which can be attributed to the consumption of TEOS and its replacement by silica chains that cannot be detected by the TD-NMR equipment. It should be noted that some residual TEOS must have stayed trapped inside the polymer matrix, as denoted by the positive dependence of the signal observed on the amount of TEOS employed in each formulation.
Another evidence of the successful sol–gel reaction is the appearance of an infrared absorption mode typical of Si–O symmetric and asymmetric deformations at 795 and 1090 cm−1, respectively, 29 indicating that there was formation of the inorganic phase (Figure 2). The absorptions were only clearly discernible at the highest nominal SiO2 concentration studied in this work due to the equipment’s resolution. Furthermore, the absorption arising from chloroform at 825 cm−1,30,31 was not detected, meaning that the solvent was sufficiently removed by the film preparation steps, therefore not contributing to the TD-NMR signal intensity analysis discussed previously. Aside from the mentioned features, no other relevant modification was identified in the sample’s infrared spectra.
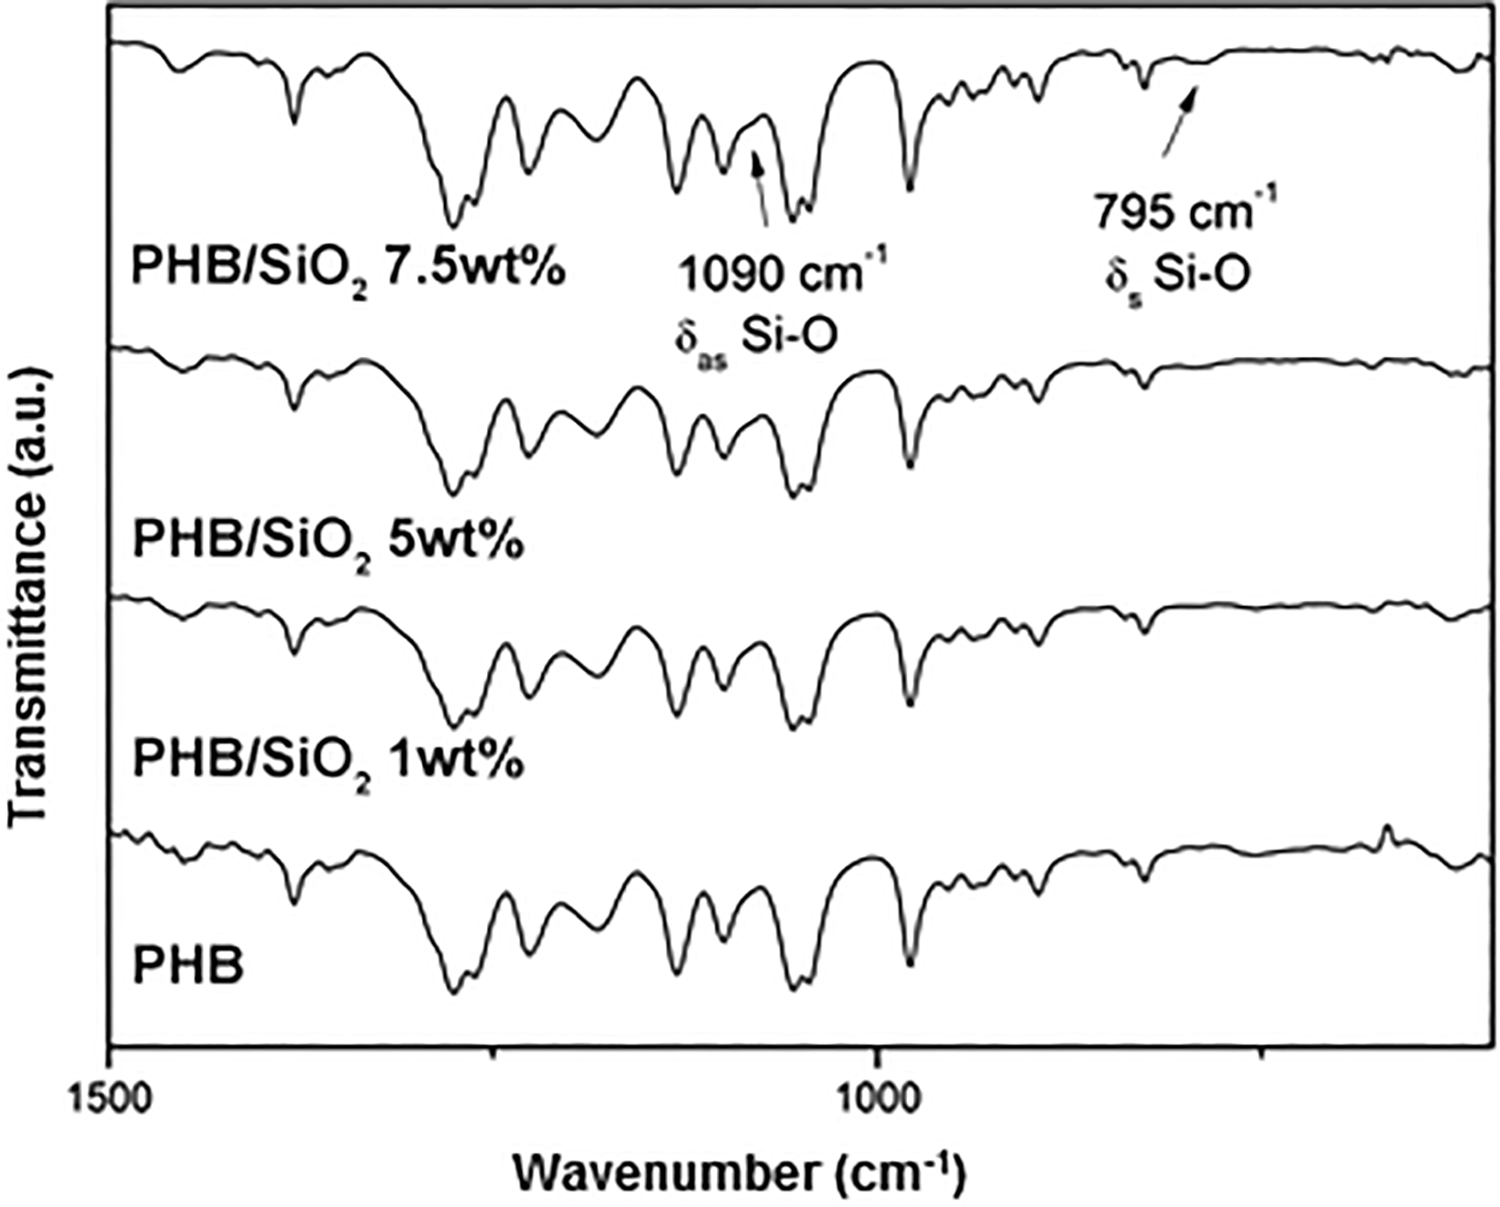
FTIR spectra of the samples showing Si–O absorption modes arising from the inorganic phase.
The incorporation of the inorganic phase amid the PHB matrix should effect changes on the polymer’s crystallinity degree by positive and/or negative nucleation events. Figure 3 shows WAXD patterns obtained for the samples. A qualitative analysis of the diffractograms’ profiles demonstrates a sudden increase in peak intensity at 1 wt% of SiO2 loading with respect to neat PHB. Higher SiO2 loads seemed to have provoked the disappearance of the typical PHB diffraction pattern at 2θ = 13.5°, 17°, 22°, and 25.5° corresponding to planes (020), (110), (101), and (121), respectively.32,33 The WAXD crystallinity degree reduction was previously seen on sol–gel obtained PLA-SiO2 nanocomposites and attributed to the formation of amorphous SiO2, 24 and the same characteristic was seen for phenolphthalein polyethersulfone/SiO2 nanofibrous membranes. 34
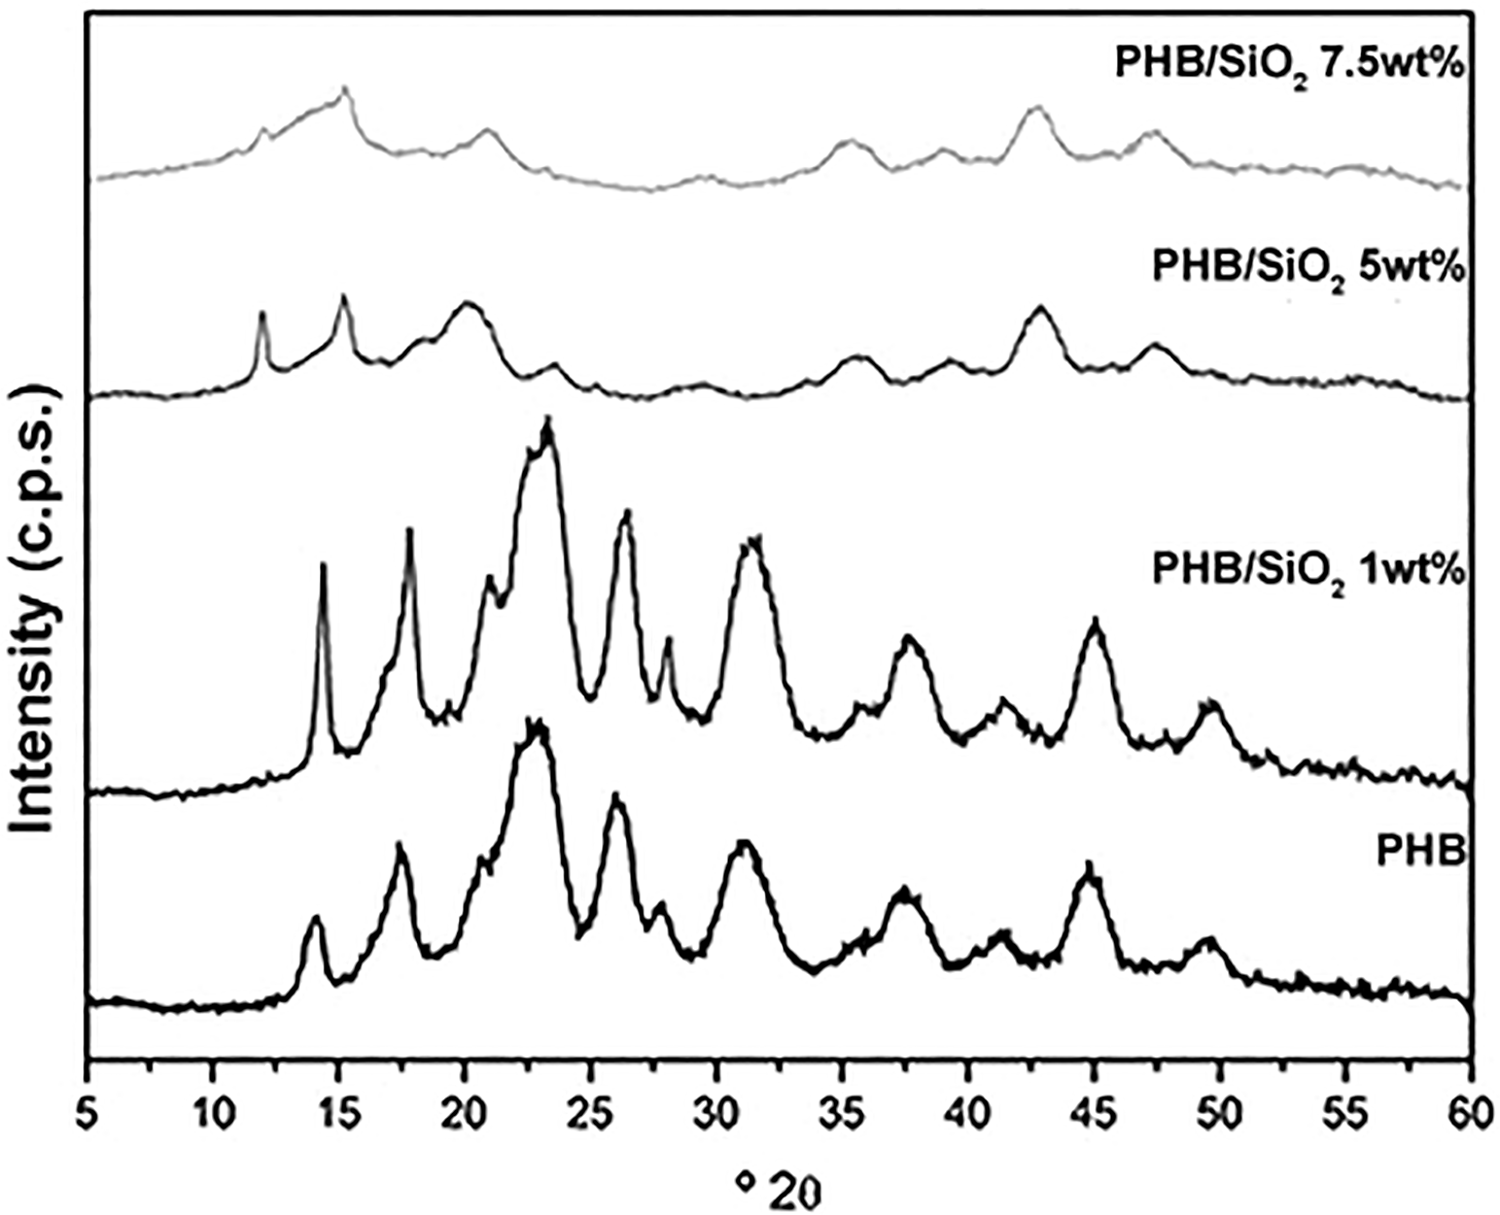
WAXD patterns obtained for all the samples. Qualitative analysis indicates SiO2-load dependent.
The calculated Xc of all samples is presented in Table 1. It should be noted that SiO2 is an amorphous oxide at room temperature if it has not undergone annealing. 35 Therefore, it could not have contributed to the increase in PHB crystallinity degree observed for the PHB/SiO2 1 wt% hybrid. This observation is better discussed with the aid of the SAXS results presented ahead in this article.
Xc calculated via equation (1) for the samples studied in this work.
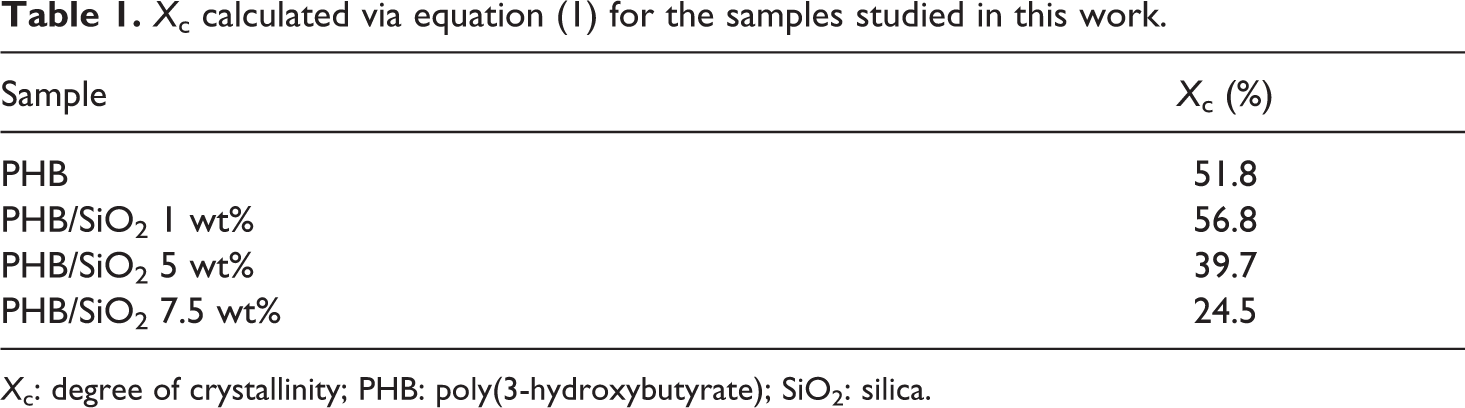
Xc: degree of crystallinity; PHB: poly(3-hydroxybutyrate); SiO2: silica.
Probing the PHB molecular dynamics by means of the Solid Echo sequence, we verified that the rigid fraction of the NMR magnetization, typically arising from rigid and crystalline phases in the polymer matrix, was not affected by the incorporation of SiO2 in all concentrations studied in this work. The mobile fraction, attributed to polymeric amorphous regions, however, showed substantial increase in relaxation time with the addition of SiO2 in high concentrations. This increase can be related to the extinction of portions of the crystalline phase brought by the presence of dense silica networks in the polymeric matrix.36,37 The results are presented in Table 2.
Rigid and mobile phase contributions to the decay of the NMR signal of the samples obtained by equation (2).
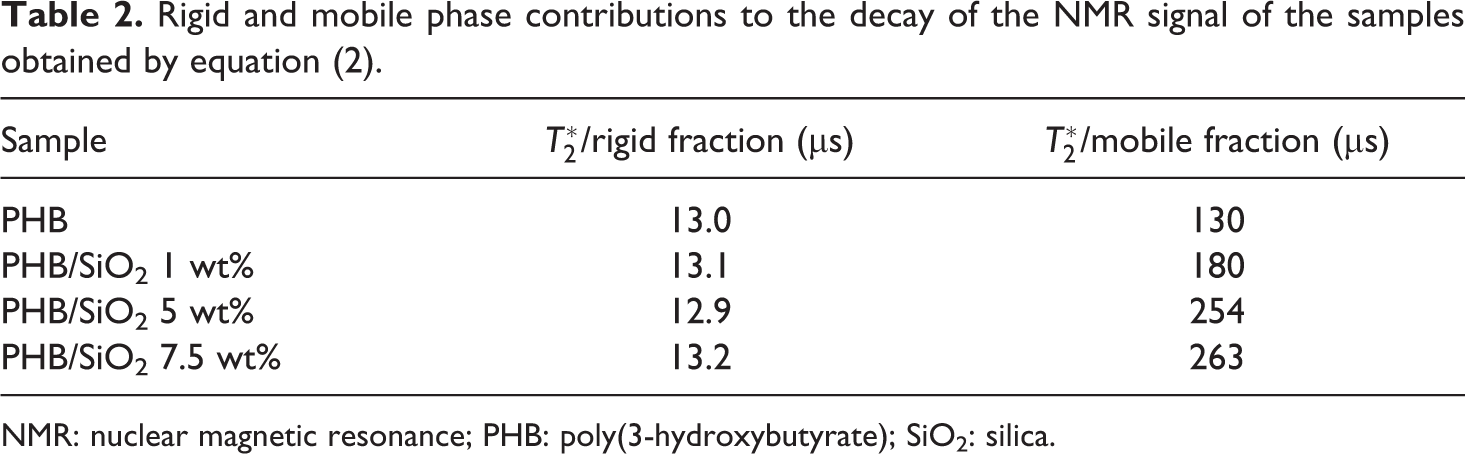
NMR: nuclear magnetic resonance; PHB: poly(3-hydroxybutyrate); SiO2: silica.
A convenient way to visualize the similarities between the WAXD results and those obtained through TD-NMR32,38 is presented in Figure 4. A nonlinear dependence of both variables on the loading of SiO2 in the PHB matrix is clearly seen. The results show that the rigid fraction (Ag) can be attributed to the crystalline phase in the polymeric matrix.
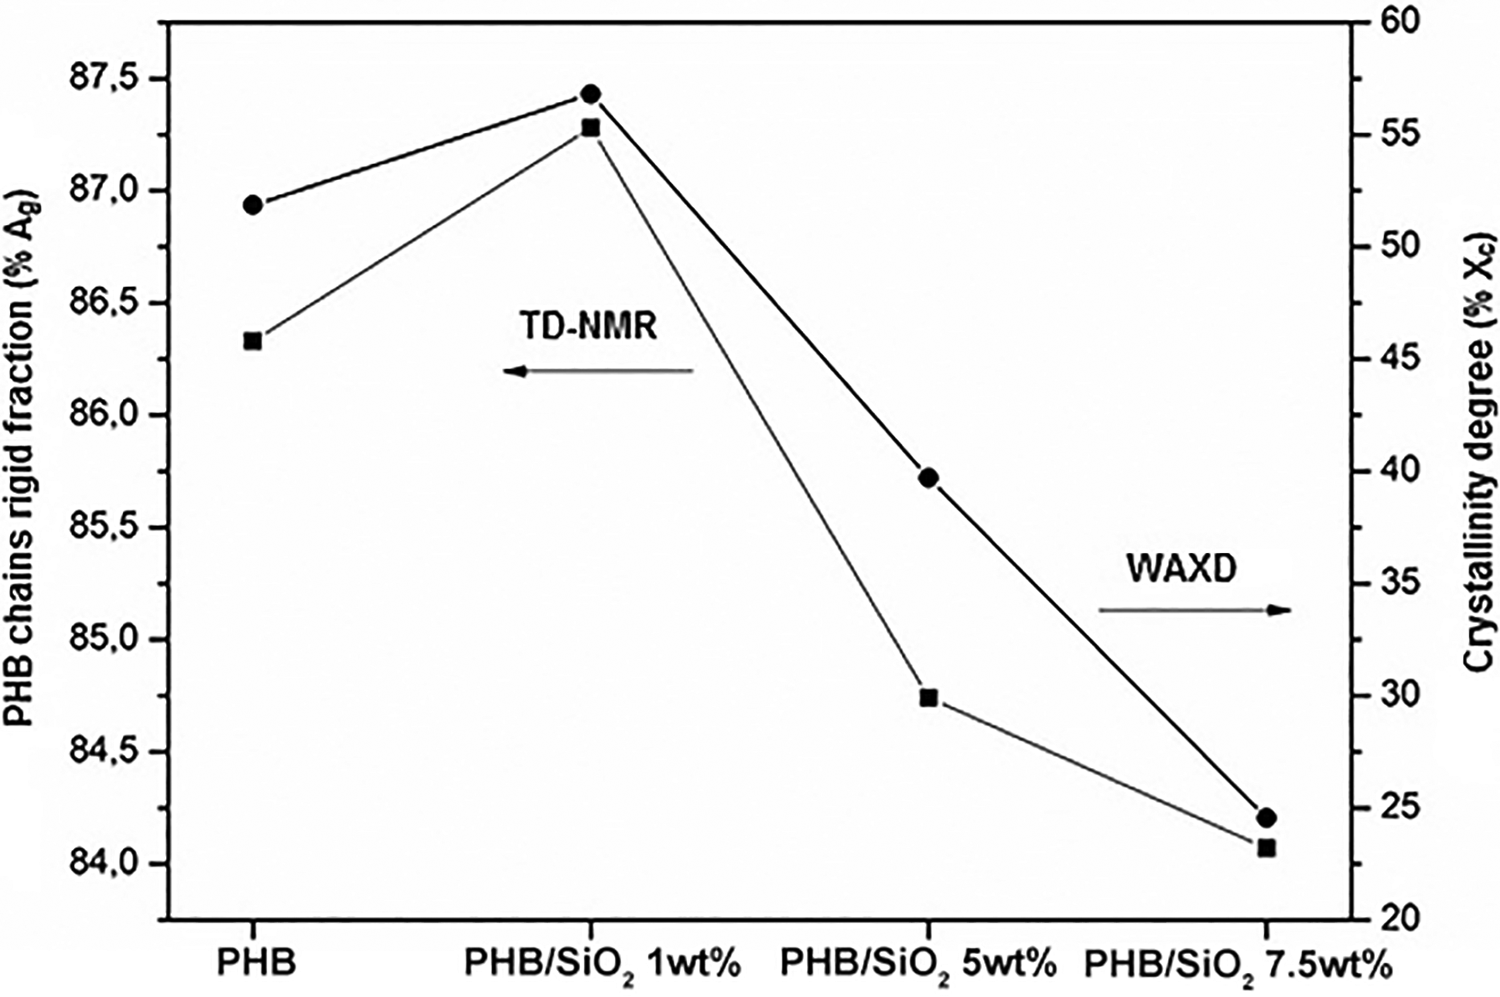
Comparison between TD-NMR and WAXD results showing a similar trend for all samples studied. The TD-NMR values were obtained by equation (3).
SAXS is a powerful and well-established technique for probing the detailed microstructure of semicrystalline polymers and provides information describing structural features of the order of 10–1000 Å in size.39,40 In samples possessing a regular, ordered morphology (such as PHB), a correlation peak is observed in the SAXS intensity at a characteristic value of q (denoted by qmax), which is related to the distance between domains or heterogeneities in the material. In this way, SAXS usually allows lamellar period lengths (L) in polymer spherulites and drawn polymers to be resolved. In a simplified way, the scattering may be treated according to Bragg’s law and hence the following equation (4):
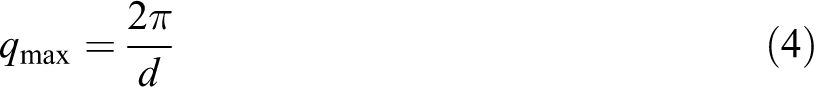
where d is the average interdomain spacing (d-spacing) and q is the magnitude of the scattering vector, defined as (4π sin θ)/λ), where θ is the scattering angle and λ is the X-ray wavelength. In our case, the PHB possesses a lamellar morphology which is isotropically distributed throughout the material. The Lorentz correction can then be applied to the SAXS intensity, aiming at the determination of peak position. The Lorentz correction involves the multiplication of the intensity function by q2 and has the effect of shifting the position of a broad correlation peak to higher values of q (Figure 5).
Lorentz-corrected (iq2 vs. q) SAXS patterns of PHB samples with 0, 1, 5, and 7.5 wt% of SiO2.
In this way, assuming an ideal lamellar model used to describe certain semicrystalline synthetic polymers, the d-spacing represents the distance between adjacent crystalline lamellae which are separated by amorphous domains and arranged in space-filling stacks. The long period (L) can be also estimated by Lorentz-corrected SAXS patterns, represented by d-spacing (d). The long period of the PHB samples with 0, 1, 5, and 7.5 wt% of SiO2 according to Bragg’s Law were 59.7, 57.3, 55.9, and 55.2 Å (Table 3). The decrease in the long period with increasing of SiO2 concentration may be related to the level of structural disorganization of the polymer, as previously indicated by WAXD and TD-NMR.
SAXS parameters obtained from Teixeira’s model and Bragg’s law.a
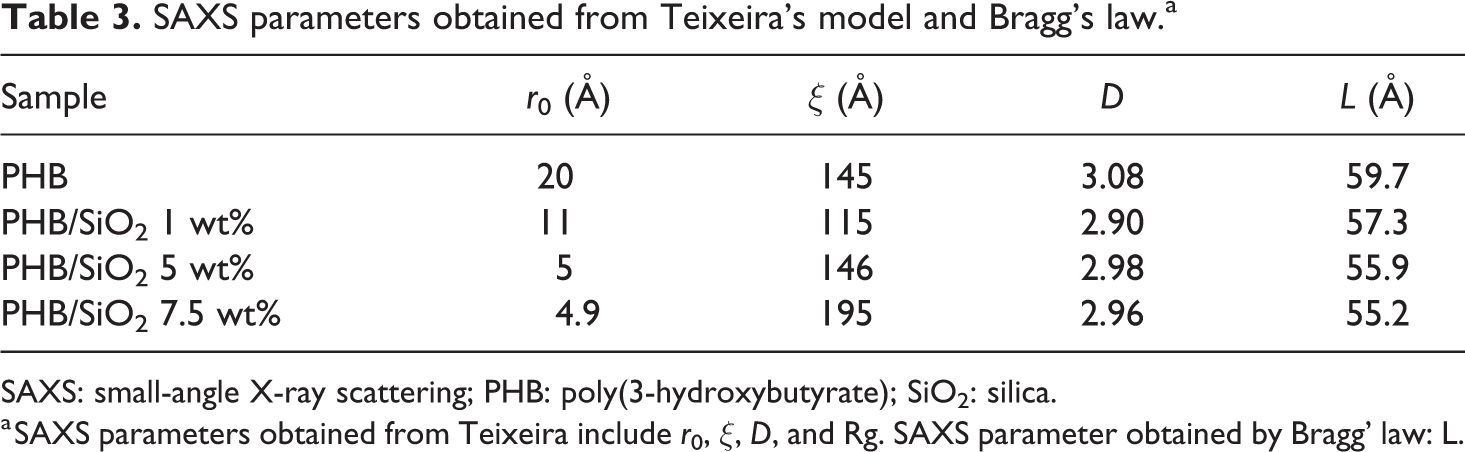
SAXS: small-angle X-ray scattering; PHB: poly(3-hydroxybutyrate); SiO2: silica.
a SAXS parameters obtained from Teixeira include r0, ξ, D, and Rg. SAXS parameter obtained by Bragg’ law: L.
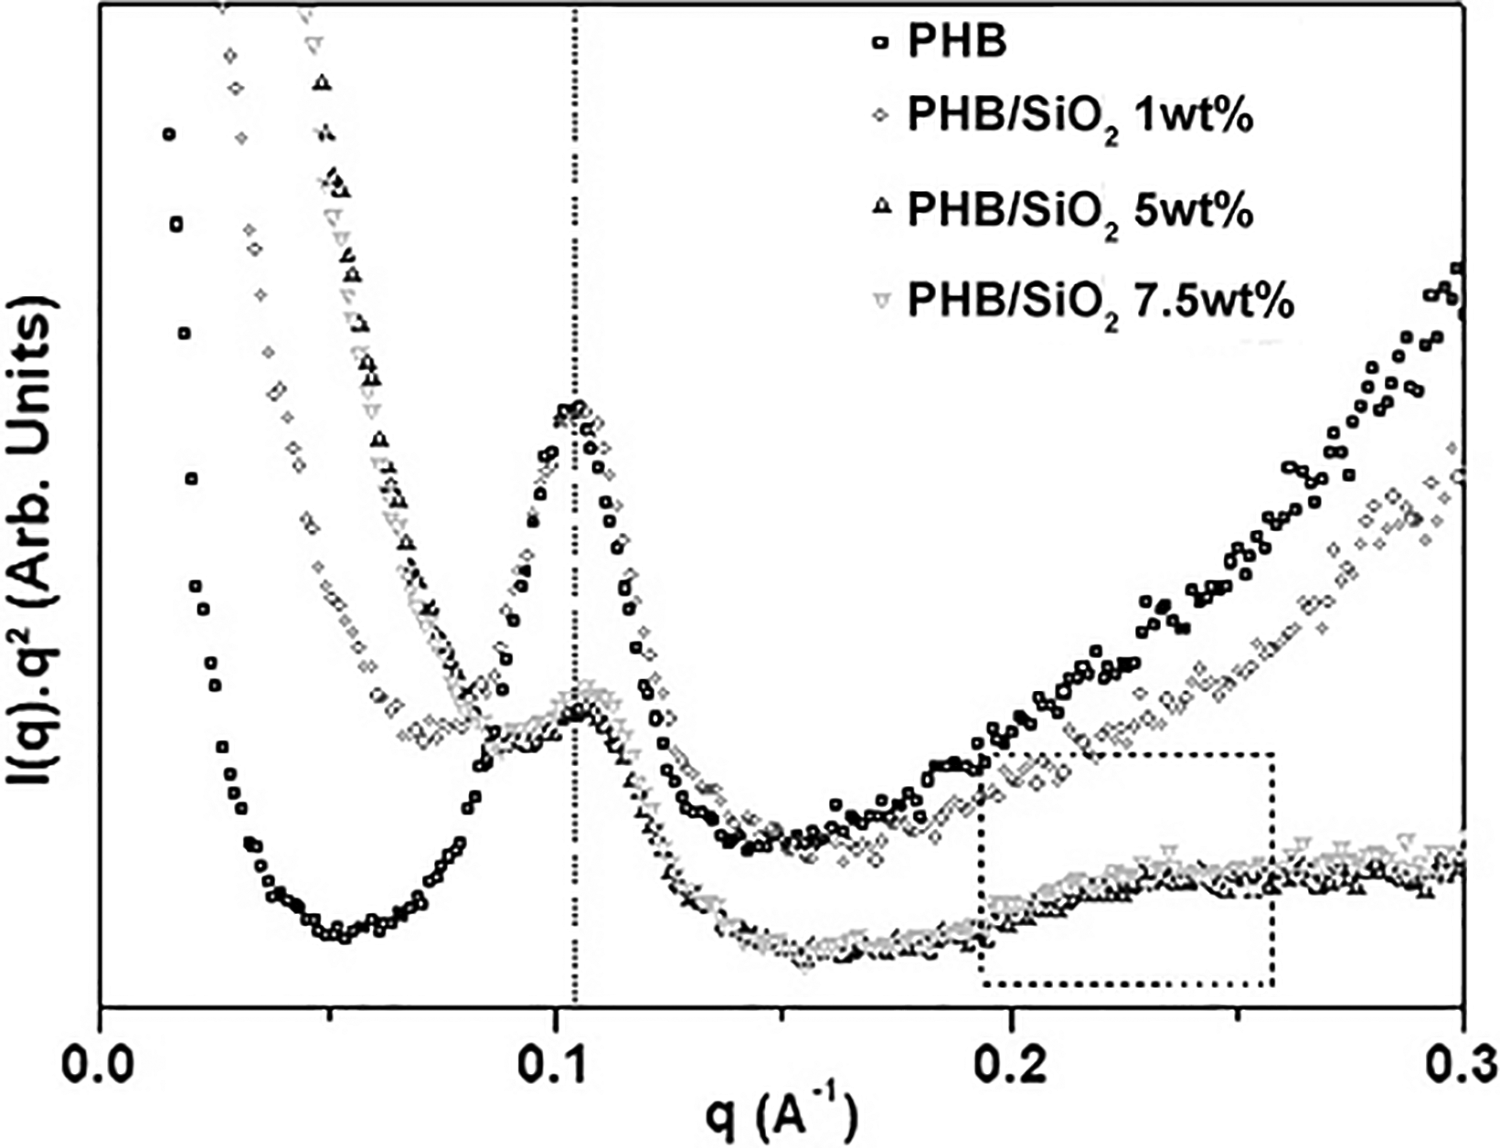
From Figure 6 it is also possible to observe that the characteristic peak of the lamellar periodicity of PHB at high q-values (around 0.1 Å−1) becomes flattened, indicating the increase of structural disorder might be caused by inorganic phase formation by sol–gel method. Another information can be visualized in the range of q between 0.2 Å−1 and 0.3 Å−1 (highlighted dotted region), where a not very intense and broad peak appears. This peak is possibly attributed to the correlation distance of domains rich in SiO2, indicating an excess of inorganic phase in PHB samples containing 5 and 7.5 wt% of SiO2.
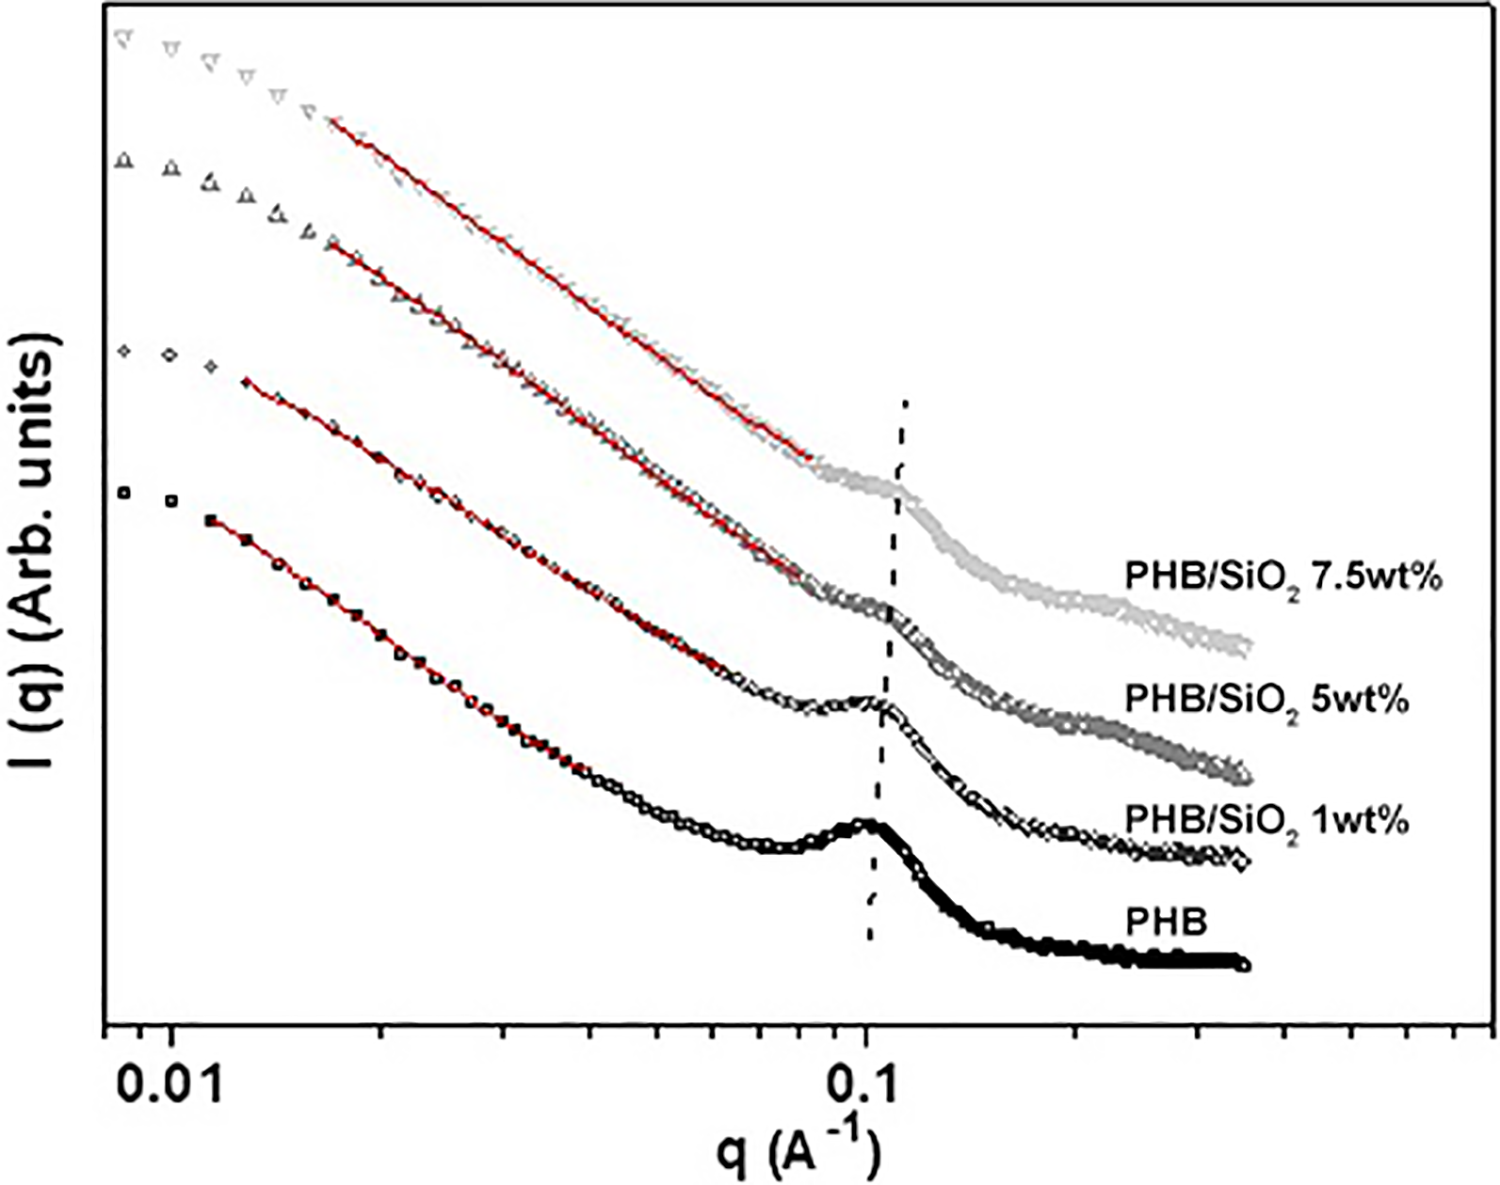
Small-angle X-ray scattering patterns of PHB samples with 0, 1, 5 and 7.5 wt% of SiO2.
Owen and Bergmann 41 reported the presence of structures showing fractal geometry over a certain range of lengths in PHB samples. They concluded that the units making up the fractal structure are much larger fibrillar units to which individual crystal lamellae. Sol–gel systems also commonly present fractal structures.42,43 For fractal objects, it is well-known that the scattered intensity I(q) follows a power law, I(q) ≈ q−D, where D is a fractal dimension. For mass fractals, 1 < D < 3, while for surface fractals 3 < D < 4. In this present work, we have found an exponent of approximately 2.9 in the sample with 1 wt% of SiO2.
A linear decreasing intensity regime is observed at medium and low q-values, with a slope lower than 3, which invalidates the use of the Beaucage model to determine the structural parameters of the samples’ secondary domains. Freltoft et al. 44 and Teixeira 45 have shown that the nanostructure of samples presenting SAXS profiles with both tendency to plateau at low q-range and said linear regime at medium q-range is fractal and that the experimental SAXS curve can be fitted by equation (5):

Equation (5) is valid for a fractal object composed of elementary particles of size r0, forming fractal aggregates of average size ξ. Γ is the gamma function and C is a constant. This expression becomes I(q) ≈ q−D when 1/ξ < q <1/r0. Equation (5) fits well the experimental curves at low and medium q-range. This reveals that the secondary domains present in all samples have a fractal structure. The value of D (around 3, Table 3) evidences the ramified character of the fractal secondary aggregates commonly obtained by the sol–gel method.
The data in Table 3 show that the structural parameters obtained by fitting the SAXS data through Teireixa’s model indicate that a more dense inorganic structure is formed from the concentration of 5 and 7.5 wt% of SiO2. The sample containing the least amount of SiO2 had the smallest aggregate size (115 Å), which may have been low enough that small nuclei were formed, with a short reach of interconnectivity, favoring the crystallization of PHB. Somehow it appears that the lower volume of branched inorganic structure positively interferes with the crystallinity degree, facilitating the growth of PHB crystals. On the other hand, for the samples containing 5 and 7.5 wt% of SiO2, the formation of a dense inorganic network would be responsible for the decrease in the packaging of the crystalline structure of the PHB, reducing sharply the crystallinity degree of the samples due to the greater extension of the structural disorder. The comparative analysis of the WAXD and TD-NMR data allowed us to infer that the variation in crystallinity degree was arising from the different mobility regimes experienced by the PHB chains.
Conclusion
In situ sol–gel synthesis of SiO2 nanoparticles have been successfully conducted in a PHB matrix. The alkaline hydrolysis of the TEOS precursor was detected via TD-NMR showing a convenient and fast analysis method for this kind of reaction. The formation of the SiO2 network on the polymer was verified through FTIR and SAXS measurements. The hybrid’s crystallinity degree was very sensitive to SiO2 loading and demonstrated a nonlinear dependency with this parameter, as detected by TD-NMR and WAXD. Structural parameters of the hybrids were determined via SAXS which revealed fractal structures composed of SiO2 networks in the hybrids, typical of this kind of sol–gel synthesis. Besides, trends in parameters such as the inorganic network´s level of aggregation were elucidated and shown to be dependent on SiO2 loading in the PHB matrix.
Footnotes
Acknowledgements
The authors would like to thank the Institute of Physics at University of São Paulo for providing the means to conduct the SAXS measurements.
Funding
The authors disclosed receipt of the following financial support for the research, authorship, and/or publication of this article: The authors would like to thank Brazilian agencies CAPES and CNPq for their financial support.