
Abstract
Upconversion nanoparticles (UCNs) find application in nanomedicine as biolabels to identify cancer cells. In this work, Y2O3: Er3+/Yb3+ and Gd2O3: Er3+/Yb3+ systems were fabricated by combustion synthesis (CS) and sol-gel (SG) methods to obtain nanoparticles with different shapes and sizes after post-annealing treatments. The crystallinity and morphology were analysed by x-ray diffraction (XRD) and transmission electron microscopy (TEM), respectively, and the luminescent properties by spectrofluorescence measurements. The luminescence varied depending on the doping level. In this study, for the host Y2O3, with Er3+/Yb3+ (1%/1% mol), the green emission was more strongly attributed to the 2H 11/2→4I 15/2, 4S3/2→4I 15/2 transitions of Er3+ ions. Red emission was present in Yb3+ (5%/10% mol) due to the 4F9/2→4I15/2 transition for both hosts. For the host Gd2O3, green emission was present in Er3+ (2% mol) and Yb3+ (3% mol). The surface of some UCNs was coated with a thin silica layer and analysed in order to compare the luminescence with the uncoated UCNs. The purpose of the coating was to prepare the samples for further functionalization for biolabel use. Results show that the emission intensity of all samples strongly depends on the synthesis method. SG was more reliable than CS synthesis in producing UCNs with better morphology and luminescent properties.
1. Introduction
Luminescent materials have been studied in the last decade due to their multiple applications in biomedicine [1, 2]; for example, as biolabels to identify cancer cells [3]. In the last five years, attention has been paid to upconversion luminescence because it can be applied to a variety of devices, such as lasers, displays and fluorescence imaging [4]. Y2O3 and Gd2O3 UCNs co-doped with Er3+/Yb3+ possess the ability to absorb near-infrared (NIR) radiation and upconvert it to emit within the visible range. Yb3+ acts as the sensitizer that transfers the NIR energy to the activator Er3+, with the advantage that the emission wavelength is shorter than the NIR excitation.
Several authors have prepared different UCNs with the hosts Y2O3 and Gd2O3. Li [5] prepared Gd2O3 co-doped with Er3+/Yb3+ (3%, 20% mol) by the precipitation and combustion method, while Hemmer [1] used the same host with the doping Er3+ 1% mol and Yb3+ 1% mol. Amongst other authors, Chen [6] co-doped the host Y2O3 with Er3+/Yb3+ (1%, 10% mol) and Kong [7] compared the hosts Y2O3, La2O3 and Gd2O3 co-doped with several concentrations of Er3+/Yb3+, whereas Kumar [17] studied the thermoluminescence effects of Gd2O3 co-doped with Er3+/Yb3+. In this context, UCNs of Y2O3 and Gd2O3 co-doped with Er3+/Yb3+ have been synthesized. The focus of this work, then, is that the annealing temperatures and the co-dopings were varied in order to obtain the better UCNs to be used as biolabels to detect cancer cells after proper functionalization. The upconversion process happens when Yb3+ absorbs NIR radiation (980 nm) and it transfers a first photon to Er3+, so that its electron in the 4I15/2 level is promoted to 4I11/2 level. The process continues when Yb3+ transfers a second photon to Er3+, which is the same electron that is raised to a higher level 4S3/2. From here it rapidly decays to its base state, emitting green light. Depending on the percentage of the doping, the electron can also be promoted to level 4F9/2 and then decays, emitting red light [8]. The electrons of Er3+ have a metastable energy level with longer excited states; meanwhile, another advantage of the doping is that the electrons of Yb3+ have a cross-section with large absorption in the NIR spectra and, in turn, can transfer the excitation energy to Er3+ [9].
The luminescent properties of diverse UCNs were studied in order to determine their efficacy as cellular biolabels. NIR-absorbing UCNs are adequate fluorescence labels because NIR light shows reduced phototoxicity compared with UV light, while its penetration into biological tissues can be deeper [10]. In this work, the nanoparticles were synthesized and characterized in order to compare their properties. In addition, the silica-coated UCNs that were obtained had strong luminescence and size, such that they can be used as biolabels with the appropriate functionalization
2. Materials and Methods
The UCNs of Y2O3: Er3+/Yb3+ and Gd2O3: Er3+/Yb3+ were prepared by two methods: combustion synthesis (CS) and sol-gel (SG), with several concentrations of Yb3+ and Er3+ and annealing temperatures. The UCNs were also ultrasonicated in order to obtain less agglomeration. Afterwards, the nanoparticles were characterized with different techniques. The UCN crystallographic structure was analysed by XRD and the morphology by TEM. The luminescence properties were analysed with a spectrophotometer (Hitachi 4500). The UCNs coated with silica were also analysed with the Energy-dispersive X-ray spectroscopy (EDS) in order to study the morphology and uniformity of the silica coating. We found that the synthesis method is relevant to the luminescence intensity and also the annealing temperatures.
2.1 Combustion synthesis
The solution for CS of Gd2O3: Er3+/Yb3+ were prepared with stoichiometric amounts of the precursors dissolved in 20 ml of de-ionized water. The precursors were as follows: Gd(NO3)3 (Alfa Aesar 99.9965%), Yb(NO3)3 (Alfa Aesar 99.9%) and Er(NO3)3 (Alfa Aesar 99.9%). The mixture was stirred in a magnetic stirrer to obtain a homogeneous product with no visible residue. The solution changed into a transparent gel, while carbohydrazide (CH6N4O Alfa Aesar 97%) was added to the solution as fuel. The stoichiometry is given below:

where x varies between 0, 0.02 and 0.10, which are the percentages of Ytterbium, while y varies between 0.01 and 0.03 and represents the percentage of Erbium. This mixture was then transferred into a muffle furnace and maintained at a fixed temperature (500°C). The mixture of nitrates (oxidizers) and the fuel (carbohydrazide) underwent spontaneous combustion under heating, while the chemical energy from the exothermic reaction heated the precursor mixture to a high temperature. Consequently, large amounts of gases were produced in the reaction together with the flame due to gas-phase reaction of the combustion gases [11]. The solution underwent an annealing treatment consisting of exposure to a high temperature for variable periods. The reaction mixture was removed from the furnace and annealed at a temperature of 700 to 900°C for Gd2O3:Er3+/Yb3+, and 900 to 1200°C for Y2O3:Er3+/Yb3+ for two hours. The same process was repeated to prepare Y2O3:Er3+/Yb3+, where the precursor changed for Y(NO3)3 (Alfa Aesar 99.9%) instead of Gd(NO3)3. The stoichiometry was:

where x varies between 0.01, 0.05 and 0.10, which are the percentages of Ytterbium, while y is 0.01 and represents the percentage of Erbium. See Table 1 for doping and annealing temperatures.
Doping and annealing temperatures for the UCNs of Gd2O3 and Y2O3

2.2 Sol-gel method
The precursors for this method were the same nitrates as used for the CS. The precursors were diluted with HNO3 (14% mol). Tartaric acid (C4H6O6 Aldrich, USA) was dissolved in de-ionized water and the individual solutions were mixed under constant stirring. The molar concentration of tartaric acid was 1:2 for the metal ions present in the Gd2O3 or Y2O3. Both solutions were mixed and stirred for 24 hours at room temperature. Thereafter, the pH of 5.0 was verified and the mixture was heated under constant stirring at 80°C for two hours. This yielded a denser sol. Subsequently, the sol was heated at 120°C until a gel was produced and dried to form the xerogel [12]. The xerogel was collected and annealed (Table 1). The stoichiometries for Y2O3 and Gd2O3 respectively, were:

The variations of x and y and the annealing temperatures are shown in Table 1.
2.3 Ultrasonication
All the UCNs used were ultrasonicated with a high-intensity ultrasonic processor (Sonics & Materials, Inc.) for about 30 minutes with 20 ml of isopropanol/ethanol before the analysis for TEM or silica-coating in order to avoid agglomeration of the nanoparticles.
2.4 Silica-coating
When producing UCNs for use as biolabels in order to identify cancer cells, a fine silica coating was made to prepare the samples for further functionalization. Silica-coating of the particles was done by Stöber synthesis [13]. Distilled water (80 ml) was mixed with 0.21 gr of UCNs (see Table 2) under constant magnetic stirring for 20 minutes. Also 1 ml of Ludoxam (Aldrich, USA) was mixed with 9 ml of distilled water. The second mixture is added slowly to the first one. The final solution was stirred for between 20 and 24 hours. The silica-coated UCNs were precipitated with acetone and centrifuged three times. Finally, the UCNs were filtered and then annealed at 900°C for two hours.
Silica-coated UCNs

2.5 Characterization
The crystallinity and morphology of the UCNs were analysed by XRD with the Phillips X′Pert-MPD, equipped with Cu Kα radiation (λ= 0.15406 nm). Measurements in a 2θ = 10–80 degree range were taken with a step-size of 0.1° and a one-second dwell per point. The results obtained were compared with the database PCPDFWIN. The TEM used was JEOL JEM-2100-F in order to study the morphology and the nanoparticle size. The photoluminescence of the UCNs was analysed with a fluorescence spectrophotometer (PL, Hitachi® FL-4500) with a wavelength of 980 nm for excitation. The silica-coated UCNs were analysed with the EDS in order to study the morphology and uniformity of the silica coating.
3. Results
This section shows the XRD results as well as the morphology analysis and photoluminescence displayed by all UCNs synthesized in this work.
3.1 XRD and morphology of Y2O3:Er3+/Yb3+ and Gd2O3:Er3+/Yb3+ UCN
The composition obtained for the UCNs synthesized by CS and SG methods was (Gd1-x-yYbxEry)2O3 and (Y1-x-yYbxEry)2O3 (Table 1). The XRD patterns of the UCN are in Figure 1. All the diffraction peaks are consistent with JCPDS No. 89-5592 (Y2O3) and JCPDS No. 88-2165 for the Gd2O3 database and demonstrate that the samples have a cubic structure. The highest annealing temperatures, 800–900°C for Gd2O3 and 1100–1200°C Y2O3, were chosen in order to transform the Gd2O3:Er3+/Yb3+ and Y2O3:Er3+/Yb3+ nanoparticles into a crystalline structure. Consistent with Singh [20], the nanoparticles of Gd2O3:Er3+/Yb3+ annealed at 600°C were transformed into a multiphase form, with a monoclinic and cubic phase, while at 900°C, the phase was only cubic, as confirmed herein. The 900°C temperature was, therefore, selected in order to continue.

XRD patterns of Y2O3: Er3+/Yb3+ and Gd2O3: Er3+/Yb3+ compared with the standard data JCPDS no. 89-5592 [Y2O3] and JCPDS no. 88-2165 [Gd2O3]: a) JCPDS no. 89-5592 [Y2O3]; cubic structure: b) Y2O3:Er, Yb (1%, 1%)1100°C (CS); c) Y2O3:Er, Yb(1%,5%) 1100°C (CS); d) Y2O3: Er, Yb (1%,10%)1200°C (SG); e) JCPDS 88–2165:Gd2O3 cubic structure; f) G2O3: Er, Yb (1%,10%) 900°C (CS); g) G2O3: Er, Yb (2%,3%) 800°C (CS); and h) G2O3: Er 1% 900°C (SG).
Figure 2 shows the TEM images of bare Gd2O3:Er3+/Yb3+ and Y2O3:Er3+/Yb3+ UCNs prepared by SG, while Figure 3 shows those prepared by CS. UCNs obtained by both synthesis methods were mostly of a spherical shape. The average size of the Gd2O3:Er3+/Yb3+ nanoparticles were 50 nm (+/-10 nm), while for the UCN Y2O3:Er3+/Yb3+ it was 70 nm (+/-10 nm). Agglomerates were observed mostly on the UCNs prepared by CS. UCNs tend to agglomerate; indeed, some authors have presented agglomerated UCNs [17–18]. The morphology did not change due of the different doping concentrations.

TEM images of bare Y2O3: Er3+/Yb3+ and Gd2O3: Er3+/Yb3+ synthetized by SG: a) Y2O3: Er3+, Yb3+ (1%, 1%) 1200°C SG; b) Er 1%, Yb 10% 1200°C SG; c) Er 1%, Yb 5% 1200°C SG; d) Gd2O3: Er3+, Yb3+ (1%, 10%) 900°C SG; e) Yb 2% 900°C SG; f) Er 2%, Yb 3% 900°C SG; and g) Er 1% 900°C SG.

TEM images of bare Y2O3: Er3+/Yb3+ and Gd2O3: Er3+/Yb3+ synthetized by CS: a) Y2O3: Er3+, Yb3+ (1%, 1%) 1200°C CS;b) Er 1%, Yb 10% 1200°C CS; c) Er 1%, Yb 5% 1200°C CS; d) Gd2O3: Er3+, Yb3+ (1%, 10%) 900°C CS; e) Yb 2% 900°C CS; f) Er 2%, Yb 3% 900°C CS; and g) Er 1% 900°C CS.
Figure 4 shows the TEM images of the silica-coated UCN. The size increased only by about 1–3 nm due to the core-shell formed of silica. Some of the UCNs presented the spherical shape. In Figures 4 b) and c), the crystallographic planes are clearly shown and the silica coating can be seen as amorphous. The UCNs tend to agglomerate after and under coating. The coated UCNs were also analysed with the EDS technique to confirm the presence of silica (Figure 5).
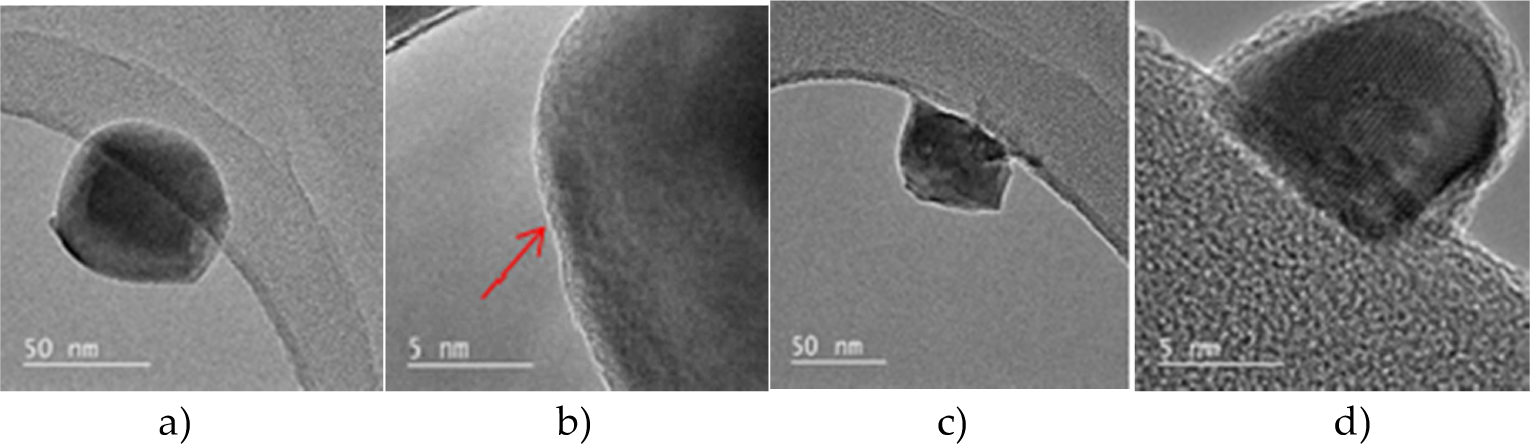
TEM images of UCN with silica coating: a) Y2O3: Er3+, Yb3+ (1%, 10%); b) Y2O3: Er3+, Yb3+ (1%, 5%); c) Y2O3: Er3+, Yb3+ (1%, 1%); and (d) Gd2O3: Er3+, Yb3+ (1%, 10%).
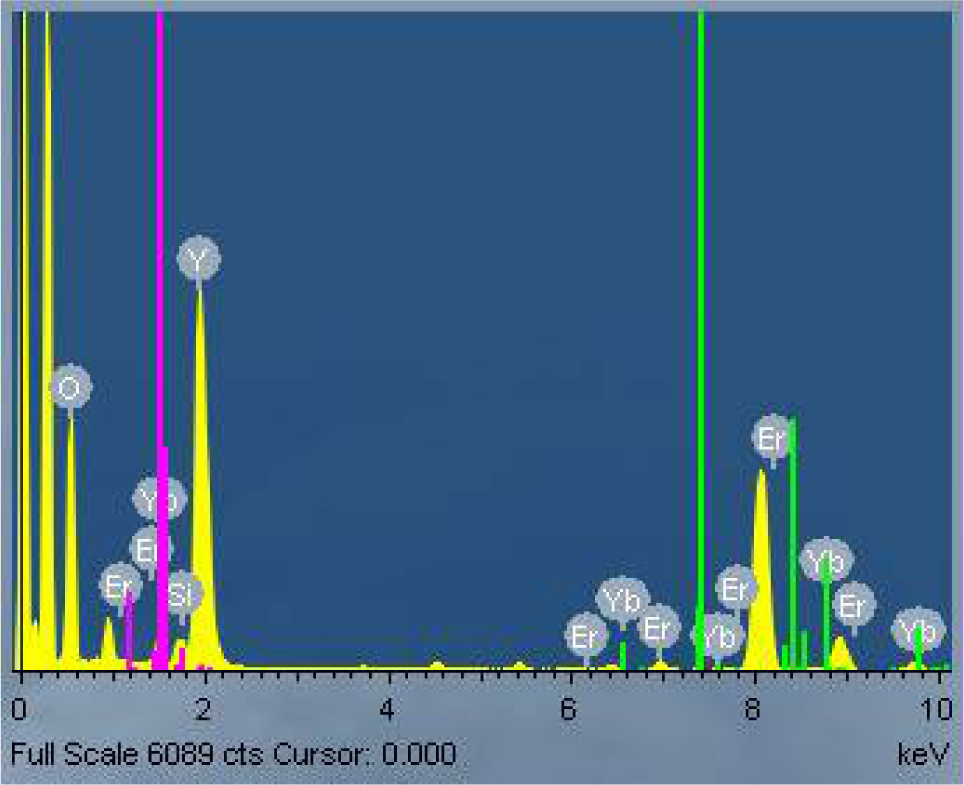
EDS technique to confirm the presence of silica on UCNs Y2O3: Er3+, Yb3+ (1%, 1%) (1200°C annealing)
3.2 Upconversion luminescence process
In Figure 6 is shown a classic diagram of the upconversion process [8,14]. On receiving the excitation energy of 980 nm, the Yb3+ ion transfers energy via two photons to the Er3+ ion, which is excited by the first photon from the ground state 4I15/2 to the state 4I11/2. With the second photon, the Er3+ ion is excited by the 4F7/2 state. With no further radiation, it may decay to the 2H11/2 and 4S3/2 levels. The green emission is caused by the decay from 4S3/2→4I15/2 and the red emission by the 4F9/2→4I15/2 transition.

Energy-level diagram for Yb3+ and Er3+ upconversion emission (980 nm excitation)
3.2.1 Upconversion luminescence properties of Gd2O3:Er3+, Yb3+
Inorganic host materials Gd2O3 and Y2O3 doped with Er3+ and Yb3+ ions are upconverting phosphors that absorb light in the near-infrared range (980 nm) and emit in the visible spectra. Upconversion luminescence spectra of samples under 980 nm laser excitation are shown in Figures 7, 8 and 9 for all doping concentrations and annealing temperatures (Table 1) for Gd2O3:Er3+/Yb3+, Gd2O3:Er3+ and Gd2O3:Yb3+. The spectra show two groups of upconversion emission peaks at 561–563 nm and 661–663 nm. These peaks are attributed to 4S3/2→4I15/2 transition and 4F9/2→4I15/2 transition of Er3+ ions, respectively. For doping with Yb3+ (2%), the red emission is clearly much stronger than the green emission. For doping with Er3+ (1%), the green emission (661 nm) is stronger. The emission intensity for samples synthesized by the SG method is greater than the CS method.
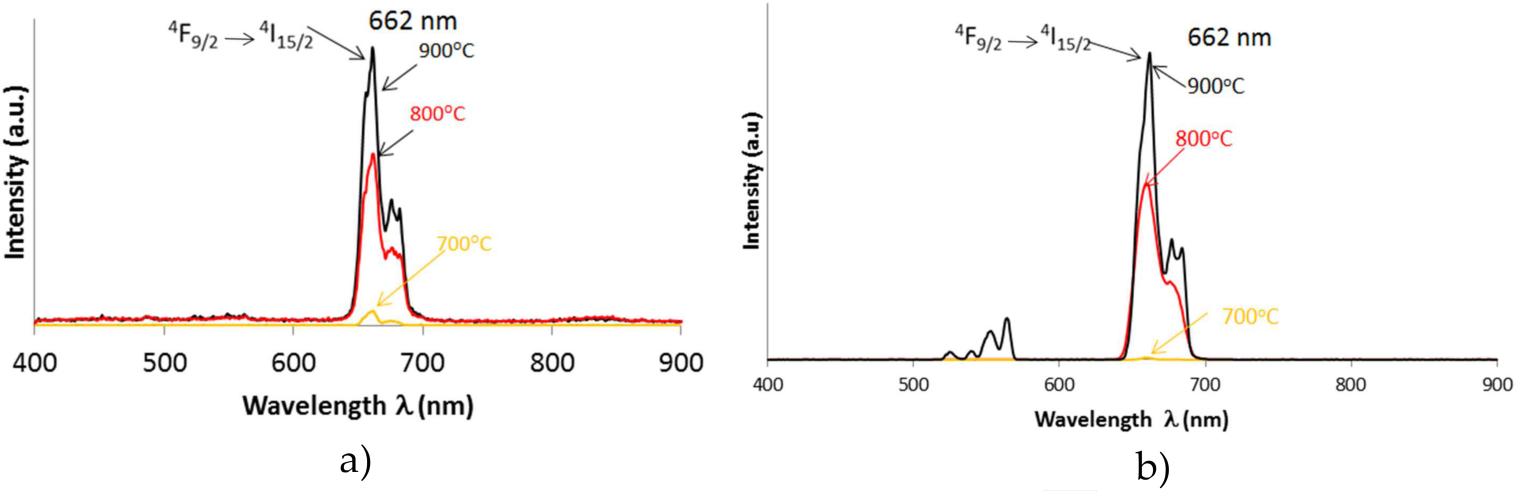
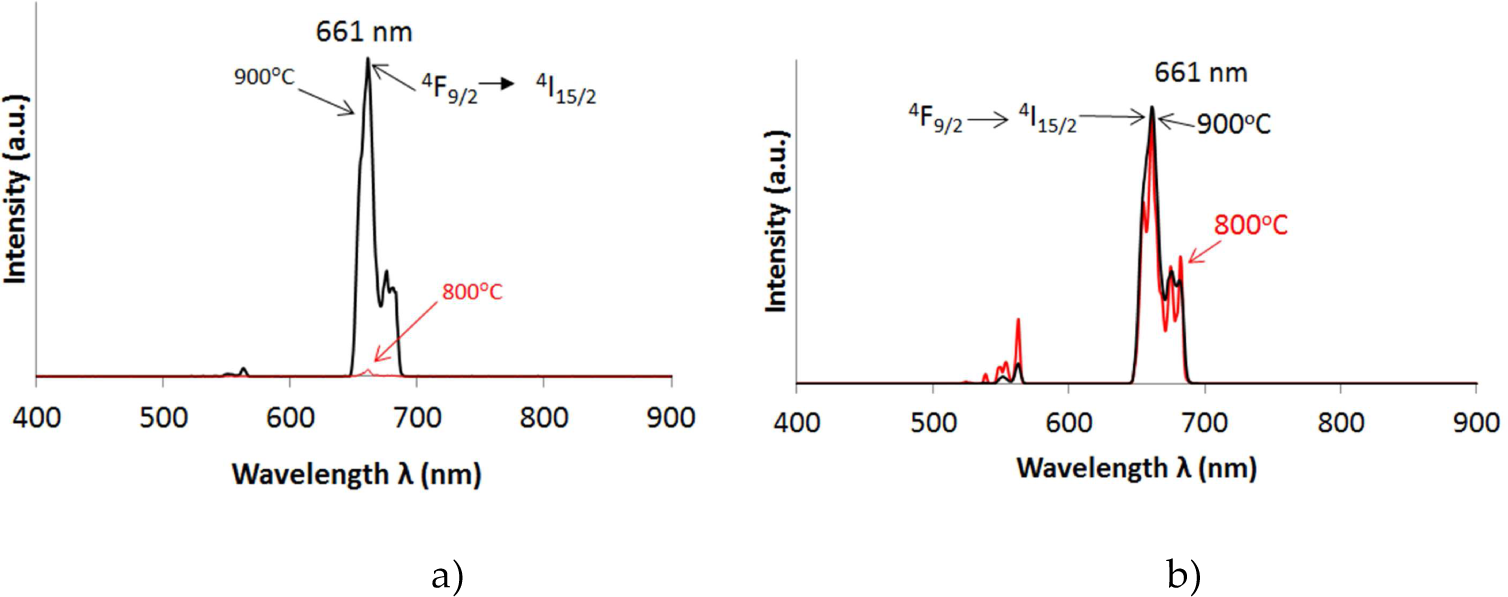
The upconversion emission spectra for Gd2O3:Er3+/Yb3+ (1%, 10% mol) under 980 nm excitation at three annealing temperatures: 700, 800 and 900°C. a) CS and b) SG method. Red emission (660–662 nm) obtained with both synthesis methods and low or no emission at 700°C annealing.

The upconversion emission spectra for: a) Gd2O3:Er3+ (1% mol) at 800 and 900°C annealing temperatures, and b) Gd2O3:Yb3+ (2% mol) at 900°C annealing. Both under 980 nm excitation. In (a) green emission (563 nm) is stronger than red emission (661 nm). In (b) red (661 nm) and green emission (560 nm) are present but the red emission is the strongest.
The upconversion emission spectra for Gd2O3:Er3+/Yb3+ (2%, 3% mol) under 980 nm excitation at three annealing temperatures: 800 and 900°C. a) CS and b) SG method. Red emission present (661 nm) with both methods, but green emission is also present with lower intensity. The best luminescence was with the 900°C annealing on all the samples.
3.2.2 Upconversion luminescence properties of Y2O3:Er3+, Yb3
Upconversion luminescence spectra for Y2O3:Er3+/Yb3+ UCN samples are shown in Figures 10, 11 and 12 for the different doping percentages and annealing temperatures (Table 1). Under laser excitation of 980 nm, transitions 2H11/2→ 4I 15/2 (550 nm), 4S3/2→4I 15/2 (564 nm) and 4F9/2→4I15/2 (660 nm) are marked in Figure 9. The highest intensity for the Er3+/Yb3+ (1%, 1% mol) doping is in the green emission (564 nm). For the doping Er3/Yb3+ (1%, 5% mol), the same transitions are present, but the highest is the red emission of the 4F9/2→4I15/2 (660 nm) transition (Figure 11). All samples doped (1%, 5% mol) emit orange due to the combination of emissions of several colours. For the Er3+/Yb3+ (1%, 10% mol) doping (Figure 12), the highest emission is in red (663 nm) and corresponds to the transition 4F9/2→4I15/2; the green transitions are present but with lower emission.
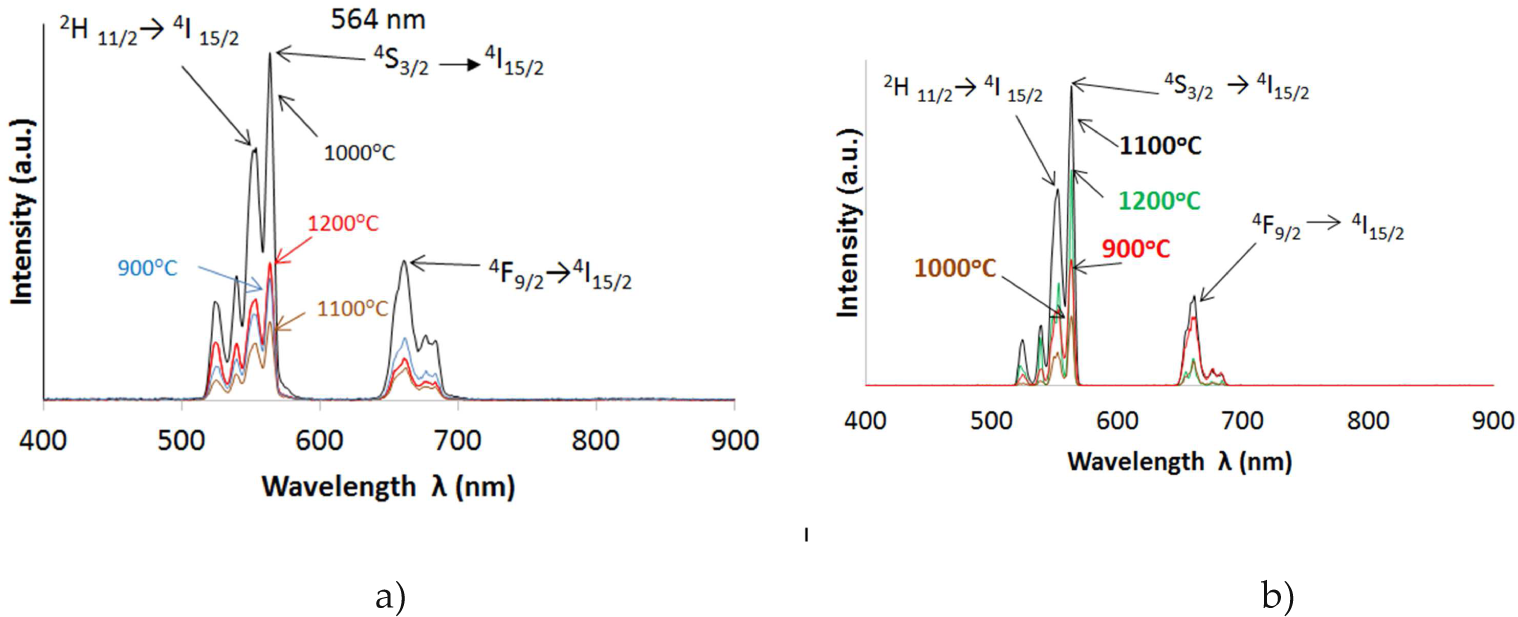
The upconversion emission spectra for UCNs under excitation with 980 nm of Y2O3:Er3+/Yb3+ (1%, 1% mol) a) by SG and b) CS. Green emission (564 nm) with both synthesis methods is present

Shows the upconversion emission spectra for UCN under excitation with 980 nm wavelength of Y2O3:Er3+/Yb3+ (1%, 5% mol) a) by SG and b) CS

The upconversion emission spectra for UCNs under excitation with 980 nm of Y2O3:Er3+/Yb3+ (1%, 10% mol) a) by SG and b) CS. Red emission (661 nm) present with both methods
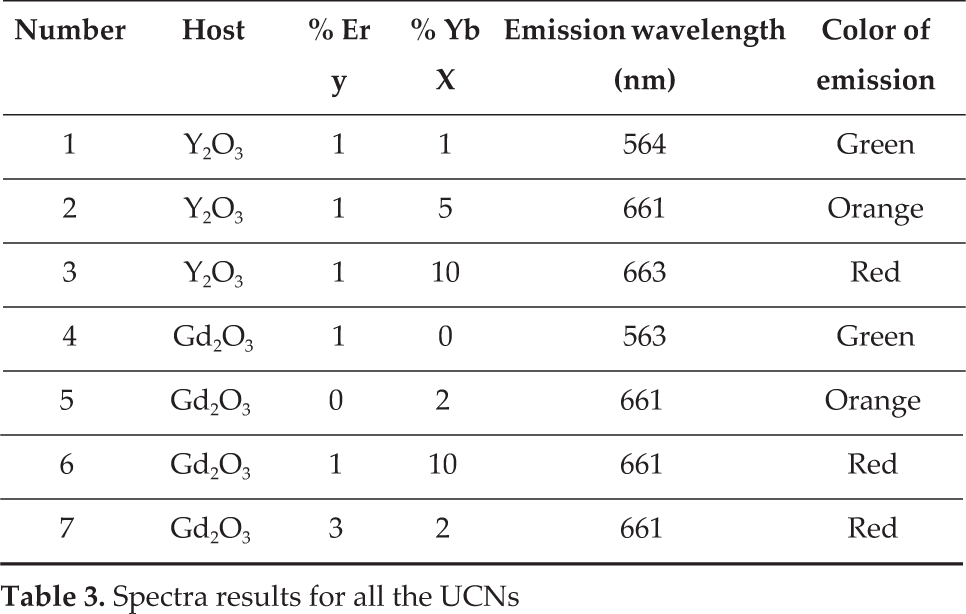
The spectra results of all the UCNs under laser excitation (980nm) are shown on Table 3. The doping Y2O3:Er3+/Yb3+ (1%, 1% mol) presents green emission, the same as Gd2O3:Er3+ (1% mol). The transitions of 2H 11/2→ 4I 15/2 (550 nm), 4S 3/2→4I 15/2 (564 nm) and 4F9/2→4I15/2 (660 nm) are present in all the UCNs of Y2O3:Er3+/Yb3+ with different intensities and in the Gd2O3:Er3+/Yb3+ samples.
Spectra results for all the UCNs
3.2.3 Upconversion luminescence properties of the silica-coated UCNs
Upconversion luminescence spectra for silica-coated Y2O3:Er3+,Yb3+ and Gd2O3:Er3+,Yb3+ samples are shown in Figure 13. Under laser excitation of 980 nm, transitions of 2H 11/2→4I 15/2 (550 nm), 4S 3/2→4I 15/2 (564 nm) and 4F9/2→4I15/2 (660 nm) are indicated. The intensity of some samples is lower than that of the non-coated samples, but still the luminescence is good. The same transitions are present.

Silica-coated UCNs. The same transitions are present as much as the non-coated UCNs, with great intensity: a) Y2O3:Er3+/Yb3+ (1%, 10% mol) CS 1200°C; b) Y2O3:Er3+/Yb3+ (1%, 5%) CS 900°C, in which the transition 2H 11/2→ 4I 15/2 is not present, but the 4F9/2→4I15/2 is with lower intensity; c) Y2O3:Er3+/Yb3+ (1%, 1% mol) SG 1100°C, in which all transitions are present and almost with the same intensity as the original UCN; and d) Gd2O3:Er3+/Yb3+ (1%, 10%) SG 900°C.
4. Discussion
UCNs prepared by CS and SG methods were (Gd1-x-yYbxEry)2O3 and (Y 1-x-yYbxEry)2O3 (Table 1). The XRD analysis showed that the crystal structure of UCNs is a cubic lattice in agreement with JCPDS nos. 89–5592 (Y2O3) and 88–2165 (Gd2O3) database. According to the morphological analysis, the average size of the Gd2O3:Er3+/Yb3+ UCN was about 50 nm (+/-10 nm deviation) and the UCNs Y2O3:Er3+/Yb3+ were about 70 nm (+/- 10 nm deviation). The SG method offered better morphology results than the CS method. UCNs calcined with the highest annealing temperatures, which in this work were 900°C for gadolinium oxide and 1100–1200°C for yttrium oxide, show more intense luminescence due to the better formation of the crystalline structure and a more efficient insertion of Er3+ and Yb3+ into the lattice. Yttrium oxide is more stable at higher temperatures than gadolinium oxide; this is why higher temperatures were used for annealing yttrium oxide. For the UCNs with the host Gd2O3, the annealing temperature of 900°C produced more intense UCNs luminescence due to the complete formation of the crystalline structure. At 700°C, the crystalline structure is in the process of forming [15] and the luminescence intensity of some UCNs is low or none: for example, the Gd2O3:Er3+/Yb3+ (2%,3%) (Figure 9) and Gd2O3:Yb3+ (2%) (Figure 8 b).
According to Li [5], the Yb3+ ions have a much larger absorption cross-section relative to that of Er3+ ions around 980 nm, while the Er3+ ion can be excited from the ground-state 4I15/2 to the excited state 4I11/2 by energy transfer from the excited Yb3+ ions. In this study, for the host Y2O3 with Er3+ (1%) and Yb3+ (1%) concentrations, the green emission was stronger due to the electron population in level 4S3/2→4I15/2 At higher concentrations of Yb3+ (5% and 10%), the 4F9/2→4I15/2 level was more electron-populated. With both synthesis methods, the red emission is much stronger than the green emission. This suggests that the 4F9/2 level is more electron-populated than the 4S3/2 level. However, present results agree with Li [5], in that the emission intensity strongly depends on the synthesis method. In the present study, the SG method produced UCNs with higher luminescence intensity than CS. We conclude that this is because the SG method produces a more homogeneous and purer solid outcome than the CS method, which generates a solid with more defects and impurities. For example, no green emission was found in the Gd2O3:Er3+/Yb3+ (2%, 3%) sample synthesized by CS; however, with the SG, the sample did emit in green. This may be because the CSUCNs have centres of non-radiative relaxation that releases a phonon instead of a photon [8]. That is why we propose that, for UCNs, the CS method is less reliable than SG. In this field, other authors, such as Li Yanhong [5], have compared synthesis with two methods, CS and precipitation, of only one host, Gd2O3:Er3+/Yb3+ (3%, 20%), with only one annealing temperature, 950°C; Singh [15] analysed only Gd2O3:Er3+/Yb3+, but varied the molar concentration of Yb2O3 from 0% to 0.6% and of Er2O3 from 0% to 3.5%. Meanwhile, Vetrone [16] prepared Y2O3: Er3+/Yb3+ by CS and hydrolysis methods. In addition, Kong [7] compared three different hosts – Y2O3, La2O3, and Gd2O3 – by flame synthesis co-doped with Er3+ and Yb3+. The effects on Gd2O3:Er3+/Yb3+ with several doping concentrations of Er3+ (0.5% to 2%) and Yb3+ (0% to 15%) were also reported by Kumar [17–18]. To the best of our knowledge, the present study is the first to compare two hosts with several doping concentrations of Er3+ and Yb3+ and various annealing temperatures for UCNs synthesized with the methods of CS and SG.
Hemmer [1] studied the application of UPNs (Gd2O3:Er3+, Yb3+) in biomedicine, such as in in vivo fluorescence bioimaging. Improving the UCNs synthesis method and luminescence properties can lead to the production of nanoparticles, which may be applied as biolabels for cancer cell detection. Further studies to determine cytotoxicity of silica-coated nanoparticles and functionalization of UCNs are needed.
5. Conclusions
The emission intensity depends of the synthesis method: the SG method produces more intense samples than CS. We conclude that this is because the SG method produces a more homogeneous and purer solid than the CS method, which generates a solid with more defects and impurities. The average size of the Gd2O3:Er3+/Yb3+ UCNs were about 50 nm (±10 nm deviation) and the UCNs Y2O3:Er3+/Yb3+ were about 70 nm (±10 nm deviation). The Er3+ and Yb3+ are on small percentages and did not affect the structure of the hosts. The red emission with high intensity was present in the UCNs Gd2O3:Er3+/Yb3+ (1%, 10% mol) (900°C annealing) and also in the UCNs Y2O3:Er3+/Yb3+ (1%, 10% mol) (1200°C annealing). The green emission with high intensity was present on the UCNs Y2O3:Er3+/Yb3+ (1%, 1% mol) (1200°C annealing). Silica-coated UCNs show good emission spectra. The UCNs synthesized in this work may be potentially used as biolabels to detect cancer cells given that, with the silica coating, the UCNs had a core/shell that can be functionalized with various ligands, which can be used on biological systems for imaging applications. Further experiments are in progress, such as cytotoxicity evaluations and functionalization studies, before these UCNs can be used in vitro.
6. Conflicts of interest
The authors declare no conflicts of interest.
Footnotes
7. Acknowledgements
The authors wish to acknowledge the support of the Dirección General Asuntos del Personal Académico UNAM DGAPA under grant no. 109913, and the Consejo Nacional de Ciencia y Tecnología CONACyT under grant no. 232608. The technical support provided by Eloisa Aparicio, Francisco Ruiz and Marcelino Ponce is also gratefully acknowledged.