
Abstract
The Joule heating of carbon fiber-based textiles enables an energy- and cost-efficient processing of carbon fiber reinforced thermoplastic parts. This article introduces a new method to pass direct current into a dry, not pre-consolidated hybrid yarn textile based on recycled carbon fibers and polyamide 6 fibers. The aim is to melt polyamide fibers, subsequently impregnate carbon fibers, and finally consolidate the material to form a composite part in a single process step. To increase the reliability of this technology, the electrical properties and the behavior of the material during the heating process must be thoroughly investigated. It will be addressed how the material is characterized during the process and how the changing resistivity of the textile affects the current flow between the electrodes to generate intrinsic heat. Moreover, a method to determine the effective material resistivity by finite element simulation on the fiber scale based on a CT scan is presented. Thus, a validated material model with respect to the temperature development in the textile based on ρ = ρ (Τ) was established.
Introduction
The suitability of electric current to generate heat in a carbon fiber-based textile, thus forming composite parts, has been proven in the literature. 1 –14 First applications of Joule heat in carbon fibers were aimed at the efficient curing of thermoset resins. 1 –4 The resulting cured composites were manufactured with short cycle times while offering identical mechanical behavior to the state of the art. The contacting of carbon fibers to generate a homogeneous temperature throughout the composites was described to be a challenging task. 1,4 Recently, researchers started to employ the concept of Joule heating for processing pre-impregnated thermoplastic materials. 5 –11 Further developments in this field have since enabled the manufacturing of simple 3D parts from pre-impregnated thermoplastic sheets. Even complicated shapes could be heated evenly throughout the parts. 10 However, there are two main downsides to the use of pre-impregnated materials, that is, the resulting higher costs of the overall process chain and the required two-step process due to heating and forming. In contrast, less research has been directed toward dry multilayer fabrics based on hybrid yarn made of carbon fibers and thermoplastic fibers (Figure 1). In this case, the semifinished part is a flexible and highly drapeable textile with aligned reinforcement fibers and a suitable thermoplastic resin which must be impregnated. The aim of the process discussed in this article is to use one tool to add heat, pressure, and movement to impregnate and consolidate the semifinished part in a one-step process. First experiments yielded satisfying results for this concept with a void fraction below 1 %, flexural properties in accordance with the state of the art and heating times of 15 s. 11 Further research is required to investigate the theoretic behavior of the changing resistivity in textiles used in the setup depicted in Figure 2. Changes in resistivity may result from the impregnation and consolidation process. Heat is generated, which changes the properties of the carbon fibers on the one side and melts the polymer fibers and thereby creates more contact points between carbon fibers on the other side. Furthermore, the heat is generated by a high current, which shows a reduction of resistivity through tunneling electrons. These corresponding transport properties of conductive composites are widely discussed for impregnated composites based on laminates or percolation-based short fiber composites. 15 –19 Therefore, in this article, the dependency of resistivity is being assessed for a discontinuous, not pre-consolidated material. The mechanism and homogeneity of heat generation between two electrodes (Figure 2) due to an applied current are evaluated as well. Yarlagadda et al. 12 identified three different mechanism in the textile with varying effects depending on the stage of the process (fiber heating through Joule losses, dielectric hysteresis heating, and contact resistance heating between fibers). Myungsoo et al. 13 found the same theory being valid for laminates. To validate the theory of Joule heat generation in the research project presented in this article, the process was simulated and compared to experimental data. Therefore, the physical criteria influencing the process need to be defined to describe the material itself as well as the transition between materials in the simulation software. Athanasopoulos et al. 20 describe the flow of current in transverse direction to the carbon fibers as a zigzag path from contact point to contact point. This fits the theory of Chippendale et al. 15 according to which the degree of anisotropy determines the traveling of current through the material between the electrodes, since current seeks to minimize the Joule heat released. Moreover, Zantout and Zhupanska 16 discovered that the so-called a-spots between carbon fibers are primarily responsible for heat generation under applied current. The term a-spot refers to the area where current flows between two contacts. They also described the sudden change in the number of a-spots during the process as a significant difficulty. The resistivity changes due to changing temperature and geometric orientation further complicates this process. 1,3
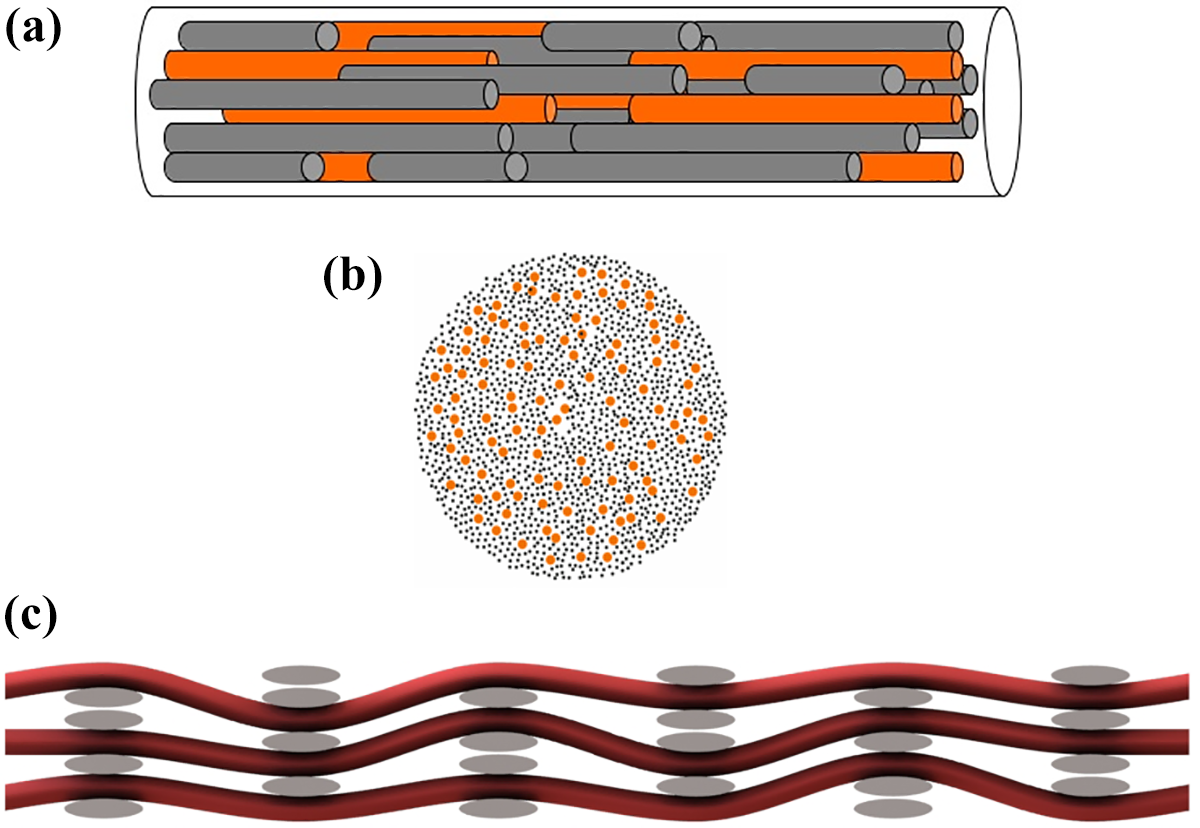
Longitudinal (a) and transverse (b) section of hybrid yarn as well as the resulting multilayer fabric (c).
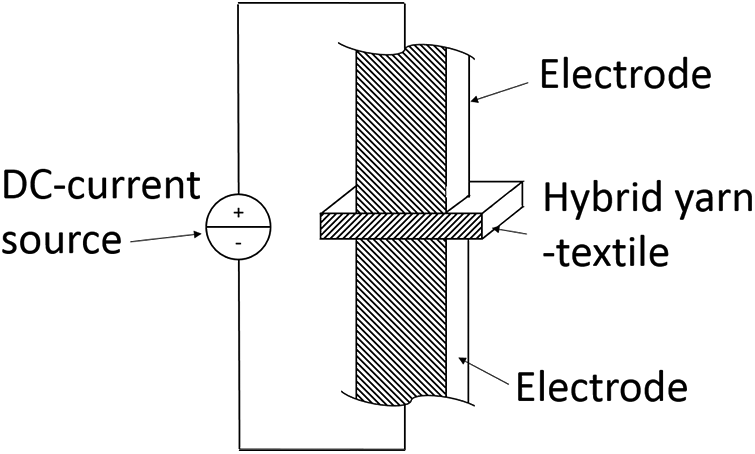
Concept of Joule heating between two electrodes.
Procedure
Material
The investigated heating mechanism is based on a conductive textile. In this case, a multilayer fabric made from a hybrid staple fiber yarn containing 60 mm polyamide 6 (Radici) fibers and 80 mm recycled carbon fibers (rCFs) (SGL SIGRAFIL C T24-5.0/270 from bobbin ends) is examined. In the literature, three types of rCFs are defined: fibers from production offcuts, prepreg fibers, and fibers gained from end-of-lifetime components. 21 Reusing carbon fibers on an industrial scale has a great potential for reduced costs and enhanced environmental friendliness. During the carding process, 80 mm carbon fibers are shortened to 60 mm. The final yarn and fabric show a homogeneous distribution of reinforcement and thermoplastic resin fibers, compare Figure 1. Yarn manufacturing was carried out by Wagenfelder GmbH, Wagenfeld, Germany, whereas weaving was performed at the Institute of Textile Machinery and High Performance Material Technology, Dresden, Germany. Table 2 represents a fiber volume fraction (FVF) of 44 % for a consolidated specimen. The melting point at 160 °C was determined by differential scanning calorimetry (DSC) analysis. The further development of the hybrid yarn and the multilayer fabric is described in the literature. 11,21,22
Heat conductivity in the transverse direction (VGSM 3.2 simulation and LFA measurement).a
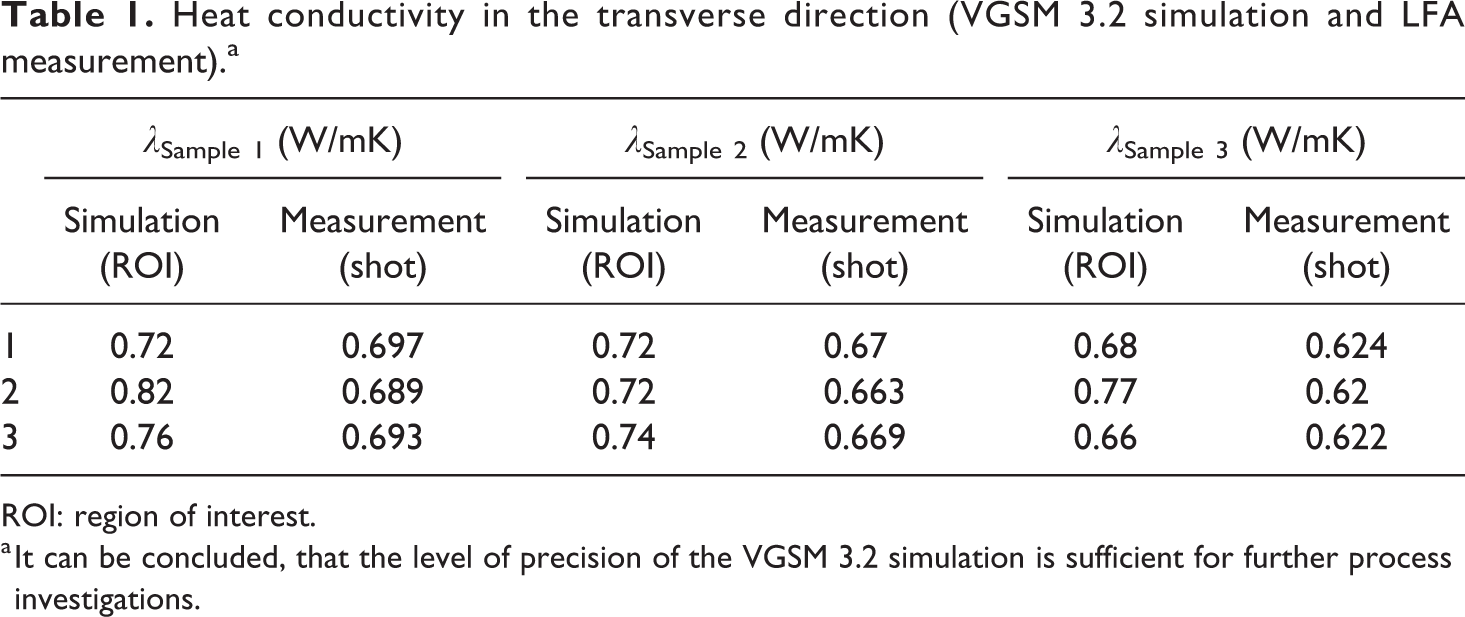
ROI: region of interest.
a It can be concluded, that the level of precision of the VGSM 3.2 simulation is sufficient for further process investigations.
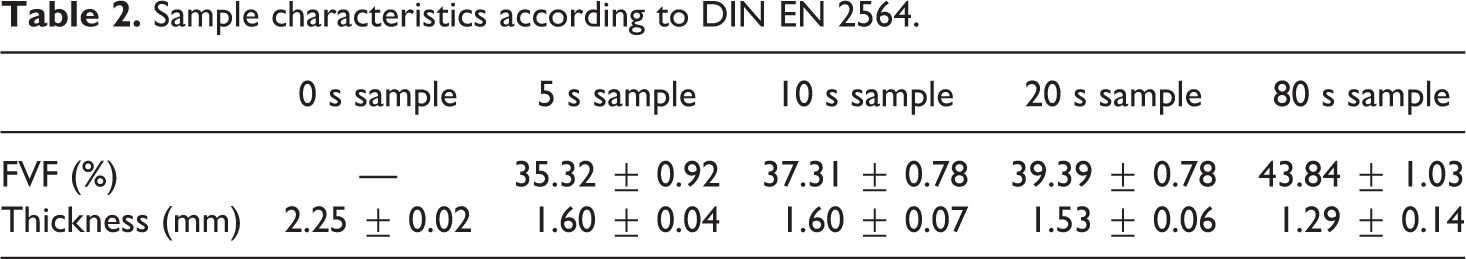
Sample characteristics according to DIN EN 2564.
Sample preparation
The concept of using intrinsic Joule heat to impregnate and consolidate a conductive textile in the transverse direction between two electrodes (Figure 2) was first introduced by Reese et al. 11 To obtain in-depth knowledge on the processes occurring between both electrodes in the hybrid yarn textile, the material and process must be characterized in terms of the changing resistivity. 23 The objective is to simulate the temperature development in the textile based on the theoretic electrical behavior. Thus, the material resistivity being dependent on temperature and the degree of impregnation as well as the influence of the current level must be evaluated. Therefore, several samples from the same textile charge were prepared depicting different stages of the impregnation and consolidation process at a pressure of 30 bar, a current of 175 A, and an electrode temperature of 110 °C. The size of the electrode contact surface in Figure 2 is 900 mm2; it was coated with Loctite Frekote 770NC and B15. The samples were prepared by energizing the hybrid yarn textile based on the setup shown in Figure 1 for 5 s, 10 s, 20 s, and 80 s. Measurement data were recorded using a Graphtec logger GL240 in the style of DIN EN 16812 and DIN EN 60584. The setup, dimensions, and equipment are described in Reese et al. 11 The research introduced in this article focused on changes in resistivity due to changes in temperature, the degree of compaction, and current.
Figure 2 shows two electrodes connected to a direct current (DC) source, which were placed into a pressure-controlled press. Both electrodes were tempered using oil flow through integrated heating-cooling channels. The pressure dependency of the heating process as well as the influence of fabric structure, different electrode geometries, surface conditions, electrode temperature, and the amount of current and voltage were described in a previous article. 11 As a summary, with respect to the influence of fabric structure on the resistivity of the composite, the more layers and the higher the distribution of interlacement, the more uniform and increased is the resistivity. Furthermore, it was found that the resistivity is mainly influenced by the pressure on the textile and the surface condition of the electrodes. The higher the pressure, the lower and more even the resistivity as well as the higher the contact resistivity (polished or even coated electrode surface), the higher the total resistivity and therefore the better the temperature distribution.
CT scans and simulation of material characteristics
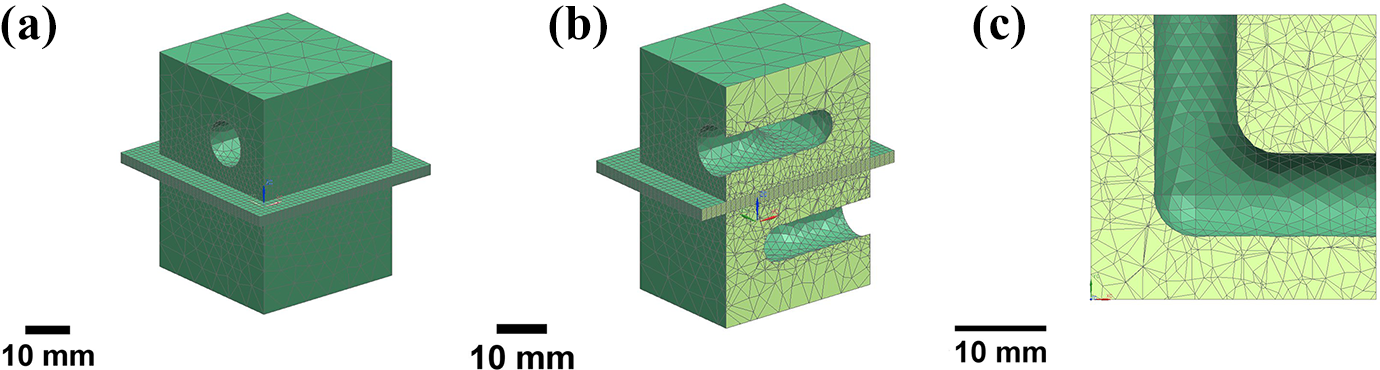
To assess the effect of geometric changes in the textile due to heating under pressure, CT scans of each sample trio, which were energized for 5 s, 10 s, 20 s, and 80 s, were analyzed using the software Volume Graphics VGSTUDIO MAX 3.2 (VGSM 3.2). In particular, 4 × 4 mm CT scans for a total of 12 samples were taken using a Phoenix X-ray nanotom with a resolution of 2 µm. An example of a 3D rendering of a reconstructed CT scan can be seen in Figure 3. The analyzed region of interest (ROI) was defined on the CT scan, and the material characteristics were simulated for that specific volume element in all spatial directions. The simulated values for the effective electrical resistivity in the longitudinal (both warp- and weft-) direction of three CT scans of 80 s energized samples were then compared to the measured resistivity values of 80 s consolidated probes (Figure 4) using four-terminal sensing. Once the method for the simulation of the effective electrical resistivity using a CT scan was validated, the resistivities in the through-thickness direction were determined by simulation for all 12 samples.
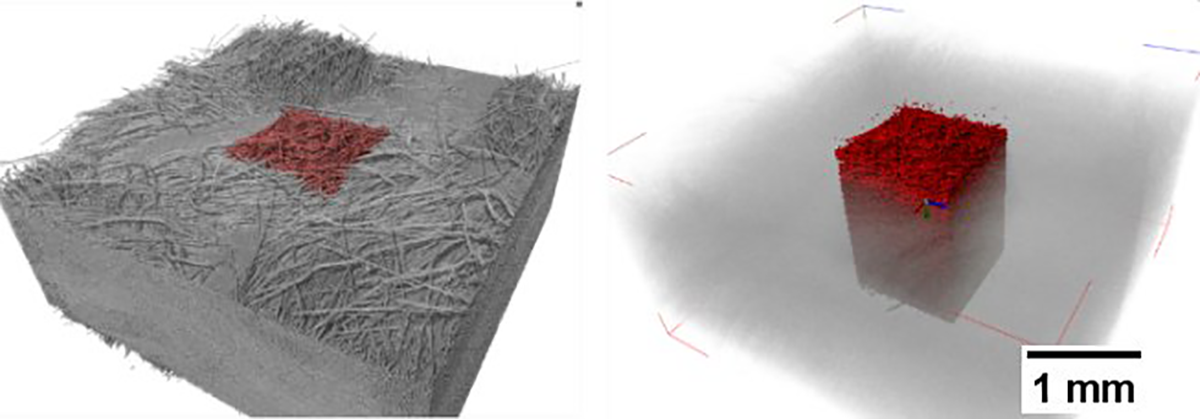
Region of interest (ROI) of the CT scan.
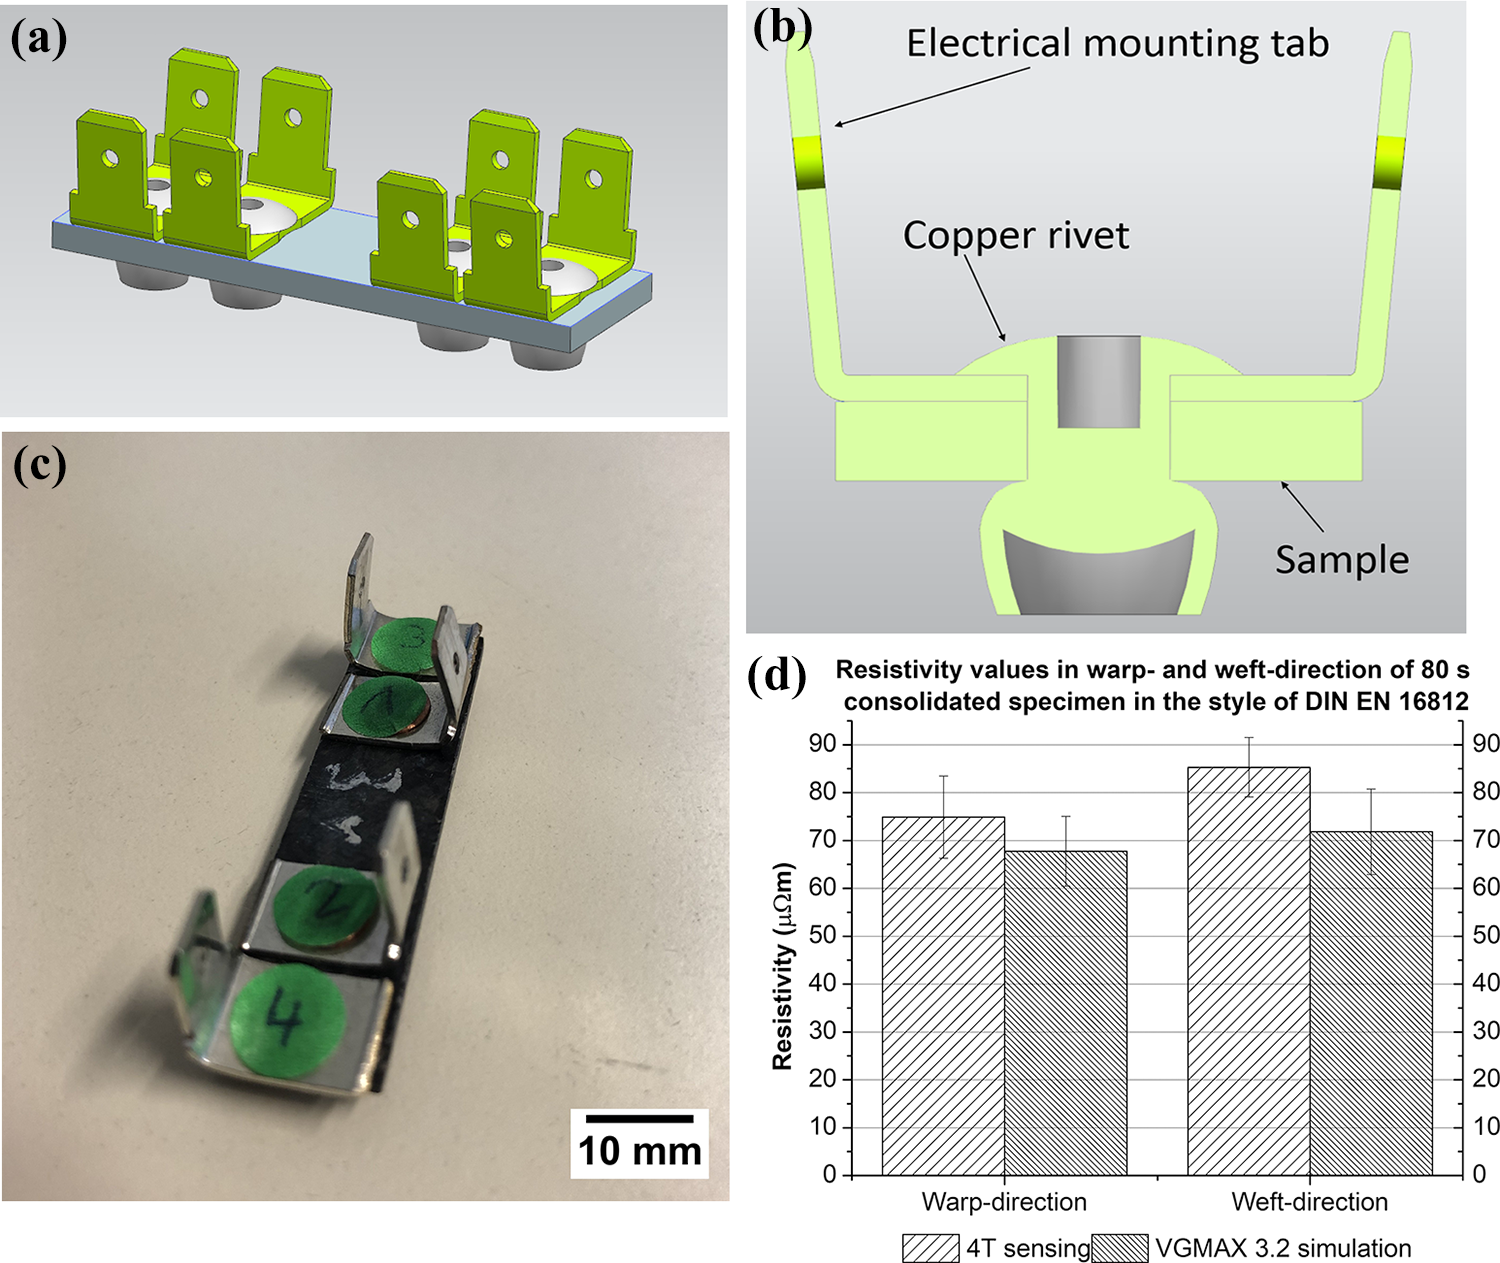
Sample setup for four-terminal sensing (a to c); comparison of simulated and measured values in the warp and weft direction for an 80 s energized sample (d).
For the simulation of electrical current in the sample, an image segmentation step of CT data was performed in VGSM 3.2, separating carbon fibers from thermoplastic resin. This step is necessary to be able to assign different bulk resistivities to the two components as input for the subsequent finite element simulation. The segmentation procedure starts with an initial contour based on a user-provided gray value threshold, which is then locally refined (down to sub-voxel precision) to compensate for local contrast variations. To obtain accurate simulation results, a truthful segmentation is crucial as over- or underestimation of fiber diameters or gaps between carbon fibers lead to inaccuracies in current simulations. The initial gray value threshold is validated so that, in conclusion, the final image segmentation matches the previously determined fiber volume fraction as detailed below (Table 2). The selected version of VGSM 3.2 can only process two material components simultaneously, so that voids are considered as part of the (low-conductive) polyamide phase. This simplification is acceptable as the carbon fibers are assumed to primarily affect the total electric flow. Since the fiber geometry has a very complex structure, the creation of a conventional finite element mesh would be very challenging, if not impossible. VGSM 3.2 employs a specific finite element variant, a so-called immersed-boundary solver, which does not require a geometry-conforming mesh but operates directly on the segmented CT data. Thus, all details of the fiber geometry provided by CT data are taken into account without simplifications. The stationary electrical current through the fiber/polyamide composite is simulated, characterized by the individual bulk resistivities of the two components. The driving boundary condition is a fixed voltage drop, where two different voltages are applied onto two parallel planes at opposing boundary faces of the sample. A-spots are not explicitly determined, but they are taken into account implicitly through the fiber geometry.
Experimental characteristics of the electrical behavior
Dependency of electrical resistivity on degree of compaction
During the process of melting the polyamide fibers, the geometric position of conductive carbon fibers is changing. Hence, the resistivity of the textile fabric is also changing. To assess the influence of the geometry dependent electrical resistivity during the process, a CT-based simulation method was chosen. This is a suitable method due to the complexity of resistivity measurements of samples that are not fully consolidated in the through-thickness direction while avoiding the influence of contact resistance. In a first step, the method discussed in section “sample preparation” must be validated, so that the results obtained can be evaluated.
Validation of the CT-based method
The bulk electrical resistivity values used for the simulation were 19 µΩm for the carbon fiber and 1E-07 µΩm for the polyamide. As previously explained, potentially occurring voids are considered to be part of the polyamide component. The fiber, resin, and void contents of the physical samples were determined following DIN EN 2564. The segmentation of the CT image was then calibrated by adjusting the initial gray value threshold in VGSM 3.2 until the segmented FVFs matched.
The effective resistivity in the warp and weft direction was determined by means of three samples of each textile direction. Probes were consolidated using the setup displayed in Figure 2 with an electrode contact area of 2500 mm2 and the settings described above. 11 These samples were then prepared according to the images in Figure 4(a) to (c). On the top left, the sample test setup for one textile direction is shown with dimensions of 50 mm × 13 mm × 1.3 mm. The samples were cut in the weft or warp direction and grinded to their final dimension using a disk-type sander. Subsequently, the holes required for the copper rivets were drilled with a precision drill suitable for CFRP (DIN 6535) and the electrical mounting taps were riveted onto the sample. Resistance was measured by a FLUKE 8808A multimeter after conditioning of the samples. Force connections were ensured by means of outer mounting taps, whereas sense connections were established by inner mounting taps (in the style of DIN EN 16812). The diagram in Figure 4(d) shows that the values compiled by CT scan analysis are in agreement with the measured values of the four-terminal sensing with a deviation of 9.5 % (warp) and 16.7 % (weft). Since the values simulated by VGSM 3.2 are further used to gain in-depth knowledge on the Joule heating process, a plausibility check was performed. For this, a simulation of transverse heat conductivity was carried out based on CT scans of samples that were energized for 80 s using VGSM 3.2. In addition, to validate the simulated values, a laser flash analysis (Netzsch laser flash analysis [LFA] 457 Microflash) of 80 s consolidated samples was conducted in the through-thickness direction (in agreement with DIN EN ISO 22007-4). The simulation result of three CT scans is 0.73 ± 0.05 W/mK, and the LFA result for three samples is 0.66 ± 0.03 W/mK (Table 1). The difference between measured and simulated values amounts to 9.6 %. Moreover, it was revealed that the deviation between theoretic calculation and actual measurement is comparable for electrical resistivity and heat conductivity. Hence, the error for the CT-based method of determining electrical resistivity of a carbon fiber reinforced thermoplastic part was determined and further values in the transverse direction for CT scans of 5 s, 10 s, 20 s, and 80 s can be investigated.
Results of the CT-based method
The findings of the through-thickness evaluation of resistivity are shown in Figures 5 and 6. However, the CT scan simulation only reflects the geometric position of carbon fibers and thermoplastic resin for the examined settings of each sample. It can be seen that the number of a-spots increases, thus leading to a decrease in electrical resistivity. This result is in accordance with the literature and confirms the theory of Athanasopoulos et al., 20 according to which current follows a zigzag path through the composite.
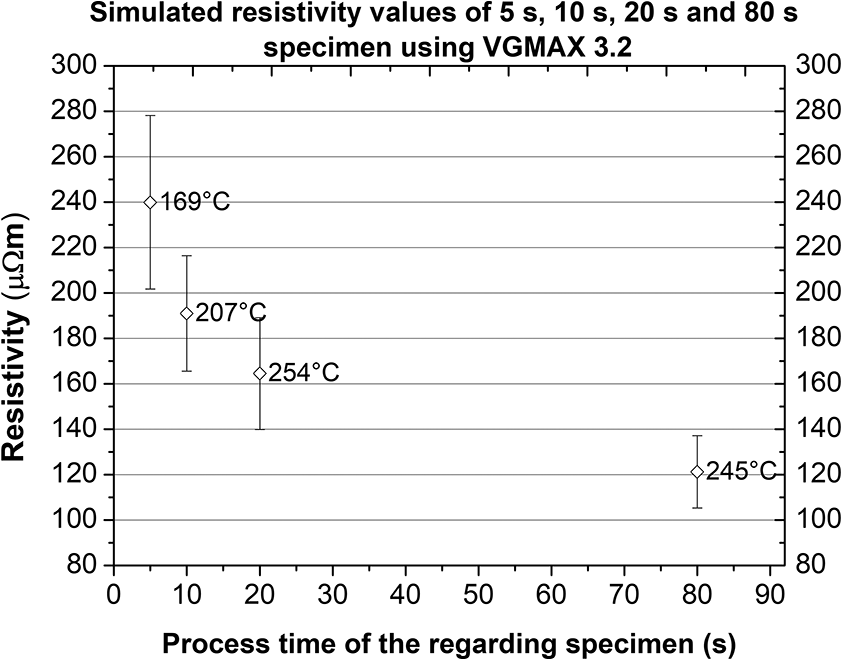
Simulated transverse resistivity values of 5 s, 10 s, 20 s, and 80 s energized samples and the maximum measured temperature during the manufacturing of the samples.
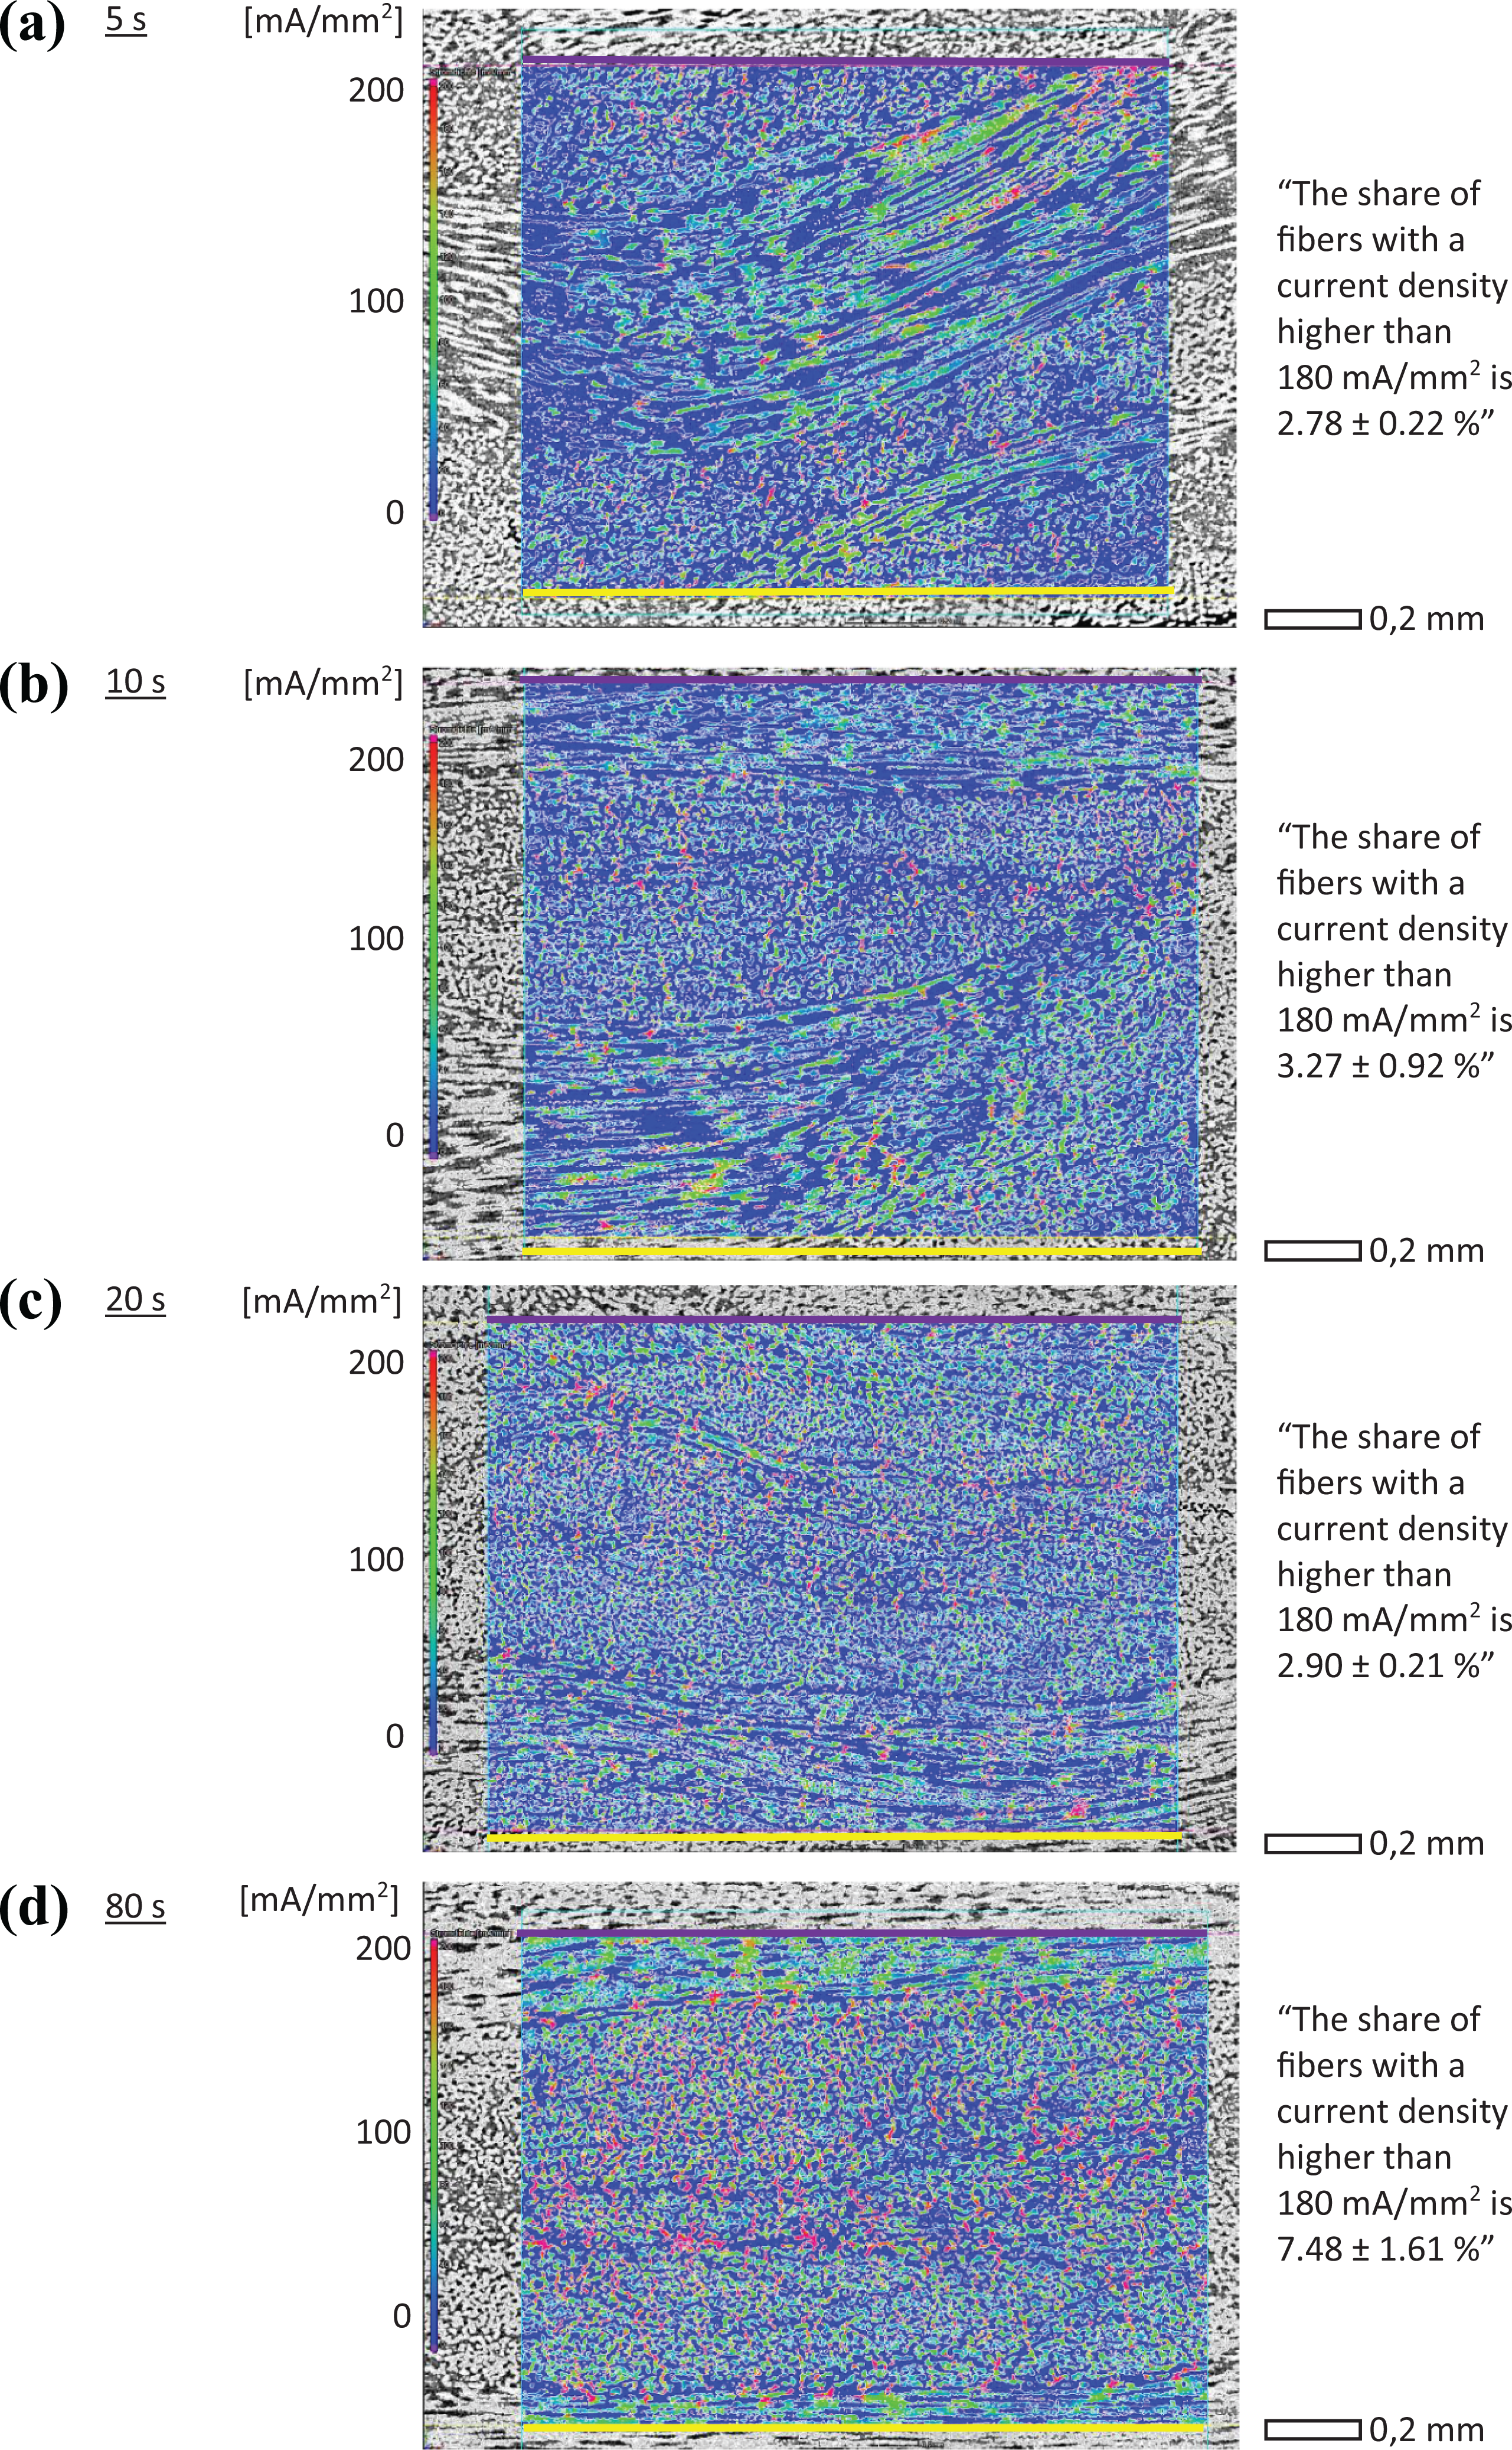
Current density distribution in (a) 5 s, (b) 10 s, (c) 20 s, and (d) 80 s energized samples.
Figure 5 illustrates the simulated resistivity values as a function of time, which match the sample distribution of current density throughout the different stages in Figure 6. The higher the energization time, the lower the resisity. Moreover, the diagram in Figure 5 exhibits the maximum measured temperatures during sample manufacturing. It was noticed that energization times that exceed 20 s result in a high deviation of the maximum temperature. During the melting of the thermoplastic component, the carbon fibers form a settled conductive network and a composite with decreased resistivity is formed. A 50 % change in resistivity can be noticed due to compaction.
Figure 5 indicates that the examined change describes the behavior between approximately 160 °C and 260 °C. For temperatures below 160 °C, further testing is required (3.2 and 3.3). The simulation of effective resistivity values in all three spatial directions (Figures 4 and 5) proves that the composite made of discontinuous rCFs and polyamide 6 has an anisotropic behavior, which is, however, less pronounced compared to the material analyzed in the literature. 15,18 The resistivity value in the through-thickness direction is nearly double the longitudinal direction value. This leads to the assumption that the current flow from one electrode, through the textile, to the other electrode (Figure 1) occurs within a small radius from the electrodes. The results described in Figure 5 can also be represented as a simulation of current density displayed on the actual CT scan. Thus, the increase in a-spots and the degree of compaction can be visualized. Figure 6 shows results of the transport simulation in an ROI of a CT scan for samples that were energized for 5 s, 10 s, 20 s, and 80 s respectively. The software determined the distribution of the current density in the material for a potential difference of 0.3 V. The graphical depictions show an extract of the CT scan and the defined ROI for which the current density was calculated. In Figure 6, the purple and yellow lines symbolize the electrodes between which the current density was simulated. The percentage of hot spots, where the current density is higher than 180 mA/mm2, was determined by analyzing images of three different samples for each energization time using the software “ImageJ 1.8.” Only the 80 s sample shows a significant increase in current density hot spots. It can be seen that the occurrence of current flow hot spots is evenly distributed and that the theory of current flow following a zigzag path through the composite holds true. 15,16,20 This is shown particularly in Figure 6 (pictures for 5 s and 80 s), where a high and even current density appears along the bundle of carbon fibers, which is directed horizontally. Importantly, all fibers take part in the conductive network, thus indicating a homogeneous heating behavior within the textile.
In Table 2, the FVFs and sample thicknesses of Figures 5 and 6 are listed. The fiber, thermoplastic resin, and void contents were determined following DIN EN 2564. These values match the observations and prove that an increased impregnation time can enhance the sample quality with respect to voids. However, this relationship can only be confirmed for these settings. According to the literature, by changing the pressure on the sample, the current value, the electrode temperature or the surface condition of the electrode, the heating time can be adapted in accordance with quality aspects. 11
Dependency of electrical resistivity on the level of current flow
Experiments on the relation between voltage and current were conducted using the setup seen in Figure 2 by applying six current levels ranging from 50 A to 200 A while measuring the voltage drop and temperature. The electrode temperature is 110 °C, which is established by a constant oil flow through the electrodes. Hence, if a sample is energized with a certain current, the heat output in the textile at some point in time is lower than the cooling power of the oil flow. Each sample was placed between the electrodes, pressure was applied, and the sample was then energized until reaching that point. As a result, the voltage value can be determined for each preset current level and each temperature. Five samples were conducted for each current level. The result can be seen in Figure 7. For further information on method and setup, see Reese et al. 11
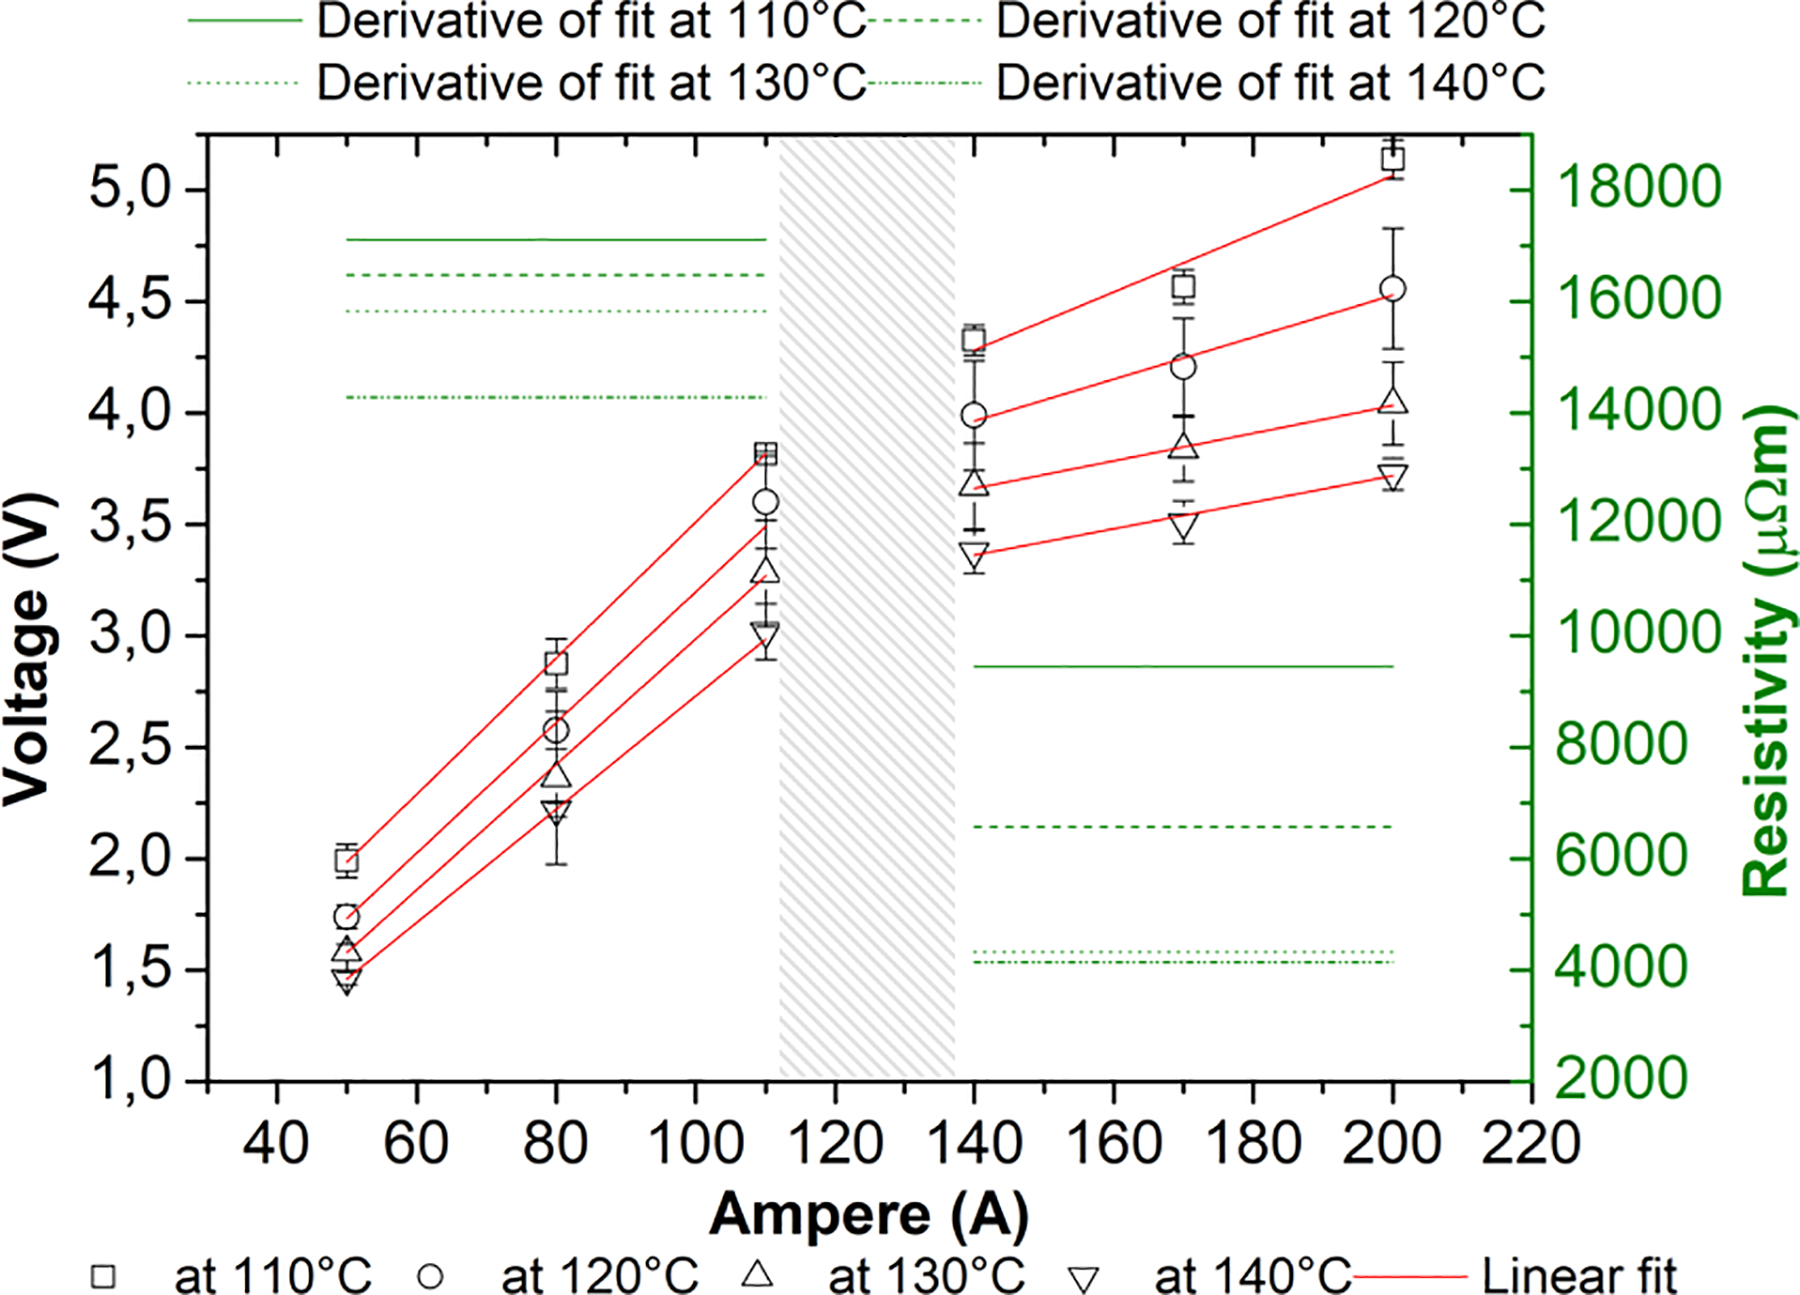
U-I diagram of the composite from 110 °C to 140 °C with linear fit depicting ohmic behavior and respective derivative to show the corresponding resistivity.
Figure 7 displays the U-I characteristics of the process at certain temperatures as well as the derivates of the respective linear fit. A series of measurements shows a tendency toward two areas of linearity. Up to 110 A, one linear fit was used to describe the relation between the points; from 140 A onward, a discontinuity occurred and another linear relation describes the U-I characteristic. As a result, the diagram exhibits two areas with ohmic behavior at the identical temperature level with a sudden change in resistivity. It can be seen that the resistivity is constant for currents between 140 A and 200 A and at a temperature higher than 130 °C. Similar observations can be found in the literature. Sichel and Gittleman 24 describe a linear characteristic at low temperatures for carbon-polymer composites and a nonlinear characteristic at high temperatures. They explain this behavior with the tunneling effect of electrons through gaps between conductive paths. A decrease in resistivity with increasing current was also observed by Zantout and Zhupanska. 16 They state that the material reaches a stable condition at a certain point where the resistivity does not decrease further. These observations match the behavior seen in Figure 7. The change in resistivity for 110 °C is Δ110 °C = 7659.1 µΩm from a low or no current to a high current. In conclusion, if the textile has a temperature of 110 °C and a current ≥140 A is applied, the resistivity drops by that value. It can be stated that, depending on the current level, there are two distinguished resistivity levels.
Dependency of the electrical resistivity on temperature
The resistivity of carbon fiber-based composites is dependent on the temperature of the material. 20,23 To determine the influence of temperature on the resistivity of the material both the pure carbon fibers and the combined woven textile based on staple fiber yarn need to be assessed. The behavior of the woven, not energized textile can only be observed for temperatures significantly lower than the melting temperature of polyamide 6 without increasing the number of a-spots. Results are introduced in Figure 8. For the examination of pure carbon fiber, the diagram is anticipated to show a linear negative temperature coefficient (NTC) behavior up to a temperature where the behavior changes to a positive temperature coefficient (PTC). 25 –27 This point marks the validity of the temperature-dependent resistivity of the woven material. Results for the carbon fiber examination are illustrated in Figure 9.
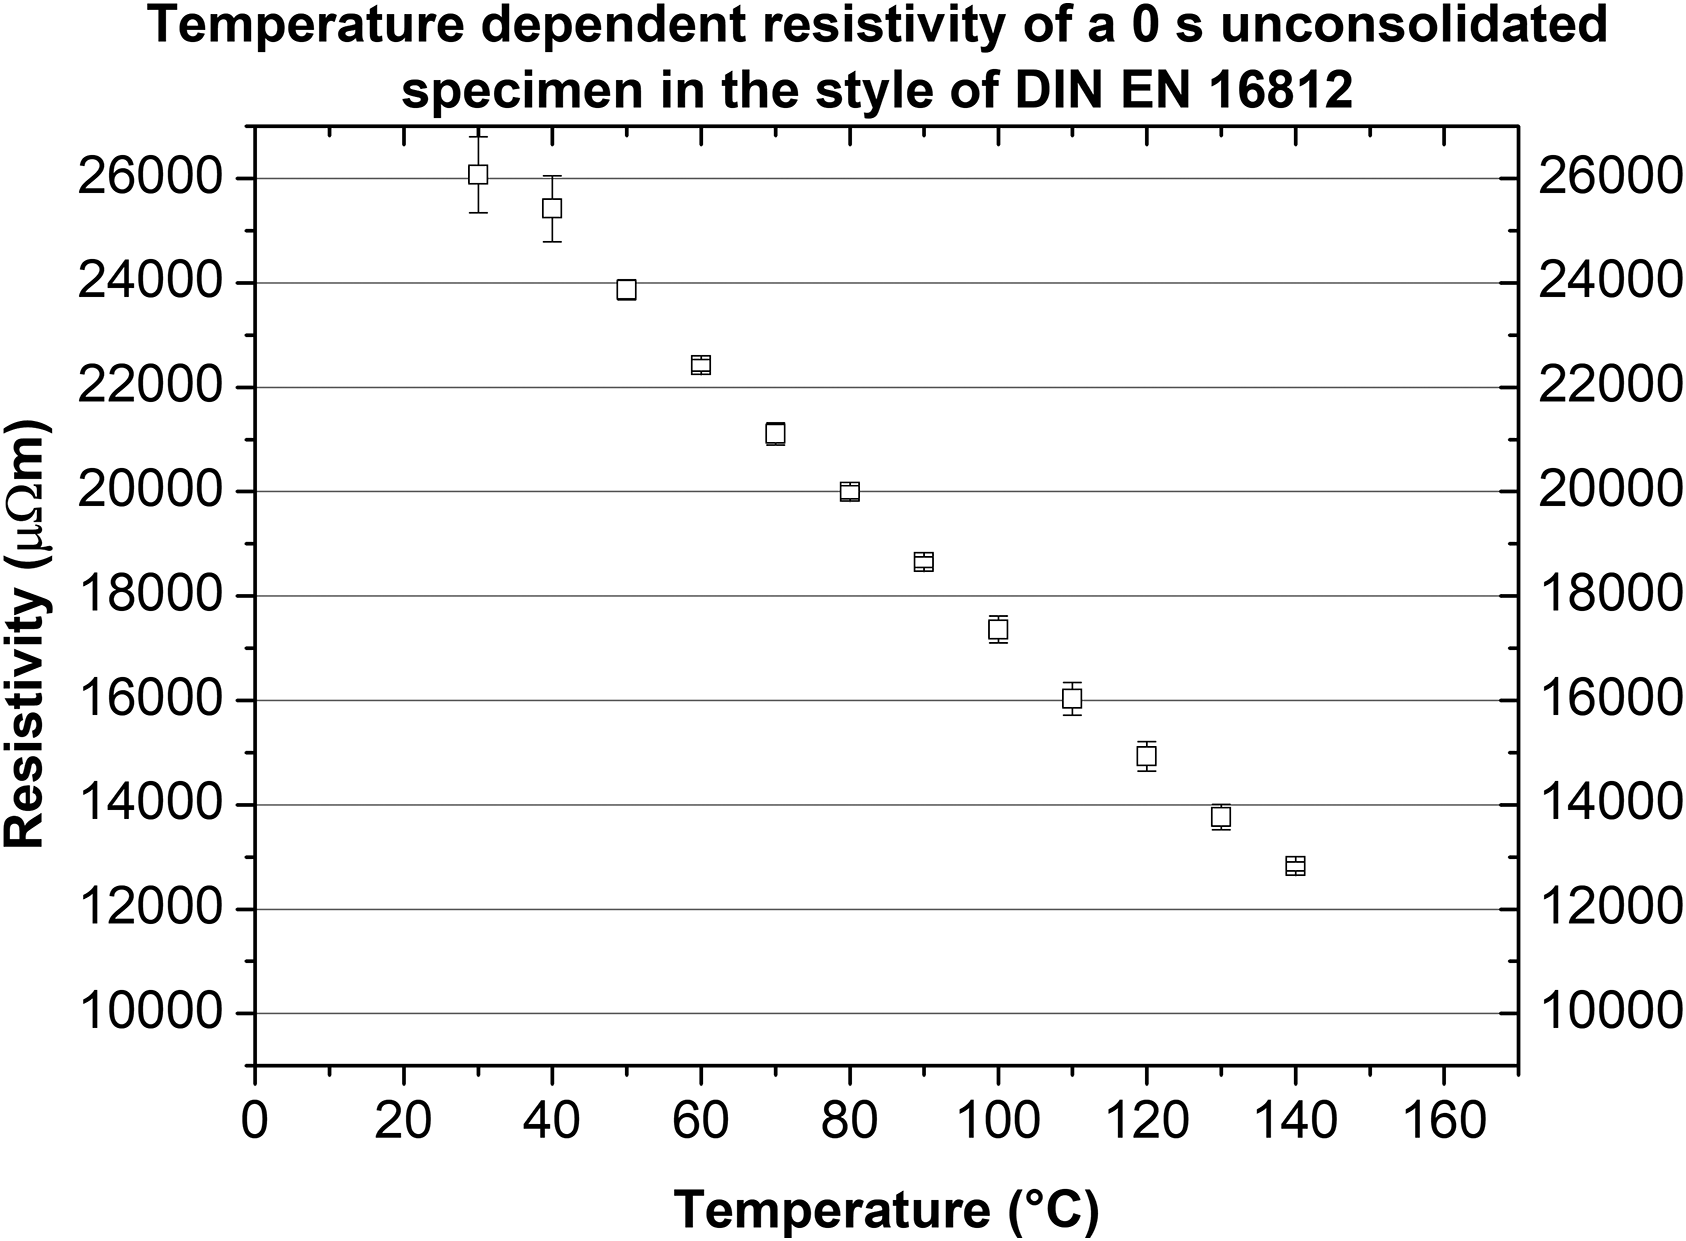
Temperature dependency of resistivity of 0 s samples.
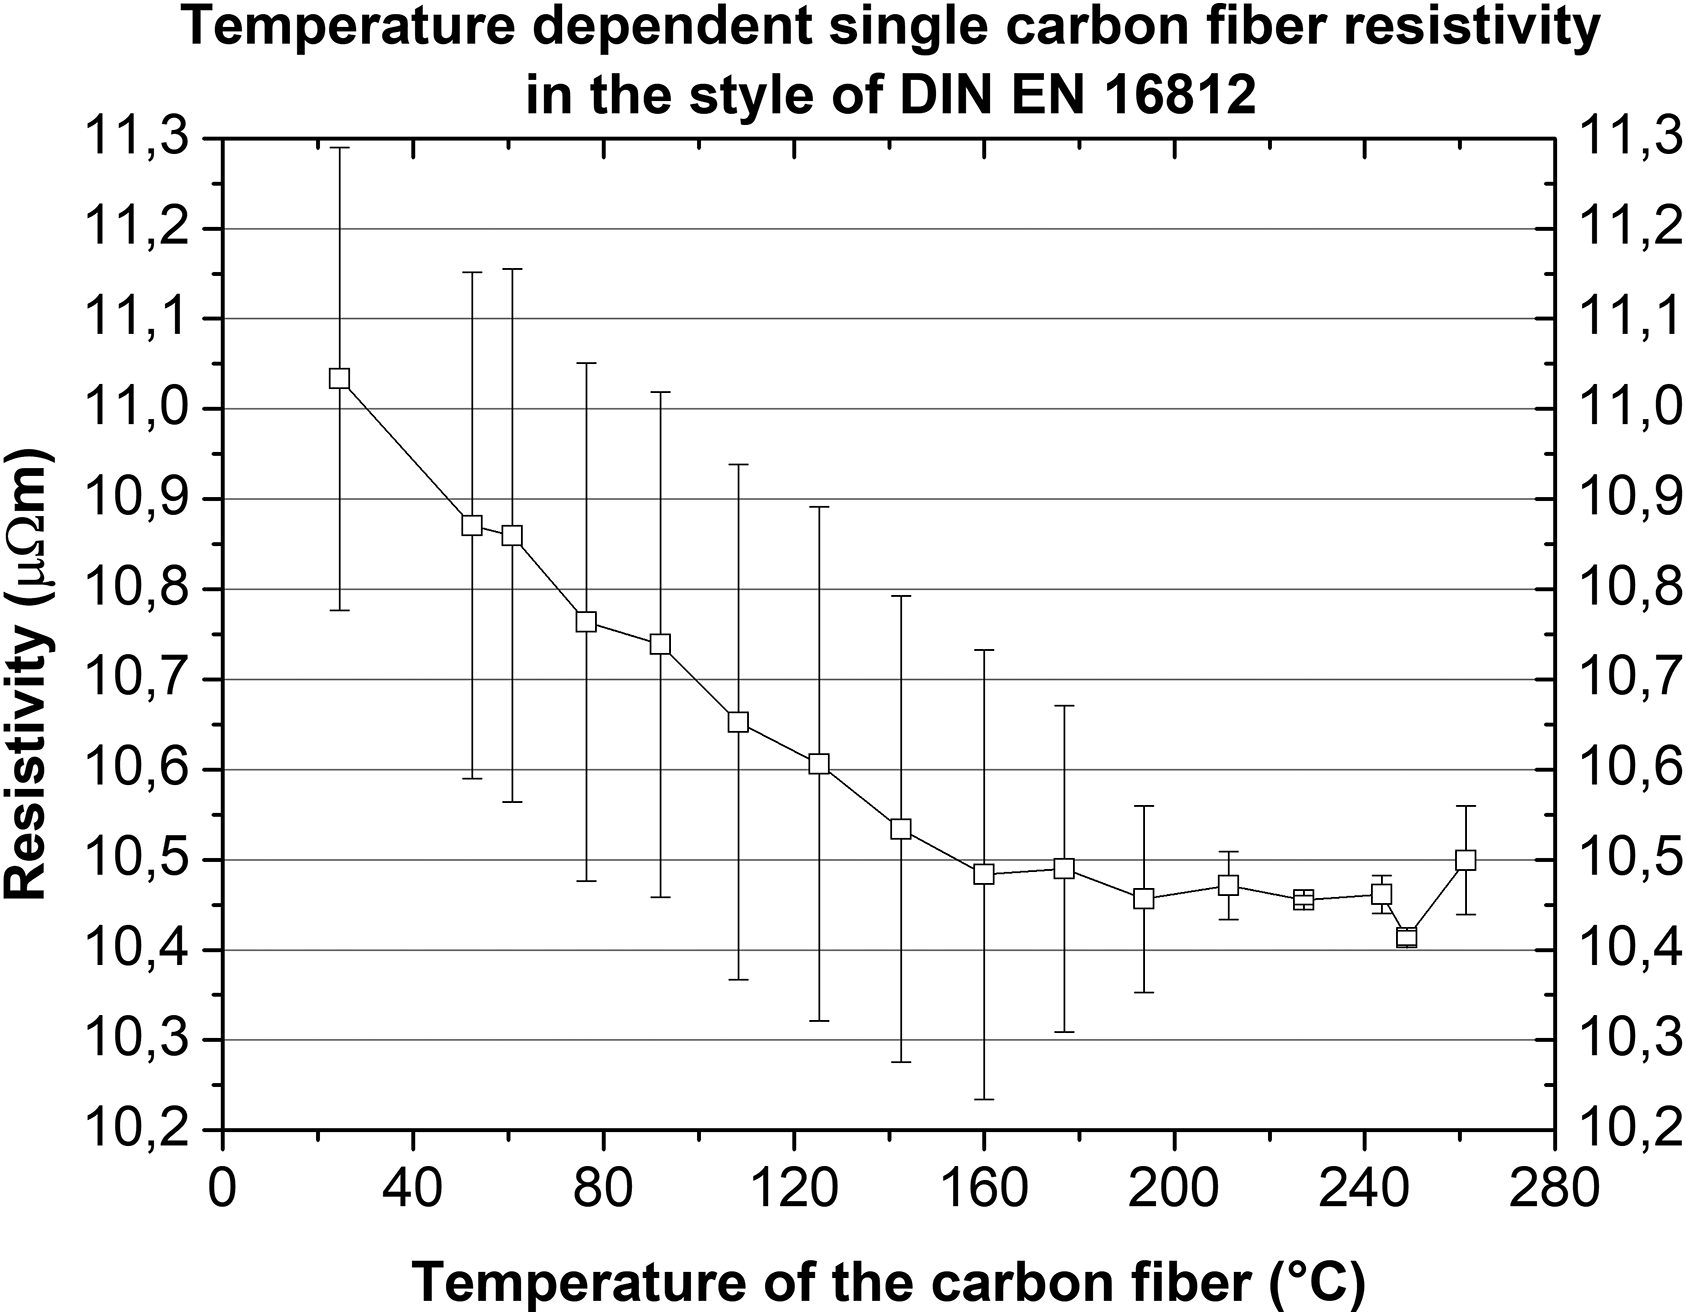
Temperature dependency of single carbon fiber resistivity.
Figure 8 shows the result of three probes of unconsolidated woven textile that were used to measure the temperature dependence of the material by placing each probe into the setup seen in Figure 2 and heating both electrodes from 30 °C to 140 °C using oil flow, while simultaneously measuring the resistance with the four-terminal sensing option of the FLUKE 8808A in the style of DIN EN 16812. The contact resistivity for both electrode-textile transitions is included in this measurement. Figure 8 reveals a strong dependency of the dry hybrid yarn-based textile (0 s samples) on temperature. The NTC coefficient for the linear fit can be determined to NTC = (dR/R0)/dT = 0.471 with an associated R2 value of 0.99921. This behavior is identical with values given in the literature for epoxy/CF laminates but with a more pronounced change in resistivity. 19 It is noticeable that the standard deviation is low for all points of measurement.
To determine the temperature-dependent material characteristics in the nonlinear region, 25,26 pure carbon fibers were examined at up to 260 °C, that is, a temperature that is significantly higher than the melting point of the polyamide fibers used. The behavior of the pure carbon fibers was assessed at the Institute of Textile Machinery and High Performance Material Technology, Dresden, Germany. Single carbon fibers were isolated from a roving and soldered to a fixture on both ends to achieve a fixed measuring section of 50 mm. The fiber was then placed over a heating plate and the resistance was determined in the style of DIN 51911 in a temperature range from 30 °C to 260 °C using a Keithley DAQ6510 multimeter for four-terminal sensing. Figure 9 presents the temperature dependency of the resistivity of the selected SGL carbon fibers in the temperature range between 30 °C and 260 °C. The carbon fibers show both NTC and PTC behaviors. 25,26 As displayed in Figure 9, a linear NTC behavior can be seen until 160 °C are reached, whereas from approximately 250 °C onward, a PTC behavior occurs. This can be explained by two effects, which appear in the different temperature ranges and lead to an inflection point in the electric behavior. 25 On the one hand, there is a semi-conductor specific increase in free charge carrier with temperature, and on the other hand, the conductor-specific carrier scattering superimposes other effects at higher temperatures. 25,27 In the scientific community, the resulting inflection point has been established as the characteristic temperature of carbon fibers as it describes the minimum value of electrical resistivity.
Resulting segmentation of the total resistivity
The research efforts described in previous chapters experimentally examined the influence of temperature, level of current, and change in geometric position of conducting and nonconducting fibers on the resistivity of the material. It was revealed that the main changes in resistivity that primarily affect the process are the established lower resistivity at high current levels and the temperature dependency of the carbon fiber resistivity. Hence, a theoretic behavior of the textile’s resistivity over temperature can be forecasted by defining a frame for this specific process. The relevant temperature frame starts at 110 °C to which the electrodes are preheated. The textile sample is then placed between the electrodes and pressure is applied. As soon as the preset pressure is reached, the current flow is turned on automatically by a DC contactor (controlled by a programmable logic control). These boundary conditions yield the starting value for electrical resistivity according to Figure 8 at 110 °C. Since the textile is settled during that experiment, which it is not during the actual process, 15 % of the resistivity value needs to be added. This relation is known from a previous article. 11 As soon as the current (≥140 A) is switched on, the resistivity drops according to Figure 7 for a temperature value of 110 °C. Based on this resistivity value, the incline can be subtracted to 160 °C following the behavior seen in Figure 8. From 160 °C to 260 °C, the behavior follows the decrease described in Figure 5. As initially mentioned, this process characterization does not include changes due to thermoelectric effects (peltier effect), melting of the polymer, as well as shrinkage of polymer fibers or changes of the contact resistivity, which may lead to a momentary increase in resistivity.
The fact that the simulated resistivity of the textile based on the CT scans is 5.1 % of the corresponding resistivity at a temperature of 170 °C leads to the assumption that the contact resistance has a major effect on the heating behavior in this process stage. The contact resistance occurs twice, that is, once when the current enters the textile and once when it leaves the textile. The electrical resistivity of a coated electrode surface is therefore 2235 µΩm. Zantout and Zhupanska 16 also found that contact resistance heating dominates over Joule heating at a certain point during the process.
Simulation of the process
Theoretic model of the simulation
The aim of the simulation is to calculate the temperature development in the textile in dependency on the changing resistivity. Therefore, the commercial solver “NX Advanced thermal” is employed for a transient simulation of the temperature development with an implicit time integration (calculated for 80 s with calculation steps at 0.5 s increments). The value of the reached temperature over time can then be validated by experimental data. The basis for the simulation is the determined function for electrical resistivity of the material over temperature (ρ = ρ (Τ)), which is derived from the values listed in Table 3. Thus, the power generated by the Joule effect is not constant throughout the process as previously described by Garmendia et al. 23 For a macroscopic simulation, the textile is represented as a black box with defined material characteristics. Figure 10 shows a meshed finite element method (FEM) model with the textile being placed between two electrodes. The dimension of the textile in Figure 10 is 40 mm × 40 mm × 2 mm with 11 nodal points over its thickness and mesh size of 1 mm2. Part (c) in Figure 10 represents the path of the oil flow to temper the electrodes at 110 °C with a flowrate of 1.4 m/s.
Meshed FEM model in Siemens NX.
Material data of the textile selected for the FEM model.
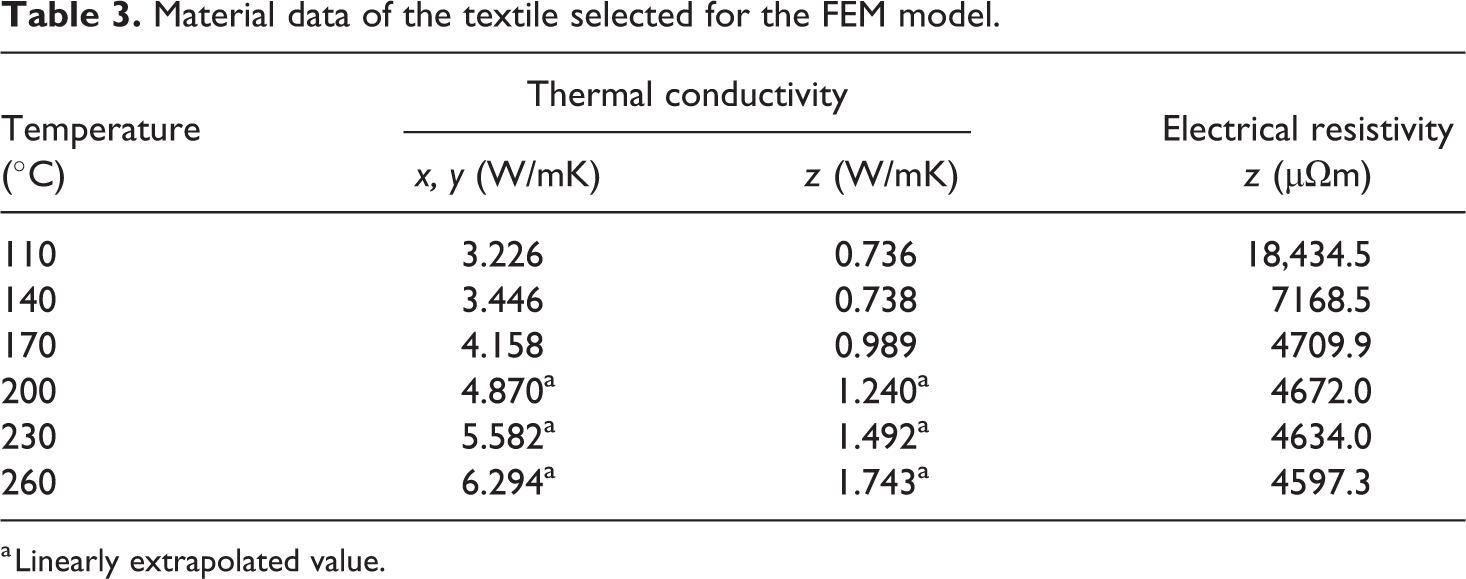
a Linearly extrapolated value.
Table 3 presents the material data of the selected textile. The temperature-dependent heat conductivity was determined using a laser flash analysis in agreement with DIN EN ISO 22007-4. It was found that the heat conductivity is not dependent on the degree of compaction. Moreover, empirical values were used to evaluate the temperature-dependent heat capacity. As a boundary condition, the thermal contact value between tool and textile was defined as 3500 W/m2 K for a solid and as 5000 W/m2 K for temperatures above 222 °C. Since the contact resistivity of the textile is included in ρ = ρ (Τ), an electrical contact of 1E-06 Ω is defined between electrode and textile. Further material characteristics were taken from the respective datasheets (Steel 1.2842, Oil RO200). Losses through convection were implemented for an ambient temperature of 20 °C, and for heat dissipation via tempering channel, a forced convection is defined. The start conditions include a temperature of 110 °C for textile and electrodes and a load of 175 A applied between top and bottom electrode. The model aims at validating the determined material behavior over temperature. Specific effects that had a significant effect on the process during experiments, 11 for example, thermoelectric effects, are not considered.
Results of simulation and validation
Figure 11 shows the simulated temperature values over time for a current level of 175 A as well as the experimental data for the same amount of current. It leads to the conclusion that the simulation results are satisfying for an initial estimation of the temperature over time development during the intrinsic heating of a non-pre-consolidated textile based on the setup seen in Figure 2 according to the change in resistivity as defined in this article.
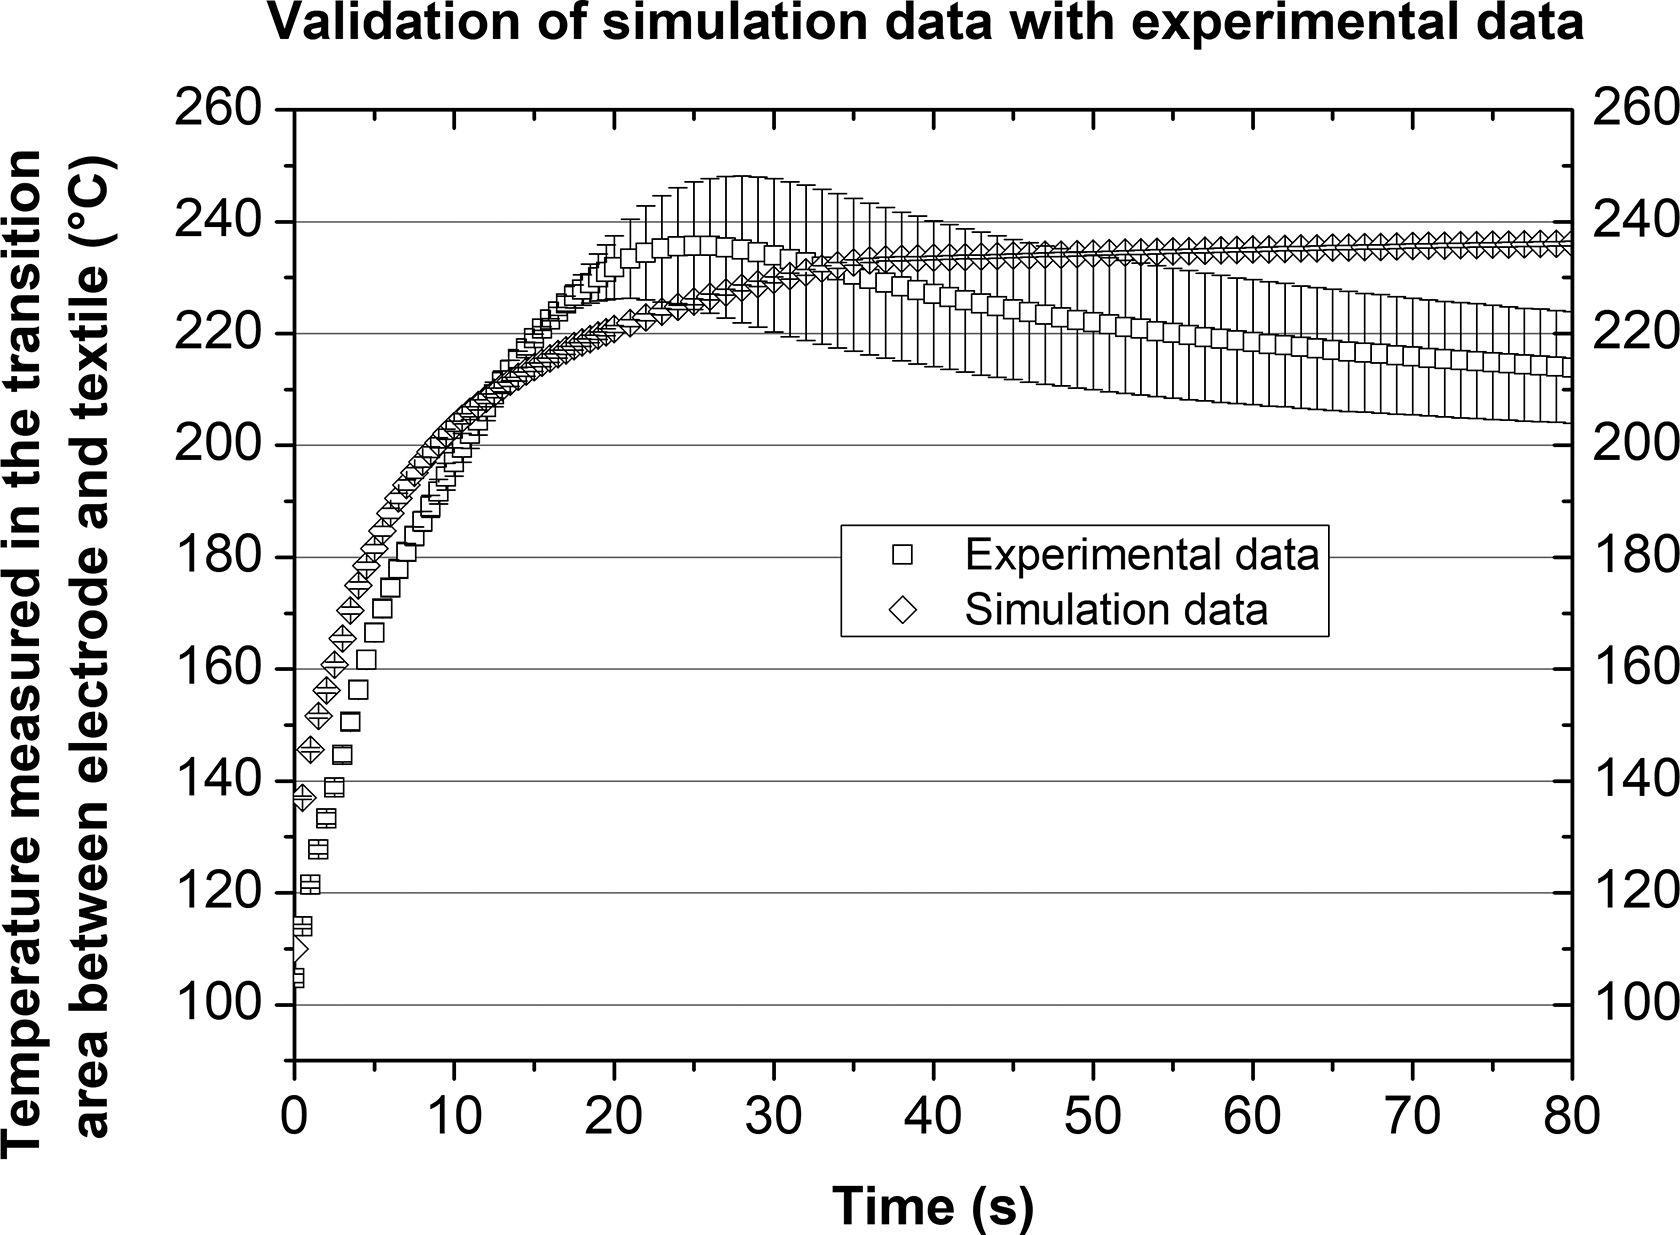
Simulated and experimental characteristic of temperature over time.
To validate the calculated temperature development over time, temperature curves were recorded based on the selected settings for three samples each. The temperature curves are in good agreement for the first 10 s, apart from minor deviations. However, after 10 s, simulation data show a slow convergence to the asymptotic solution close to 240 °C, whereas experimental data further increase to an inflection point at approximately 240 °C and 25 s. These different behaviors can be explained by the simplifications applied, that is, by neglecting changes by movement due to volume change or shrinkage of thermoplastic fibers. It can be assumed that close to the melting point of the polyamide, different effects occur, which are similar to the well-known lofting behavior of pre-impregnated thermoplastic carbon fiber sheets at the melting point. These effects tend to increase the resistivity for a short time, thus leading to a higher temperature development. The behavior after 40 s reveals another difference between simulated and experimental data: in reality, cooling through the 110 °C oil flow has a larger influence on the temperature development at that stage. It can be concluded that the deviations displayed in Figure 11 between simulation and experimental data can be explained in good approximation.
Furthermore, it should be noted that the contact resistivity of the textile is included in ρ = ρ (Τ). To further evaluate the influence of the contact resistivity and gain detailed knowledge on the heating mechanism, it should be investigated individually.
Nevertheless, the results obtained from the simulation model enable a basic understanding of the process.
Conclusion
In this work, a hybrid yarn textile consisting of two types of fibers (polyamide 6 and recycled carbon) was characterized in terms of the changing electrical resistivity of the material during Joule heating, which originated from a current flow in the transverse direction through a compressed woven textile. A new method based on CT scan analysis and image-based finite element simulation was applied to understand the material behavior. Furthermore, different physical influences affecting resistivity in dependence on temperature, the degree of compaction, and the value of current were determined. It can be stated that up to a specific temperature, the textile resistivity, including temperature and current dependency, has a major influence on the process so that subsequently, the contact resistance dominates the behavior. A simulation model based on the determined electrical resistivity over temperature is in good agreement with experimental values. The developed process for the impregnation and consolidation of dry hybrid yarn textiles in a one-step process as previously described in Reese et al. 11 can now be modeled reliably. This is another crucial step toward using thermoplastic carbon fiber-based hybrid yarn textiles in series productions, thus reducing process times and energy consumption.
Footnotes
Authors’ note
The authors are responsible for the content of the publication.
Funding
The author(s) disclosed receipt of the following financial support for the research, authorship, and/or publication of this article: This research and development project is funded by the Federal Ministry of Education and Research (BMBF) under the concept “Innovations for the Production, Service and Work of Tomorrow” with funding from the Energy and Climate Fund (support code 02P14Z020–02P14Z030), managed by the Project Management Karlsruhe (PTKA).