
Abstract
This study explores the preparation and mechanical behavior of free-standing polymer-dispersed liquid crystal (PDLC) film membranes. Polyurethane (PU) was used as a thermoplastic polymer matrix to form these free-standing film membranes. Cholesteryl oleyl carbonate (COC) and cholesteryl pelargonate were used as liquid crystals (LCs) with different molecular weights. PDLC membranes were produced by casting method after LCs and polymer were mixed in the tetrahydrofuran solvent at room temperature. These membranes were formed at different concentration ratios of polymer and LCs. The relationship among the phase separation, LCs and polymer contents as well as the LCs molecular weights was investigated. The morphological structures of these membranes were studied using scanning electron microscopy (SEM). SEM images exhibited that the shapes of LC droplets embedded in PU matrix were more uniform and smaller than those of the membranes which include LC with lower molecular weight. The mechanical properties of the PDLC membranes were determined by carrying out the tensile tests. It was found that the membranes which include COC LC were more flexible.
Introduction
Liquid crystals (LCs) are functional materials which have a wide application range from the electro-optical displays to sensor and membrane technologies 1 taking the advantage of the arrangements of their molecular orientations as a function of the temperature, electric, or magnetic field effects. 2 –4 LCs have also been attracted more interest in membrane and biological applications with the understanding of the present of many biological systems such as DNA, cell membranes, proteins, cholesterols. 5 –8 Moreover, liquid crystalline materials may be a new candidate of membranes due to their ordered arrangement and soft elasticity behavior. 9 The LC-containing membranes were produced as transport membranes. 10 –13 Several studies showed that the LC membranes gained higher stability when the higher viscosity of cholesteric LC was blended with cellulose derivatives. 10,11,14 –16 Another study focused on the effect of the polymer molecular weight on membrane structure using the poly (ethylene-co-vinyl alcohol) (EVAL). 17,18 The results exhibited that low-molecular-weight EVAL had small open pores and large number of pores, whereas high-molecular-weight EVAL produced closed pores and low number of pores. Moreover, LCs with cholesterol side-functionalized group behave as a cross-linking point form to produce non-covalent network inside the polymer matrix of the membrane structure. 19 Polymeric membranes were also formed via nonsolvent-induced phase separation process and the microdroplets including LC were produced inside the polymer wall. The aggregation of some of the hard and soft segments of the polymer results in a separation of these phases. 20 In this case, polyurethanes (PUs) may be a good candidate as a polymer composed of alternating soft polyether segments and hard urethane segments consisting aromatic groups. However, researchers have been studying the polymer dispersion and membrane technology using different kind of materials. 21 –23
Our study is about the preparation of free-standing polymer-dispersed liquid crystal (PDLC) film membranes. PDLC films were produced by casting method after LCs of cholesteryl oleyl carbonate (COC) and cholesteryl pelargonate (CP) and polymer of PU were mixed in the tetrahydrofuran (THF) solvent at room temperature. Although there are many studies on the PDLC systems in the literature which are mostly about electro-optical behaviors of these systems in terms of the display technology, 24 –27 there are limited studies on the mechanical behaviors of these systems. 28
In this work, a series of PU LC composite membranes with two different cholesteric LCs, namely COC and CP, were prepared at six different concentration ratios. The textures and morphologies of the phase-separated structures of the PU/LC composite membranes were characterized via polarized optical microscopy and scanning electron microscopy (SEM), respectively. The relationship among polymer LC concentration and the morphological structures as well as their mechanical properties was discussed. The importance of this work is in proving that the LC-polymer composite membranes are favorable for improving the mechanical properties of the membrane, especially for the biomedical materials.
Experimental section
LC was embedded in the polymer matrix to form a polymer/LC composite film membrane. Commercially available PU which contains 35 wt% hard segment and 65 wt% soft segment (Sigma-Aldrich) was used as the polymer compound of the composite film. Two kinds of cholesteric LCs, namely COC (Sigma-Aldrich) and CP (Sigma-Aldrich), were used to prepare the mixtures. The chemical structures of all these components are shown in Figure 1. The preparation method of these membranes requires a solvent for dissolving polymers and mixing with LCs.
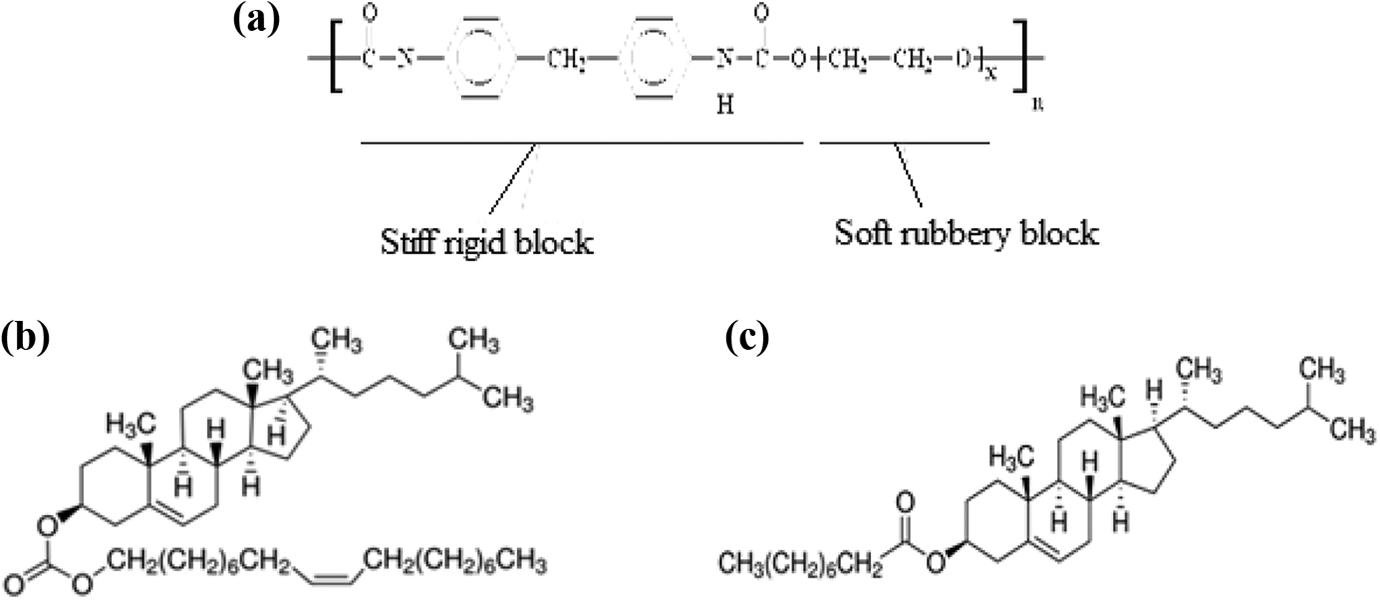
Chemical structures of (a) PU, (b) COC, and (c) CP.
The components of different samples with the different weight ratios of the PU/LC, where the LC referred to COC or CP, are shown in Table 1.
The compositions of composite membranes.
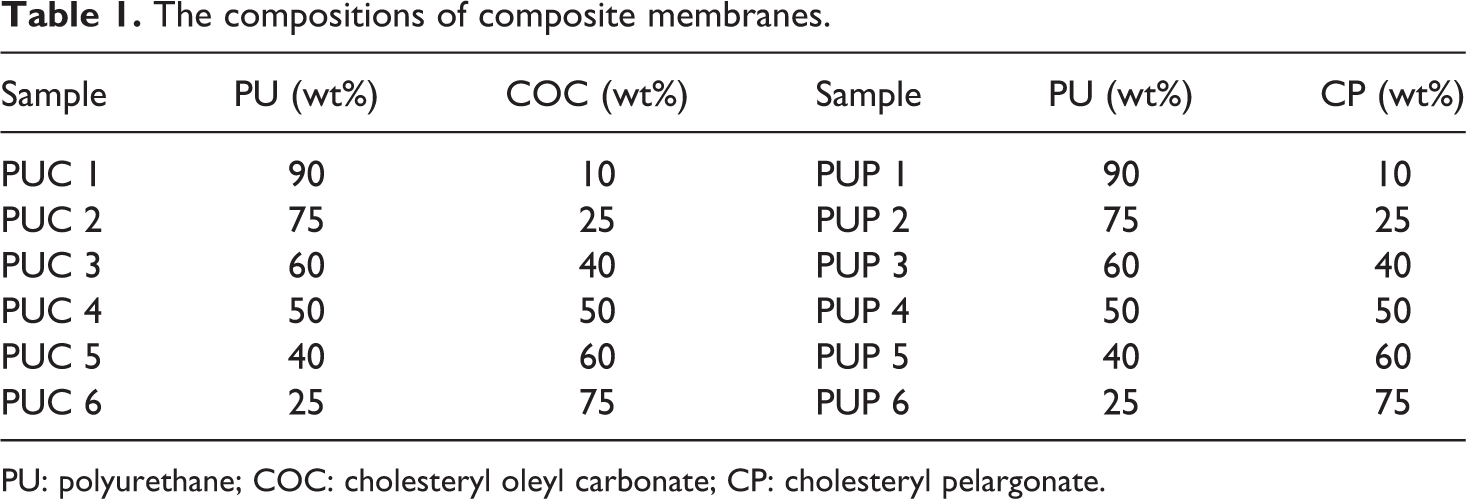
PU: polyurethane; COC: cholesteryl oleyl carbonate; CP: cholesteryl pelargonate.
To form a uniform solution by mixing LCs with polymer matrix, THF was used as a solvent. The clear and homogenous solution was formed with the mixing of these materials into 10 mL (THF) by stirring in a beaker for 2 h at room temperature. Subsequently, these solutions were cast on clean glass substrates and they were left under atmospheric pressure for 72 h at room temperature to evaporate the solvent. After the solvent evaporation, the LC/polymer mixtures remained in a single phase. The composite membranes were placed under polarizing optical microscope (Nikon Cipol) equipped with polarizers crossed at 90° and the observation of the textures of these composite membranes was carried out at room temperature. The surface topographies of the PU/LC composite membranes as well as shape and the density size of polymer networks were determined using a SEM (JEOL 6000) with an accelerated voltage of 20 kV. The composite membranes which formed in a beaker were treated with the mixture of dichloromethane and hexane at a volume ratio of 20% and 80%, respectively, for 24 h at room temperature to extract LC from these membranes. After the LCs were removed from these membranes, they were sputtered with a gold layer via a sputter coater (DII-29030SCTR, JEOL smart coater) before SEM observation. In addition to morphological studies, PU/LC composite membranes which contain different polymer content were exposed to the mechanical tests to understand the mechanical characteristics of these membranes. All the PU/LC composite membranes were resized to a dimension of 1 cm in width, 10 cm in length, and 0.02 cm for the measurement of their tensile properties. A universal material testing machine (Shimadzu 5 kN) was used to determine the tensile tests at a crosshead speed of 5 mm/min by using ASTM D882 test method (Figure 2).
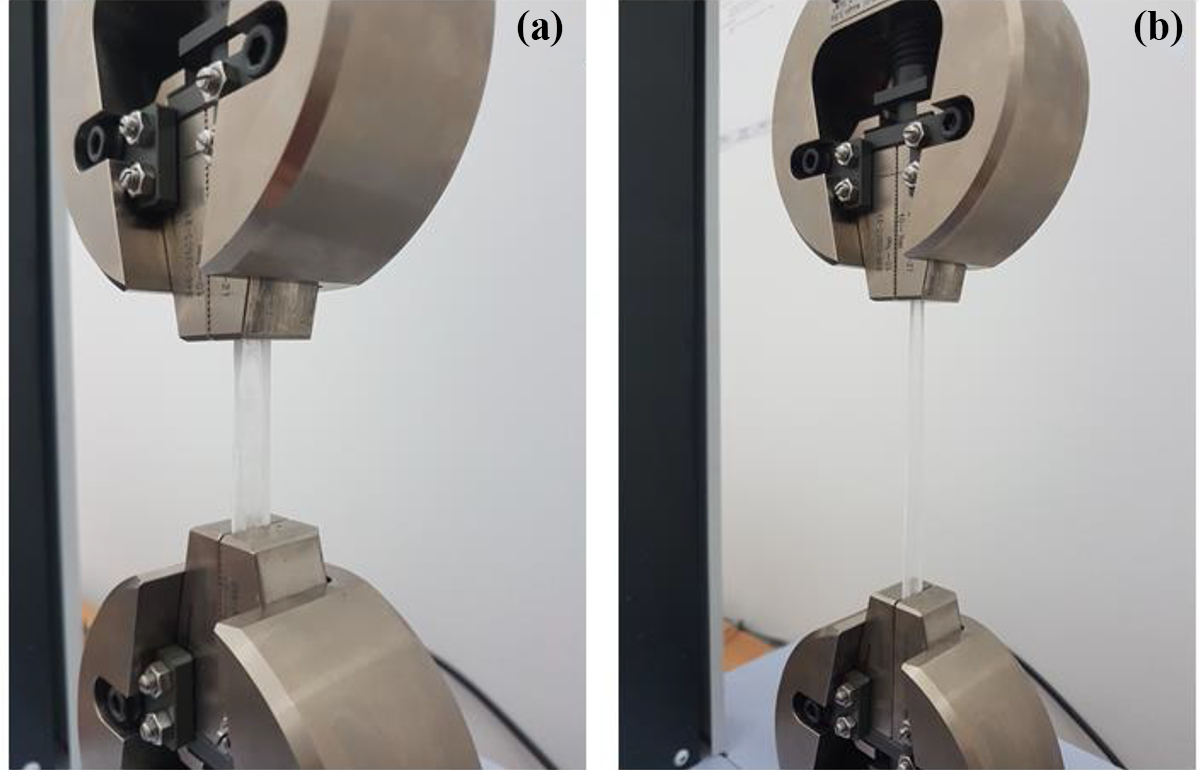
Application of tensile test: (a) before tensile test and (b) during tensile test.
Results and discussions
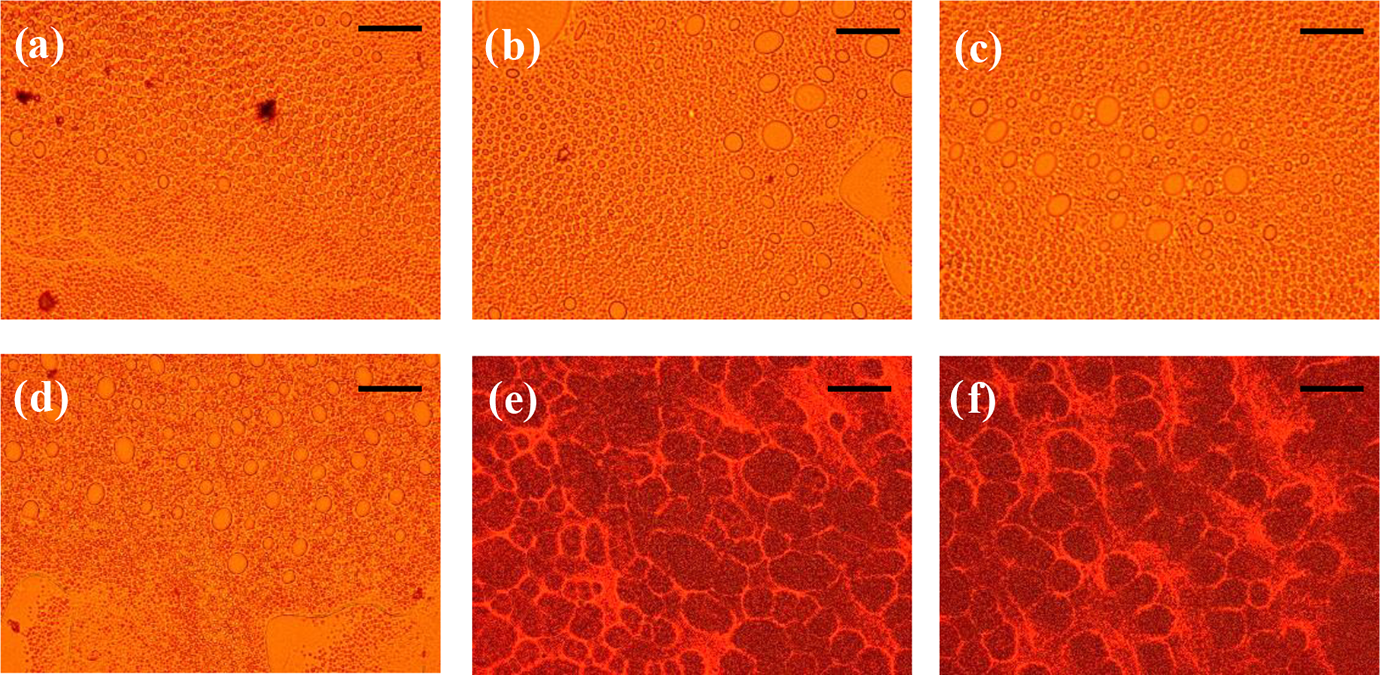
The formation of membranes using PU and two different LCs of COC and CP was checked using polarizing optical microscope; the textures of these membranes are shown in Figures 3 and 4, respectively. The LC droplets were produced in discrete coagulates inside the PU polymer matrix. Characteristic textures of the polymer-LC droplets were determined using a polarizing microscope. It clearly showed that LCs were encapsulated in the polymer matrix forming droplets.
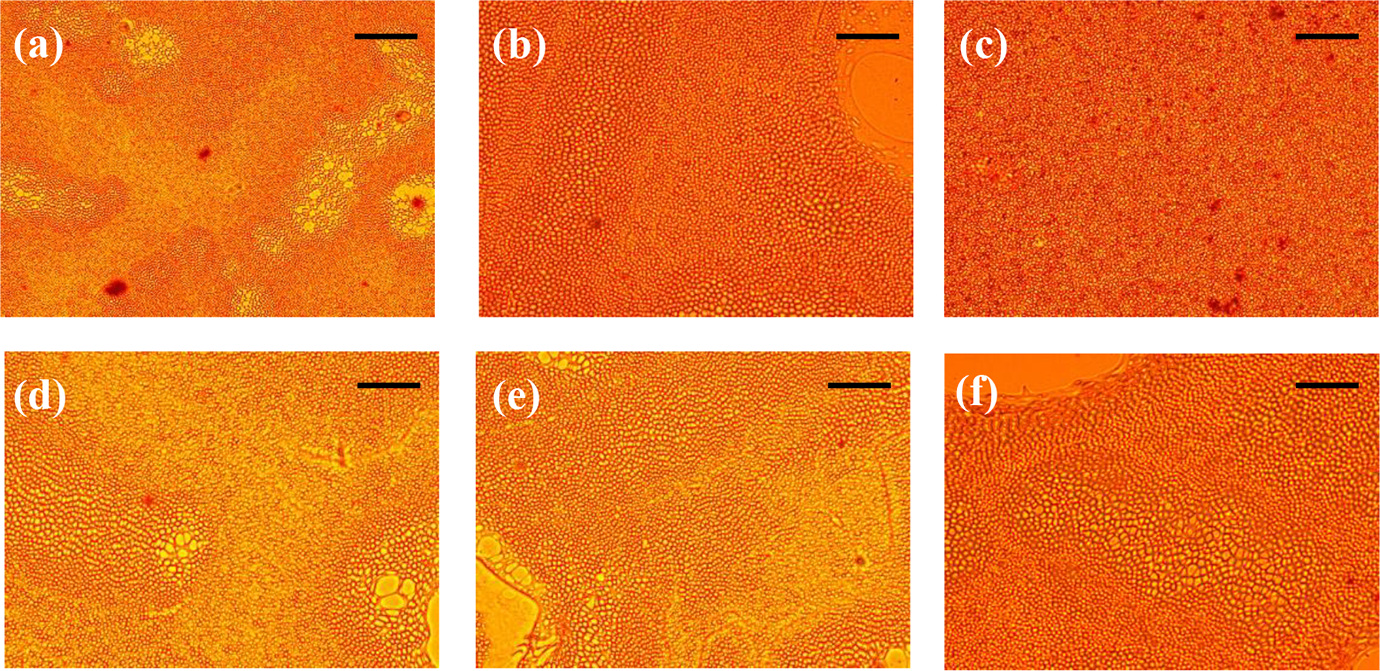
POM images of (a) PUC 1, (b) PUC 2, (c) PUC 3, (d) PUC 4, (e) PUC 5, and (f) PUC 6. The scale bar is 20 µm.
POM images of (a) PUP 1, (b) PUP 2, (c) PUP 3, (d) PUP 4, (e) PUP 5, and (f) PUP 6. The scale bar is 20 µm.
Figure 3 shows that there is a high droplet density in PUC membrane samples with uniform droplet sizes. Droplets were smaller at higher polymer concentration. It was observed that the droplets size became bigger when COC LC was replaced with CP LC, and the droplets were not uniform as much as in PUC samples.
The force–displacement curves were reported for each sample and these reported values obtained as averages of three samples. Figure 5(a) shows the force–displacement diagrams of the samples PUC 1 and PUP 1 and it was observed that PUC 1 was 15% longer than PUP 1 and the failure load of PUC 1 sample was 45% higher than PUP 1. When PU concentration was reduced to 75% by weight in the samples, Figure 5(b) was obtained for PUC 2 and PUP 2 samples. This curve showed that the mechanical properties of PUC 2 sample were better than PUP 2. The displacement of the PUC 2 sample was 23% higher and the failure load value was 50% higher than those of PUP 2.
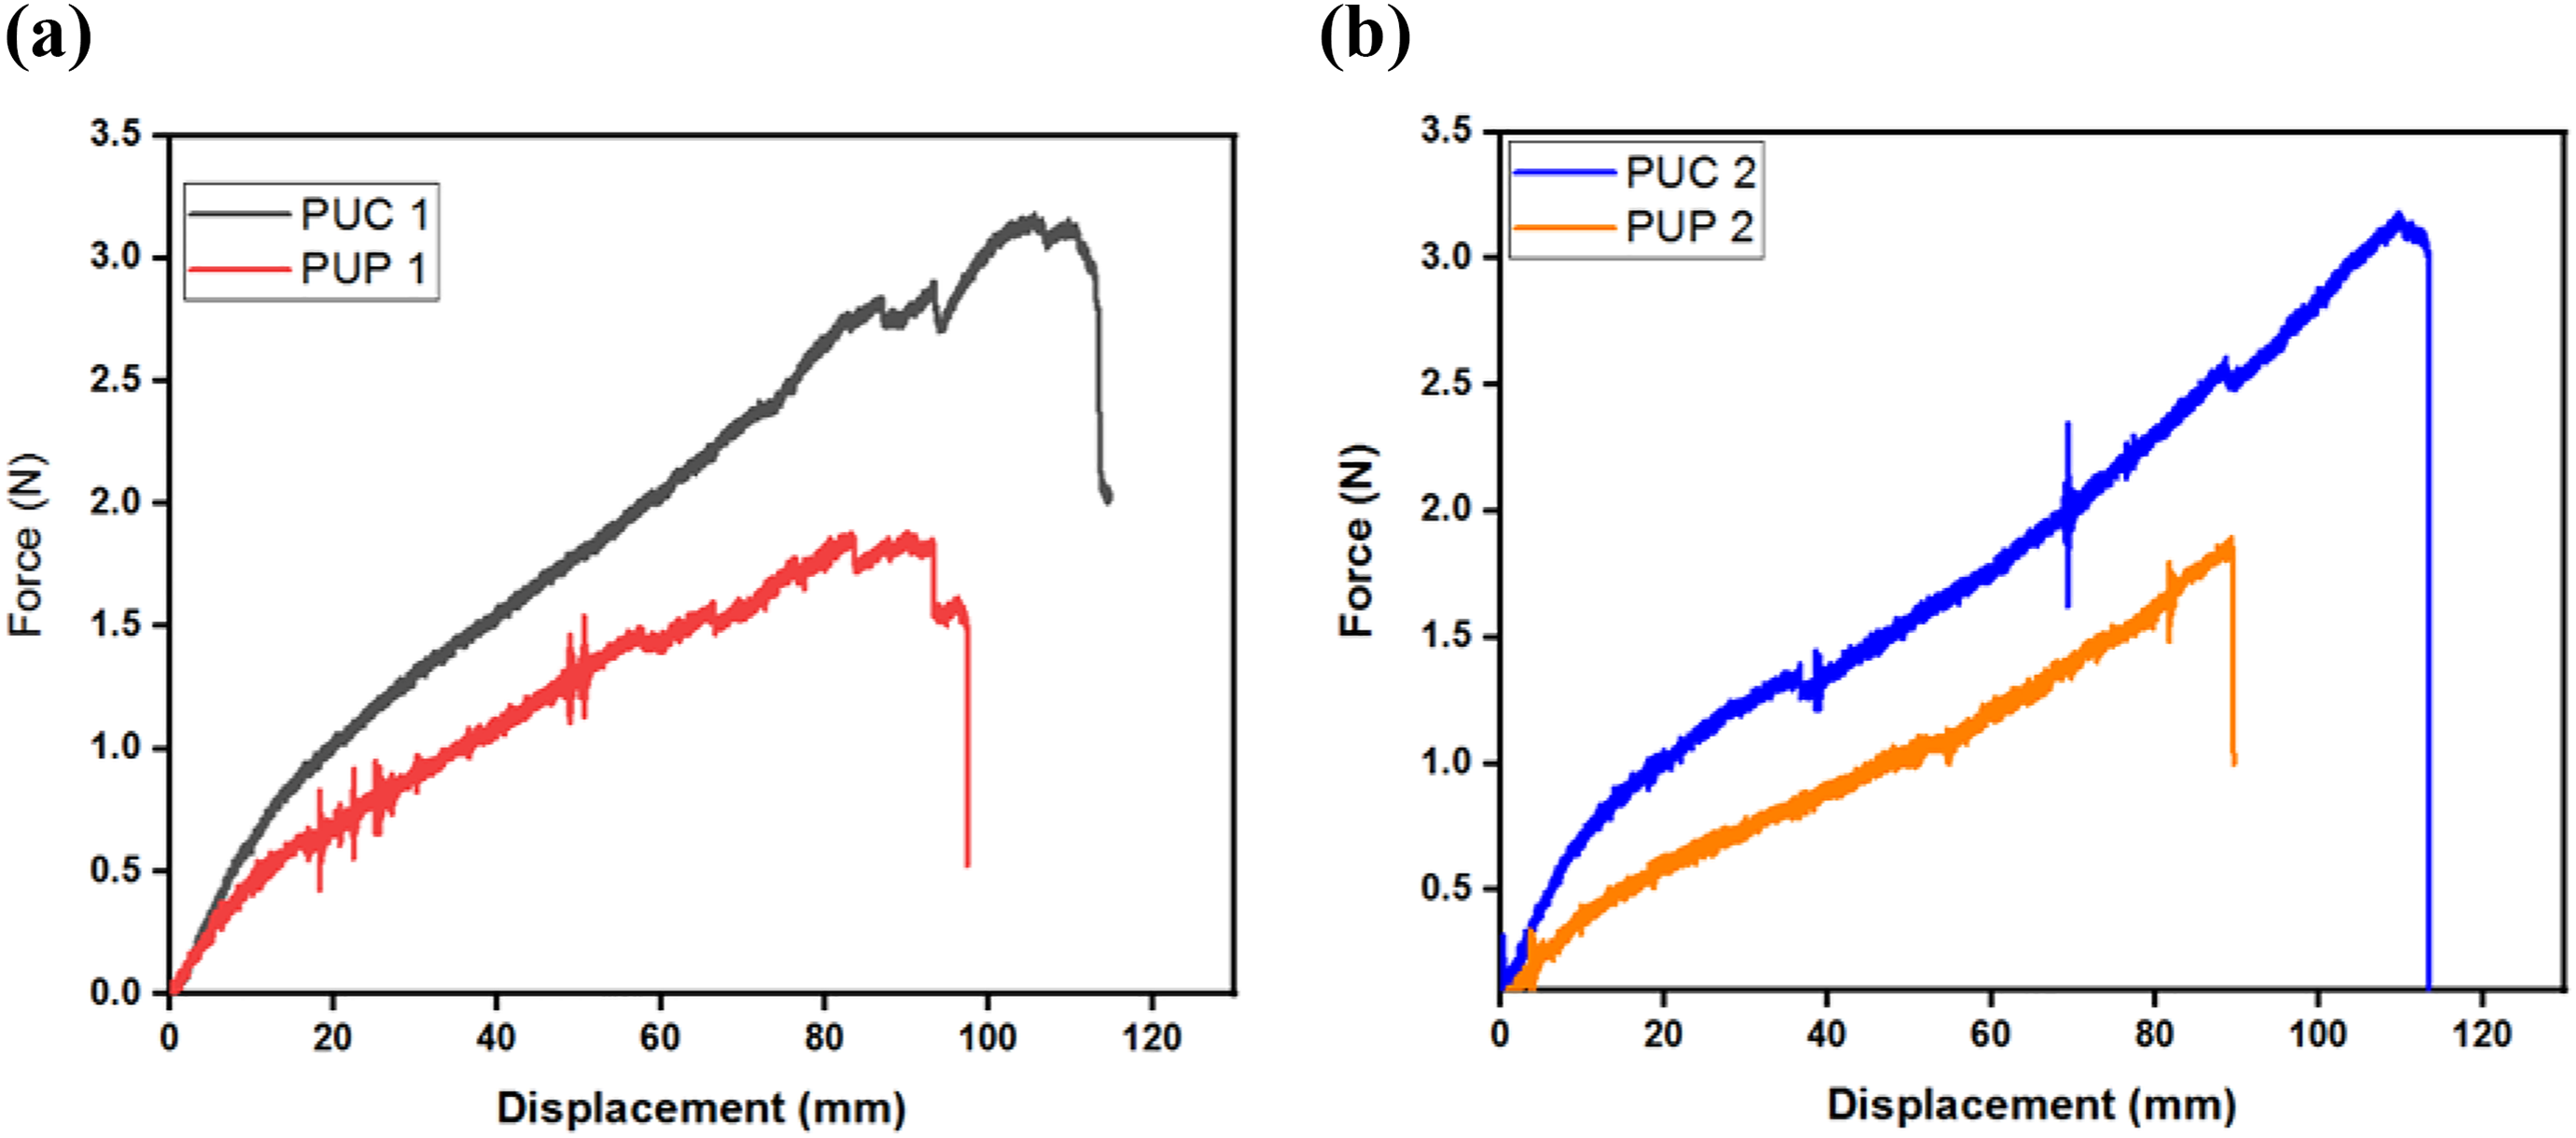
The force–displacement curves of (a) PUC 1 and PUP 1 and (b) PUC 2 and PUP 2.
In the case of the reduction of PU concentration in the samples up to 40% by weight, the displacement values of samples PUC 3 and PUP 3 were quite different from each other, as shown in Figure 6(a) and (b). The failure load of PUC 3 was 9% higher than that of PUP 3, whereas the displacement of PUC 3 reduced by 50% when compared to that of PUP 3, as shown in Figure 6(a). Moreover, PUP 3 showed the maximum displacement value in all samples. Figure 6(b) shows the force–displacement diagram where the concentration ratios by weight of PU and LC samples are the same. The failure load of the PUC 4 sample was 30% higher than that of PUP 4, whereas its displacement is 30% less than that of PUP 4. It is seen that the displacements of PUP samples were better if the weight ratio of LC in the composite membranes was about 40–50%.
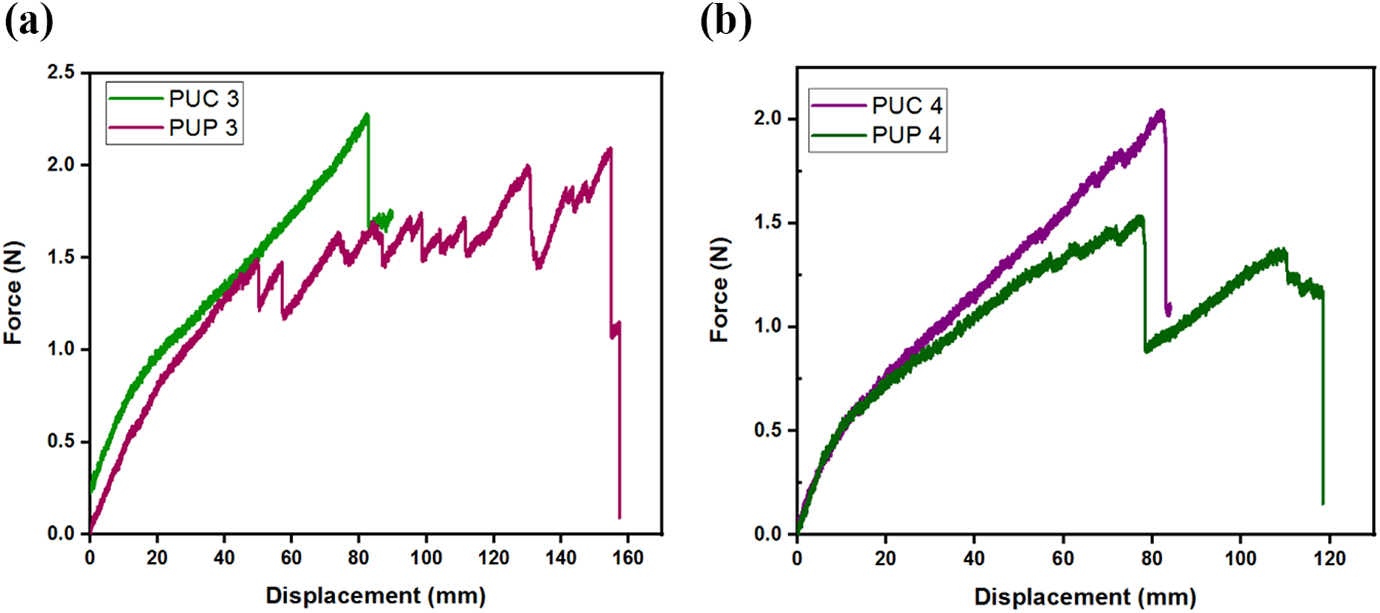
The force–displacement curves of (a) PUC 3 and PUP 3 and (b) PUC 4 and PUP 4.
As shown in Figure 6(a) and (b), the presence of a sharper fluctuations structure in the diagrams of the PUP samples indicates that the failure loads in the PUP samples were greater when compared with the failure loads of the PUC samples. This was an indication that PUP samples were better elongated.
Figure 7(a) shows the force–displacement diagrams of the samples in which the weight ratio of PU in the composite membranes is 40%. The displacement of PUC 5 sample was 24% less than the displacement of PUP 5, although the failure load of PUC 5 sample was 15% greater than the failure load of PUP 5. Figure 7(b) shows the force–displacement diagrams of the samples when PU concentration in composite membranes was reduced to 60%, and it was seen that the failure and displacement values of both samples were close to each other. Force and displacement values were very low compared to the values in Figures 5 and 6.
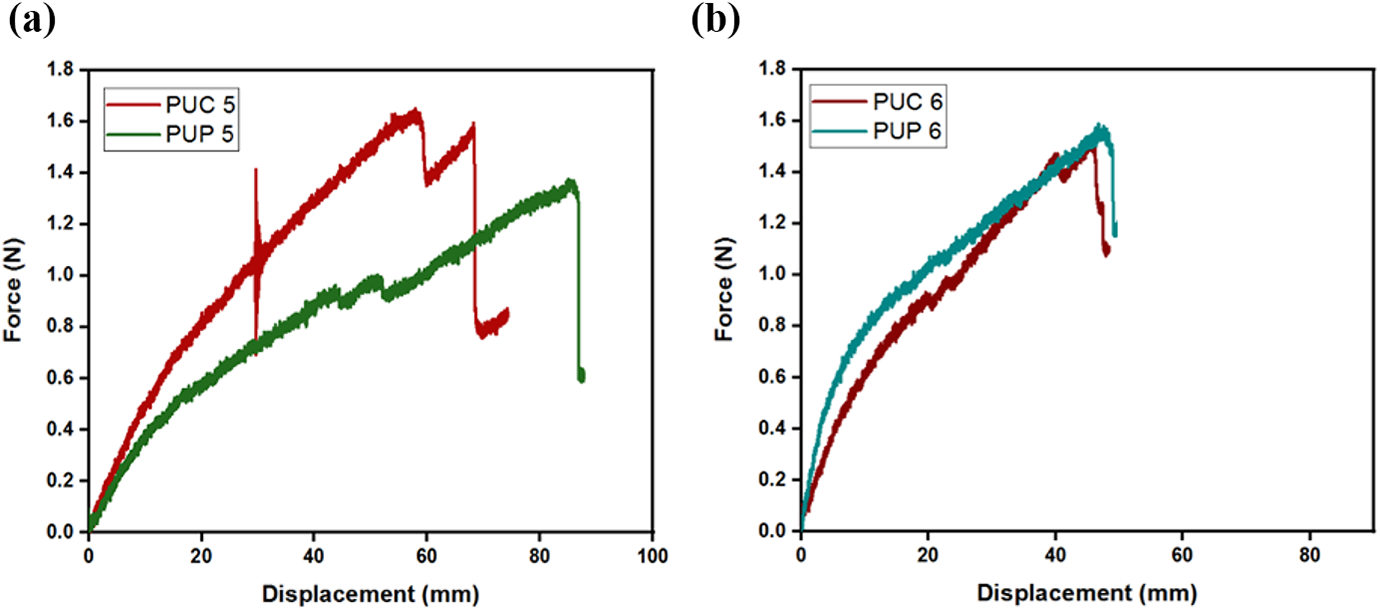
The force–displacement curves of (a) PUC 5 and PUP 5 and (b) PUC 6 and PUP 6.
The comparison of the force–displacement diagrams of the composite membranes which include COC and CP LCs is shown in Figure 8(a) and (b), respectively. As shown in Figure 8(a), the failure load and displacement values decreased with increasing weight ratio of COC LC in composite membranes. Similarly, Figure 8(b) shows that the failure load and displacement values gradually decreased with the increment in the weight ratio of CP LC in the composite membranes.
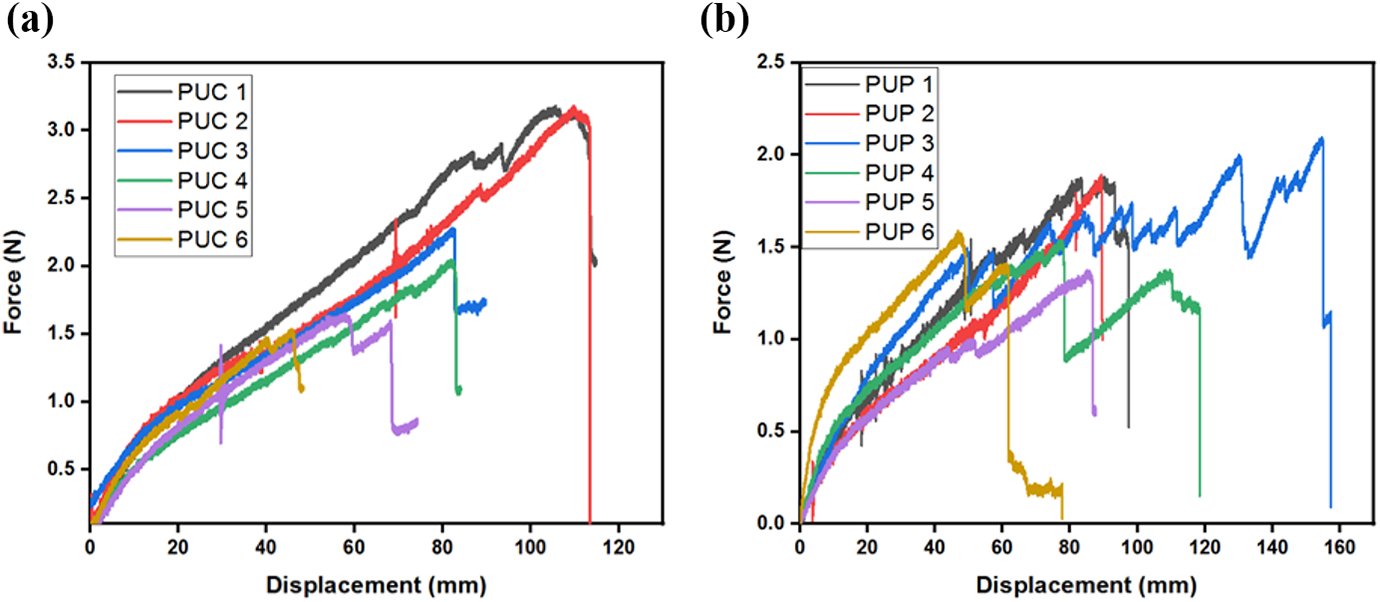
The force–displacement curves of (a) PUC samples and (b) PUP samples.
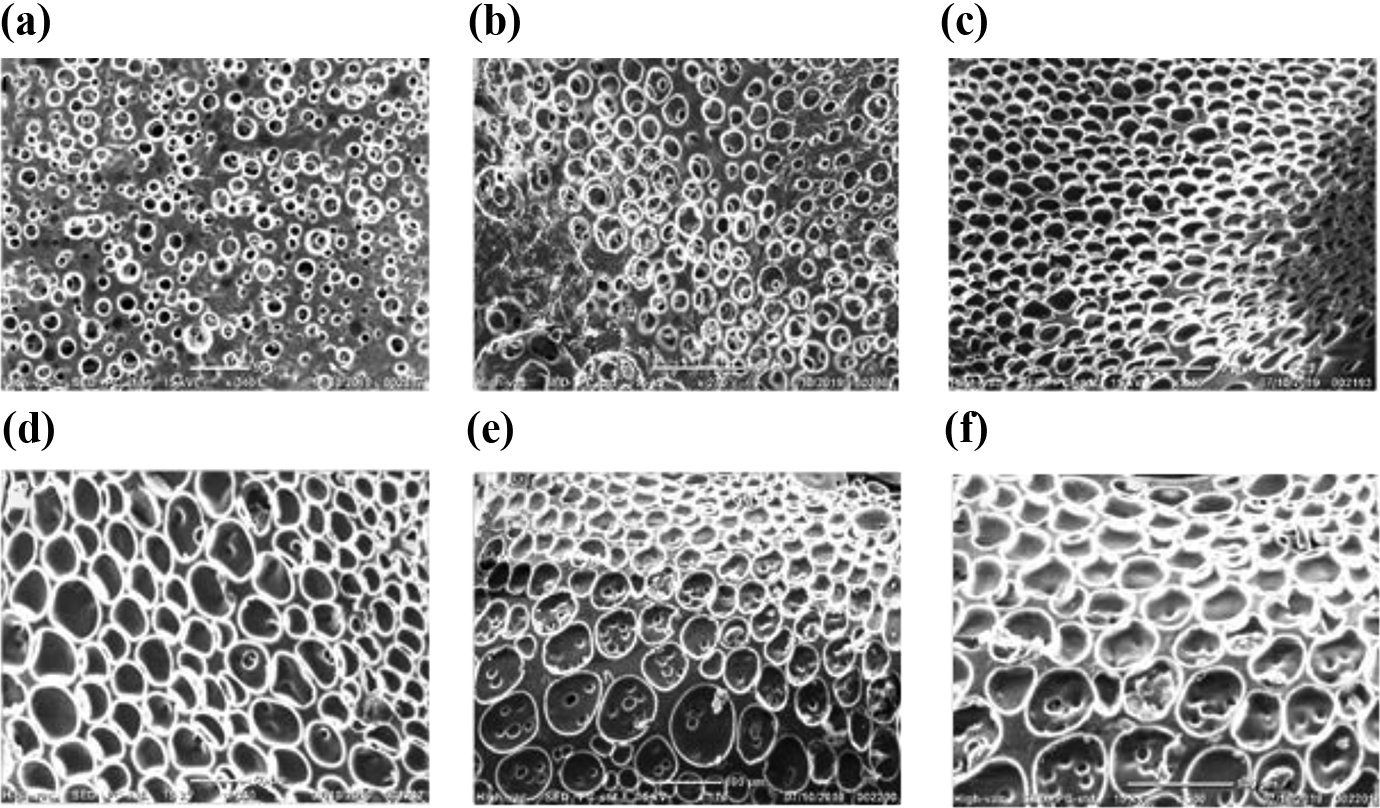
Surface topographies of all the membrane samples were characterized using SEM at 20 kV. In order to remove the LCs from the PU/LC membranes, they were left in the mixture of dichloromethane and hexane at the concentrations of 20% and 80% by volume, respectively, at room temperature for 24 h in a sealed beaker. Polymer membranes were carefully removed from the beaker and were sputtered with a thin layer of gold. All the SEM images were acquired at a normal angle. Figures 9 and 10 reveal the polymer morphologies of PUC and PUP composite membranes, respectively. The SEM images showed that CP and COC LC phases dispersed uniformly in the polymer matrix of these two composite membranes. The morphological observations of PUC and PUP membranes are presented in Figures 9 and 10, respectively. The SEM images proved that the less LC concentration leads the less LC in the composite membranes. As shown in Figure 9(a) to (c), LC droplets grew bigger in the sample PUC 3 when compared with the sample PUC 1, as a result of increasing CP LC concentration from 10 wt% to 40 wt%. However, the LC droplet sizes were almost the same size for samples PUC 4 and PUC 5 which include the LC concentration of 50 wt% and 60 wt%, respectively (Figure 9(d) and (e)). When LC concentration was increased up to 75 wt%, the LC droplets size grew more and became denser in the sample PUC 6, as shown in Figure 9(f). This figure exhibits that the phase separation in the composite membranes correlates with the LC concentration. Besides, the size and distribution of droplets were uniform.
SEM micrographs of (a) PUC 1, (b) PUC 2, (c) PUC 3, (d) PUC 4, (e) PUC 5, and (f) PUC 6 membranes.
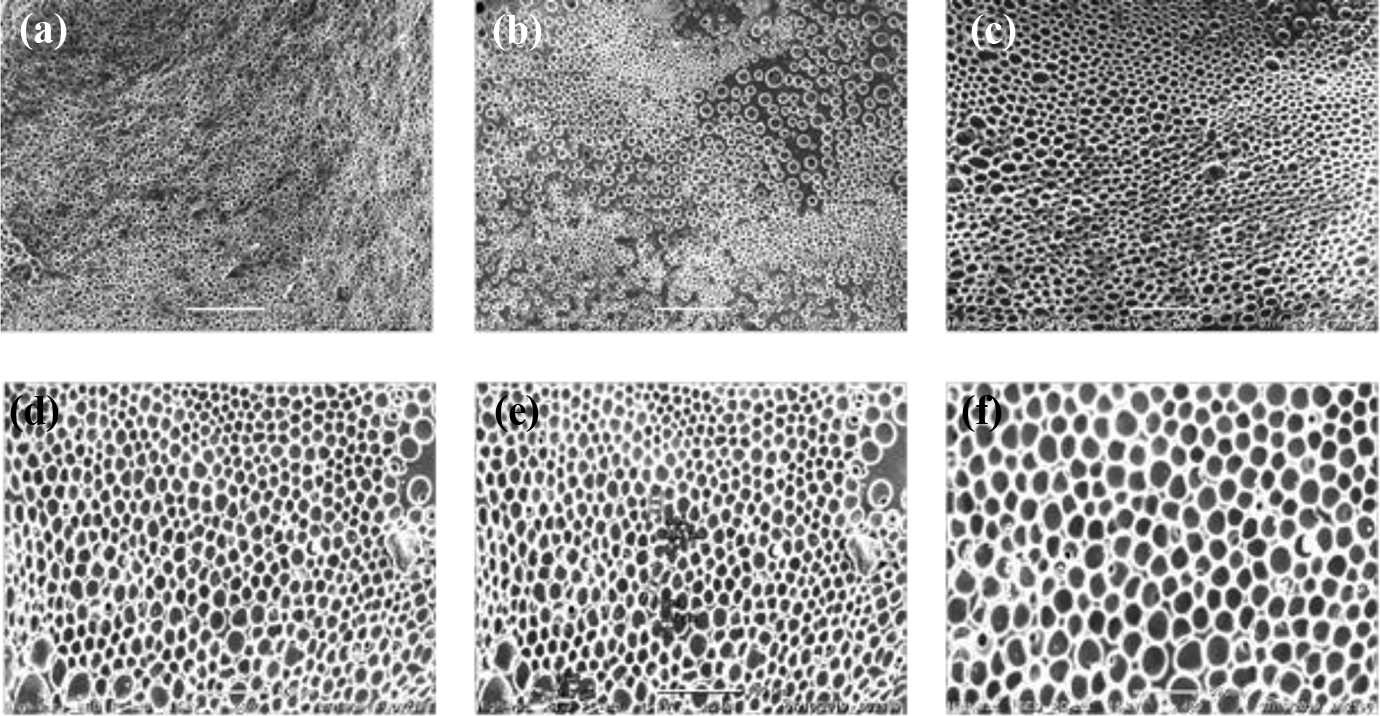
SEM micrographs of (a) PUP 1, (b) PUP 2, (c) PUP 3, (d) PUP 4, (e) PUP 5, and (f) PUP 6 membranes.
Similarly, the phase separation in the composite membranes correlates with LC concentration which was included by PUP membrane samples. Figure 10 showed that the size and density of LC droplets increased gradually with increasing LC concentration. When the LC concentration was increased more than 50 wt%, the LC droplets size became gradually bigger and coupled each other to be a continuous phase, as shown in Figure 9(c) to (f). When the membrane samples formed with COC LCs were compared with the samples formed with CP LC, the droplets shapes became bigger, whereas their sizes became less spherical. PUP membranes have more inhomogeneous droplets in terms of the shapes. Since the molecular weight of CP was higher than that of COC, LC droplets formed irregular shape-domains as percolated structures in the matrix polymers during solvent evaporation in PUP samples. The entropy of this system was increased with the increasing molecular weight, therefore, the arrangements of cross-links were raised and decreasing entropy caused an increment in the droplets size fixed in the polymer matrix of PU, as shown in Figure 10(d) to (f). Due to the different length of flexible side-chains, PUP tended to produce larger LC domains, while the PUC formed uniform distribution among the composite membranes.
Conclusion
In conclusion, two different types of LCs with different molecular weights were introduced into PU polymer matrix at different concentrations in the range from 10% to 75%. The PDLC membranes were formed by casting method. The results showed that the concentration and the chain length of LC play an important role on the droplet sizes of LC droplets in the polymer matrix of membranes. It was observed that LC droplets size grew bigger with the decreasing polymer concentrations. The LC droplets size and distribution as well as textures and arrangements of these LC domains in the polymer matrix of membranes changed due to the different length of flexible length chains of the LCs. Additionally, the tensile tests demonstrated that the failure load and displacement values decreased with increasing weight ratio of both COC and CP LCs. The mechanical properties of PUC membranes were quite better than that of PUP membranes, especially for the samples with higher polymer concentration. Moreover, morphological observations showed that CP and COC LC phases dispersed uniformly in the polymer matrix of these composite membranes. These observations proved that there was a correlation between the phase separation in the membrane and the LC concentration.