
Abstract
This study builds upon prior research investigating the effects of gearbox oil on filament wound carbon fiber reinforced polymer (CFRP) materials. Here, short carbon fiber composite material was examined, motivated by the intention to use such materials in vehicle gearboxes. Automotive sector faces pressures to reduce CO2 emissions, therefore car manufacturers explore possibilities to implement CFRP into their gearboxes for parts such as shafts or casings to save weight, and also improve NVH behavior. Also, e-bike manufacturers aim to use polymers with short carbon fibers for making gears in their gearboxes. The important caveat to using these materials in gearboxes is the operating environment which is oil. While numerous studies have explored the influence of water on CFRP mechanical properties, research on the effects of oil remains scarce. Our experiment, conducted on 3D printed specimens, revealed predominantly positive effects of 60°C oil on the material’s ultimate tensile strength, with increases ranging from 2 to 10% depending on printing orientation, and on Young’s modulus, which increased by 7% in the longitudinal direction but decreased by 5% in the transversal direction. Interestingly, there was no significant change in glass transition temperature, and only negligible and inconsistent diffusion behavior was observed.
Introduction
The automotive industry faces challenges on multiple fronts. One of them is reducing CO2 emissions and energy consumption overall. One of the ways to achieve it is through lightweighting. Car manufacturers have already successfully employed composite materials into the vehicle structure 1 with reasonable financial sustainability. 2 A previous project at Czech Technical University dealt with implementing carbon fiber reinforced polymers (CFRP) in a gearbox. 3 This initiative not only yielded weight reductions but also demonstrated noise attenuation, attributed to the inherent properties of CFRP that effectively dampen vibrations.4,5 The perspective of gearbox NVH becomes important especially in electric vehicle where there’s no internal combustion engine (ICE) which was the main source of noise and superimposed every other source. 6 In that case, gearbox is suddenly one of significant components in terms of NVH, and on top of that the electric motor can have multiple times higher speed than ICE, exciting noise of much higher frequencies (gear whining in terms of gearbox) that are more uncomfortable to people’s perception. 7
CFRP have good stiffness-to-weight ratio and higher natural damping than metals which favours them in attempts to reduce weight and noise of gearboxes. But what must be considered is that the operating environment in gearbox is oil. How does the exposure to oil influence mechanical properties of CFRP? Existing literature on this subject is limited, with notable studies showcasing varied outcomes. For instance Amaro et al.
8
exposed glass fiber composite to engine oil and hydraulic brake fluid, revealing a reduction in stiffness and strength following 15-day exposure. The mechanism of failure in this scenario originated from the degradation of the fiber itself. Conversely, Kim et al.
9
experimented with thin (0.2 mm) CFRP specimens exposed to oil at temperature of 150°C for durations up to 24 h. Their observations indicated relatively modest oil uptake (0.45%) and tensile tests revealed the loss of strength. Furthermore, Mahieux et al.
10
documented decrease in T
g
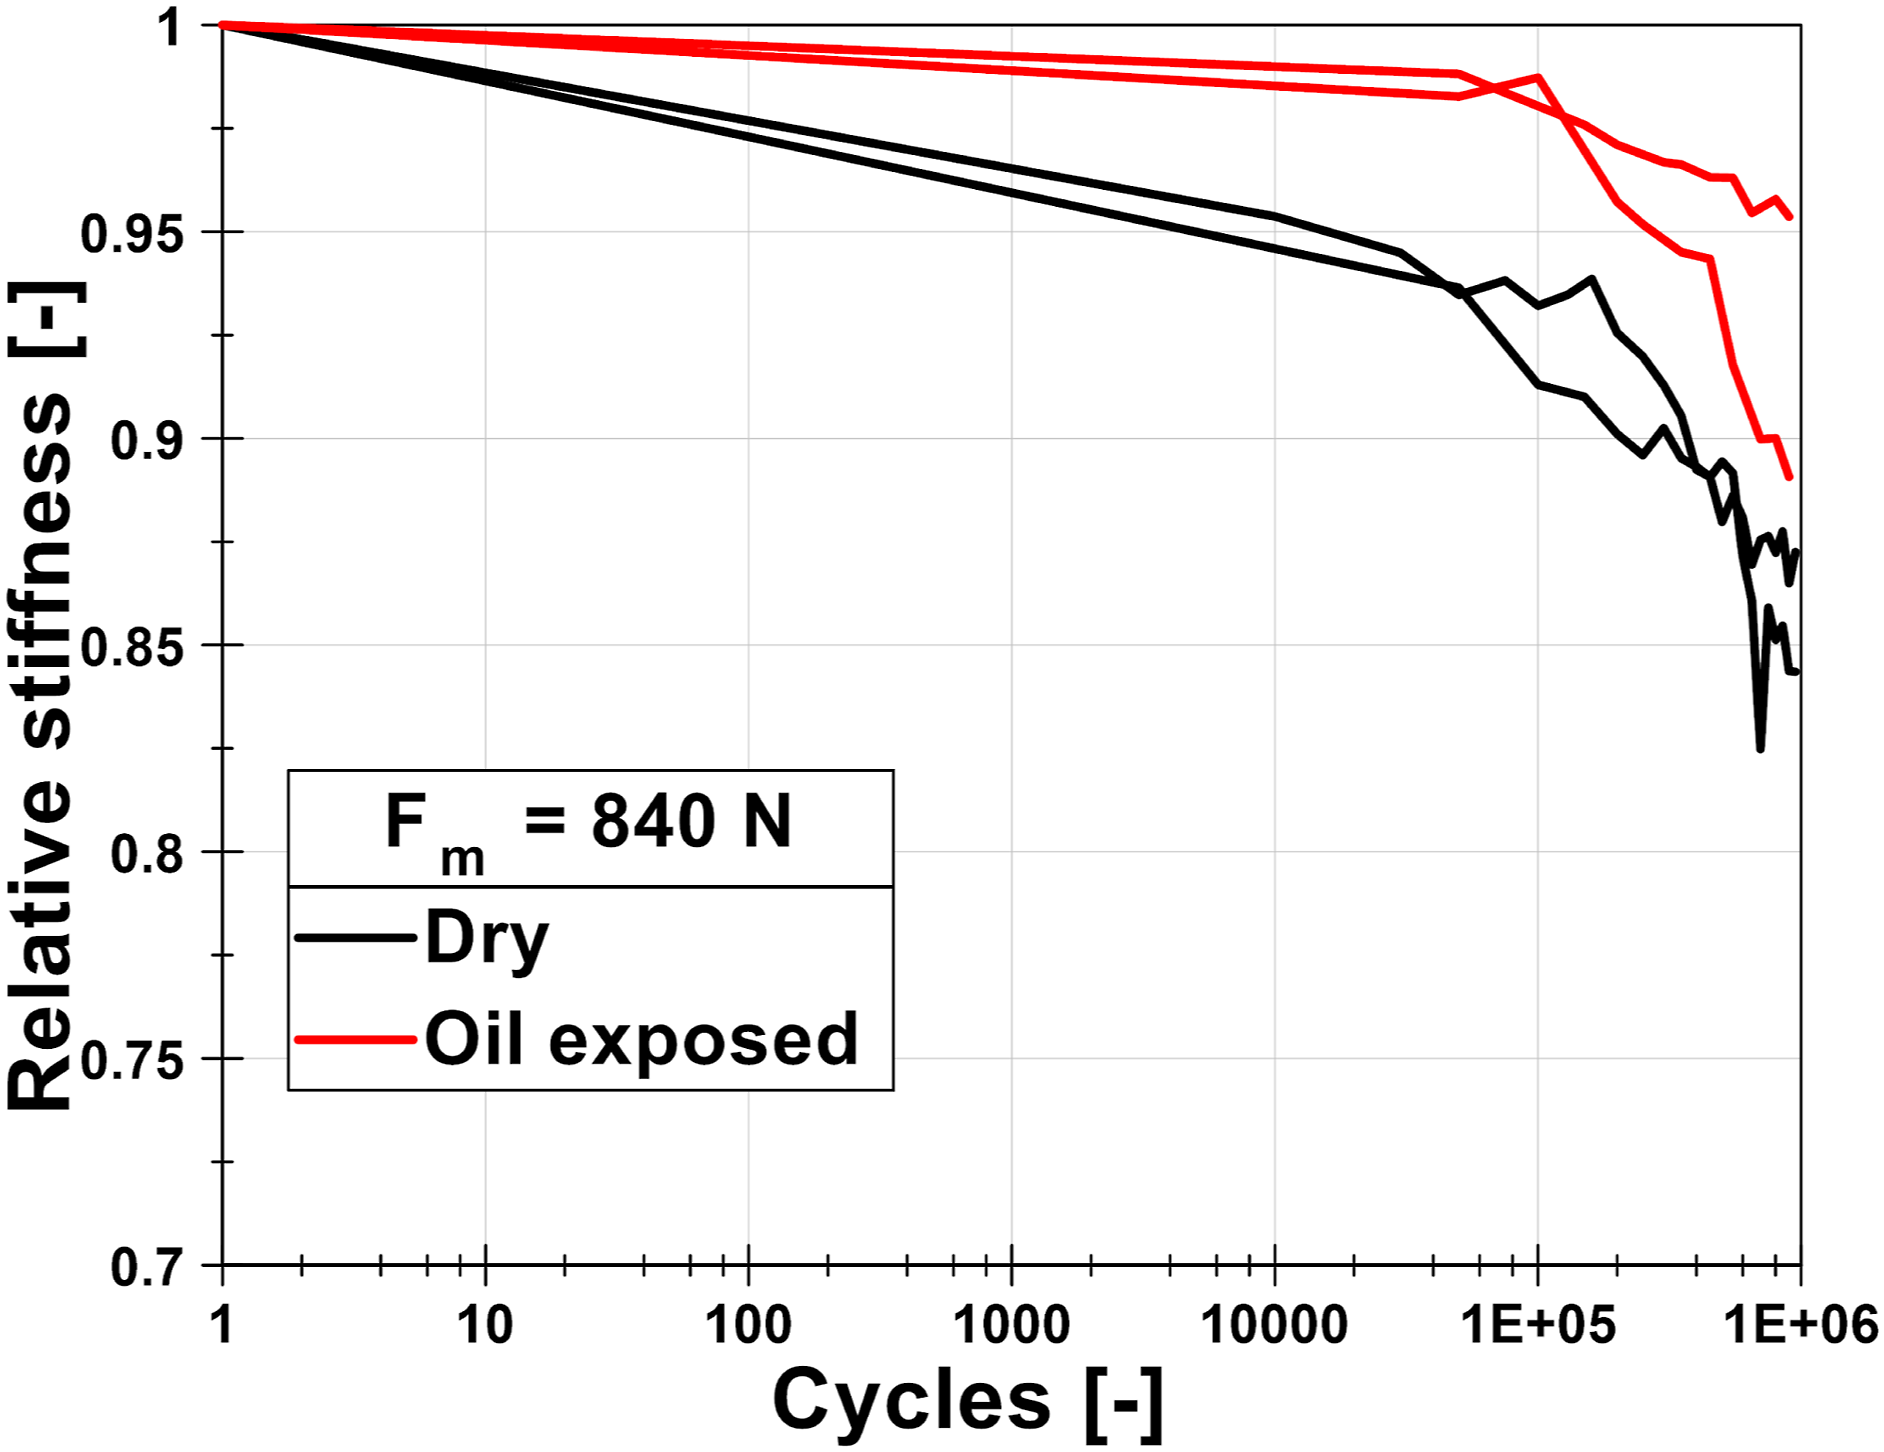
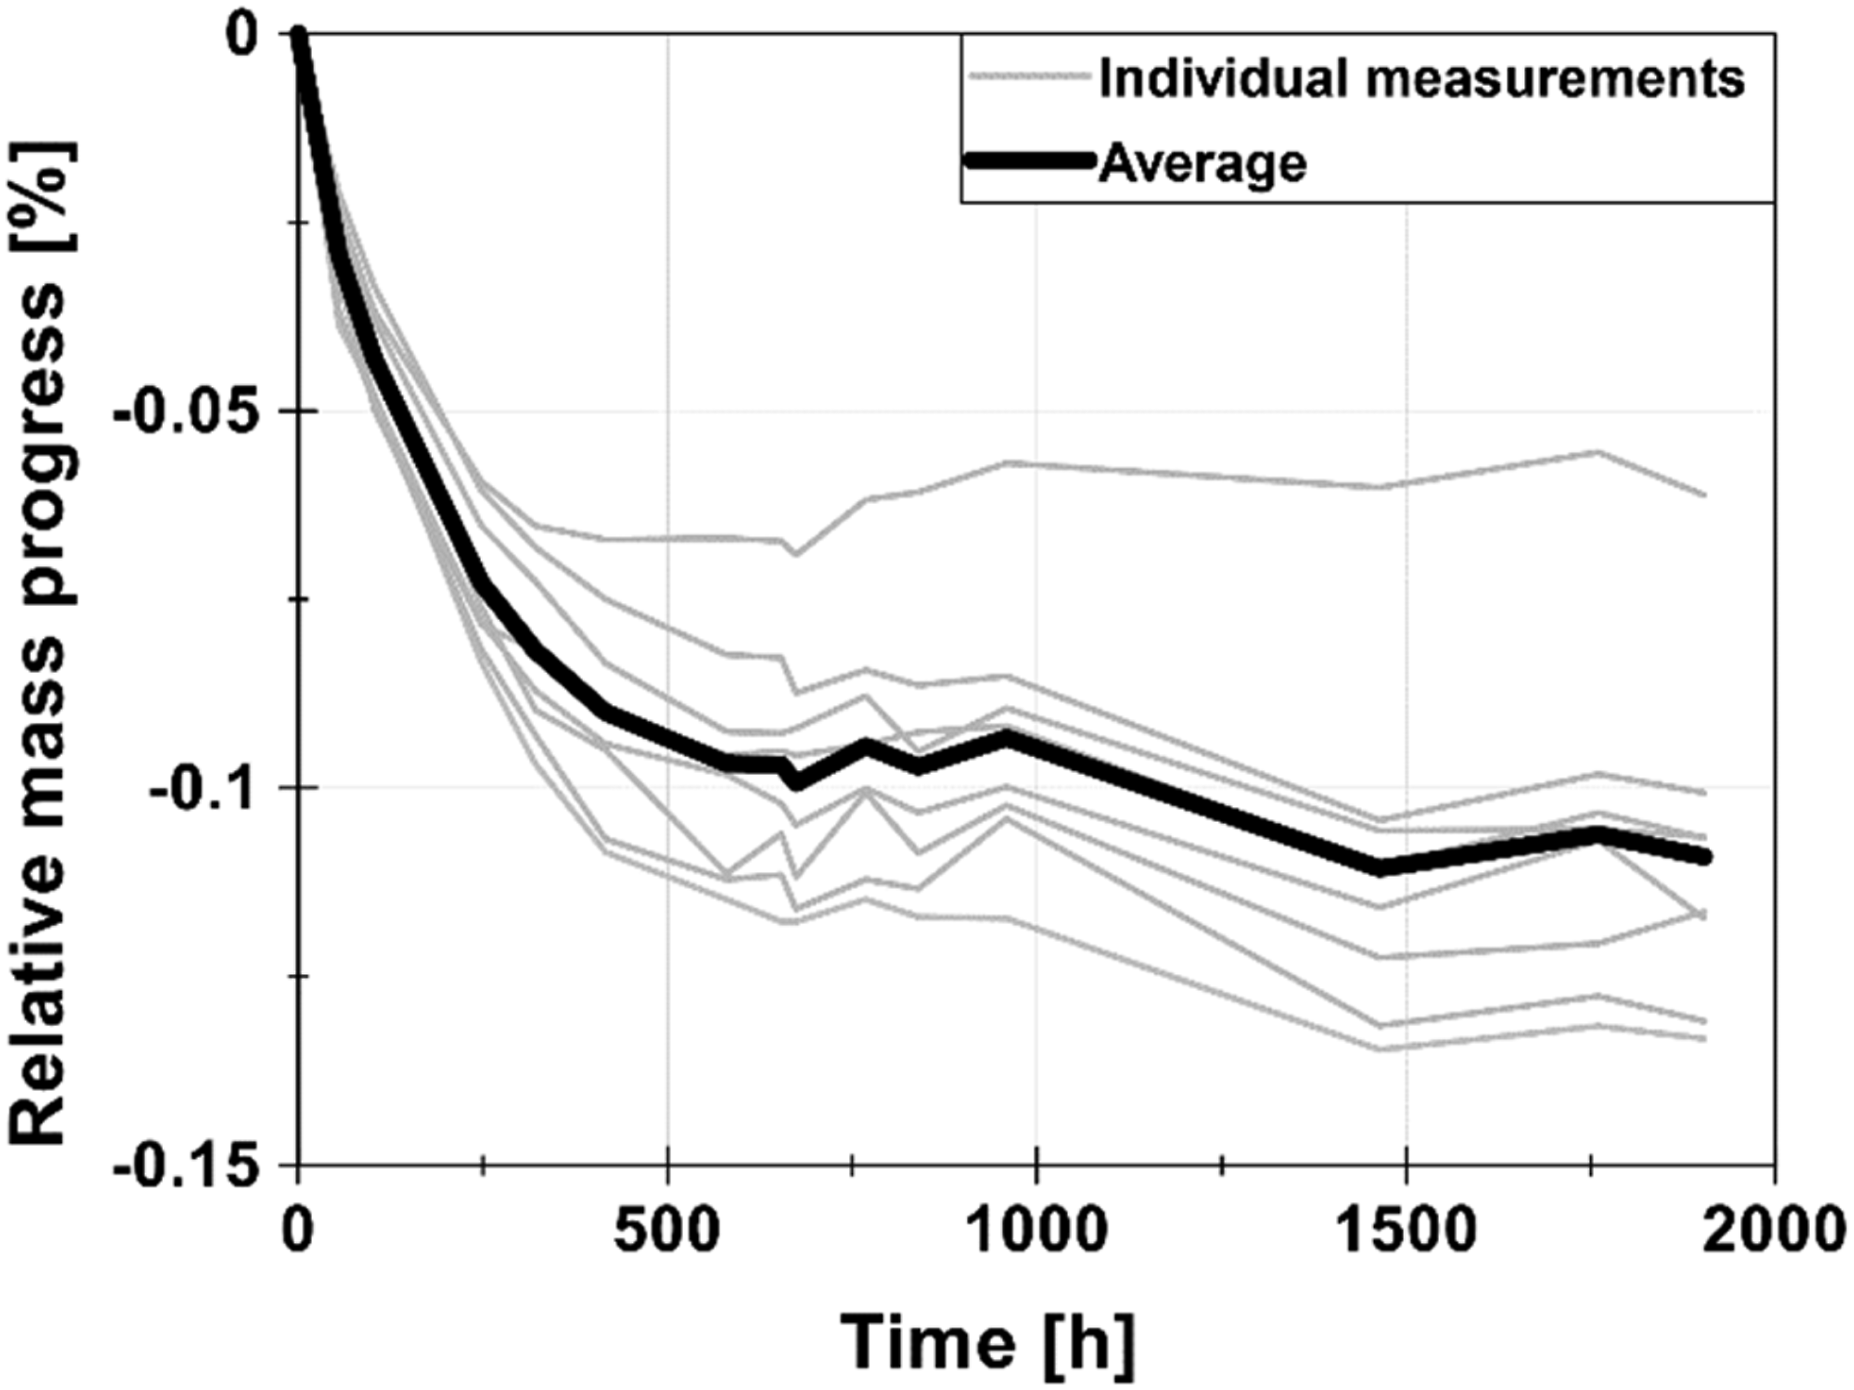
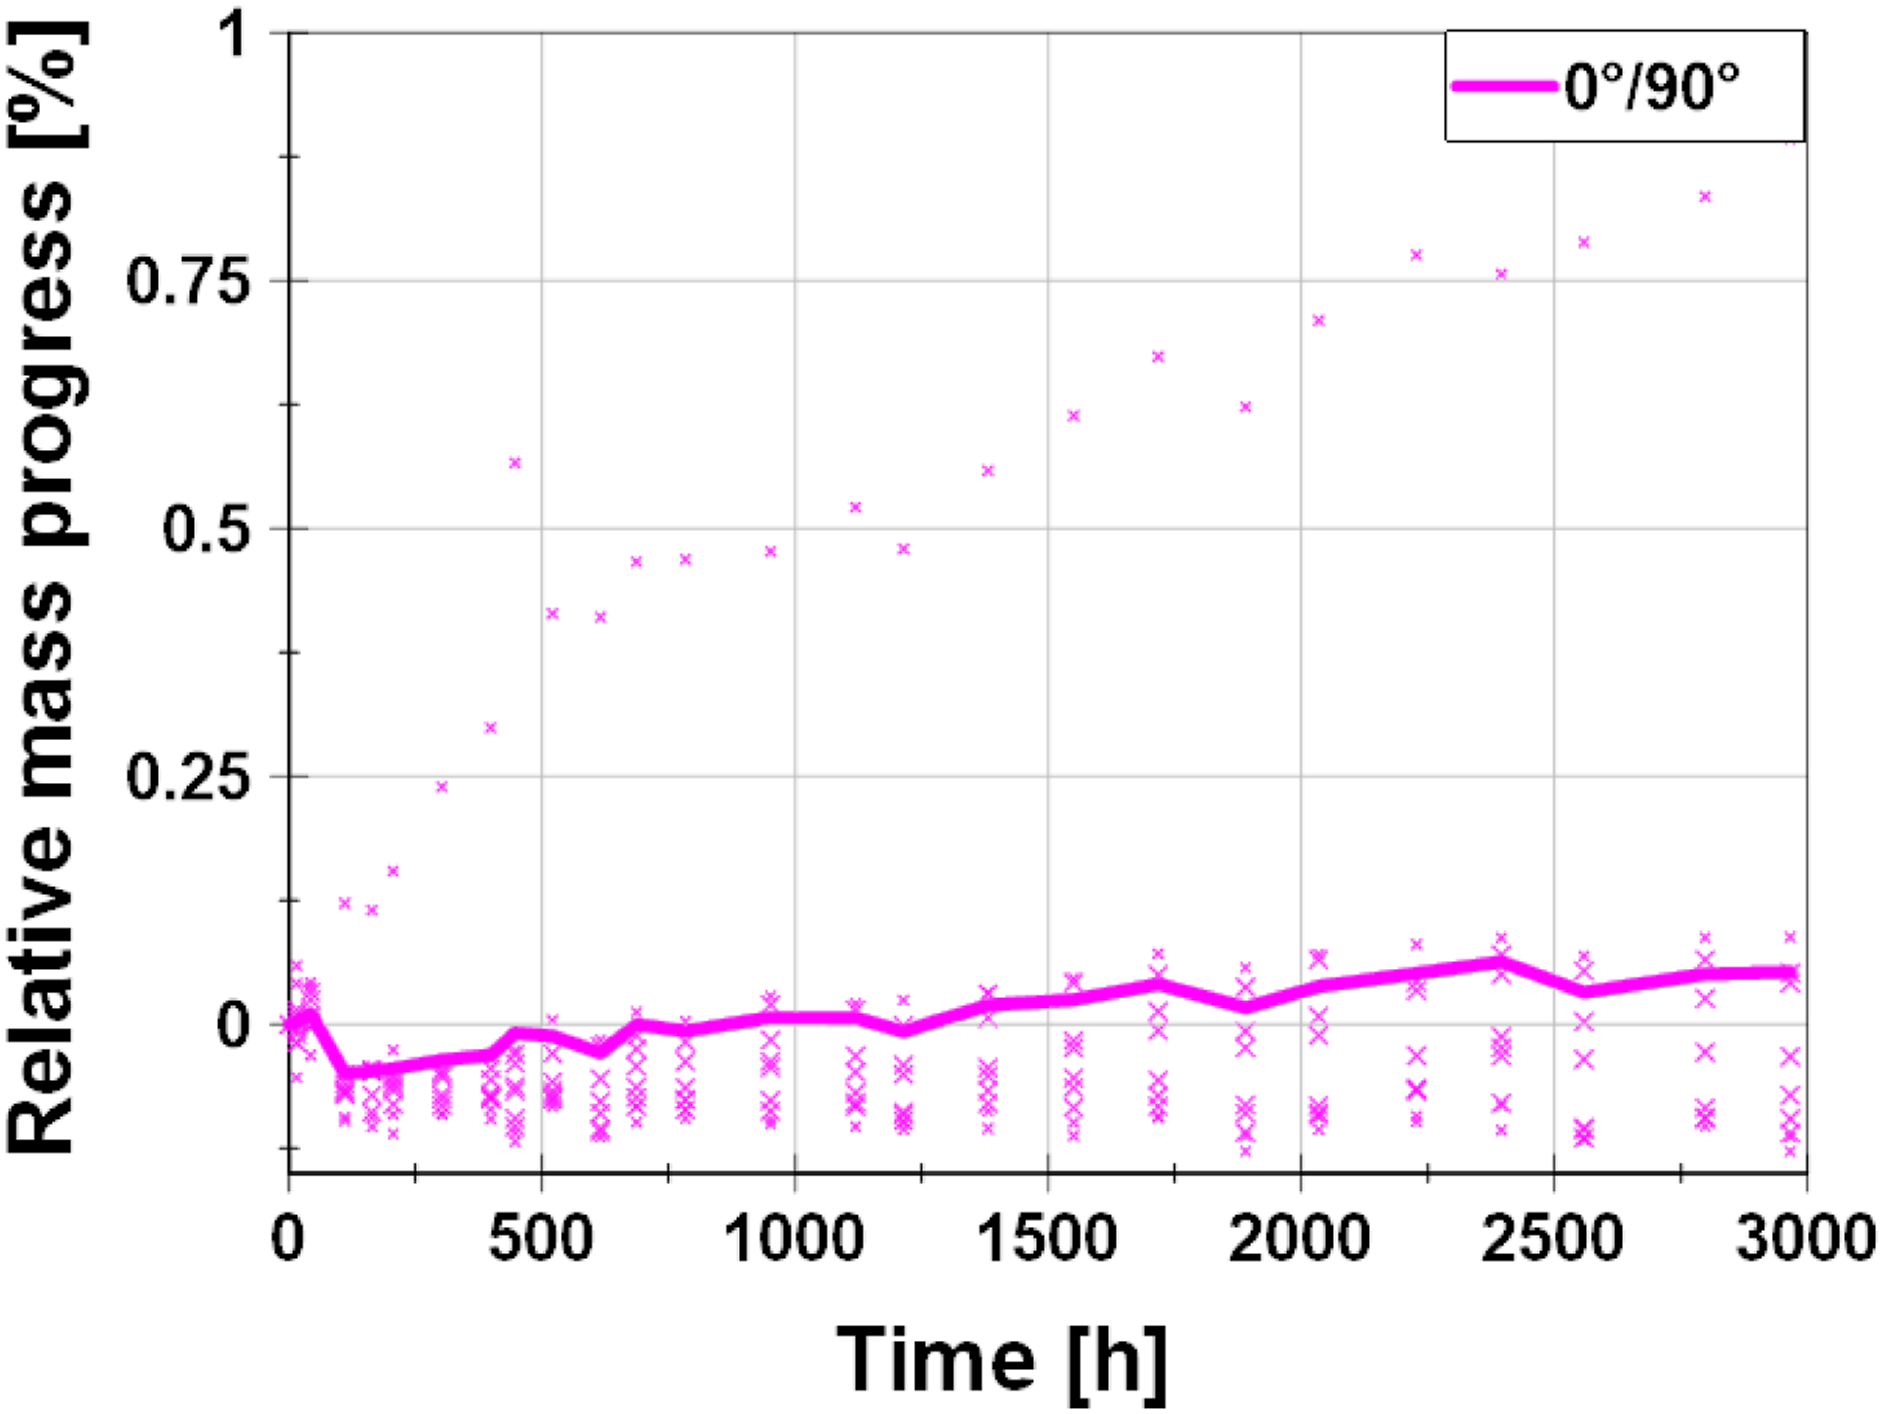
by 30°C following a two-month immersion in oil (independently of the temperature). Another project conducted at Czech Technical University experimented with CFRP tubes manufactured by filament winding exposed to 80° hot gearbox oil. Subsequent tests surprisingly showed improvements in terms of stiffness, strength and fatigue Figure 1 after oil exposure and no diffusion of oil into material. In fact, a minor mass loss was observed (Figure 2).
11
Current paper follows on from that project. Stiffness degradation of CFRP filament wound tubes during cyclic loading.
11
Mass progress of CFRP filament wound tubes during oil exposure.
11
On the other hand, there are effects of various operating environments on CFRP that are thoroughly described in literature including mechanisms of degradation. Photon energy of UV radiation that has roughly the value of the covalent bond energy of the polymer matrix. The energy from UV radiation thus causes a so-called photooxidation reaction, which transforms the molecular structures of the polymer and can even result in local microcracks. 12 Also water can have adverse effects that result from its penetration into material and irreversible chemical reaction called hydrolysis during which water molecules break chemical bonds in material13,14 that in case of CFRP results in damaging the interface between matrix and fiber. Another mechanism of degradation of CFRP is plasticization which is a process in which water molecule react with hydroxyl groups in matrix and form weak hydrogen bonds. This change is reversible upon water desorption.15,16 These changes in microstructure of the material lead to degradation of mechanical properties such as strength and Young’s moduli,17,18 fatigue life,19,20 interlaminar fracture, 21 interfacial shear strength 22 or glass transition temperature,23,24 although not always as shown by 25 The negative effect of water is also applicable to CFRP-steel adhesive joints.26,27
It’s also worth noting that water is absorbed into the material and increases its concentration in time. This absorption can be described by Fick’s law of diffusion,28–30 a differential equation ∂c/∂t = D ∗ ∂2c/∂x2 with the solution in form of exponential with a saturation level. This diffusion is faster in direction of fibers31,32 and is temperature and concentration dependent.33,34
Given the dearth of research on the topic of influence of oil, and because of the results from previous project on filament wound samples that contradicted the other studies and anecdotal evidence from industrial partners that suggested negative influence of oil and other petrol-based products on CFRP, the decision was made to conduct this study. This time, the experiment was performed on short carbon fiber composite material that was manufactured by technology of 3D printing. Such material would be suitable to use as a replacement of steel gears in e-bike gearbox 35 where the demands on strength and temperature resistance aren’t as challenging, while providing sufficient stiffness, lightweighting and good NVH properties at reasonable costs.
Experiment
Specimens
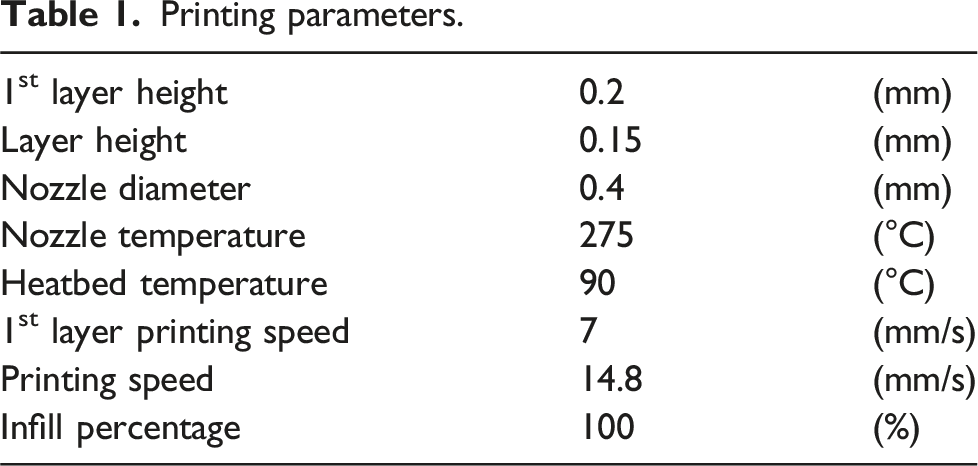
Further investigation on influence of oil on CFRP was conducted on short carbon fiber 3D printed specimens offering a cost-effective approach to experimentation. The selected material for this experiment was PETG-based XT-CF20, a thermoplastic polymer with a declared 20% content of short carbon fiber and a supposed strength of 76 MPa. The experiment consists of two batches of specimens. One batch to be tested after exposure to oil at an elevated temperature 60°C to simulate the operating conditions in gearbox, and second batch to be tested in untreated condition to obtain reference values.
The chosen mechanical test method is static tensile test. The geometry of the test specimen was designed based on ISO 527 standard, although the length was modified so the sensors could fit into the experiment setup. The test specimen including dimensions and orientations of printing is shown
3
in Figure 3. Geometry and orientation of specimens.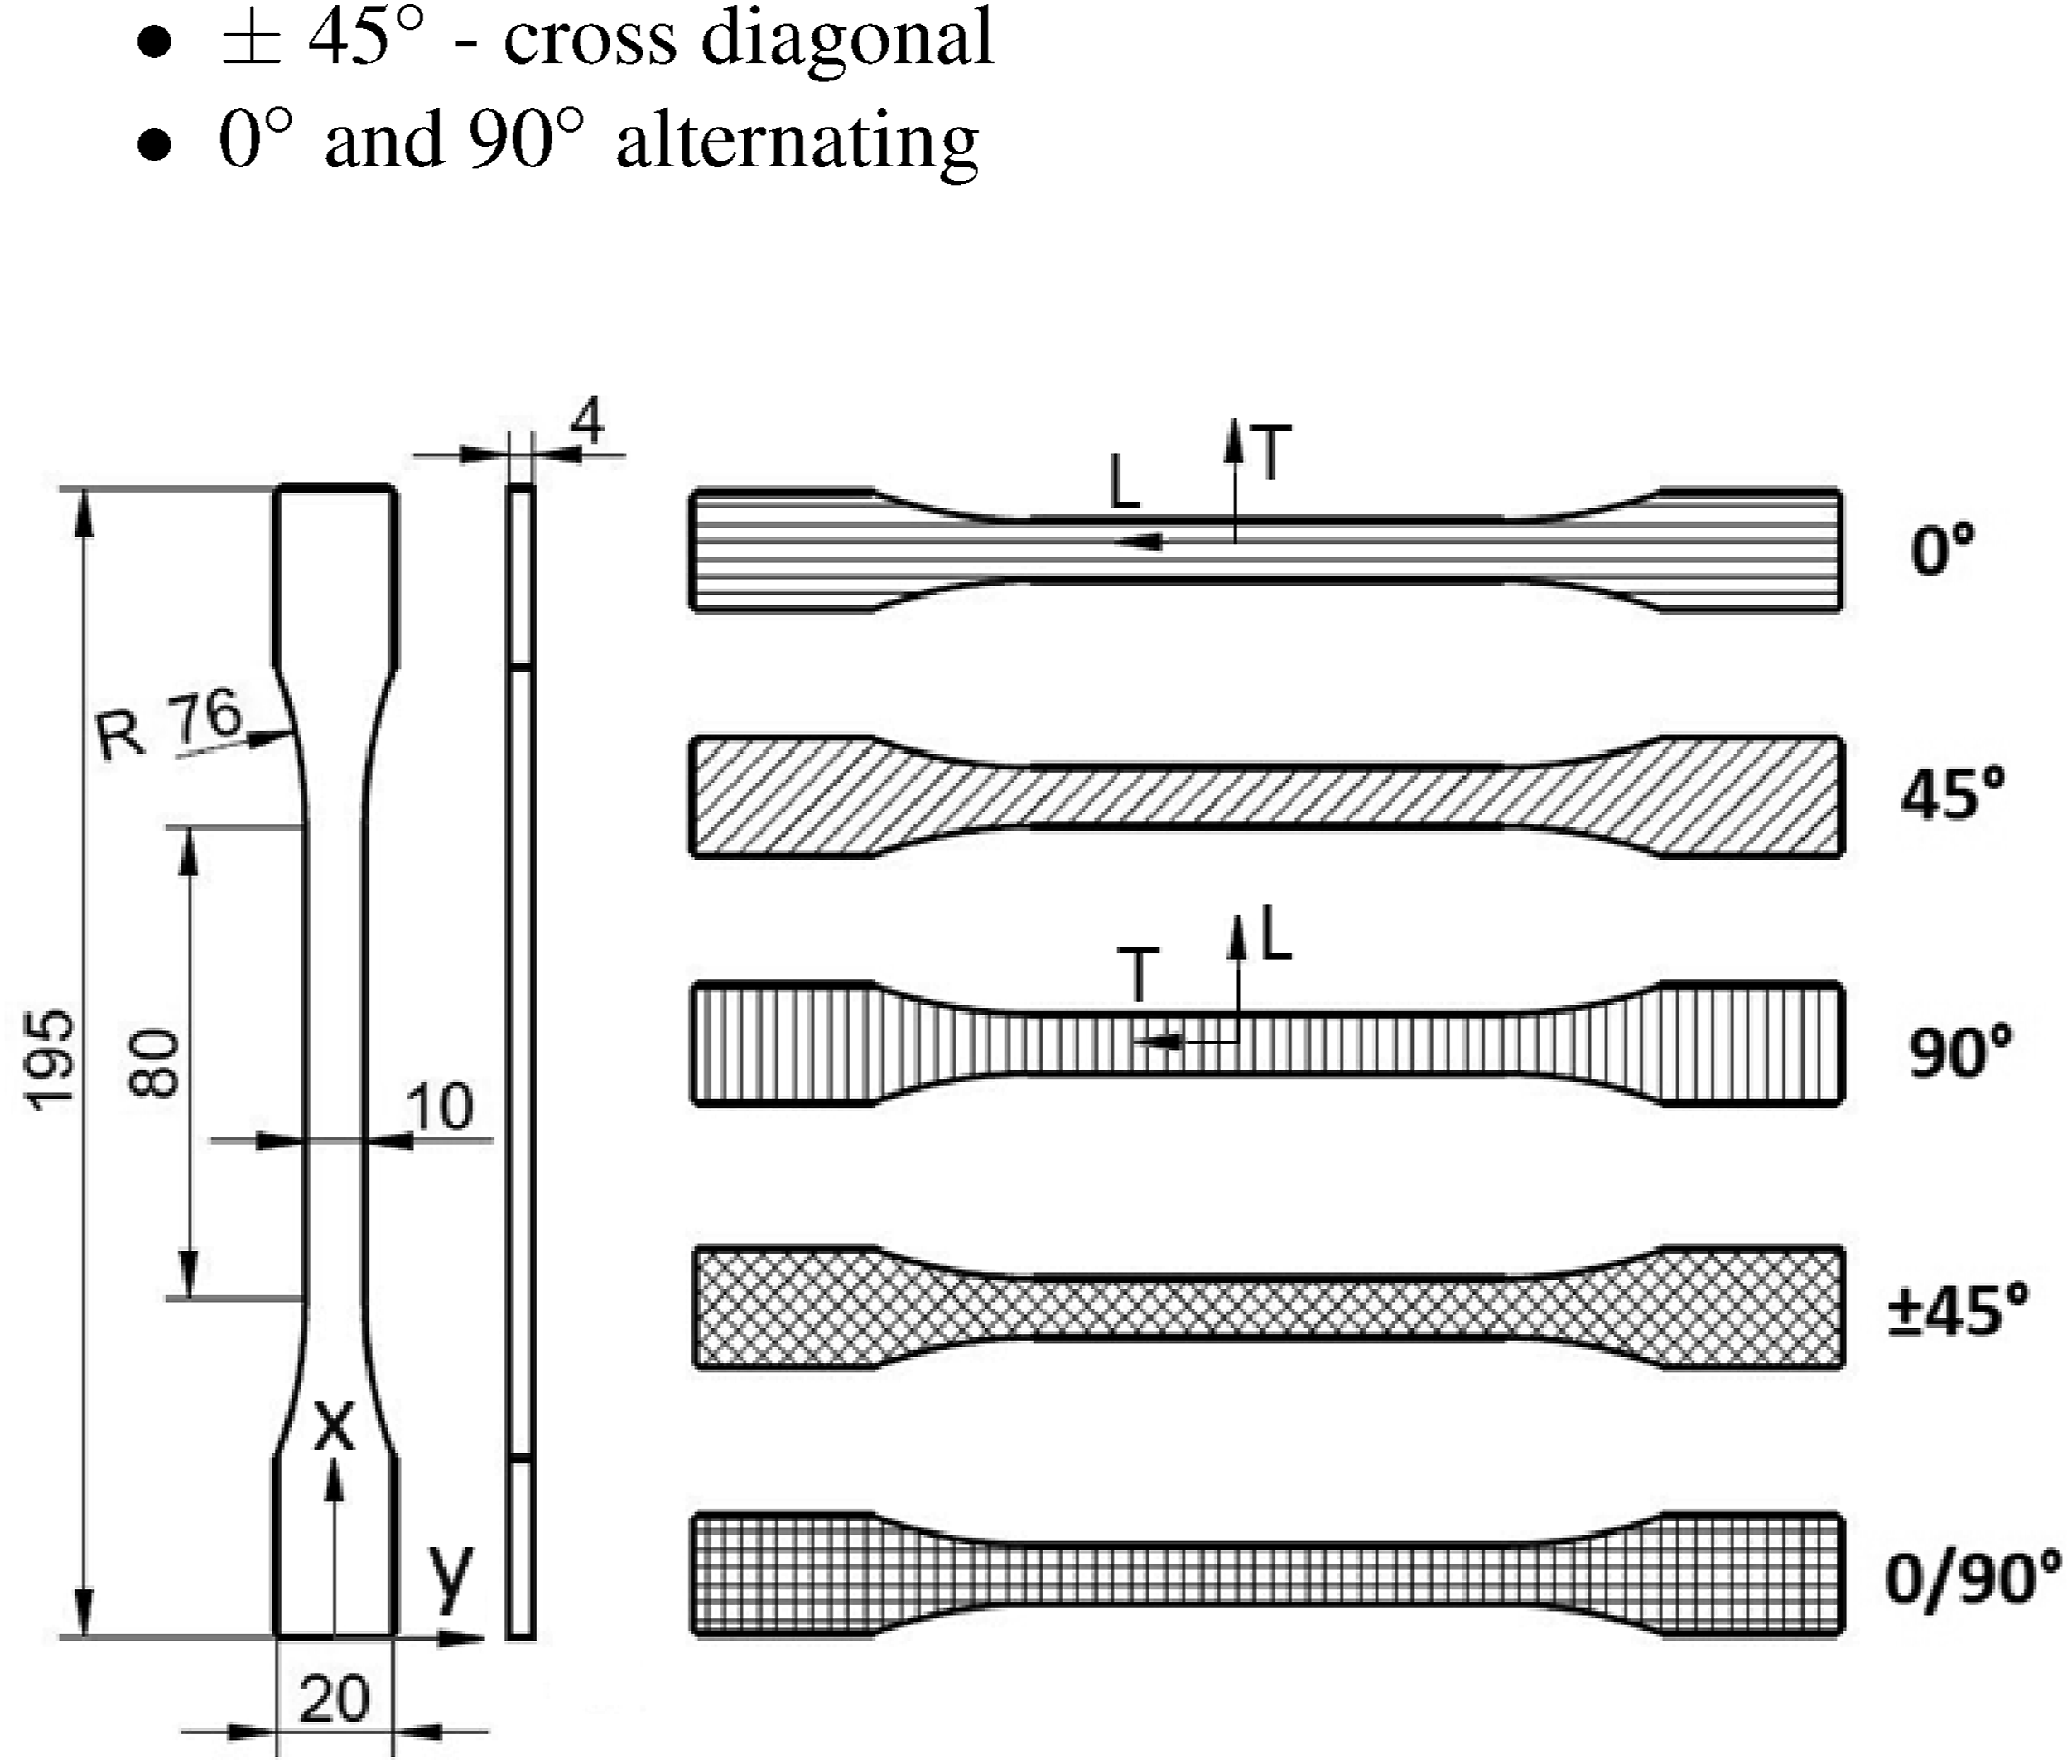
To comprehensively evaluate mechanical properties and oil uptake, specimens were printed in five different orientations. Each specimen was printed by adding layers in thickness, but the movement of the printing nozzle varied. The chosen orientations included: • 0° - longitudinal • 45° - diagonal • 90° - transversal • ± 45° - cross diagonal • 0° and 90° alternating
Each orientation comprised 20 specimens, with 10 specimens designated for testing in an untreated (dry) condition and 10 after oil exposure, resulting in a total of 100 tensile tests. This robust dataset ensures comprehensive analysis and reliable conclusions regarding the influence of oil on mechanical properties.
Printing parameters.
Oil immersing
The specimens were immersed in oil for 124 days to assess the potential impact on their properties. Throughout the immersion period, regular weight measurements were conducted to monitor any mass uptake of oil.
During each measurement, the specimens were removed from the oil to allow excess oil to drip away. Subsequently, any residual oil was wiped off using a cloth. This approach was adopted because, unlike water, oil does not evaporate. Additionally, the use of a solvent such as gasoline was avoided to prevent any potential interference with measurement accuracy.
Then, the weight was measured by scale KERN ADJ 100-4 with range of 120 g and resolution 0.0001 g while the specimens’ weight was around 14 g. Each specimen underwent five consecutive weight measurements to obtain an average value before being re-immersed in oil.
The setup of the oil exposure is illustrated in Figure 4 featuring a heating plate and a cross-section view of the insulated oil tank containing the specimens. This configuration ensured consistent temperature conditions throughout the immersion process. Insulated oil tank with heating plate for immersing CFRP specimens.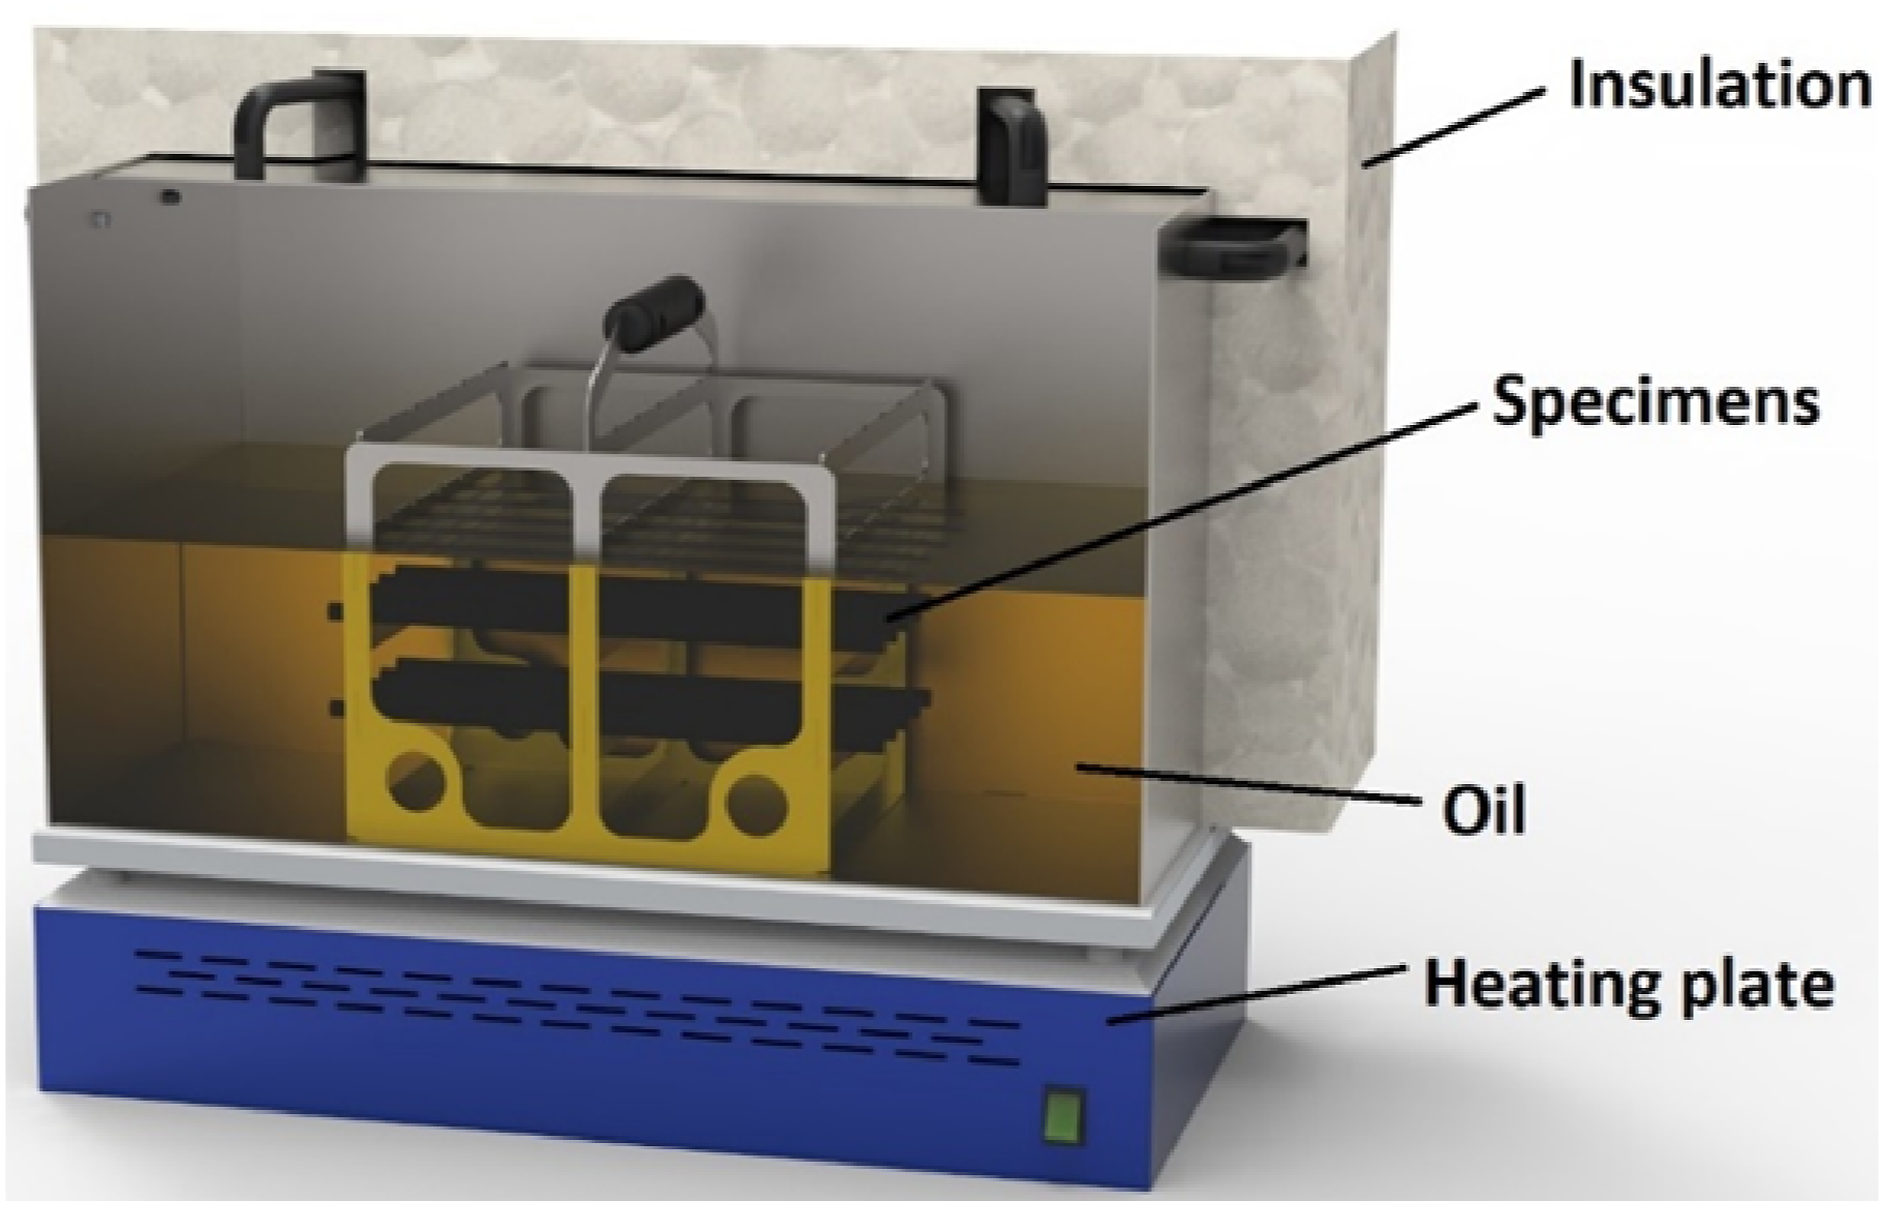
Tensile tests
The static tensile tests encompassed the measurement and evaluation of several parameters critical to understanding material behavior under applied loads. Direct measurements were taken for force and deformations in both length and width dimensions of the specimens.
Using these parameters, it was possible to obtain others. These include nominal stress σ that is calculated as force divided by cross section of undeformed specimen (w * t = 4 * 10 mm). Strain in x-direction obtained from extensometer data, was calculated using the equation ɛ x = (L − L0)/L0, where L is the length of the middle section and L0 is the length before deformation (80 mm). Strain in y-direction was obtained from transversal extensometer using the equation ɛ y = (W0 − W)/W0, where W is the current width of specimen and W0 is the width before deformation (10 mm). The directions x and y are depicted in Figure 3.
With knowledge of stress and strain, Young’s moduli (E
L
and E
T
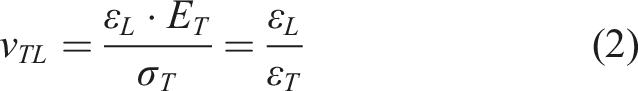
) were determined from tests conducted on specimens oriented at 0° and 90°. Young’s modulus was computed as the slope of the stress-strain curve in its initial linear section. Subsequently, Poisson’s ratios (ν
LT
and ν
TL
) were calculated in accordance with Hooke’s law.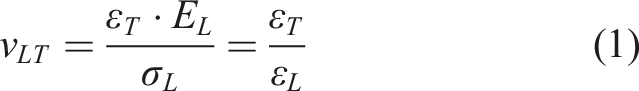
The standard followed in the tensile testing was EN ISO 527-1. After a few initial tests with testing speed 3 mm/min (speed of clamps of the hydraulic machine), the speed was increased and kept for the rest of the experiment at 4 mm/min ensuring the specimens would break safely within the limit for static tests according to the standard. The test time then varied between 40 and 60 s depending mainly on printing orientation. Both dry and oil exposed specimens were tested at room temperature.
Figure 5 shows the tensile test setup. The hydraulic machine is equipped with a force sensor, as well as transversal and longitudinal extensometers to evaluate stress, strain, Young’s moduli and Poisson’s constants. Tensile test device.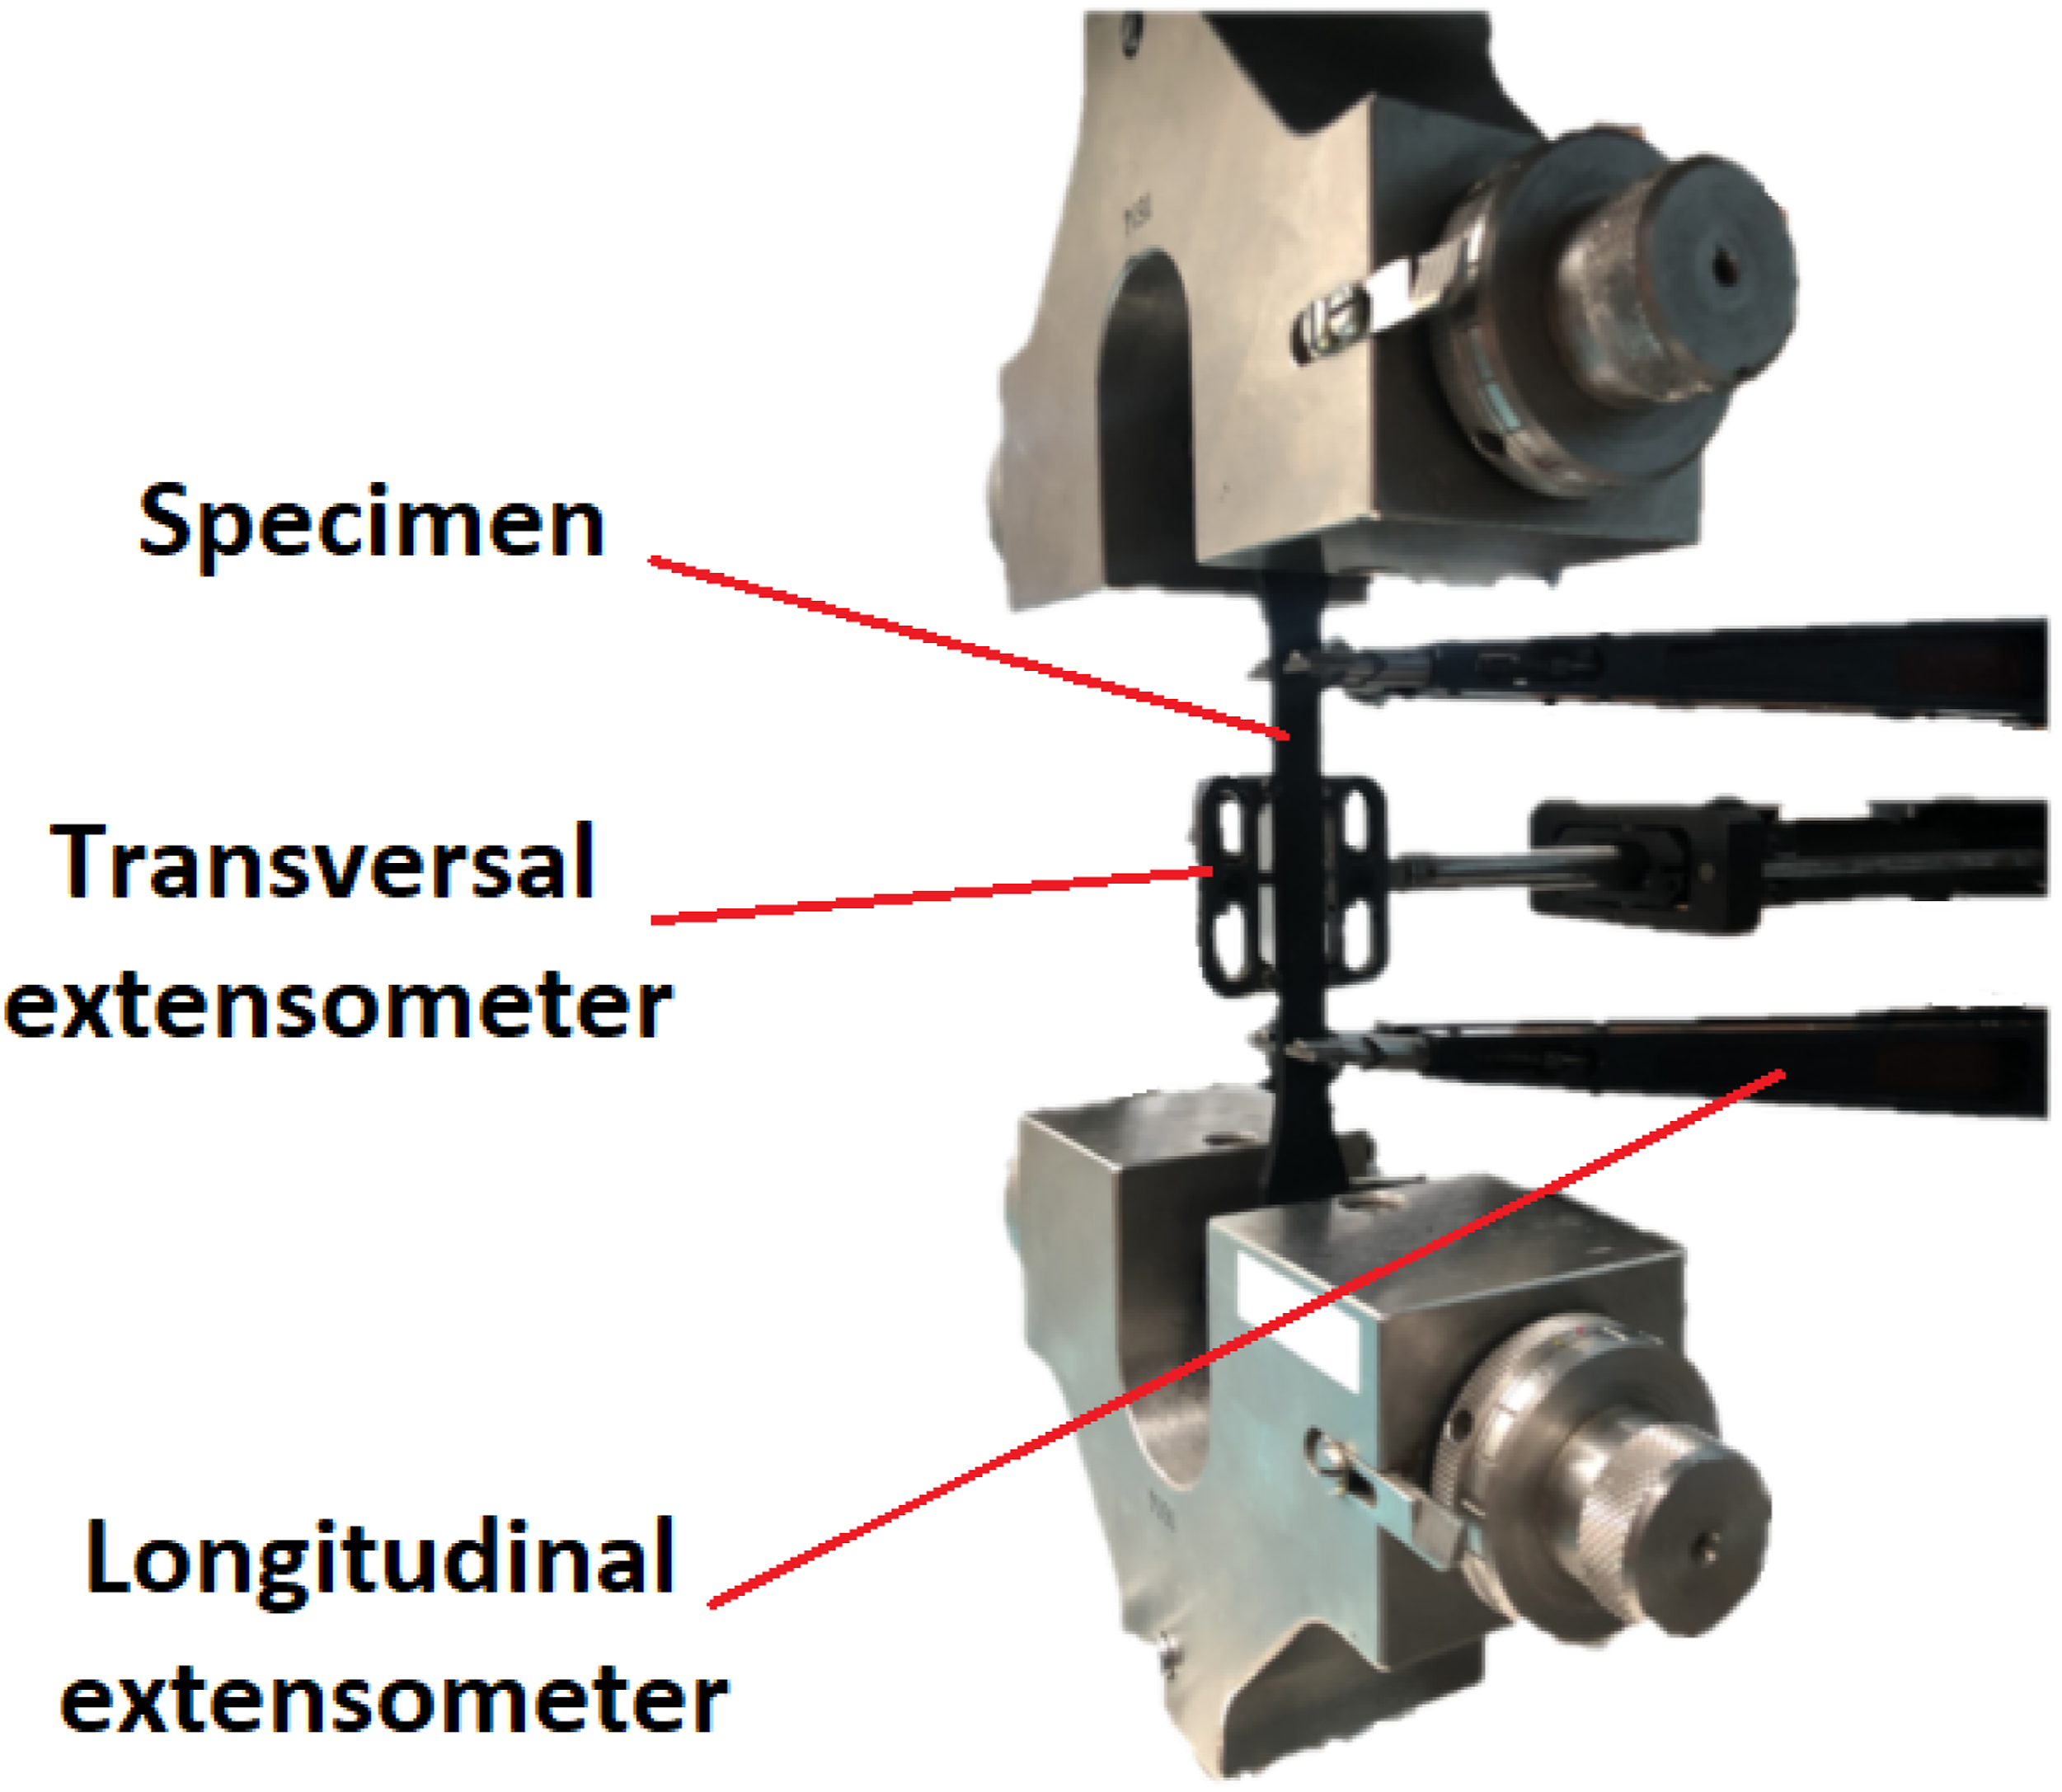
Results and discussion
Oil uptake
The results from oil uptake did not perfectly align with Fick’s law of diffusion like in the studies on water and moisture uptake. Unlike a previous experiment involving filament wound samples cited in the previous chapter, which exhibited minimal mass uptake, the current investigation revealed some degree of oil absorption, albeit relatively small (under 1%) compared to water saturation levels, which commonly exceed 1% and may even extend up to 4%.
Figure 6–10 depict the mass progress for specimens oriented at 0°, 45°, 90°, ±45°, and 0/90°, respectively. Mass progress - orientation 0°. Mass progress - orientation 45°. Mass progress - orientation 90°. Mass progress - orientation ±45°. Mass progress - orientation 0/90°.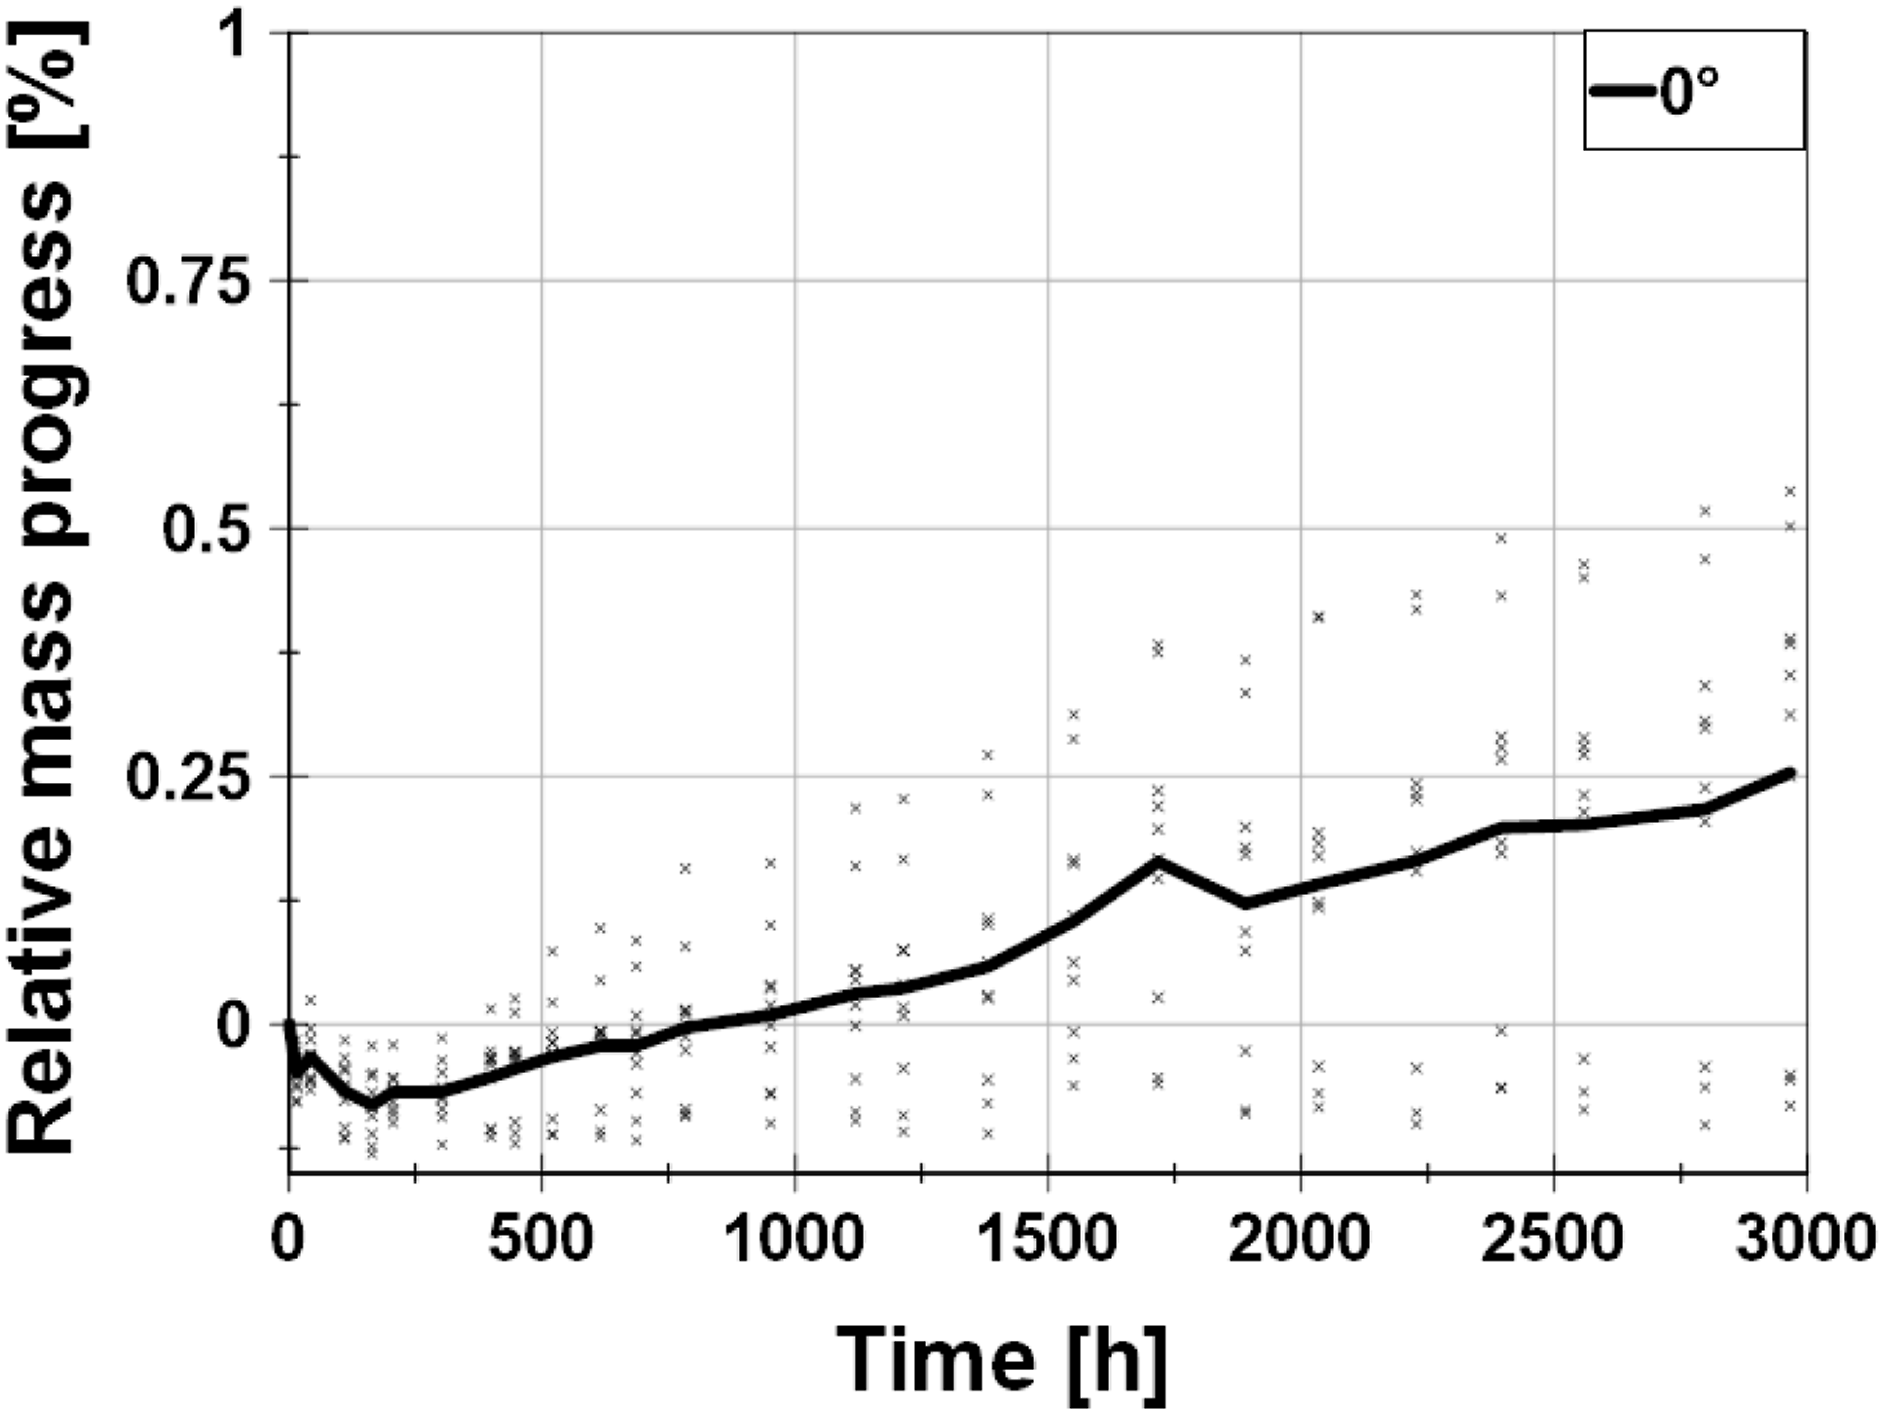
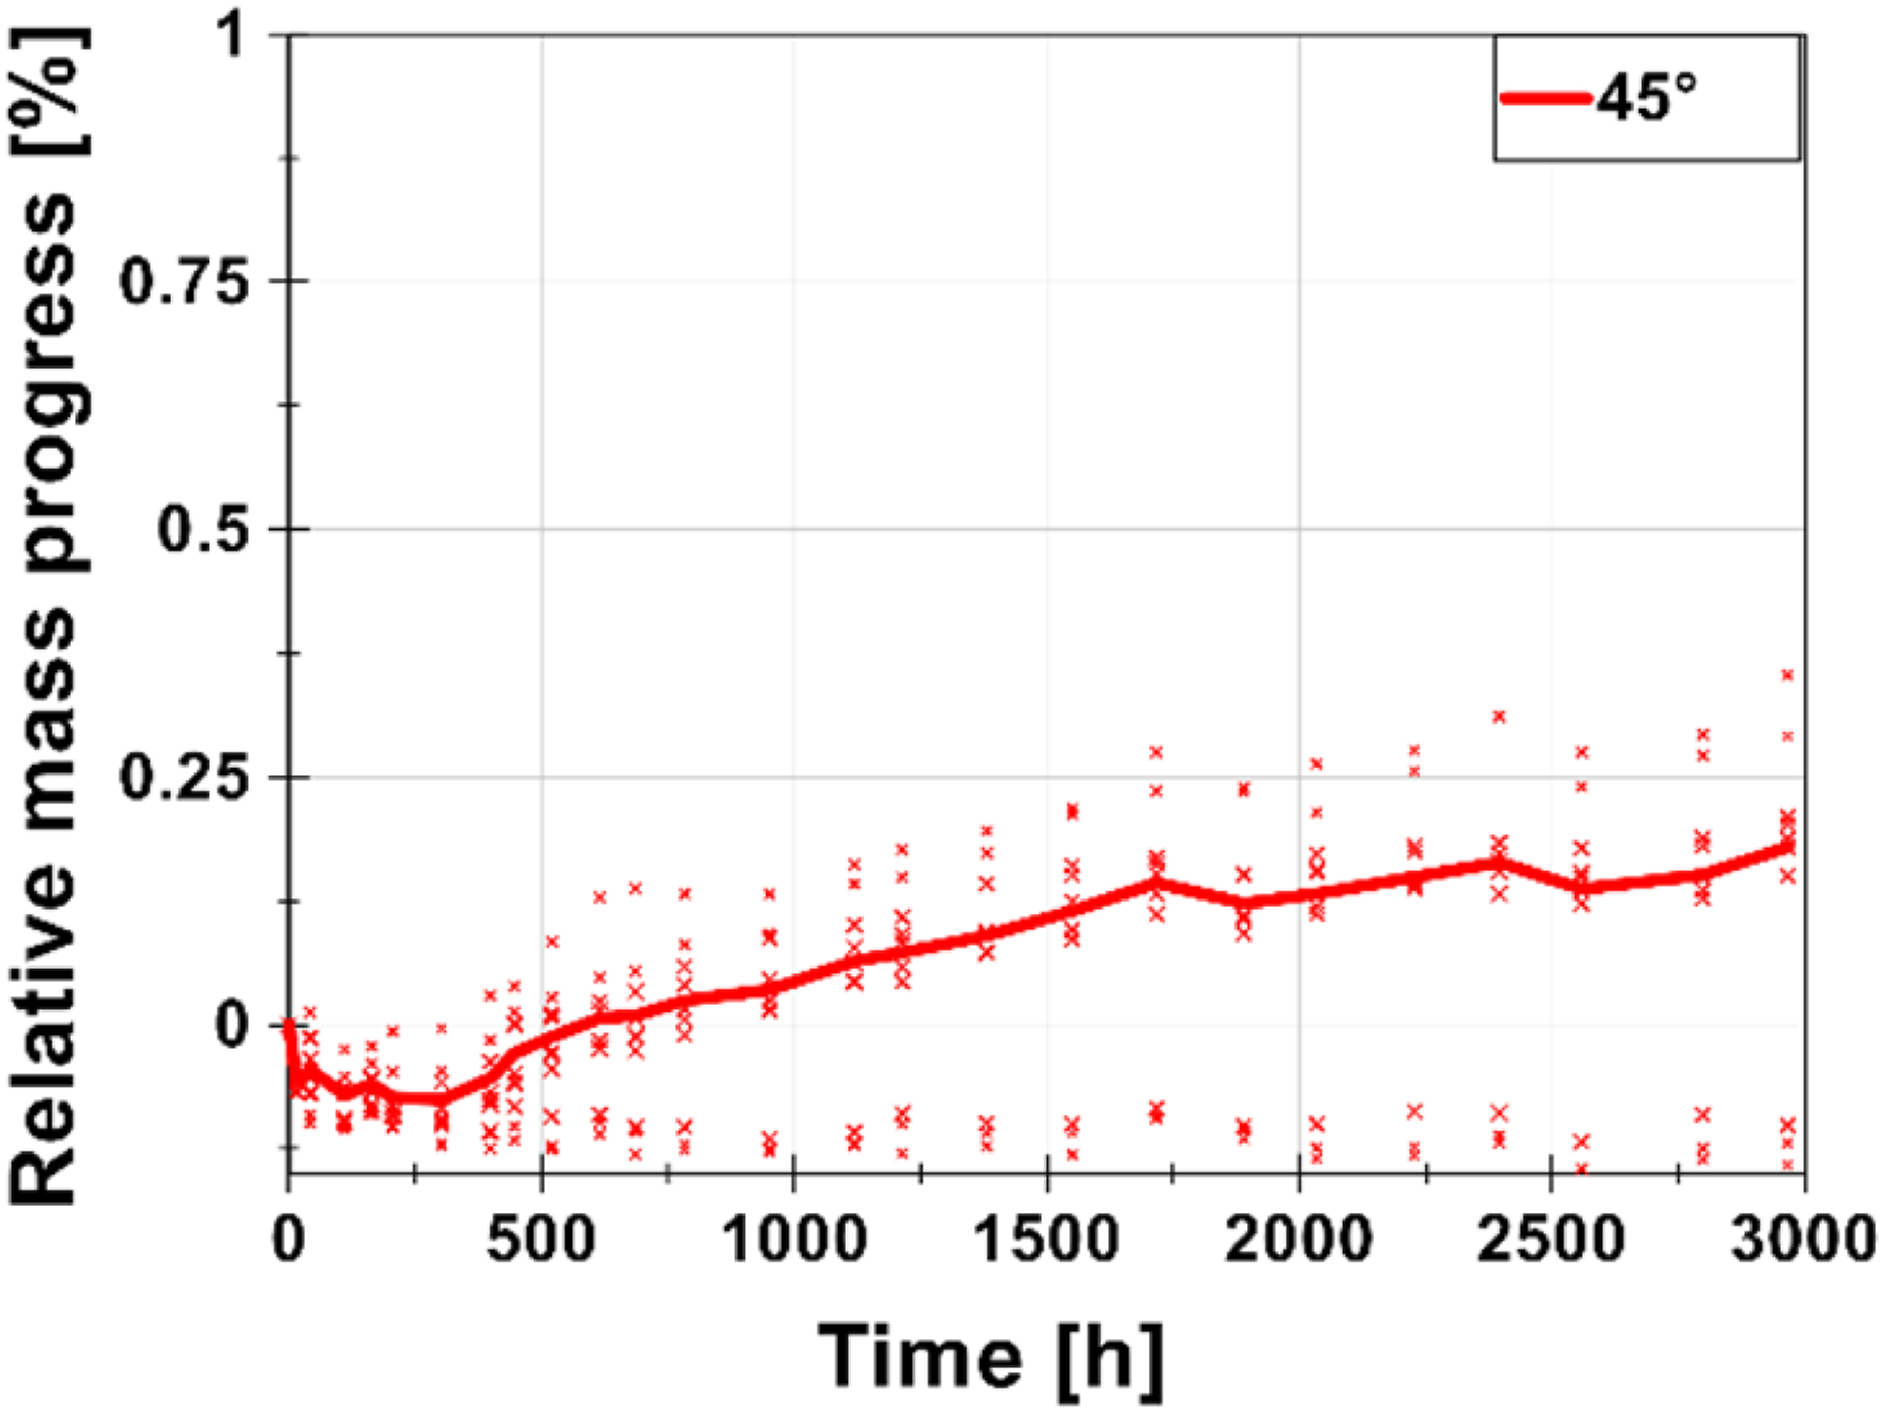
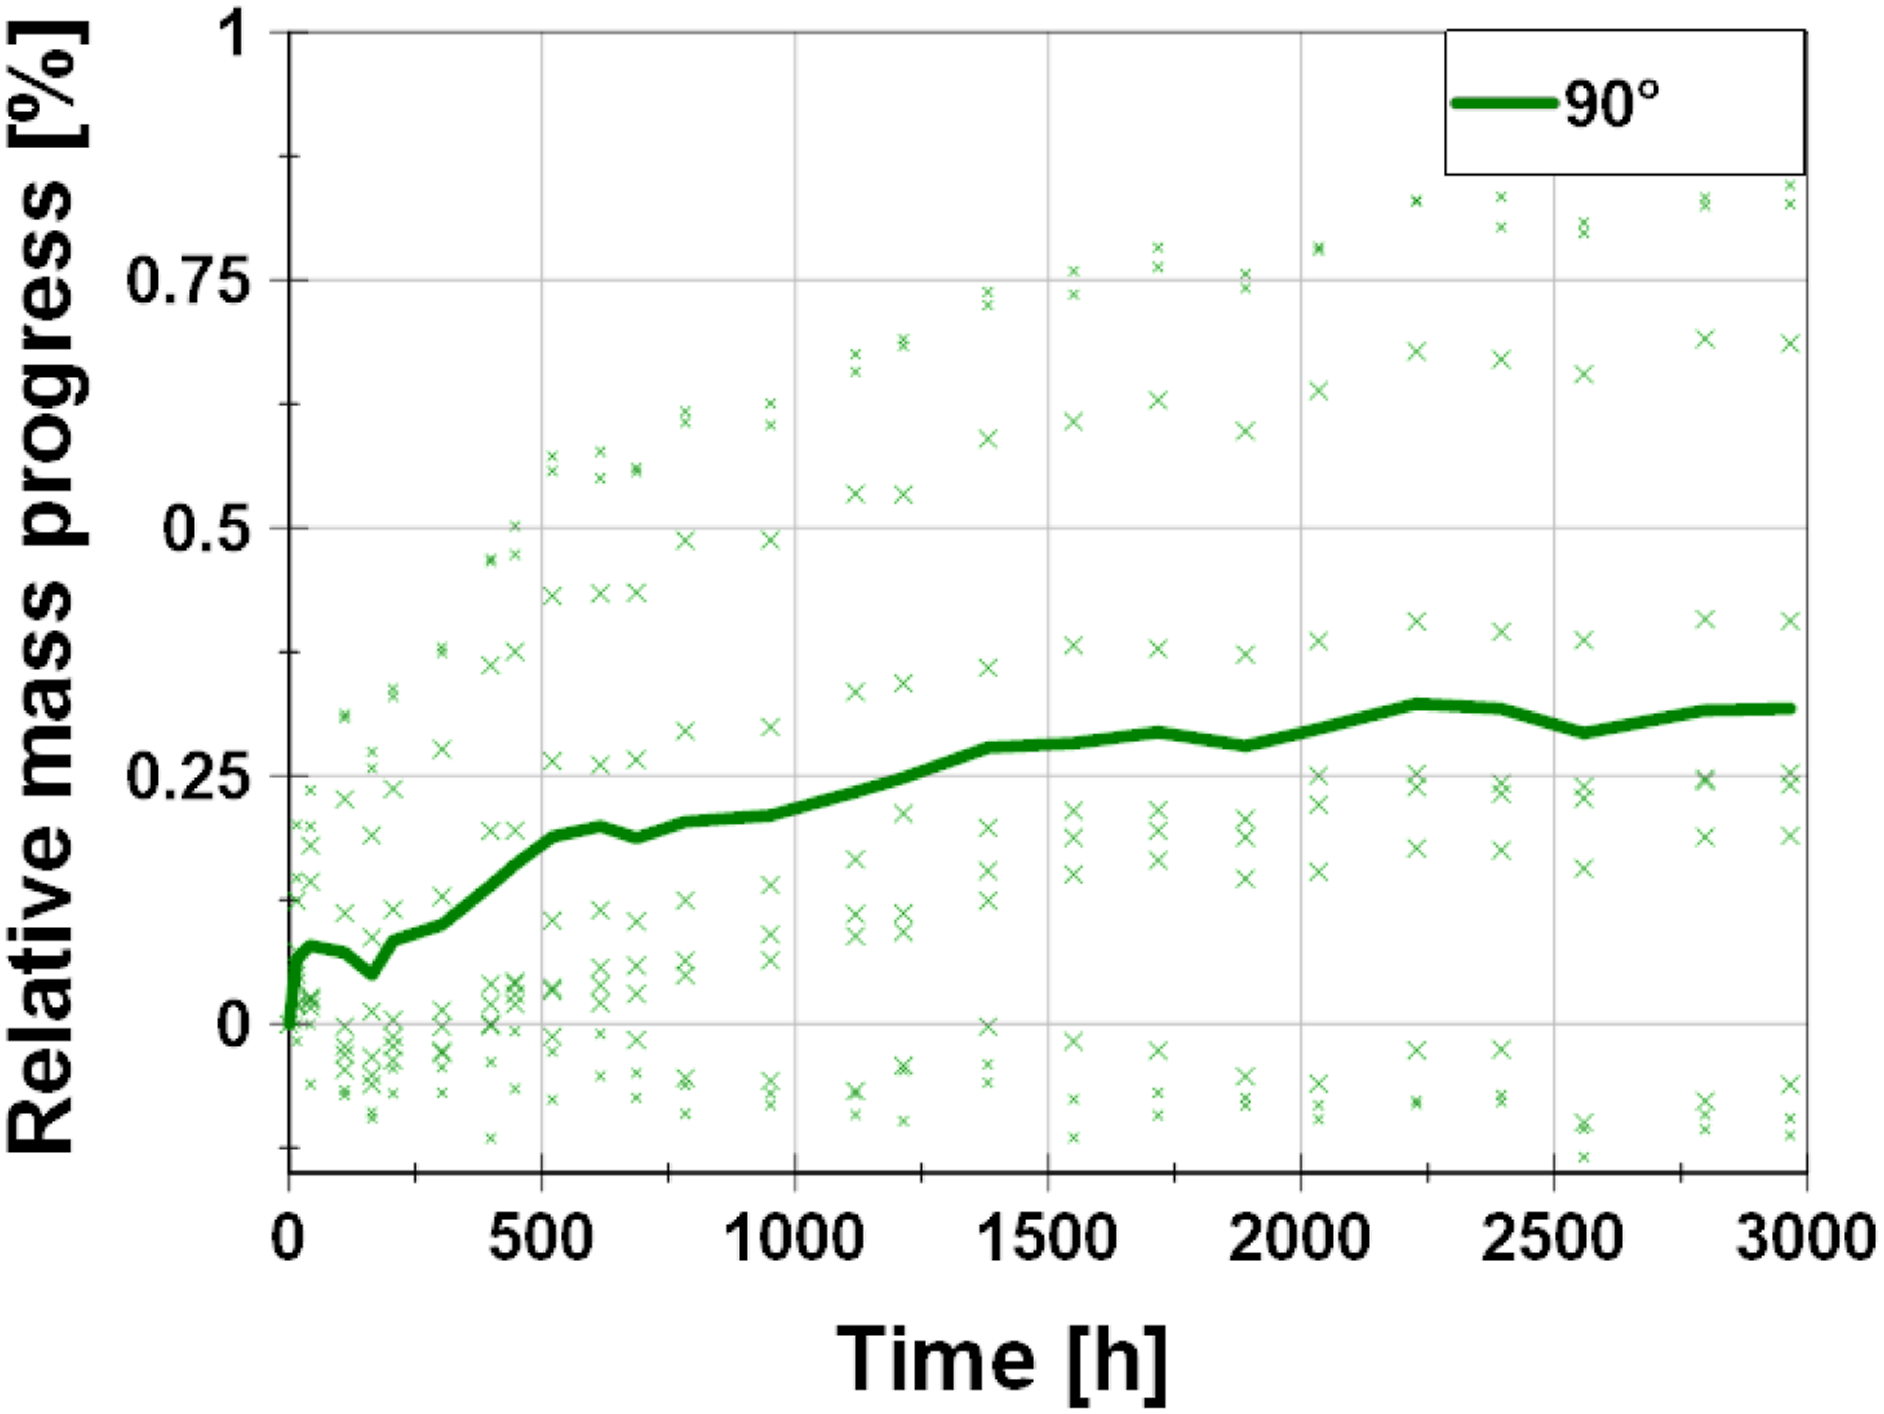
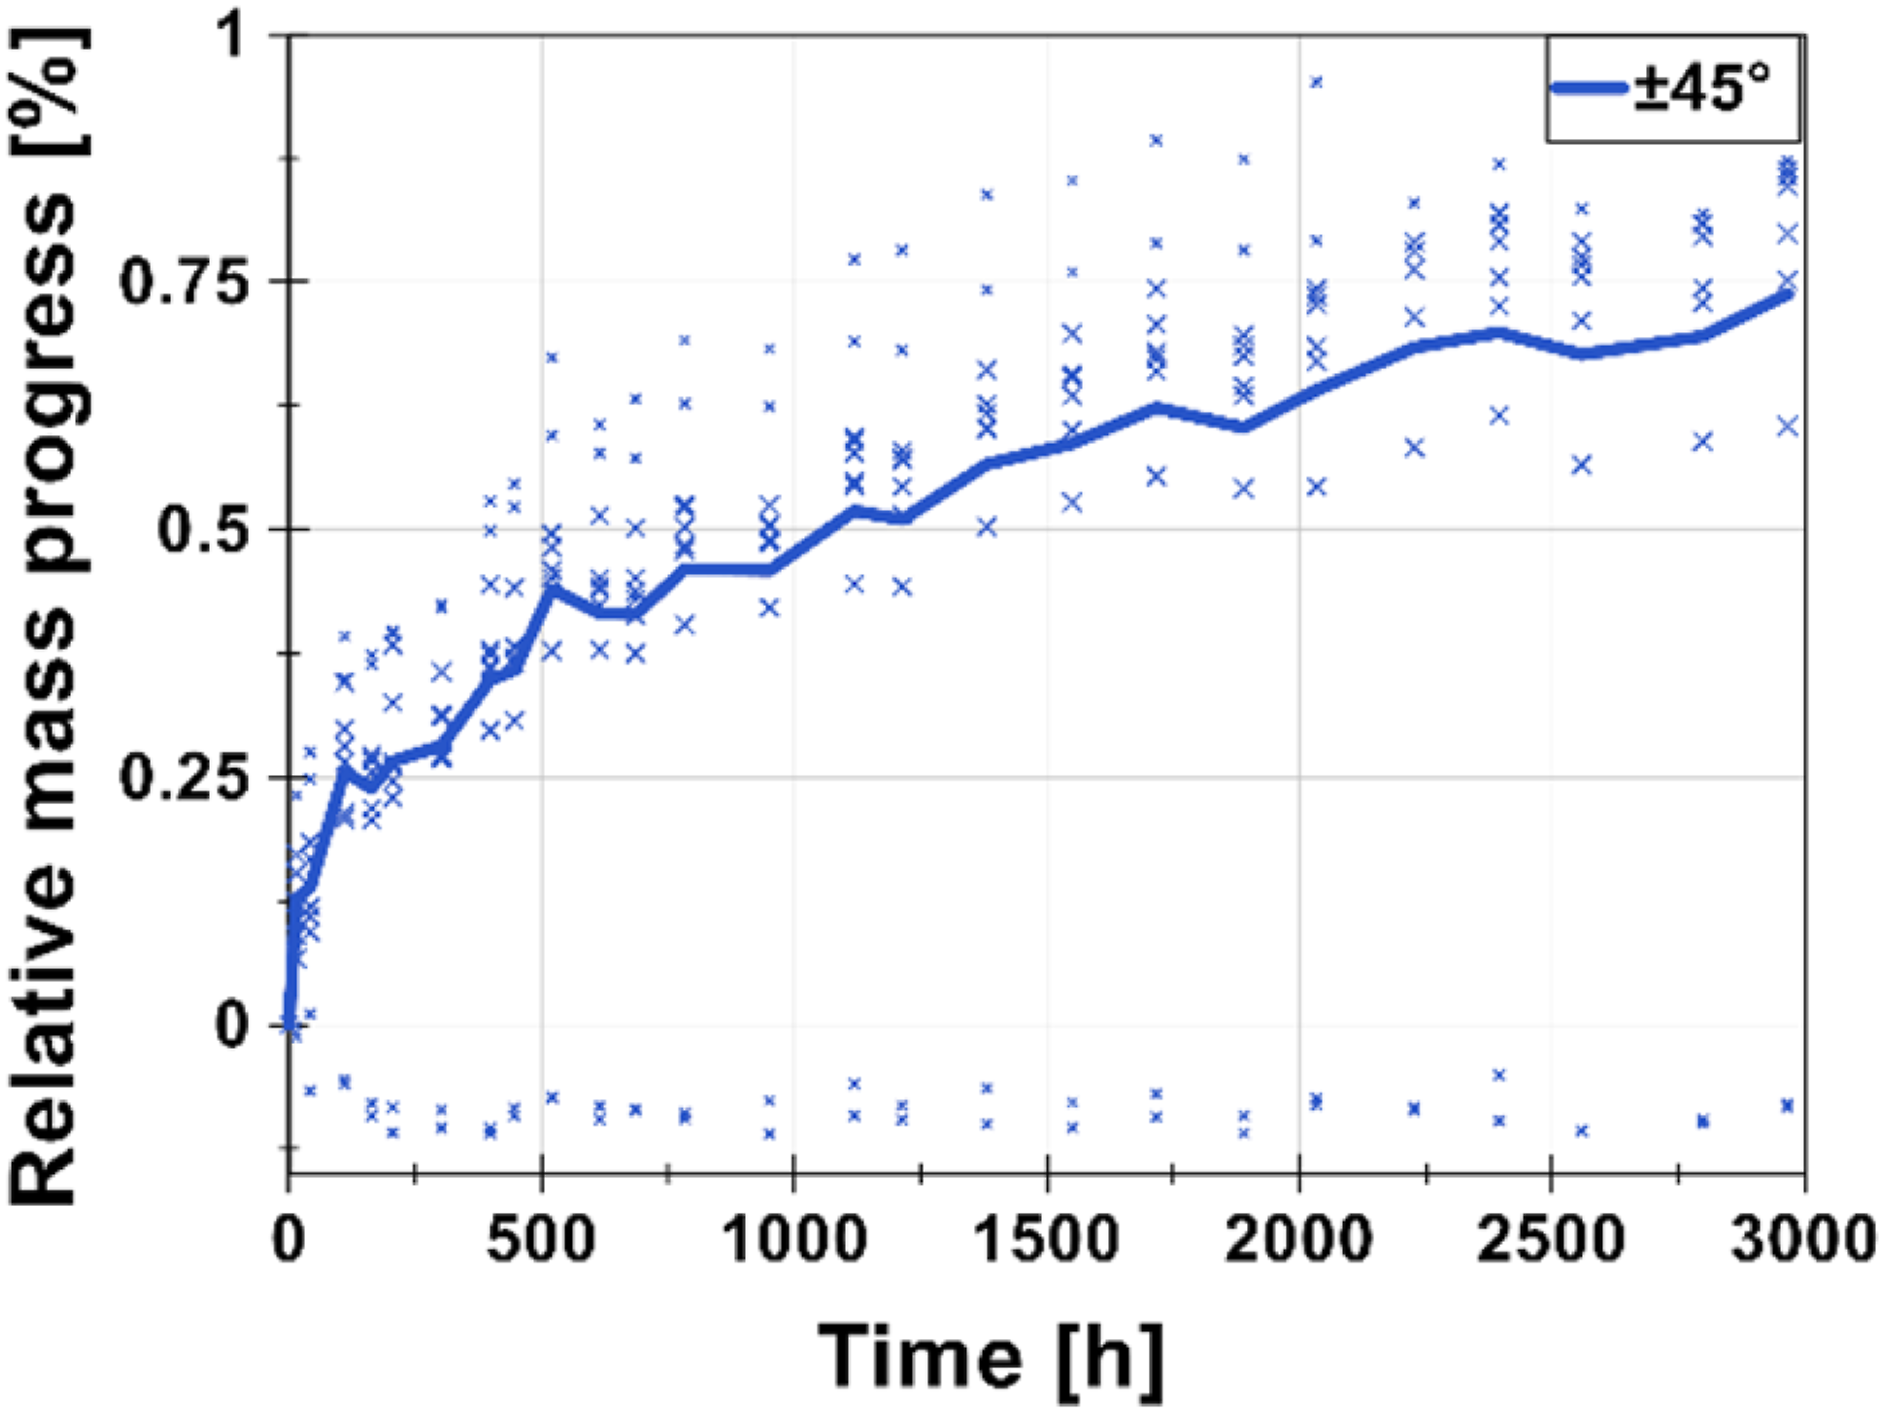
What is obvious at the first sight is that there is a significant data scatter especially for the 90° orientation, where the data points vary from mass loss of 0.15% to mass uptake 0.85%. Additionally, with the exception of two outliers, the mass progress for specimens oriented at ± 45° aligns closely with the predictions of Fick’s law. Such progress was anticipated for all specimens. Unfortunately, other curves deviate from the theoretical shape, either by an initial mass loss (0°, 45° and 0/90°) or by lacking any mass uptake at all (0/90°). Moreover, individual orientations show seeming inconsistency with one another. For instance, the mass progress of specimens oriented at ± 45° should mirror that of specimens oriented at 45°, and the mass uptake for specimens oriented at 0/90° should fall within the range observed for specimens at 0° and 90°. This inconsistency makes use of simple Fick’s law and precise determination of coefficients of diffusivity impossible.
The variability of results within respective orientation is most likely caused by the difficulty in achieving good repeatability of manufacturing with 3D printing technology an issue that will be also discussed in following chapters. Various samples then contain different amounts of pores and cavities which contributes to large scatter of results. These imperfections are presumably the main driver of diffusion of oil because our previous research on continuous CFRP manufactured by filament winding which has better integrity of the material showed virtually no significant mass uptake as Figure 2 shows.
The differences between different orientations are in agreement with previously mentioned literature (e.g28,31) as the biggest mass uptake among unidirectional specimens experienced specimens with 90° orientation, even though with large scatter of data. Among the combined orientations, the one with the biggest mass uptake (and also biggest among all) is the ±45°orientation. It’s due to the fact that changing printing orientation every layer creates even more imperfections and voids through which the liquid can penetrate the material.
Tensile tests
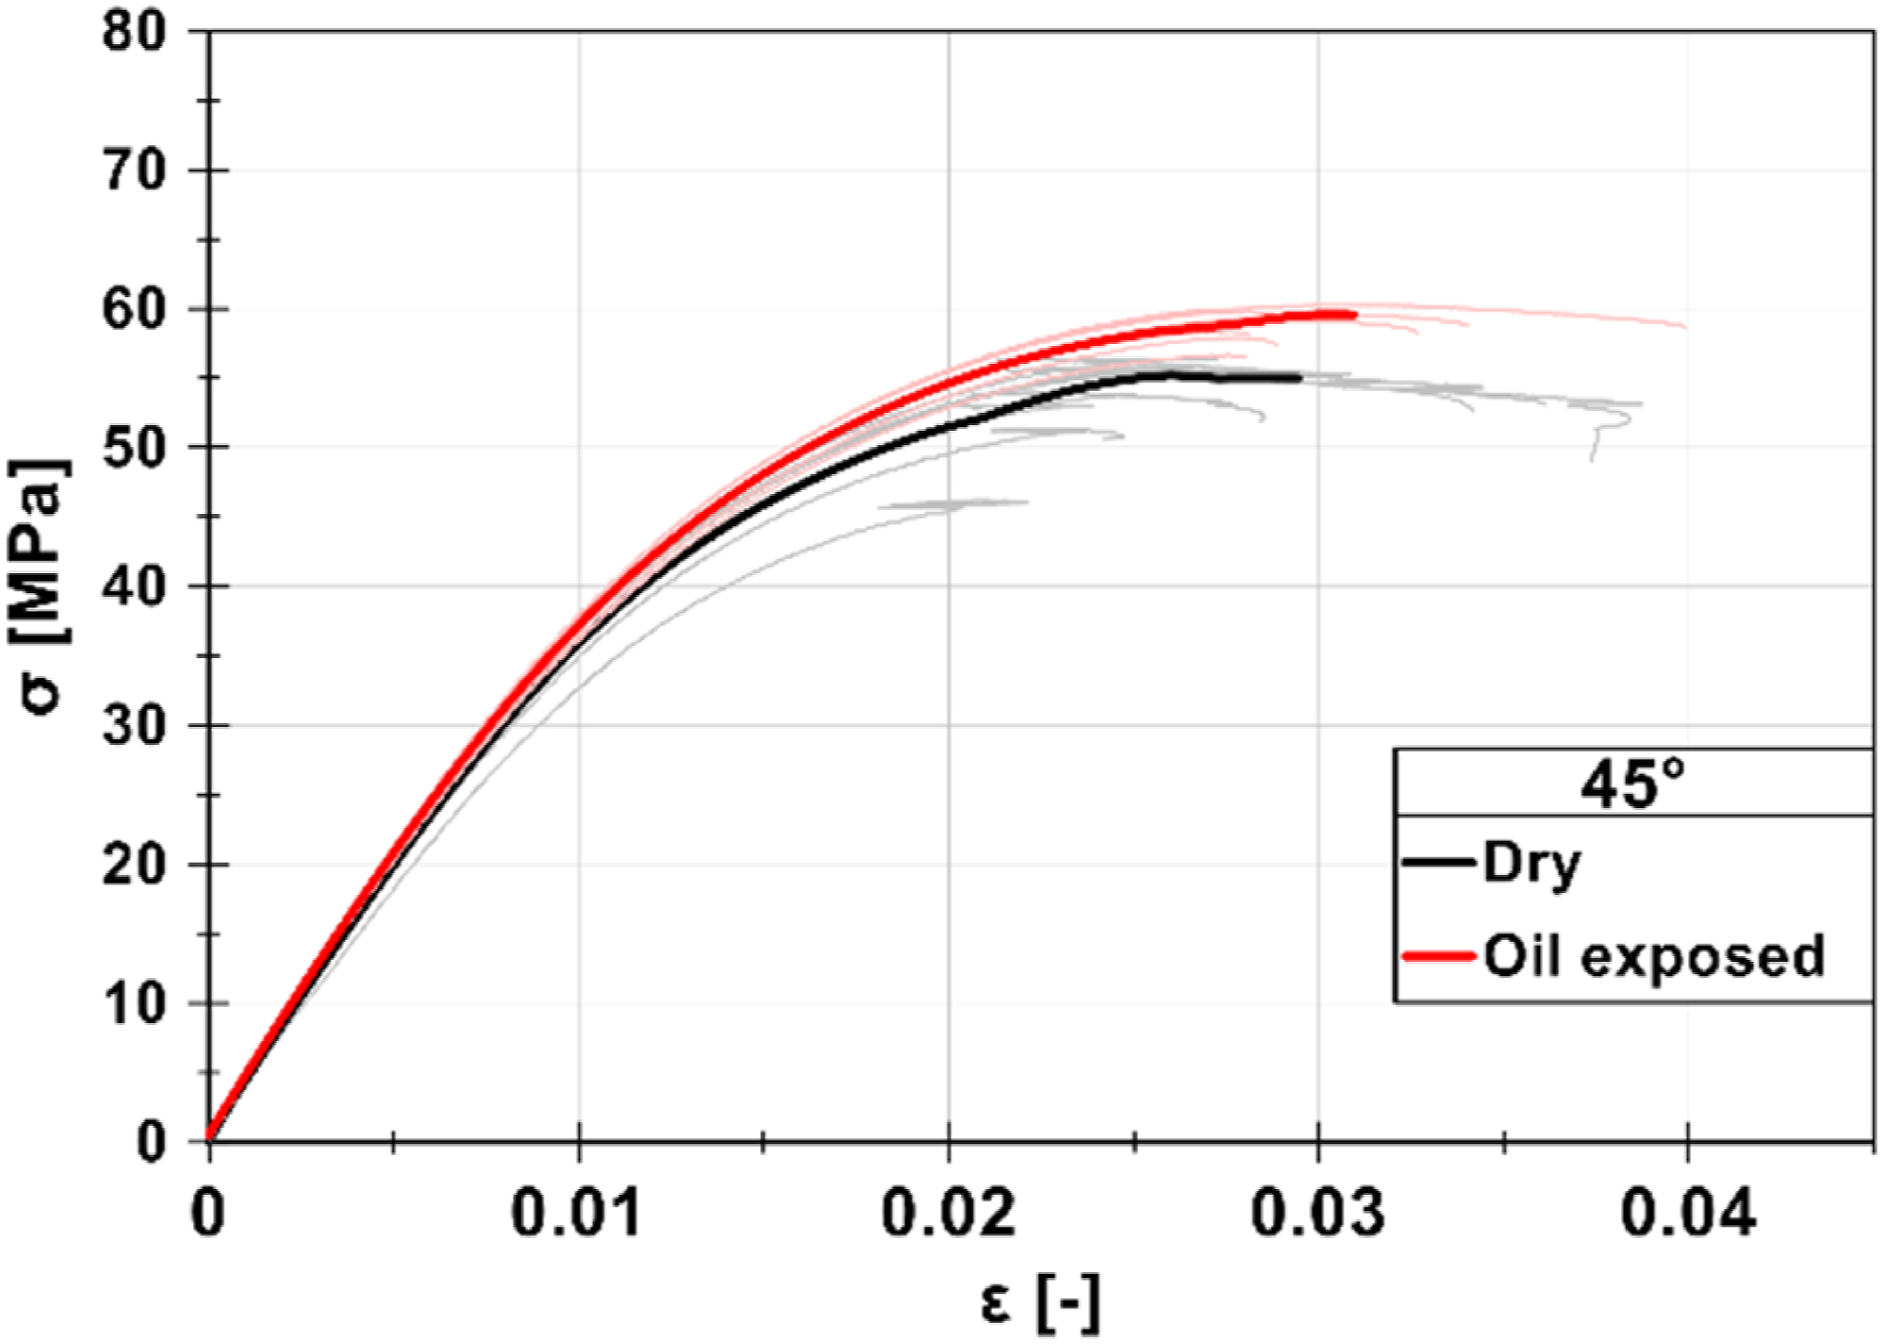
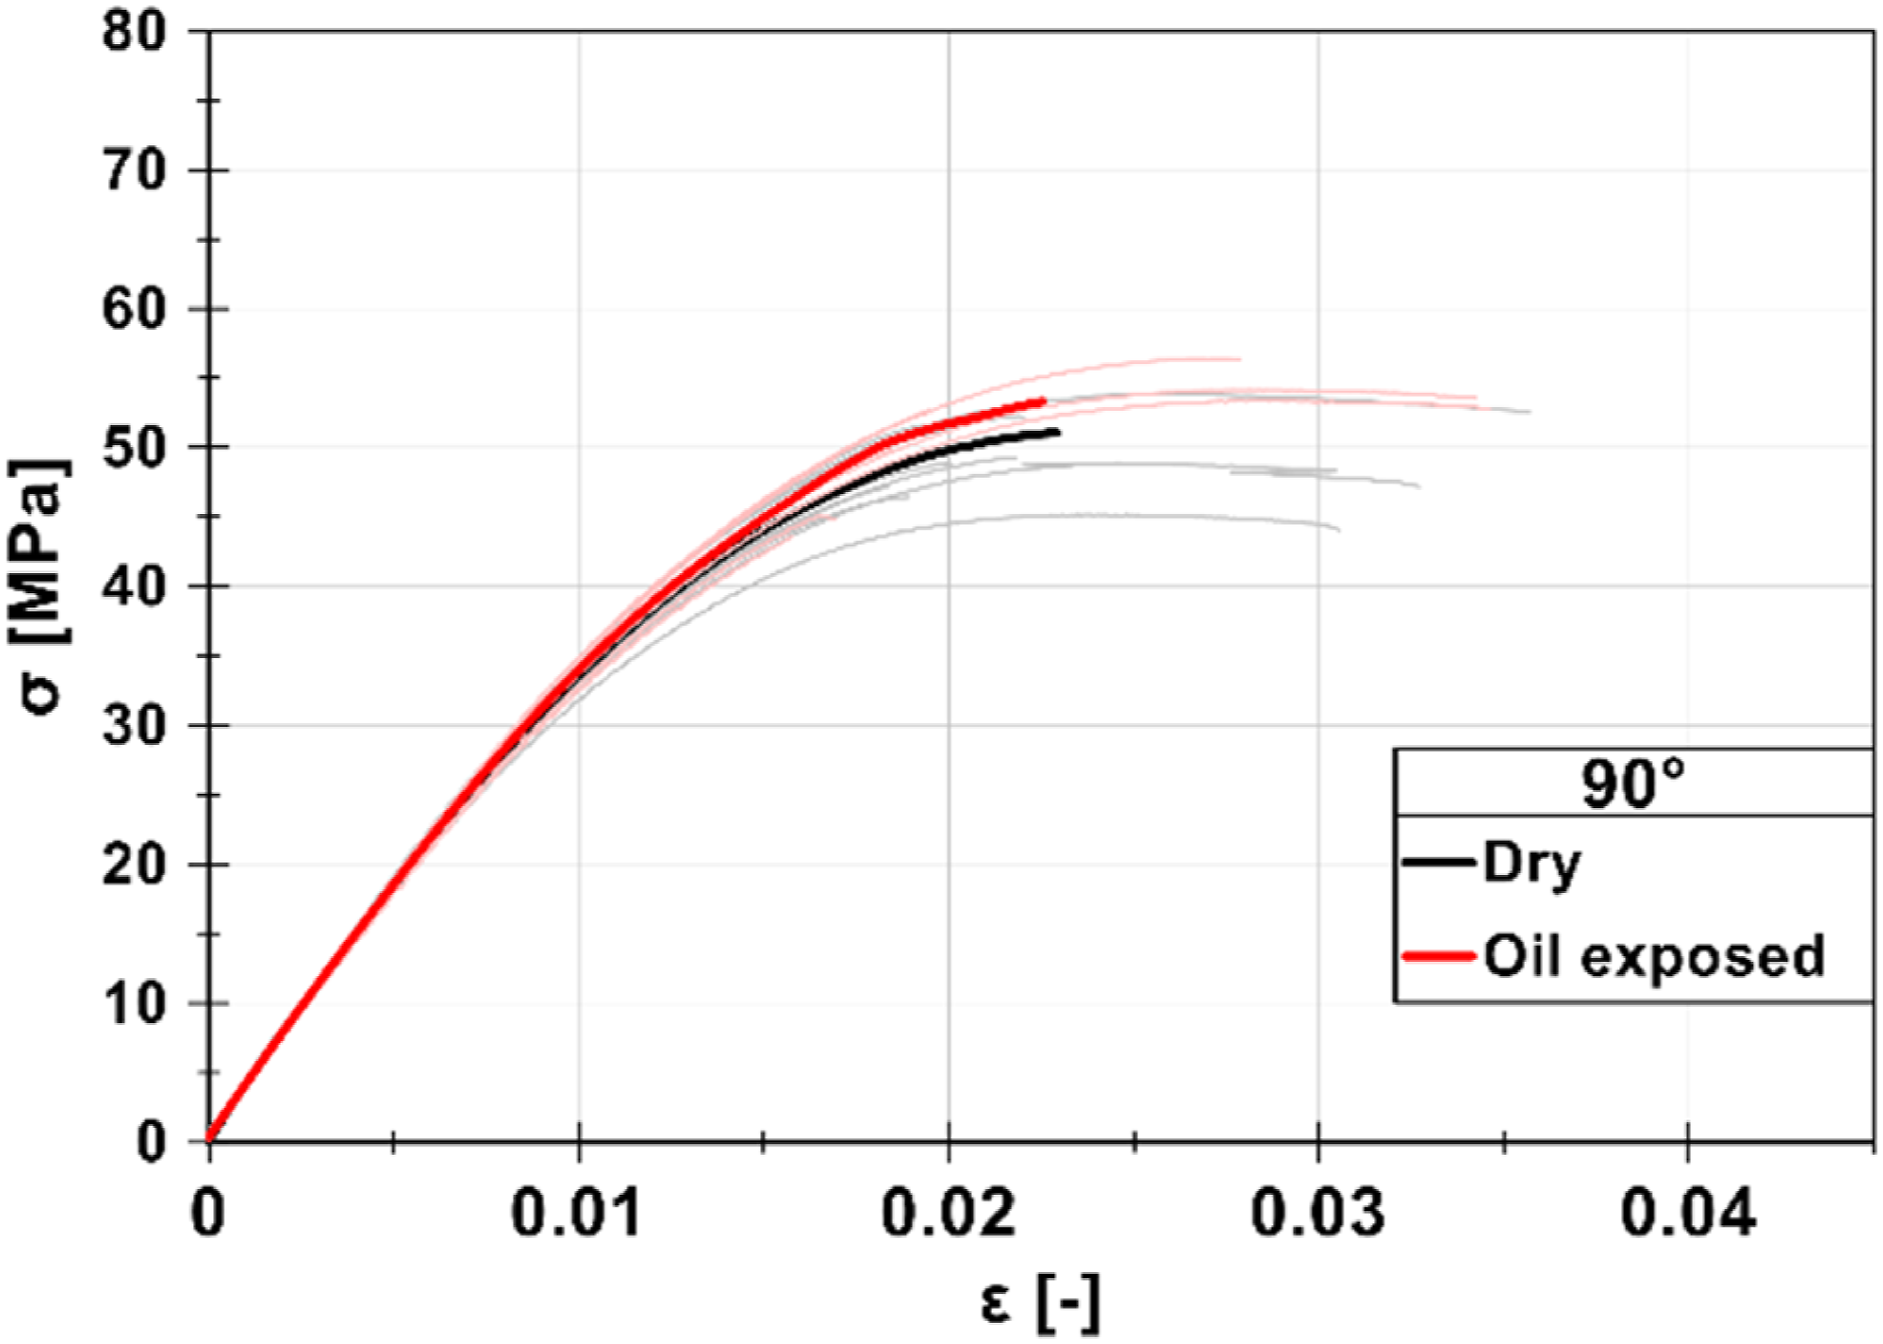
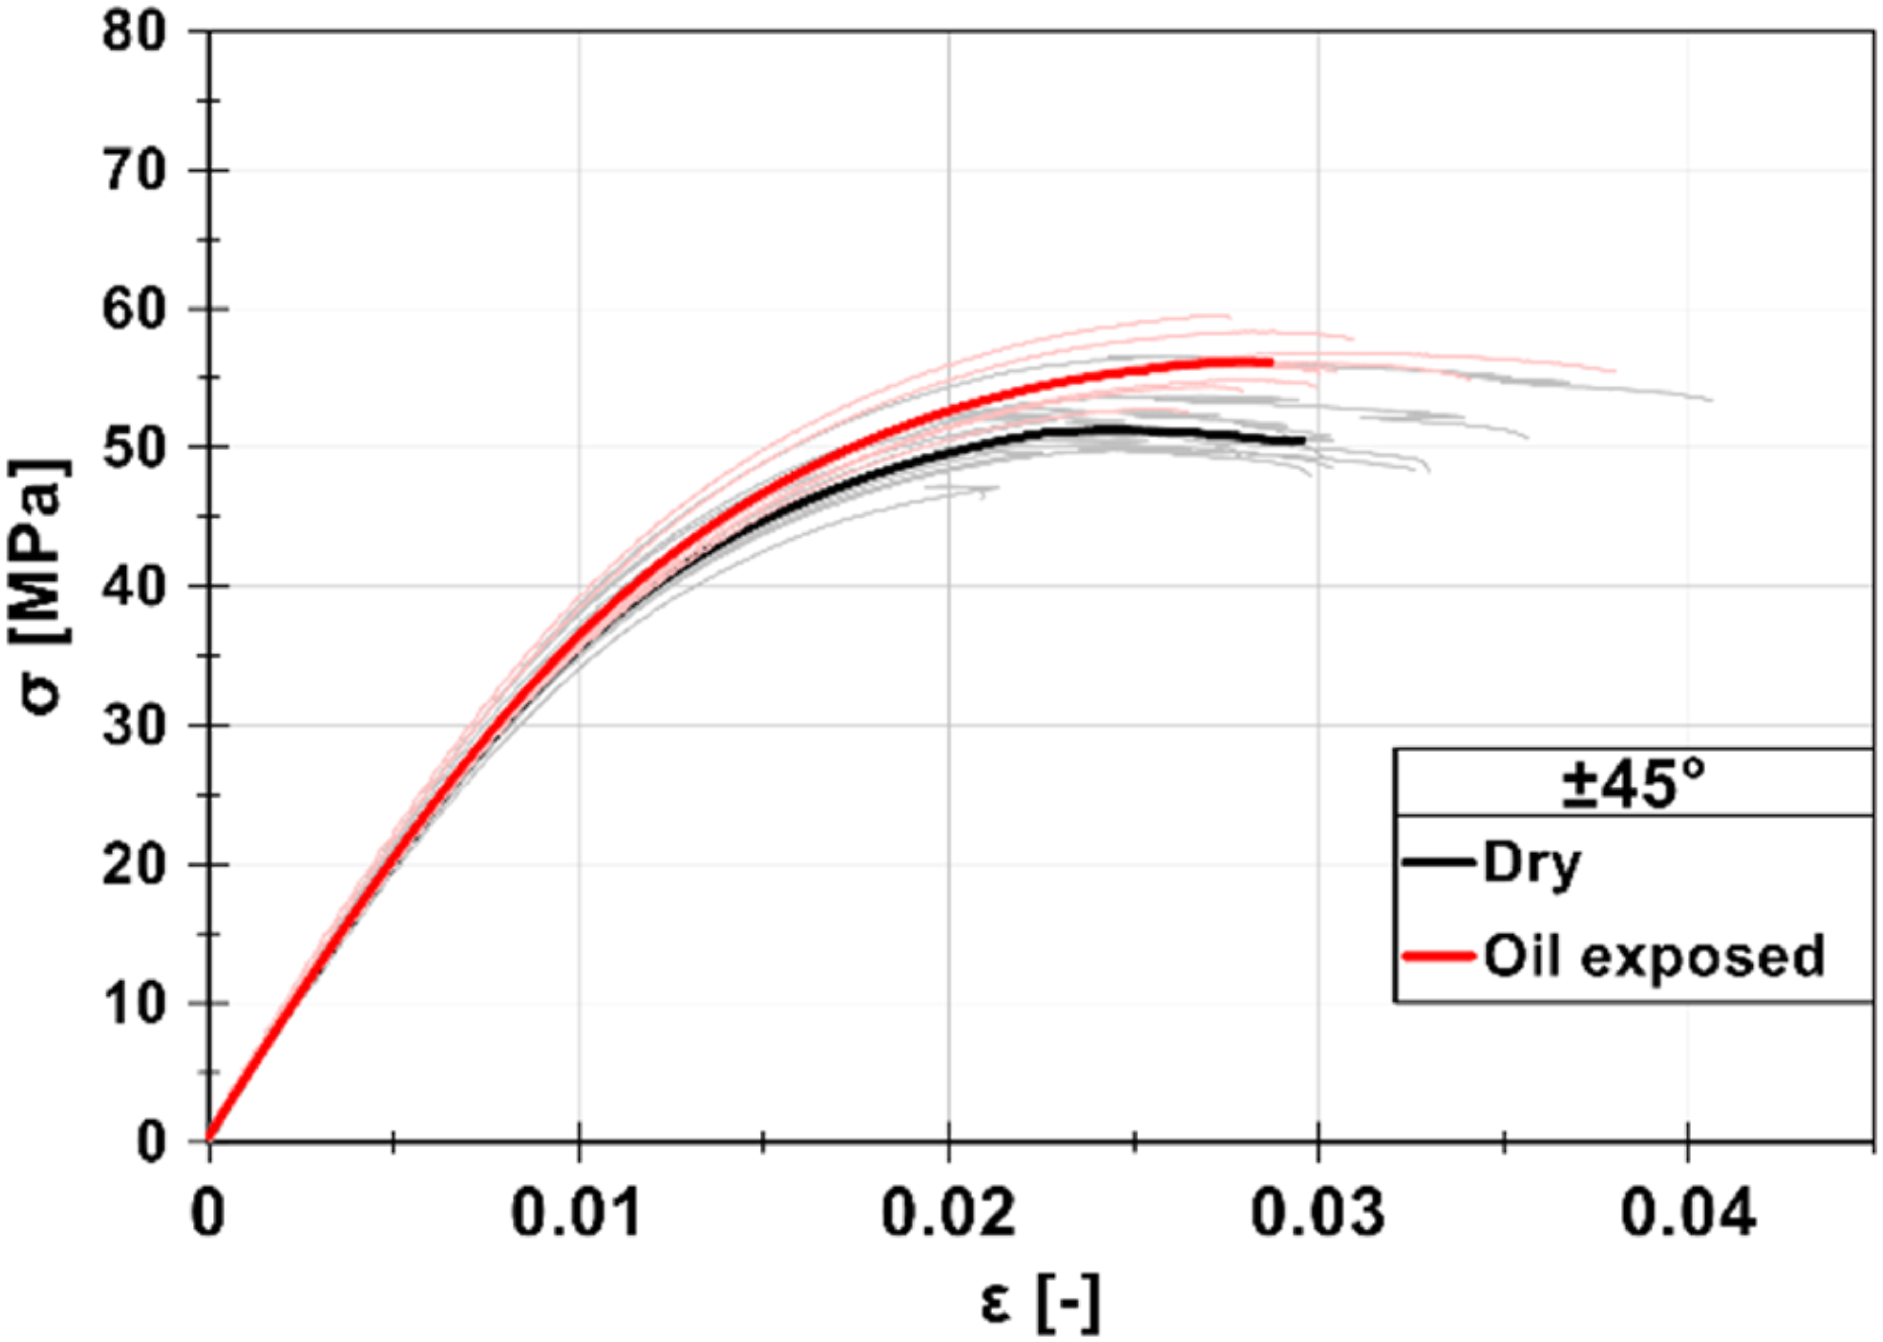
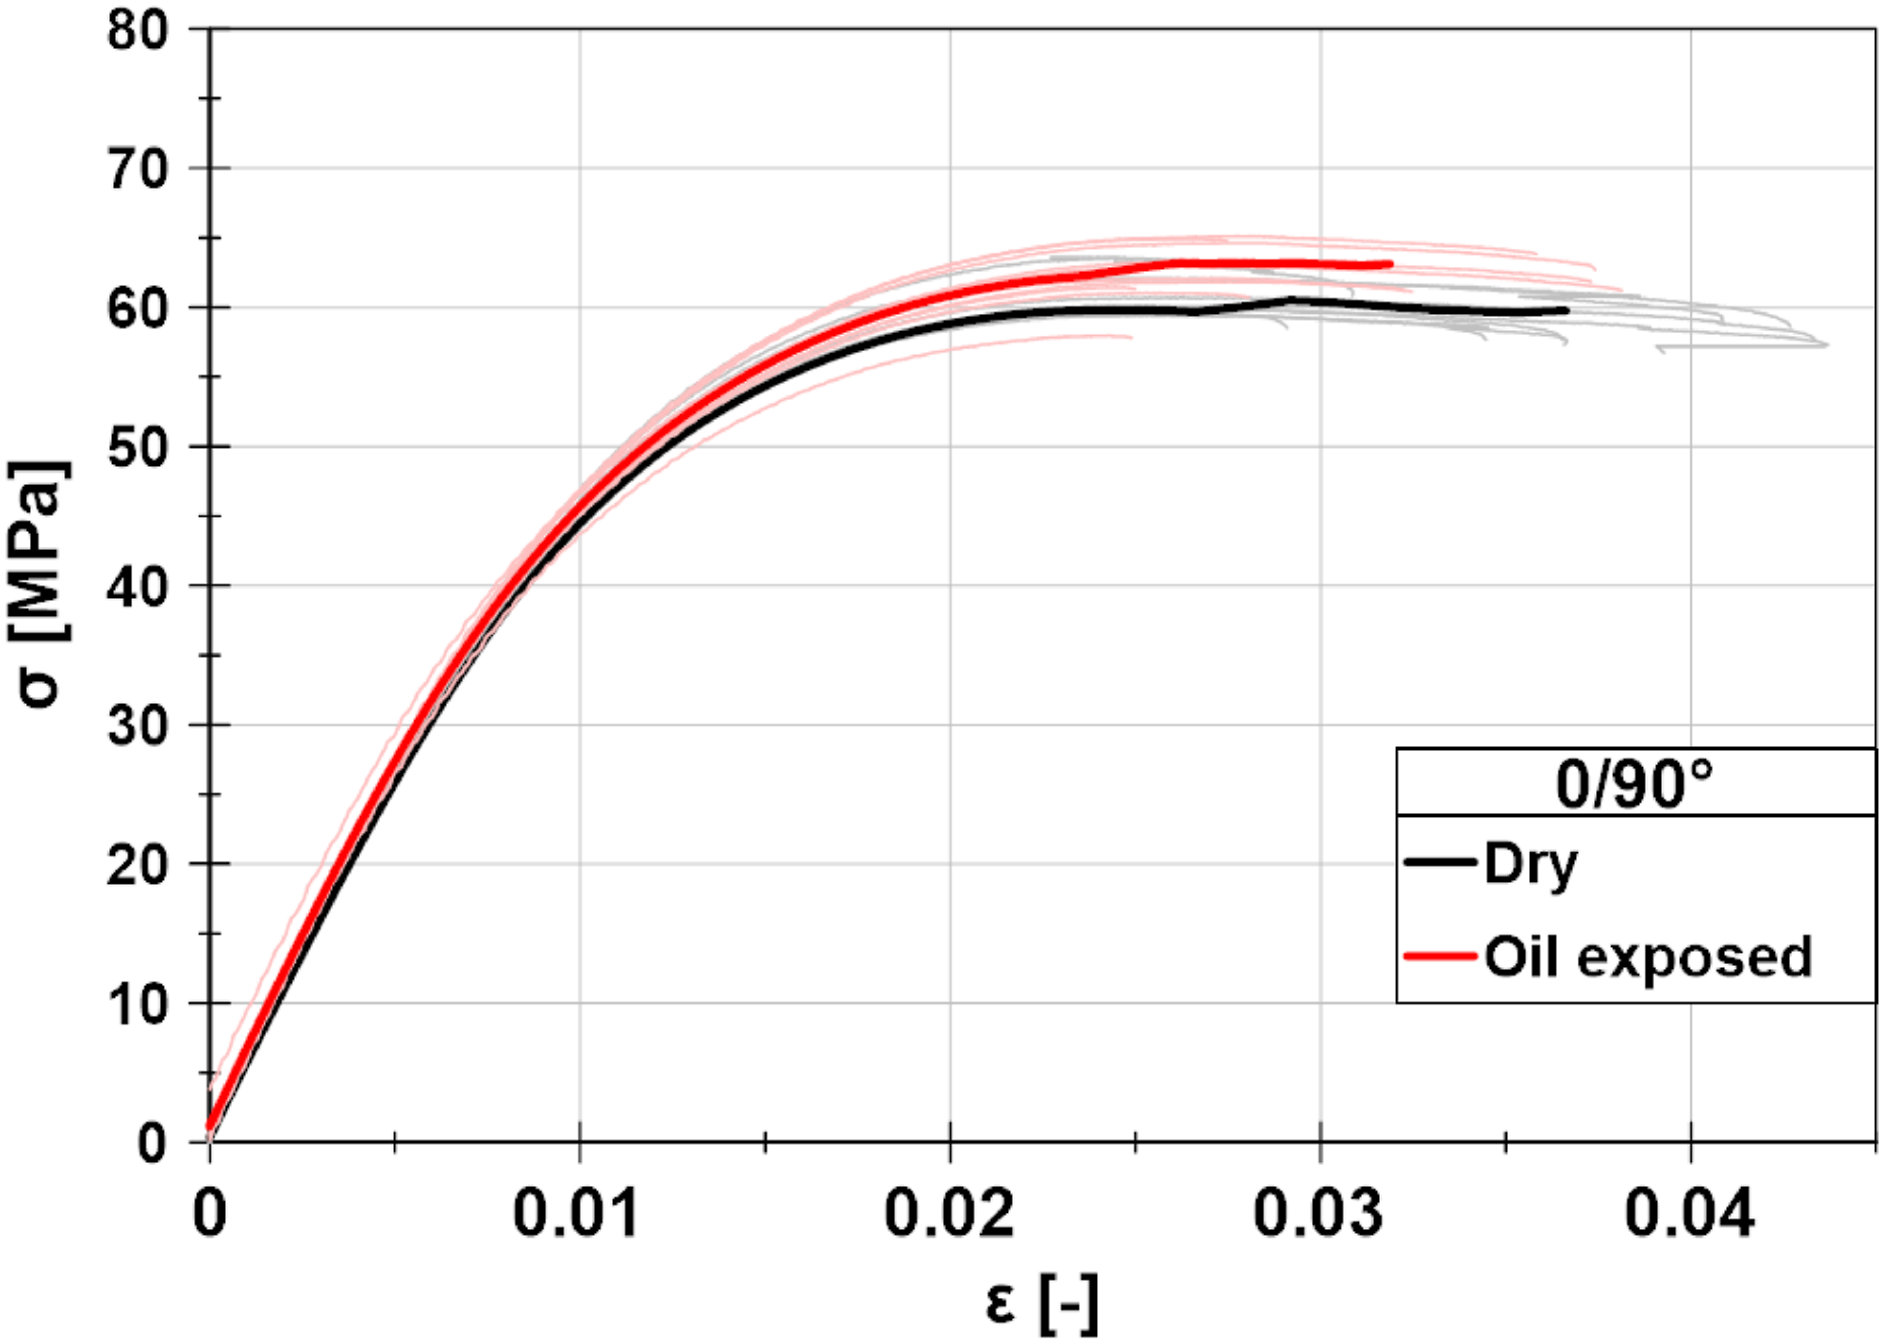
Graphs from all tensile tests are presented in Figures 11–15. The shaded lines represent unprocessed data from individual tests, while the solid black and red lines depict the average curves of dry and oil-exposed tests respectively. The average curves are truncated at the average strain value during failure. It’s visible from the graphs that ultimate tensile strength (UTS) rose again after oil exposure. This trend is observed for all orientations. Additionally, the average maximal strain decreased after oil exposure. Tensile tests - orientation 0°. Tensile tests - orientation 45°. Tensile tests - orientation 90°. Tensile tests - orientation ±45°. Tensle tests - orientation 0/90°.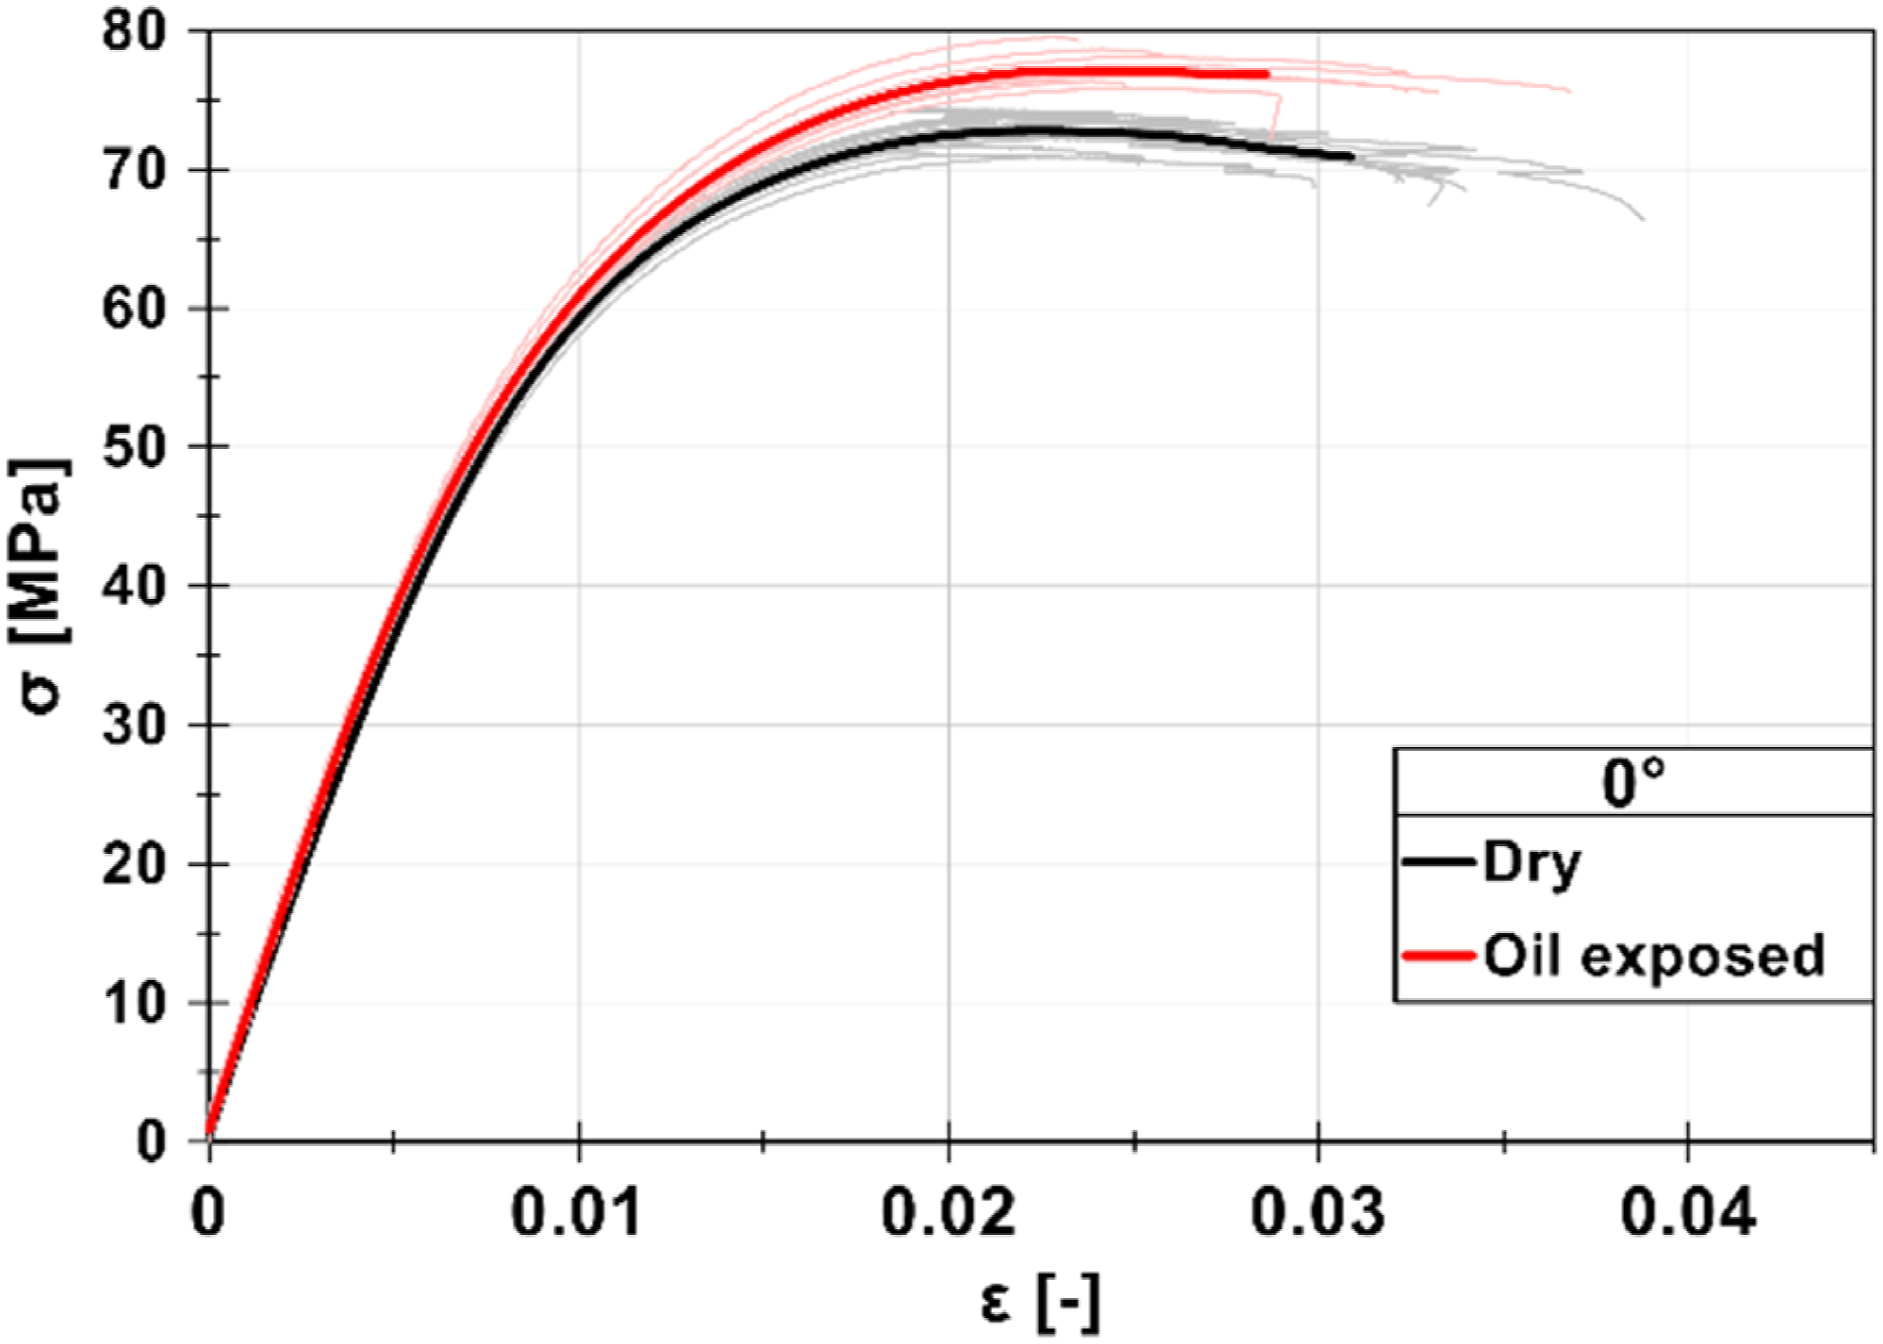
Detailed information on strength, Young’s moduli and maximal strain is provided in Figures 16–18 including boxplots that graphically show statistical values (median, interquartile range, and scatter). UTS values. Values of Young’s moduli. Max. strain values.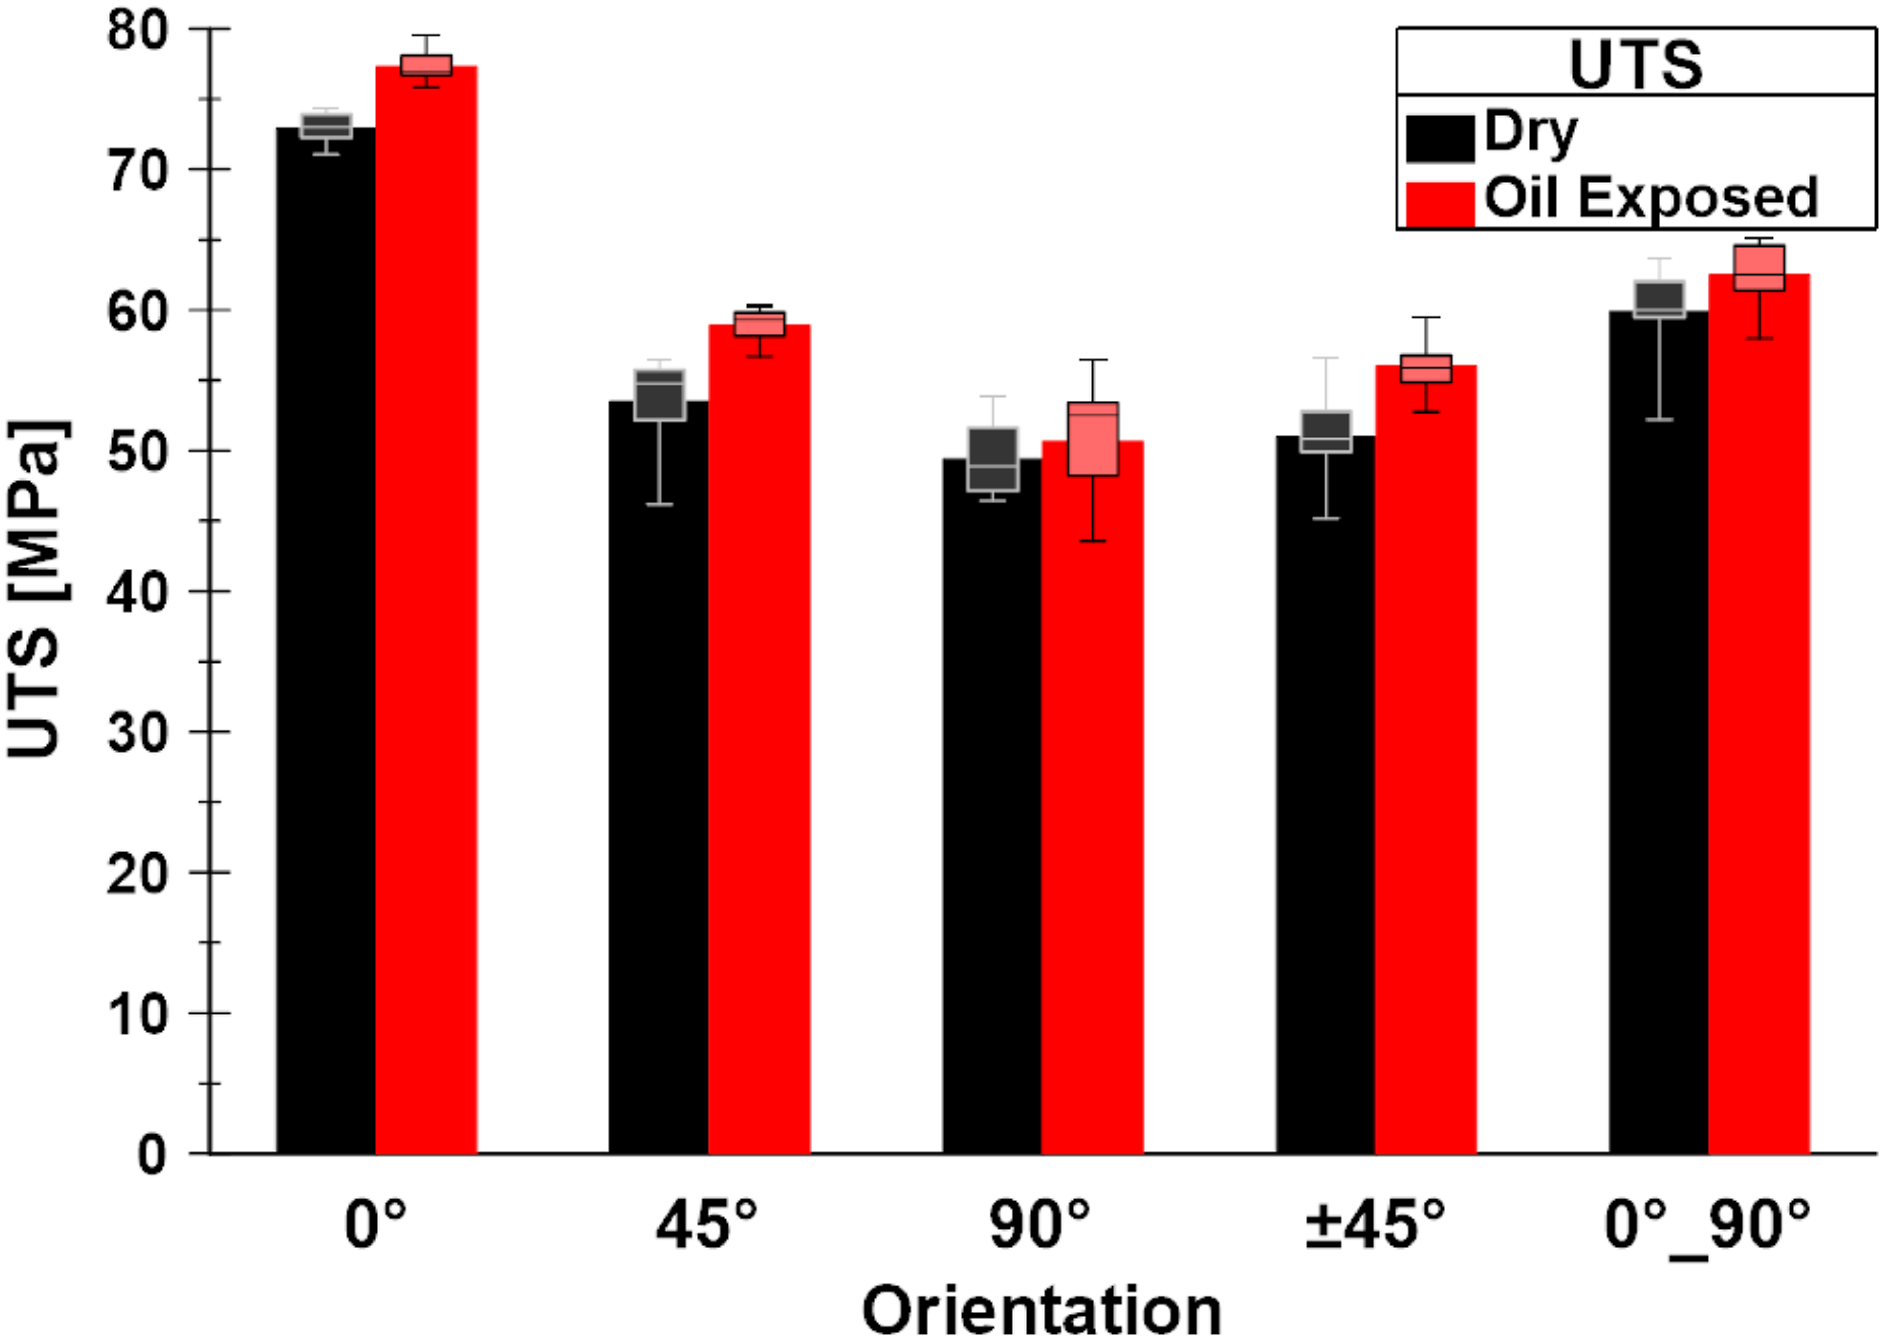
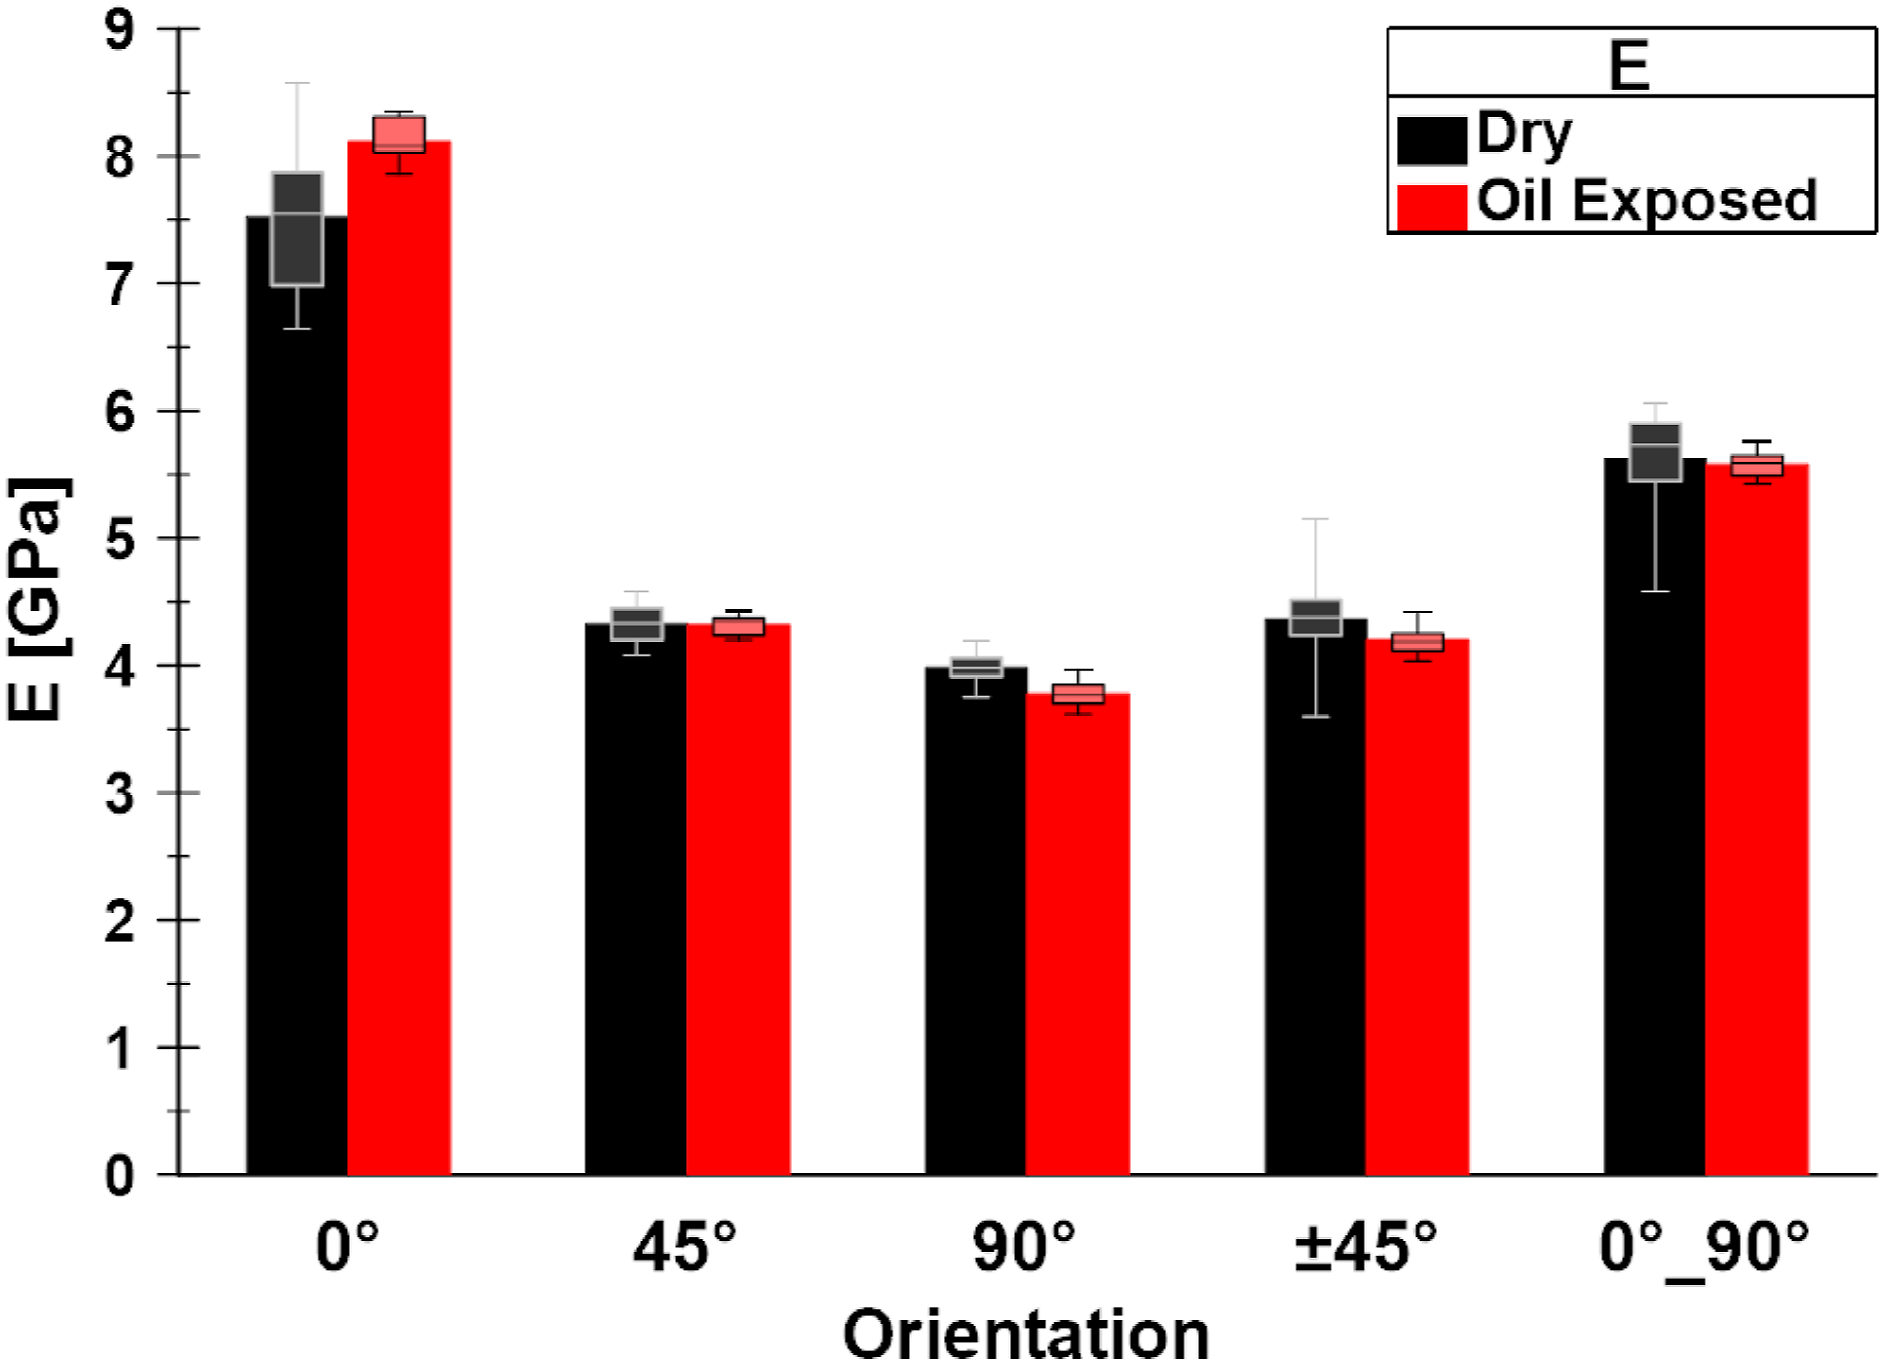
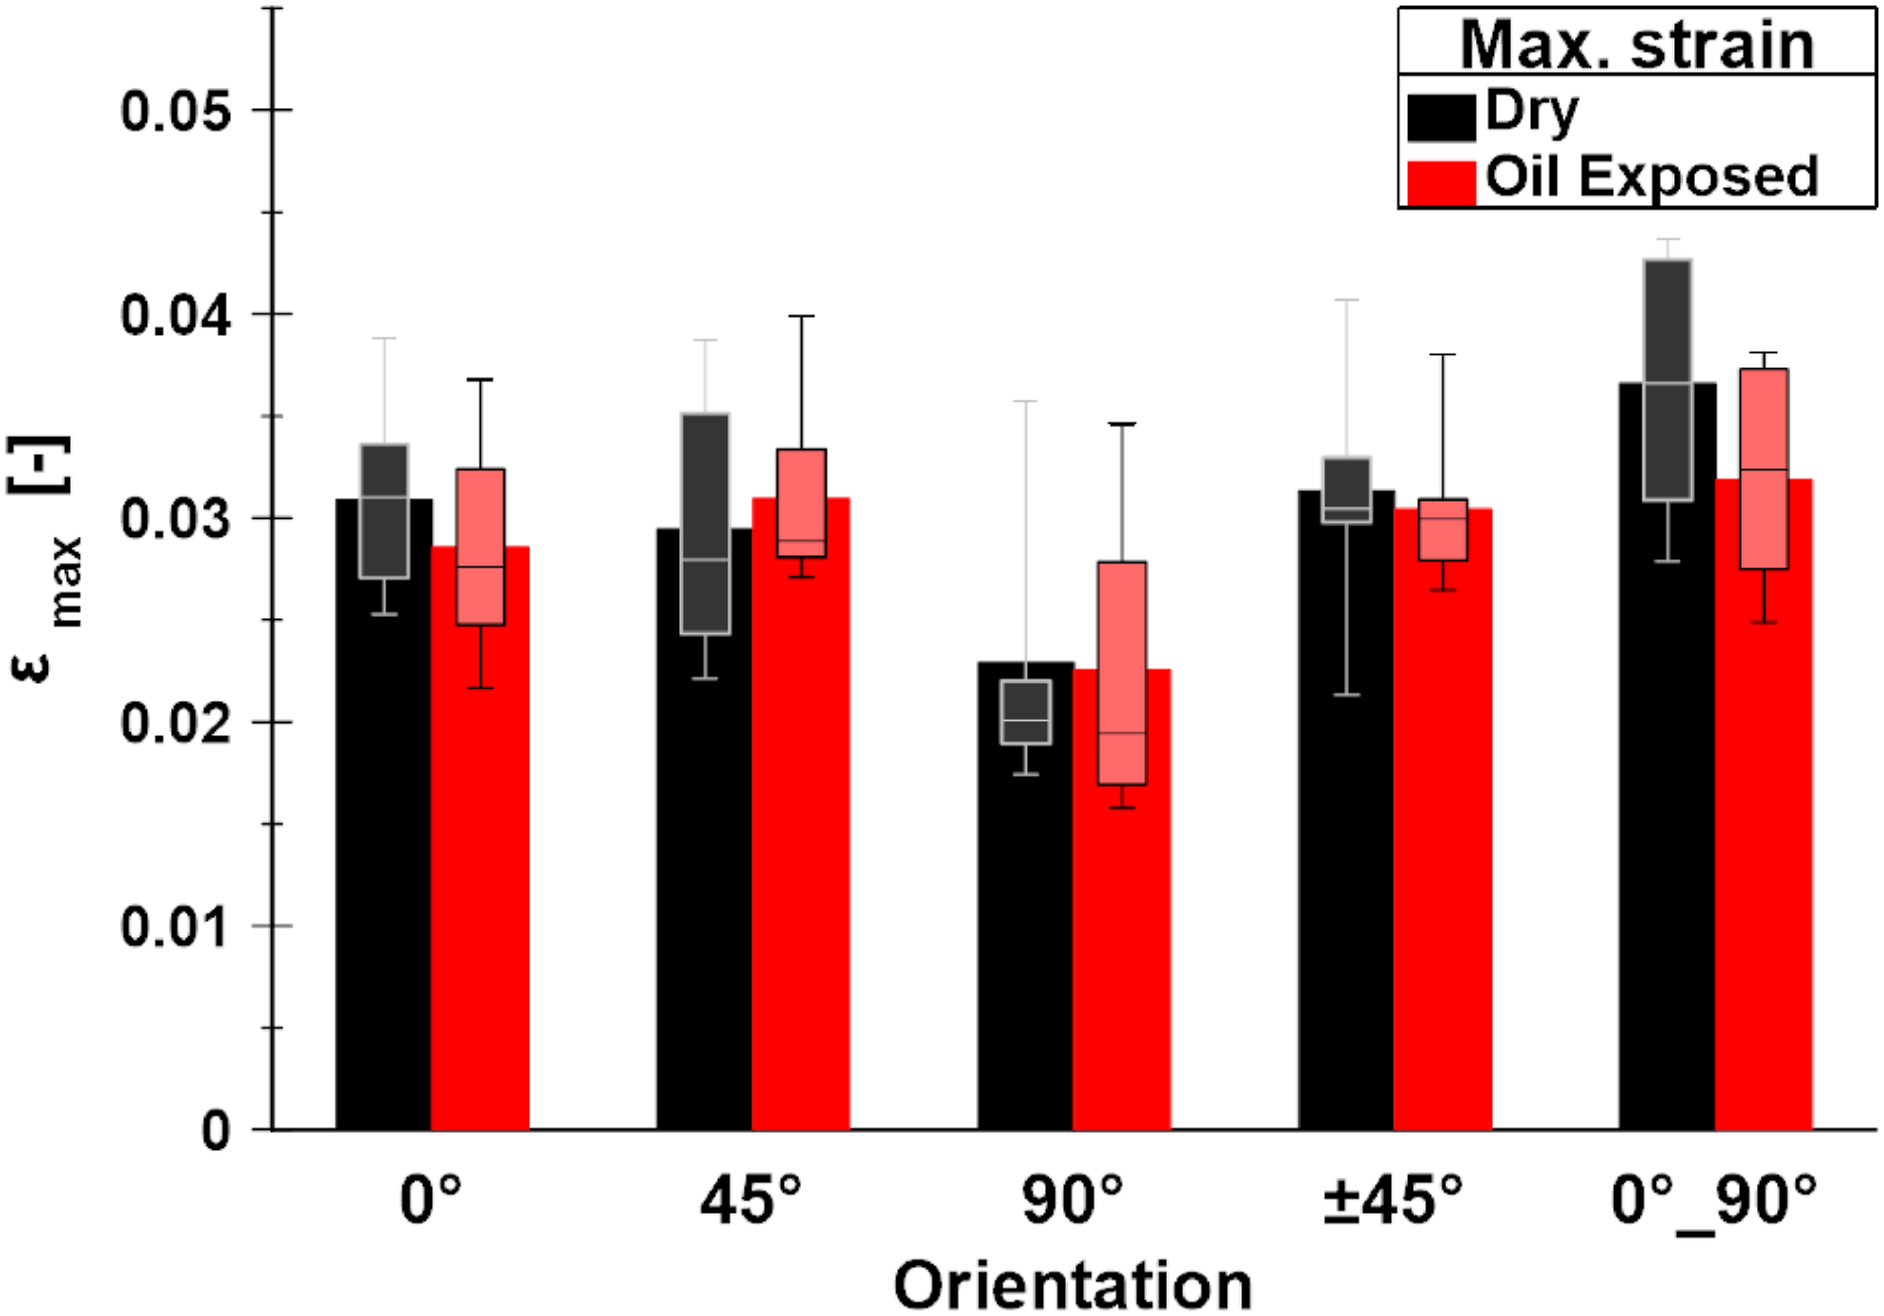
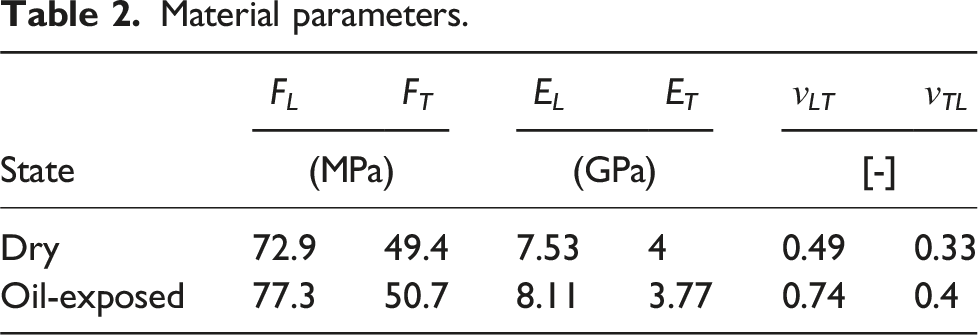
Statistical data confirm the conclusion on increased UTS and allow investigation into Young’s moduli data. The Young’s modulus in longitudinal direction E L (obtained from tests on 0° orientation) increases after oil exposure by 7.7%, while transversal Young’s modulus E T 90° orientation (obtained from tests on 90° orientation) slightly decreased by 5.3%. Maximal strain data exhibit a large scatter, making it challenging to draw any definitive conclusions as commonly achievable scatter is within 10% (e.g. in Ref. 36). The explanation to such wide scatter of values is partly due to the brittleness of the material (2%–3% average max. strain) causing that the interquartile range of displacement at rupture 0.6 mm in absolute terms means 22% variation in relative terms. And more importantly it’s due to the inherent property of the 3D printing technology which is limited repeatability. That can result in specimens with different porosity at different locations.
Material parameters.
An interesting finding comes from visualization of relationship between mass uptake of individual specimens and UTS value. This visualization is depicted in Figures 19–23. Each graph contains average value of UTS of dry specimens in respective orientation as a reference. The horizontal scale ranges from −0.2% to 1.2% so the data are comparable between all orientations. The negative values on the horizontal scale indicate mass loss. Relationship between mass uptake and UTS - orientation 0°. Relationship between mass uptake and UTS - orientation 45°. Relationship between mass uptake and UTS - orientation 90°. Relationship between mass uptake and UTS - orientation ±45°. Relationship between mass uptake and UTS - orientation 0/90°.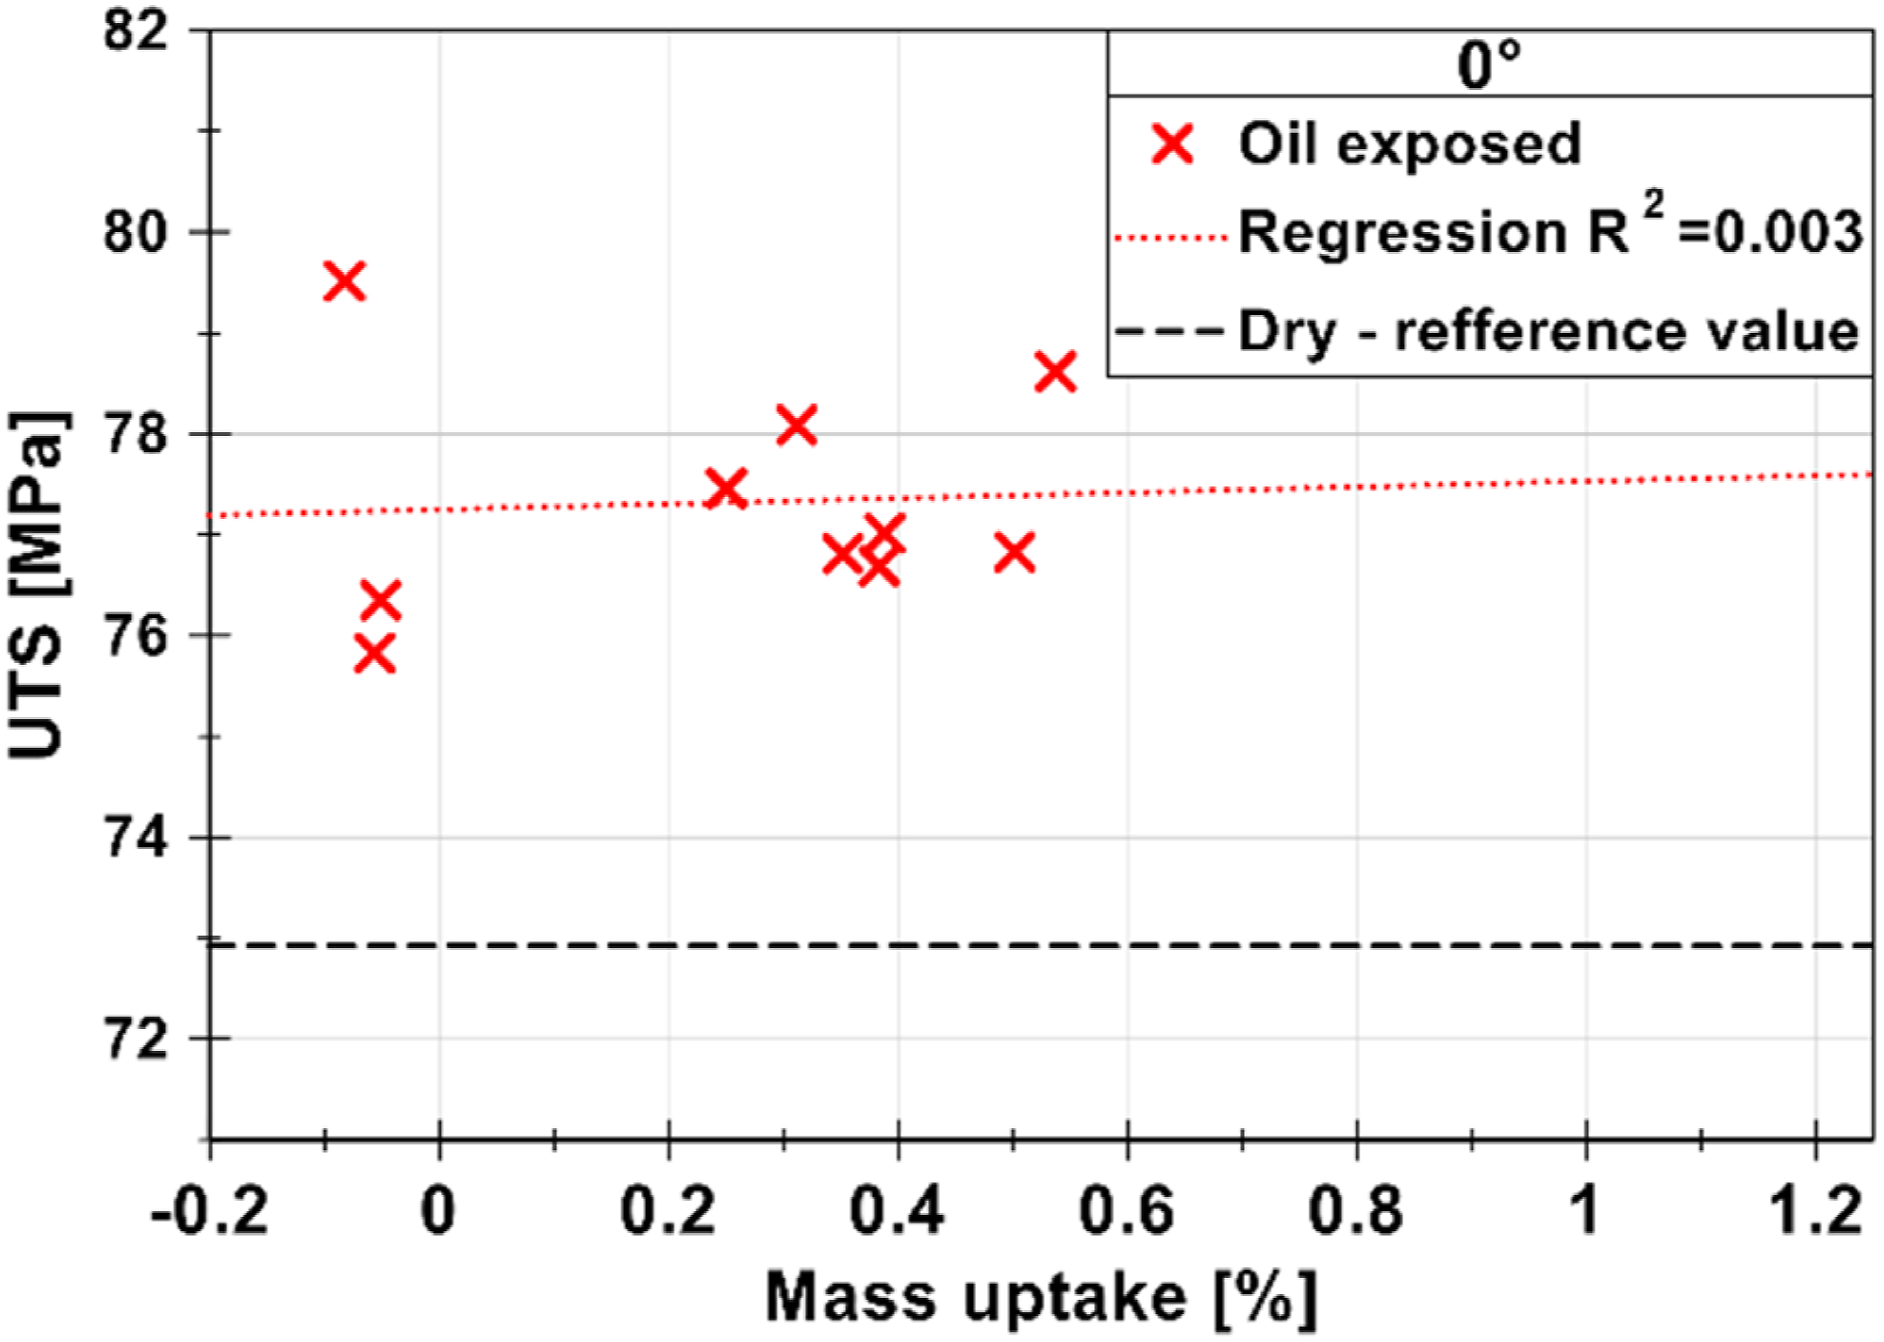
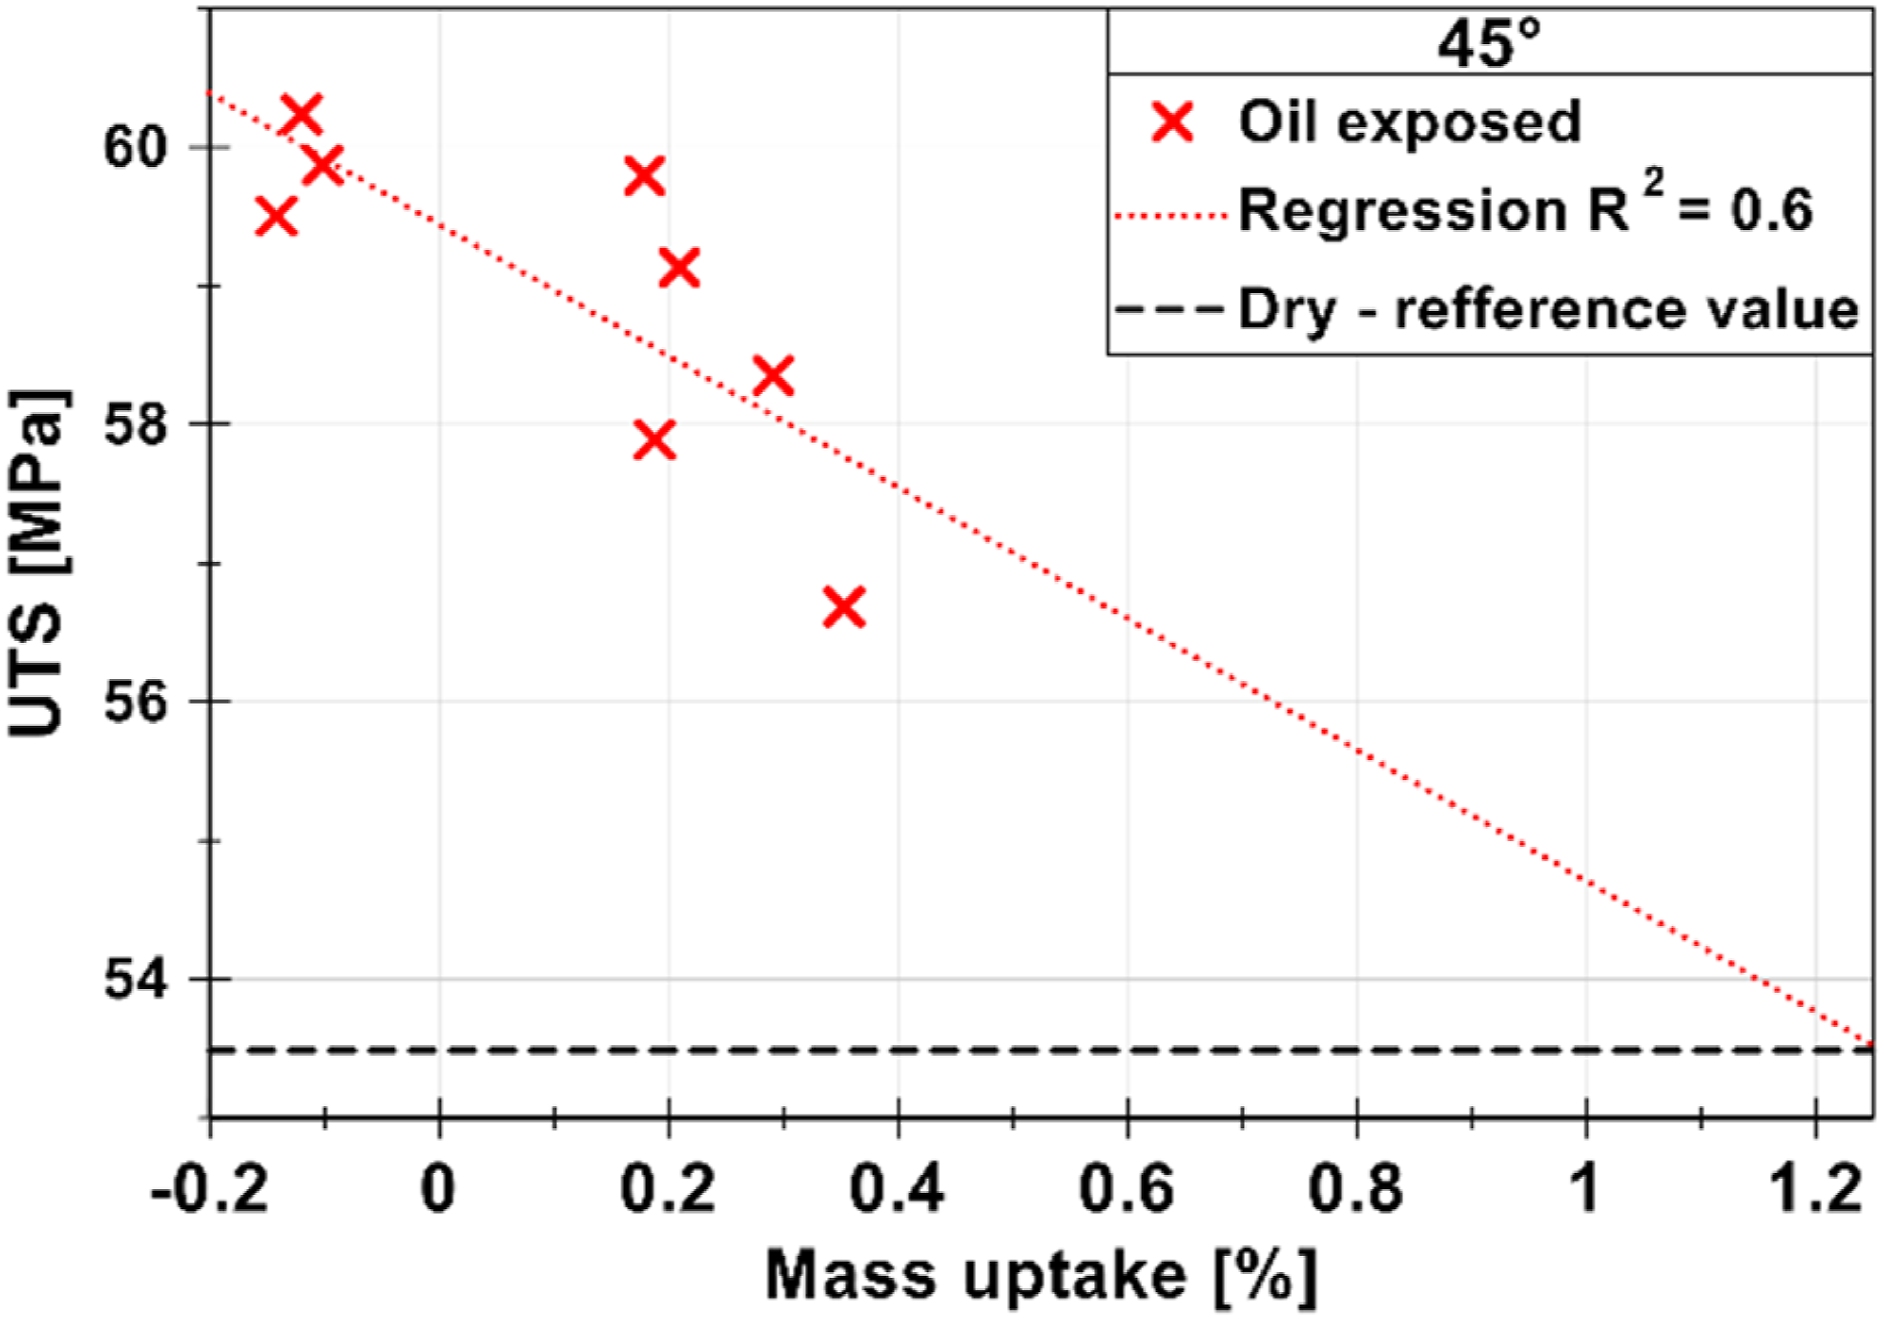
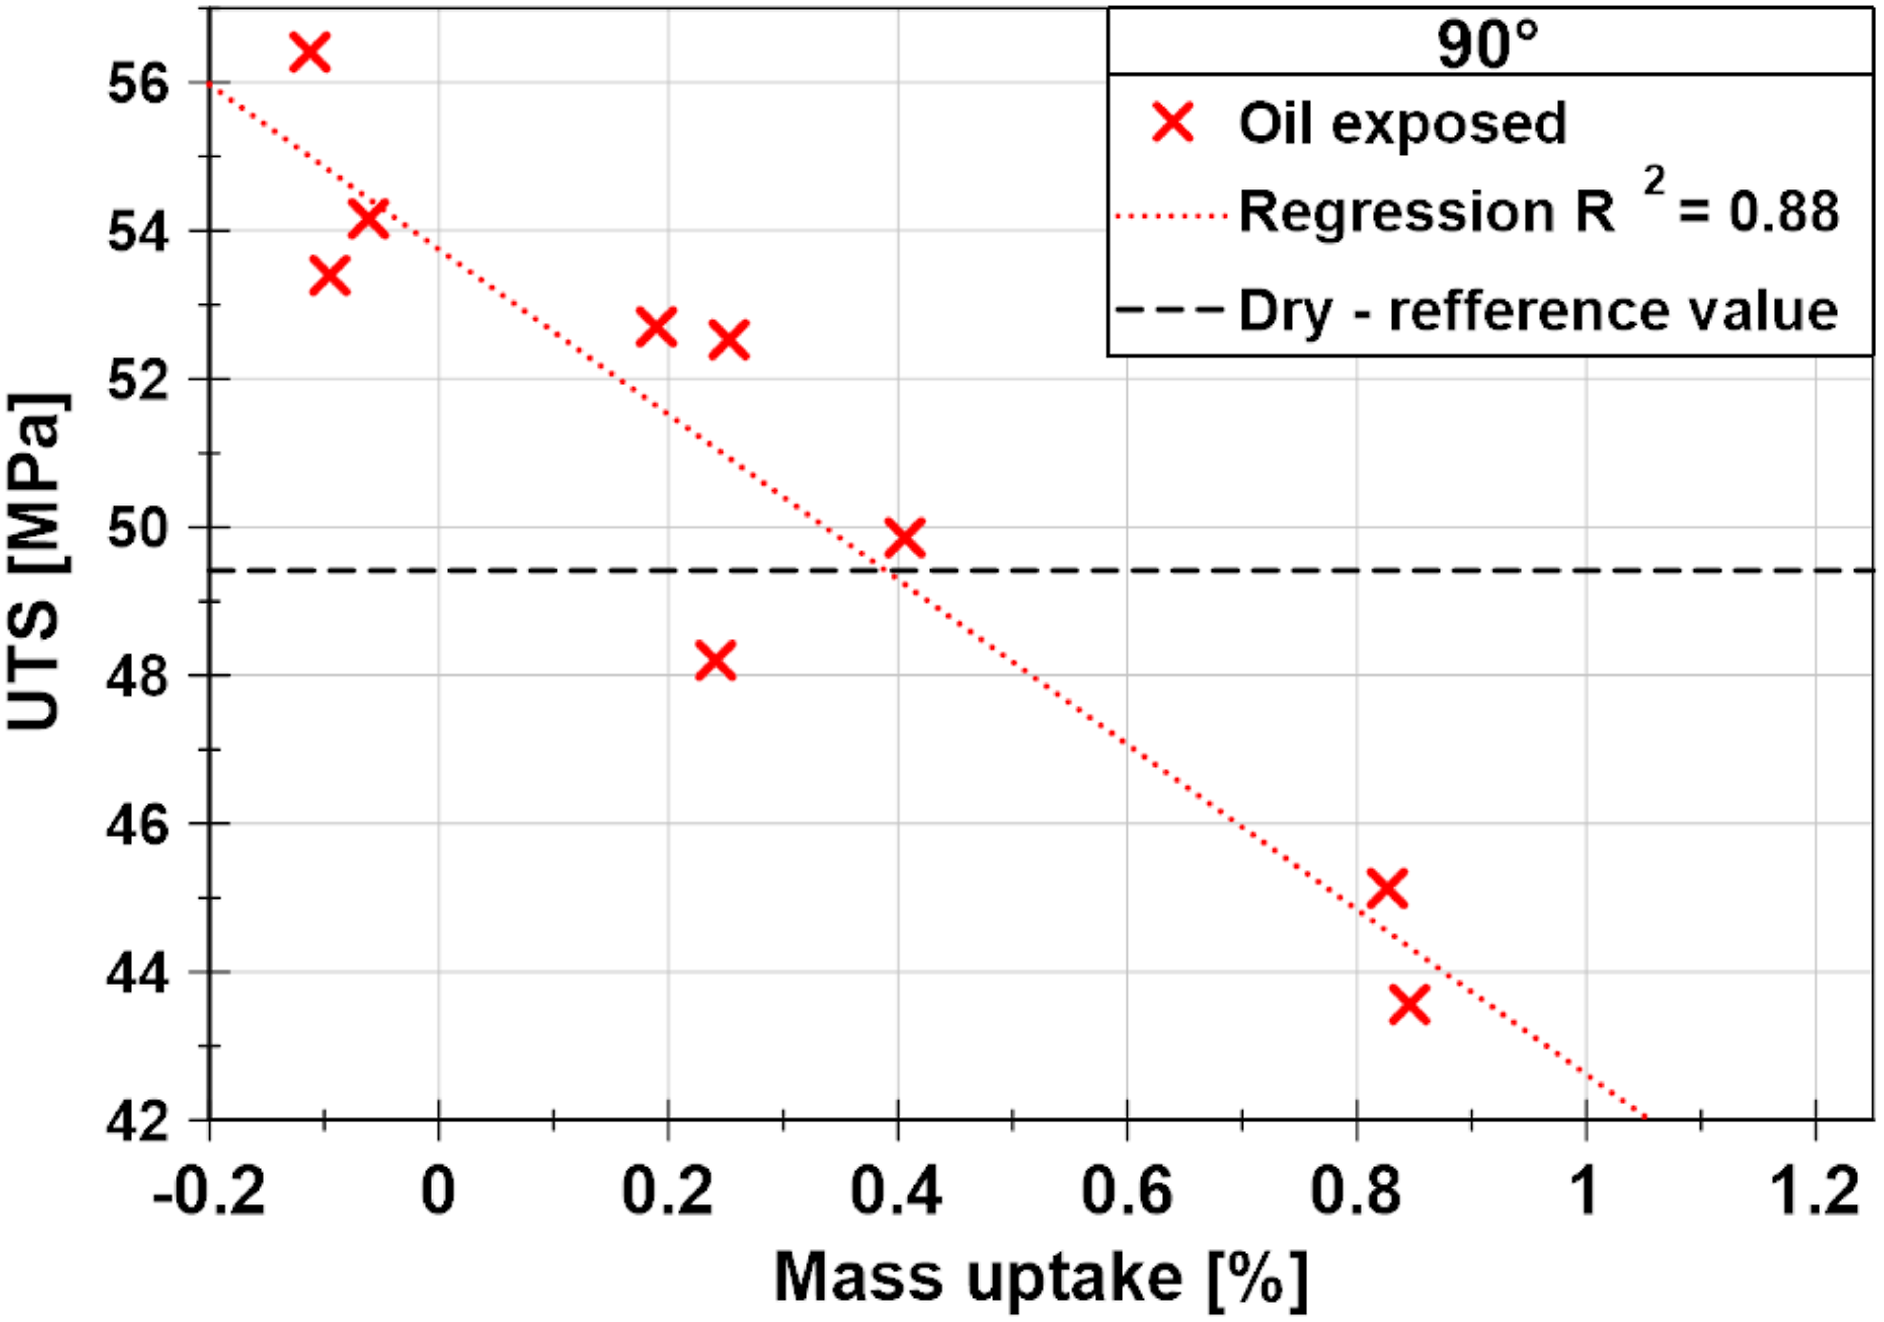
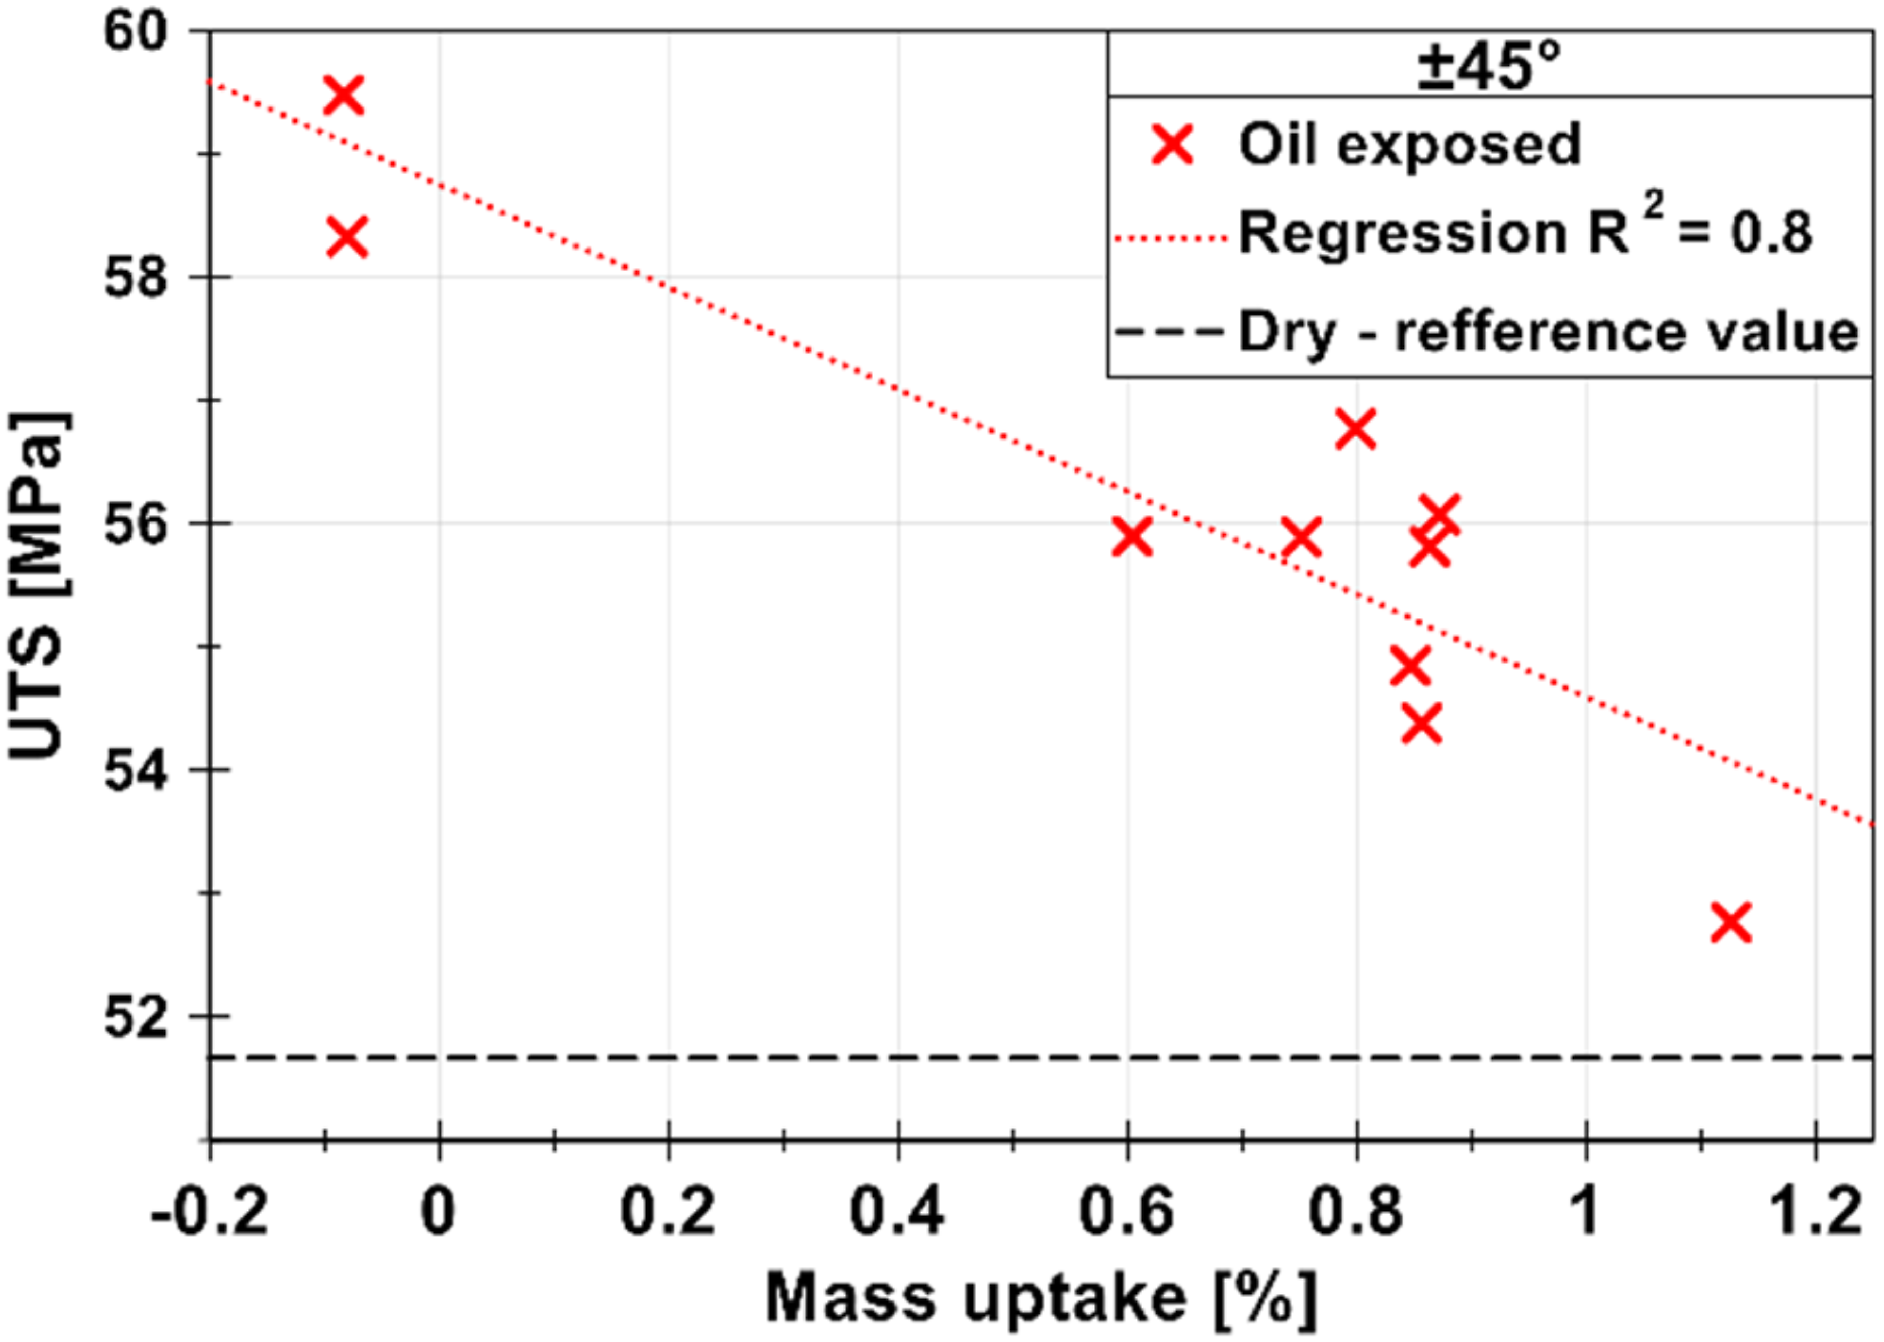
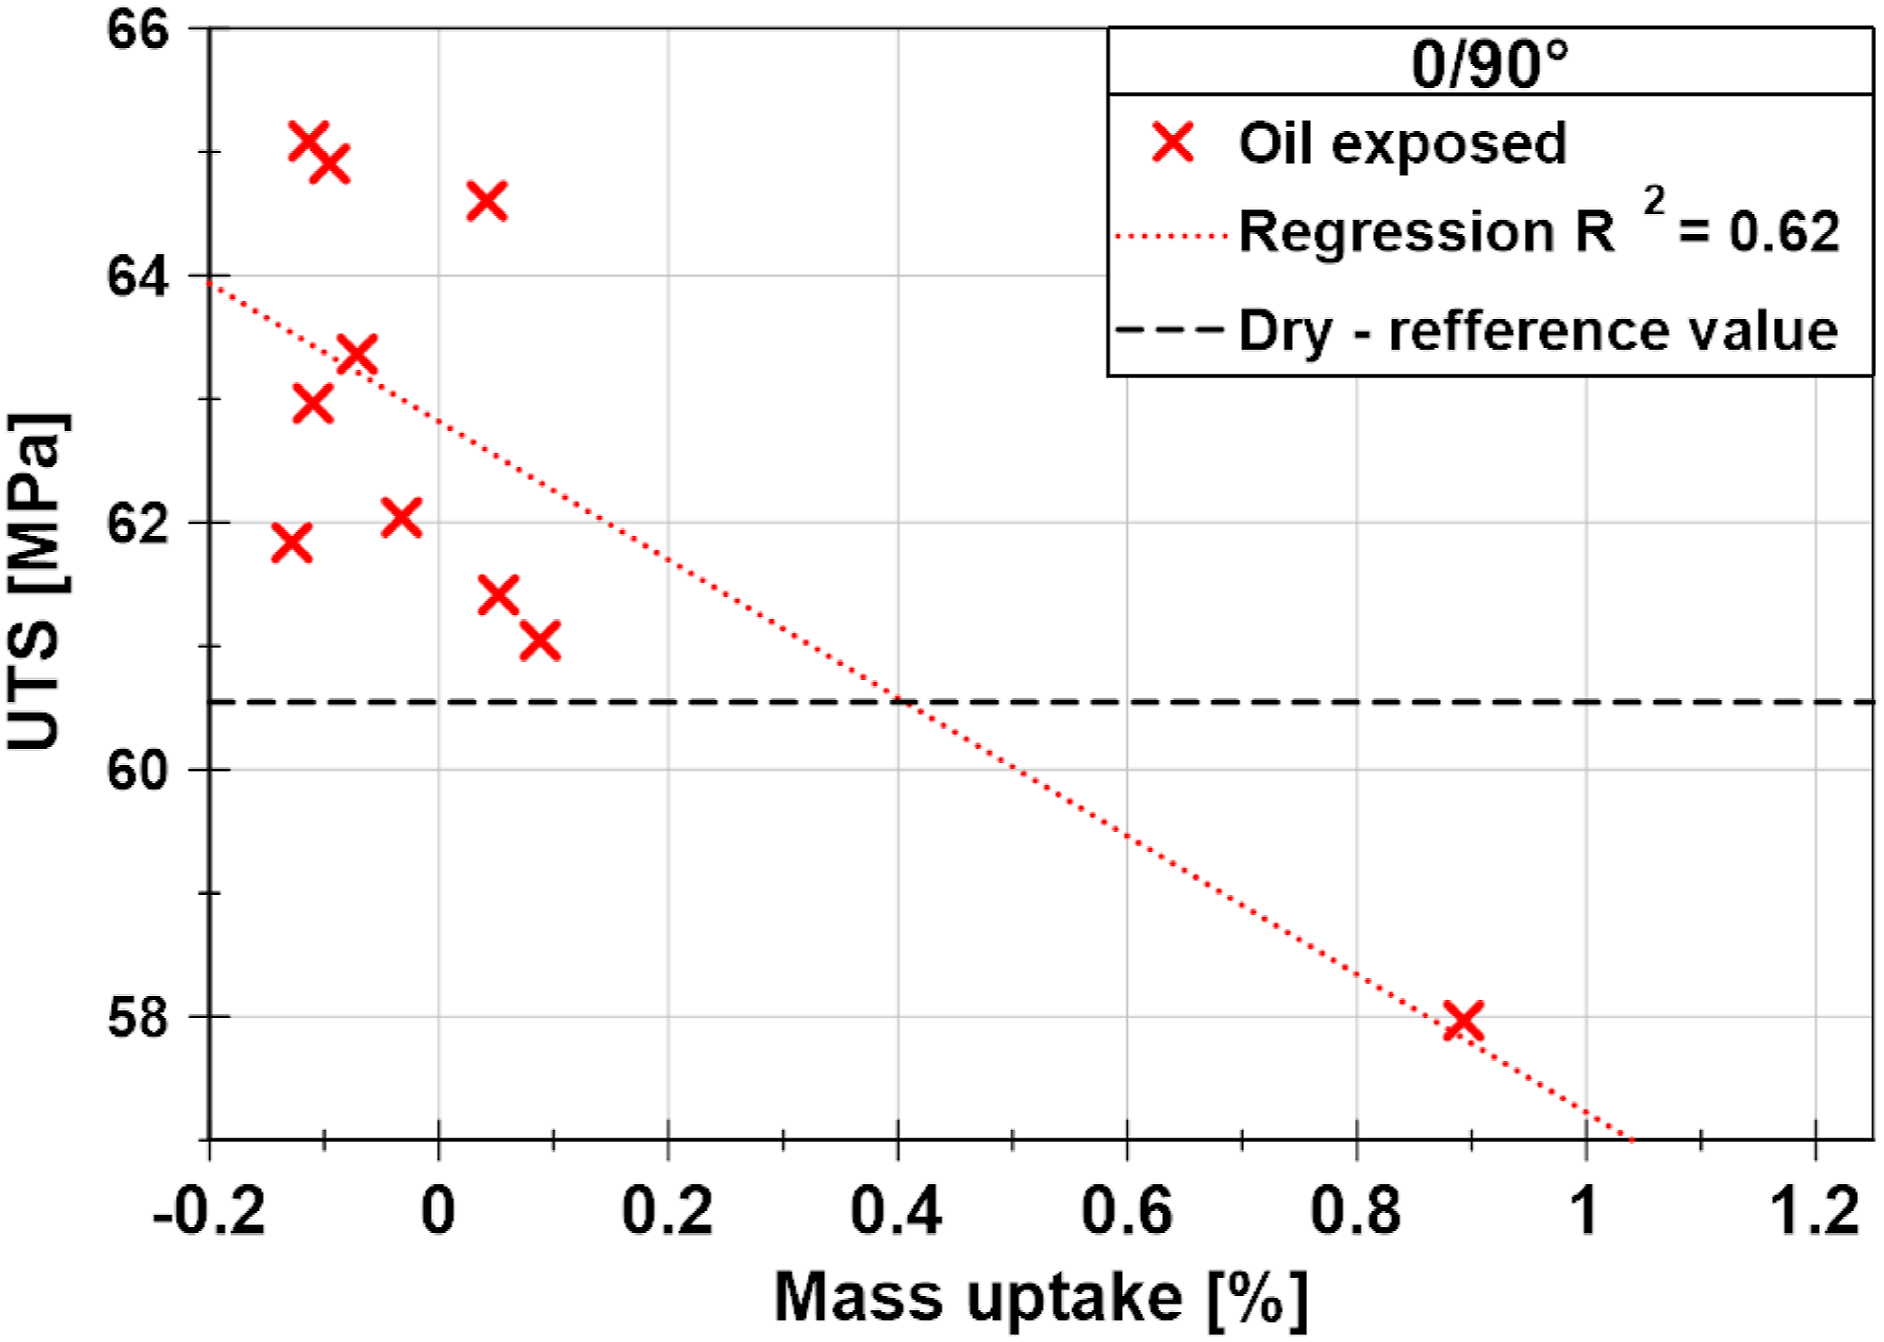
The data show that with exception of 0° orientation, increasing mass uptake results in decreased strength, while at the same time the overall values are still higher than those of the original untreated material. It does not necessarily imply an adverse effect of oil, it can simply mean that more porous material absorbs more oil, and the porosity causes lower strength.
The inconsistency of 0° orientation with the rest of the orientations should raise attention. According to previous studies on water such as Ref. 16; the liquid disrupts the interface between phases of the material. While the 0° orientation consists of 22 longitudinal traces in each of the 26 layers in the middle section, the 90° orientation consists of more than 150 transversal traces along which can the oil penetrate and resulting in much more interfaces between phases that are exposed to possible degradation.
It’s important to point out that specimens have ruptured in the middle section with a few exceptions in each batch that broke at the interface between the middle section and the radius connecting it to the end section (see example from one batch in Figure 24). However, it’s positive that the ruptures on the interface of sections don’t correspond with decreased UTS. For example, UTS of samples 9 and 10 in orientation 45° was 55.5 MPa and 56.4 MPa respectively, while the average UTS for the whole batch was 53.5 MPa. It’s also positive that the exact location of the rupture varies. Specimens after tensile tests.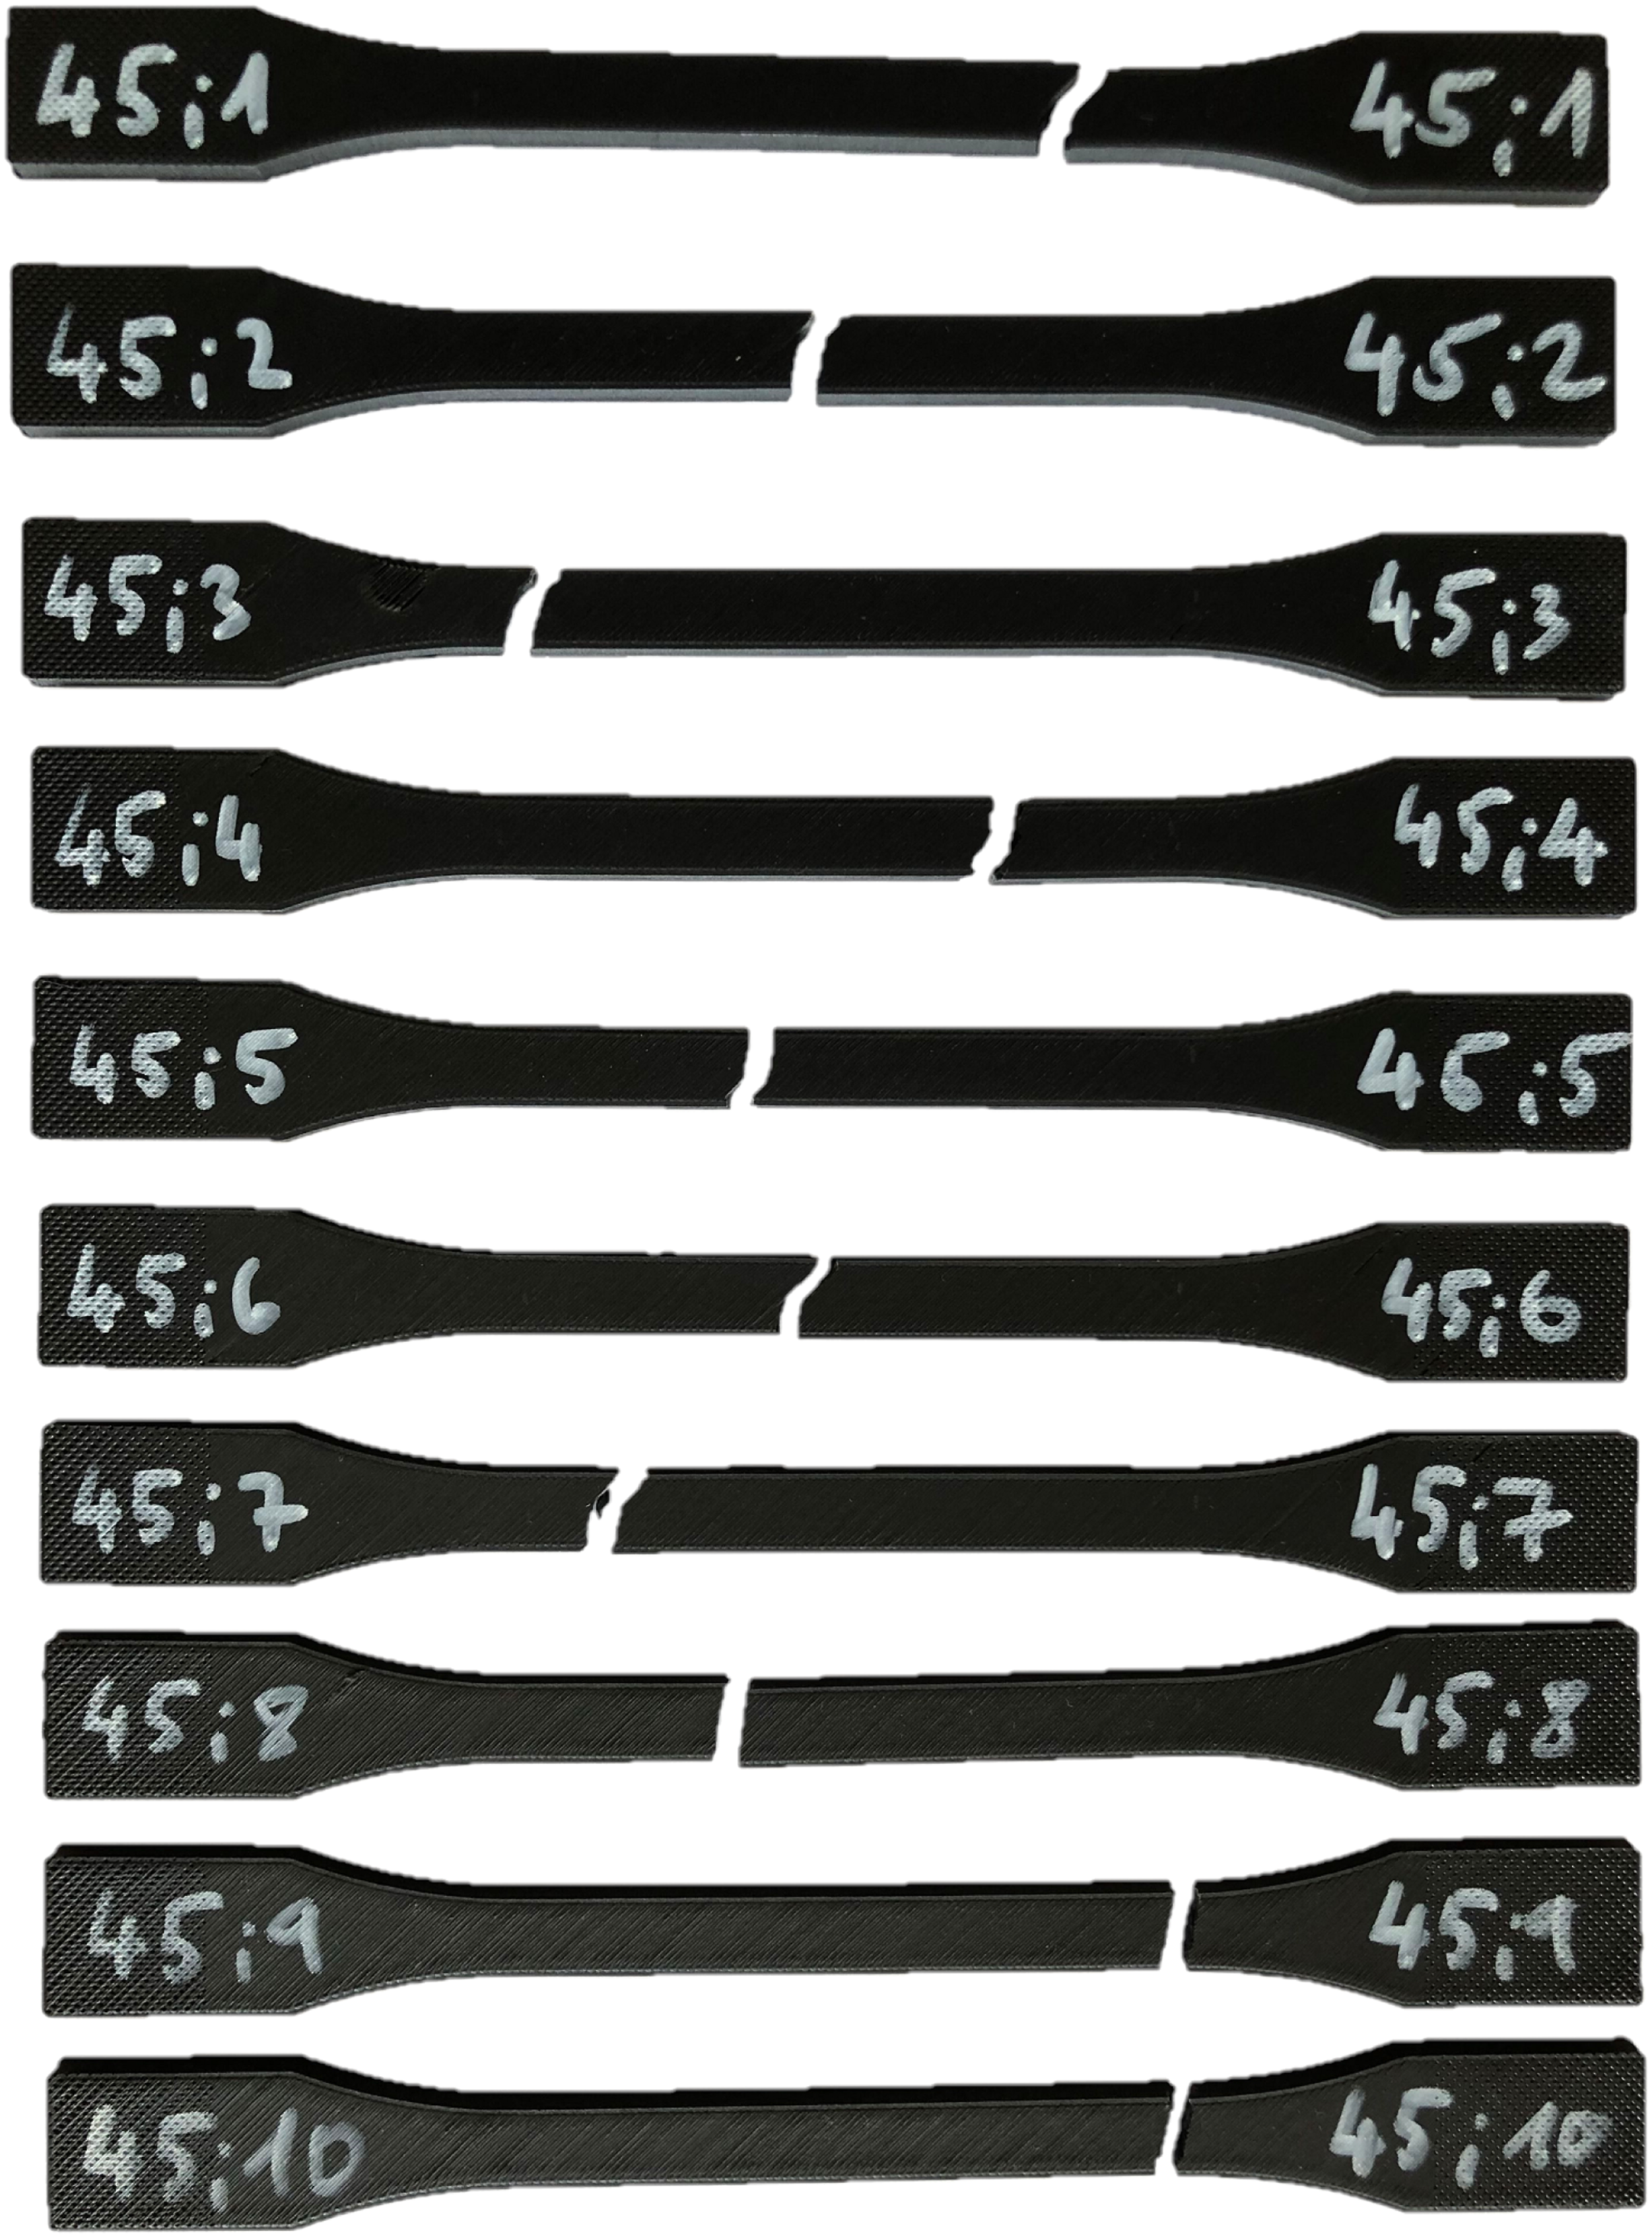
Statistical testing of distributions
Since the box plot, mean, and median results did not effectively reveal the differences in the tensile testing outcomes across various printing orientations, statistical testing of the distributions was chosen as a more objective evaluation method. The primary focus of this chapter is to determine whether there is a significant difference between dry and oil-submerged samples printed with various fiber orientations. First, all the distributions (E, UTS) were assessed to determine if they followed a normal (Gaussian) distribution, using the Shapiro-Wilk test (Distribution Analysis) with a significance level of α = 0.05. This part is following the approach that has been taken in Ref. 37
For comparing two independent specimens, a t test was conducted when both distributions were normal. However, if at least one distribution was not normal, the Mann-Whitney U-test was applied instead.
For example, the distribution of ultimate tensile strength for the specimen with a 45° fiber orientation in dry conditions (45°dry) followed a normal distribution, while the ultimate tensile strength for the specimen with the same fiber orientation but submerged in oil did not. This deviation from normality in the oil-submerged sample required the application of the Mann-Whitney U-test. A similar situation was observed for the 0/90° configuration concerning the ultimate tensile strength (UTS). In contrast, when examining the Young’s modulus of elasticity, the Shapiro-Wilk test indicated that the distributions for all datasets were normal.
According to this pipeline the significant differences considering the UTS were found between the configuration dry and submerged in oil for printing direction 0°, ±45° and 0/90° as for the 45° and 90° of printed orientation were found to be insignificant. Considering the E (Young modulus) the significant difference according to t test were found to be for 0° and 90°
Comparison of the distribution of UTS and E values between configurations submerged in oil and dry with respect to different fiber orientations.
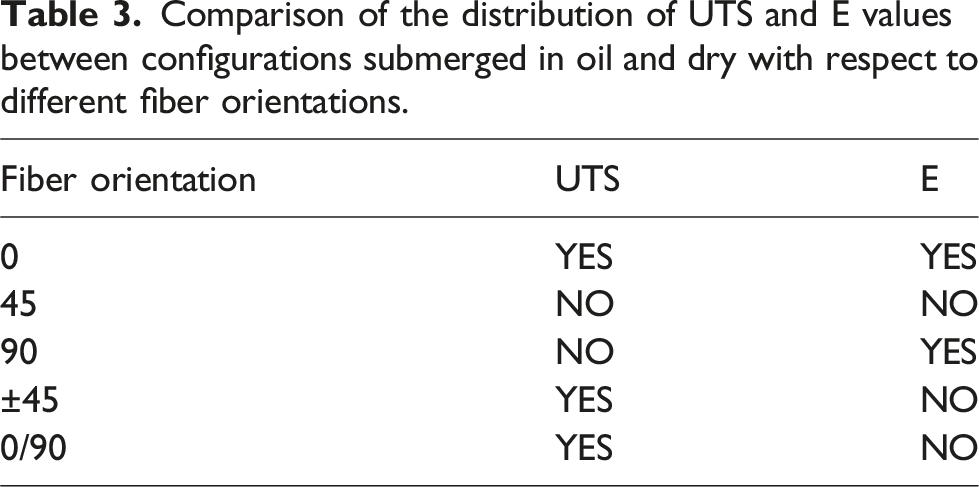
Regarding the Young’s modulus of elasticity, the significant differences align with what was observed in the box plot for the 0° configuration. Additionally, significant differences were also found for the 90° configuration, which is particularly noteworthy.
Differential scanning calorimetry
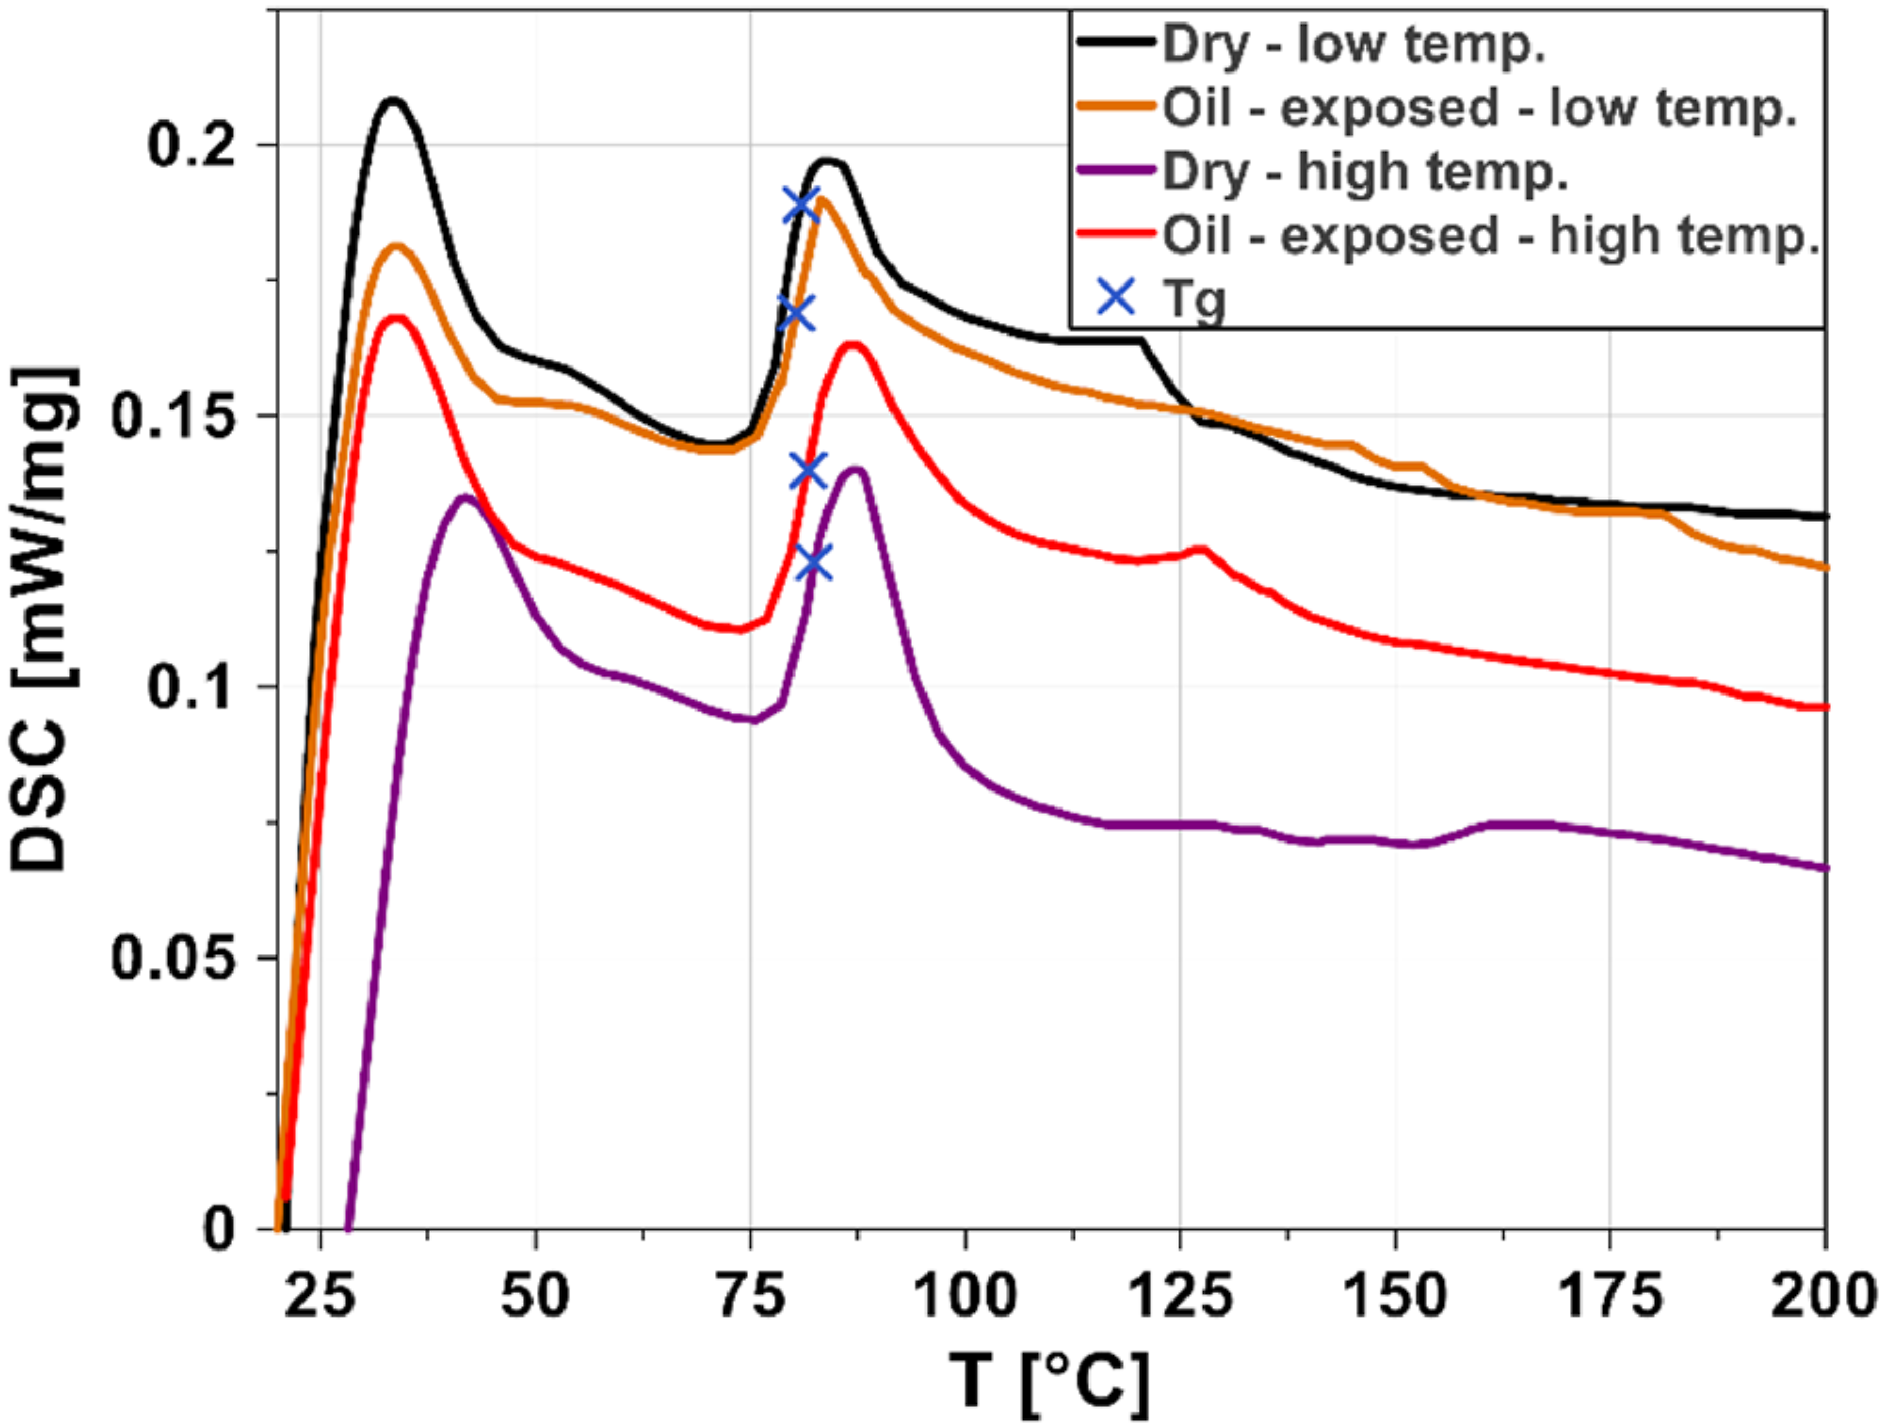
In response to the results of the tensile tests, a decision was made to test the hypothesis, that the increased mechanical properties were caused by annealing in hot environment for extended period of time that caused structural changes in the material rather than the exposure to oil alone. Differential scanning calorimetry (DSC) was employed for this investigation. Four states of the specimens were compared. Two previously mentioned in tensile testing: dry specimens that experienced only room temperature, and specimens that were exposed to oil at 60°C. Then, leftover specimens that were manufactured (but not used for tensile tests) were exposed to oil at room temperature and to temperature of 60° in dry state.
Figure 25 shows result from differential scanning calorimetry (DSC) that show practically no variance in T
g
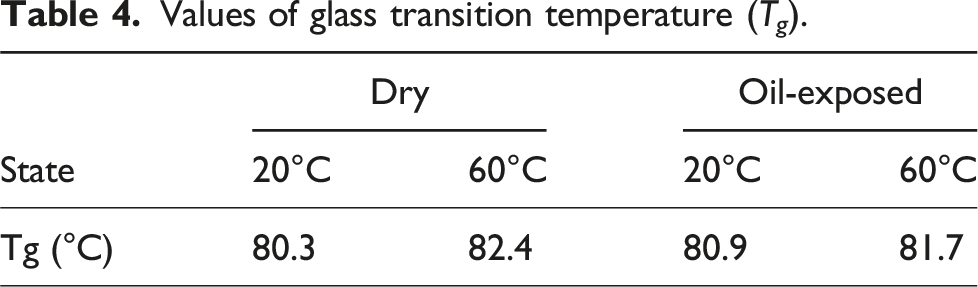
(only 2°C), and that the heat flow of thermally exposed specimens is lower. The values of T
g
are summarized in Table 4. Results from DSC. Values of glass transition temperature (T
g
).
Conclusion
The experiments on 3D printed short fiber CFRP material were initiated following the testing of filament wound specimens exposed to hot oil. In that prior investigation, it was surprising to find that the specimens exhibited mass loss during exposure, coupled with improved mechanical properties afterward. The goal of the experiment using 3D printed specimens was to validate this unexpected phenomenon, and indeed, similar results were observed. Mechanical properties (such as UTS and E), showcased improvement after exposure to 60°C oil. While fatigue tests were not conducted, the positive or neutral trends observed in other parameters provide a solid basis for anticipating a similar outcome in fatigue characteristics.
A mass uptake was recorded during oil exposure, but this behavior did not align with Fickian diffusion patterns. Yet, there was a correlation between higher mass uptake and lower UTS. However, even the reduced UTS values post-oil exposure remained higher than those of the reference unexposed material.
We can conclude that 3D printed short fiber material can be used in high temperature oil as operating environment, because the mechanical properties don’t degrade after oil exposure. The only limit with oil exposure is respecting glass transition temperature of given material (which in this particular case was 80°C) and keep the operating temperature safely below this limit.
Footnotes
Declaration of conflicting interests
The author(s) declared no potential conflicts of interest with respect to the research, authorship, and/or publication of this article.
Funding
The author(s) received no financial support for the research, authorship, and/or publication of this article.
Data availability statement
We have data from tensile tests and mass measurement. The data will be available on request.