
Abstract
The zinc oxide (ZnO)-grafted polymers have emerged as a prominent material for fabrication of 3D printed biosensor due to its inherent antibacterial, antifungal, room temperature ferromagnetic magnetic behaviour, crystallinity, high thermal conductivity and high exaction binding energy. In this study, ZnO (nanoparticles (NPs)) were grafted with polylactic acid (PLA) using twin-screw compounder for preparations of feedstock filaments. The filaments were prepared by varying input parameters of twin-screw compounder such as ZnO concentration in PLA (0–2%), forced loading (10–15 kg) and torque (0.1–0.2 Nm). Further tests were conducted for thermal properties (on differential scanning calorimetry set-up), mechanical properties (on ultimate tensile testing set-up, Shore D surface hardness, optical photomicrograph-based porosity analysis) and shape memory effect (with stimulus as water under different temperature conditions). The results of the study show that inducing 1% ZnO in PLA led to the formation of highly responsive composite with water as stimulus (at 25°C temperature), mechanically weak, porous, soft surface, while incorporation of 2% ZnO in PLA headed to less porous, harder and responsive composite to the water as stimulus (at 40°C temperature). The proposed combination of ZnO NPs and PLA shows encouraging range of crystallinity, tensile properties and shape memory effect, which made it an eligible candidate for 3D printing applications.
Introduction
Polymer composite has attracted attention of many researchers or analysts because of its wide application in medical, automotive, thermoelectric, aerospace, construction and many other fields.1,2 Among many types of fillers, metal oxide is one of the most prominent and usually utilized fillers. 3 Zinc oxide (ZnO) is a wide-band gap semiconductor of the II–VI semiconductor group with high refractive index, good magnetic properties, crystallinity, high thermal conductivity, binding, antibacterial and ultraviolet (UV) protection properties having emerging applications as medicine additives, electrode in liquid crystal displays, thin-film transistor and light-emitting diodes. The inherent antibacterial, antifungal and magnetic responsive properties of ZnO offer fabrication of 3D printed biosensors.4–6 Some studies have reported fabricated hierarchical structures based on ZnO, which include nanoparticles (NPs), nanorods (NRs) and nanoflowers with hydrothermal reaction. 7 The periodic structures of ZnO consisting of alternating layers with tetragonal symmetries fabricated by the extrusion of ZnO inks with a concentration of 48 vol%. The results indicated that 1500°C was an optimum sintering temperature to obtain high compressive strength up to 11.09 MPa. 8 The acrylonitrile butadiene styrene (ABS)-ZnO composites tensile strength increases when filler loading increases up to 11 wt%, which was successfully fabricated by using a 3D printer. Also it has been reported that dynamic storage modulus of conductive ABS-ZnO composite increases with the addition of ZnO filler, indicating stiffness enhancement of the composites. 9 The effect of ZnO and graphene that combines two Li+ accommodation sites, and the contribution of graphene pyramids, provides more available sites to favour lithium storage capacity. 10 The proposed ZnO modification reveals no significant change on the mechanical properties of zirconium dioxide (ZrO2) ceramics. Whereas the ceramics modified with ZnO exhibited significant change, that is, it exhibits higher antibacterial efficiency than pure ZrO2 ceramics. 11 The study reveals that increase in active surface area leads to enhancement of the photocatalytic performance of the microstructure array of Zn NRs. 12 The incorporation of pre-coated fillers and increase of infill density in case of printed ABS/ZnO composites led to the improvement of tensile strength, Young’s modulus and hardness of the composites. 13
The presence of magnesium oxide and ZnO in porous tricalcium phosphate (TCP) scaffolds increased the surface area of TCP from 1.18 ± 0.01 m2 g−1 to 2.65 ± 0.02 m2 g−1, the bulk density from 37.89 ± 0.83% to 50.82 ± 1.10% and the compressive strength from 17.94 ± 1.65 MPa to 27.46 ± 2.63 MPa. This also enhanced mechanical and biological properties, which are promising for orthopaedic applications. 14 Nanocomposite polystyrene filaments enriched with ZnO and titanium dioxide NPs highlighted that the fabricated 3D structures offer promising photocatalytic properties, reaching an efficiency of almost 70% after five cycles of reuse in 20 ppm of methylene. 15 Addition of dopants into TCP increased the average density of pure TCP from 90.8 ± 0.8% to 94.1 ± 1.6% and retarded the two-phase transformation at high sintering temperatures, which resulted in up to 2.5-fold increase in compressive strength. 16 Hydrothermal growth of novel nanocomposites is well suited for conductive printing applications. Time-dependent absorption, photoluminescence and photoconductivity measurements reveal that growth in high pH solutions promotes a better graphene dispersity, higher doping levels and enhanced bonding between the graphene and the ZnO NRs. 17 This study reveals that there is no significant effect on the mechanical properties of ZrO2 ceramics with ZnO modification, but the plate counting results show that ceramics modified with ZnO exhibited significantly higher antibacterial efficiency than pure ZrO2 ceramics, the ZrO2-ZnO ceramics had a significant killing effect of 8 h. 11 The mechanical and biological properties of the scaffolds were improved by doping of ZnO, that is, the fracture toughness increased from 1.09 MPa to 1.40 MPa, and the compressive strength increased from 3.01 MPa to 17.89 MPa when the content of ZnO increased from 0 wt% to 2.5 wt%. 18 Some studies were reported on the polylactic acid (PLA)-ZnO composite, which shows that higher crystallinity in the nanocomposite was induced both by the presence of ZnO nano fibers and by the 3D printing process. Also scanning electron microscopy (SEM) revealed that the fibres were dispersed throughout the nanocomposite. 19 The combinations of ZnO (2 wt%) and clove essential oil (25 wt%) improve the desirable film properties like elongation at break (EAB), optical, structural, thermal, barrier and microbiological properties.20,21 It has been reported that fabricated 3D structures offer promising photocatalytic properties, reaching an efficiency of almost 70% after five cycles of reuse in 20 ppm of methylene blue aqueous solution, under UV irradiation. 15 In an another study, super ink jet printing printed structures showed similar electrochemical behaviour to batteries composed of silver foil electrodes with the use of an aqueous electrolyte solution of potassium hydroxide with dissolved ZnO. 22 In the past two decades, 3D printing has given an edge in recent manufacturing which used various fillers for customized materials along with design flexibility in typical engineering applications.23,24 The fused deposition modelling (FDM) is one of the most economical 3D printing techniques which has given very successful results for the blending of fillers in a large variety of thermoplastic composites with enhanced thermal, mechanical, morphological and rheological properties along with greater design flexibility.25,26
The literature review reveals the studies on ZnO filler for various thermoplastics to improve optical, magnetic, antimicrobial, photocatalytic, crystallinity and thermal conductivity of composite materials. Some studies have also detailed the 3D printing of ZnO-grafted thermoplastics for the preparation of functional, non-functional, periodic and nanoporous structures for various applications. But hitherto little has been reported on ZnO-grafted PLA for the preparation of structures having four-dimensional (4D) properties using water as a stimulus. This study reports the synthesis of ZnO NPs by the co-precipitation method and twin-screw compounding for the preparation of ZnO-grafted PLA composites. In addition, thermal, mechanical and surface properties of PLA composites were reported to investigate the effect of water stimuli on shape memory effects.
Materials and methods
The experimentation is subdivided into two different phases, namely, synthesis of ZnO NPs by the co-precipitation method and twin-screw compounding for the preparation of ZnO-grafted PLA composites. The analytical approaches such as differential scanning calorimetry (DSC), ultimate tensile testing, surface hardness, SEM, Energy Dispersive X-Ray Analysis (EDAX) and effect of water stimulus on shape memory effects have been used to evaluate the performances of prepared compound.
Synthesis of ZnO NPs
ZnO NPs were synthesized by the co-precipitation method. Zinc acetate dehydrate (Zn(CH3COO)2·2H2O) and sodium hydroxide (NaOH) were used as raw materials. In this typical process, zinc acetate dehydrates (0.2 M) and NaOH (0.2 M) were dissolved separately in deionized water under continuous stirring to make a homogenous solution of desired concentration. NaOH solution was added drop wise in zinc acetate dehydrate solution to maintain the PH value at 8. The white colour precipitates begin to appear. The mixture was allowed to stirring for next half hour and the precipitates were collected using whatsman-40 filter paper. These precipitates were allowed to dry in air oven for 2 h at 600°C. This dried sample was crushed to get white powder and calcined at 3000°C in muffle furnace for 3 h to form ZnO NPs powder. Figure 1 shows the flow chart for sample synthesis. The details of chemical reaction involved in the synthesis of ZnO NPs are given as follows:
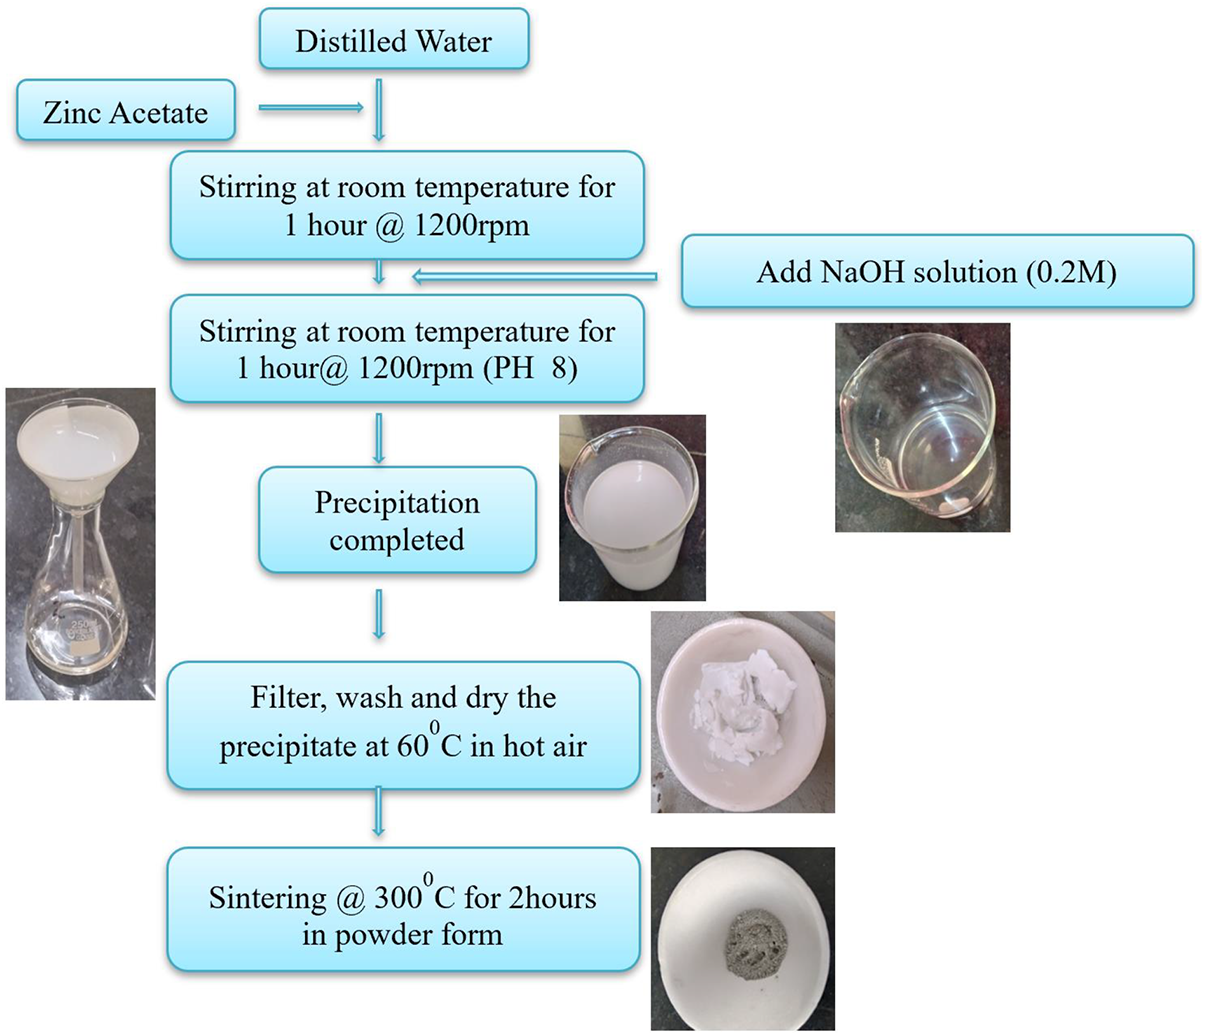
Procedure for synthesis of ZnO.


Structural property of prepared sample depends on the chemical reaction during the synthesis of ZnO NPs. The reaction mechanism can be explained in a two-step process.
4
First step involves the generation of a ZnO nuclei, and subsequent ZnO crystal growth. The first equation explains the conversion of zinc acetate into Zn(OH)2, which acts as the basic growth unit during the synthesis of ZnO. In second and third equations, Zn(OH)4 is coverted into
Preparation of ZnO-grafted PLA compound
In the next step, the ZnO NPs were mechanically blended with PLA grains using linseed oil for uniform particle dispersion. The composite was prepared by twin-screw extrusion process by varying the ZnO concentration in PLA (0–2%), loading (10–15 kg) and torque (0.1–0.2 Nm) at 170°C temperature. The design of experiment as per Taguchi L9 orthogonal array has been used for nine differently processed filaments. Figure 2 shows the preparation of ZnO-grafted PLA composite.
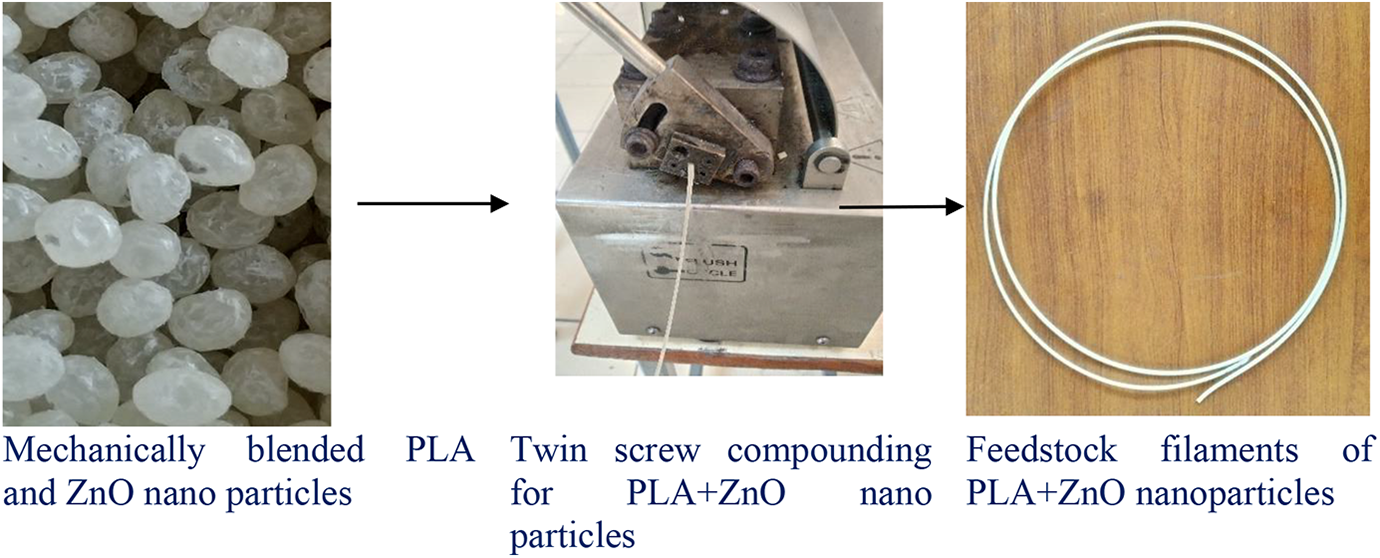
Preparation of ZnO-grafted PLA composite.
Experimentation
Differential scanning calorimetry (DSC)
The DSC set-up (Metller Toledo Private Limited, Powai, Mumbai, maximum temperature: 600°C) has been used for thermal analysis. The DSC of ZnO was performed under 30–500°C with inert atmosphere of N2 gas supply. The endothermic thermal reaction was maintained at 10°C min−1 and exothermic reaction at −10°C min−1. The DSC of ZnO samples before crystallization and after crystallization has been performed to validate the crystallinity into the ZnO NPs. Two thermal cycles of each sample were performed to ensure the stability in crystallinity of the samples. Similarly, DSC of virgin PLA, PLA + 1% ZnO and PLA + 2% ZnO have been performed under 30–220°C with inert atmosphere of N2 gas supply.
Compound preparations
Twin-screw compounder (ThemoFisher Scientific, Waltham, MA USA, maximum temperature: 300°C) has been used for feedstock filament preparation. The feedstock filament has been prepared by varying the ZnO concentration in PLA (0%, 1% and 2%), applied load (10.0, 12.5 and 15 kg) and torque (0.10, 0.15 and 0.20 Nm). The Taguchi L9 orthogonal array has been used as a design of experiment for the preparation of feedstock filaments. The barrel temperature was maintained at 170°C. Table 1 gives the design of experiment based upon Taguchi L9 orthogonal array.
Design of experiment for filament preparations.
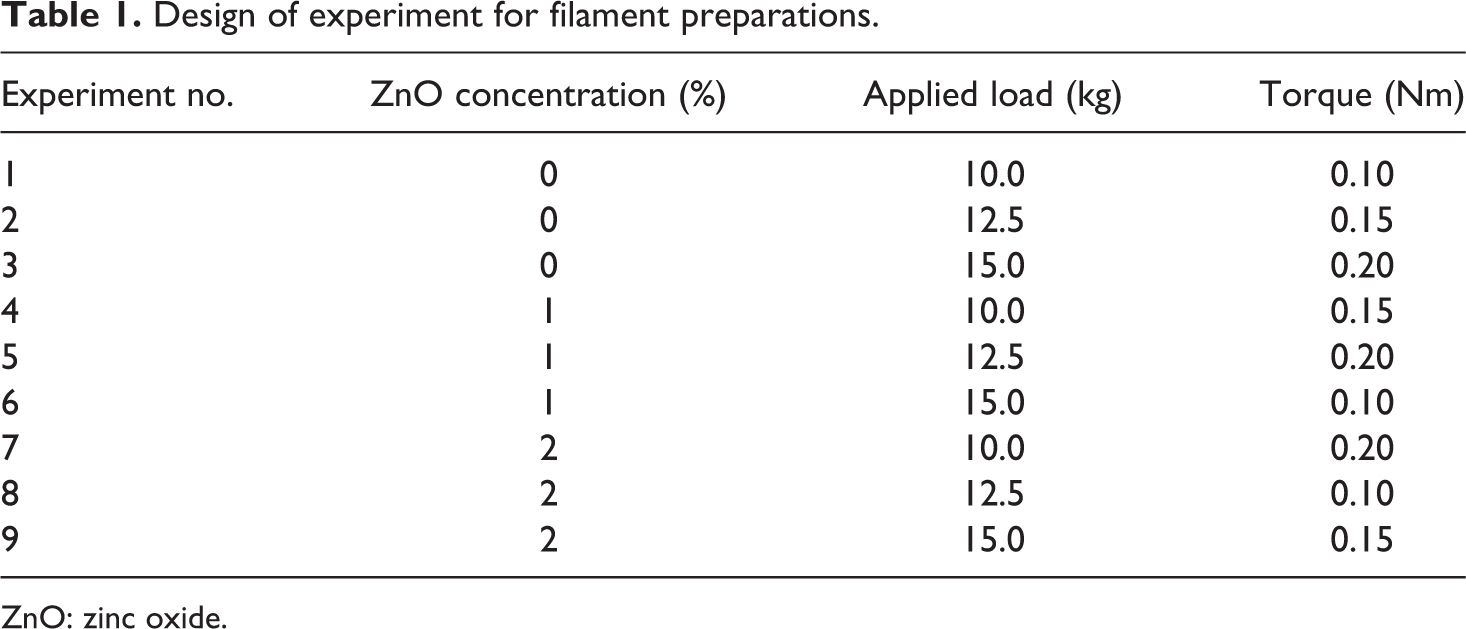
ZnO: zinc oxide.
Tensile testing
Universal tensile tester (Shanta Engineering, Pune, India, maximum capacity: 5000 N) has been used to measure the ultimate tensile strength, fracture tensile strength, percentage elongation at peak and percentage EAB. The cylindrical filaments were used for tensile testing with grip separation of 50 mm and strain rate of 50 mm min−1.
Morphological analysis
A SEM (Jeol, New Delhi, India, model: JSM-IT500) has been used to observe the fracture behaviour of the feedstock filaments. The SEM observations were taken at ×50, ×200, ×800 magnifications, 15 V power supply and vacuum mode: high vacuum. Furthermore, EDAX analysis has been made to check the mass fraction of the element present in the final compound.
Shore D hardness test
A portable Shore D durometer (Bloomerang, Dongguan, Guangdong, China) has been used to check the surface hardness. A filament holder prepared by 3D printing has been used for hardness testing.
4D shape memory effect
For investigating the effect of water stimuli on the shape memory effect, samples were exposed for 5 h in water media: (i) water at normal atmospheric temperature, that is, 25°C and (ii) water at 40°C temperature. On three different time instances, the dimensions of the feedstock filaments were measured, first before immersion in the water stimuli, second after 5 h immersion to water stimuli and third after 5 h drying to normal atmospheric temperature.
X-ray diffraction
The proper phase formation of synthesized samples using D8 DISCOVER powder X-ray diffractometer (Bruker Corporation, New Delhi, India) with Cu Kα radiation (λ = 1.54 Å) at 40 kV and 25 A has been confirmed. The diffraction patterns were recorded over the range 20 ≤ 2θ ≤ 80 with a step size of 0.3°.
Results and discussion
The analysis has been made based upon the results obtained from recrystallization of ZnO NPs, effect of ZnO on crystallinity PLA matrix, effect of ZnO and compounding parameters on mechanical and morphological properties of PLA composite filaments.
Thermal analysis
Figure 3 shows the thermogram of ZnO NPs before and after crystallization. It has been observed during endothermic reaction that ZnO NP before crystallization induced heat in itself shows the sign of non-crystallinity, since no upward peak was observed. But on the other hand, sample of ZnO after crystallization emitted heat and an upward peak was observed shows the presence of crystallinity in the ZnO NPs.
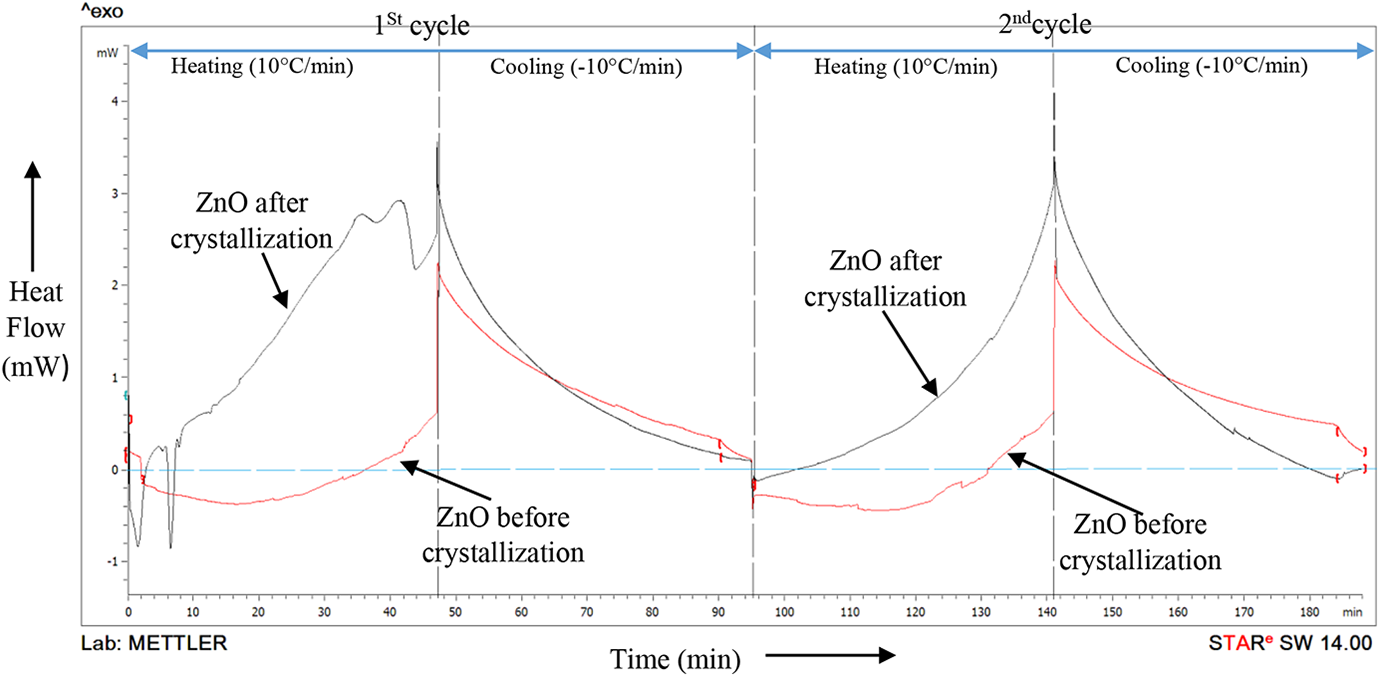
Thermograms of ZnO before and after sintering.
X-ray diffraction (XRD) technique has been employed to investigate the structural properties of synthesized ZnO NPs. The recorded XRD pattern (Figure 4) shows resemblance with standard Bragg’s positions of hexagonal wurtzite crystal structure of pure ZnO (PDF: 792205). All the peaks are properly indexed and one could not observe any impurity peak within the detection limit of the instruments. Total 11 peaks were observed at different angle and indexes as (100), (002), (101), (102), (110), (103), (200), (112), (201), (004) and (202) planes. The presence of sharp and intense peak at specific angles confirms the crystalline nature and hexagonal quartzite crystal structure of prepared ZnO NPs.
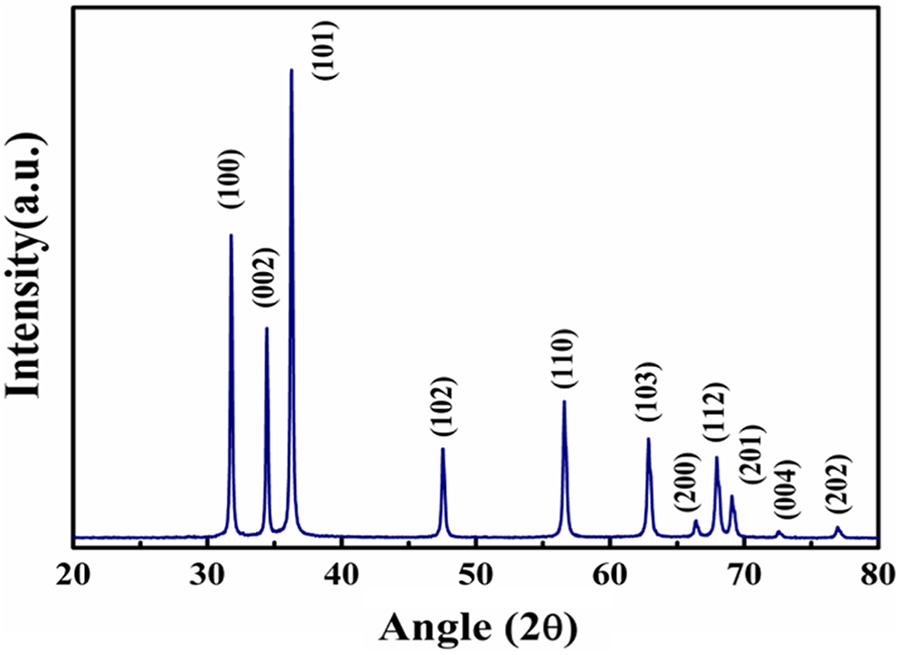
XRD plot of pure ZnO.
The crystallite size of sample has been calculated using Scherer’s formula:
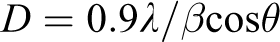
where D is the crystalline size of a sample, λ is the wavelength of X-rays, θ is the Bragg’s angles and β is the full width at the half maximum. The calculated value of crystallite size for (101) peak is 38 nm, which confirms that the synthesized sample is NP. The lattice parameters (a and c) and volume of unit cell were determined using unit cell software. The observed value of lattice parameters and volume of unit cell are a = b = 3.25 Å, c = 5.21 Å and V = 47.66, respectively, which are very close to the standard value. The value of atomic packing fraction (APF) has been calculated using the following equation:
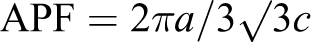
The calculated value of APF is 75.4% which is slightly greater than that of bulk ZnO (74%). The difference in APF value is due to its size effect.
The effect of melt processing on the PLA polymer was observed (see Figure 5). It has been observed that in virgin PLA grain negligible crystallinity was present (crystallinity: 0.30% in the first cycle and 0% in the second cycle) but after extrusion at 170°C, larger peak of crystallinity has been observed (crystallinity: 4.87% in the first cycle and 3.35% in the second cycle). Furthermore, it has been observed that the glass transition temperature of virgin PLA was reduced from 61.93°C in the first cycle to 59.59°C in the second cycle, but the glass transition of extruded sample gain more thermal stability and improved their glass transition temperature from 54.08°C in the first cycle to 59.12°C in the second cycle. The affinity for not losing crystallinity and glass transition temperature of extruded filament shows that melt processing is an essential aspect to maintain the basic characteristics of PLA. Again to validate this theory, the energy capacity and melting point of both samples were measured. It has been observed that the melting point of virgin PLA is shifted from 153.96°C in the first cycle to no melting in the second cycle, and in the second cycle the melting point of PLA was completely vanished. On the other hand, the melting point of extruded PLA has shifted from 153.60°C in the first cycle to 151.43°C in the second phase. The heat energy capacity of virgin PLA has recorded −21.09 J g−1 and for extruded sample it was −14.17 J g−1 in the first heating cycle. In the second heating cycle, the heat energy capacity of virgin PLA was completely vanished and for extruded PLA it was reduced to minor level as −12.08 J g−1. Hence, the tendency to retain the basic thermal properties is found more in case of extruded samples.
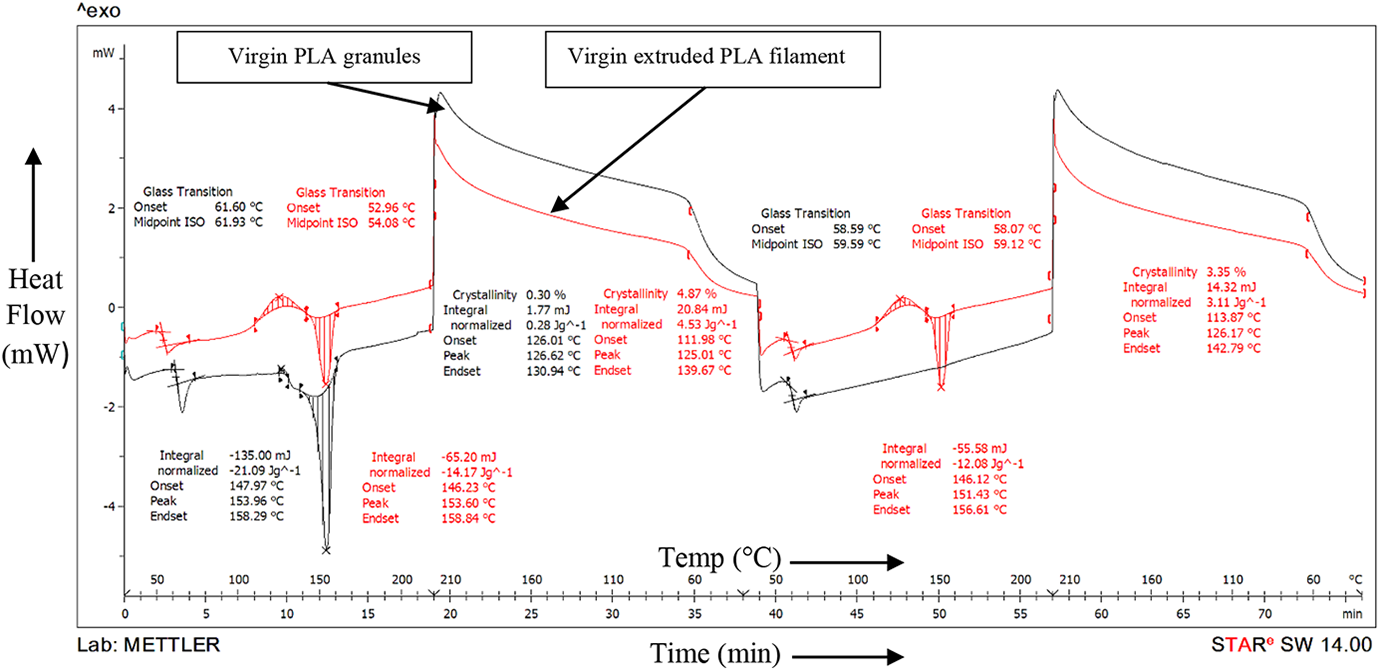
Thermograms of virgin PLA and extruded virgin PLA.
To investigate the effect of ZnO grafting in PLA, the thermograms of PLA + 1% ZnO and PLA + 2% PLA have been evaluated (Figure 6). The affinity to retain the glass transition temperature is found similar in both samples and no significant deviation was observed. But, changing the concentration of ZnO on PLA resulted into wide variation of crystallinity. It has been observed that crystallinity of PLA + 1% ZnO was reduced from 14.03% in the first cycle to 11.71% in the second cycle. For PLA + 2% ZnO, the crystallinity was reduced from 21.68% in the first cycle to 17.30% in the second cycle. It has been ascertained from here that increasing the ZnO percentage in PLA led to improved crystallinity and heating cycle reduced its affinity to maintain crystallinity. The melting point of PLA + 1% ZnO reduced from 155.17°C to 155.48°C and melting point of PLA + 2% ZnO reduced from 155.48°C to 147.71°C in subsequent heating cycles. So, it may be taken as there is no effect of melting point difference on shifting ZnO proportion in PLA from 1% to 2% but heating cycles degrade their melting points. The more interesting fact may be observed form the results of heat energy capacity, in this case there in no significant difference of heat energy capacity of PLA + 2% ZnO (−22.60 J g−1) and PLA + 1% ZnO (−21.67 J g−1) was found. On the other hand, the second heating cycles significantly reduced its energy affinity as heat energy capacity of PLA + 2% ZnO (−8.40 J g−1) and PLA + 1% ZnO (−7.60 J g−1) found with much lower values.
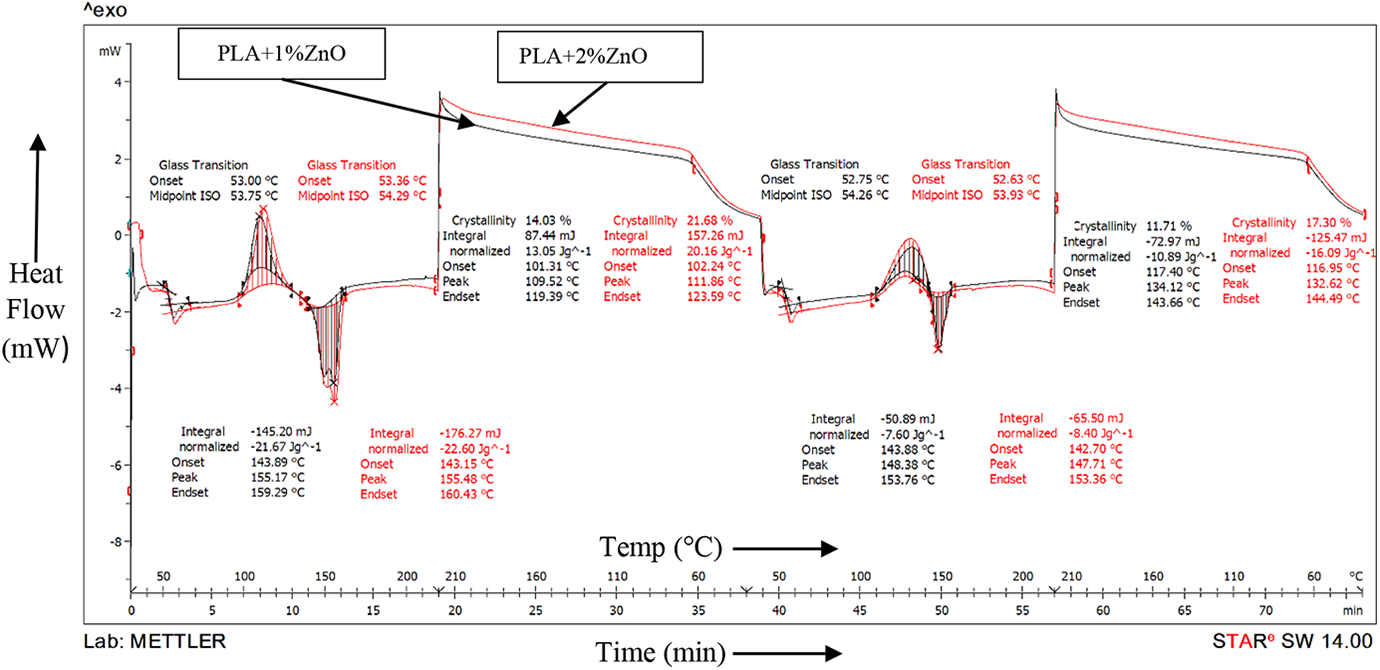
Thermograms of PLA + 1% ZnO and PLA + 2% ZnO.
Mechanical and surface properties
Mechanical properties
Based on Table 1, Table 2 and Figure 7 shows the result of tensile test of all the samples in term of strength at peak, strength at break, percentage elongation at peak, percentage EAB, Young’s modulus and modulus of toughness. There were three trials at each experimental conditions performed to reduce the experimental errors.
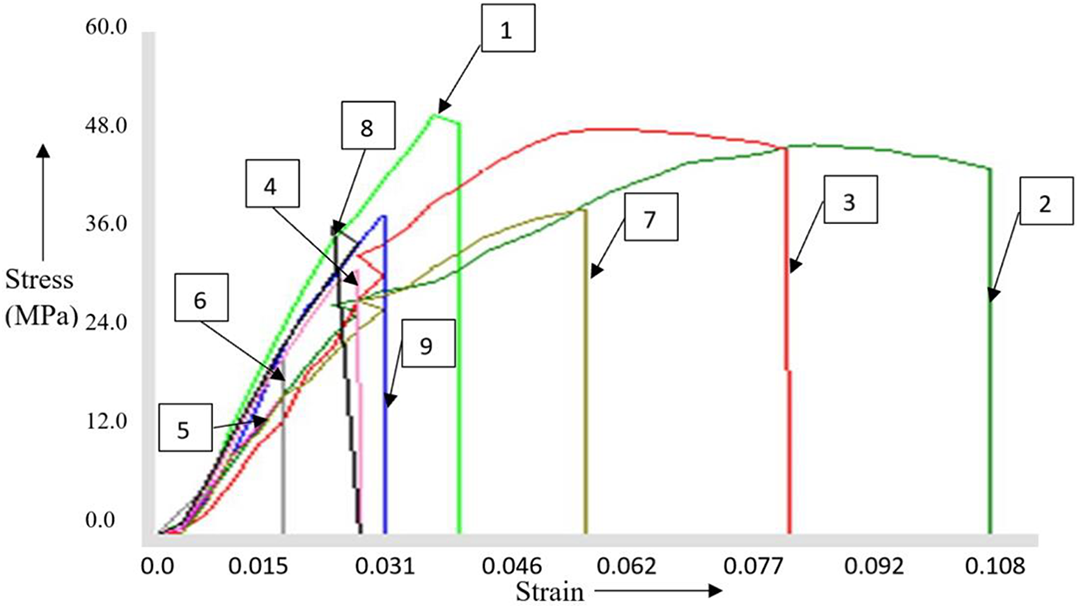
Stress versus strain curve (as per Table 2).
Observations for mechanical properties (tensile).
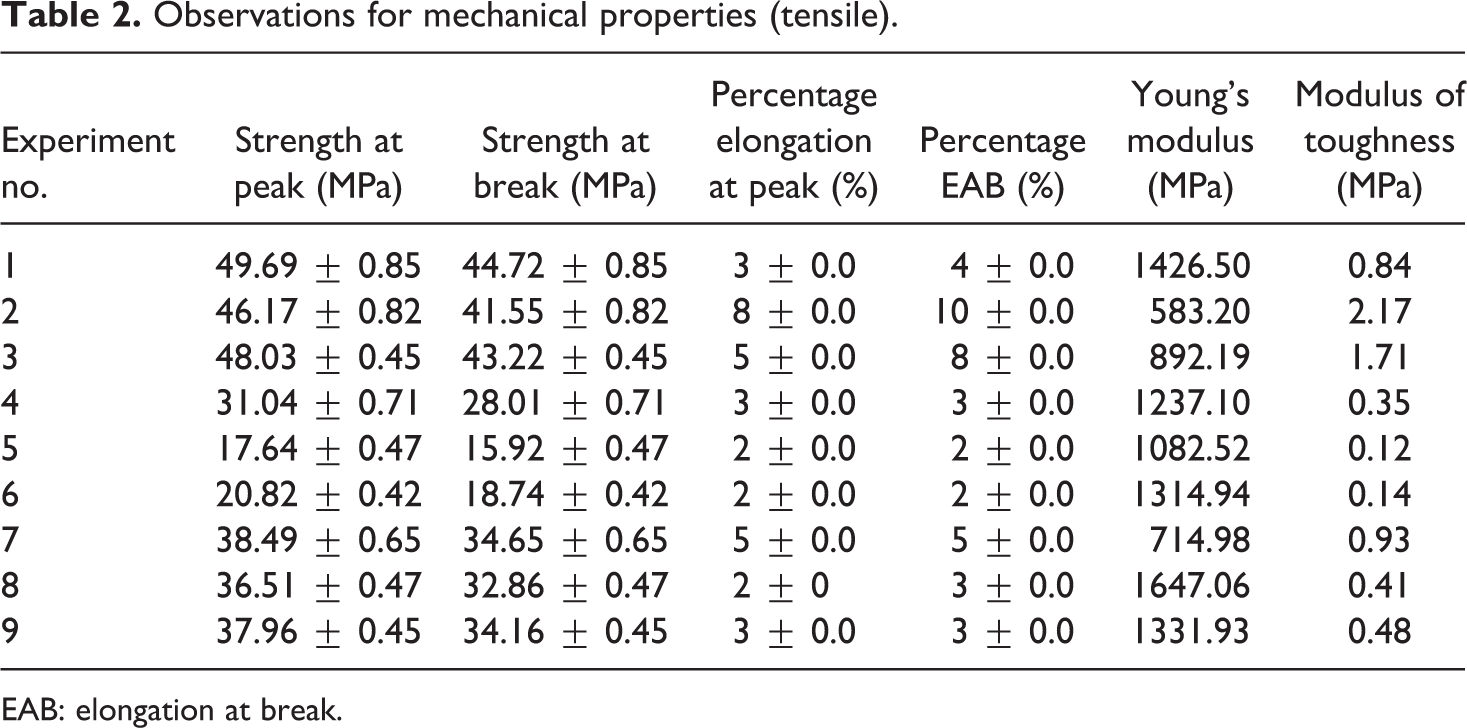
EAB: elongation at break.
It has been observed from Table 2 that among nine samples, the first sample of the virgin PLA has maximum strength at peak (49.69 MPa), maximum strength at break (44.72 MPa), extruded at 10 kg applied load and 0.1 Nm torque. This may be because of the fact that feed stock filament for this sample was prepared at minimum torque and loading conditions resulting into better grain refinement. The 5th sample with PLA + 1 wt% ZnO powder, extruded at 0.2 Nm torque and 12.5 kg load gives minimum strength at peak (17.64 MPa), minimum strength at break (15.92 MPa). While in the set of PLA + 2% ZnO concentration filaments, sample no. 7 extruded at 0.2 Nm torque and 10 kg load gives maximum strength at peak (38.49 MPa), maximum strength at break (34.65 MPa) and maximum toughness (0.93). It has been observed that the maximum Young’s modulus (583.2 MPa) and modulus of toughness (2.17 MPa) was attained in case of sample no. 2 among nine samples. It should be noted that the tensile strength observed in this study is equivalent to the results obtained previously by Chu et al. 27 The tensile strength of PLA-ZnO composite is equivalent to tensile strength reported by previous studies of PLA-ZnO nanocomposites which was 38.96 ± 8.19, on the other hand, the EAB is also observed equivalent to previous studies (elongation = 7.74%). As per study conducted by Li et al. for preparation of PLA-C6-1% ZnO, the tensile strength observed is 18.36 MPa which is lesser than the present study. 28 However, the elongation is observed higher (32.22%) in the previous study as compared to this study.
Surface properties
Photomicrographs and porosity values
Based on Table 2, Figure 8 shows the photomicrographs of fractured filaments at ×30 magnification after tensile testing. The observations have been taken to investigate the role of process parameters for surface defects/voids. The sample no. 1 resulted into maximum strength and sample no. 5 into minimum strength.
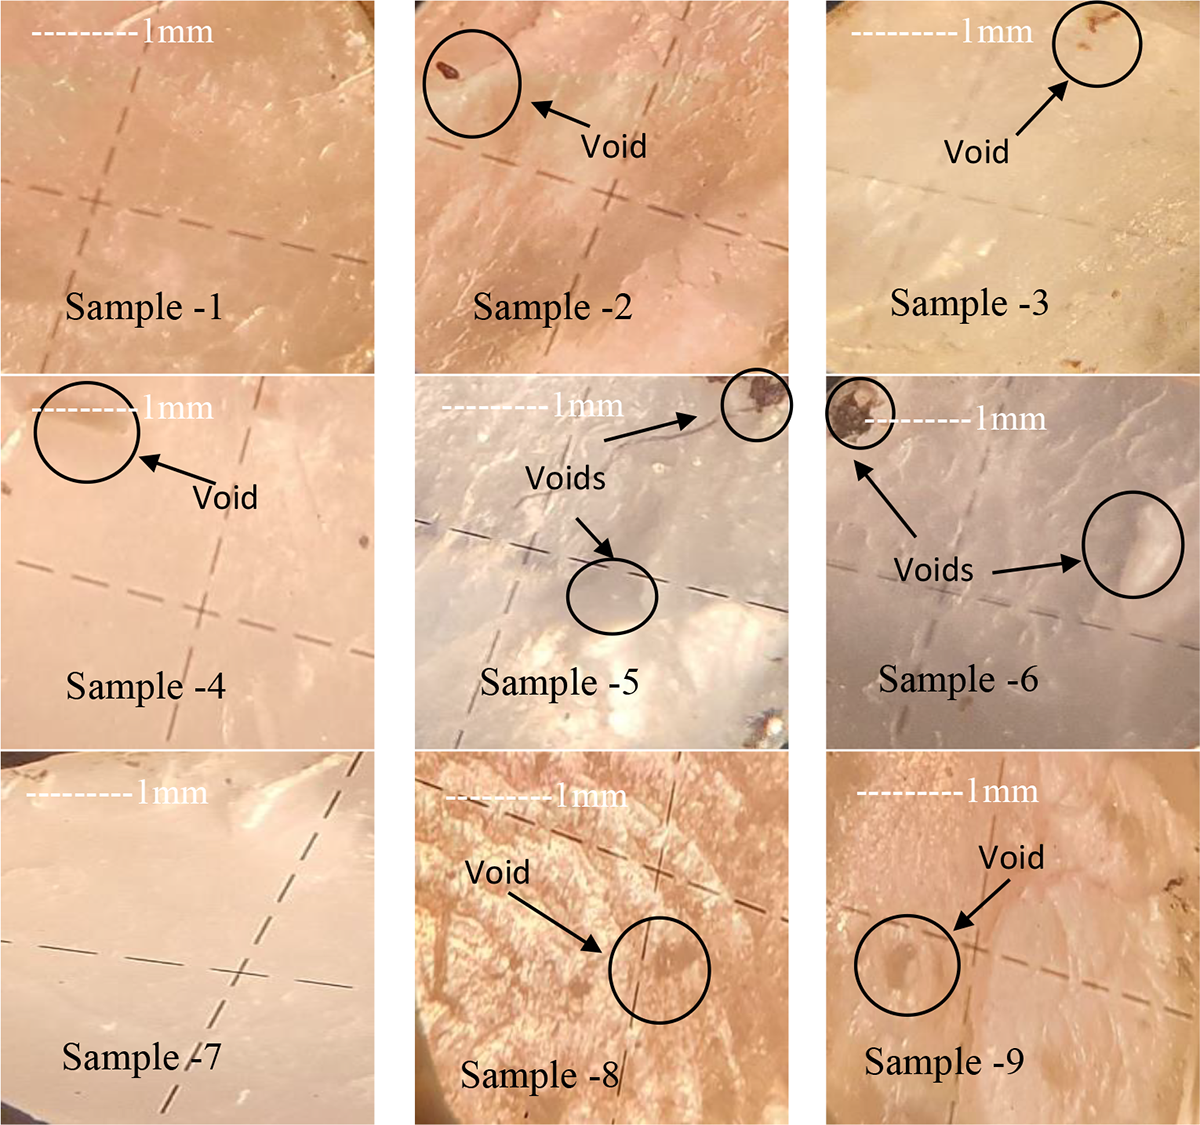
Photomicrographs of fractured feedstock filaments (×30 magnification).
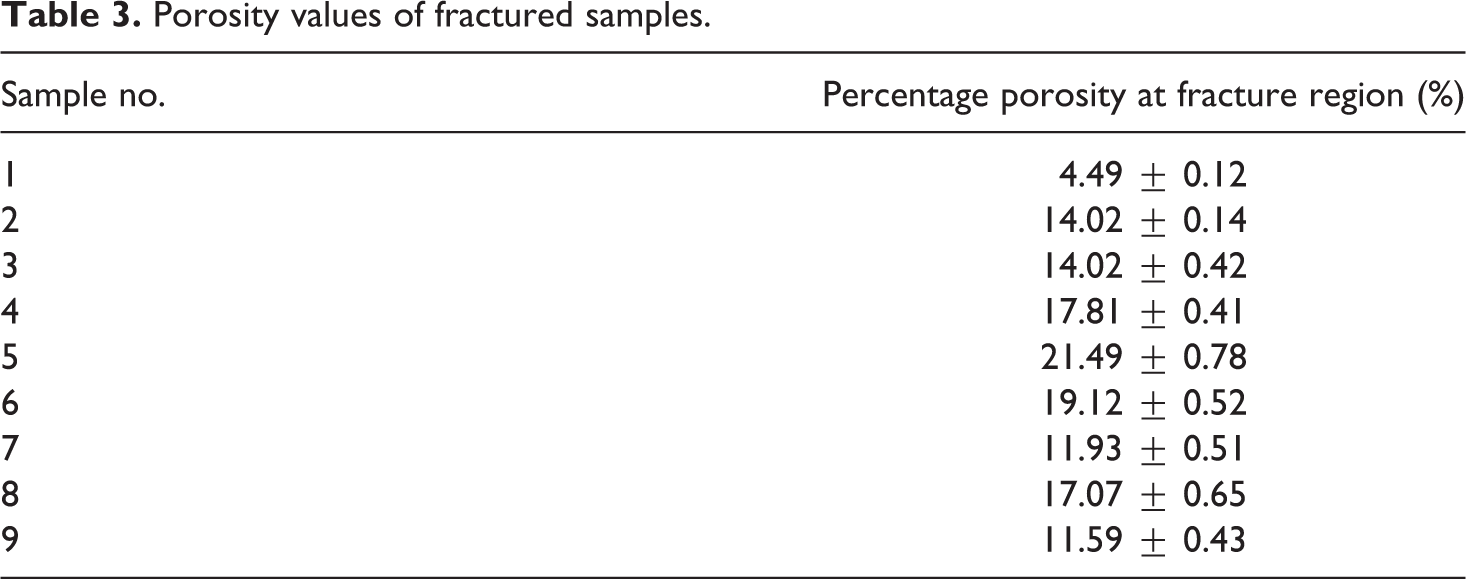
The porosity values of the samples are presented in Table 3. As observed from Table 3, among nine samples, the first sample of the virgin PLA has minimum porosity (4.49%) which was extruded at 0.1 Nm torque and 10 kg load. This may be because of the fact that feedstock filament was prepared at minimum torque and loading conditions resulting into better grain refinement. The fifth sample (PLA + 1 wt%ZnO) extruded at 0.2 Nm torque and 12.5 kg load gives minimum strength at peak (17.64 MPa), minimum strength at break (15.92 MPa) because of maximum porosity (21.49%), while in the set of PLA + ZnO powder composites, sample no. 7 extruded at 0.2 Nm torque and 10 kg load gives maximum strength at peak (38.49 MPa), maximum strength at break (34.65 MPa), with a porosity of 11.93%.
Porosity values of fractured samples.
Furthermore, for cross verification of above results, cross-section images of samples prepared in experiments 1, 5 and 7 were captured via SEM at different magnifications, that is, ×50, ×200 and ×800 and different elements were analysed by EDAX as shown in Figures 9 and 10, respectively.
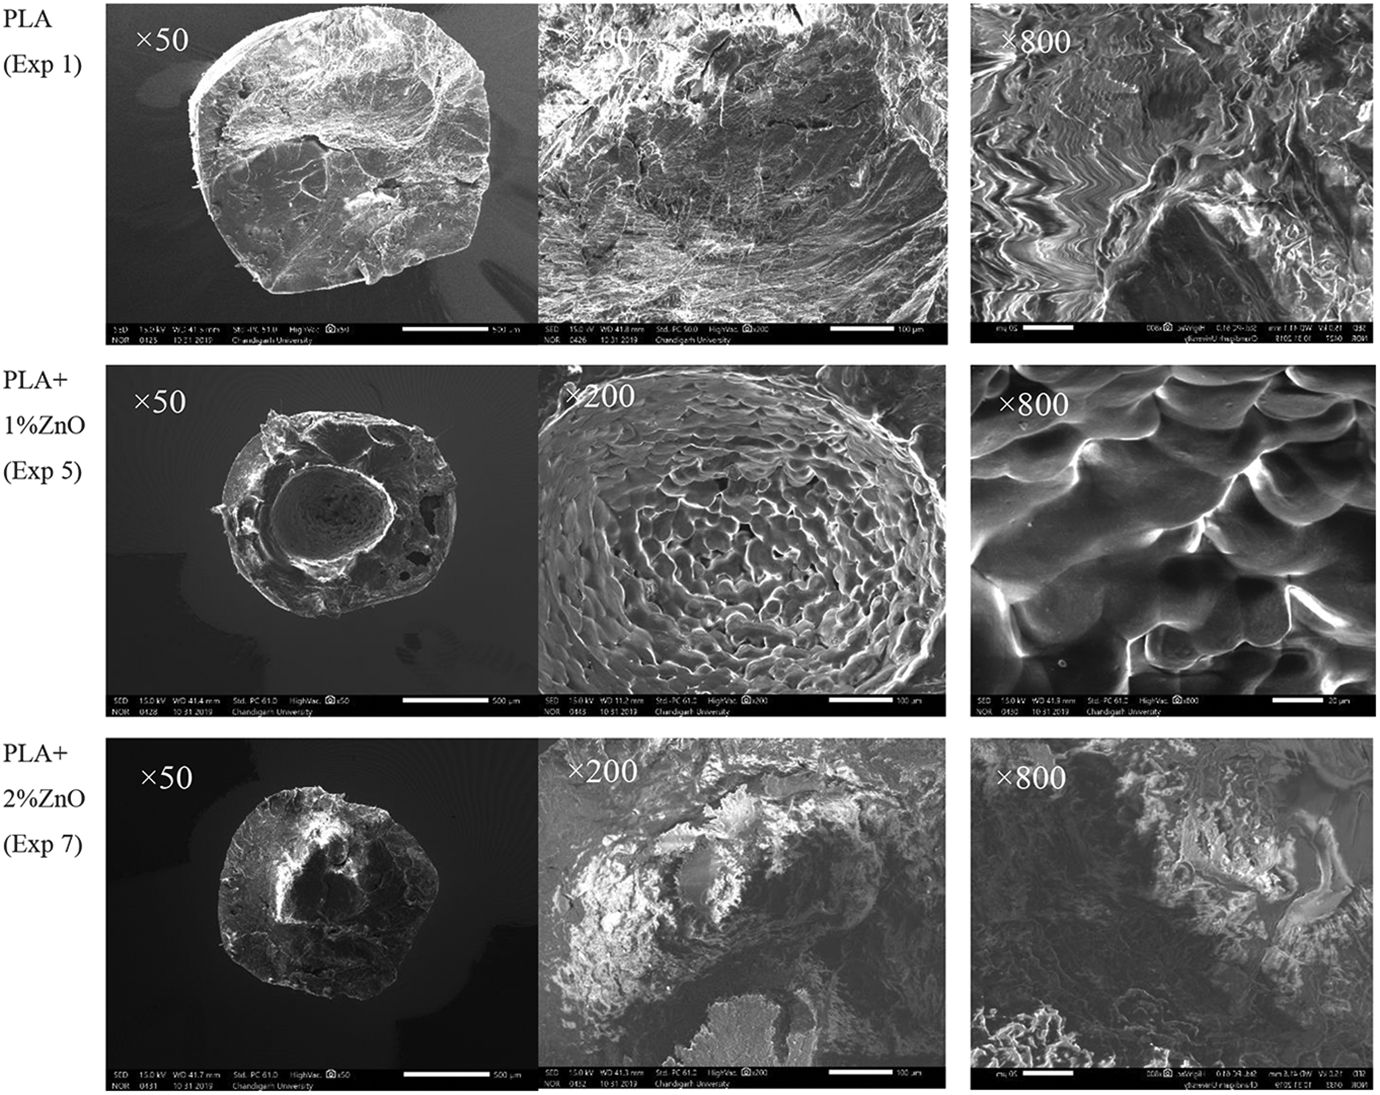
SEM images for sample no. 1, sample no. 5 and sample no. 7 at ×50, ×200 and ×800.
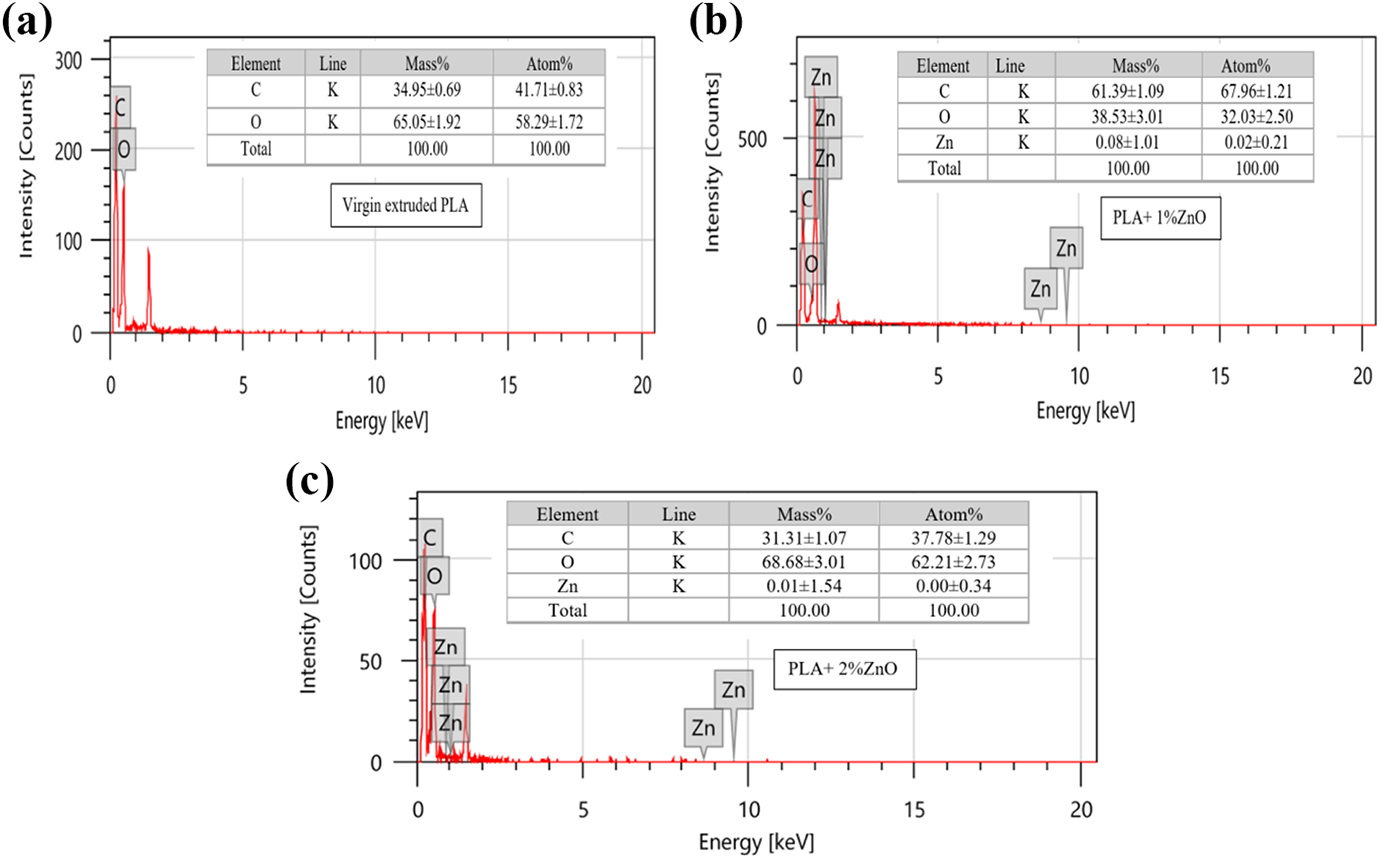
Energy dispersive spectrometry (EDAX) of sample no. 1, sample no. 5 and sample no. 7 at ×50 (a), ×200 (b) and ×800 (c).
Based on Figure 9, it can be ascertained that the presence of voids in case of sample no. 5 decreases the mechanical properties of specimen, whereas the sample no. 1 with no voids resulted into higher mechanical properties. From the set of PLA + ZnO-reinforced samples, sample no. 7 has higher mechanical properties because of less voids presence in this case as seen from these images. The SEM images (Figure 9) were further processed with image processing software to get 3D rendered image (Figure 11). As observed from the Figure 11, the sample no. 1 with better strength at peak and strength at break has smother surface with lower Ra value (28.80 nm) as compared to specimen no. 5 with Ra value of 50.23 nm, hence justify the observations for better tensile properties. As a matter of fact, the sample with better strength has more uniform grains with lower Ra value as compared to lower strength sample. Whereas the reinforced composite having high strength with Ra value of 32.24 nm.
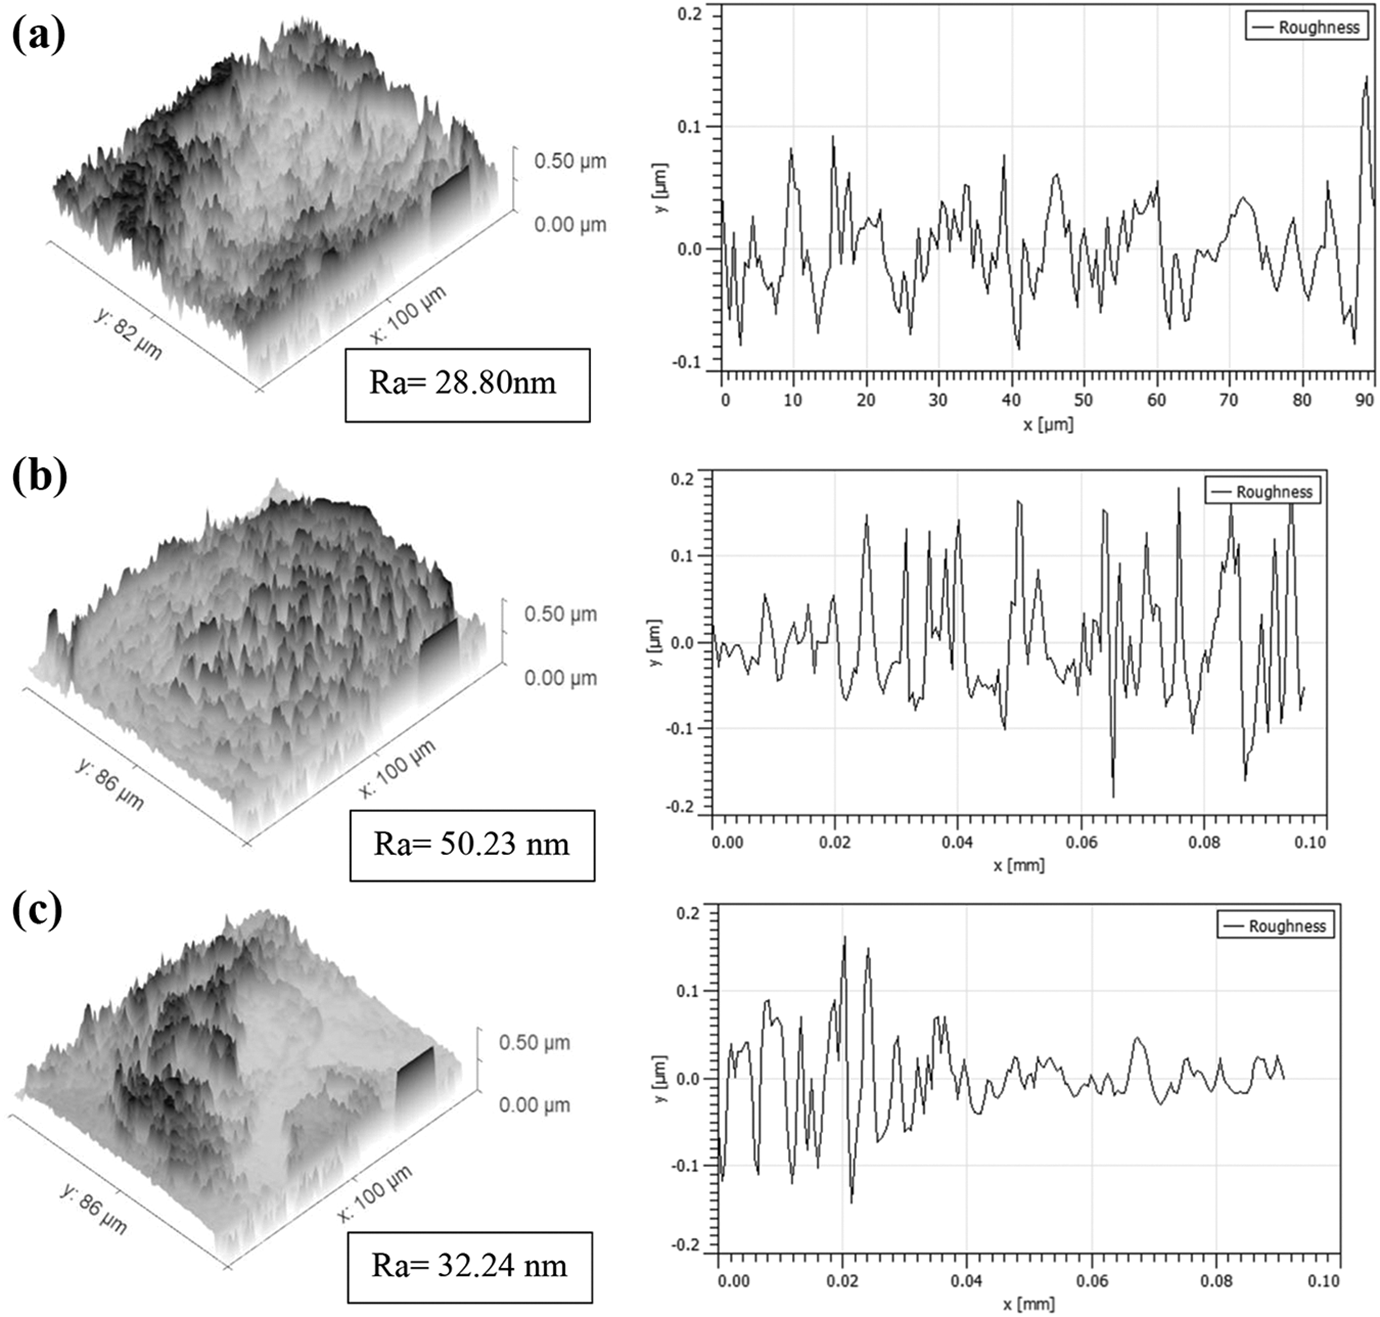
3D rendered image and Ra profile (at cut-off length of 0.05 mm) sample no. 1 (a), sample no. 5 (b) and sample no. 7 (c).
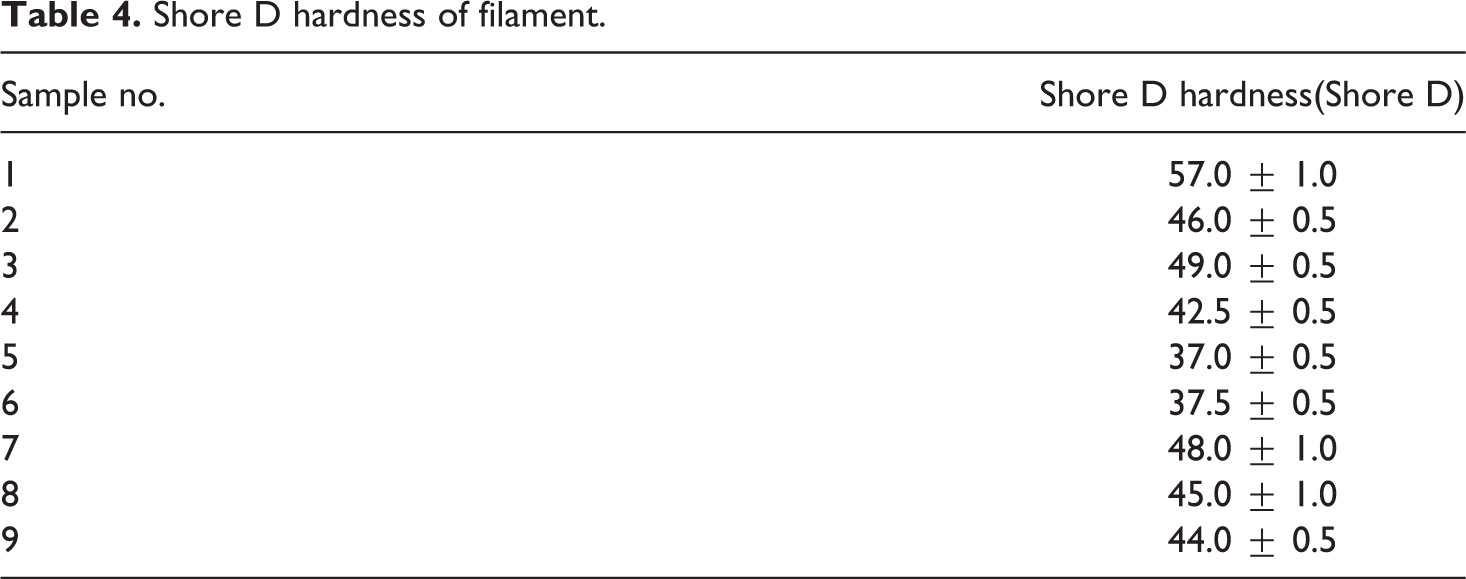
These results were again cross verified with the values of Shore D hardness as given in Table 4. As observed from Table 4, among nine samples, first sample of the virgin PLA has maximum value of Shore D hardness (57 Shore D), extruded at 0.1 Nm torque and 10 kg load. In sample with PLA + 1 wt%ZnO powder, sample no. 4 extruded at 0.2 Nm torque and 12.5 kg load gives minimum value of shore hardness (37 Shore D). While in the set of PLA + 2 wt%ZnO powder composites, sample no. 7 extruded at 0.2 Nm torque and 10 kg load gives maximum Shore hardness (48 Shore D).
Shore D hardness of filament.
Optimization of process parameters
For optimization of the input parameters signal-to-noise (SN) ratio has been calculated as given in Table 5. The SN ratio for maximum better-type case has been calculated as:
Optimization of process parameters for mechanical properties.
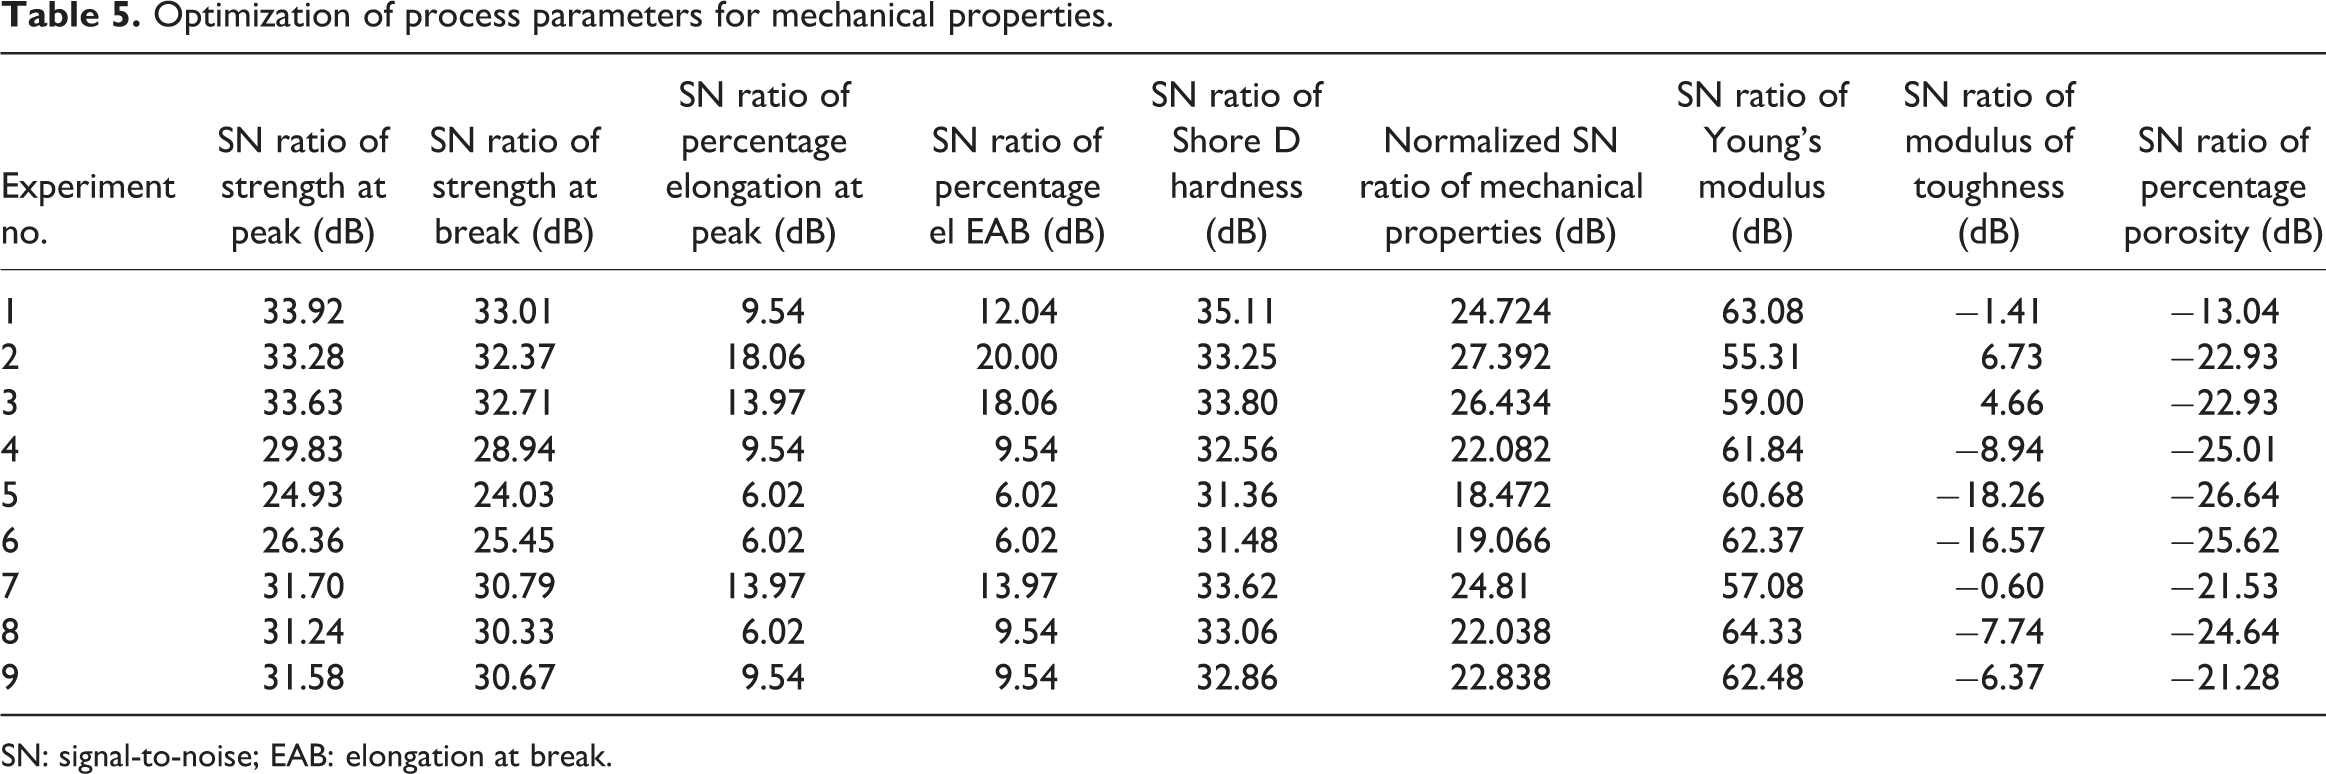
SN: signal-to-noise; EAB: elongation at break.
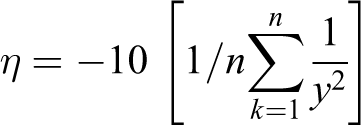
where η is the SN ratio, n is the number of experiment and y is the material properties at experiment number k. Based on Table 2, Table 5 gives the SN ratios for different selected parameters.
Based on Table 5, Figure 12 shows the main effect plots of SN ratio on mechanical and surface properties of nine samples.
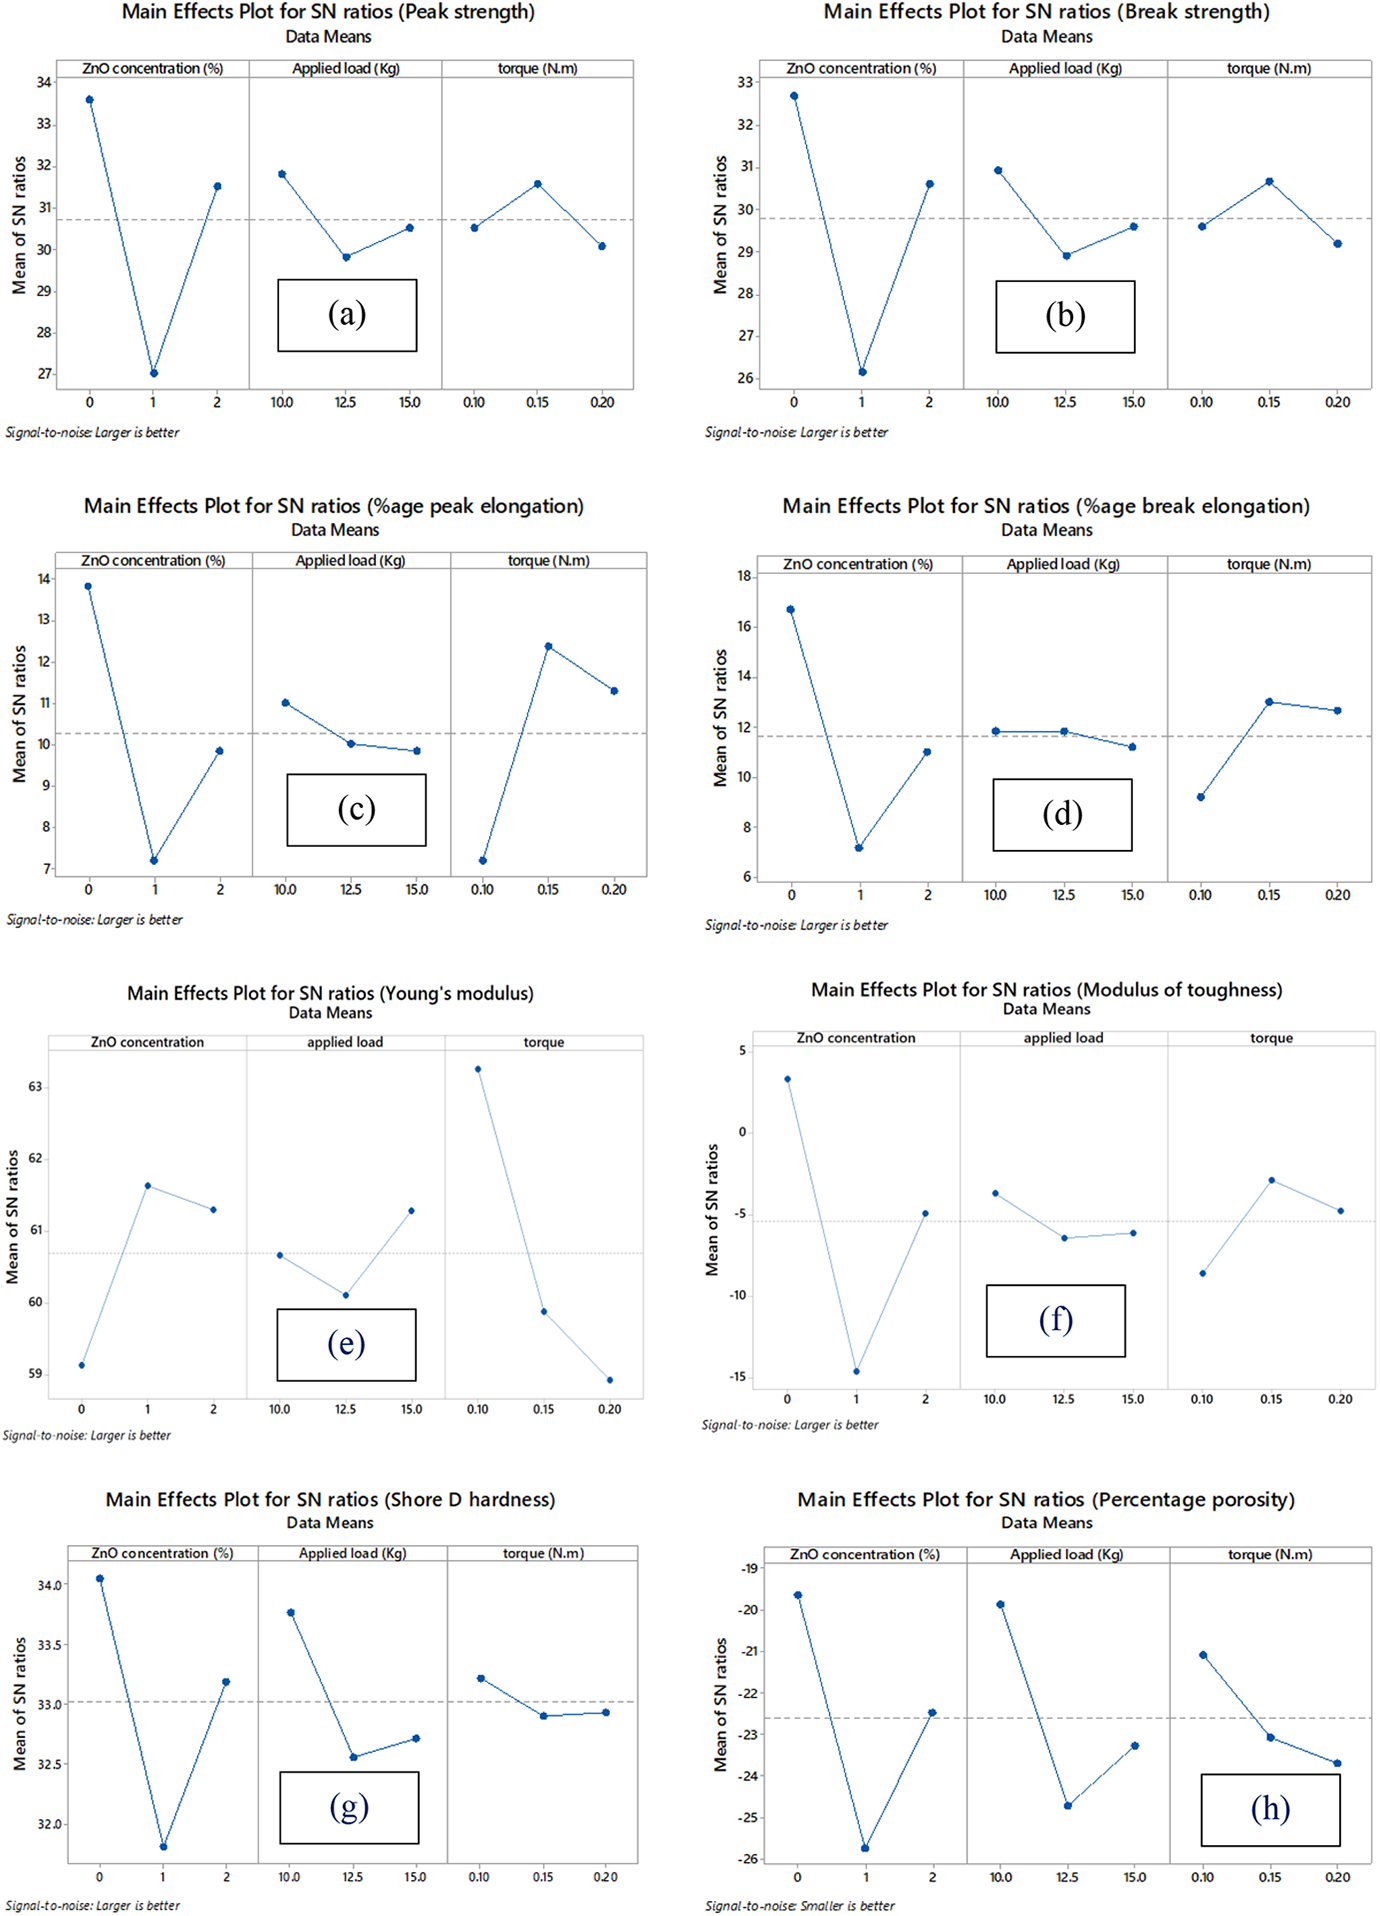
Main effects plots of SN ratio on tensile properties: (a) peak strength, (b) break strength, (c) percentage peak elongation, (d) percentage break elongation, (e) Young’s modulus, (f) modulus of toughness, (g) Shore D hardness and (h) percentage porosity.
The analyses of variance (ANOVAs) are conducted for various SN ratios of tensile test results; the ANOVA for SN ratios of peak strength and ranking table for SN ratios of peak strength are given in Tables 6 and 7, respectively. It should be noted from Table 7 that the ZnO concentration is ranked 1, applied load is ranked 2 torque is ranked 3 in case of peak strength.
ANOVA for SN ratios.
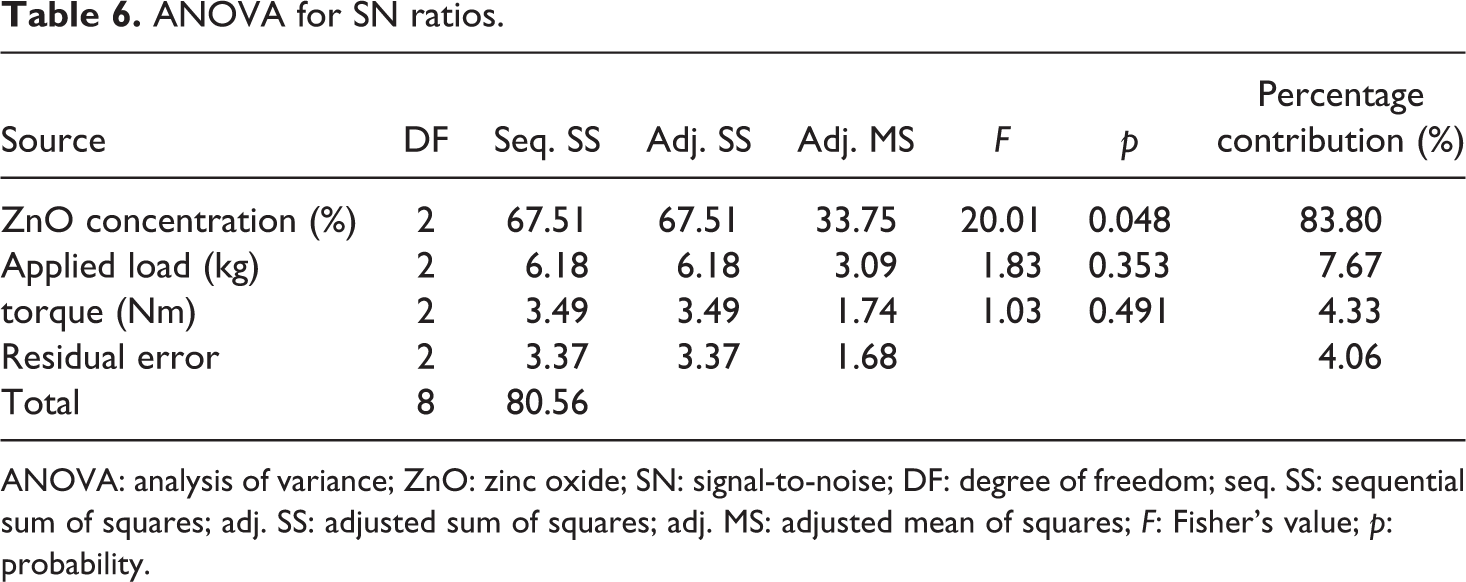
ANOVA: analysis of variance; ZnO: zinc oxide; SN: signal-to-noise; DF: degree of freedom; seq. SS: sequential sum of squares; adj. SS: adjusted sum of squares; adj. MS: adjusted mean of squares; F: Fisher’s value; p: probability.
Response table for SN ratios (larger is better).
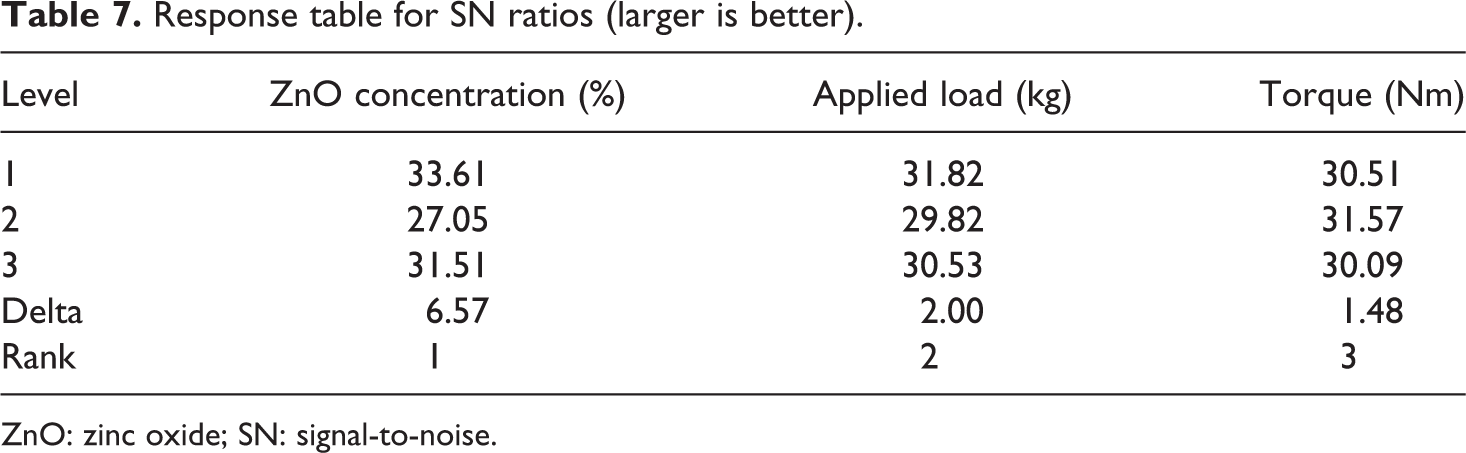
ZnO: zinc oxide; SN: signal-to-noise.
Prediction of mechanical properties: On the predicted settings, the optimum values of mechanical and surface properties can be calculated. In this case, the optimum peak strength can be obtained by a filament processed under 0% ZnO reinforcement, 10 kg applied load and 0.15 Nm torque. To obtain optimum peak strength following relation was used:

where m is the mean of SN ratio of different experimental conditions, mA1 is the ZnO reinforcement at level 1, mB2 is the applied load at level 1 and mC2 is the torque at level 2. The optimum value at predicted setting can be measured as


where yopt is the optimum tensile strength at peak.
Calculation:
Overall mean of SN ratios (m) for strength at the peak has been calculated as
It has been observed from the response table of SN ratio:

Now from equation (1)

Now, from equation (3) yopt2 = (10)ηopt/10
The strength at peak at predicted setting was calculated 59.98 MPa. To validate the prediction, experiment was performed on the predicted setting and it has been observed that the actual value of strength at the peak was 60.58 MPa. Similarly, on the predicted setting for each property standard tensile test and surface characterization tests have been performed and values are given in Table 8.
Predicted and observed value.
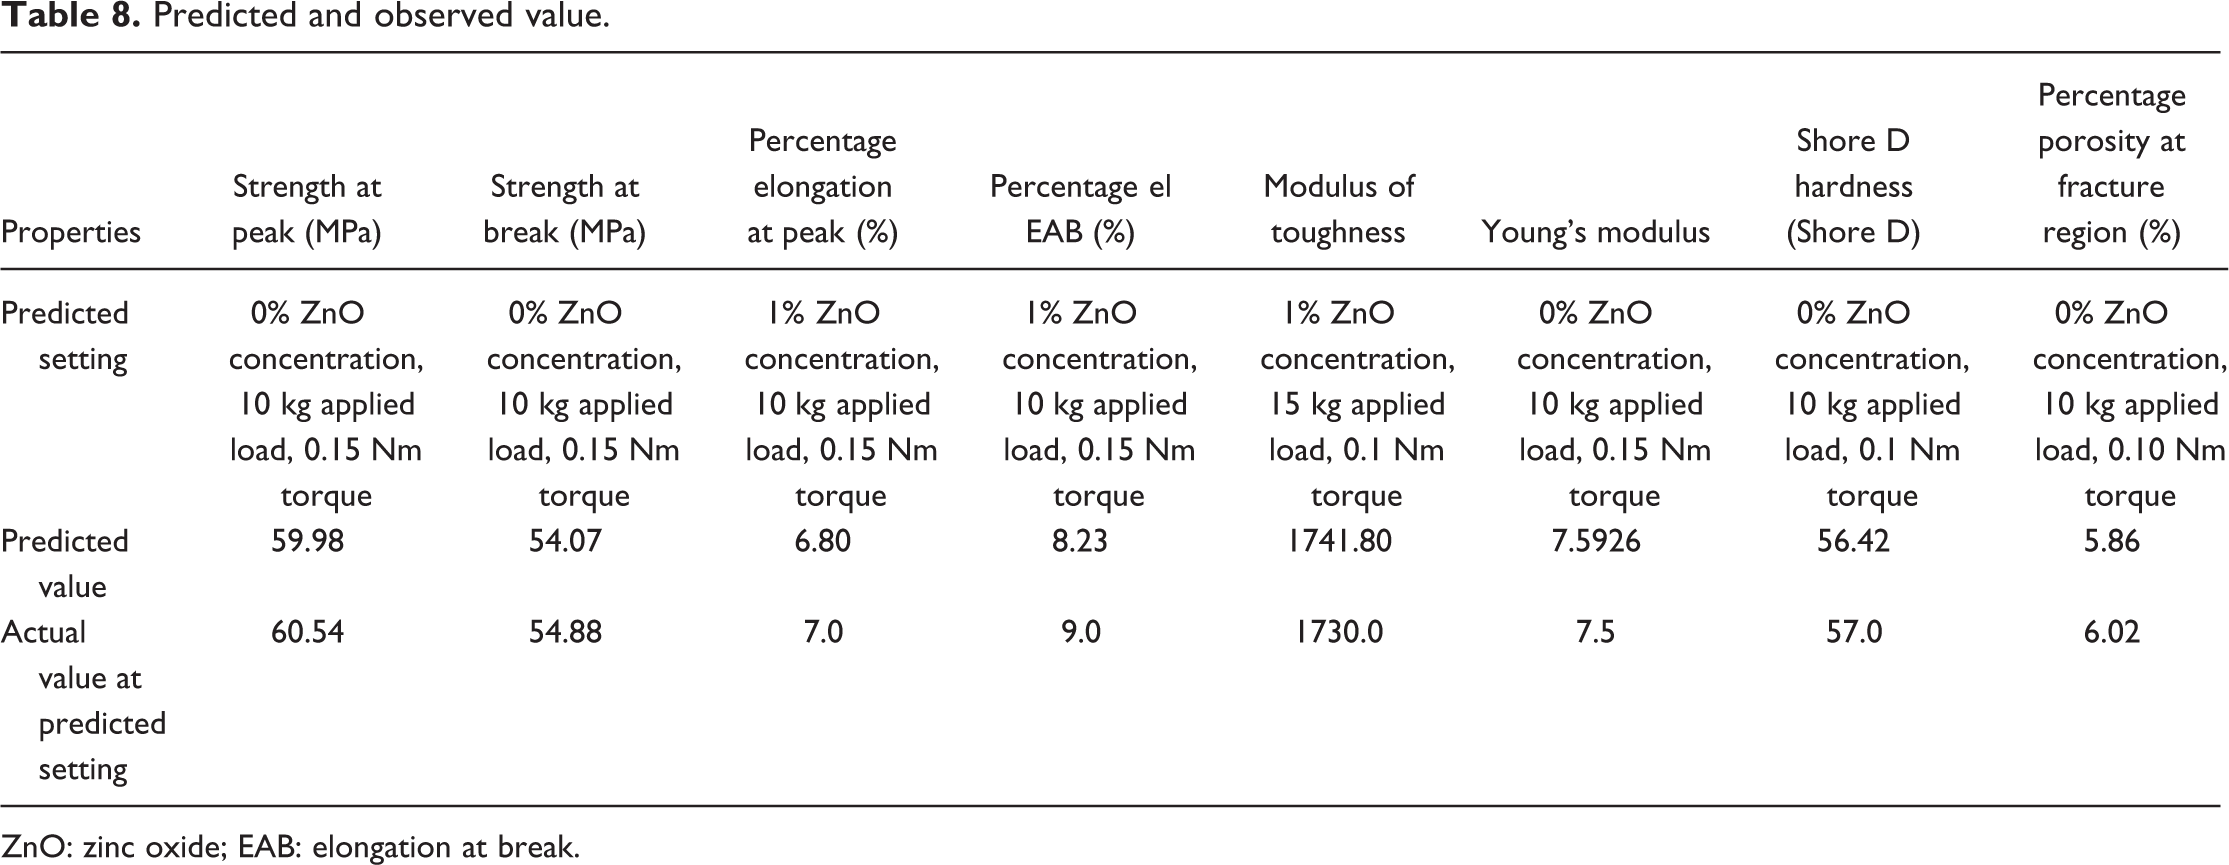
ZnO: zinc oxide; EAB: elongation at break.
Further based on Table 5, for multi-factor optimization, contours plot and combined SN ratio plot has been drawn (Figure 13). As observed from Figure 13(a), the optimum range for the applied load is between 11 Nm and 15 Nm for 0–0.1 wt% concentration of ZnO powder. Furthermore, Figure 13(b) shows the contour plots of torque versus applied load. The optimum value of torque is between 0.12 Nm and 0.17 Nm, at 11–14 kg load. Figure 13(c) shows the contour plots of ZnO concentration (%) versus torque. The optimum values are between 0 wt% and 0.23 wt% of ZnO powder and 0.12–0.20 Nm of torque.
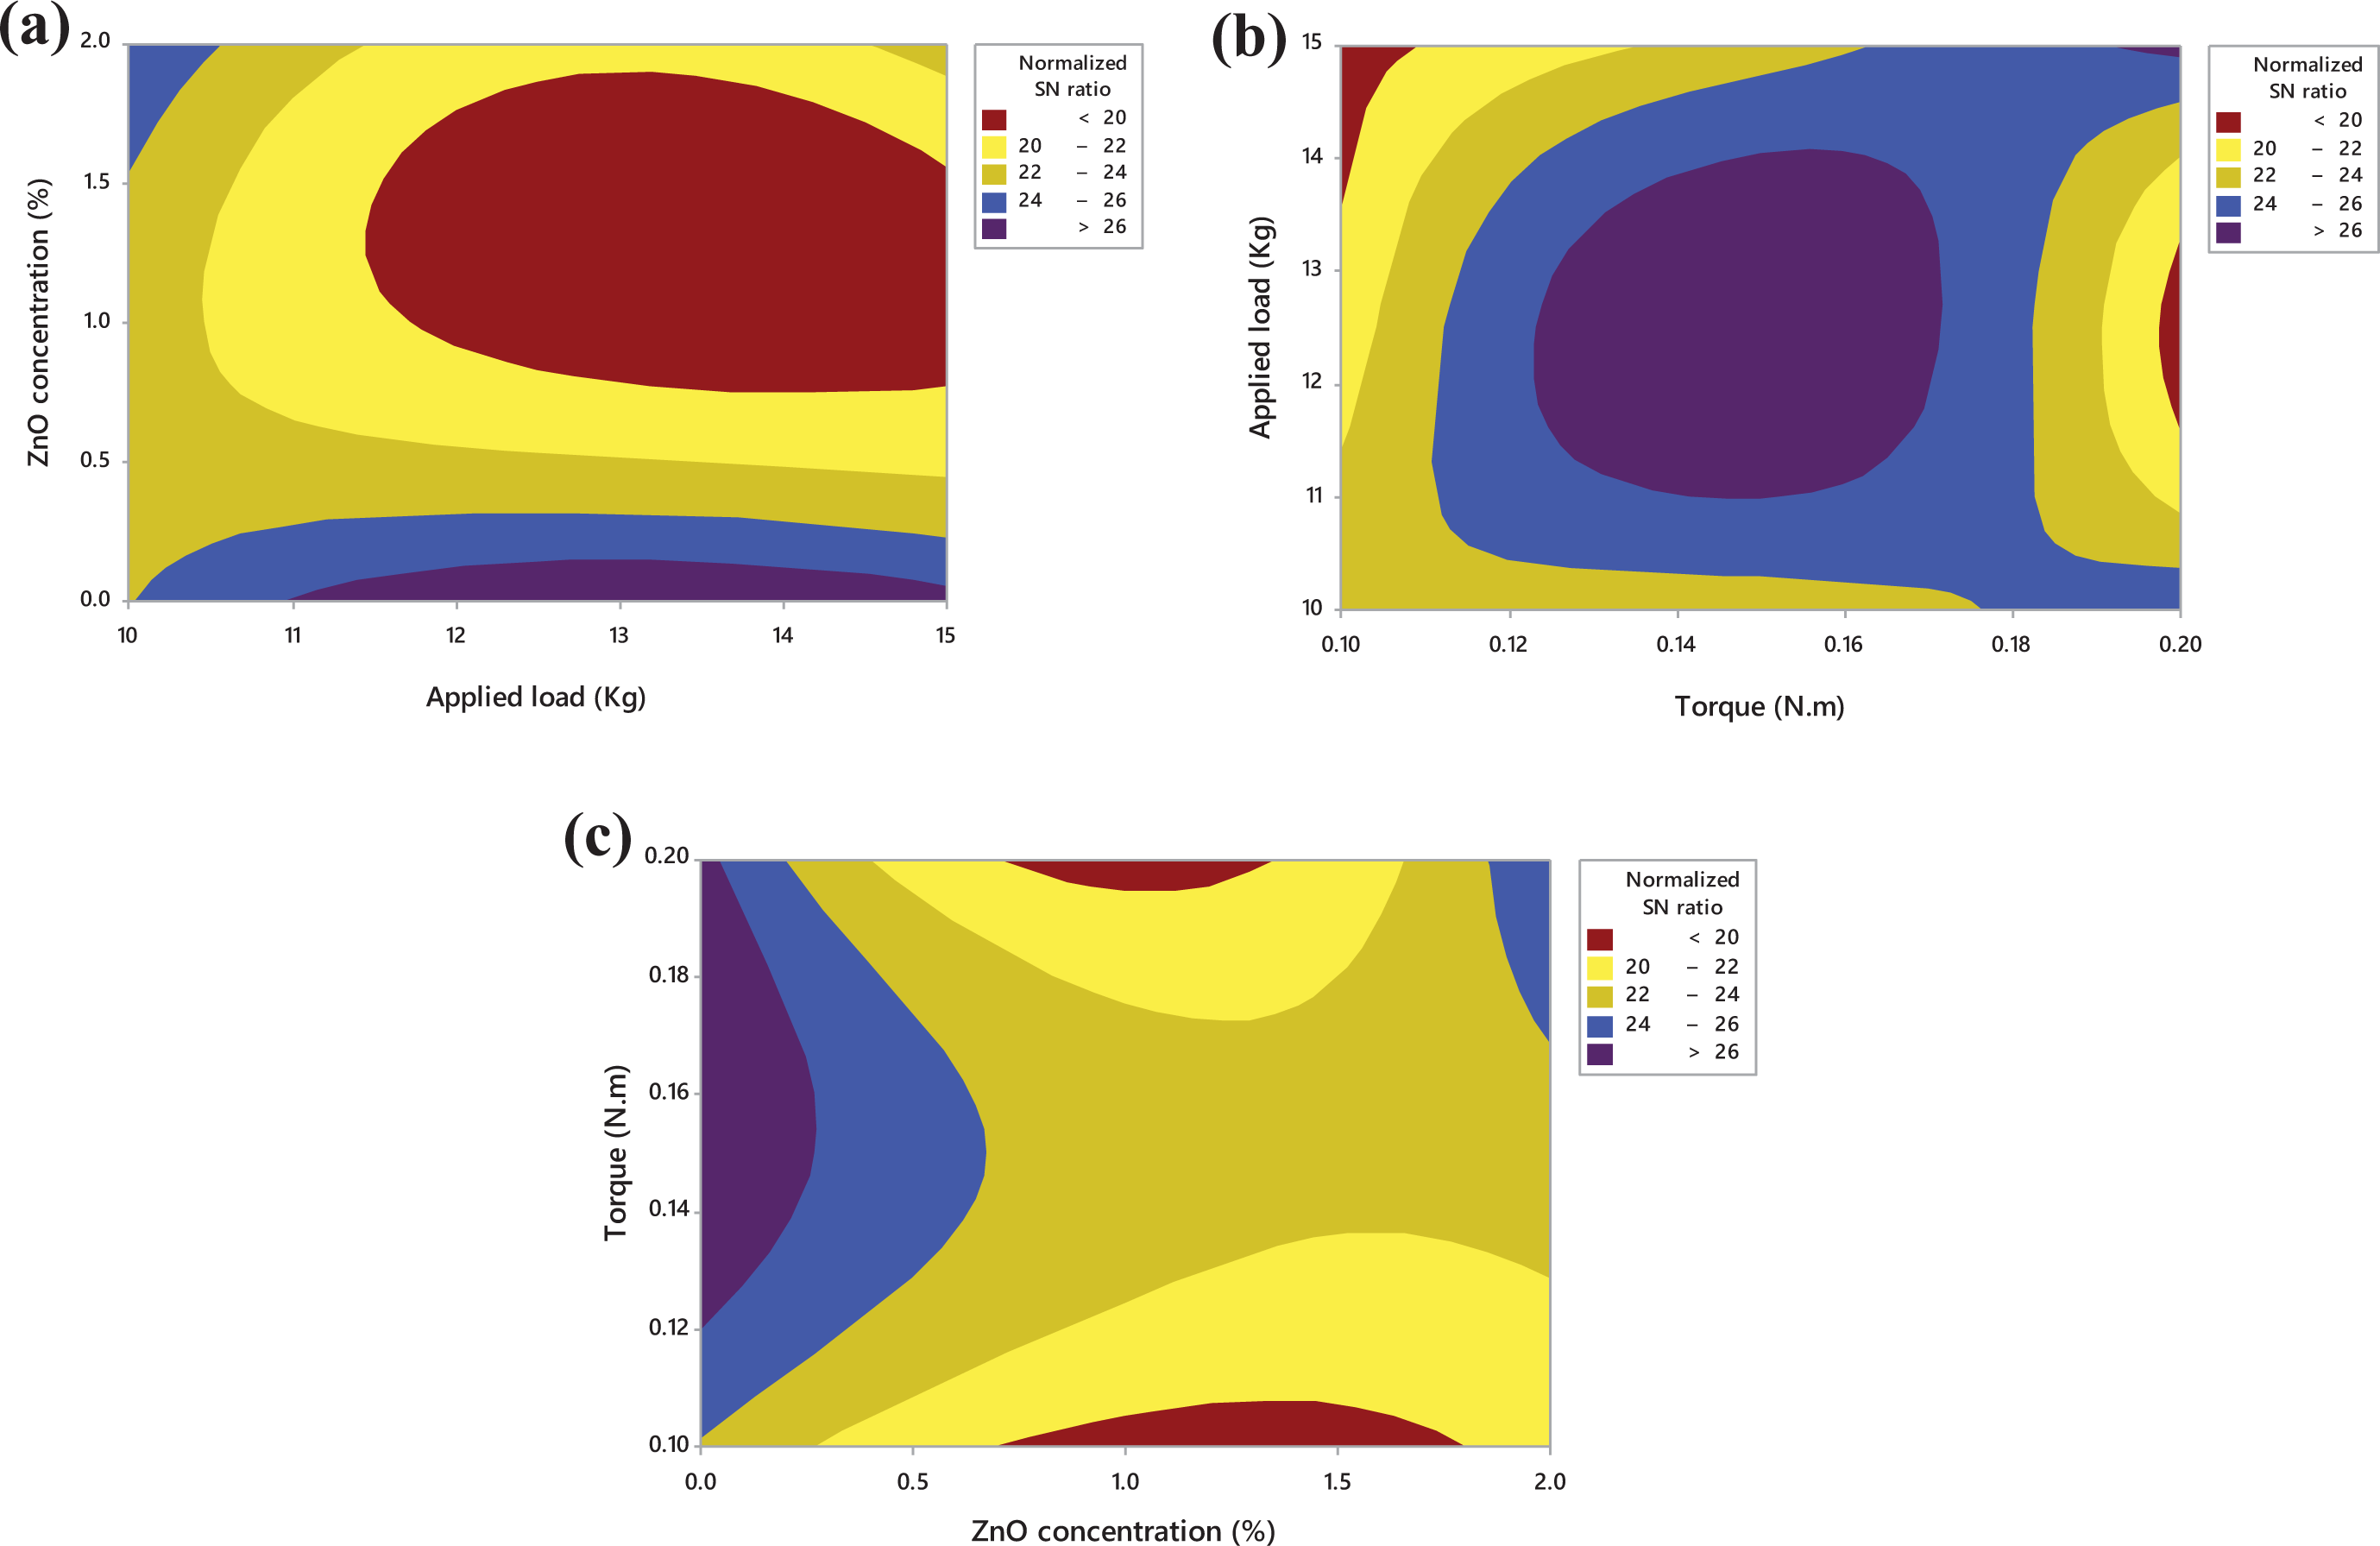
Contour plots for interaction of process parameters: (a) contour plot of normalized SN ratio versus ZnO concentration, applied load, (b) contour plot of normalized SN ratio versus applied load, torque and (c) contour plot of normalized SN ratio versus torque, ZnO concentration.
Shape memory effect
Tables 9 and 10, respectively, give the experimental results of shape changes of PLA, PLA-1% ZnO and PLA-2% ZnO composites at 25°C and 40°C. It has been observed that there was no significant moisture intake in the sample after immersion to 25°C for 5 h. Also, drying in open air for 5 next hours, has not affected its weight. So, it has been ascertained that samples are water resistive.
Shape changes in water stimuli at 25°C.
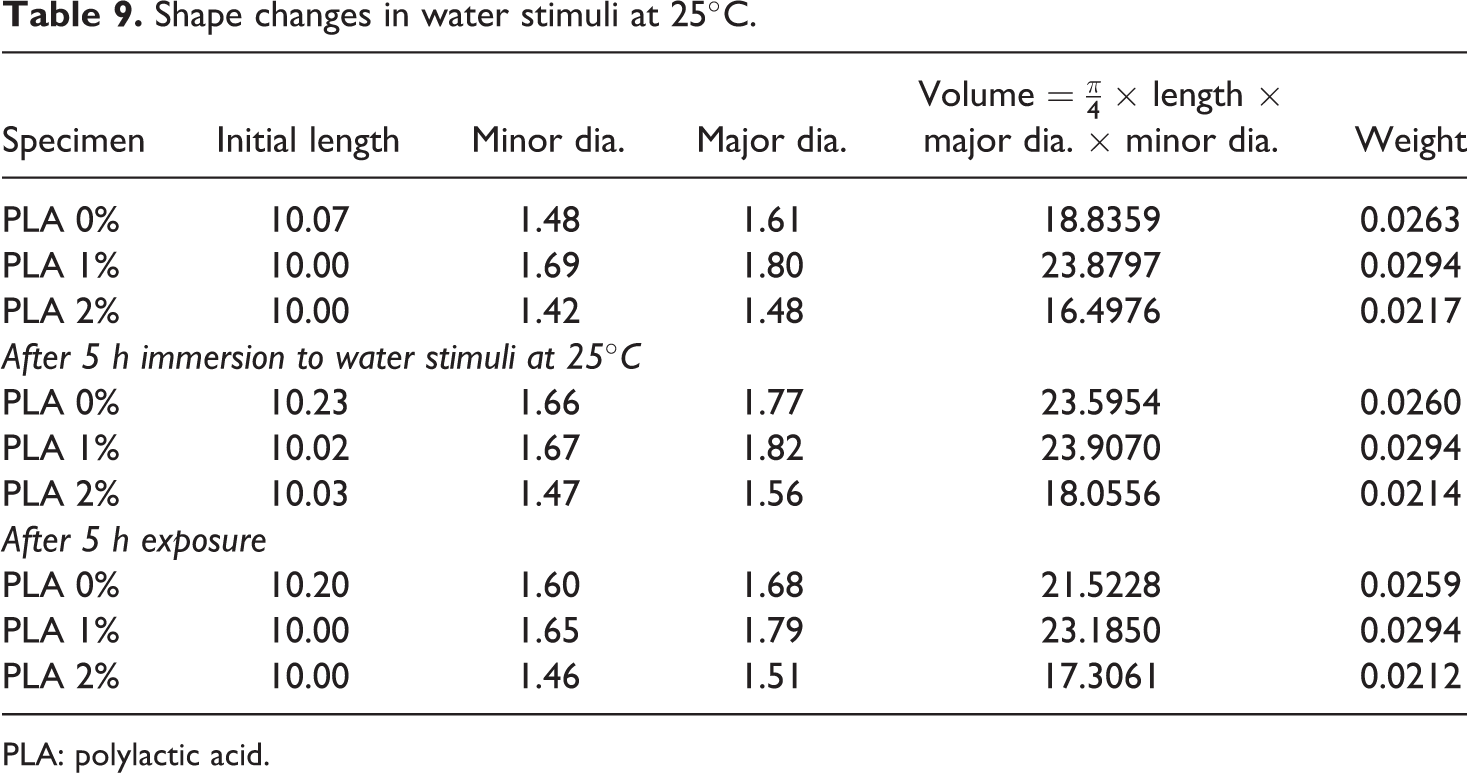
PLA: polylactic acid.
Shape changes in water stimuli at 40°C.
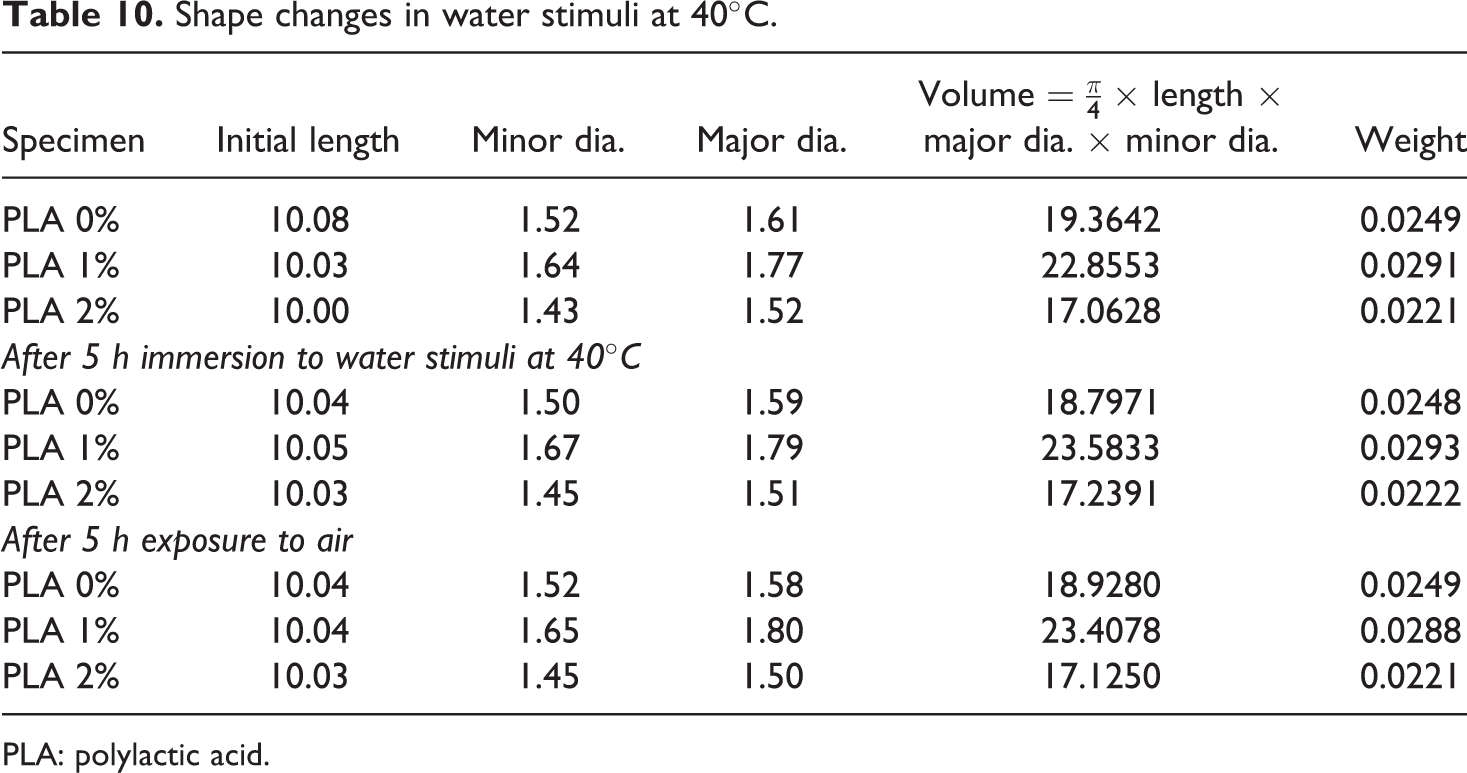
PLA: polylactic acid.
To investigate the shape memory effect, the samples in the filament form have been immersed for 5 h (at 25°C and 40°C) and their volumetric dimensions were measured. Again the samples were exposed to 5 h in the open air and final volumetric dimensions have been measured (see Figure 10). Table 11 gives the shape memory effect of different samples in different stimulus conditions. For samples immersed at 25°C, the percentage recovery of the shape was measured maximum in case of PLA-1% ZnO (97.8%) and minimum in extruded PLA without reinforcement (85.74%). For samples immersed at 40°C, the recovery was measured maximum in PLA-2% ZnO (94.64%) and minimum in PLA-1% ZnO.
Shape memory effect under different water stimulus.
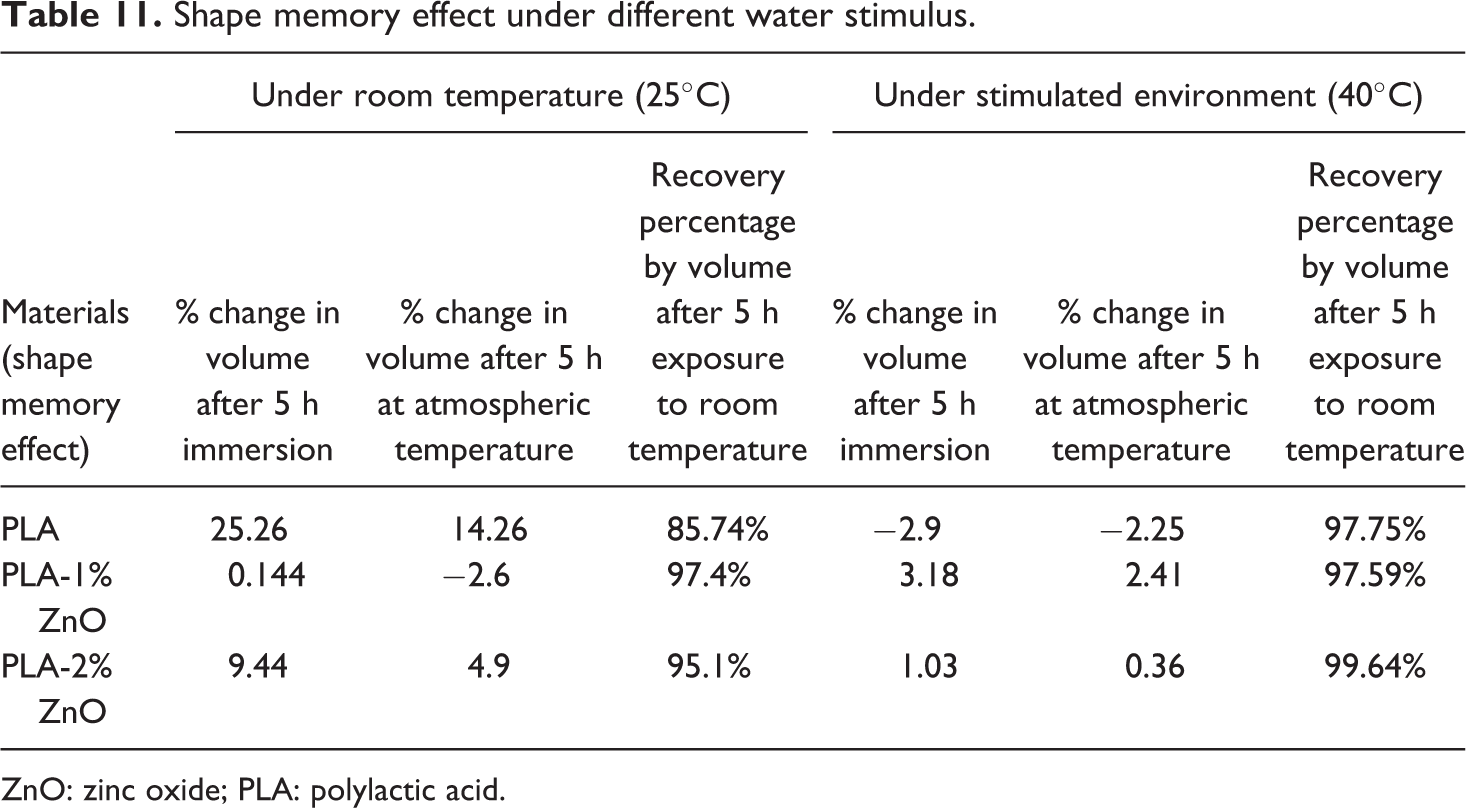
ZnO: zinc oxide; PLA: polylactic acid.
For maximum shape memory effect under normal condition PLA-1% ZnO and under elevated temperature condition PLA-2% ZnO is a better option. Since, the optimum human body temperature is near about 40°C so that biosensing will be maximum respond for the PLA-2% ZnO samples.
Printability of the ZnO-grafted PLA thermoplastic composites
Here it has been ascertained that for maximum shape memory, maximum tensile strength, maximum hardness and maximum crystallinity the PLA-ZnO combination obtained was PLA-2% ZnO. The feedstock filaments of PLA-2% ZnO were printed to check the printability of the composition on open-source commercial FDM 3D printer. The FDM was operated at 200°C nozzle temperature, 60°C bed temperature, 100% infill density and rectilinear fill pattern. It has been observed that the PLA-2% ZnO was capable of printing and there were ±2% volumetric tolerances as compared to the original design. Figure 14(a) shows the original computer-aided design of the part and Figure 14(b) is the actual printed sample.
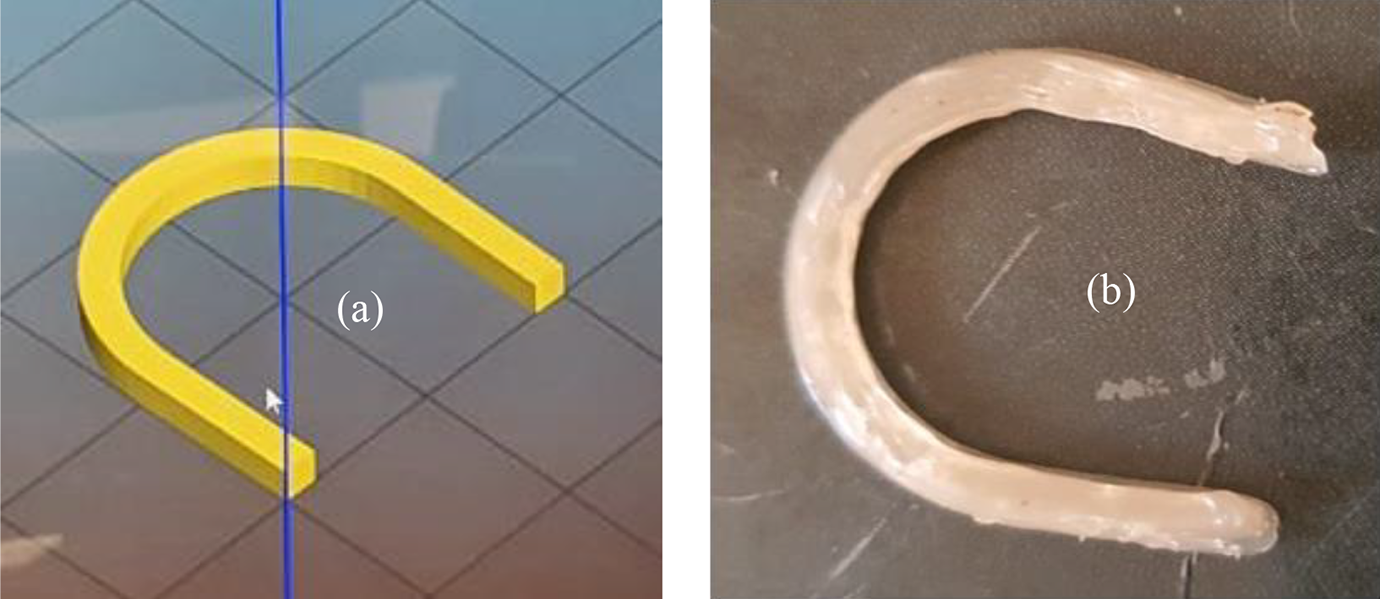
(a) CAD design for 3D printing and (b) actual printed part.
Conclusions
Following conclusions have been made from the present study:
Synthesized ZnO NP before crystallization/sintering induced heat in itself shows the sign of non-crystallinity. But on the other hand, the sample of ZnO after crystallization/sintering emitted heat and an upward peak was observed, which shows the presence of crystallinity in the ZnO NPs.
In virgin PLA grain, there negligible crystallinity was present (crystallinity: 0.30% in the first heating cycle and 0% in the second heating cycle) but after extrusion to the 170°C, there is a larger peak of crystallinity has been observed (crystallinity: 4.87% in the first cycle and 3.35% in the second cycle). The extrusion process enhanced the crystallinity for thermal stabilization. Also, varying the concentration of ZnO NP into PLA matrix resulted in wide variation of crystallinity. It has been observed that crystallinity for PLA + 1% ZnO was 14.03% and for PLA + 2% ZnO was 21.68%.
The mechanical and morphological properties suggested that PLA-2% ZnO has possessed much better properties as compared to PLA-1% ZnO. The optimization of the process parameter has been performed. The optimum values are between 0 wt% and 0.23 wt% of ZnO powder, 11–14 kg load and 0.12–0.20 Nm of torque.
For maximum shape memory effect under normal condition PLA-1% ZnO and under elevated temperature condition PLA-2% ZnO is a better option. Since, the optimum human body temperature is near about 40°C so biosensor will respond better for PLA-2% ZnO samples.
The previous studies have been reported that ZnO-based nanocomposites are highly sensitive to fluorescence and photoluminescence which is best suited for preparations of dopamine, glucose and protein. So, ZnO-based nanocomposites are reported as biosensors materials by the previous authors.29–31 The present study is focused on the mechanical behaviour of 3D printed parts for possible 3D printing of biosensors in future biomedical applications. Also for ascertaining 4D properties, the immersion in water may be extended to 2–4 days for predicting PLA composite water resistivity by measuring the dissolution using inductively coupled plasma optical emission spectroscopy to confirm its leaching.
Footnotes
Acknowledgements
The authors are highly thankful to Centre for manufacturing research, GNDEC, Ludhiana, University Centre for Research and Development, Chandigarh University and Department of Physics, Chandigarh University for providing financial/technical assistance to carry out the research work.
Funding
The author(s) received no financial support for the research, authorship, and/or publication of this article.