
Abstract
In past two decades, the 3D printing of thermoplastic-based composite matrix has been widely explored for different engineering applications. But hitherto little has been reported on the preparation of polylactic acid (PLA) composite-based 3D-printed circular disc to ascertain its circumferential compressive strength, thermal conductivity, and morphological properties for possible structural engineering applications. The present investigation outlines the circumferential compressive strength, thermal conductivity, and morphological properties (Shore D hardness, surface voids using fractured surface analysis) of 3D-printed PLA composite matrix. Based upon the thermal conductivity test, it has been ascertained that sample printed on fused deposition modeling (FDM) setup with infill density of 100%, infill angle of 90°, and infill speed of 70 mm/s has shown maximum thermal conductivity (0.278 W/mK). Further it has been observed that with the increase in infill density, thermal conductivity of the sample has improved. Circumferential compressive testing has been performed on universal tensile testing machine setup (with in-house developed fixtures), and from printer setting optimization viewpoint, it has been ascertained that infill density has maximum contribution for peak and break strength. Further morphological studies (surface hardness, fractured surface analysis, and surface roughness (Ra) data) have supported the observed behavior of circumferential compressive strength and thermal conductivity of 3D-printed samples.
Keywords
Introduction
Thermoplastics find various applications being a flexible material for incorporating different reinforcements in its base matrix. Different filler materials have been found suitable for reinforcement in polymeric base to provide required property such as ceramic particles for hardness, tensile strength, 1 ferrous ferric oxide (Fe3O4; magnetite particles for magnetic property),2,3 and alumina particles for decreasing the melt flow index (MFI) of composite.4,5 Polymeric composite finds application in electronics and electrical industry as they behave as insulator and shows low electrical conductance, which is the required property for printed circuit board and holders for different devices.6,7 Various researchers have investigated the thermal conductivity of polymers and have found that amorphous and virgin polymers have shown low thermal conductivity (ranging between 0.1 W/mK and 0.3 W/mK). 8 Polyvinyl alcohol (PVA) reinforced with cellulose nano crystals (CNCs) have been investigated by researchers for different molecular weights of PVA, different loadings of CNC fillers in PVA, and different ordering parameters, and it has been observed that with increasing content of CNC in the base matrix, the thermal conductivity has improved up to 3.45 W/mK. The CNC orientation in the composite matrix has a vital role to play for improving thermal conductivity of the prepared composite. 9 Researchers have also worked for the super thermal conductivity of the polymeric composite for thermal management application and have observed that polyethylene when carefully deposited in perfect chain without entangling of atoms may result in better thermally conductive chain with thermal conductivity of 62 W/mK, which was higher than some of the ceramic and metals. 10 Hybridized fillers reinforcement, one of the techniques to prepare electrically and thermally active polymeric composite, has been investigated by some researchers, and it has been observed that deposition of different fillers in the matrix for different continuous phases of polymeric crystal has resulted in multifunctional component with high thermally and electrically active component. 11 Polymeric composite with lower weight of reinforcement and high thermal and electrical conductance may have some good application for lightweight components such as electronic and electrical parts as these composite may be used for replacement of heavyweight components from circuit, which are generally made of metal or ceramic composite. These lightweight components may also find application in manufacturing of fuel cells.12,13 The effect of filler dimension has also played important role in conductivity of composite, but some researchers have also used similar thickness, aspect ratio, and size of the filler in hybrid composite, so that compatibility of composite would be enhanced in comparison to different size fillers. It has been observed that 44% of filler (graphene and boron nitride (BN)) enhances the thermal conductivity by 35 times. 14 Some research groups have investigated the effect of graphene reinforcement in epoxy-based thermoset polymers and have observed that when graphene content in epoxy resin is increased more than 40 wt%, then thermal conductivity of the composite reached 12 W/mK. Moreover, presence of graphene in the composite has enormously enhanced the electrical conductivity for the component.15,16 Polyethylene and polyvinyl chloride (PVC) reinforced with varying range of carbon materials wt% in the composite have been investigated for the thermal conductivity, and it has been observed that with increasing carbon chain in composite, the conductive chain of the composite increases to the same extent and also it was observed that temperature has a negative relation with thermal conductivity of the composite material. 17 Researchers have also investigated some fundamental theoretical models for thermal conductivity approximation and have suggested an equation which may be used to calculate the thermal conductivity of any composite material whose parent component thermal conductivity is known already. The observation has suggested that the theoretical model was accurate. 18 Further, new parameters were added in the standard theoretical equation to enhance the predictability of model such as length/diameter ratio, which was incorporated into the model equation. 19 The comparative study of graphene and carbon nano tube (CNT) for the composite has suggested that graphene has shown higher thermal conductivity than CNTs. Therefore, graphene may also be used in electronic applications where super conductive composite is required with reduced weight of component. 20 Microstructure of polymer composite may also be designed per requirement, so that it may behave as super conductive material from thermal viewpoint. Researchers have explored this and have observed that filler orientation and filler agglomerates have positive effect on thermal and electrical properties of composite. 6 It has been observed that phonons are the responsible factors for polymeric heat conduction. The length of the phonon in case of the polymer is very low due to which most of the polymeric matrix exhibits small thermal conductivity range varying from 0.1 W/mK to 0.5 W/mK. But the flexibility of the polymer for processing conditions, preparation of composites, lightweight components, and so on attract the scientist to explore the polymeric matrix for higher thermal conductivity with some reinforcement of metal/ceramic powder. Various fillers such as aluminum oxide (Al2O3), silica powder, iron powder, and graphene powder have been used by previous researchers to make the polymeric matrix more thermally conductive.21,22 Polyimide matrix with BN up to 30 wt% has shown the thermal conductivity of 0.71 W/mK, which was higher than the polyimide alone. Moreover, the presence of BN particles in polyimide has also increased the thermal stability by increasing the glass transition temperature (Tg) as well as heat resistance index. 23 Polyethylene glycol (PEG) polymeric base in addition to Al2O3 has shown better thermal conductivity (0.42 W/mK) than virgin PEG (0.29 W/mK). Only 4 wt% of Al2O3 has resulted in nearly 41% improvement in thermal conductance of composite. 24 It has been observed by previous studies that amorphous structure of the polymeric material results in low thermal conductivity (k < 0.2 W/mK), whereas crystalline and dense structure such as high-density polymer ethylene result in better thermal conductivity (k > 0.5 W/mK). 25 Also it has been observed that amorphous structure of polymers shows strange phenomenon as up to Tg, the thermal conductivity shows improvement, whereas after Tg, the thermal conductivity decreases.26,27 Researchers have investigated the effect of carbon black as reinforcement in the polymeric matrix and have found that carbon black has less contribution toward thermal conductivity, whereas its effect on electrical conductivity was significant. 28 Researchers have observed that covalent bond formation between the filler and the polymeric base has resulted in better transfer of phonon, which is responsible for heat-carrying capacity, thus ultimately leading to better thermal conductivity. 29
The literature review reveals that in past two decades, the 3D printing of thermoplastic-based composite matrix has been widely explored for different engineering applications. But hitherto little has been reported on the preparation of polylactic acid (PLA) composite-based 3D-printed circular disc to ascertain its circumferential compressive strength, thermal conductivity, and morphological properties for possible structural engineering applications. The present investigation outlines the circumferential compressive strength, thermal conductivity, and morphological properties (Shore D hardness, surface voids using fractured surface analysis) of 3D-printed PLA composite matrix. This work is an extension of previously reported work in which magnetic properties of feedstock filaments prepared from PLA composite matrix (comprising of Fe3O4 powder, wood powder, and PVC polymer having self-assembly characteristics) were optimized. 2 In the present work, an effort has been made to conduct thermal conductivity test (for minimum possible value) for 3D-printed circular disc per Lee disc method and circumferential compressive testing (for maximum possible value) on universal tensile testing machine (UTM) to standardize the thermal and compressive properties of PLA composite material matrix in structural engineering applications.
Materials and method
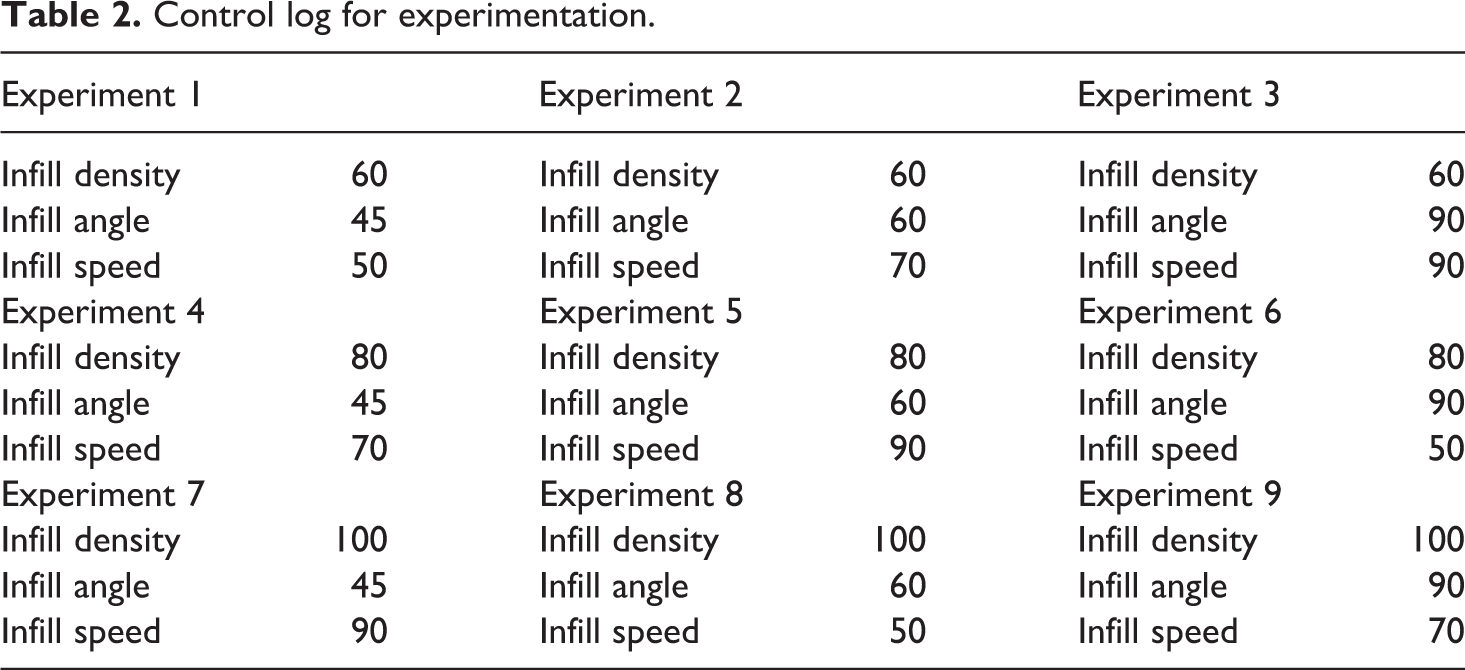
As the hybrid blended feedstock filament composed of (i) virgin PLA 50 wt%, (ii) PVC 25 wt%, (iii) Fe3O4 20 wt%, and (iv) wood powder 5 wt% as per optimized composition/proportion suggested in previously reported work2,3 has MFI for PLA: 28.01 g/10 min and for hybrid blended matrix: 42.37 g/10 min. The suggested optimized twin-screw extrusion (TSE) processing conditions were loaded: 5 kg, barrel temperature: 165°C, and torque: 0.12 Nm. The feedstock filaments were prepared by using standard extrusion conditions as reported in the literature. 2 The Lee disc to be printed on fused deposition modeling (FDM) setup was designed with solidworks tool of 110 mm diameter and .STL file was saved to configure it on slicer3r software (Prusa Edition 1.38.6) where the input processing parameters of FDM were set. In the present case study, three input parameters (infill density, infill angle, and infill speed) of FDM were selected and Taguchi L9 orthogonal array (OA) has been used for design of experiment (DOE). The prepared feedstock filament of diameter 1.75 ± 0.05 mm was loaded manually on FDM setup (Make: Divide by Zero, Pune, Maharashtra, India) and specimens were 3D printed. Table 1 presents the input parameters and their levels. The 3D-printed discs were subjected to circumferential compressive testing and peak strength, break strength, peak load and break load were noted, and stress versus strain plot was recorded based on which modulus of toughness was calculated. Table 2 lists the control log for experimentation. Figure 1 shows the procedure used for current investigation. For this case study, ASTM D2290 standard of testing has been taken as reference and customized modifications were made. To consider the effect of input parameters of FDM on circumferential strength of disc, the ASTM D2290 standard was modified and in place of split ring test method, the complete disc was tested using Y-shape holders in which grooves were in built printed to hold the specimen accurately and Y-shape holders were fixed in UTM setup to perform the test with uniform rate of compression 30 mm/s. The disc for testing was 3D printed for ϕ110 mm and thickness 1.74 mm. The reason for selecting the thickness of 1.74 mm was that one is interested in printing the specimen with least possible layer thickness of 3D printing as low layer thickness results into proper heat transfer between layers. It should be noted that 0.174 mm of layer thickness was possible in the available FDM printer (Model: Divide by Zero). The final specimens printed were of 1.74 mm thickness for 10 layers of 3D printing on available FDM setup.
Input processing parameters of FDM with their levels.
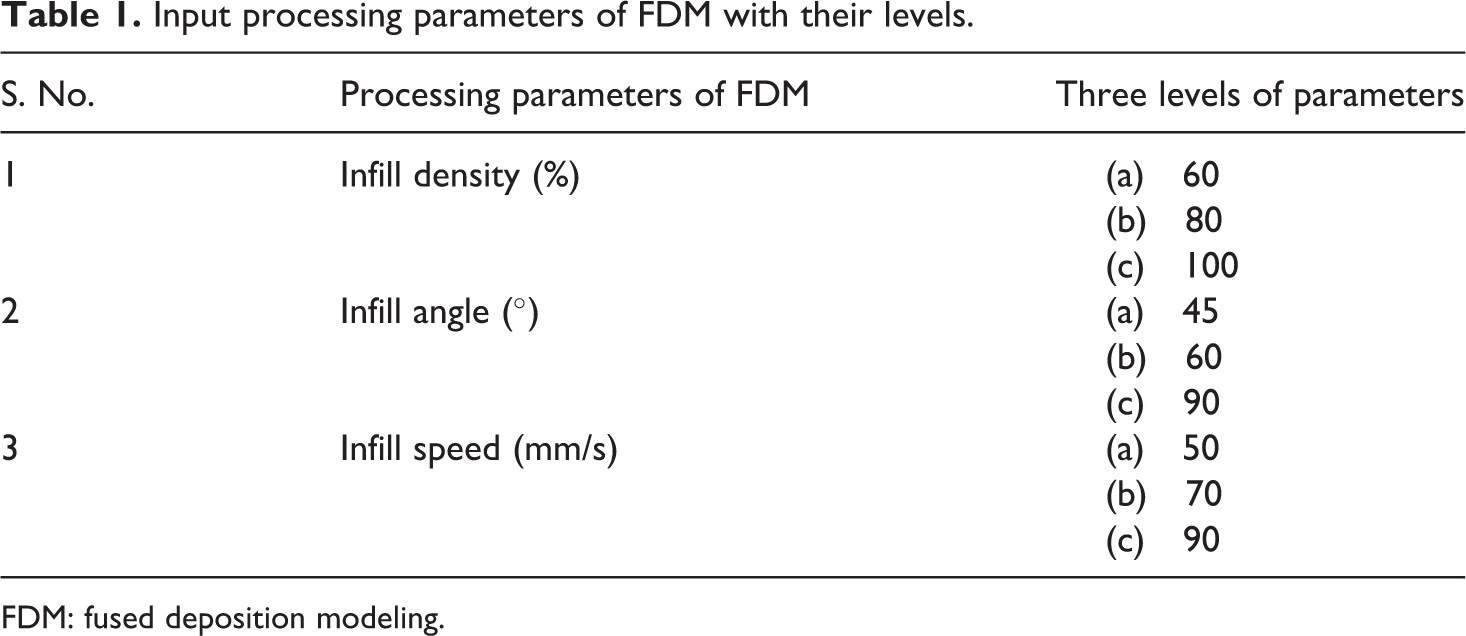
FDM: fused deposition modeling.
Control log for experimentation.
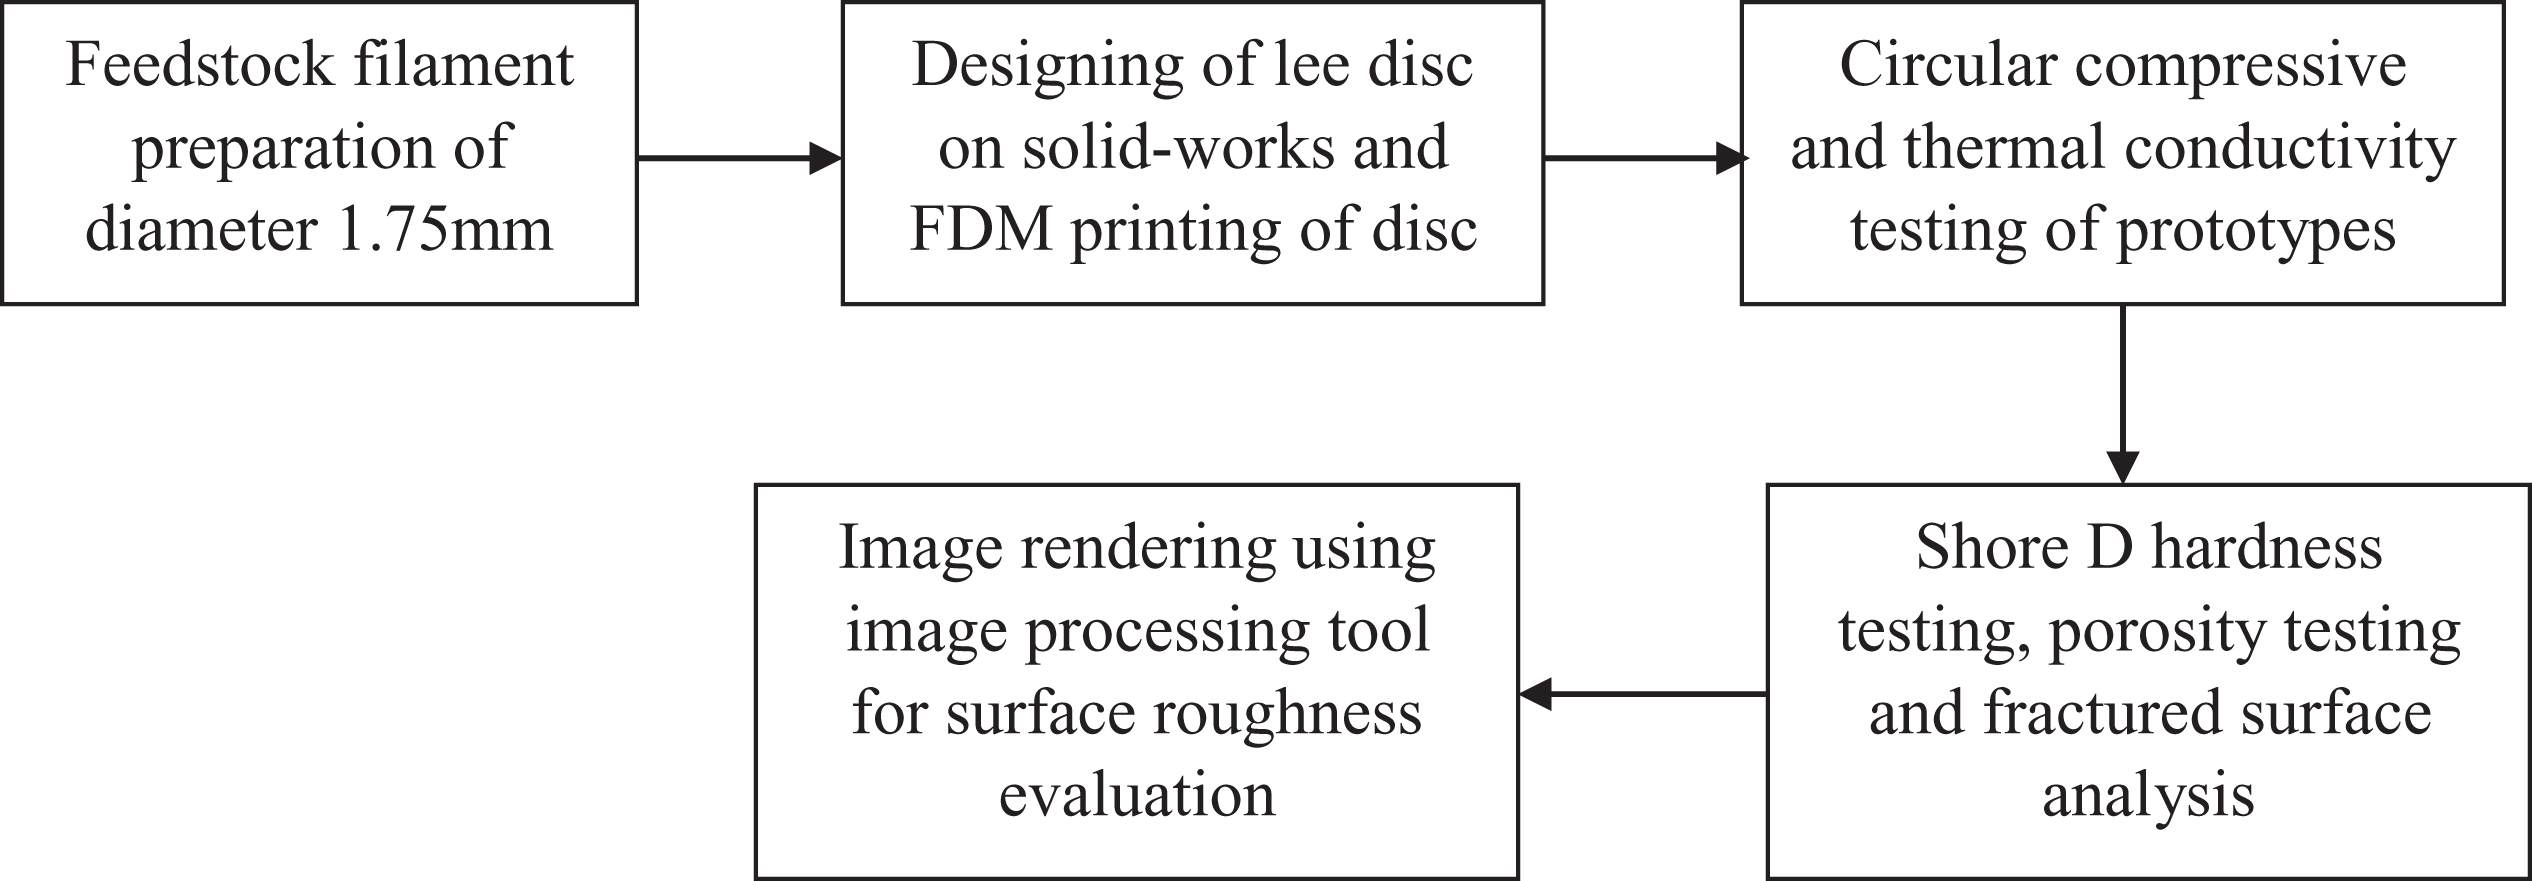
Adopted procedure for current investigation.
Experimentation
Twin-screw extrusion
The hybrid blended feedstock filaments that are composed of (i) virgin PLA 50 wt%, (ii) PVC 25 wt%, (iii) Fe3O4 20 wt%, and (iv) wood powder 5 wt% were prepared successfully with the required diameter of 1.75 ± 0.05 mm. It was observed that for the given dimension of disc (110 mm diameter), approximately 10 m length of feedstock filament was consumed (in 3D printing of one disc). The feedstock filament was prepared with TSE at 165°C and torque 0.12 Nm at 5 kg of loading conditions per previous reported study. 3
3D printing and circumferential compressive strength testing
The prepared feedstock filaments were used for 3D printing on FDM setup by loading it manually. Based on Table 2, nine different printing conditions were configured for the disc, and G-codes were exported and loaded on FDM integrated computer. Several parameters such as layer thickness, fan output, nozzle diameter, bed temperature, extrusion temperature, and so on, were taken as constant (see Table 3). Figure 2 shows the prepared feedstock filament. Figure 3(a) shows the actual dimensions of disc to be printed on FDM setup, and Figure 3(b) shows the actual printing of disc. For circumferential compressive testing, a specific holding fixture was designed and 3D printed (Figure 4), so that disc may be properly held while compressive testing on UTM. The samples were printed using infill angle of 45°, 60°, and 90°, and while testing, it has been ensured that the sample with 90° infill angles was fitted such that the compression force acts perpendicular to the specimen. In other words, for 90° infill angle, the sample was printed by fixing nozzle movement perpendicular to the X-axis and compressive force was applied along the X-axis. Further, for comparison purpose, the direction of applying compressive force was along X-axis only, but the nozzle print angle was made fixed as 45 and 60° while printing along the X-axis.
Fixed input parameters of FDM setup.
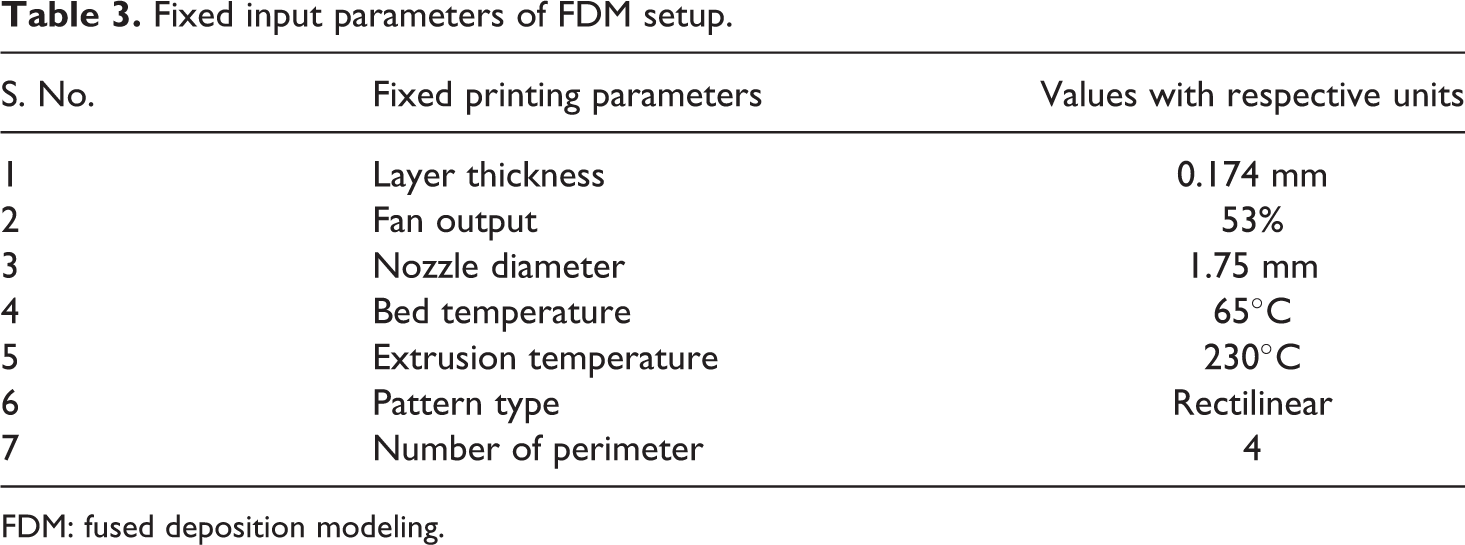
FDM: fused deposition modeling.
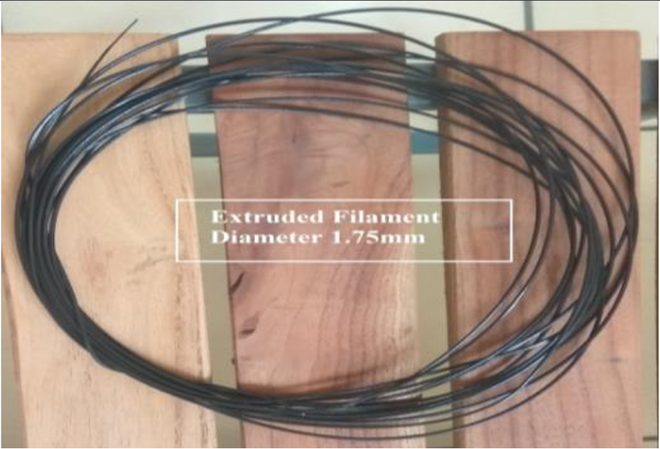
Feedstock filament with TSE.
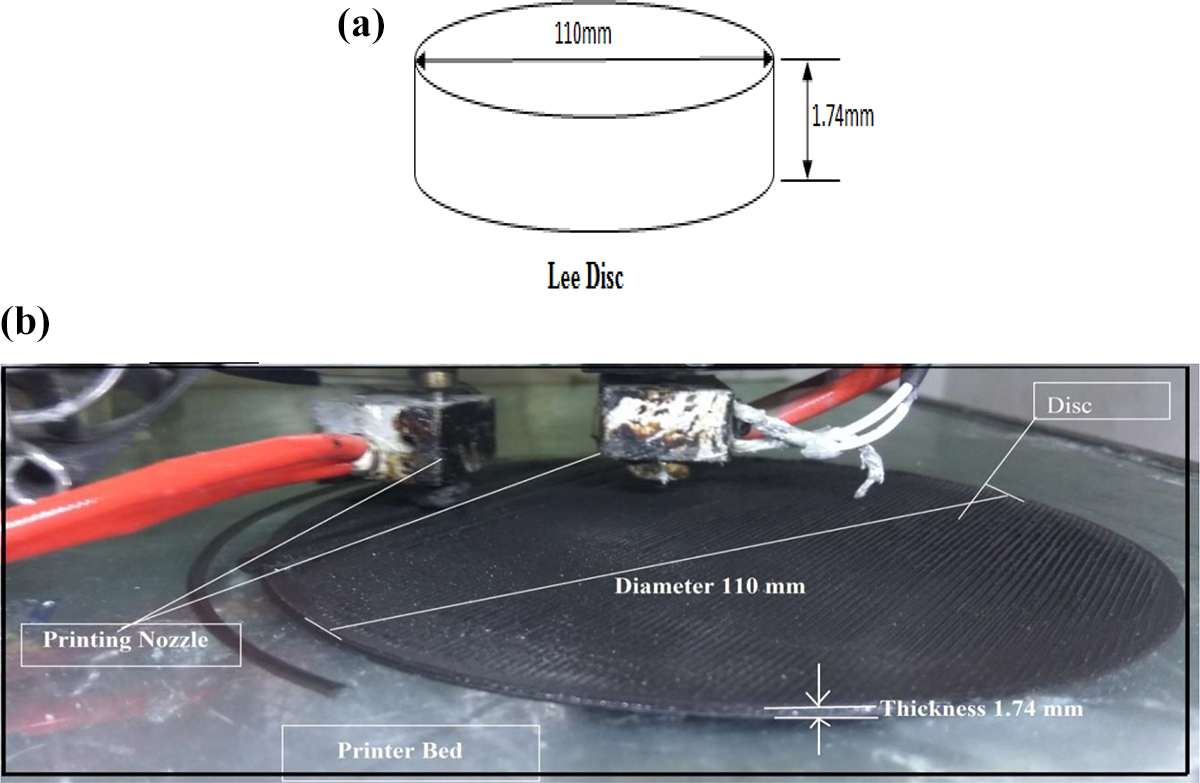
(a) 2D profile of disc. (b) 3D printing of disc.
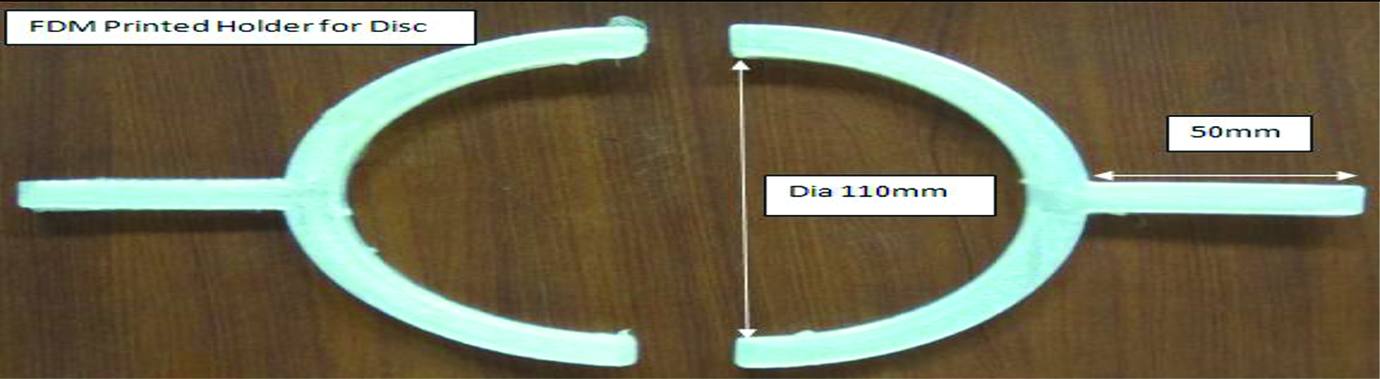
3D-printed fixture for holding of disc while circular compression testing on UTM.
Thermal conductivity test
The printed specimens/discs were then subjected to thermal conductivity testing using Lee disc methodology. Lee disc apparatus consisted of steam chamber, Lee disc, heating equipment, pot for steam production, pipe to join pot with stem chamber, and two temperature sensors one for steam chamber and another for Lee disc as shown in Figure 5.
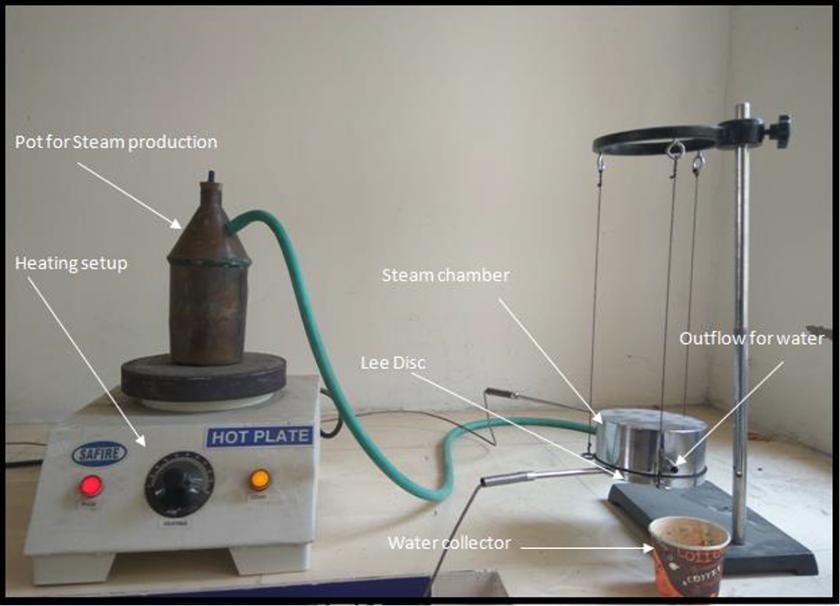
Lee disc apparatus used for thermal conductivity measurement.
Circumferential compression testing on UTM setup
The UTM setup (Make: Shanta Engineering, Pune, Maharashtra, India) with 5000 N capacity was used for compressive testing of circular disc. It should be noted that there may be slippage of disc while compression testing; therefore, a specially designed circular fixture was 3D printed (Figure 4), and peak load, break load, peak strength, break strength, and stress versus strain plot were taken from testing for further optimization of processing conditions. Stress versus strain plot was further used to calculate the modulus of toughness of printed discs. Figure 6 shows the UTM setup in actual testing environment. It should be noted that while compression testing on UTM, testing module/software circular object has been taken with grip separation of 110 mm.
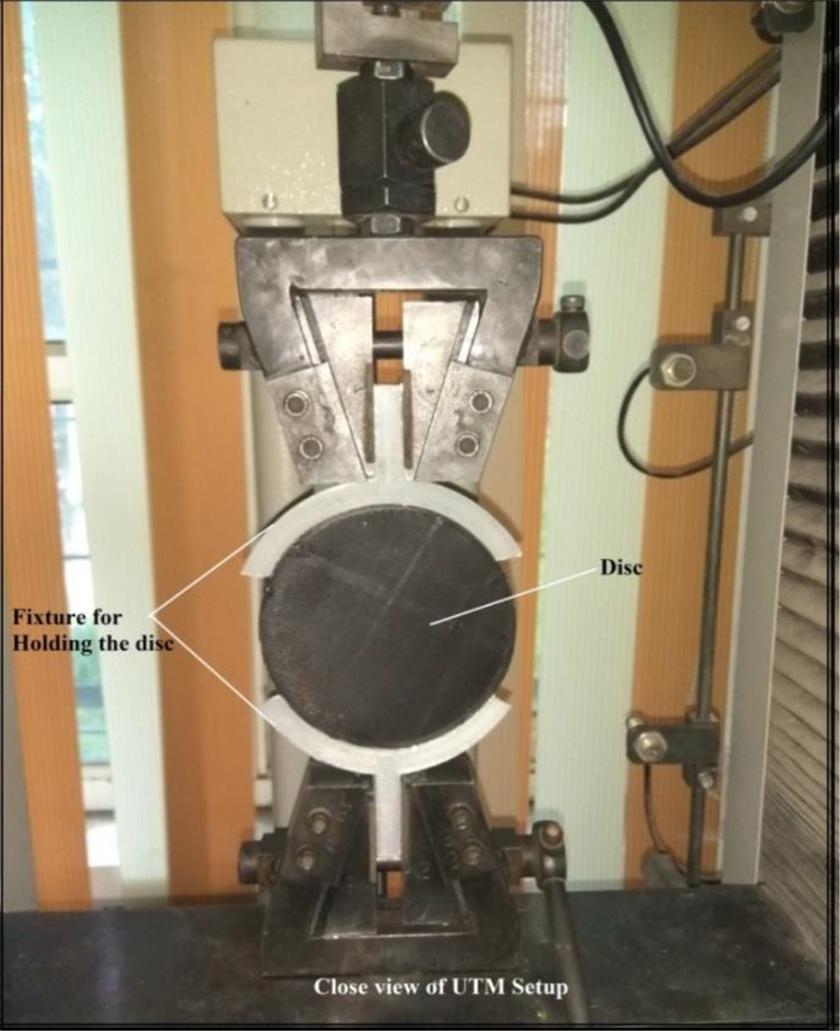
Circular compressive testing on UTM setup.
Morphological property testing
The 3D-printed disc/samples were also tested under tool maker microscope and images have been taken on ×30 magnification for further analysis. Shore D hardness tester was used to evaluate the surface hardness of printed sample. Surface properties were measured to correlate the mechanical and thermal properties with that of the morphological properties.
Results and discussion
Thermal conductivity results
The 3D-printed discs (Table 2) on FDM setup were subjected to thermal conductivity testing based upon Lee disc methodology. In Lee disc method, the printed disc of ϕ110 mm was inserted between the steam chamber and Lee disc (Figure 5), and the heater was made onto generate steam for heating the setup. After steam generation, the steam heated the steam chamber due to which the printed disc started conducting heat and Lee disc also started showing temperature reading by means of connected sensor. After the stabilization of temperature, the printed disc was taken out and then steam chamber and Lee disc were made to touch each other, so that temperature may rise to measure dT/dt (temperature vs. time) plot. After the calculation of dT/dt (Figure 7), the thermal conductivity was measured using equation (1).

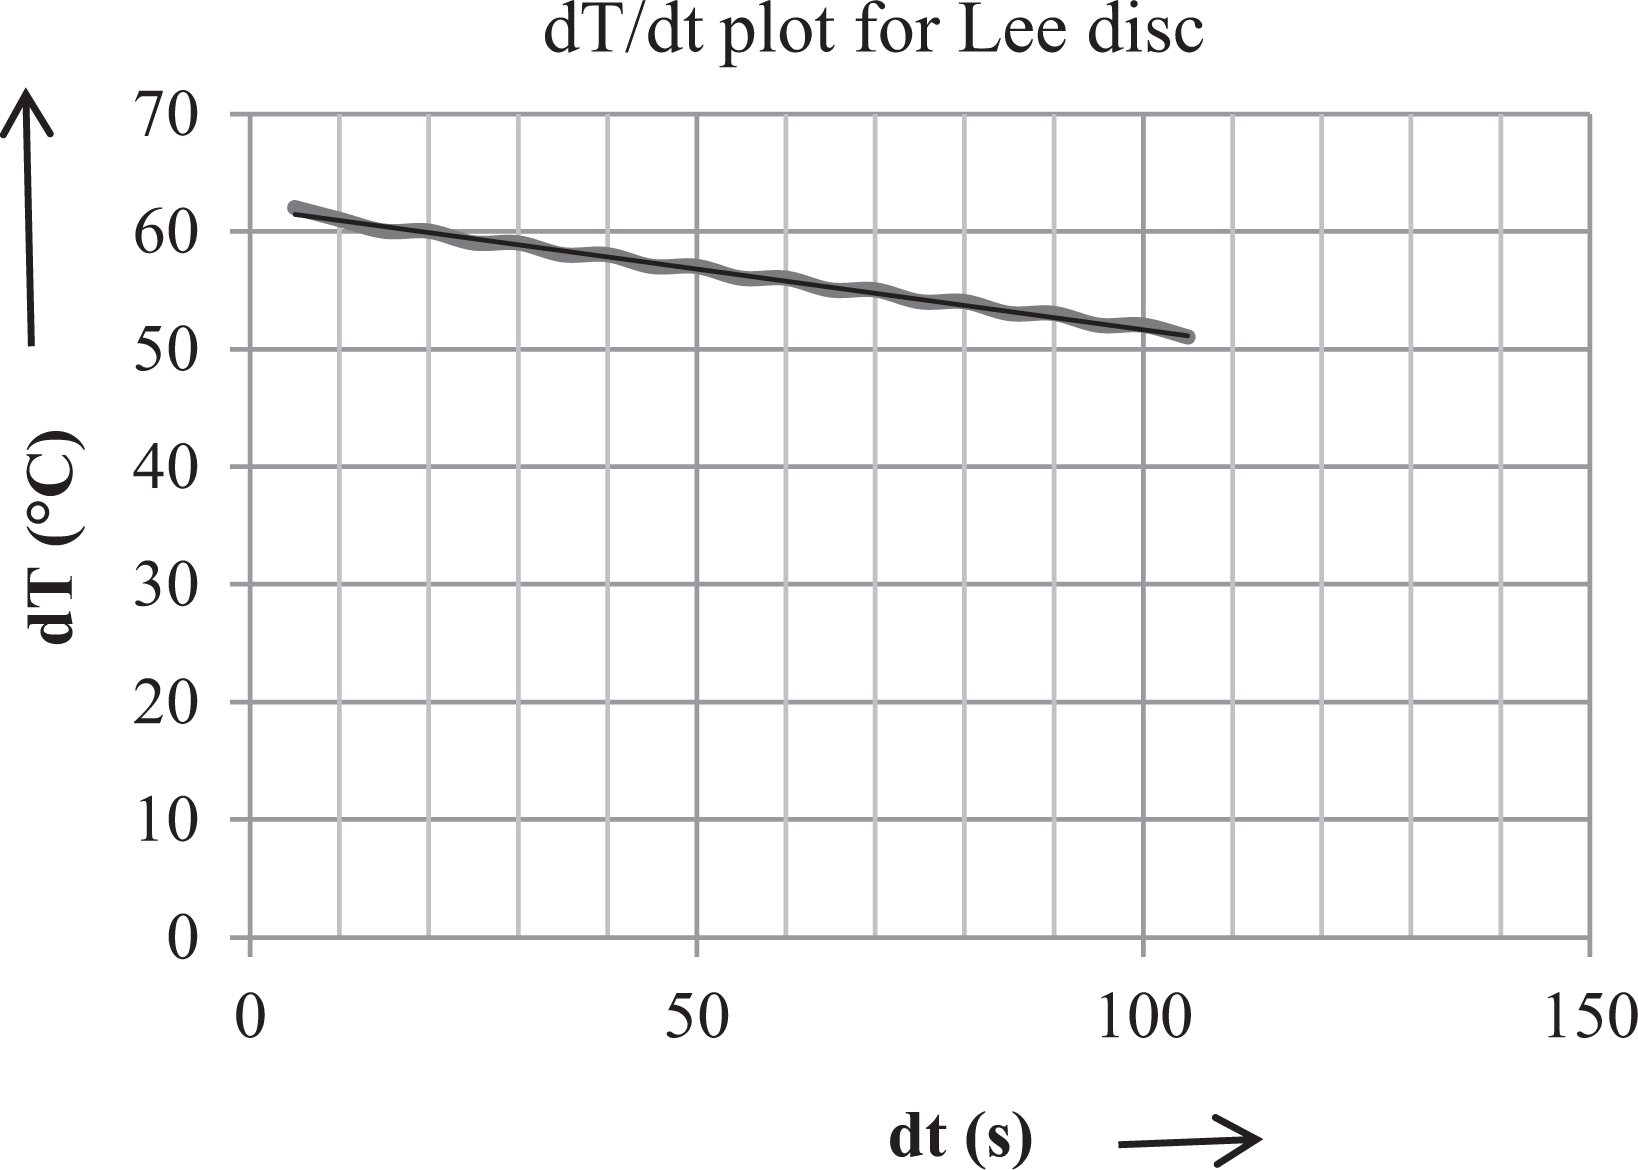
dT/dt plot from Lee disc apparatus.
Values for mass, thickness, area, and specific heat conductivity for lee disc are given below:

where y2 = 62, y1 = 51, x2 = 105, x1 = 5.
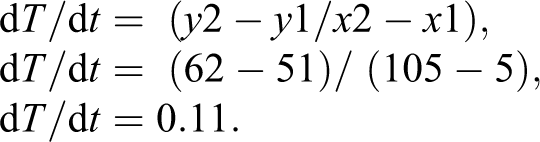
Table 4 lists the measured thermal conductivity for the nine set of 3D-printed discs. From Table 4, it was observed that least thermal conductivity (0.139 W/mK) was obtained for S. No. 1, which was printed with 60% of infill density, 45° of infill angle, and 50 mm/s of infill speed, whereas maximum thermal conductivity of 0.2781 W/mK was obtained for S. No. 9, which was printed with maximum infill density of 100%, infill angle of 90°, and infill speed of 70 mm/s. This may be due to the fact that thermal conductivity is directly related with the uniform structure formation as with least infill density, the structure may have more voids/porosity that resulted in nonuniformity of links between the deposited materials and hence resulted in low percolation effect and thus ultimately resulted in poor thermal conductivity. Whereas for maximum infill density, the printed sample may have less voids/porosity due to which links between the subsequent layers would be good enough to transfer the heat without any resistance due to which the thermal conductivity has been improved as seen from Table 4. Also the trend for thermal conductivity shows that as the infill density increases, the thermal conductivity improves, which again may be the reason that due to increase in infill density, the percolation effect enhances due to less voids/porosity between the deposited subsequent layers, which ultimately helped to transfer the heat from one side to other side.
Thermal conductivity for 3D-printed discs.
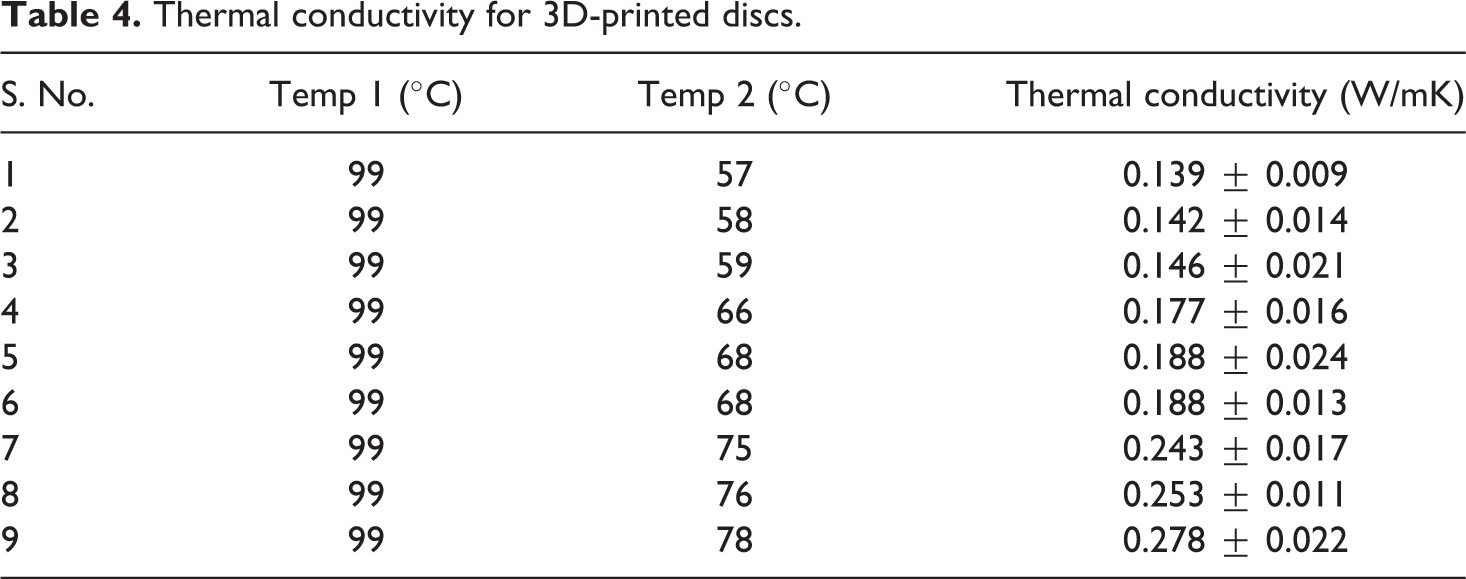
It should be noted that for structural engineering applications, lowest value of thermal conductivity is desirable, which is observed in the case of S. No. 1, whereas the highest value is observed for S. No. 9. The value for thermal conductivity for virgin PLA is around 0.23 W/mK.
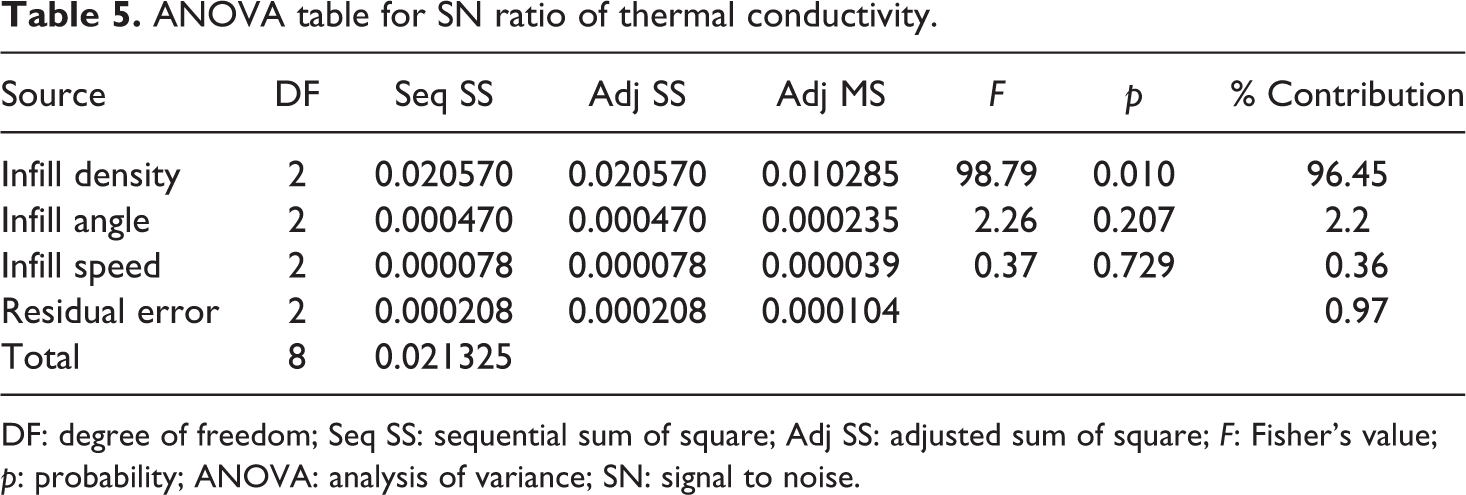
For processing condition optimization, the thermal conductivity results were taken to MiniTab 19 software package tool and Taguchi L9 OA was used for optimization. Table 5 lists the analysis of variance (ANOVA) table for signal-to-noise (SN) ratio of thermal conductivity (for smaller the better type case). It was observed that infill density is only significant parameter at 95% confidence level as p value is <0.05. Thus, it may be concluded that infill density is the sole responsible input parameter for thermal conductivity of the PLA hybrid blended matrix.
ANOVA table for SN ratio of thermal conductivity.
DF: degree of freedom; Seq SS: sequential sum of square; Adj SS: adjusted sum of square; F: Fisher’s value; p: probability; ANOVA: analysis of variance; SN: signal to noise.
Circumferential compressive testing results
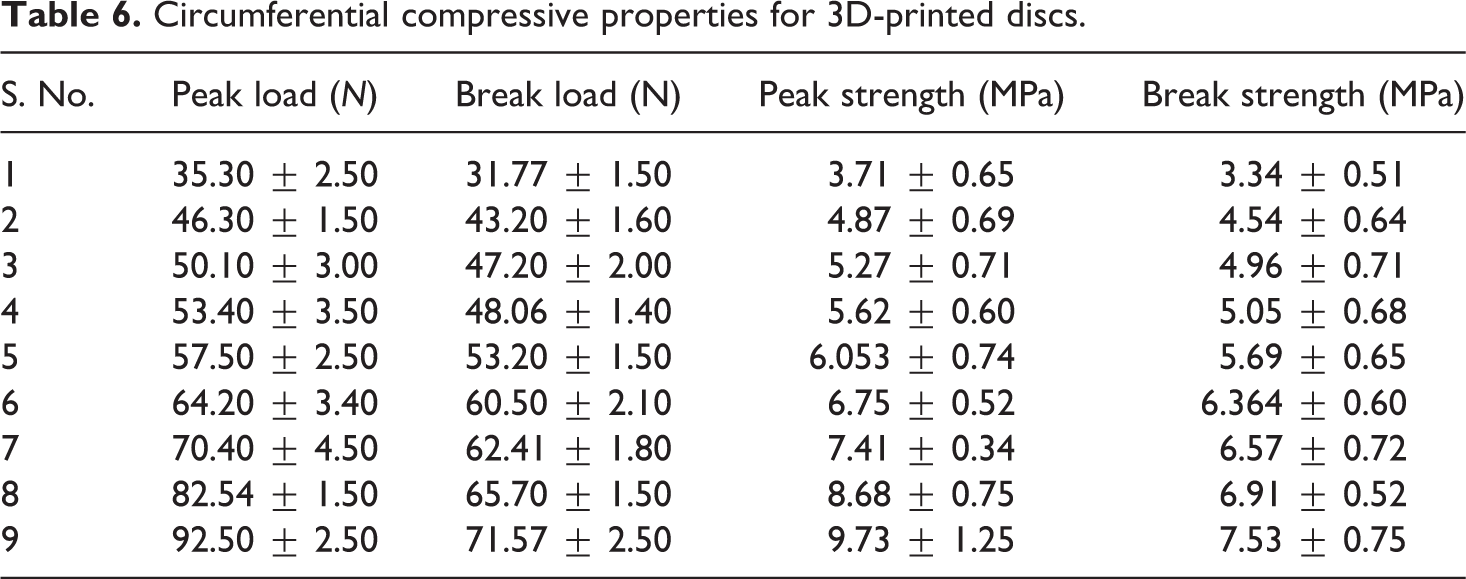
The 3D-printed discs based on Table 2 were subjected to UTM testing to ascertain the circumferential compressive properties for the printed disc. It should be noted that to avoid slippage of disc while in compression, a specially designed holding fixture was printed on FDM setup (which was made up of PLA material, see Figure 4), and the disc was held tightly with the prepared holder (Figure 6). Table 6 lists the compressive properties (peak load, break load, peak strength, and break strength) for the 3D-printed discs. It should be noted that three samples for each experiment were printed and tested for compressive strength, so that standard deviation may also be reported for the processing conditions. From Table 6, it was observed that compressive properties were improved as the infill density was increased and observed maximum for S. No. 9 printed with infill density of 90%, infill angle of 90°, and infill speed of 70 mm/s, which was in line with the observed thermal conductivity trends, thus clearly showing that better diffusion of the material in layer fashion resulted in better mechanical properties as well as provided a proper linkage/bonding between extreme printed layers for better thermal conductivity. Figure 8 shows the stress versus strain plot for the circular compressive testing, which was further used to calculate the toughness of printed discs as shown in Table 7. From Figure 8, it was observed that the printed discs have shown some ductility as their strain curve suggests. This may be due to the fact that the printed disc was of low thickness 1.74 mm, which may have given some flexibility toward distortion. Further, the stress versus strain plot was used to evaluate modulus of toughness using equation (2).

Circumferential compressive properties for 3D-printed discs.
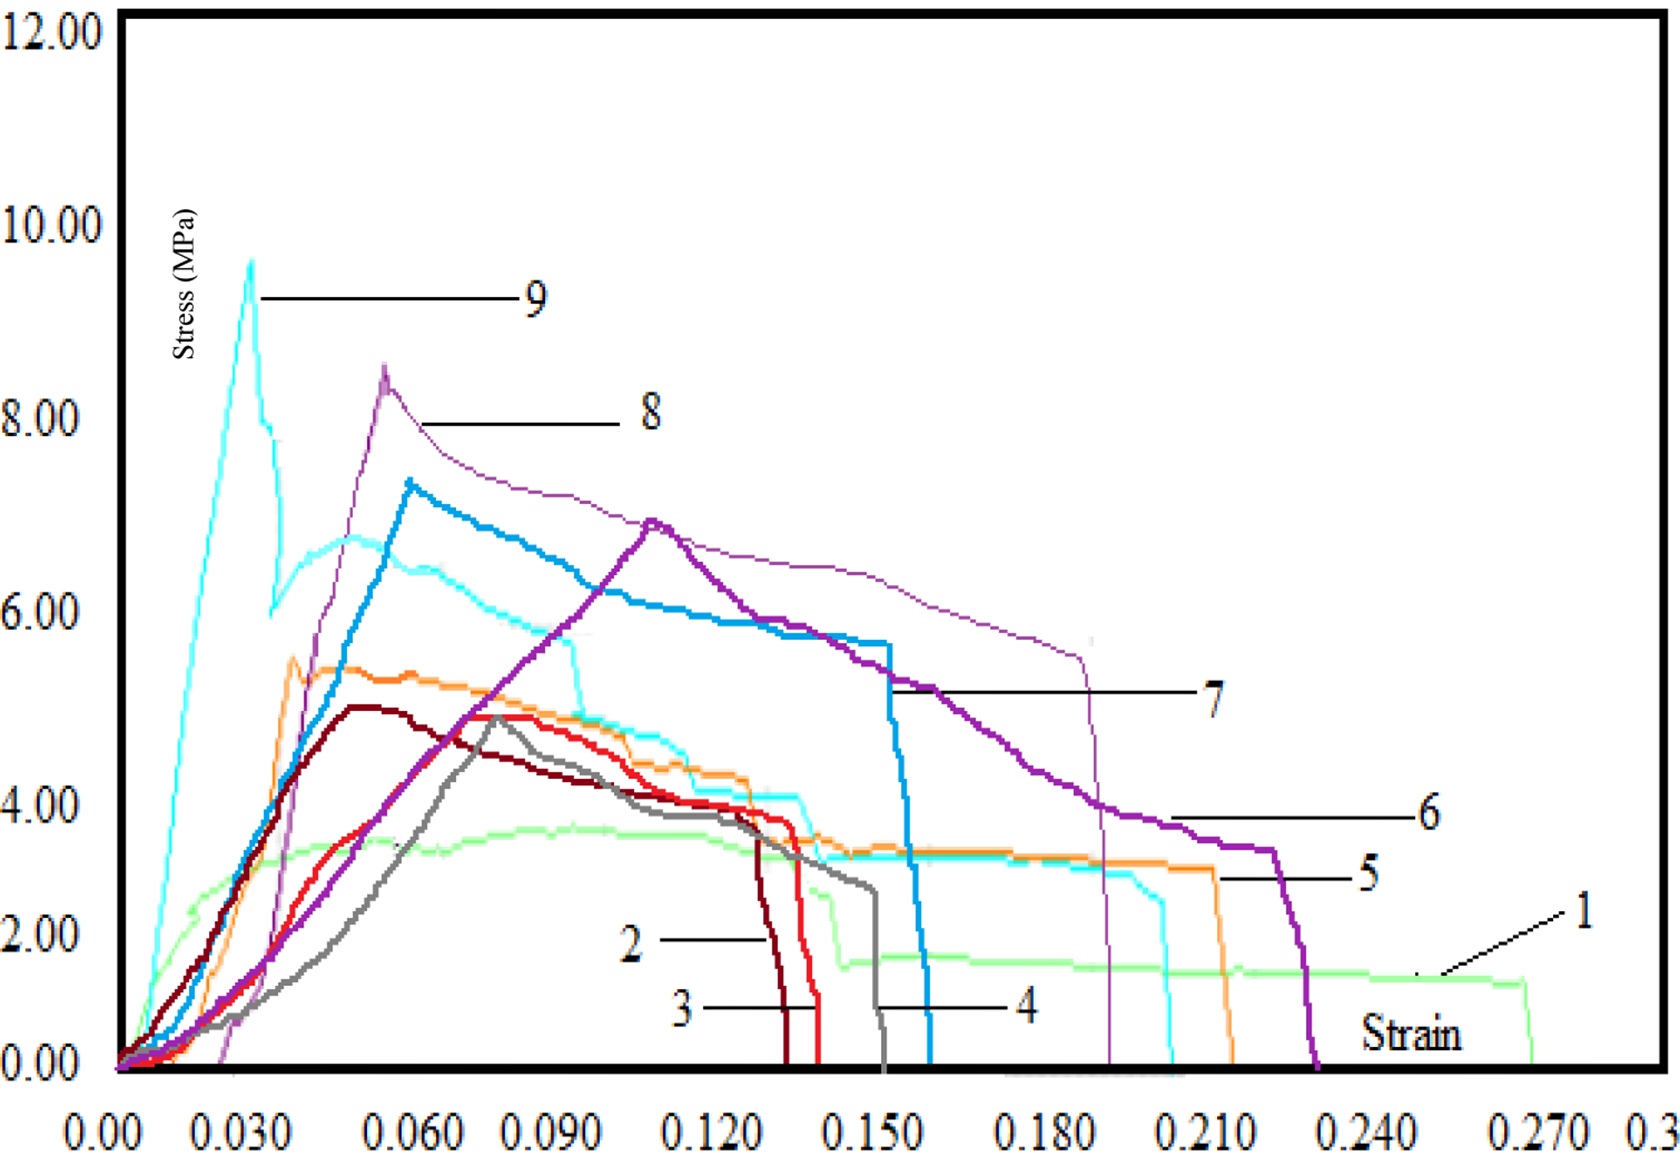
Stress versus strain plot for compressive testing.
Modulus of toughness for printed discs.
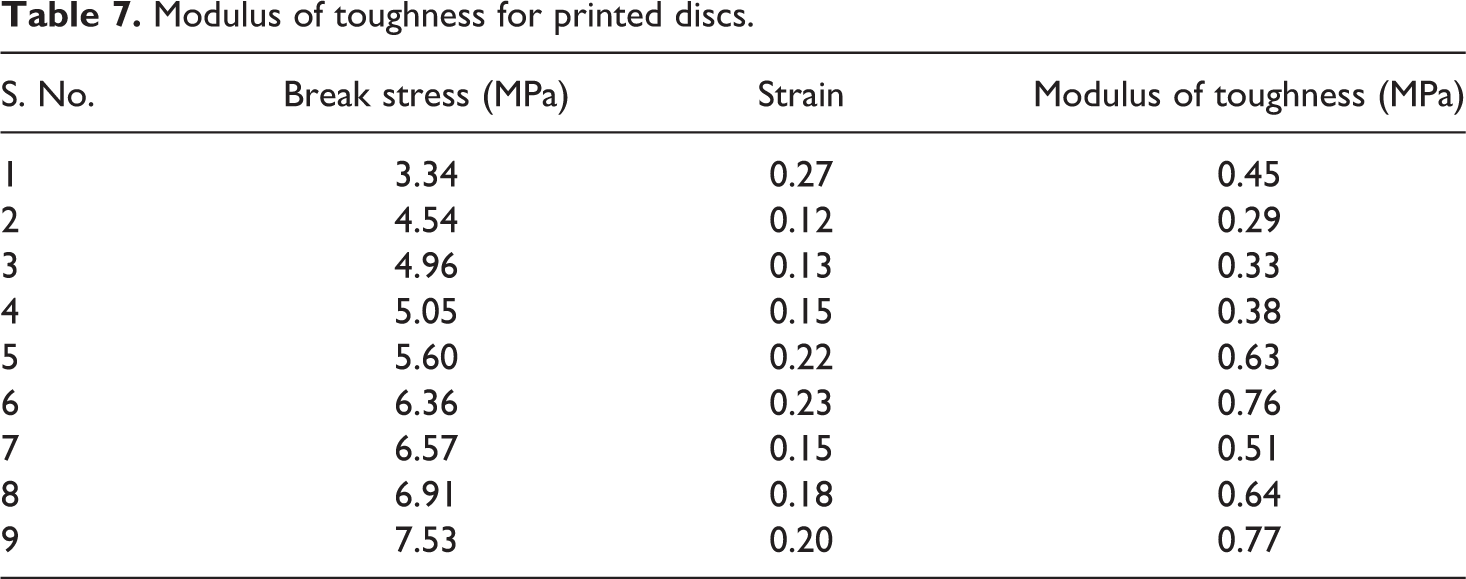
From Table 7, it was made clear that sample 9 held maximum modulus of toughness (0.7686 MPa), whereas sample 2 held least value of modulus of toughness (0.2934 MPa). Infill density has again played a major role in modulus of toughness as the values of modulus of toughness have observed to be increased with increasing infill density, which shows that sample 9 may have better crash applications (where larger modulus of toughness is required for circular sections).
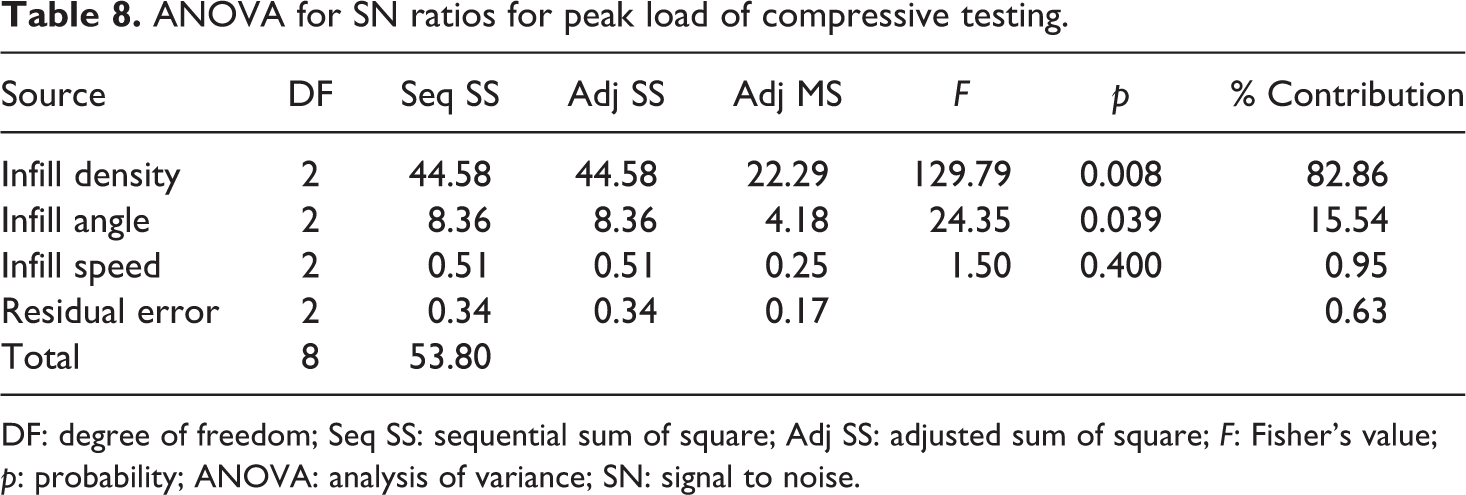
Optimization for compressive properties
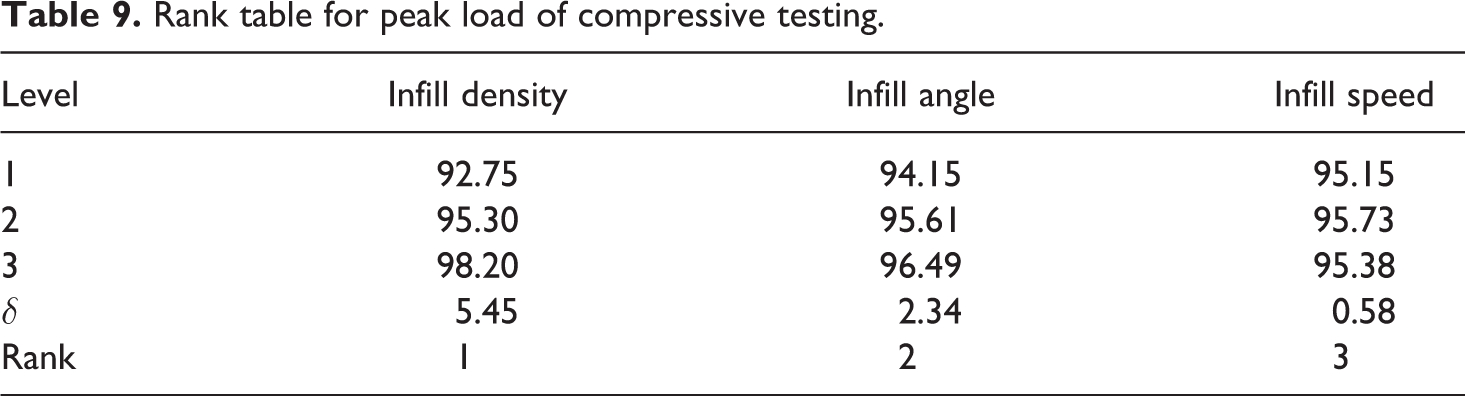
The properties observed from compression testing of circular disc were further used for optimization of printing conditions, so that the processing conditions of 3D printing may be standardized for batch production. Table 8 lists ANOVA for SN ratios from which it was observed that maximum contribution (82.86%) was given by infill density and infill angle (15.54%), whereas infill speed has least role to play toward output. It was also observed that infill density and infill angle were the significant parameters for the 3D printing as their probability ( p) value was less than 0.05 and Fisher’s (F) value was greater than 10. Table 9 lists the rank table for peak load of compressive tested sample from which it was observed that infill density was ranked first as its contribution was maximum toward the output, infill angle was given second rank, and infill speed which was least significant was given with third rank. Figure 9 shows the main effect plot for the SN ratios of peak load, which highlights that infill density of 100%, infill angle of 90°, and infill speed of 70 mm/s were the optimized condition for 3D printing of disc on FDM setup. It was observed that the optimized/suggested conditions were inside the selected DOE as experiment no. 9 (see Table 2).
ANOVA for SN ratios for peak load of compressive testing.
DF: degree of freedom; Seq SS: sequential sum of square; Adj SS: adjusted sum of square; F: Fisher’s value; p: probability; ANOVA: analysis of variance; SN: signal to noise.
Rank table for peak load of compressive testing.
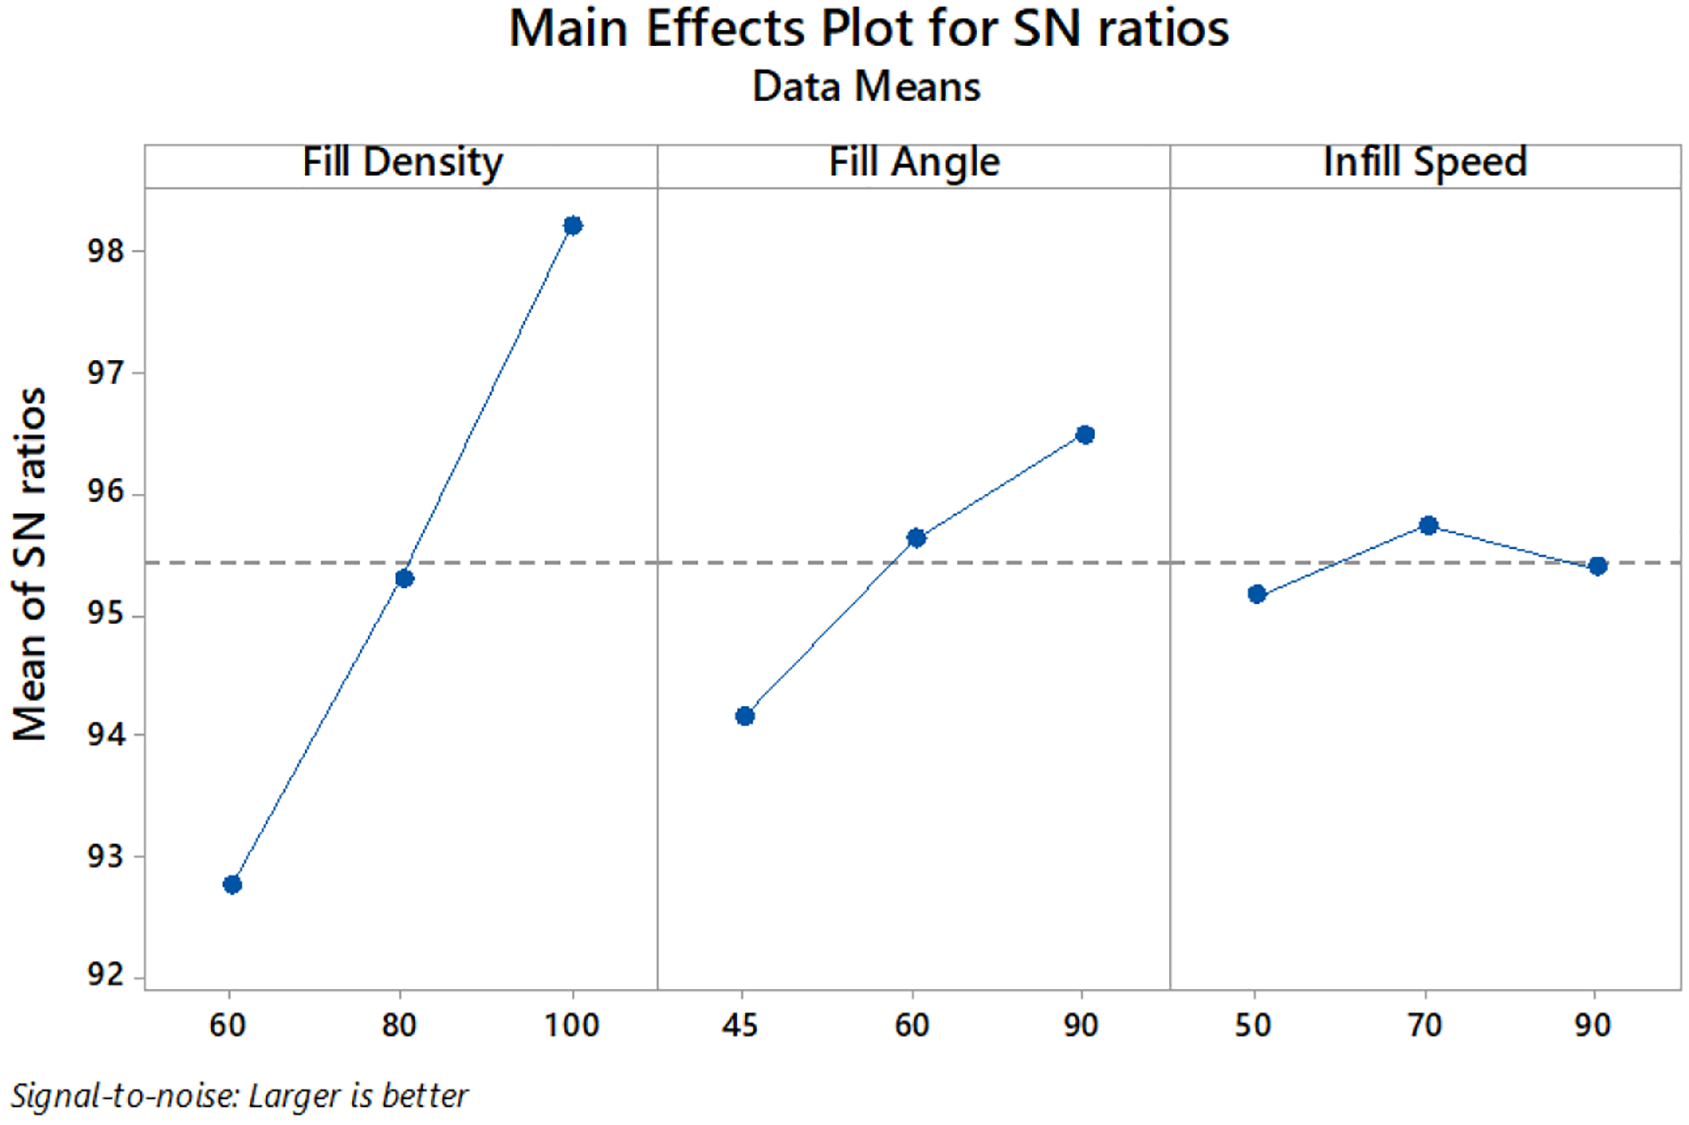
Main effect plot for SN ratio of peak load for compressive testing of disc.
Based on SN values, peak load optimization was performed by using equations (3) and (4):


where Q = SN mean of PL = 95.42, rA = max infill density from Table 9 = 98.2, rB = max infill angle from Table 9 = 96.49, rC = max infill speed from Table 9 = 95.73, putting all values in equation (3),
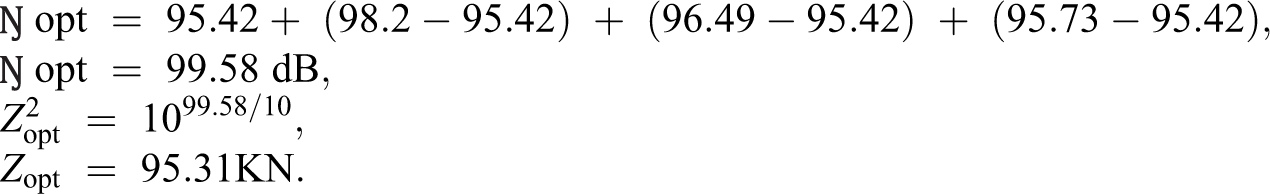
The actual peak load value for experiment no. 9 (92.50 ± 2.50 KN) was very near to the predicted value for the peak load (see Table 6). All other properties were optimized on the same line as explained above, and it was observed that similar trends have been obtained for all properties and the predicted results were very close to the actual observed results of compressive testing.
Morphological property testing results
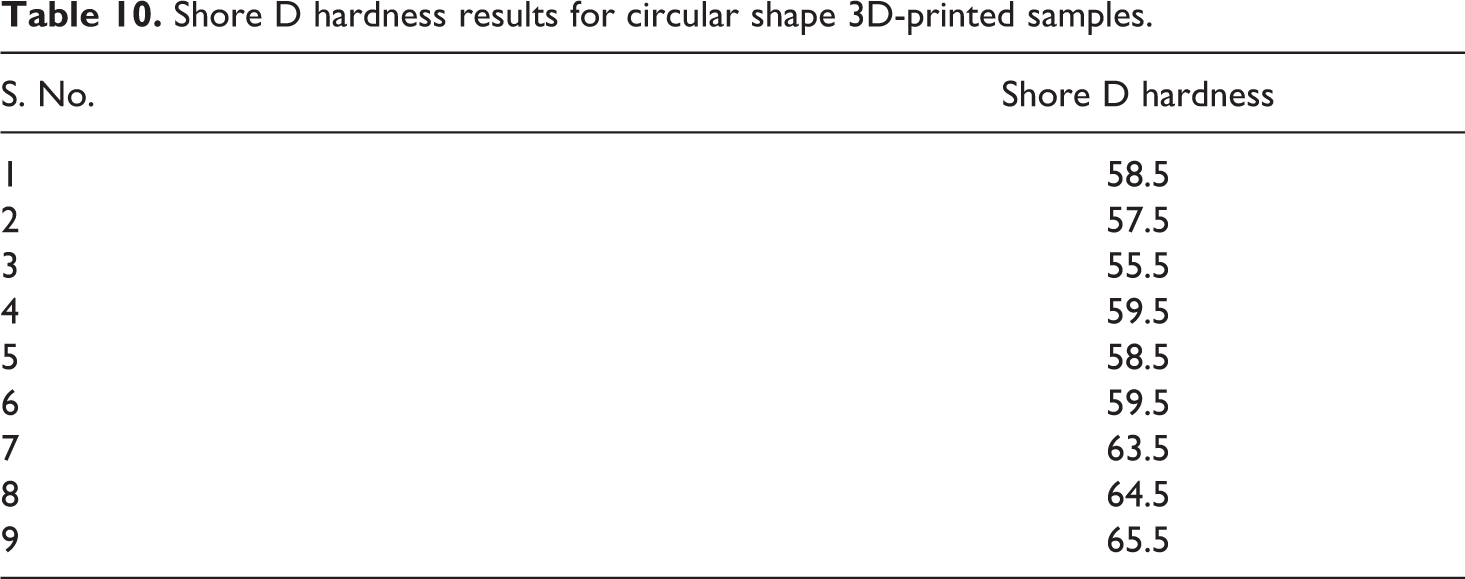
Shore D hardness
All the prepared samples were subjected to Shore D hardness testing, and it was observed that the hardness results are in line with the compressive properties. The sample which has maximum circumferential compressive strength also has shown maximum hardness. This may be due to the fact that infill density has played maximum role in output. In case of samples 7, 8 and 9, the samples were printed with maximum infill density due to which better diffusion of material may have occurred in subsequent layers which resulted in less void formation in interspace of structure resulting in higher hardness value for the samples. Table 10 presents the Shore D hardness results for the samples printed on FDM setup.
Shore D hardness results for circular shape 3D-printed samples.
Fractured surface analysis using tool maker microscope
The fractured samples of compressive testing (Table 2) were subjected to tool maker microscope for fractured surface analysis using ×30 magnification. It was observed from the fractured surface image that samples with lower infill density held maximum voids/porosity present in composite matrix (Figure 10), which may be the reason for its poor mechanical and thermal performance, whereas samples (7, 8, and 9) printed with 100% infill density have shown less voids/porosity holes due to which their mechanical and thermal performance was better. The results are in line with the previous researchers.30–34
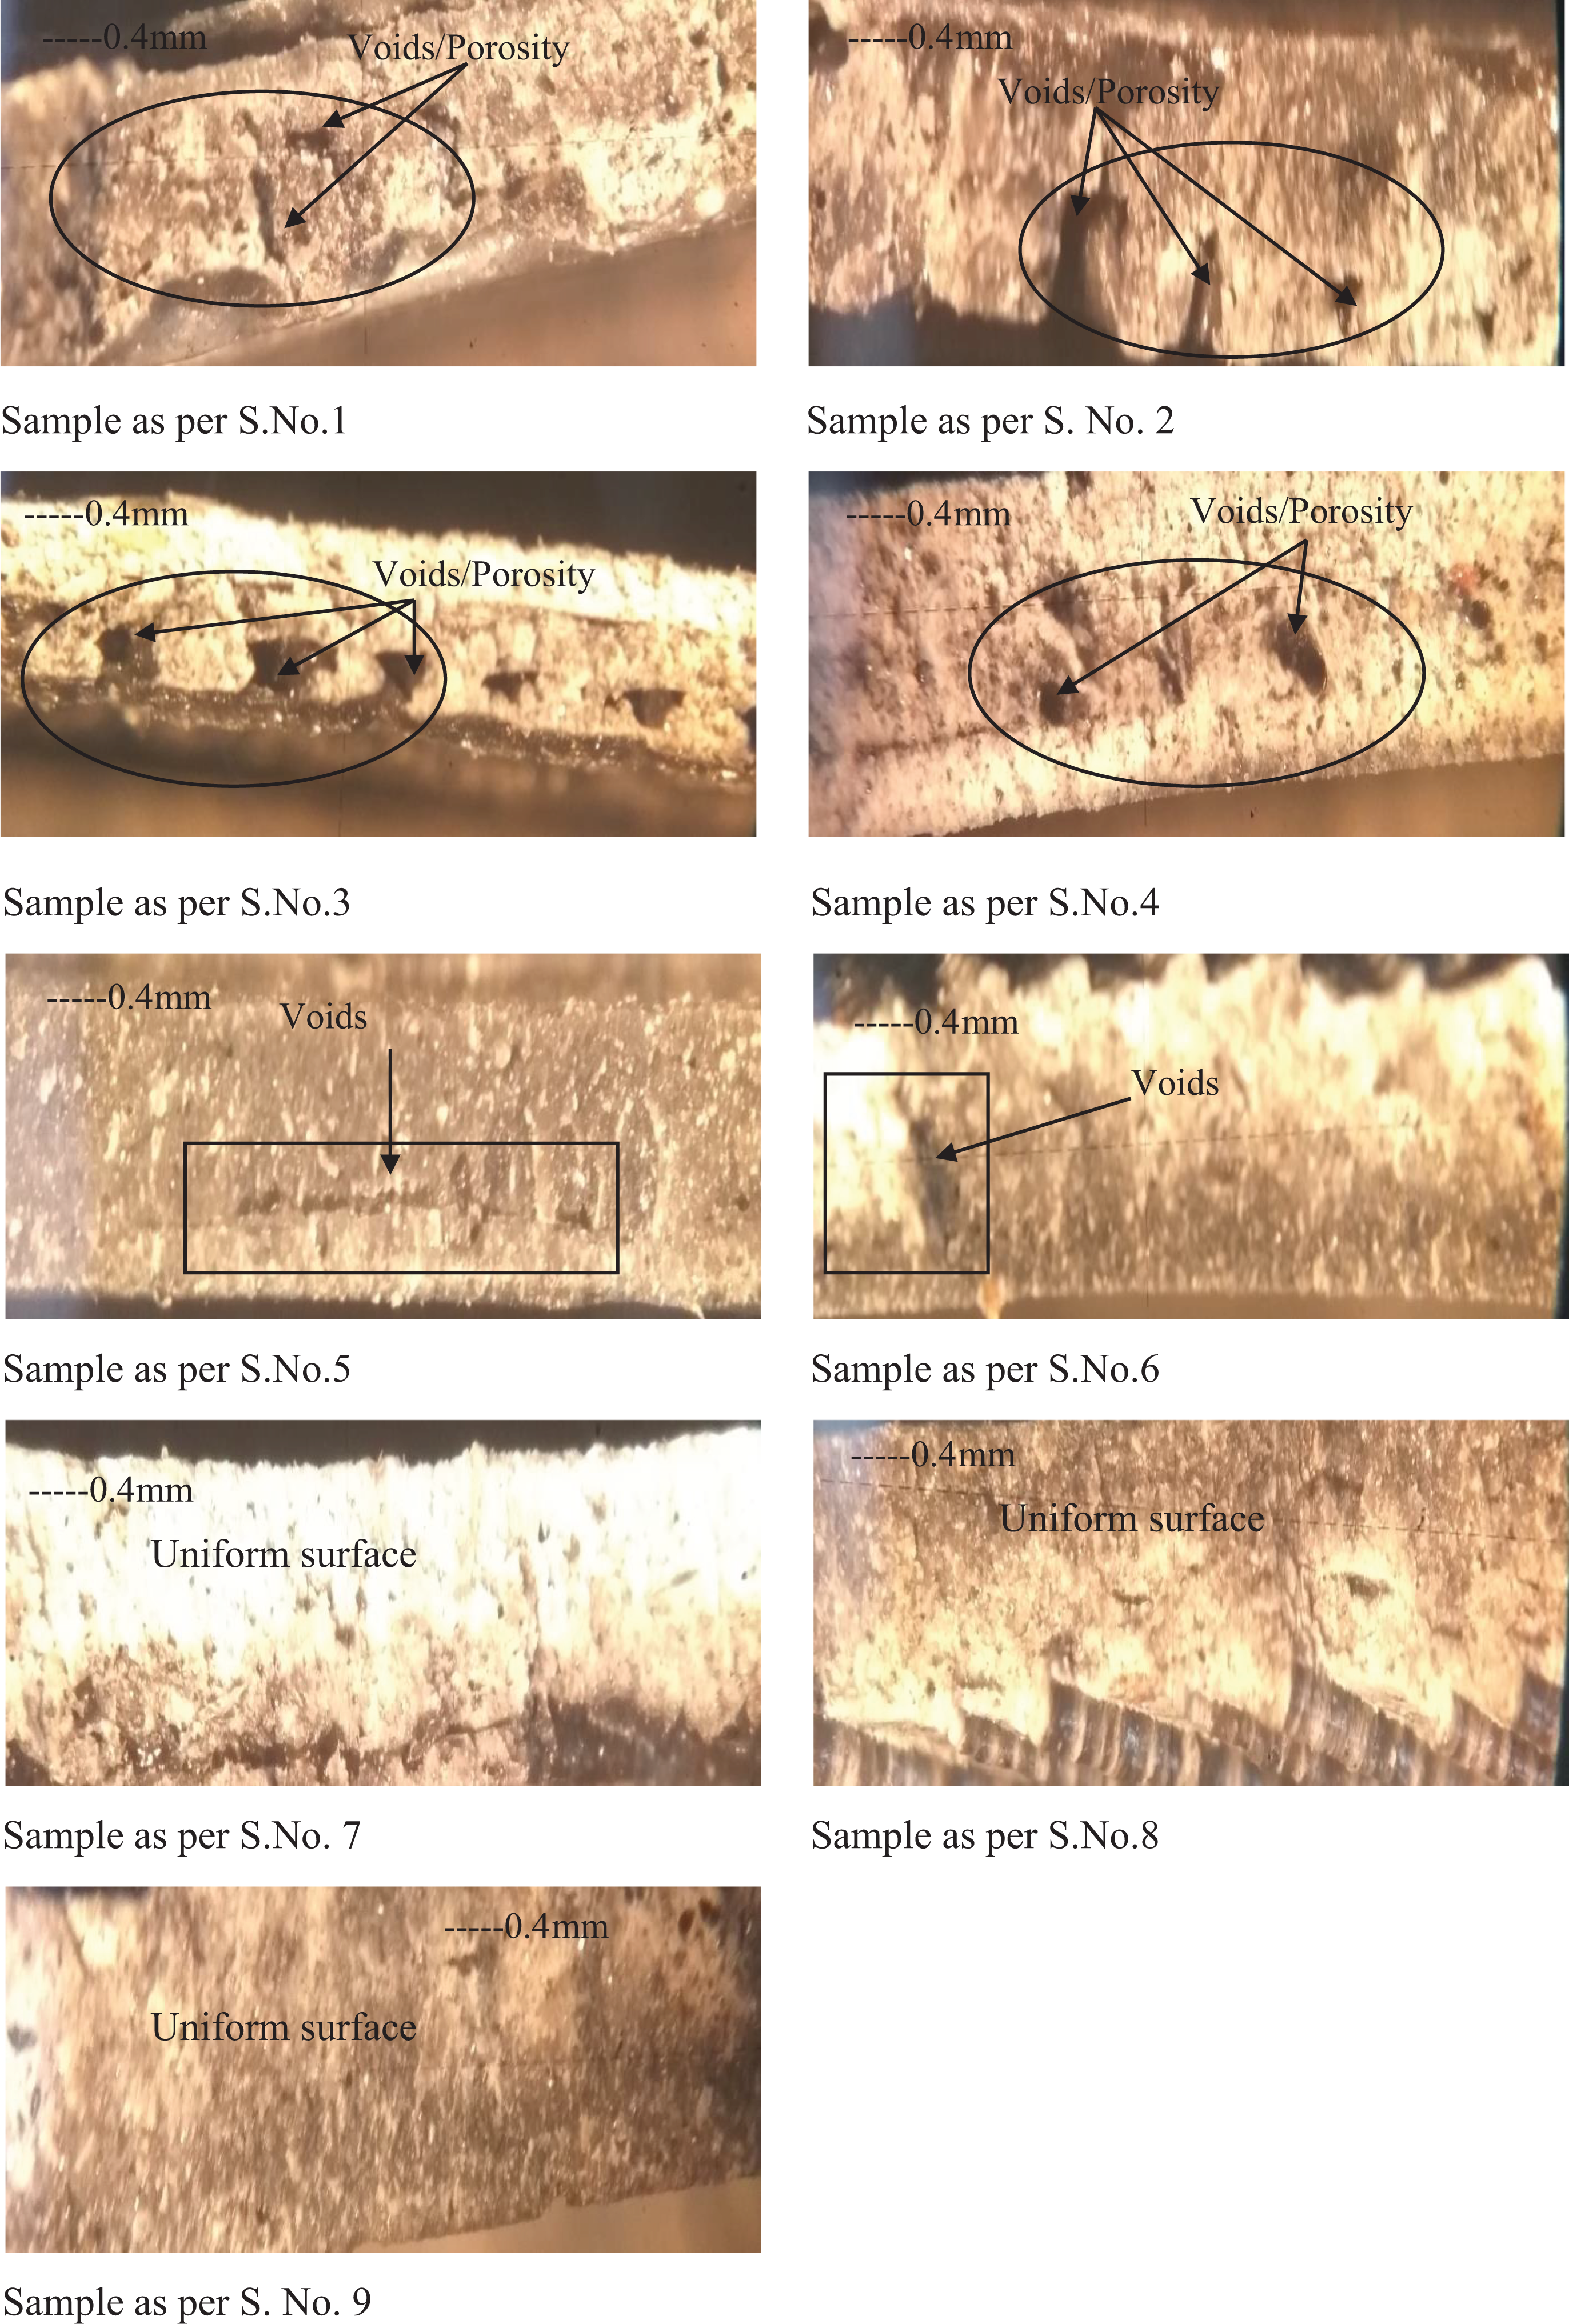
Fractured surface observed under toolmaker microscope: (a) Sample as per S. No. 1, (b) Sample as per S. No. 2, (c) Sample as per S. No. 3, (d) Sample as per S. No. 4, (e) Sample as per S. No. 5, (f) Sample as per S. No. 6, (g) Sample as per S. No. 7, (h) Sample as per S. No. 8, (9) Sample as per S. No. 9.
Surface roughness (based on image rendering) for best and worst samples
Further, the photomicrographs of sample at S. No. 9 (with best mechanical properties) and sample 1 (with poor mechanical properties) per Table 6 were processed on image processing software to evaluate the Ra (Figure 11) using 3D-rendered images. It has been observed that Ra for sample 1 (at cutoff length of 0.04 mm) was more than sample at S. No. 9 (Table 2), which may also be one of the reasons for poor mechanical and thermal properties of sample 1.
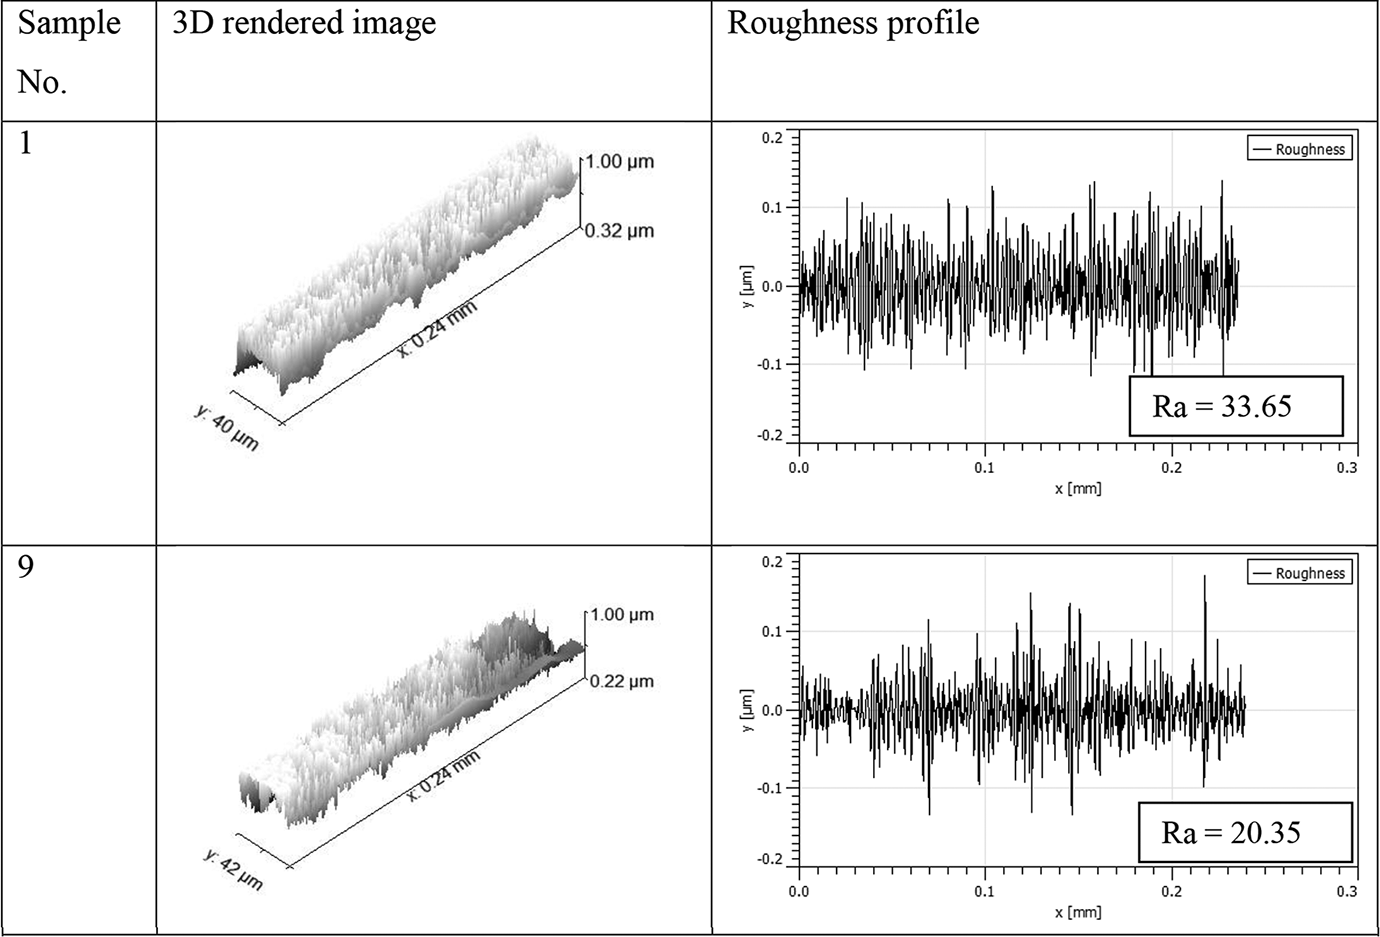
Surface roughness profile for best and worst sample.
Conclusions
The present investigation dealt with the preparation of PLA composite-based 3D-printed circular disc to ascertain its circumferential compressive properties, thermal conductivity, and morphological properties (Shore D hardness, surface voids using fractured surface analysis). Following are the conclusions from the present study: From the thermal conductivity test, it has been ascertained that sample per S. No. 9 printed with infill density of 100%, infill angle of 90°, and infill speed of 70 mm/s has shown maximum thermal conductivity (0.27817 W/mK). Also, it has been observed that with the increase in infill density, thermal conductivity of the sample has improved. Hence, from thermal conductivity viewpoint, sample prepared at S. No. 1 (Table 2) is a better candidate for structural engineering applications. However, the value of the observed maximum thermal conductivity (for PLA matrix having self-assembly characteristics) is near to the virgin PLA and can be used in structural engineering applications. From circumferential compressive testing on UTM setup, it has been ascertained that infill density has maximum contribution toward output property and is a significant parameter along with infill angle, but infill speed has no significant role in output properties. Experimental condition 9 (infill density of 100%, infill angle of 90°, and infill speed of 70 mm/s) is the optimized condition for printing on FDM setup. These results are at 95% confidence level. Further morphological testing (surface hardness, fractured surface analysis, and surface roughness) has supported the observed behavior for compressive as well as thermal behavior of 3D-printed sample.
The future studies may be conducted for multiblended 3D-printed samples in place of hybrid blend along with other properties like electrical conductivity and dimensional stability from batch/mass production viewpoint.
Footnotes
Acknowledgements
The authors are highly obliged to Thapar Institute of Engineering and Technology and manufacturing research lab of Guru Nanak Dev Engineering College for their continuous technical support.
Funding
The author(s) received no financial support for the research, authorship, and/or publication of this article.