
Abstract
2-(Naphthalene-1-yl oxy)-2-oxoethyl methacrylate (NOEMA) was synthesized from reaction of naphthalene-1-yl 2-chloroacetate and sodium methacrylate and its homopolymer was prepared by free-radical polymerization method at 60°C. The glass transition temperature of pure poly(NOEMA) was estimated as 102°C by differential scanning calorimetry technique, whereas that of poly(NOEMA) containing 10 wt% nanographene was 83°C. While pure poly(NOEMA) from thermogravimetric analysis measurements was indicating a decomposition at 290°C, poly(NOEMA) composite containing 10 wt% nanographene showed thermal decomposition temperature at 261°C. Semiconducting composites of poly(NOEMA) have been prepared by adding nanographene particles to poly(NOEMA) for preparing nanocomposites with different weight percentages (2, 3, 4, 5, and 10 wt%). The dielectric constant, ∊′, and dielectric loss factor, ∊″, of pure poly(NOEMA) were 3.66 and 0.052, respectively, whereas those of poly(NOEMA) containing 10 wt% nanographene were 186 and 210,152, respectively. Alternating current (AC) conductivity of pure poly(NOEMA) was 2.03 × 10⁻⁹ S cm−1, whereas that of poly(NOEMA) containing 10 wt% nanographene was 0.00134 S cm−1. AC conductivity mechanism of poly(NOEMA)/10 wt% nanographene composite indicated the correlated barrier hopping model. Activation energy values of poly(NOEMA)/x wt% nanographene composites was estimated to be between 4.783 eV and 0.209 eV. The polymer composite/p-Si thin-film heterojunction diode properties have been investigated from current–voltage at room temperature. The electrical parameters of the prepared diodes such as ideality factor (n), the barrier height (BH; Φ b), rectification ratio, and reverse saturation current (I o) were investigated at dark and room temperature. The ideality factor (n) value of the Al/poly(NOEMA)/x wt% nanographene/p-Si/Al diode for dark was found to be between 5.147 and 7.504, respectively. The BH (Φ b) value of the Al/poly(NOEMA)/x wt% nanographene/p-Si/Al diode at dark was found to be between 0.228 and 0.64.
Introduction
The remarkable properties of nanographene for the preparation of nanocomposites in the world have reached unexpectedly great importance, recently. Addition of nanographene to a pure polymer to prepare nanotechnological products has reached to summit in many industries, development of fascinating new materials and in many applications such as mechanical, electronic applications, environmental and food. Many composite materials prepared by combining two or more materials as they do not dissolve or can be designed to be used as a variety of structural materials by blending. 1 –3 Because of the significant difference in property requirements between structural and electronic behaviors, the design criteria for these two groups of composites show difference. 4 Because of graphene’s most exceptional properties, 5,6 it stands out as the most promising material in terms of a major doping agent for many composite applications. 7 Recently, nanographene and nanographene-based polymer composite systems have shown promising growth in technological applications. Nanographene-based composites even at very low loading can show significant improvements due to their multifunctional aspects when compared to conventional composites. This not only makes the material lighter with simple processing but also makes it stronger for many functional applications. 8 –10 Recently, a number of studies on direct current (DC) and alternating current (AC) electrical properties of heterogeneous materials based on polymer nanocomposites doped with conducting materials have been carried out and have evidenced the existence of interphase areas among dispersed nanoparticles within the polymeric insulating material. 11 The hopping conduction mechanism can be easily discerned from that of the band conduction by estimating the frequency dependence of conductivity, 12 which is due to conduction in localized regions as expected. Some researchers have reported that it is an increase in dielectric constants of polymer composites based on nanographene due to the formation of mini-capacitors in the polymer matrix. 13,14 The limited applications of polymer composite containing nanographene are due to high energy dissipation, high dielectric loss, and low voltage ability resulting from high current leakage. 15 In this study, we used neat nanographene in the polymer matrix to produce nanocomposites with improved properties. However, to the best of our knowledge, there are some reports about the effect of nanographene nanoplatelets on electric and dielectric performance of some homopolymers, copolymer, or blend, 16 –18 whereas the influences of neat nanographene on AC dielectric measurements and electrical parameters of poly(2-(naphthalene-1-yl oxy)-2-oxoethyl methacrylate (NOEMA)), which is a new homopolymer, and electrical parameters of a diode produced from nanographene-based poly(NOEMA) have not been reported in our study so far. In this context, the present study deals with some experimental observations of frequency dependence of AC conductivity and dielectric and electrical properties to understand the conduction mechanism of the Al/p-Si/poly(NOEMA)/x wt% nanographene composite/Al diode fabricated in this study. Poly(NOEMA)/x wt% nanographene composites are highlighted that optimum composites with superior behaviors in comparison to the pure poly(NOEMA) and its composites having high dielectric constant may have potential application in energy storage. The polymer composite/p-Si thin-film heterojunction diode behaviors have been studied depending on current–voltage (I-V). The electrical parameters of the prepared diodes such as ideality factor (n), the barrier height (BH; Φ b), rectification ratio (RR), and reverse saturation current (I o) were investigated at dark and room temperature. Also, the thermogravimetric analysis (TGA) and the differential scanning calorimetry (DSC) measurements were carried out to understand the thermal effect of nanographene on pure poly(NOEMA).
Materials and methods
Materials
Acryloyl chloride, nanographene, and 4-chloromethylstyrene were purchased from Sigma-Aldrich and used as supplied. The α,α′-azobisisobutyronitrile was used as an initiator in the free-radical polymerization. All of the other materials used were of analytical purity and used as received commercially. The nanographene used to prepare polymer composites was purchased from Sigma-Aldrich.
Characterization
Fourier-transform infrared (FTIR) spectra of all the samples were performed in the range of 4000–400 cm−1 on a Perkin-Elmer Spectrum One FTIR spectroscopy. Proton nuclear magnetic resonance ( 1 H-NMR; 400 MHz) and carbon-13 nuclear magnetic resonance ( 13 C-NMR; 100 MHz) spectra in presence of CDCl3 containing tetramethylsilane in the ppm level were measured by an AVANCE III 400 MHz Bruker NMR spectrometer. Thermogravimetric (TG) behaviors were evaluated under argon flow of 10 ml min−1 using TG analyzer (Shimadzu model). Samples about 5 mg were heated from 25°C to 500°C at a heating rate of 10°C min−1. DSC measurements were performed on a DSC-50 technique (Shimadzu DSC-50) using 5 mg of sample between room temperature and 200°C. The glass transition temperatures (T g) of pure polymer and its composites prepared were measured at the heating rate of 20°C min−1 from 25°C to 200°C under argon gas flow. The T g values were estimated as a midpoint of transition region. Gel Permeation Chromatography (GPC) chromatograms were obtained on Agilent 1100 system with a refractive index detector. Linear standard polystyrene series were used to calibrate GPC instrument. The carrier solvent was tetrahydrofuran (THF) at a flow rate of 1 ml min−1.
Dielectric and electrical analysis
Dielectric and electrical behaviors of investigated composites were performed on tablets prepared under 4 tons of pressure. A QuadTech 7600 LRC (the inductance [L], capacitance [C], and resistance [R] of an electrical component) Impedance Analyzer from 100 Hz up to 20 kHz was used for dielectric measurements.
Fabrication of the diode
The Si substrate was cleaned by a mixture of methyl alcohol–acetone and dried with nitrogen gas flow. The solution in the THF of composite prepared for diode was coated on p-Si having aluminum ohmic contact by a drop-coating method. Prepared films were dried under vacuum at 40°C. Then, aluminum metal was evaporated on p-Si wafer to form ohmic contact and was annealed at 570°C for 5 min under nitrogen gas flow. The top electrode of the diode was prepared by Al metal on the film with a diode contact. The I-V and capacitance–voltage measurements were carried out using FYtronix Electric Characterization system in dark condition.
Synthesis of NOEMA, monomer
NOEMA was synthesized from reaction of 2 g (9.6 mmol) of naphthalene-1-yl 2-choloroacetate and 1.96 g (18.13 mmol) of sodium methacrylate at 85°C for 24 h in presence of acetonitrile as solvent by means of phase transfer reagent (triethyl benzyl ammonium chloride [TEBAX] and NaI). The structure of NOEMA was confirmed by 1 H-NMR, 13 C-NMR, and FTIR spectra. The important signals for structure characterization of NOEMA are summarized as follows:
FTIR (ν
max, cm−1): 3058 (C=
1 H-NMR (CDCl3, δ ppm): 7.3–8.1 (7 H on naphthalene ring), 5.6 and 6.2 (cis H and trans H, respectively), 5.2 (2H, CH2 next to ester oxygen), 2.1 (CH3).
13 C-NMR (CDCl3, δ ppm): 174.4 (C=O in ester group), 169.7 (C=O in amide group), 116–144 (aromatic carbons), 58 (–OCH2 next to ester group), 18.7 (–CH3).
Preparation of composites
The composite samples were prepared with different concentrations of nanographene as a filler (2.0, 4.0, 6.0, 8.0, and 10.0 wt%). Method of preparation of composite systems was as follows: First, required amount of nanographene was poured into pre-dissolved polymer in THF and mixed mechanically. After that, the mixture was exposed to ultrasonic dispersing for a better distribution of filler in the polymer matrix. Composite mixture was exposed to ultrasonic action for 30 min. Eventually, produced composite was precipitated within n-hexane and the polymer composites were filtered. The prepared products were allowed to stand at room temperature, and then they were dried under vacuo at 40°C.
Results and discussion
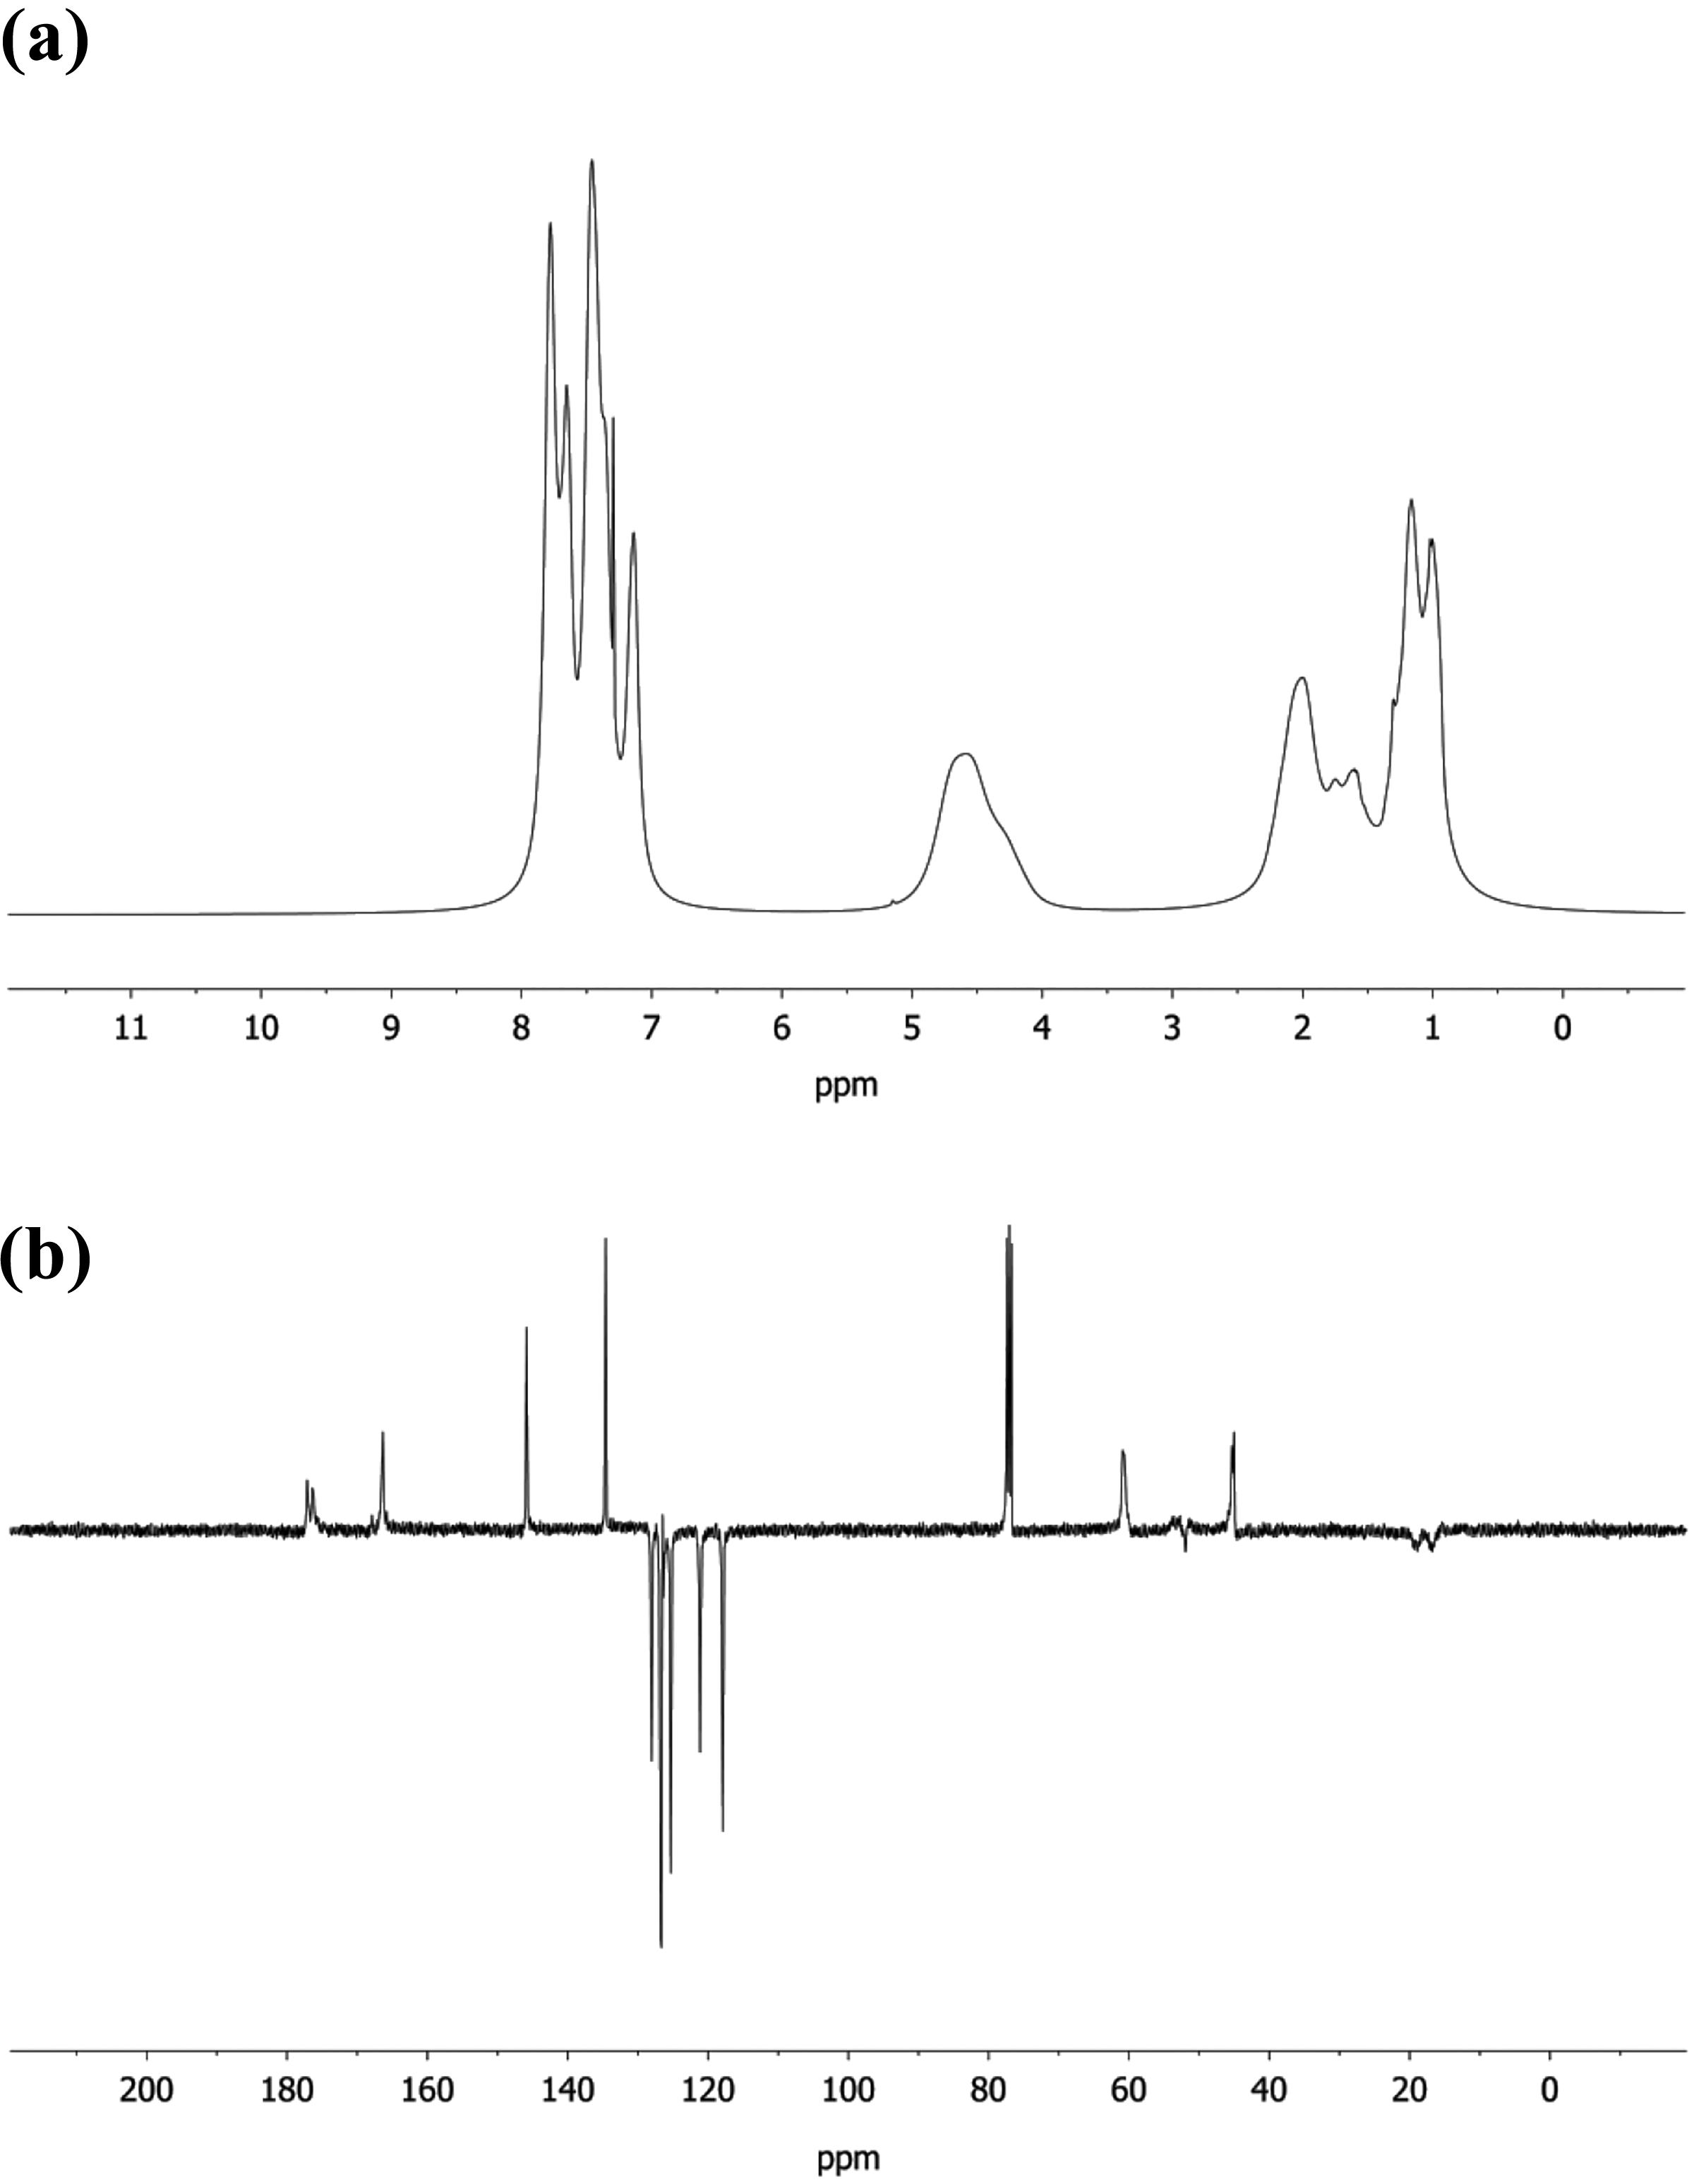
Poly(NOEMA) was prepared via conventional radical polymerization method at 60°C in presence of 2,2′-azobisisobutyronitrile (AIBN) as initiator. Reaction scheme of for poly(NOEMA) was indicated in Figure 1. 1 H-NMR and 13 C-NMR enlarged spectra of poly(NOEMA) are shown in Figure 2(a) and (b). 1 H-NMR spectrum of poly(NOEMA), as seen in Figure 2(a), indicated the most characteristic signals at 6.95–8.0 ppm (7H on α-naphthyl group), 4.6 ppm (CH2 next to ester oxygen), 0.8–2.2 ppm (CH3 and CH2 protons on the main backbone). On the other hand, 13 C-NMR spectrum indicated in Figure 2(b) of poly(NOEMA) showed the most characteristic peaks at 176.6 ppm (ester C=O), 169.7 ppm (ester C=O next to α-naphthyl group), 62.4 (–CH2 next to ester oxygen), 44 ppm (CH2 carbon on the backbone), 17 and 19 ppm (CH3 carbon on the backbone). As indicated in Figure 3, the molecular weight of macroinitiator and its polydispersity were estimated as 15,300 g mol−1 and 1.22, respectively.
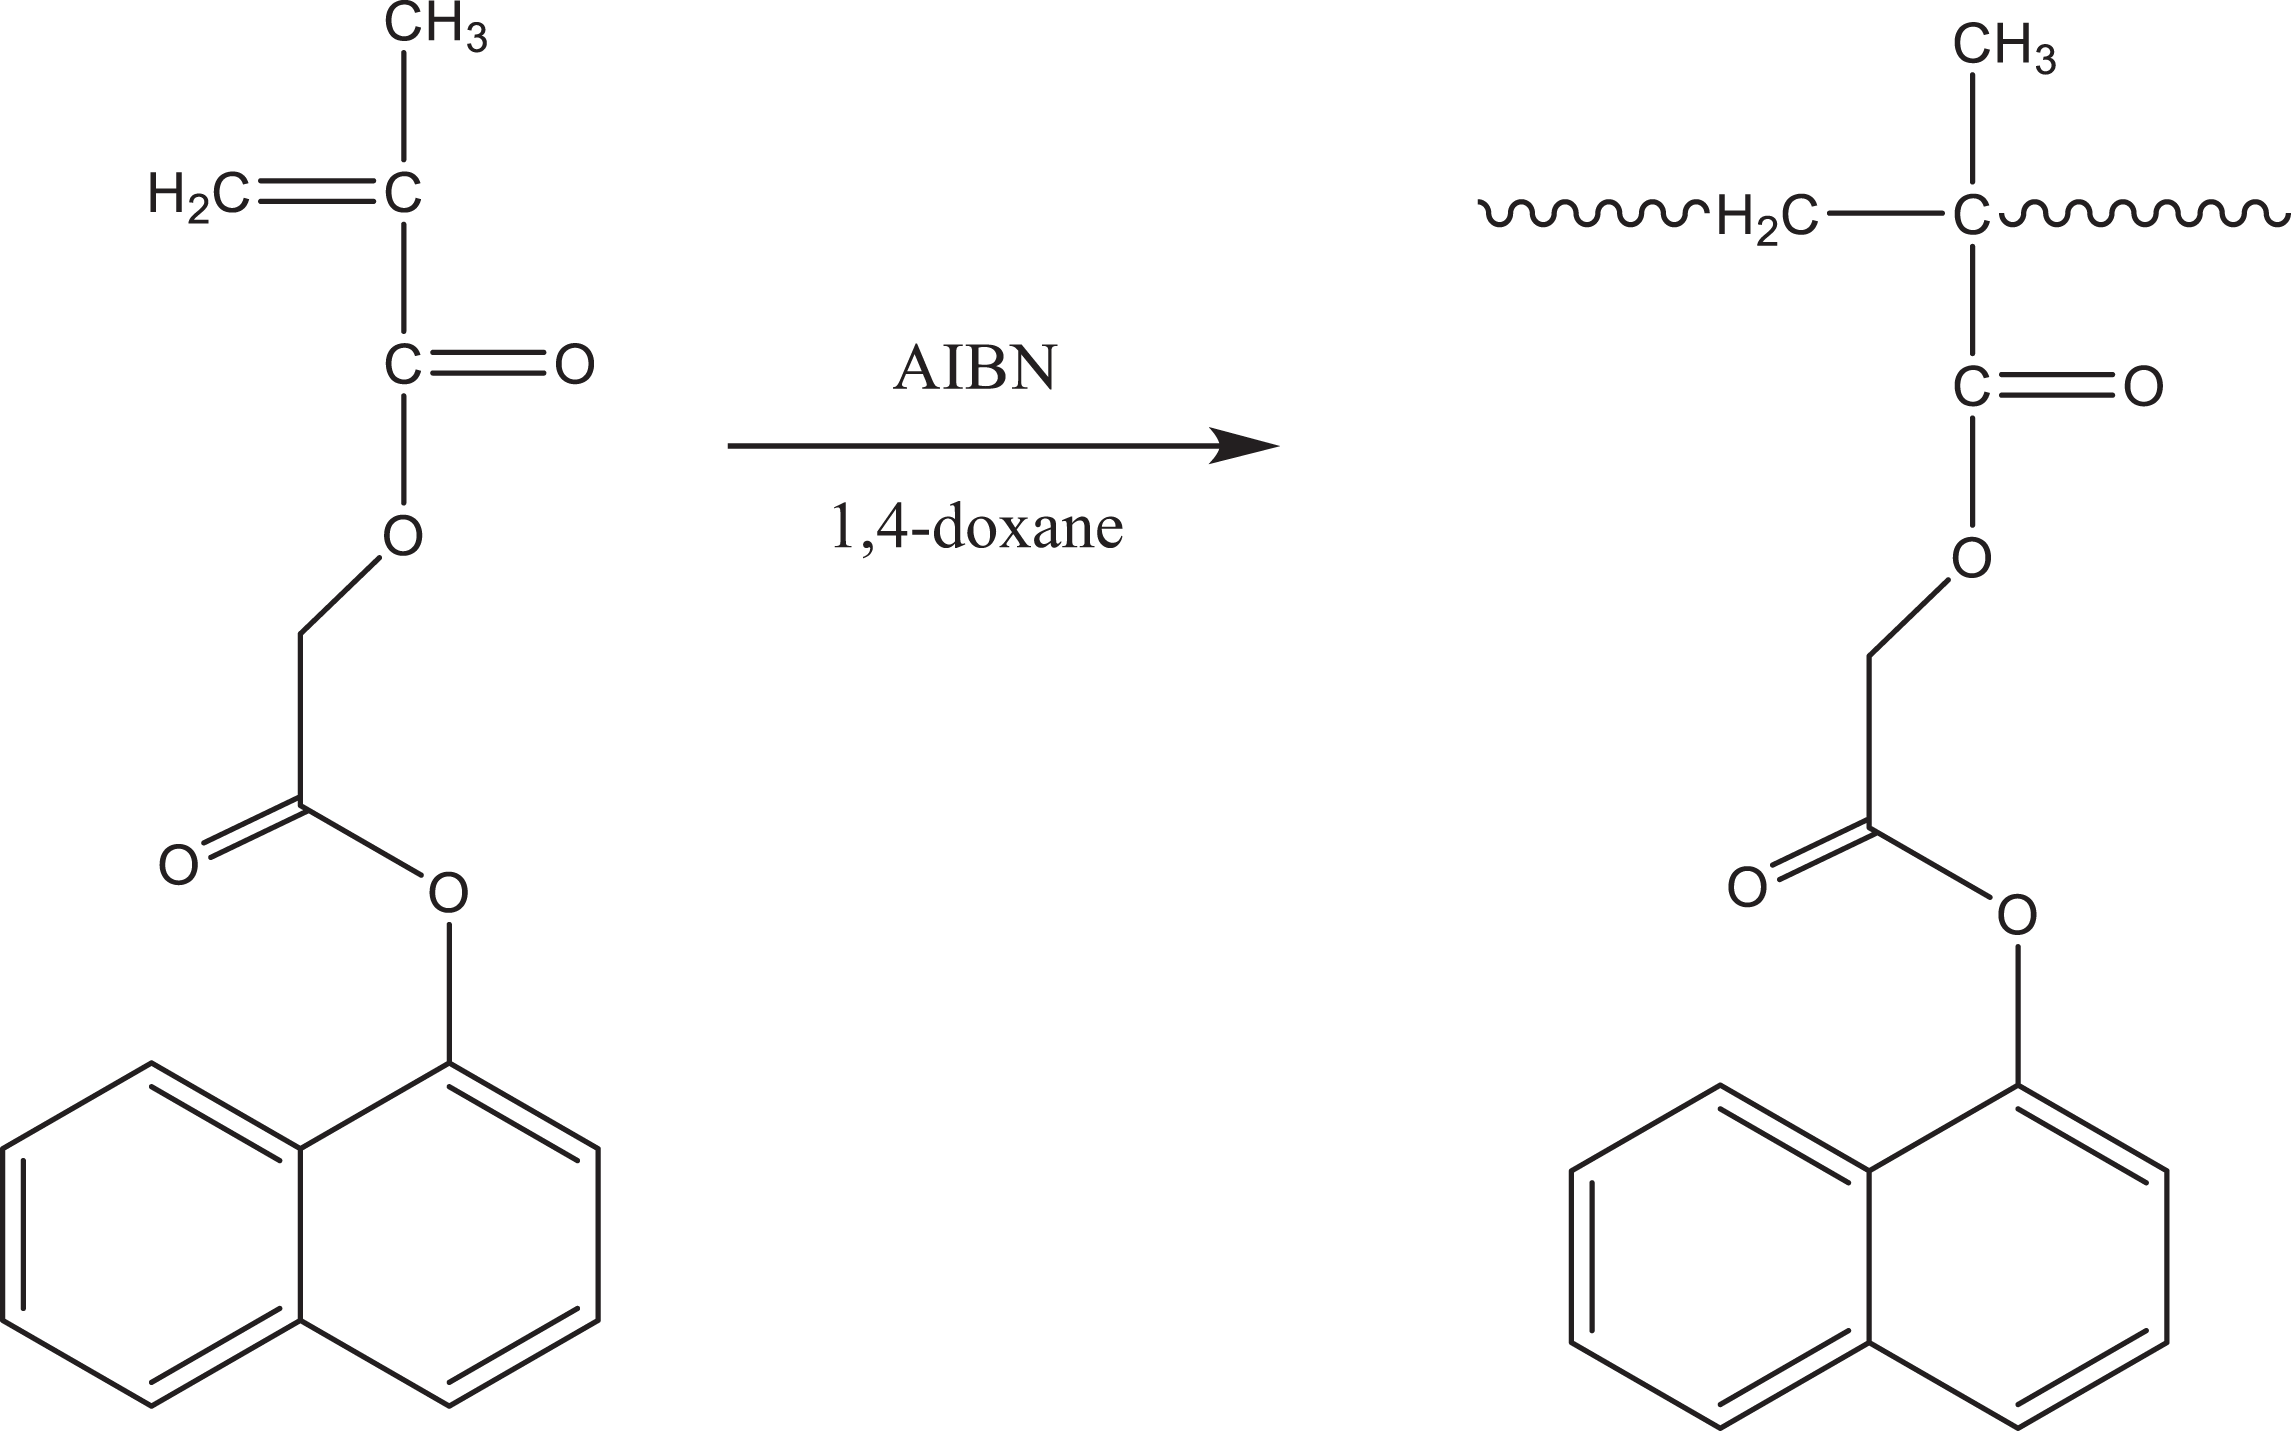
Polymerization of NOEMA.
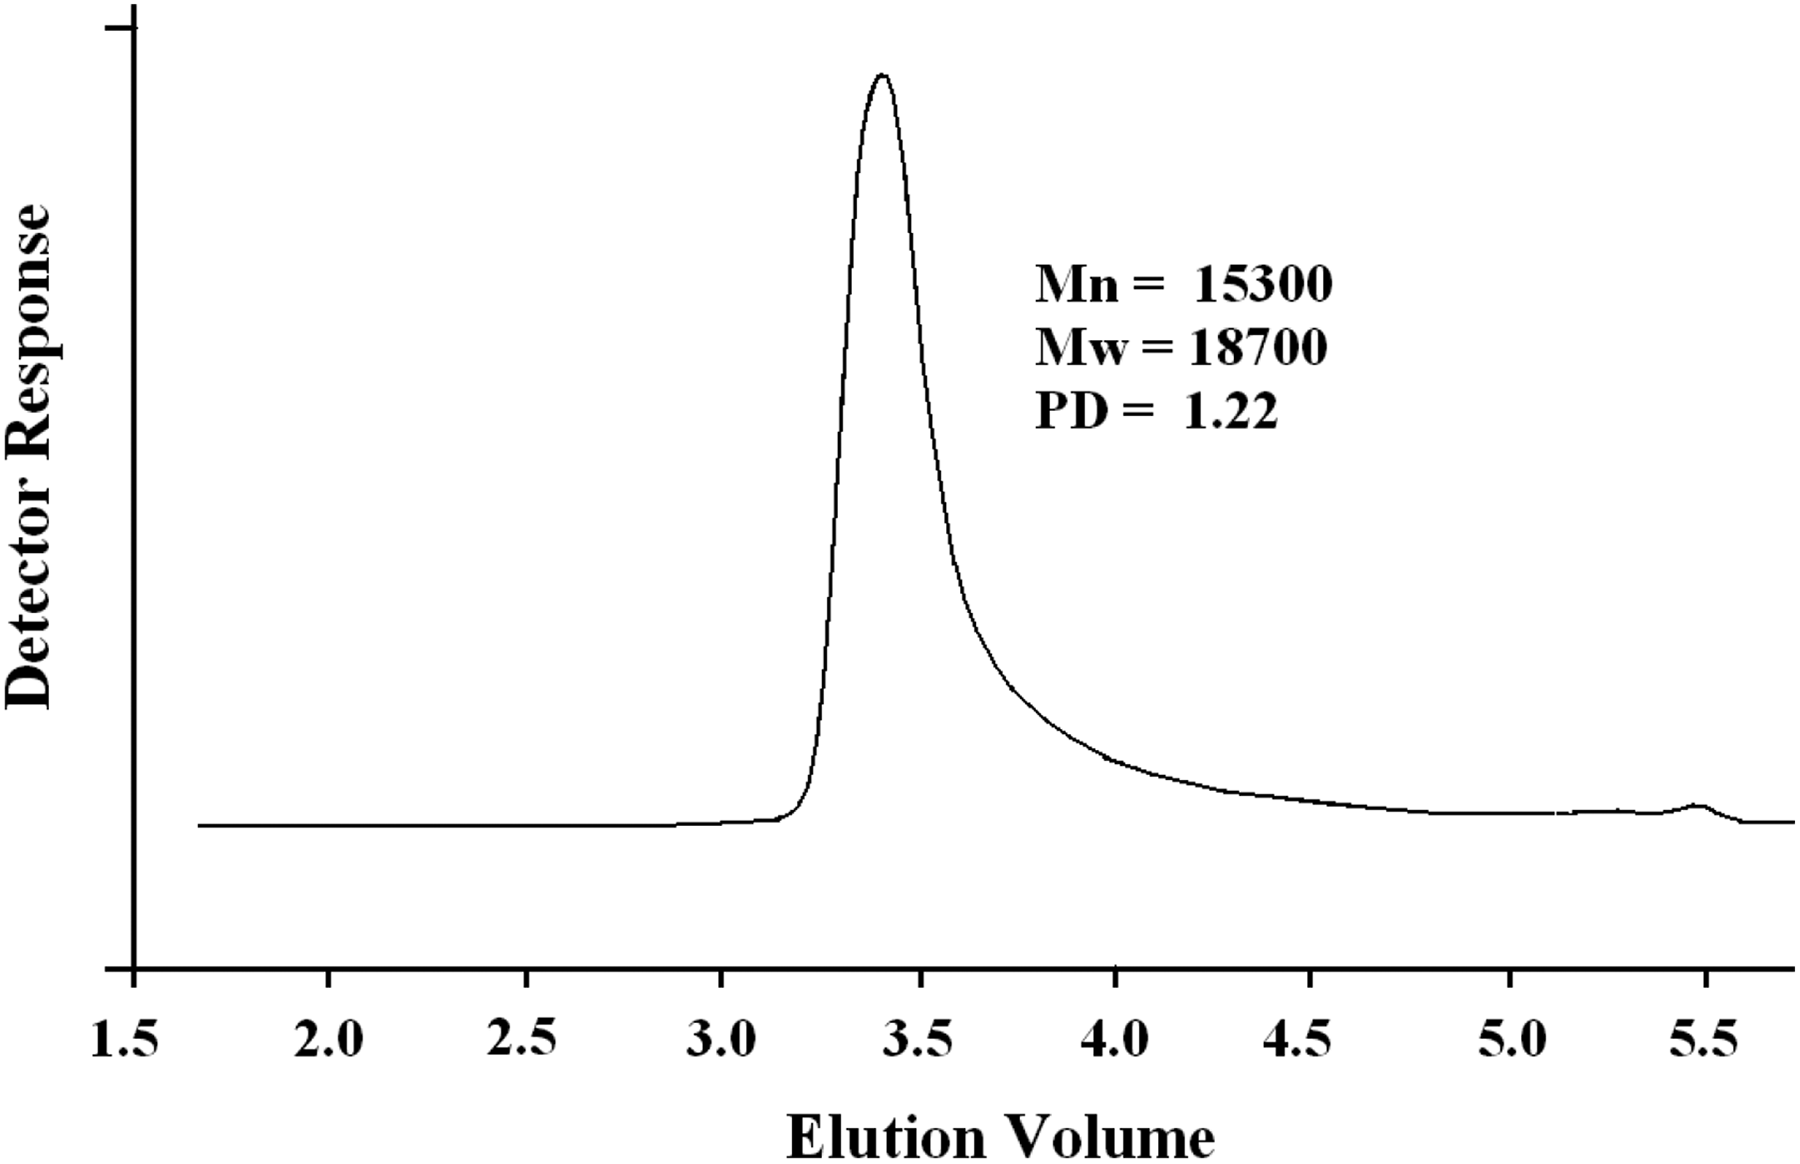
GPC chromatogram of poly(NOEMA).
DSC measurements
DSC measurements of poly(NOEMA) was recorded using a DSC-50 (at a heating rate of 20°C min−1). The T g curve of poly(NOEMA) is displayed in Figure 4. The T g of pure poly(NOEMA) prepared by free-radical polymerization method is 102°C, whereas the T g value of pure poly(2-hydroxy-3-(1-naphthyloxy)propyl methacrylate) (NOPMA)) bearing hydroxyl side group has been recorded as 110°C in the literature. 19 The T g of the polymer reflects the movement ability of the chain or side group. The T g slightly decreased because there is no hydrogen bond intermolecular of the poly(NOEMA), which is a similar polymer to poly(NOPMA). Also, the hydrophobic property of nanographene has an effect in the T g of poly(NOEMA), and with increase in nanographene loading, the composites indicated a significant decrease in the T g. The T g of pure poly(NOEMA) was measured to be 102°C, as mentioned above. Thus, the T g decreased with the percentage of nanographene, which can be suggested as the lowering effect of nanographene, which reduces segmental chain mobility. This behavior means that there is a decrease in T g. The T g of poly(NOEMA) having 4 wt% nanographene is 94°C, whereas that of poly(NOEMA) containing 10 wt% nanographene is 83°C. That is, as the content of nanographene in poly(NOEMA)/x wt% nanographene composites increased, the T g values decreased. The soft and slippery nature of nanographene especially may accelerate or reduce the T g and the initial decomposition temperature of the polymer composites. In our study, nanographene content in the polymer composites has decreased the T g of poly(NOEMA). The soft and slippery nature of nanographene especially may cause a decrease in intermolecular interactions of the poly(NOEMA). So, the free volume is increasing and T g value is decreasing. In the literature, it has been identified that with the addition of functionalized graphene sheets (10 wt%) to the poly(acrylonitrile) (PAN), the T g of the composite system has increased up to 40°C, whereas when only 4 wt% was added to poly(methylmethacrylate) (PMMA), an increase of 30°C has been observed. 20 Also, it was recorded that there was an enhancement in T g of polyvinyl chloride depending on different weight content of nanographene. 21
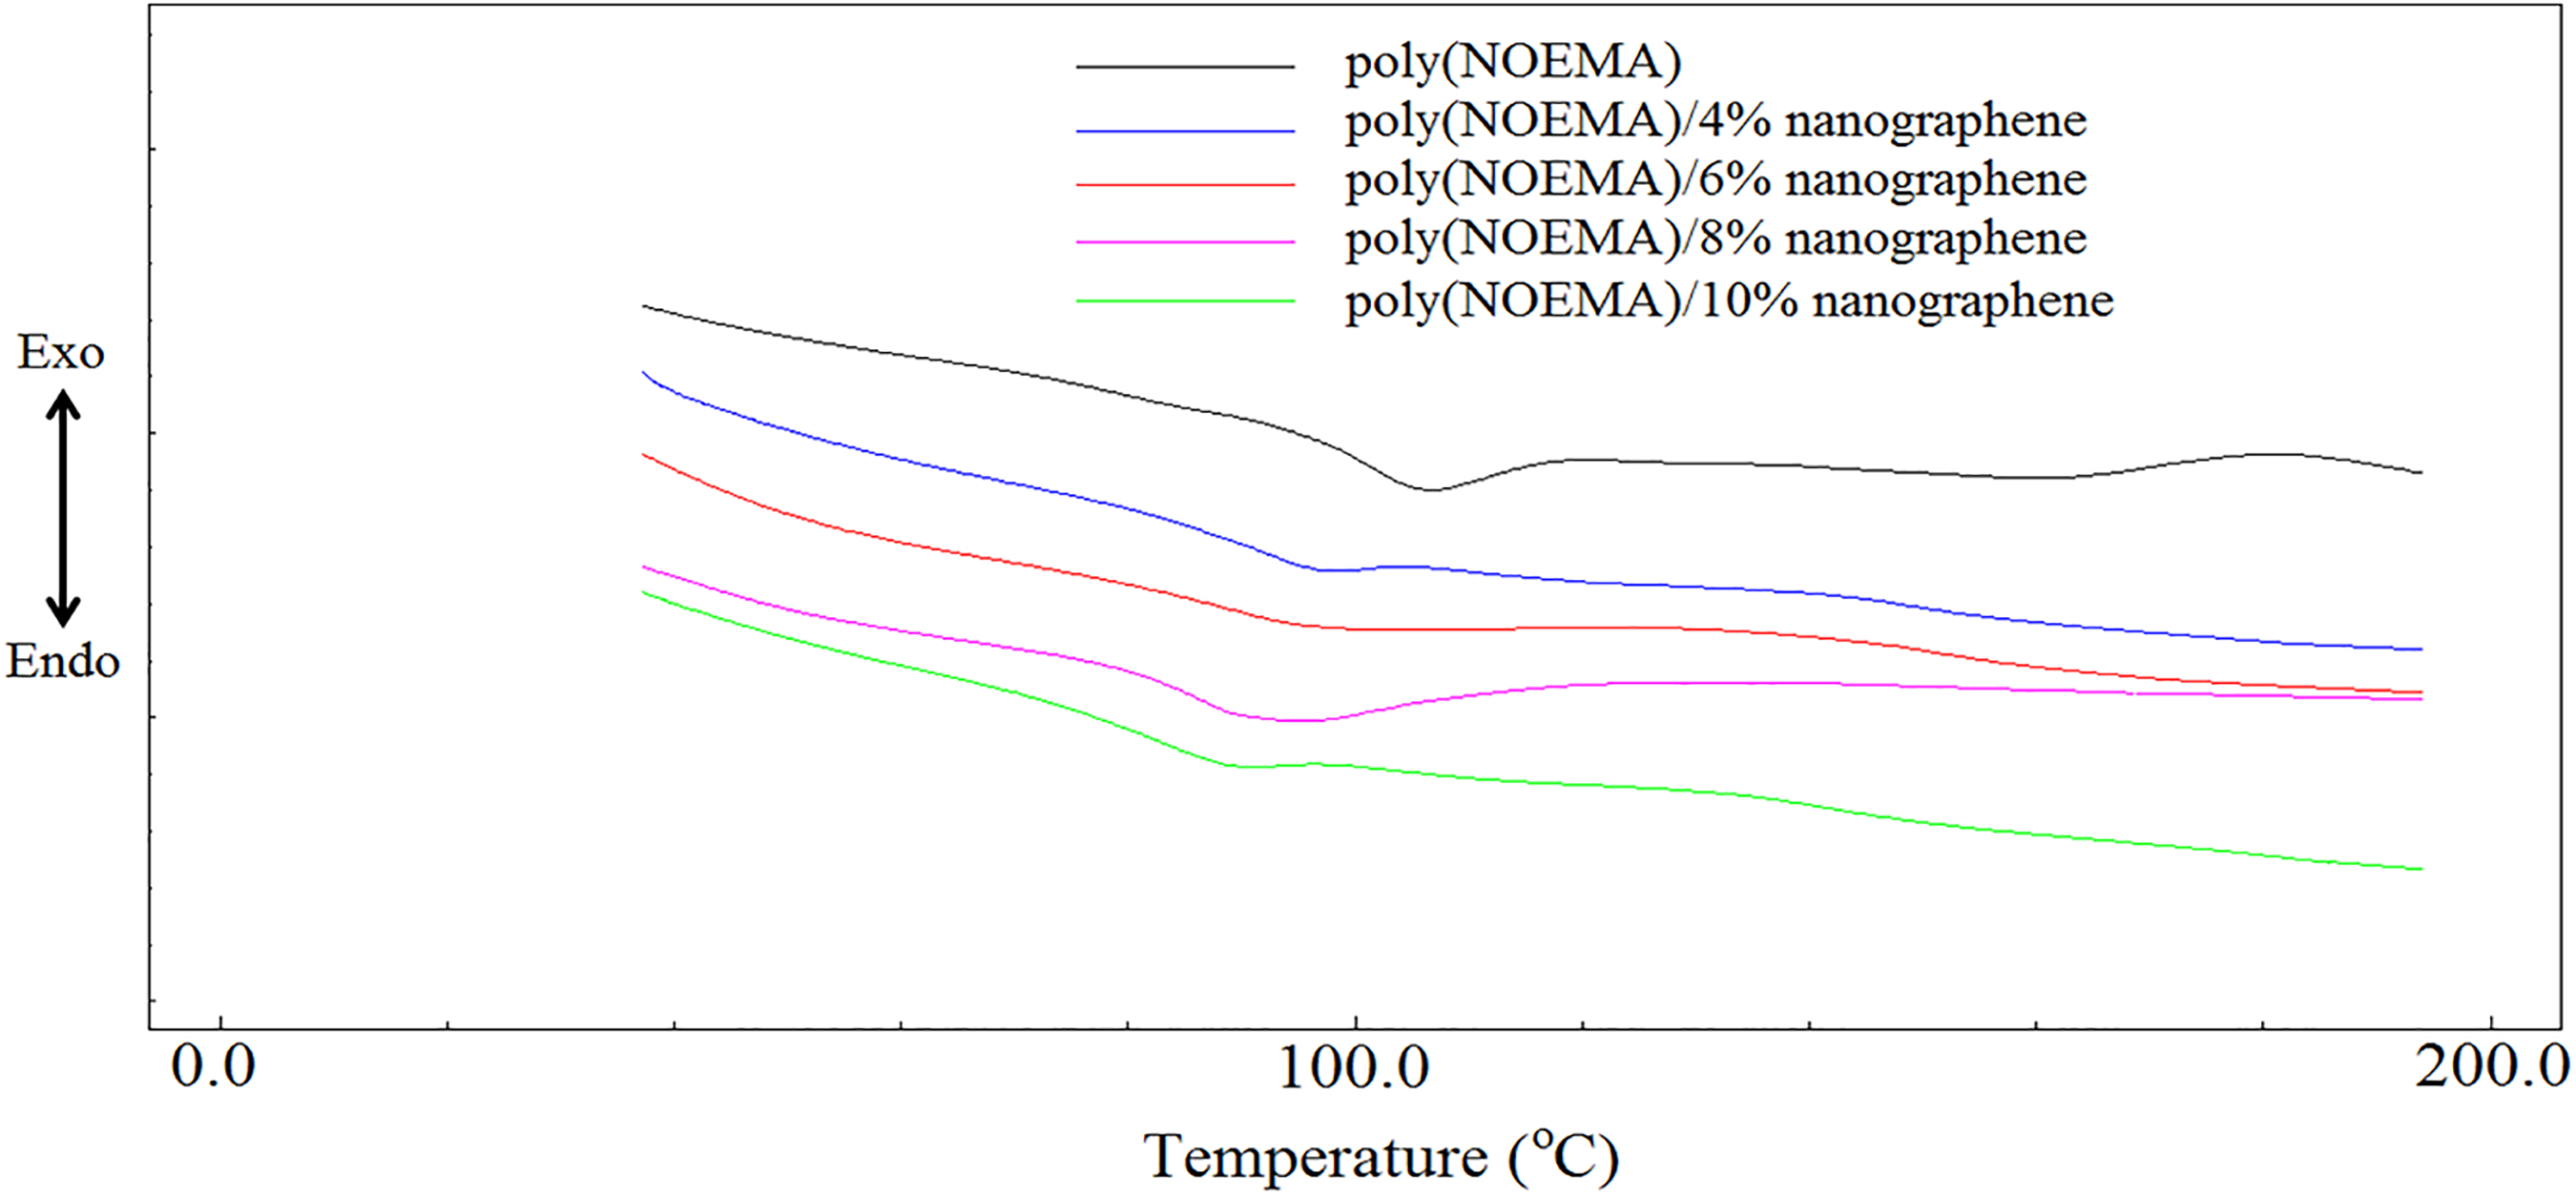
DSC thermograms of poly(NOEMA) and its composite systems.
TG studies
Thermal decomposition temperatures of pure poly(NOEMA) and poly(NOEMA)/x wt% nanographene composites were estimated by TGA. They were compared to each other as indicated in Figure 5. Thermal decomposition temperatures of pure poly(NOEMA) was compared with that of poly(NOEMA)/x wt% nanographene composites and poly(NOPMA) bearing hydroxyl side group prepared in our previous study. 19 The initial decomposition temperature of pure poly(NOPMA) was higher than those of pure poly(NOEMA) and poly(NOEMA)/x wt% nanographene composites. In this context, the initial decomposition temperature of poly(NOPMA) was 187°C and its residual was 21%. The first decomposition stage of the poly(NOPMA) decomposing at two steps was at 187°C with a weight loss of 37%, and another one is at 310°C with a weight loss of 46%. Whereas, the thermogram of poly(NOEMA) and its composites clearly indicates that it undergoes a decomposition with single stage. While pure poly(NOEMA) indicates the decomposition at 290°C, poly(NOEMA) composite containing 10 wt% nanographene showed thermal decomposition at 261°C. In addition, as content of nanographene in the composite systems increased, the decomposition temperature decreased. The slippery and soft nature of nanographene may accelerate the degradation of the polymer composites. In this context, in our study, the nanographene has accelerated the thermal decomposition temperature of poly(NOEMA). So, the slippery and soft nature of nanographene can meaningfully make better the dispersion of nanographene sheets in the poly(NOEMA) composite and enhance the compatibility between nanographene sheets and poly(NOEMA). Hence, it can be suggested that it is important to achieve a good compatibility between the poly(NOEMA) and nanographene. The results of TG measurement are summarized in Table 1.
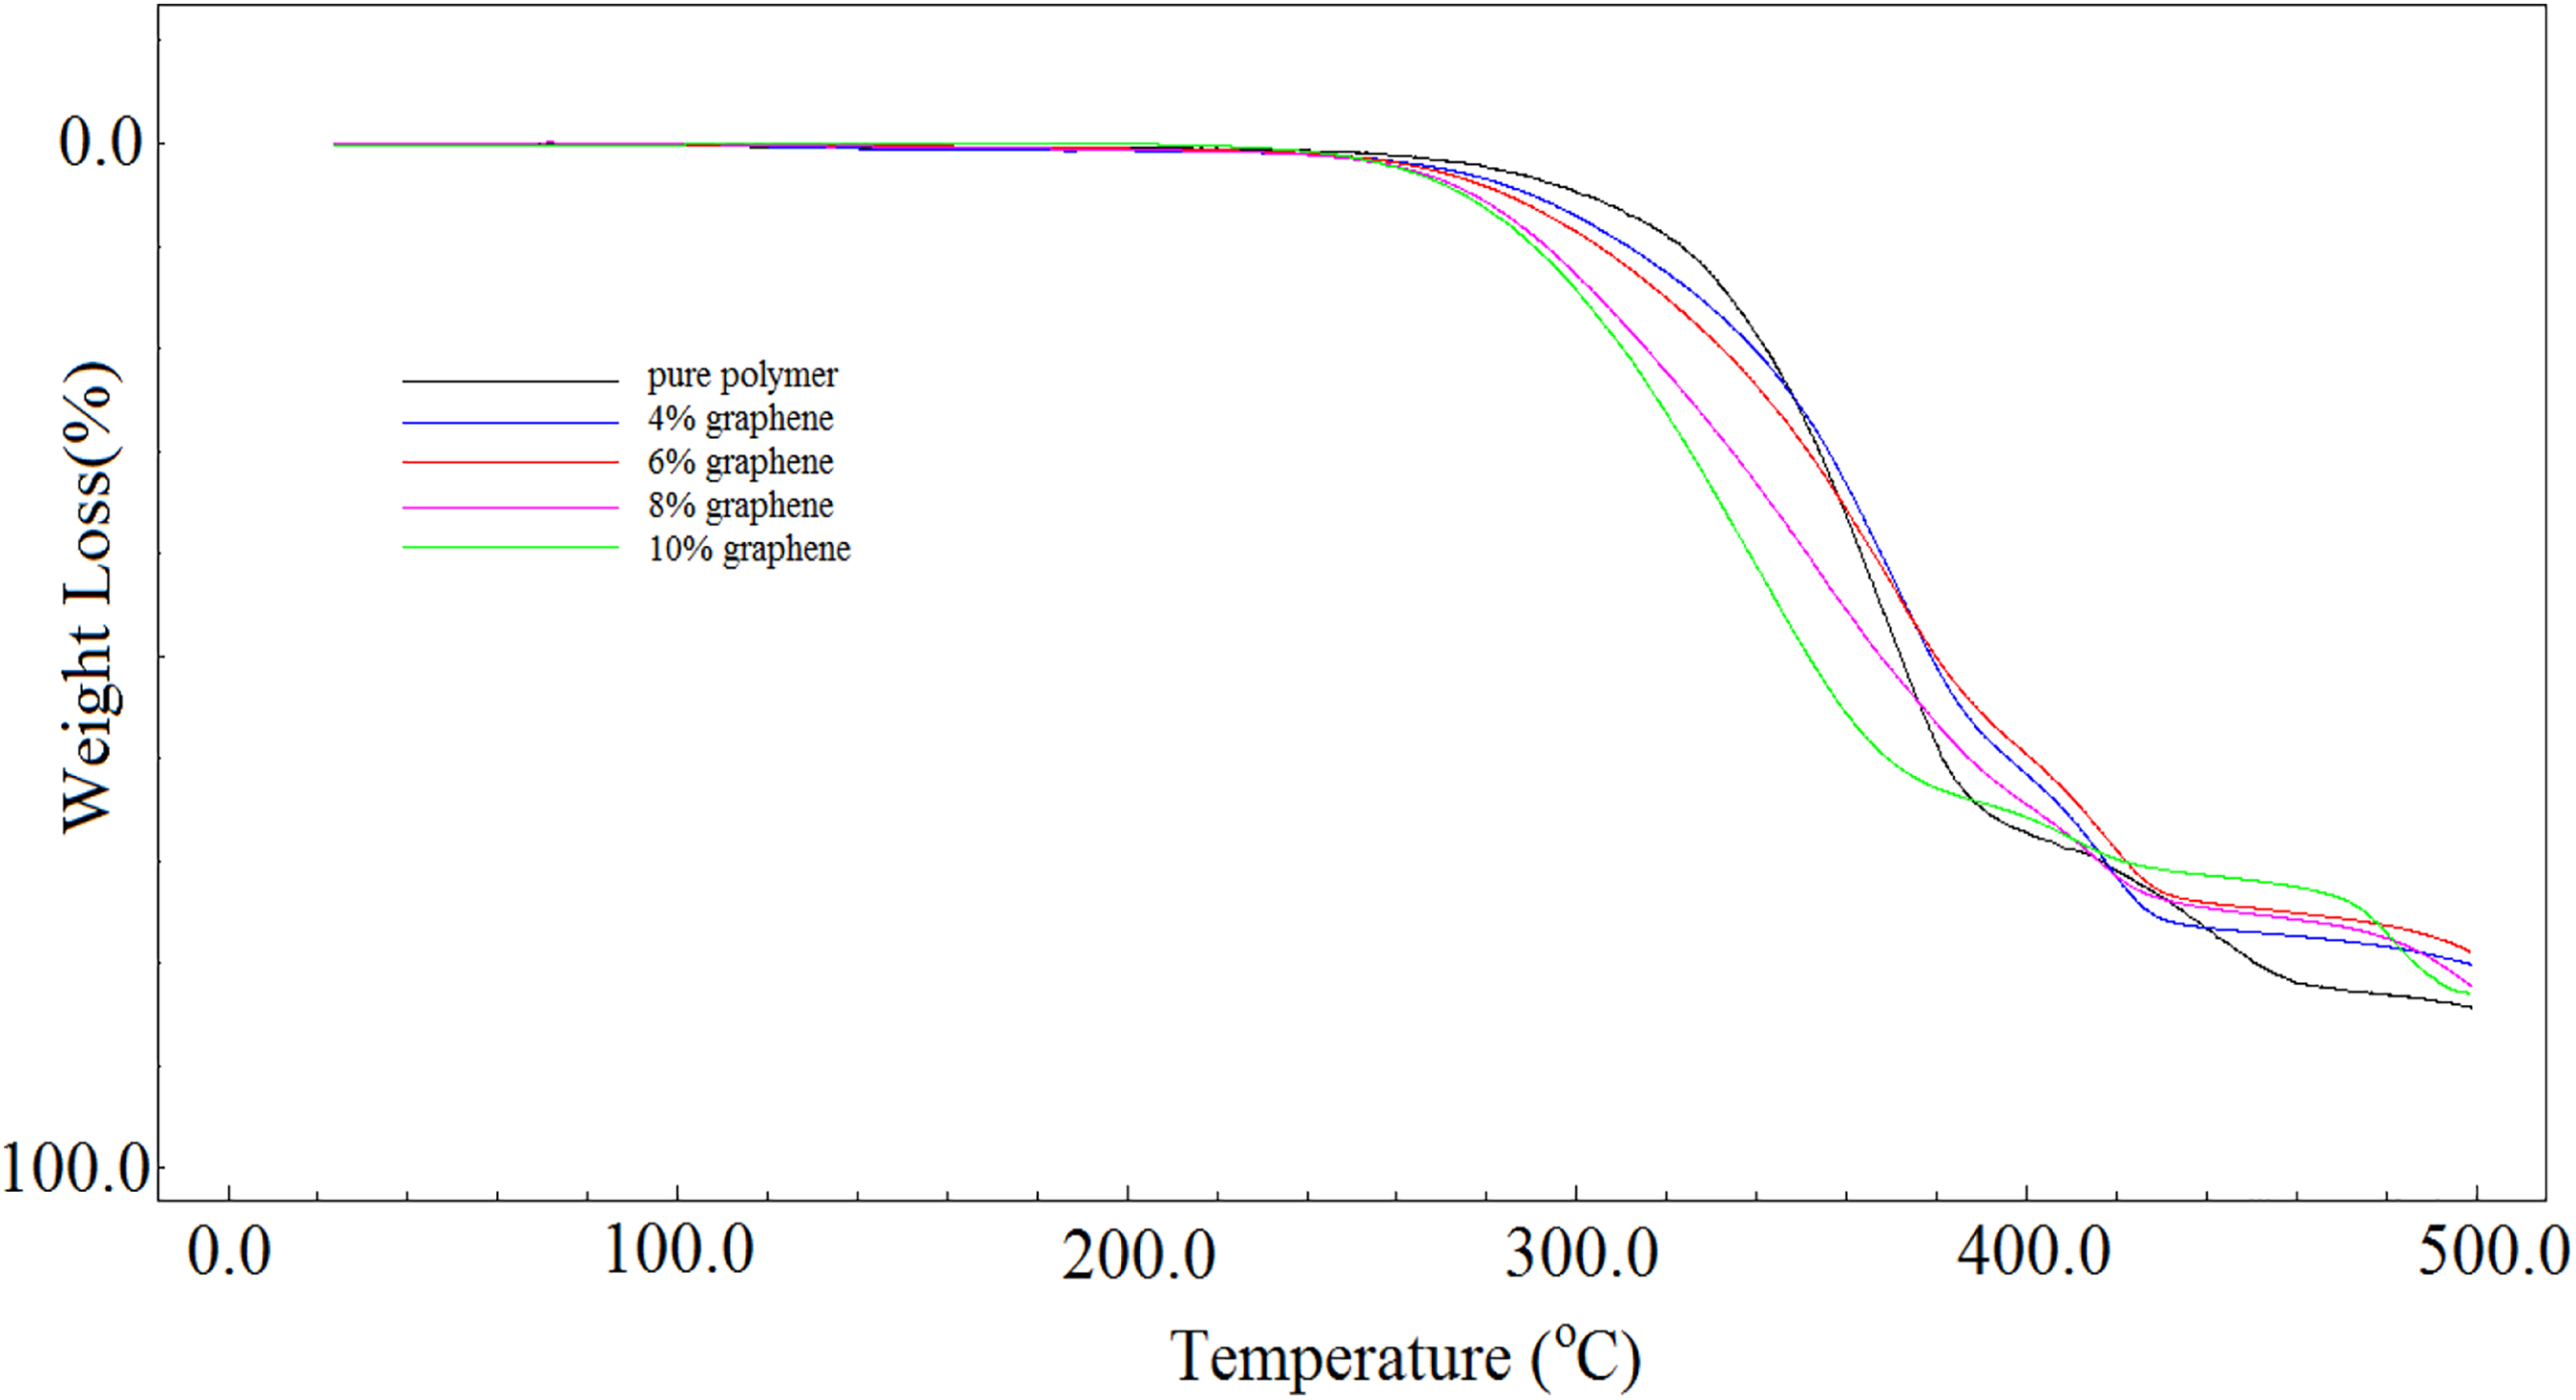
TGA curves of poly(NOEMA) and its composite systems measured at a heating rate of 10°C min−1 under argon gas atmosphere.
TGA data for poly(NOEMA) and poly(NOEMA)/x wt% filled nanographene as compared.
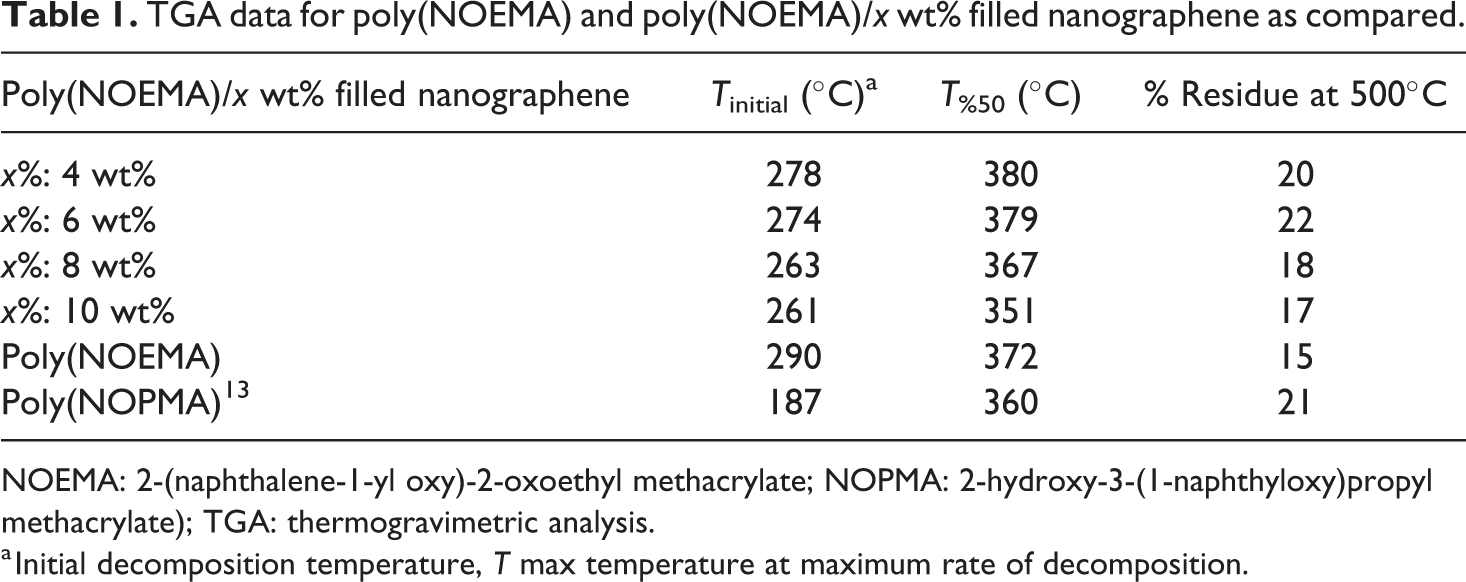
NOEMA: 2-(naphthalene-1-yl oxy)-2-oxoethyl methacrylate; NOPMA: 2-hydroxy-3-(1-naphthyloxy)propyl methacrylate); TGA: thermogravimetric analysis.
a Initial decomposition temperature, T max temperature at maximum rate of decomposition.
Scanning electron microscopy characterization
The scanning electron microscopy (SEM) images of poly(NOEMA) and poly(NOEMA)/x wt% nanographene films at different sizes are indicated in Figure 6(a) to (f). Figure 6a indicates SEM image of the pure poly(NOEMA) film. The surface morphology of the poly(NOEMA) film shows only porous and cracks. The spherulities of poly(NOEMA) not observed due to its amorphous property. Figure 6(b) to (f) shows that the poly(NOEMA)/x wt% nanographene film composites have porous spherical particles of average size 1–100 μm, which are formally distributed over whole surface area of the film. As seen in Figure 6(e), poly(NOEMA)/10 wt% nanographene film has the most prominent distributed spherulite structures. Also, all the composites confirm that the spherulites are highly porous. In addition, the SEM photographs reveal that there is some agglomeration of nanographene particles at high content of nanographene in the poly(NOEMA)/x wt% nanographene films. In this context, the SEM images of 2, 4, 6, 8, and 10 wt% nanographene containing poly(NOEMA) as shown in Figure 6(b), (c), (d), (e), and (f), respectively, indicate that the pore sizes significantly decrease in the spherical particles, which also indicates that there is considerably a change in the polymer–nanographene particle interactions due to the increasing of nanographene amounts in the poly(NOEMA) films.
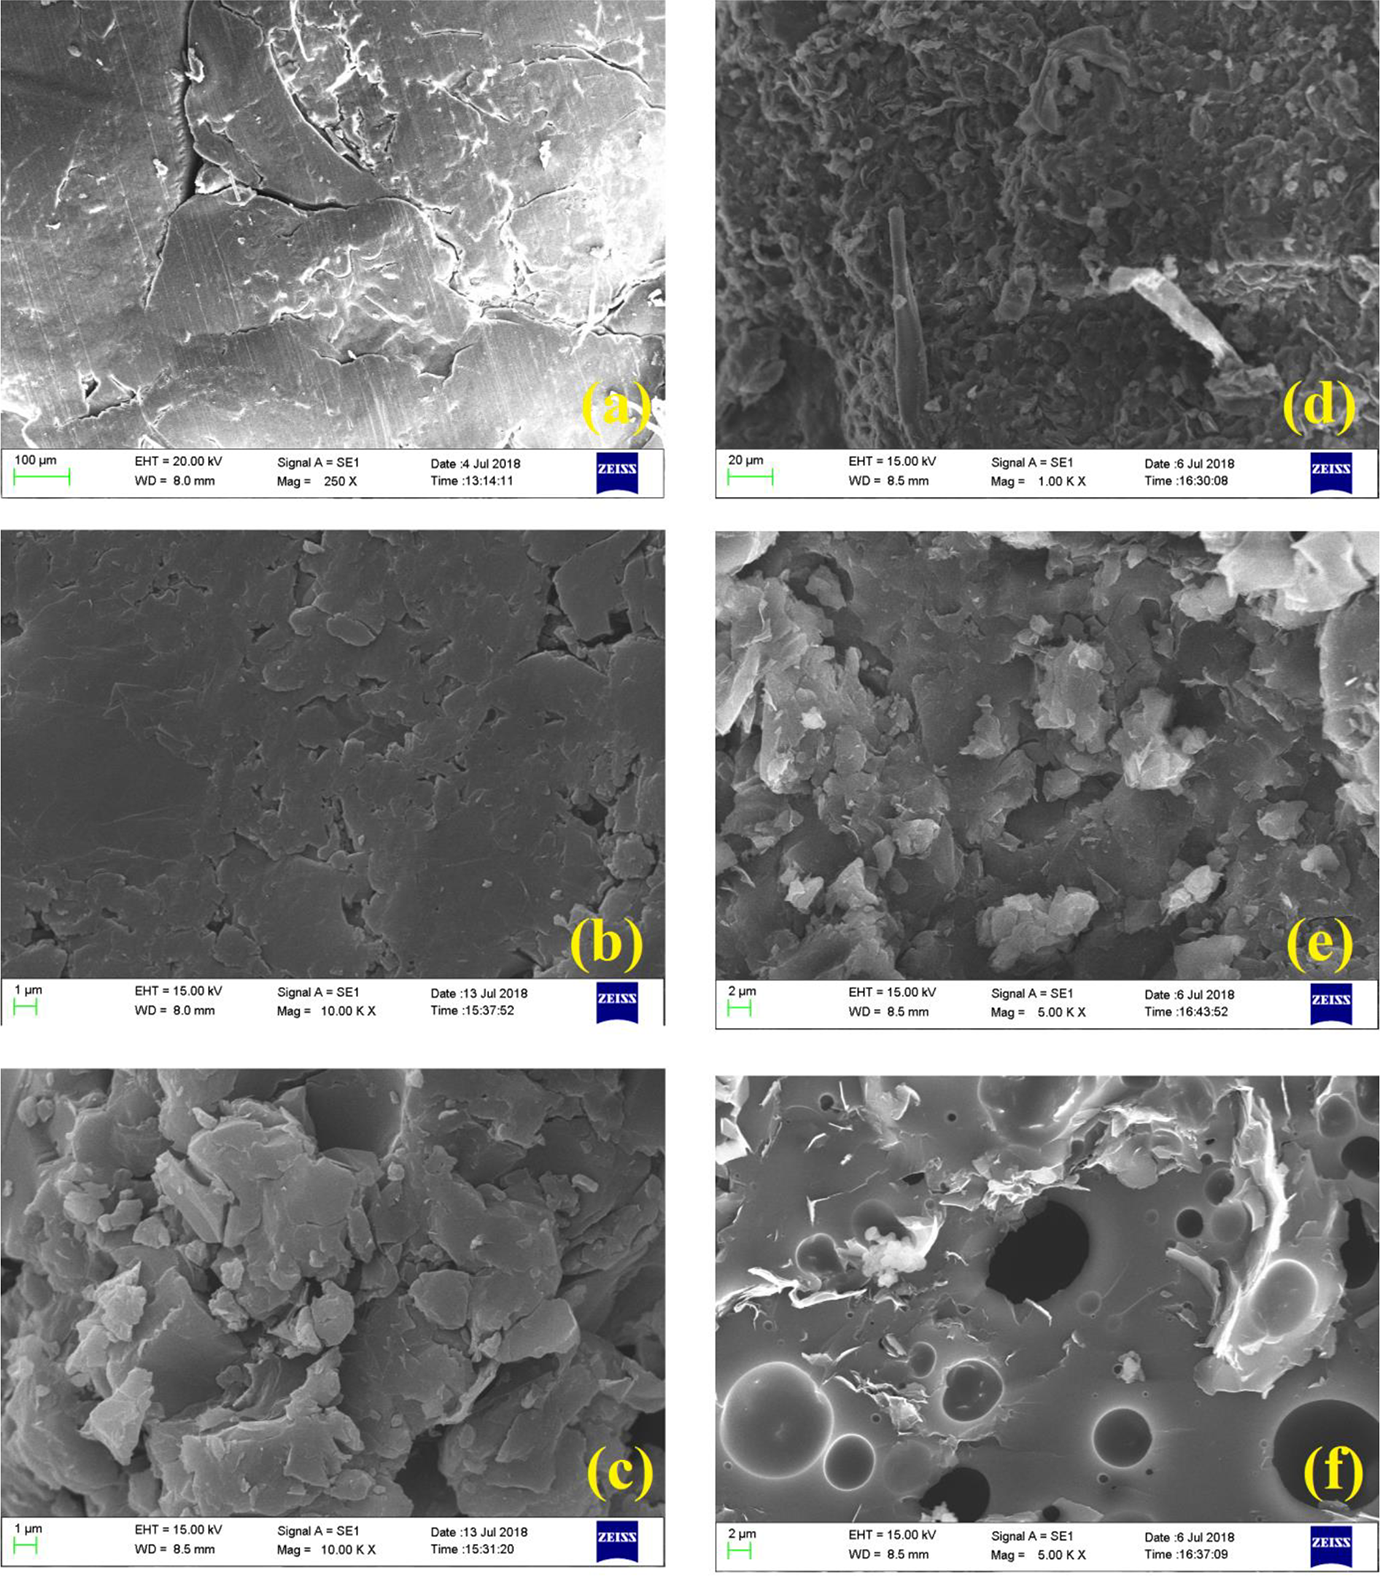
SEM images of (a) pure poly(NOEMA) and its composites containing (b) 2, (c) 4, (d) 6, (e) 8, and (f) 10 wt% nanographene.
Dielectrical behaviors
The values indicating frequency dependence of the real part (ε′) and imaginary part (ε″) of the complex permittivity

The ratio between dielectric loss factor (imaginary part) and dielectric constant (real part) of permittivity correspond to another parameter, dissipation factor or loss tangent, Tan
To understand the efficiency of nanographene filler on the poly(NOEMA), the ε′, ε″, σ, and tanδ values of the poly(NOEMA) films as a function of nanographene content between frequencies from 100 Hz to 20 kHz and fixed temperature (at 300 K) are plotted in Figures 7(a) and (b) and 8(a) and (b). From Figure 7(a), it can be said that the ε′ values of the poly(NOEMA)/10 wt% nanographene highly increase with the increase of nanographene content up to 10 wt%, but the ε′ values up to content of 2 wt% nanographene have not changed and were almost same with that of pure poly(NOEMA). Before estimating the ε′, ε″, and tanδ of the poly(NOEMA)/nanographene composite systems, firstly, the ε′, ε″, and tanδ values of the poly(NOEMA) are discussed herewith. The ε′, ε″, and tanδ values of the poly(NOEMA) are 3.66, 0.052, and 0.0142 (as estimated in Figure 8(a)), respectively, at 1 kHz and 300 K. However, at the same temperature and frequency, the ε′, ε″, and tanδ values of poly(NOEMA)/2 wt% nanographene are 5.42, 0.077, and 0.0142, respectively. Also, the dielectric constant, ε′, of poly(NOEMA)/4 wt% nanographene was estimated as 95 at 1 kHz, which characterizes that the interactions between the poly(NOEMA) chains and nanographene increase the number of effective parallels aligned dipoles in the composite. Additionally, the ε′ value of poly(NOEMA)/10 wt% nanographene was estimated as 186 at the same frequency. Figure 7(a) indicates that the ε′ values of poly(NOEMA)/x wt% nanographene are higher than that of the pure poly(NOEMA), and these values have changed nonlinearly depending on the increase in content of nanographene in the composite systems. The increasing values of ε′ dependence on the addition of nanographene in poly(NOEMA) composite can be ascribed to the relatively high ε′ value of nanographene by comparison to that of the pure poly(NOEMA). Initially, a low increase in the ε′ values (≤3 wt%) at low content of nanographene, which is not the whole dispersed poly(NOEMA) films, reflects that the weak physical interactions formed between the nanographene particles and the functional groups of poly(NOEMA) polymer result in some amount of increase in the effective parallel ordering of dipoles. So, it can be said that the dielectric polarization of nanocomposites has increased. Whereas, a high increase in the ε′ values at low concentration (10 wt%) of nanographene, which was dispersed poly(NOEMA) films, reflects that the induced-dipole–induced-dipole or London–London physical interactions occurred between the nanographene particles and the functional groups of poly(NOEMA) chains cause an increase in number of effective parallel ordering of dipoles. Therefore, the dielectric polarization of these composites increases. So, it can be said that the polymer–nanofiller interfacial zones play a significant role in the formation of dipolar polarization strength of the poly(NOEMA). The value of ε′ increases with increasing frequency at fixed temperature. This behavior confirms every sample at all frequencies. At lower frequencies, this event has a more prominent effect. As seen at all curves, the decrease in ε′ with increasing frequency is expected behavior for many dielectric materials. 22 The frequency change of the dielectric loss factor, ε″, of composites is shown in Figure 7(b). As expected, the ε″ is higher in composites containing 2–10 wt% nanographene, compared to the pure poly(NOEMA). The ε″ values of composites doped 2 and 10 wt% nanographene at 293 K and 1 kHz are 0.052 and 210,152, respectively, whereas that of the pure poly(NOEMA) is 0.052 at 300 K and 1 kHz. This behavior may be due to few reasons such as the more heterogeneous structure, free charges, and impurities.
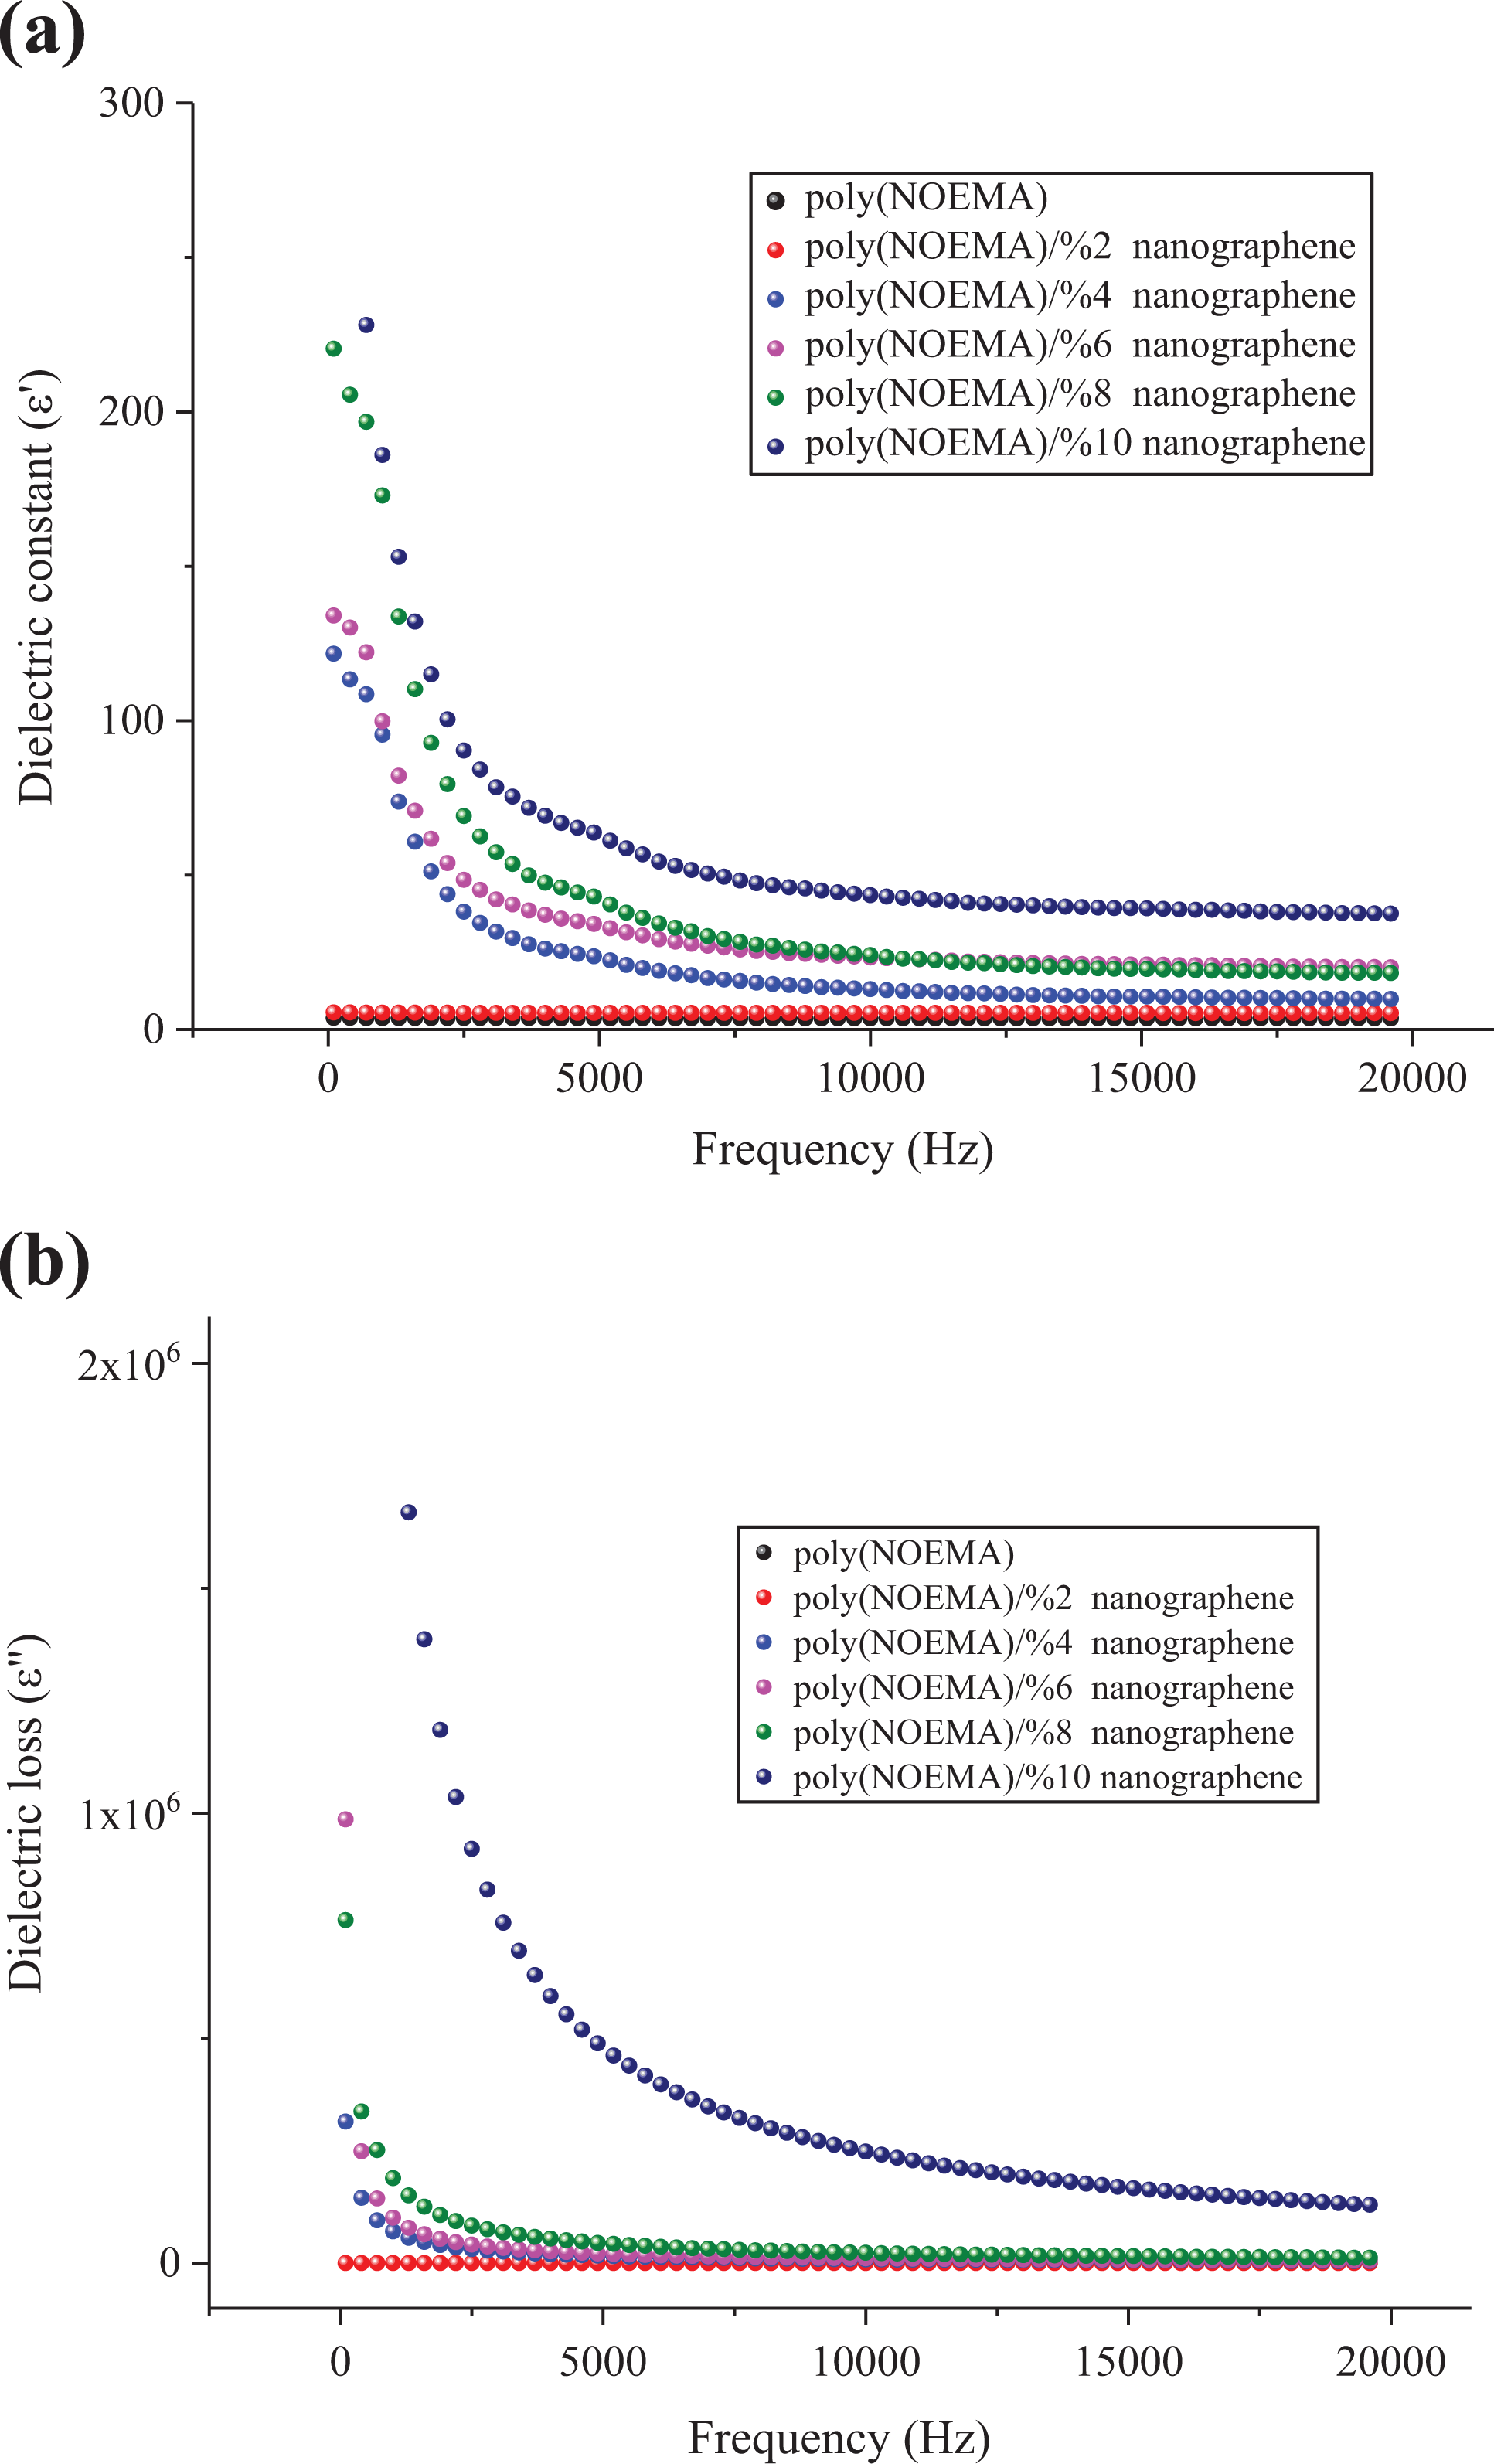
Dependence of (a) ∊′ and (b) ∊″ of the poly(NOEMA) and its composites as a function of frequency.
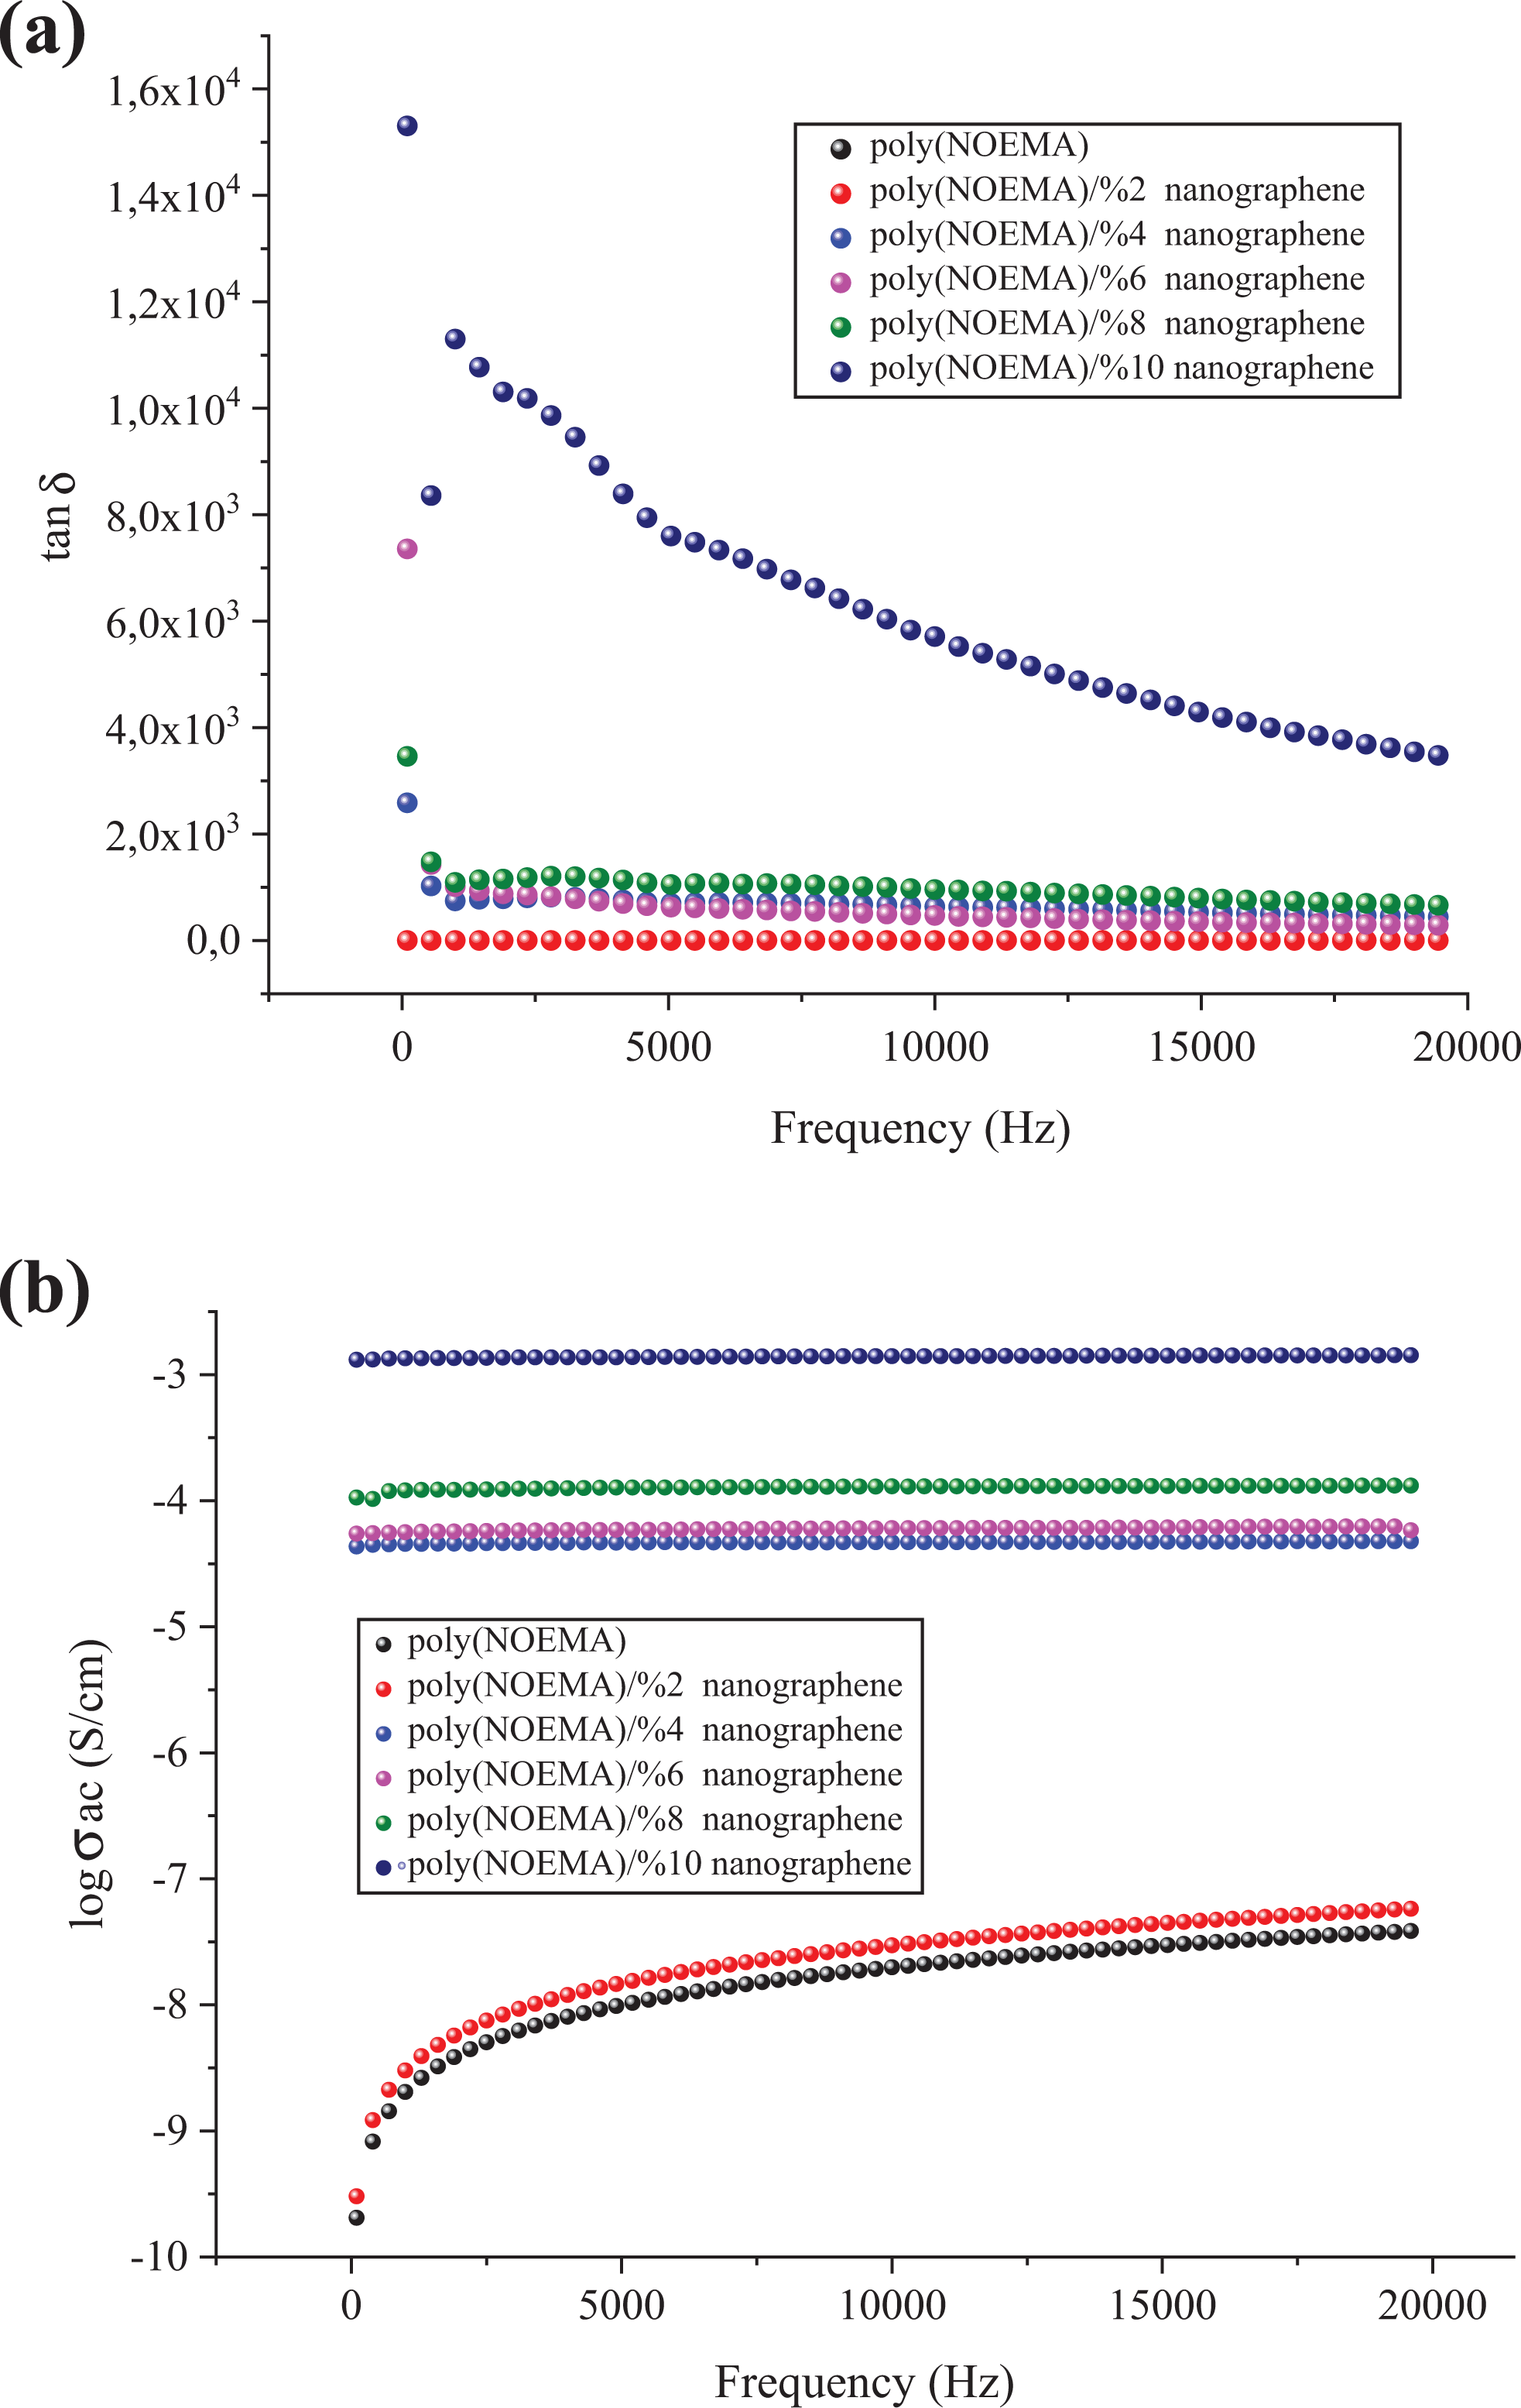
Dependence of (a) tanδ and (b) logσ AC of the poly(NOEMA) and its composites as a function of frequency.
Figure 8(b) shows change in AC conductivity depending on increasing content of nanographene in the polymer composite. As the amount of nanographene in the polymer composites increased, AC conductivity increased, and the highest value was estimated for poly(NOEMA) composite containing 10 wt% nanographene at 1 kHz and 300 K. The addition of nanographene shows reasonably an increase of the imaginary part in the polymer composite. The increase of ε′ and ε″ with filler content, as seen in Figure 9, is not linear, but it follows as an exponential law for both poly(NOEMA) and poly(NOEMA) composite systems. Variation of this exponential was verified with 10 wt% nanographene in poly(NOEMA) and dielectrically characterized. The increase in ε′ depending on increasing content of nanographene in the polymer composite can be attributed to large surface area and high aspect ratio of graphene. On the other hand, increase in mini-capacitors in the polymer composites can result in increase in ε′ of the polymer composite. The increase in ε″ depending on the content of increasing nanographene in the polymer can be attributed to increasing in mobility of free electrons and p-orbital electrons with the addition of nanographene to pure poly(NOEMA). The variation of tanδ and σ AC depending on the content of nanographene at 1 kHz is shown in Figure 10. The tanδ, which is equal to ε″/ε′, is increasing as the content of nanographene increases. The variation of dielectric permittivity with temperature is different for polymers with nonpolar polymer and polar structures. The polarization due to the charge accumulation leading to the increase in the value of the dielectric loss increases. In this case, orientation of dipoles is facilitated with rising temperature and thereby the permittivity and loss factor. The tanδ values of composites doped 2 and 10 wt% nanographene at 293 K and 1 kHz are 0.0142 and 1130, respectively, whereas that of the pure poly(NOEMA) is 0.0142 at 300 K and 1 kHz. Clearly, the undoped poly(NOEMA) exhibited similar behavior with that of the poly(NOEMA) filled 2 wt%. The increase of tanδ with filler content, as seen in Figure 10, is not linear. The high tanδ for the poly(NOEMA) with polar structure means generally that will tend to dissipate a fraction of the more stored energy and more energy storing in the form of heat. The relatively high values of tanδ at low frequencies for some polymer films in the literature are observed and are generally attributed to the leakage current in the polymeric composite samples. 23
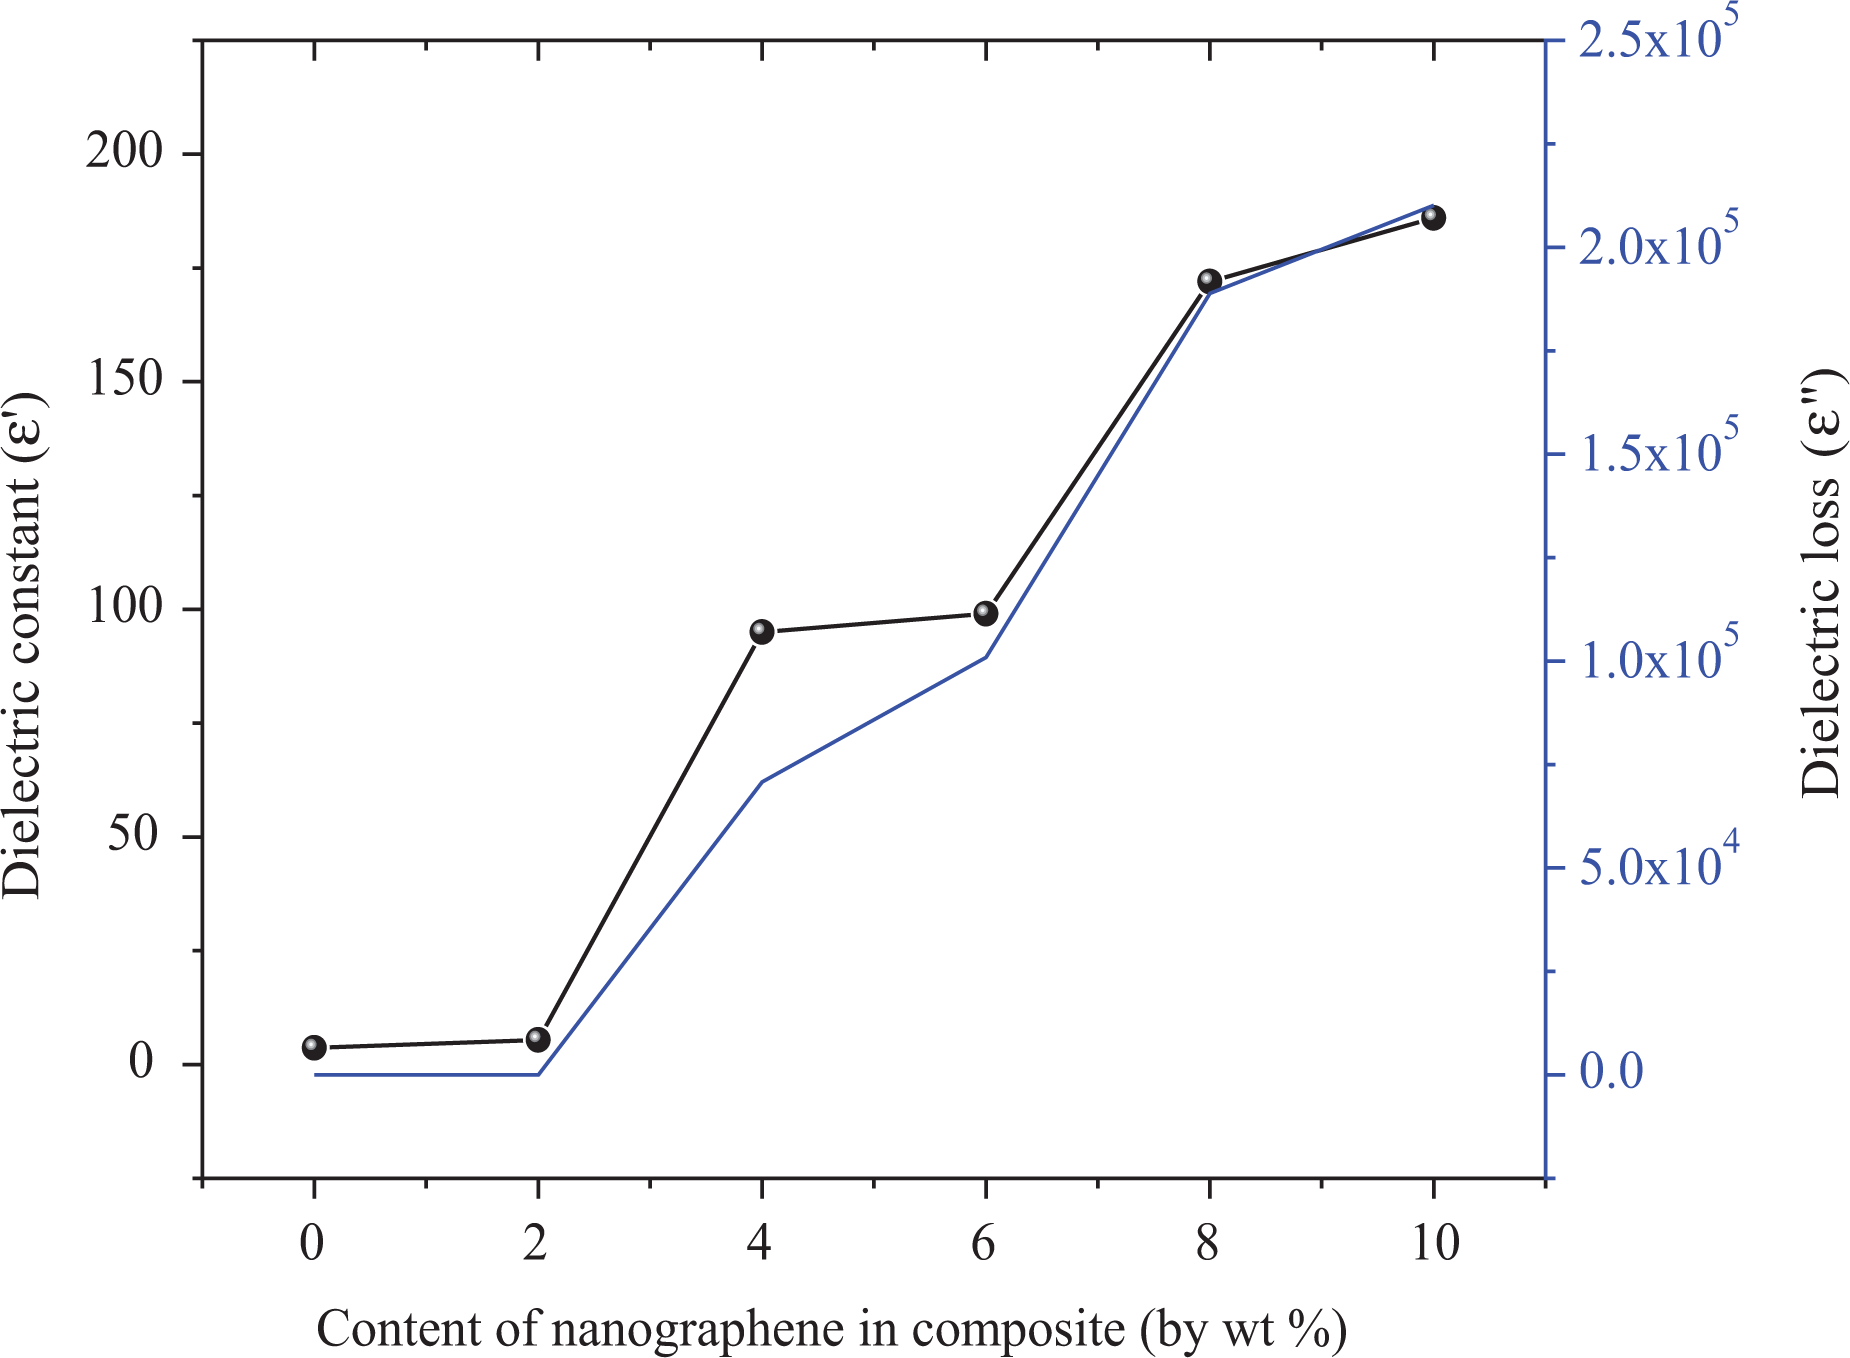
Variation of ∊′ and ∊″ depending on the content of nanographene in composite systems.
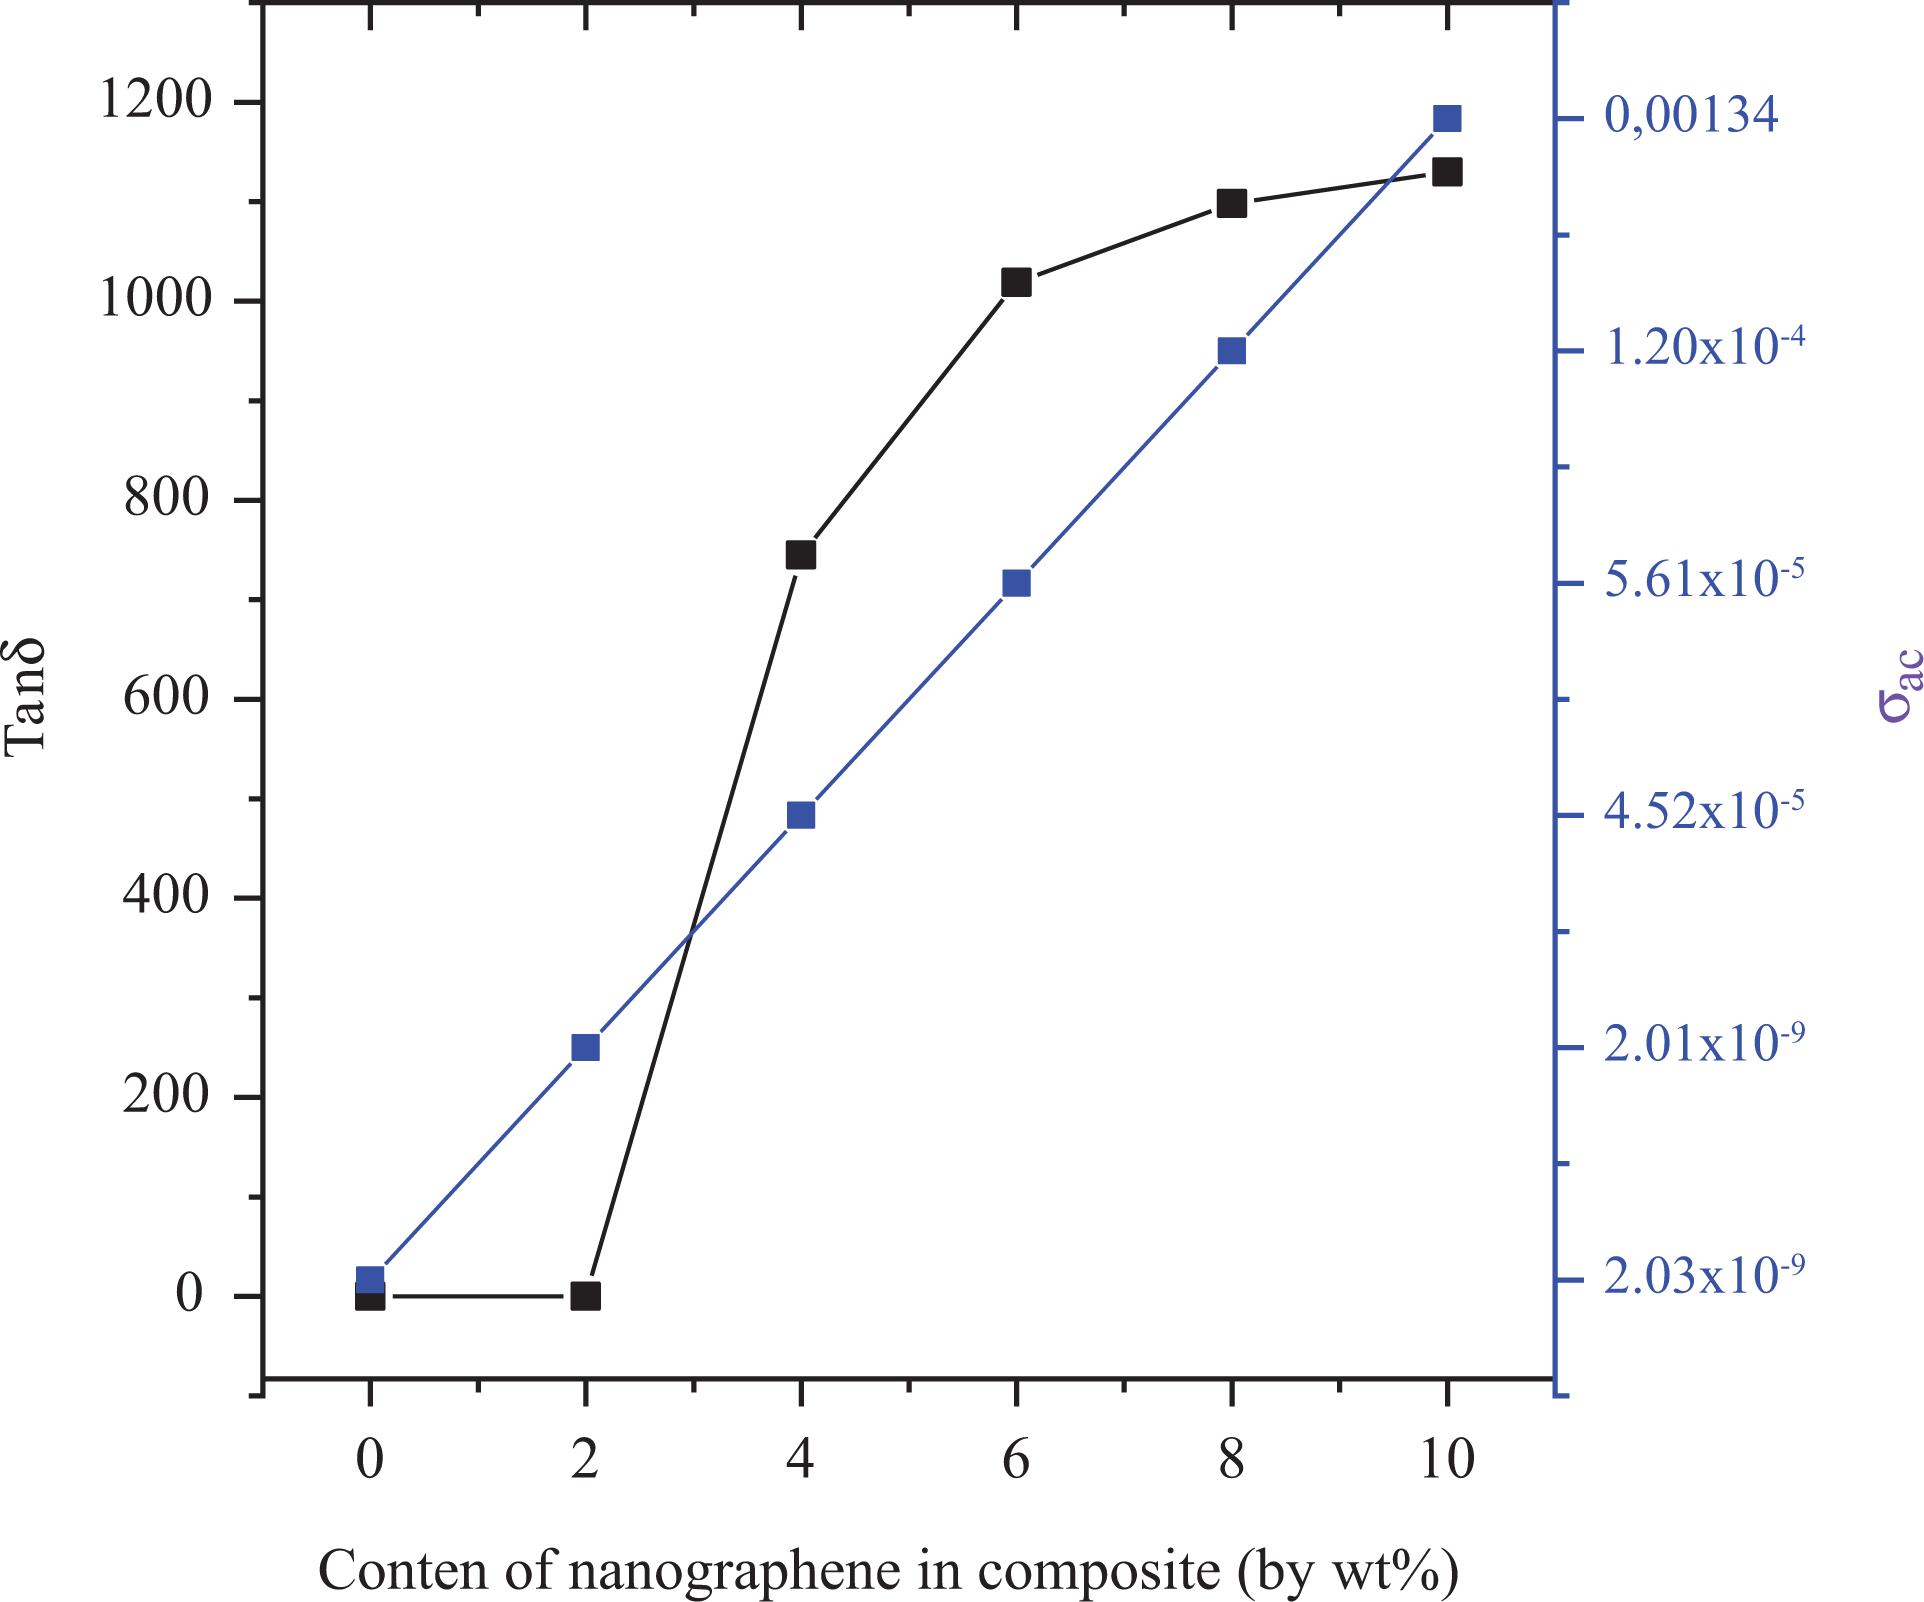
Variation of tanδ and σ AC depending on the content of nanographene in composite systems.
The conductivity of the polymer composite depends on the concentration of filler nanographene, morphology of the polymer composite, and tendency of the filler polymer to aggregate. Dependence of the AC electrical conductivity (σ
AC) on the angular frequency

where the σ
DC is the DC conductivity and the exponent s generally is seen in the range of
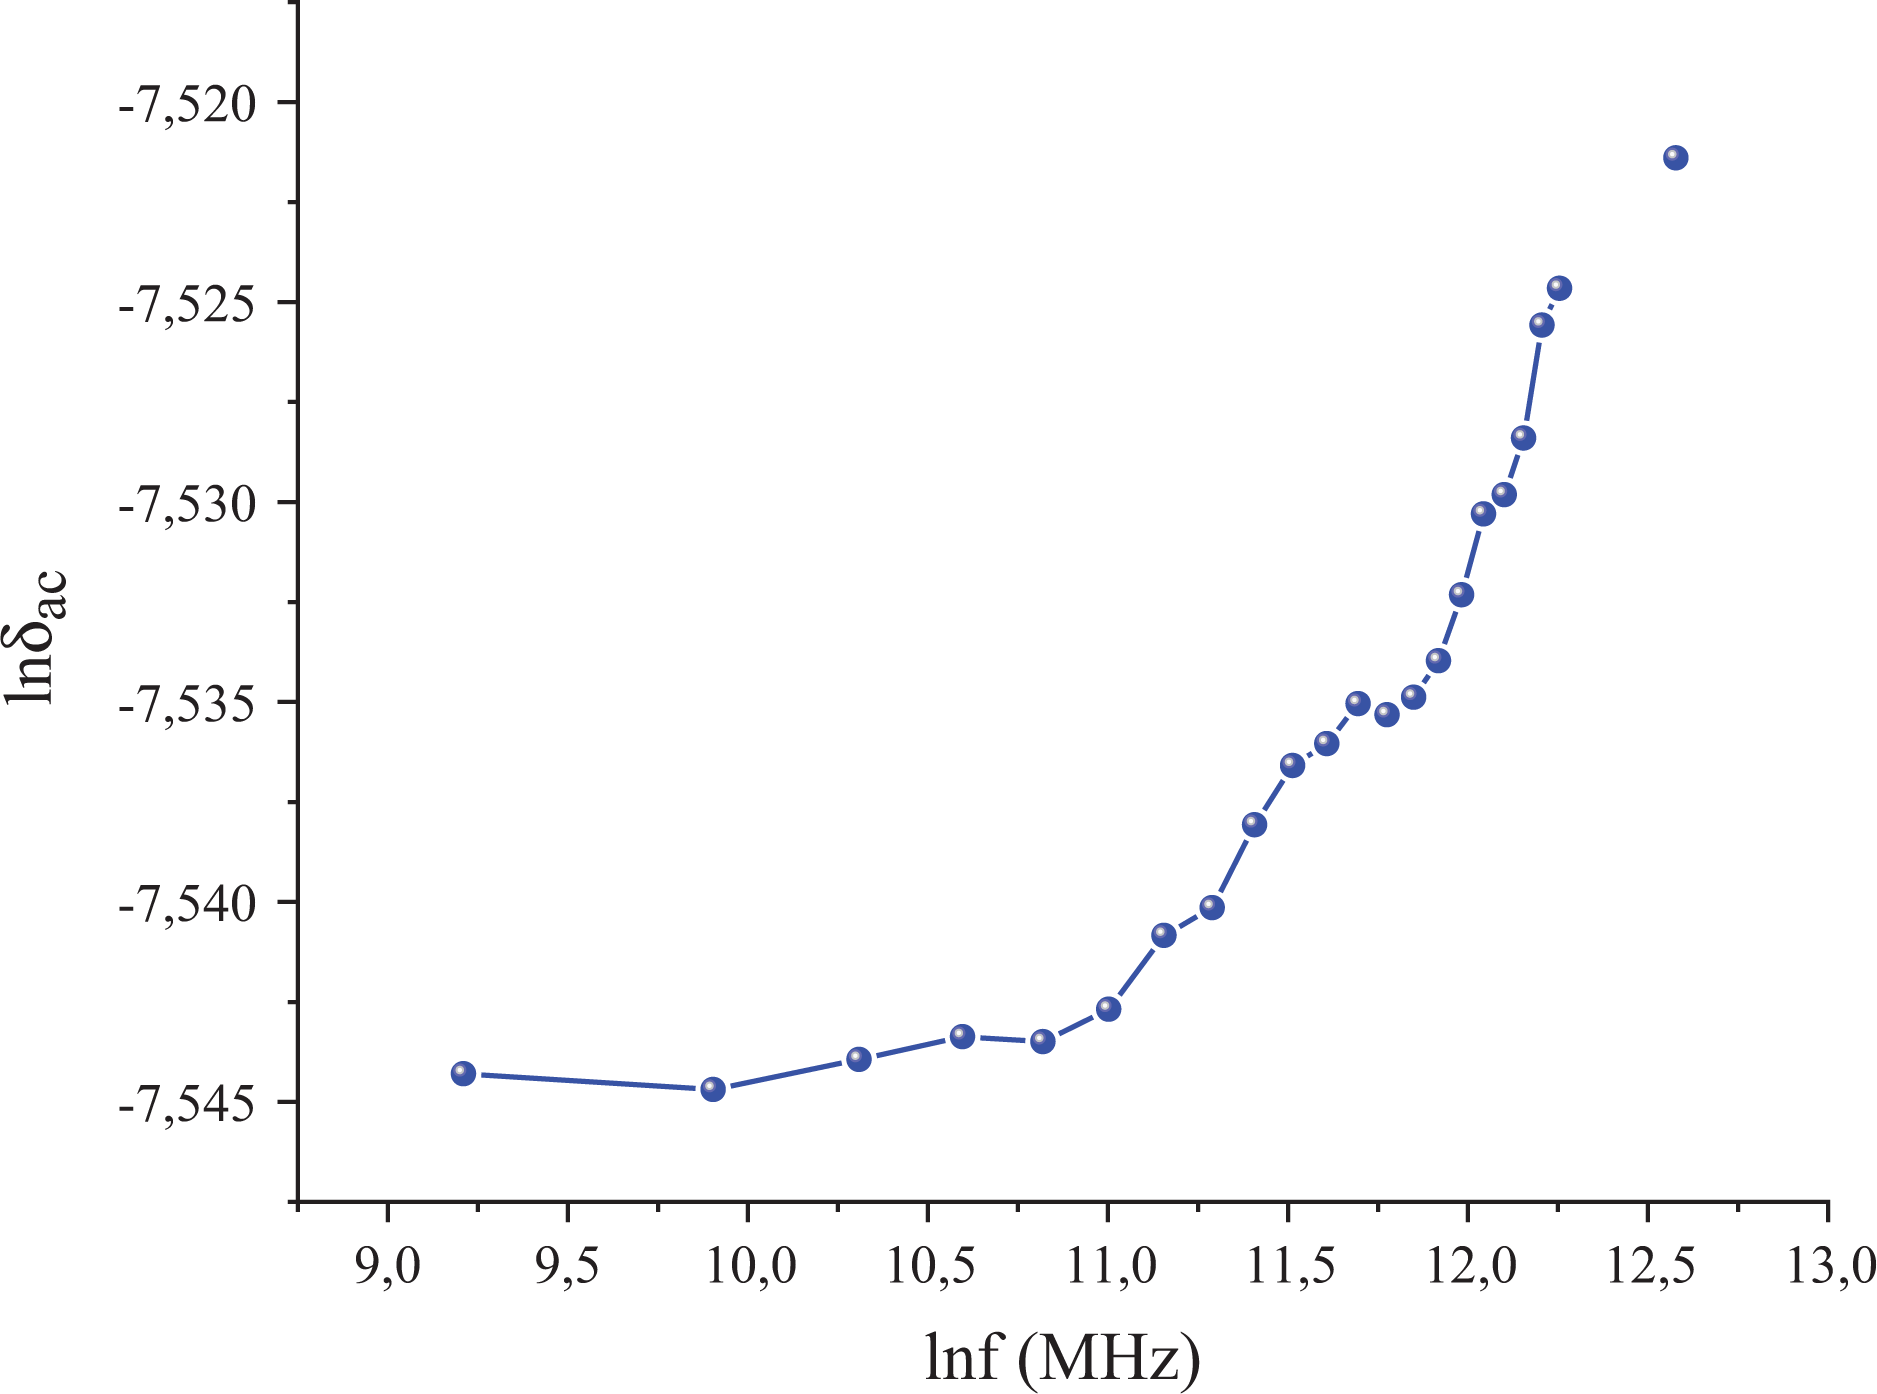
Dependence of lnσ AC versus lnf for AC conductivity at room temperature.
Dielectric results of poly(NOEMA) and poly(NOEMA)/x wt% filled nanographene at various rates at 1 kHz.
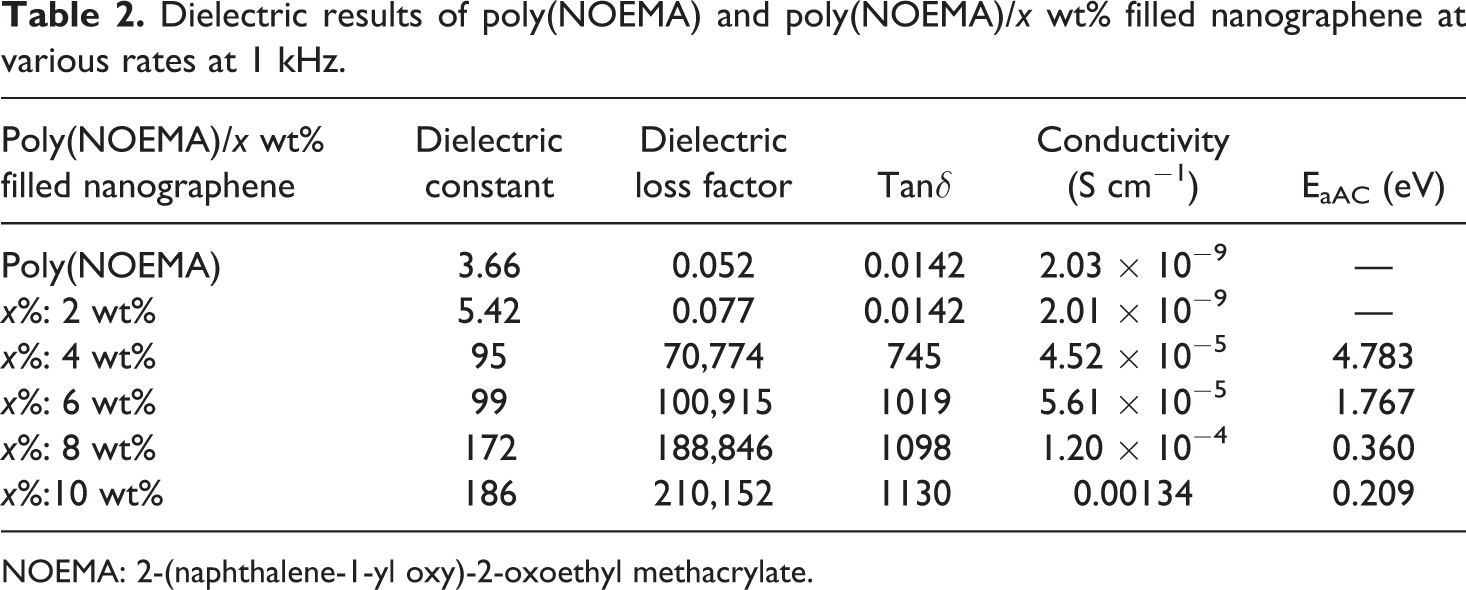
NOEMA: 2-(naphthalene-1-yl oxy)-2-oxoethyl methacrylate.
Electrical properties
The I-V characteristic electrical measurements of the heterojunction diode have been estimated using the pure thermionic emission (TE) theory. The current (I) through a Schottky barrier diode at a forward bias (

where I o is the reverse saturation current, V is the applied bias voltage, T is the absolute temperature, and k is the Boltzmann’s constant. I o is estimated from the straight-line intercept lnI-V. I o values of composites changed from 9.30 × 10⁻⁸ to 7.50 × 10⁻⁶.
The values for the BH can be estimated from equation (4) as

where A is the active device area, Φ b is the BH at zero bias, and A* is the effective Richardson constant, and its value is 32 A (cm K)−2 for p-type Si.
The ideality factor (n) can be founded from the slope of the linear region of the forward bias lnI-V plot and is estimated from equation (5)
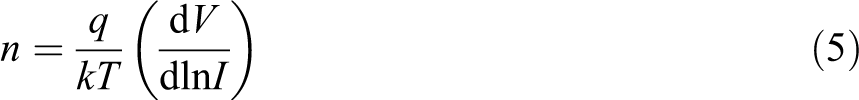
The ideality factor (n) value of the Al/poly(NOEMA)/x wt% nanographene/p-Si/Al diode for dark is found to be between 5.147 and 7.504, respectively. The estimated n value is higher than 1, which is the value of an ideal diode. The high behavior of n values is attributed to many events such as the presence of the interfacial film layer, a wide distribution of low BH patches or barrier inhomogeneous, series resistance and interface states. 31,32 The BH (Φ b) value of the Al/poly(NOEMA)/x wt% nanographene/p-Si/Al diode at dark is found to be between 0.228 and 0.64. The values found for the ideality factor (n) and the BH (Φ b) are presented in Table 3. Like that seen in Table 3, the ideality factors and the BHs changed for different composite systems, hence, it is a general practice way to take averages over these values.
Schottky parameters for Al/poly(NOEMA)/x wt% nanographene/p-Si/Al diode obtained from I-V characteristics (−2/+3 V).
NOEMA: 2-(naphthalene-1-yl oxy)-2-oxoethyl methacrylate; RR: rectification ratio; I-V: current–voltage.
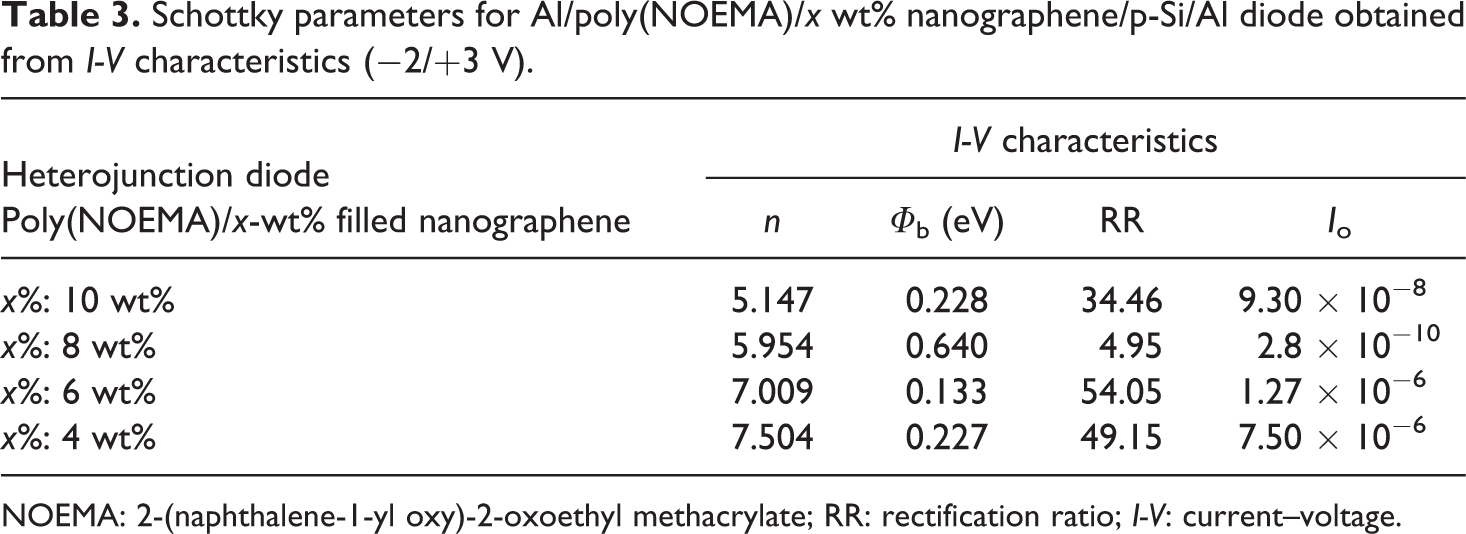
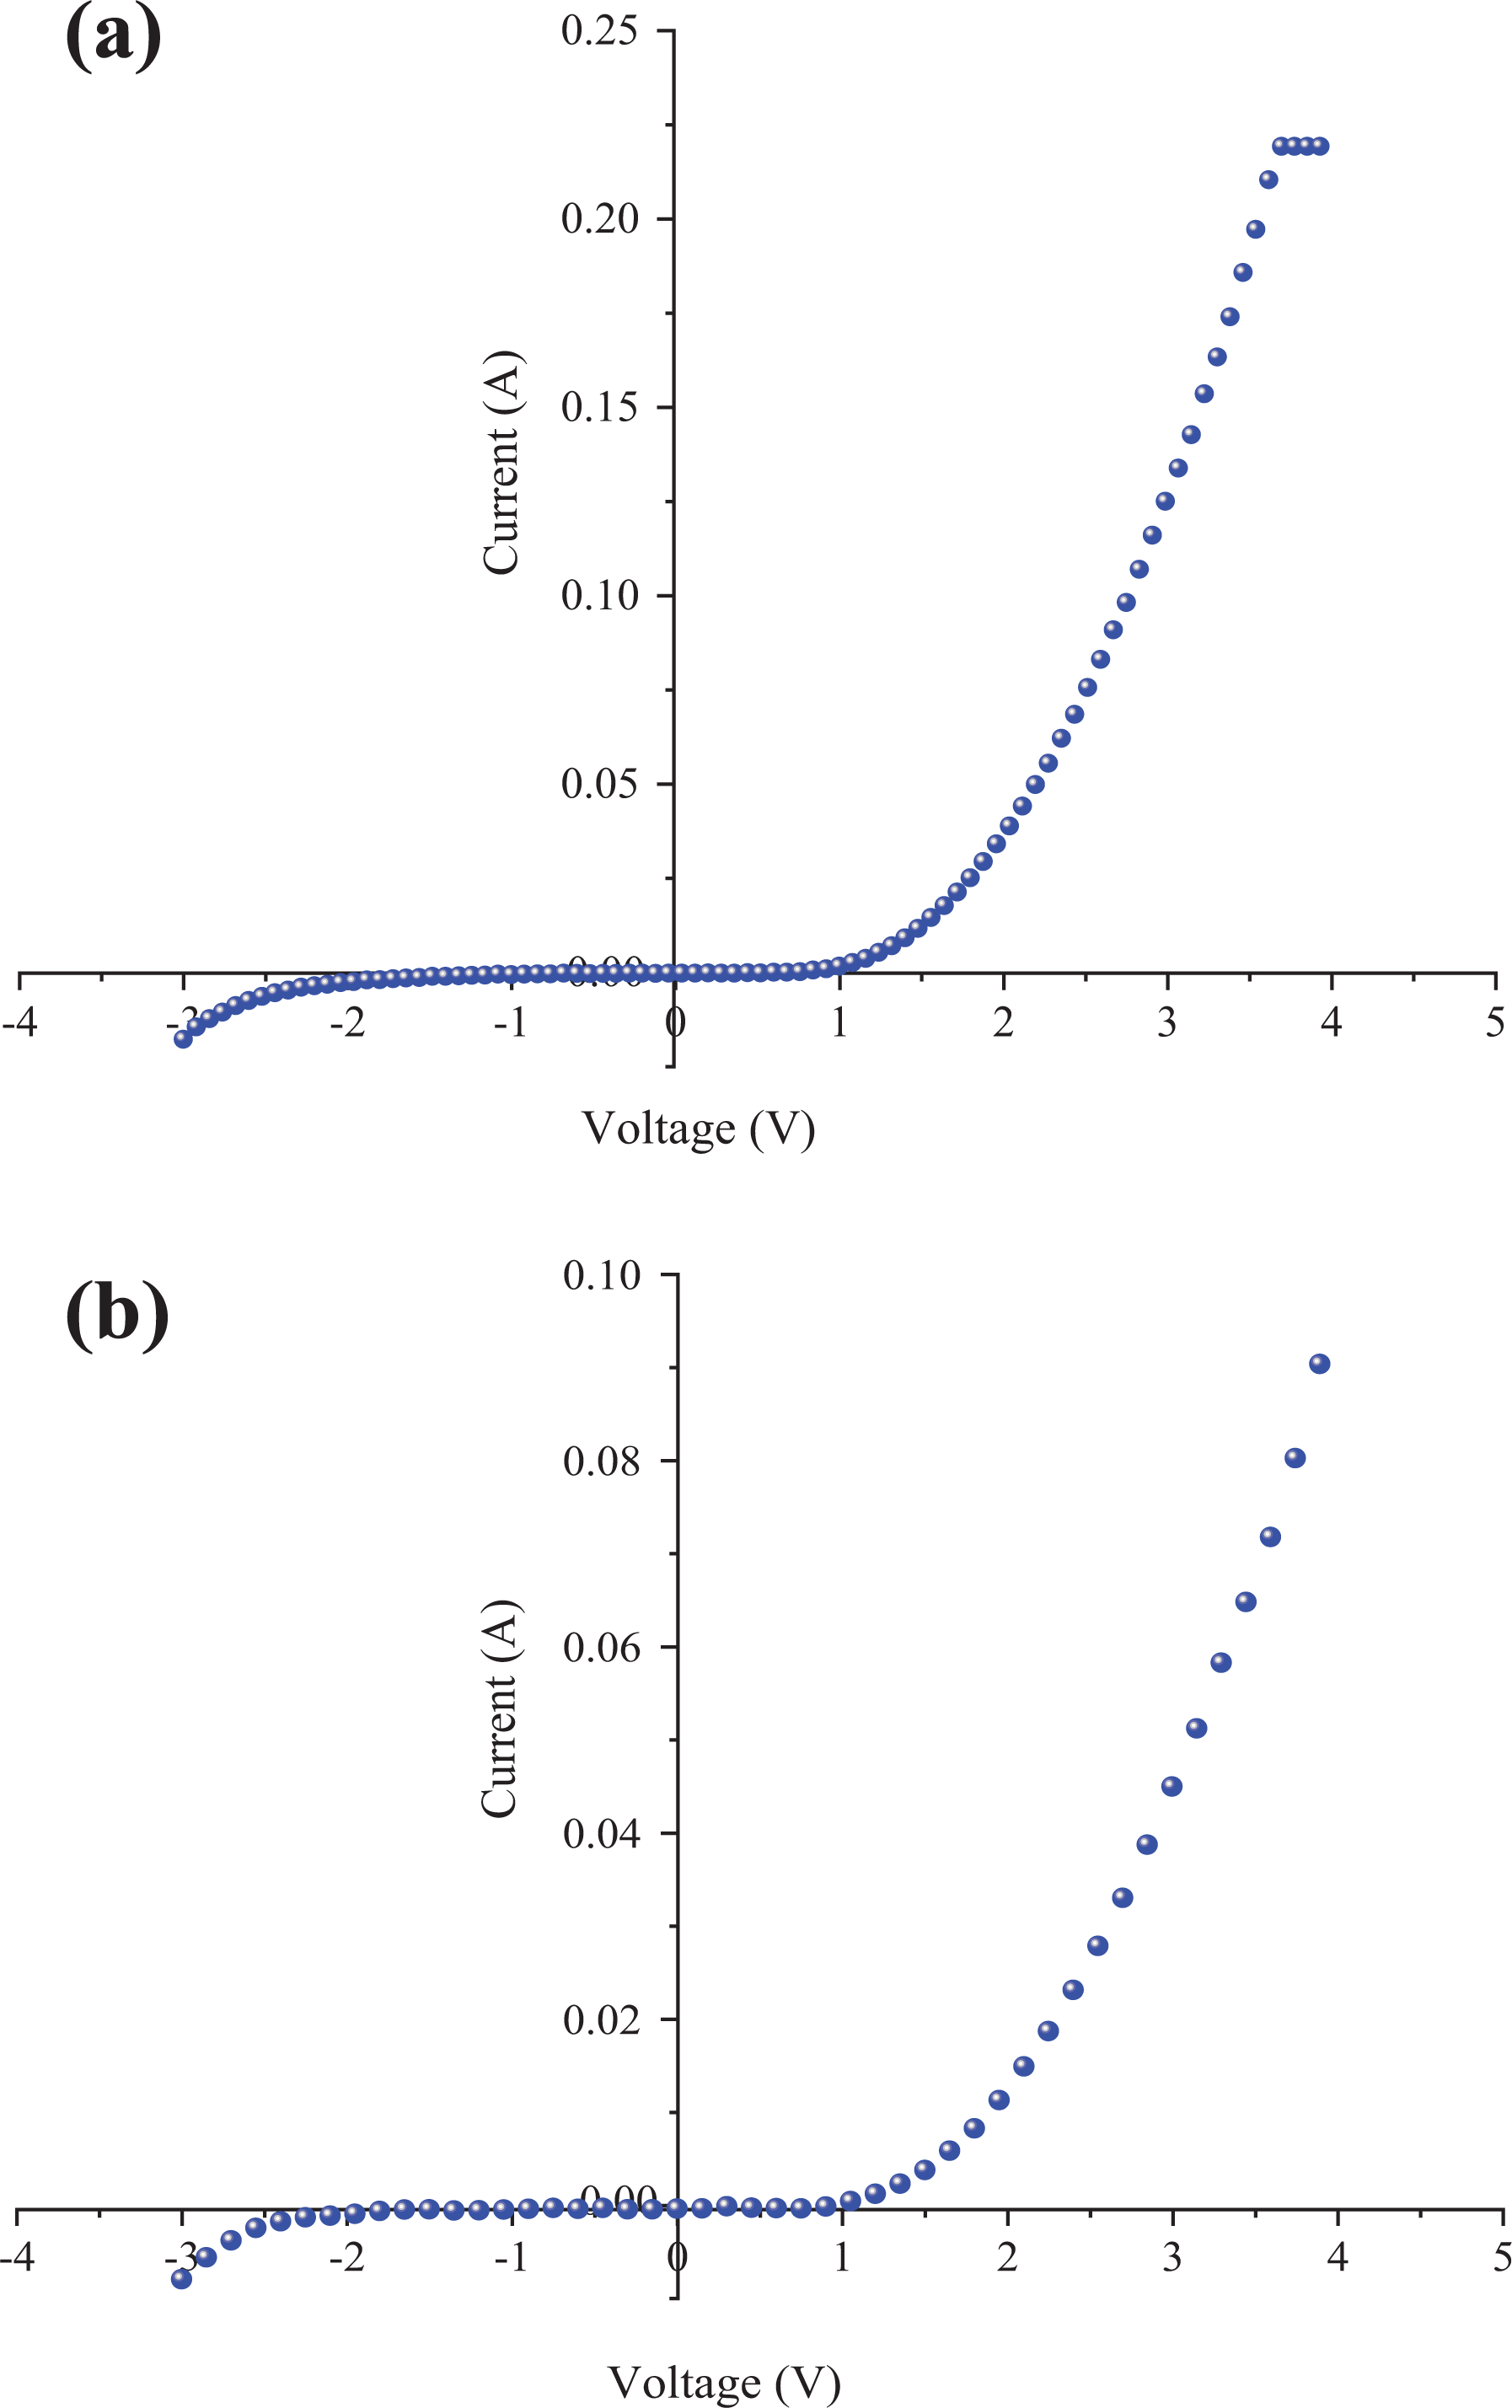
The I-V characteristics of Al/poly(NOEMA)/x wt% nanographene/p-Si/Al heterojunction diode are indicated in Figures 12 and 13. As indicated in Figures 12 and 13, the forward current is higher than that of reverse current; this indicates that the polymer composite/p-Si thin-film planar heterojunction diode exhibited rectification behaviors, which are the lowest RR is 4.95 and the highest RR value is 54.05 at −2/+3 V at dark condition.
Experimental forward and reverse bias current-voltage characteristics of: (a) Al/poly(NOEMA)-4 wt% nanographene/p-Si Schottky diode; and (b) Al/poly(NOEMA)-6wt% nanographene/p-Si Schottky diode.
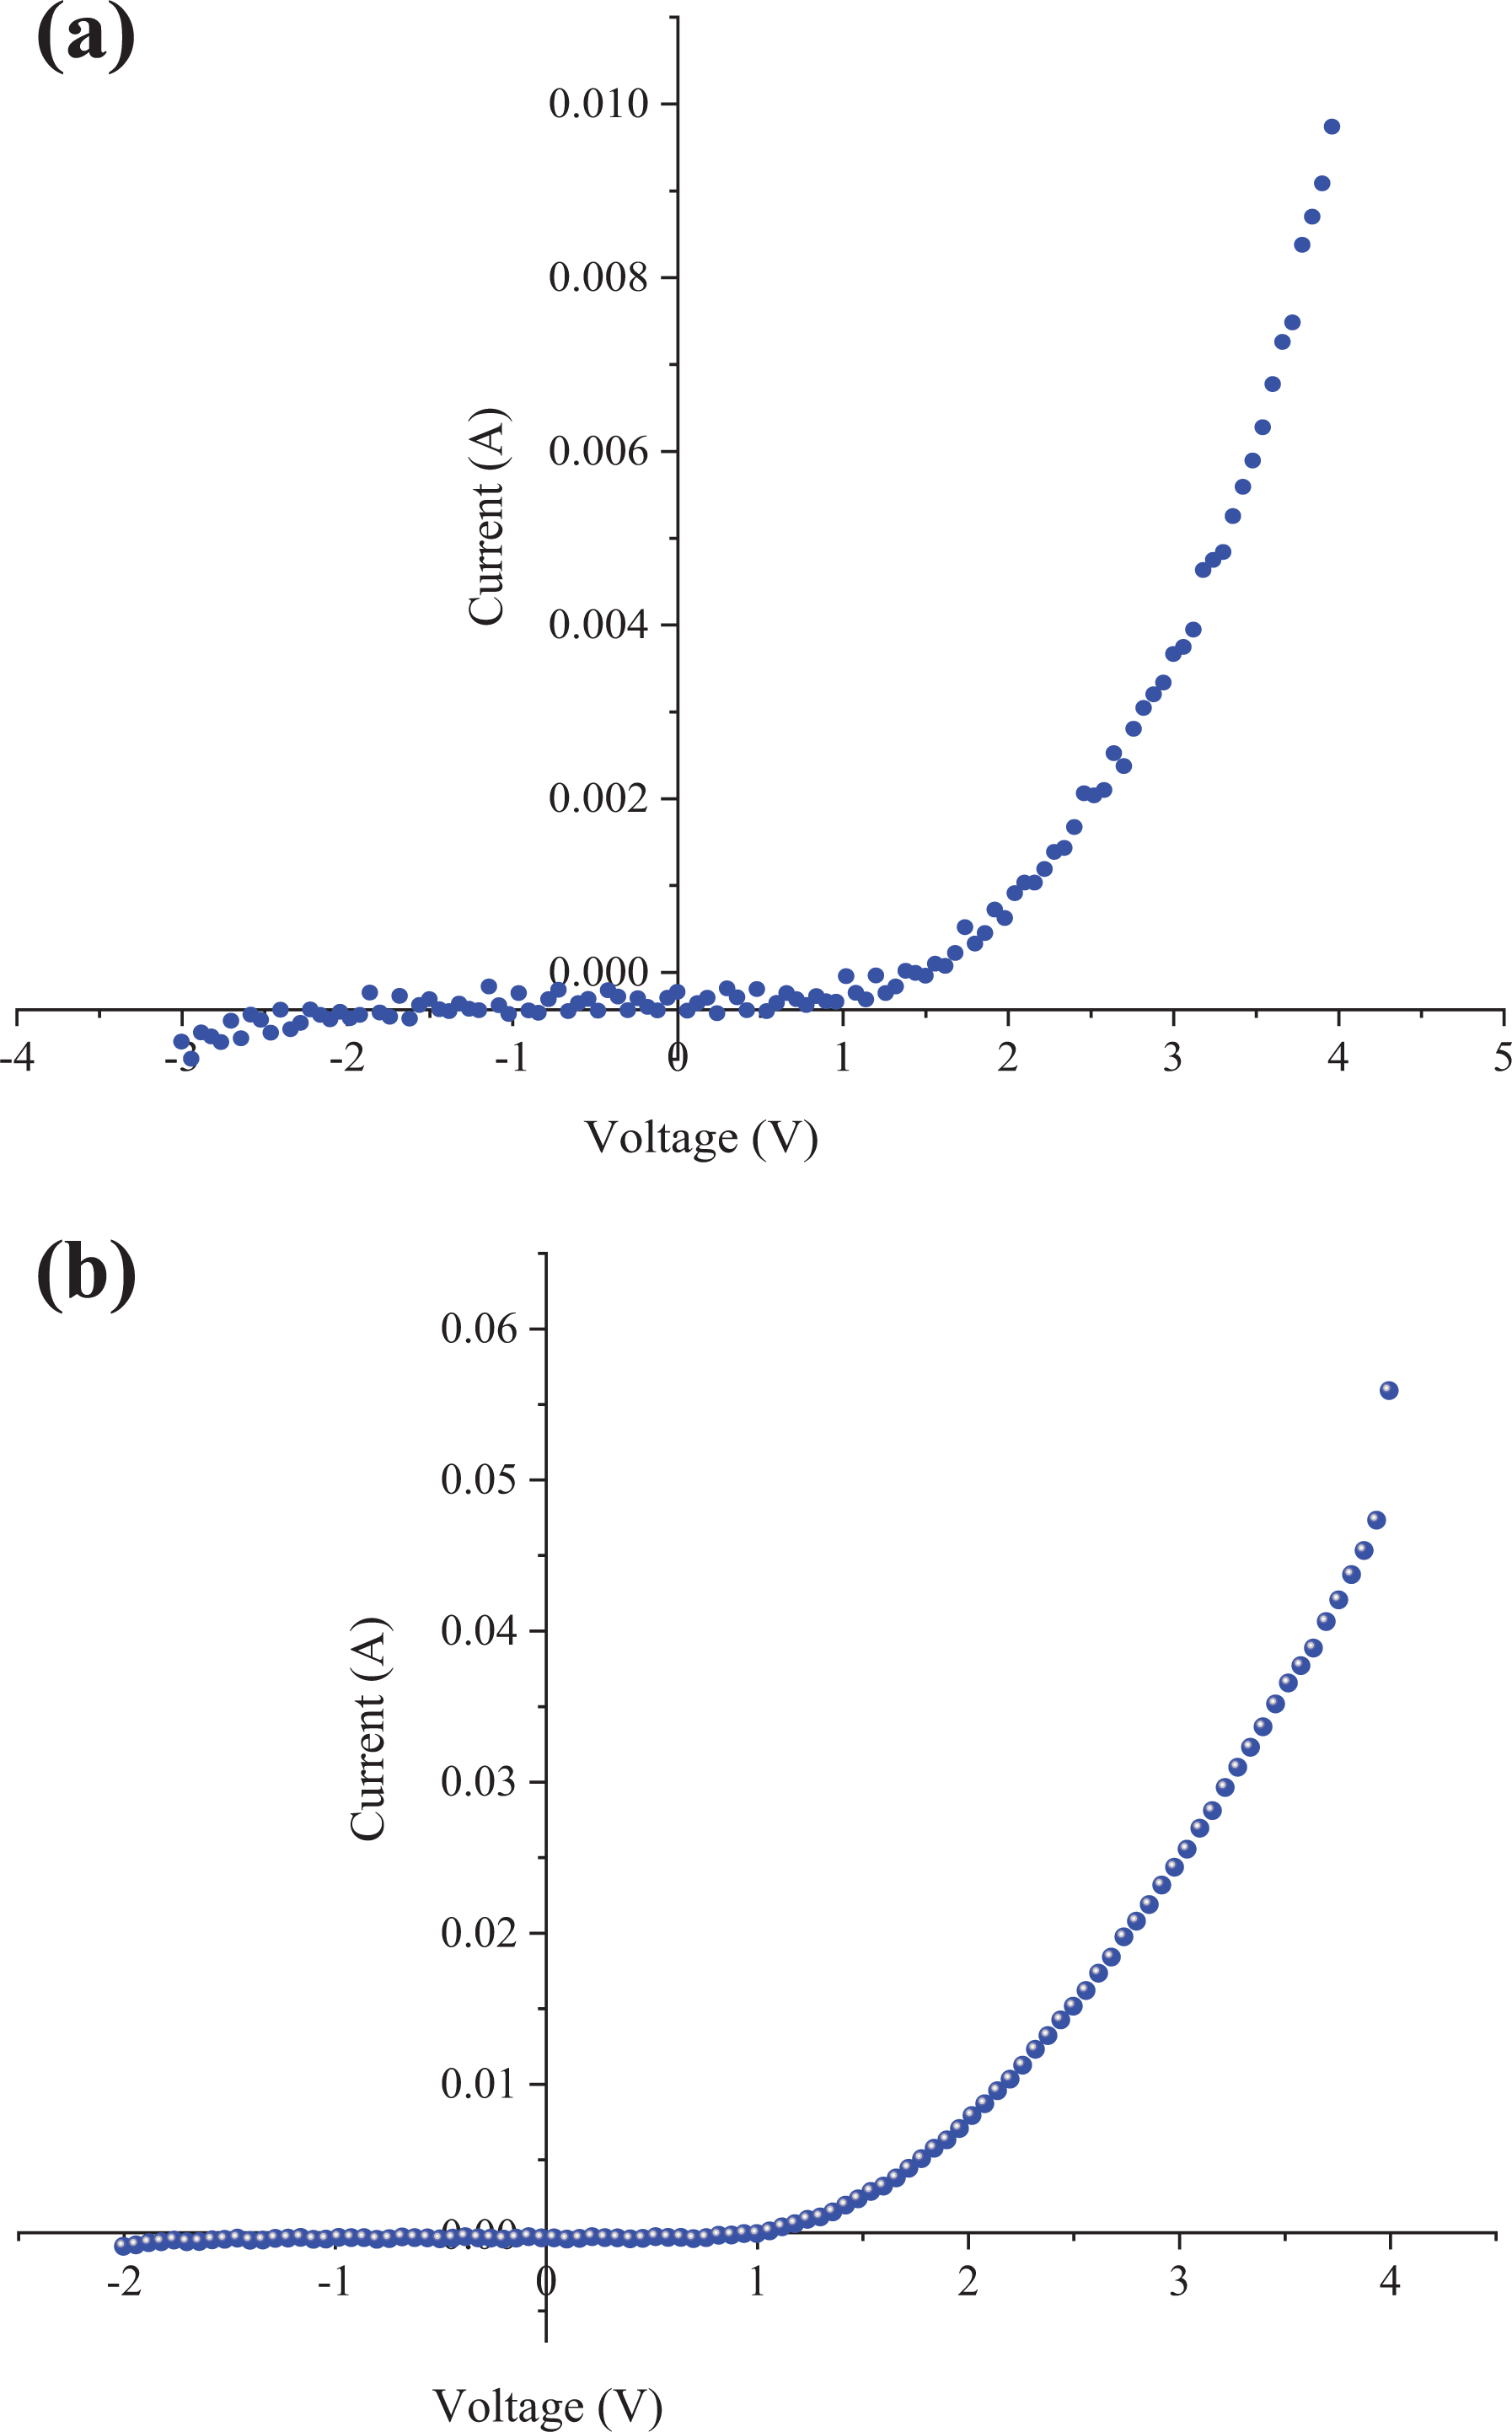
Experimental forward and reverse bias current-voltage characteristics of: (a) Al/poly(NOEMA)-8 wt% nanographene/p-Si Schottky diode; and (b) Al/poly(NOEMA)-10 wt% nanographene/p-Si Schottky diode.
The electrical properties of insulator polymers can be improved by adding suitable fillers and the electrical properties depend on the content and type of fillers. 33,34 Figures 14 and 15 show behavior of lnσ DC as a function of temperature (1/T). The composites exhibited a linear relationship between lnσ-1000/T. This relationship is explained by Arrhenius formula given as follows
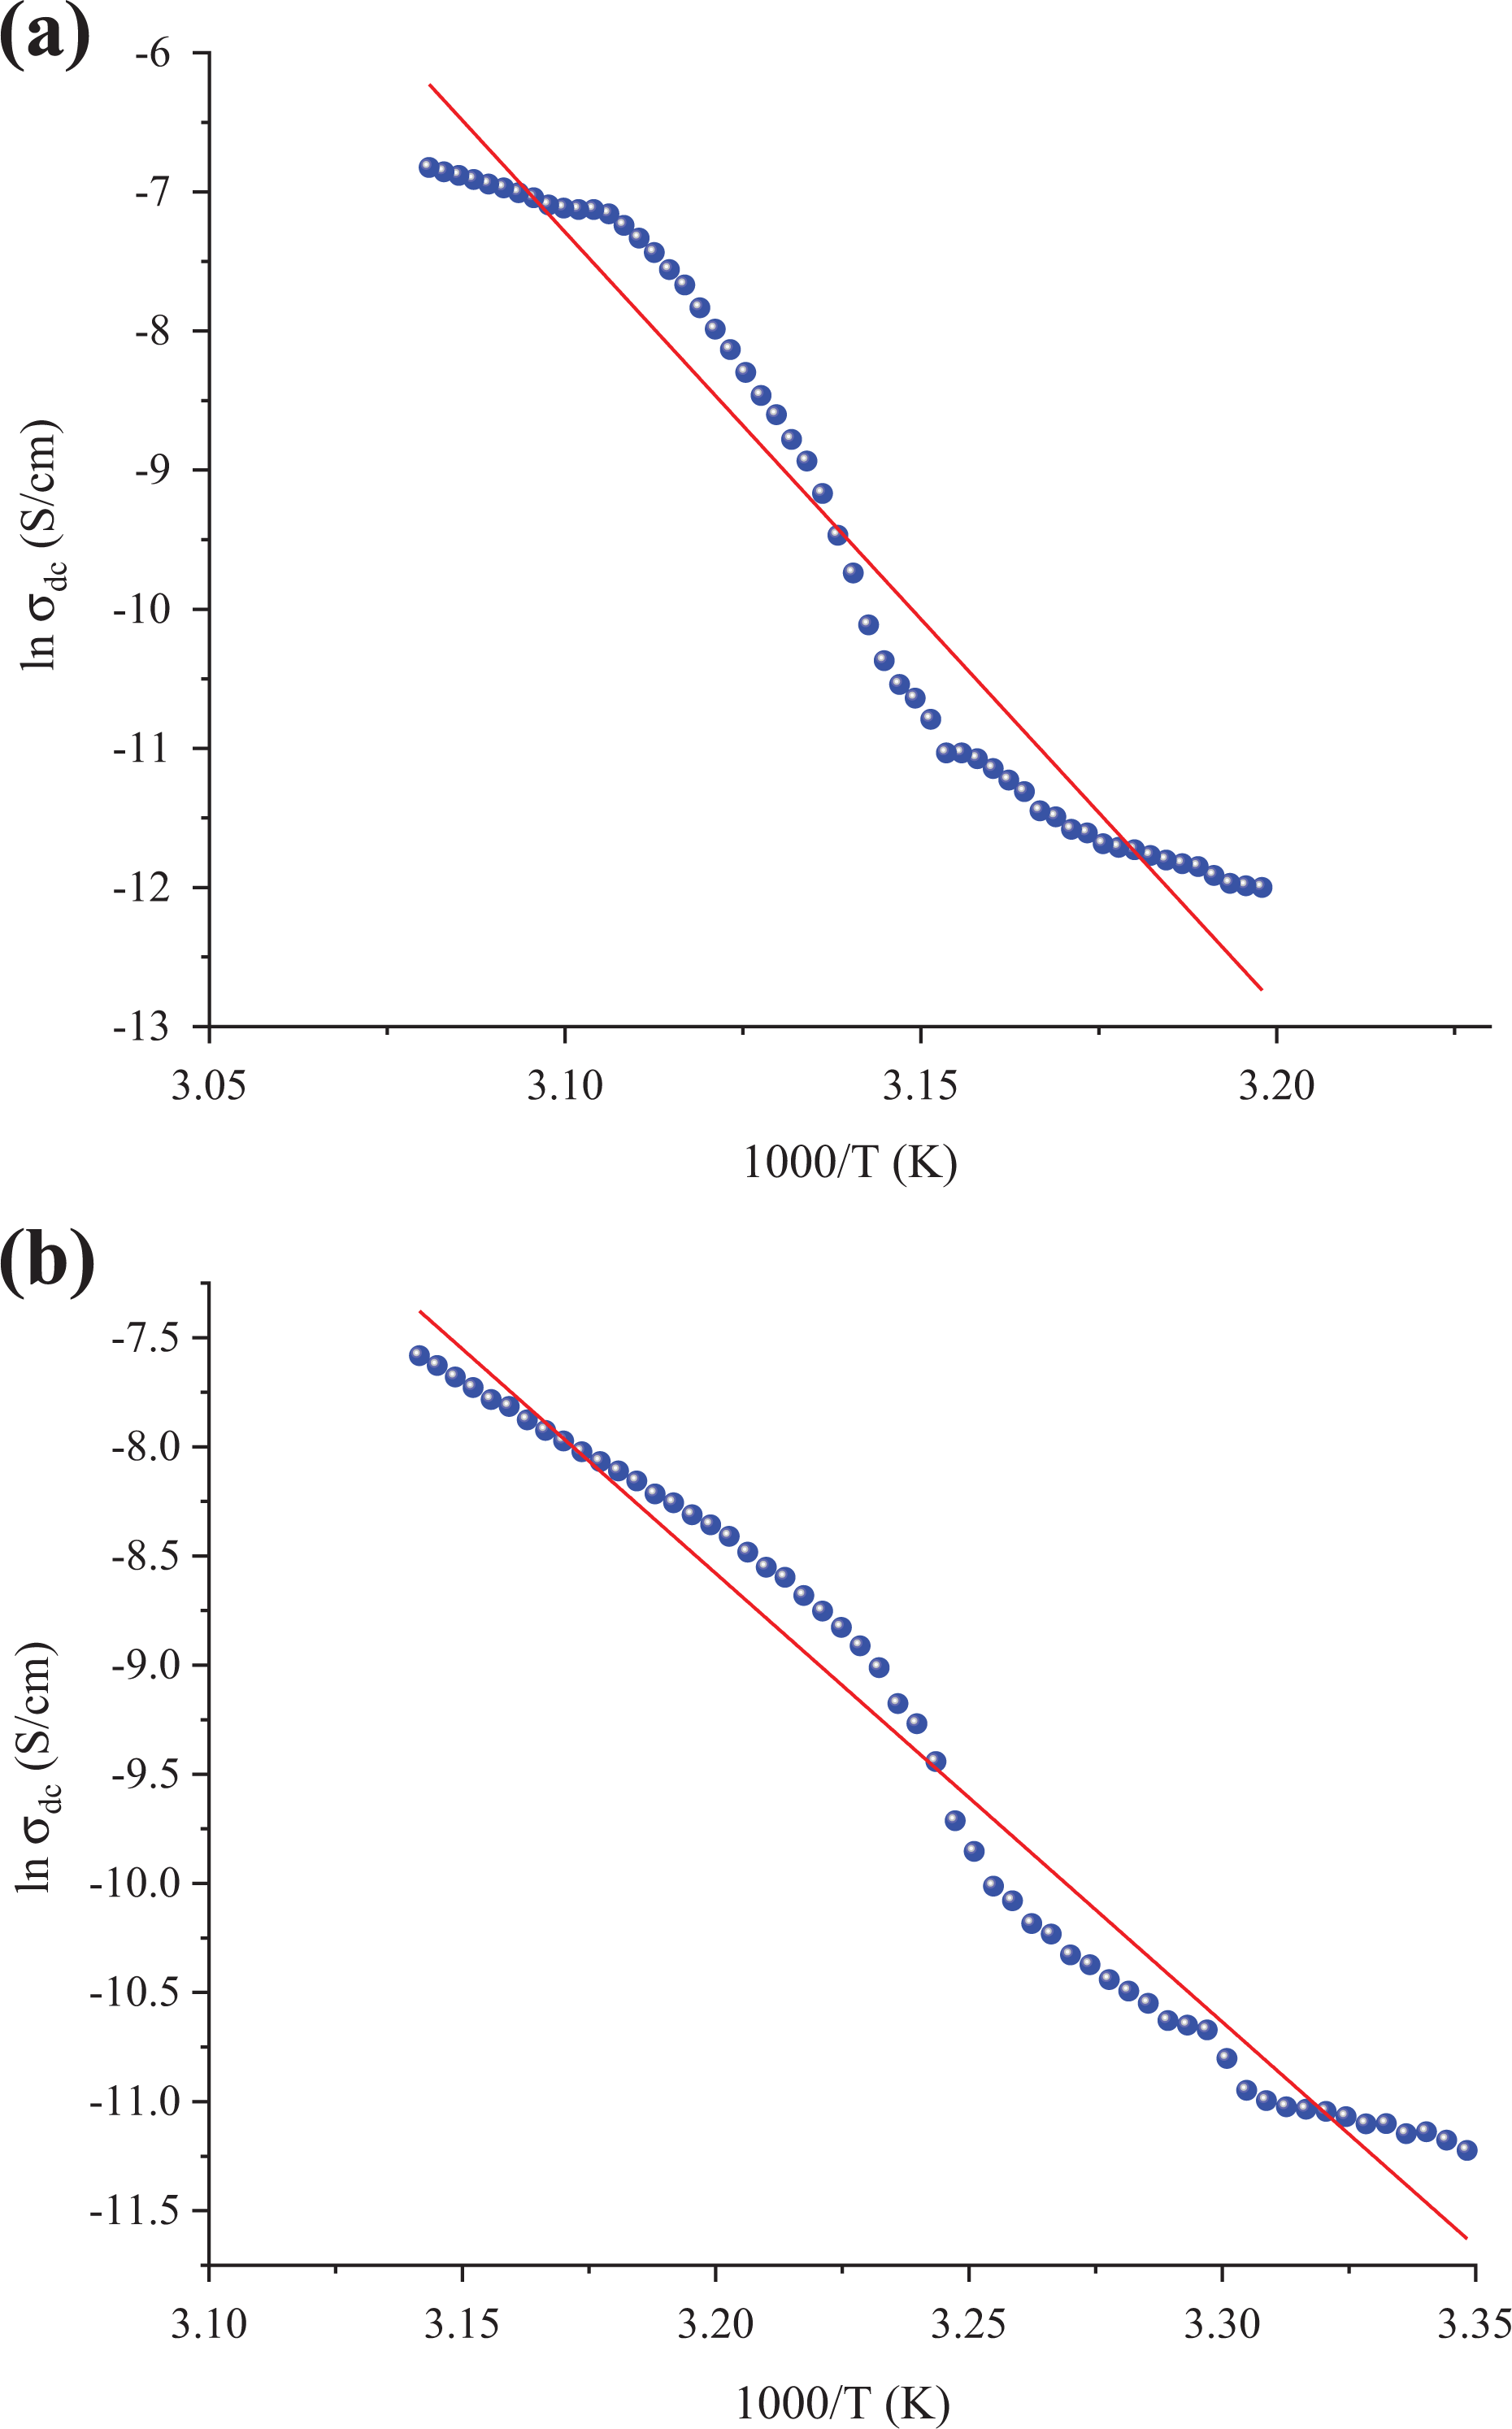
ln σ DC versus 1000/T of relative complex permittivity versus frequency for the poly(NOEMA)/(a) 2 and (b) 4 wt% nanographene.
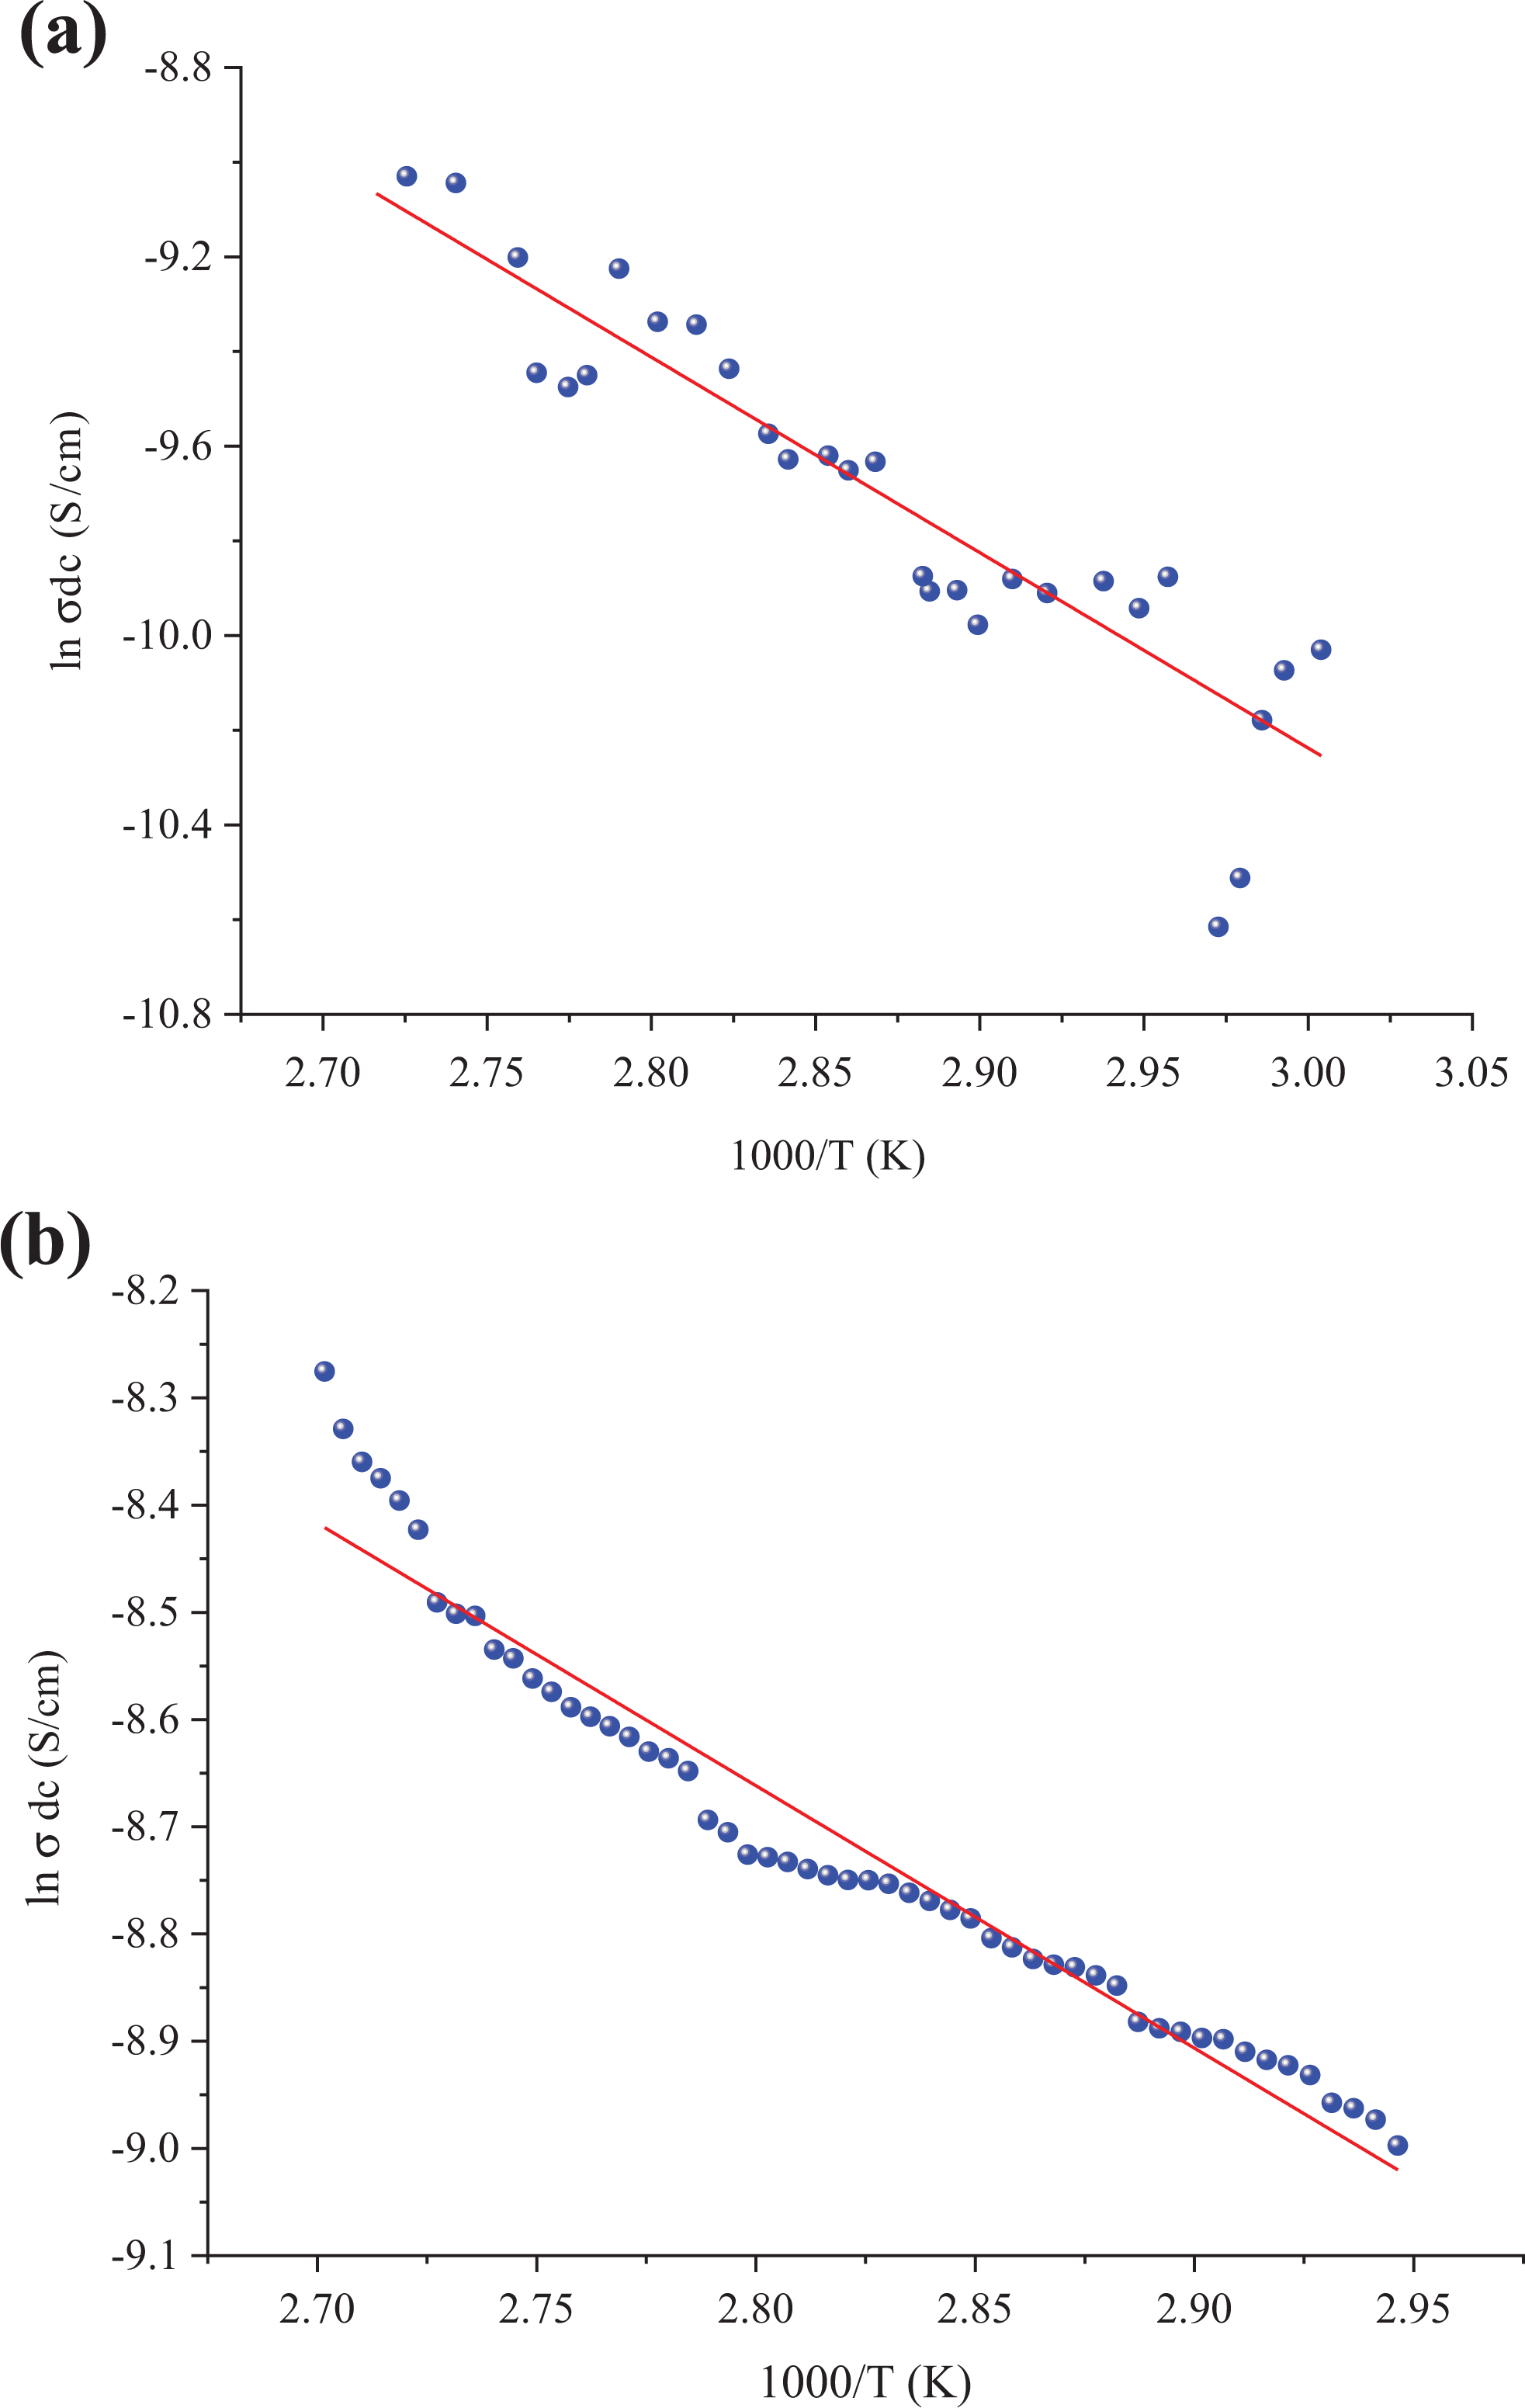
ln σ DC versus 1000/T of relative complex permittivity versus frequency for the poly(NOEMA)/(a) 8 and (b) 10 wt% nanographene.

where E a is the activation energy, σ o is the pre-exponential factor, k B is the Boltzmann constant, and T is the temperature. The activation energy values were 4.783, 1.767, 0.360, and 0.209 eV for 2, 4, 8, and 10 wt%, respectively. The higher values of σ DC for composite systems are due to the increase of number of conducting paths and more free electrons available for conducting process when the nanographene is added at high concentration to the polymer matrix. As the concentration in the poly(NOEMA)/x wt% nanographene composite systems increases, the number of the agglomerates increases as well. Two mechanisms to account for movement of electricity across gaps are known as hopping and tunneling. The hopping and tunneling mechanisms cause a certain energy of activation that governs electrons to hop across a gap between conductive surfaces for each unit transport of charge. 35,36 The CBH model was estimated as s = 0.13 for poly(NOEMA)/10 wt% nanographene. Because pure poly(NOEMA) is not a good conductor, as a result of doping with nanographene of poly(NOEMA) is expected that are gaps in the networks of conductive nanographene within amorphous poly(NOEMA)-based conductive composite. The presence of small gaps in conductive path of poly(NOEMA)-based conductive composite increases the likelihood that a given electron will acquire sufficient potential energy to surpass the energy barrier. So, the conductivity of composite with filler concentration which is less than 2 wt% is 2 × 10⁻⁹ S cm−1, and it is almost the same as that of pure poly(NOEMA). This behavior may be due to the fact that the agglomerates have no contact with each other. Hence, this behavior means that electron transfer cannot occur.
Conclusion
The homopolymer of NOEMA was prepared by radical polymerization at 60°C. The T g of pure poly(NOEMA) was estimated as 102°C from DSC measurements, whereas that of poly(NOEMA) containing 10 wt% nanographene is 83°C. While initial decomposition of pure poly(NOEMA) was estimated as 290°C from TGA measurements, those of composites decreased from 278°C to 261°C. That is, as nanographene filler concentration in composites increased, temperature of thermal composition decreased. The dielectric constant and dielectric loss factor of pure poly(NOEMA) were measured as 3.66 and 0.052, respectively, whereas those of composites changed from 5.42 to 186 and 0.077 to 210152, respectively. It was found that the frequency dependencies of AC conductivity support the CBH model. The dielectric constant, the dielectric loss, and the loss tangent (tanδ) decreased as frequency increased, whereas those of the AC and DC conductivity increased. The high dielectric constant of composites may have potential application in energy storage. The poly(NOEMA)/nanographene composites are optimum composites with superior behaviors in comparison to the pure poly(NOEMA). The ideality factor (n) value of the Al/poly(NOEMA)/x wt% nanographene/p-Si/Al diode for dark was found to be between 5.147 and 7.504, respectively. The heterojunction diode showed diode characteristics with the highest reverse saturation current and ideality factor, which are 7.50 × 10⁻⁶A at 3 V and 5.2. It has been observed that the RR was between 4.95 and 54.05 at −2/+3 V at dark condition. The activation energy from the slope of graph plotted for lnσ DC as a function of temperature (1000 × 1/T) was estimated as 4.783, 1.767, 0.360, and 0.209 eV for 2, 4, 8, and 10 wt%, respectively. The nanographene concentration in composite systems depending on electrical behaviors revealed that poly(NOEMA)/nanographene composite materials can be used as a heterojunction diode.