
Abstract
Naturally available waste biomass rice husk (RH) was modified and used to prepare nanocomposites with polyvinyl chloride (PVC) and montmorillonite clay (MMT) in a green pathway of melt blending. Three different percentages of MMT were introduced into the RH/PVC composites and their effects on various properties of composite were examined. The interaction between PVC, RH, polyethylene-grafted maleic anhydride, and MMT clay in the nanocomposite (RHPNC) was studied by Fourier transform infrared spectroscopy and thermal properties were studied using dynamic mechanical analysis and thermogravimetric analysis. Universal testing machine and limiting oxygen index flammability tester were used to study the mechanical and flame retardency properties, respectively. The delamination of MMT layers and surface morphology of clay-incorporated nanocomposites were analyzed by X-ray diffractometry, scanning electron microscopy, and transmission electron microscopy. Surface of 5 phr (parts per hundred) MMT-loaded composites appeared smoother than those of composites containing 2 or 5 phr MMT. RHPNC with 5 phr MMT showed an overall improvement in mechanical, thermal, and flame-retardant properties. Composites containing 5 phr MMT showed a decrease in water uptake capacity compared to either 2 phr or 10 phr MMT-loaded composites.
Introduction
In recent years, utilization of waste biomass as one of the components in composite has got immense interest. Composite materials comprising waste lignocellulosic fibers have fascinated many researchers and technologists such as types of composites are economic and possess good biodegradability and recyclability. 1 –3 The most attractive part of these polymer composites is that the ingredients used are obtained easily from natural wastes, and so these composites can be easily molded along with a suitable thermoplastic polymer. These forms of composite may be used to solve environmental problems. The use of lignocellulosic materials in the polymer matrix instead of inorganic substances and synthetic fibers offers outstanding protection to the environment. The advantages of lignocellulosic materials is that the final product has less weight and low cost. It also decreases the chances of toxic by-products. The use of natural fillers along with thermoplastics is gaining popularity because of their low density, nonabrasiveness, and availability with low cost along with ease of surface modification. 4
Rice is one of the major crops in the world covering around 1% of the earth surface. 5 Rice husk (RH) is a by-product which comes out from the rice grain during rice milling process. Rice milling industry is one of the major industries in China, India, Bangladesh, Nepal, and Malaysia. 6 According to reports, each ton of rice produce 0.23 tons of RH. 7 RH does not have any commercial use and is used mainly for fuel purposes. It can be made value added by forming composites with thermoplastic polymers. 8 Wood fiber as a filler in the polymer matrix has been studied extensively. 9,10 The use of RH for making composites with various thermoplastics has been reported in the literature. 11,12 A critical point in this type of composite is the interfacial phase separation between the RH and the polymer matrix which decreases the interaction between them. Modification of the RH surface is one of the methods to improve the interaction between the two surfaces. 13 Besides this, the interaction can be improved by using a suitable compatibilizer. 14 The use of various compatibilizers such as polyethylene-grafted maleic anhydride (PE-g-MA) and polyethylene-co-glycidyl methacrylate (PE-co-GMA) to improve the adhesion between cellulosic material and polymers are cited in the literature. 15 –17
Polyvinyl chloride (PVC) is the second most used polymer after polyethylene. PVC is a tough and durable material which is widely used in industries all over the world for making varieties of products. But due to thermal stability and brittleness, PVC composites exhibit some limitations in different applications. To overcome this shortcoming, different researchers have developed different techniques. 18,19 Incorporation of nanofiller improves such behavior to a great extent. 20 In this study, PE-g-MA acts as a compatibilizer to enhance the interaction between PVC, cellulose, and other components in the composite.
Nowadays, there is an increasing trend for incorporation of nanoclay into the polymer composite. Effect of silicate nanoclays as in situ reinforcement to the polymer matrix has been widely studied. 21 Introduction of nanoclay into the polymeric composite increases the thermal stability along with other properties. 22 There is little information in the literature regarding the use of RH in PVC for making composite. With this information, we have studied the effect of incorporation of montmorillonite clay (MMT) on PVC-RH composite.
The objective of this present study is to prepare the nanocomposite using RH, PE-g-MA, nanoclay, and PVC by melt blending and to study the effect of nanoclay on various properties of the composites.
Experimental
Materials and method
PVC (grade: suspension grade PVC FS: 6701, K value 67+1) was supplied by Finolex Industries Ltd (Pune, Maharashtra, India). Dibutyl phthalate (DBP) and basic lead carbonate (LC) were obtained from G.S. Chemical Testing Lab & Allied Industries (Mumbai, Maharashtra, India). The compatibilizer PE-g-MA (Sigma-Aldrich, St. louis, USA, melting point 105°C, viscosity 1700–4500 cP at 140°C, saponification value 32–36 mg g−1 of potassium hydroxide), MMT K10 (Sigma-Aldrich, St. louis, USA), laboratory soap solution (Labolene; Fisher Scientific, Pune, India) methanol, benzene, and sodium hydroxide (NaOH; Merck India Pvt. Ltd (Bangaluru, India)) were used as received. RH was collected from local rice mill industries of Assam. Other reagents used were of analytical grade.
Surface modification of RH
RH was treated with 2% soap solution at 70°C for 1 h, followed by washing with distilled water and finally drying in an oven at 100°C for 12 h. The washed RH was dewaxed by treating with a mixture of alcohol and benzene (1:2) for 72 h at 50°C. It was then washed with distilled water and dried for 12 h. The washed RH was further treated with 5% (w/v) NaOH solution for 30 min at 30°C. It was then washed with distilled water for several times to leach out the absorbed alkali and finally kept immersed in distilled water overnight and were washed repeatedly to remove the presence of any trace amount of alkali. The alkali-treated RH were dried in an oven at 70°C for 12 h. Finally, the RH was grinded and passed through a 50-mesh sieve and then stored at ambient temperature in a desiccator for further use.
2.3. Preparation of RHPNC
A total of 40 phr (parts per hundred) of the modified RH was mixed with 60 phr of PVC, 5 phr of PE-g-MA, and MMT (2–10 phr) and transferred to Brabender plasticorder for blending. Initially, the above mixture was blended by maintaining a screw speed of 50–55 r min−1, followed by the addition of lead carbonate (15 phr) and dibutyl phthalate (5 phr). PVC is heat sensitive, therefore, basic lead carbonate was added as a heat stabilizer. To make processing easier, dibutyl phthalate was added as a plasticizer in the formulations. The final blending was carried out at 145°C for 5 min at a screw speed of 70–75 r min−1. The blended mixture was then compressed in a compression molding machine (Santac, China) at 190°C for 6 min under a pressure of 5–6 ton.
Polymer and composite containing polymer (60 phr)/RH (40 phr)/PE-g-MA (5 phr)/lead carbonate (15 phr)/dibutyl phthalate (5 phr) were designated as PVC and PRGLD (PVC RH PE-g-MA lead carbonate dibutyl phthalate composite), respectively. Composite having MMT content of 0, 2, 5, and 10 phr was further designated as PRGLDM0, PRGLDM2, PRGLDM5, and PRGLDM10, respectively.
Characterizations
FTIR studies
Fourier transform infrared spectroscopy (FTIR) spectra were recorded for RH, MMT, and composites with or without MMT in an FTIR spectrophotometer (PerkinElmer, Frontier MIR-FIR, USA) using potassium bromide pellet over the wave number range of 400–4000 cm−1.
XRD studies
The degree of MMT intercalation in the composite was evaluated by X-ray diffraction (XRD) analysis. It was carried out in a D8 FOCUS X-ray diffractometer (Bruker Axs, Germany) using copper K α radiation at a scanning rate of 1° min−1 with an angle ranging from 7° to 50°.
Transmission electron microscopy
Transmission electron microscopy (TEM) investigations were carried on a JEM-2010 (JEOL, Japan) instrument equipped with a slow-scan CCD camera and at an accelerating voltage of 200 kV.
Scanning electron microscopy
The compatibility and morphological features of the composites were studied using scanning electron microscopic (SEM; JEOL JSM-6390LV) analysis at an accelerated voltage of 5–10 kV. Fracture surface of the samples, deposited on a brass holder and sputtered with platinum, was used for this study.
Dynamic mechanical analysis
Dynamic mechanical analysis (DMA) was performed under tensile mode using a Universal Q800.0 TA Instrument (New Castle, Delaware, USA). The dimensions of the specimens were 5 × 1.25 × 0.35 cm3. The specimens were scanned over a temperature range of 20−200°C. Frequency of oscillation was fixed at 1 Hz and ramped at 2°C min−1 to 200°C. Storage modulus, loss modulus (E″), and mechanical loss factor (tan δ) were recorded and plotted against temperature.
Thermal property
Thermal properties of PVC, RH, and MMT along with the polymer composite were measured using a thermogravimetric analyzer (TGA-50, Shimadzu, Japan) at a heating rate of 10°C min−1 up to 600°C under nitrogen atmosphere and by maintaining a flow rate of 30 mL min−1.
Mechanical property
The tensile and flexural tests for polymer blend and RHPNCs were carried out using a universal testing machine HOUNSEFIELD (model H100K-S; England, UK) at a crosshead speed of 2 mm min−1 at room temperature according to ASTM D-638 and D-790 standards, respectively. Five samples of each category were tested and their average values were reported.
Hardness
The hardness of the samples were measured according to ASTMD-2240 standard using a durameter (model RR12) and expressed as shore D hardness.
Water uptake test
Percentage water uptake was measured by keeping the samples in distilled water at room temperature (30°C) for different time periods after conditioning at 65% relative humidity and 30°C and expressed as

where W t is the weight of the specimen after immersion in distilled water for a specified time period and W i is the weight of the oven dried specimen.
LOI test
Limiting oxygen index (LOI) of the samples was measured by a flammability tester (S.C. Dey Co., Kolkata, West Bengal, India) according to the ASTM D-2863 method. The sample was kept vertically in the sample holder of the LOI apparatus. The burning of sample for at least 30 s at a specified ratio of nitrogen and oxygen was recorded for measurement of LOI.
4. Results and discussion
Fourier transform infrared
The FTIR spectra of RH, MMT, PVC, and the RHPNC with varied percentage of the MMT are shown in Figure 1. In the spectrum of RH in Figure 1(a), the functional group that appeared at 3431 cm−1 was attributed to hydroxyl group and the absorption peak at 2932 cm−1 was for C–H stretching. The peaks at 1645 cm−1 (–OH bending), 1160 and 1046 cm−1 (C–O stretching) also appeared. In the spectrum of PVC in Figure 1(b), C–H and CH2 stretching modes were observed at 2860 and 2977 cm−1, respectively. The absorption peak at 1428 cm−1 was assigned to the CH2 bending mode. Besides this, peaks that appeared at approximately at 1330, 1250, 950, and 830 cm−1 were due to CH2 groups deformation, out-of-plane angular deformation, out-of-plane transdeformation, and C–Cl bond stretching. 23 The strong absorption at 3430 cm−1 (–OH stretching), 1638 cm−1 (–OH bending), and 1048 cm–1 (oxide band of metals) were characteristic peaks of MMT clay (Figure 1(c)). In the spectrum of PRGLDM0, the peak intensity due to hydroxyl group was observed to reduce compared to that of RH and the peak corresponding to oxide bands of metals was absent. Further the position of hydroxyl peak was found to shift to lower wave number on addition of MMT (2–5) phr (curves in Figure 1(e) and (f)). Further addition of MMT (Figure 1(g)) increased the peak intensity corresponding to –OH stretching and shifted its position to higher wave number. This shifting of –OH stretching peak to higher wave number indicates the agglomeration of MMT. In all the cases, the characteristic peak of MMT appeared. In all the curves (curves in Figure 1 (e) to (g)), the intensity of –CH stretching that peak appeared at 2930 cm−1 was found to increase compared to –OH stretching peak that appeared at 3431 cm−1. Whereas in pure RH, the ratio of intensity of –CH stretching to –OH stretching was less. The shifting of the hydroxyl peak to lower intensity and decrease of –CH stretching peak intensity was reported. 24 All this suggested that the interaction occurred between PVC, RH, and PE-g-MA. The interactions among the different components were maximum for 5 phr MMT-loaded composite.
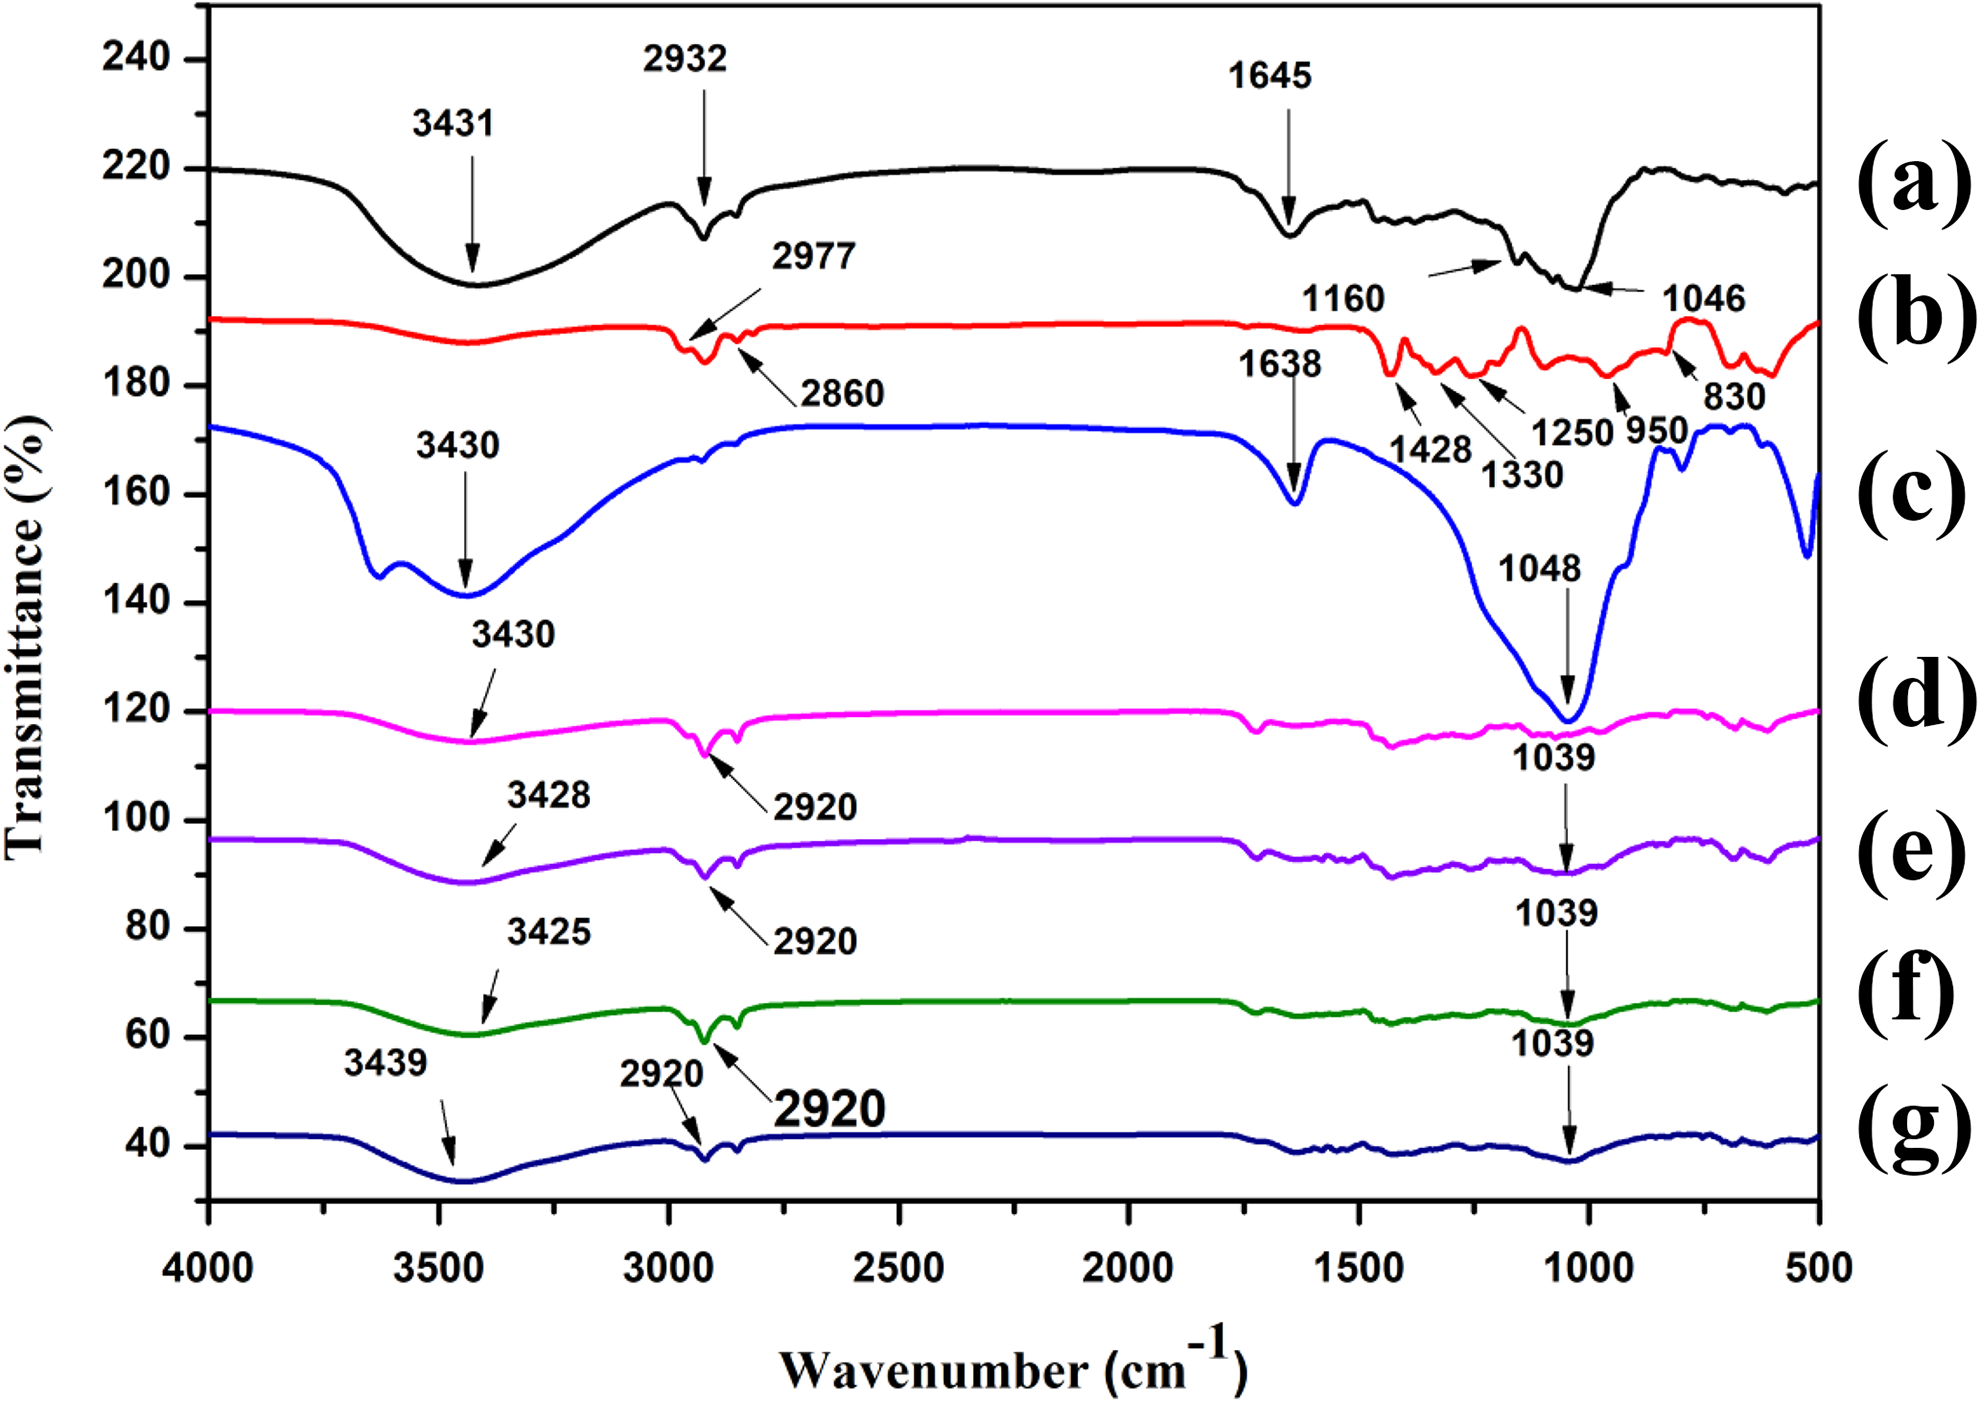
FTIR spectra of (a) RH, (b) PVC, (c) MMT, (d) PRGLDM0, (e) PRGLDM2, (f) PRGLDM5, and (g) PRGLDM10. FTIR: Fourier transform infrared spectroscopy; RH: rice husk; PVC: polyvinyl chloride; MMT: montmorillonite clay.
X-Ray diffraction
The XRD curves of RH, MMT, and RHPNC with different phr of MMT loading are shown in Figure 2. Curve Figure 2(a) represents the XRD pattern of RH. The broad shallow peak at 2θ = 22.2° was due to diffraction of (002) plane of cellulose present in the RH. MMT (curve in Figure 2(b)) shows characteristic sharp peaks at 2θ = 8.6° and 26.4° due to the silicate layers present in the clay. The nanocomposite loaded with 0, 2, 5, and 10 phr MMT was represented by the curves in Figure 2(c) to (f)). In all the curves, the characteristic peak of cellulose at 2θ = 22 was found to disappear. In Figure 2(c), the peaks that appeared at 2θ = 17.5°, 24.5°, and 31° were due to the presence of PVC. 25,26 The peaks that appeared at 2θ = 8.6° and 26.4° for MMT were absent in the diffractograms of 2, 5, and 10 phr MMT-loaded composite (curves in Figure 2(d) to (f)).The disappearance of diffraction peak might be due to the delamination of MMT layers. Therefore, it could be concluded that the crystallinity in RH decreased, and MMT nanolaminae were introduced into the amorphous region of RH/PVC composite. 27
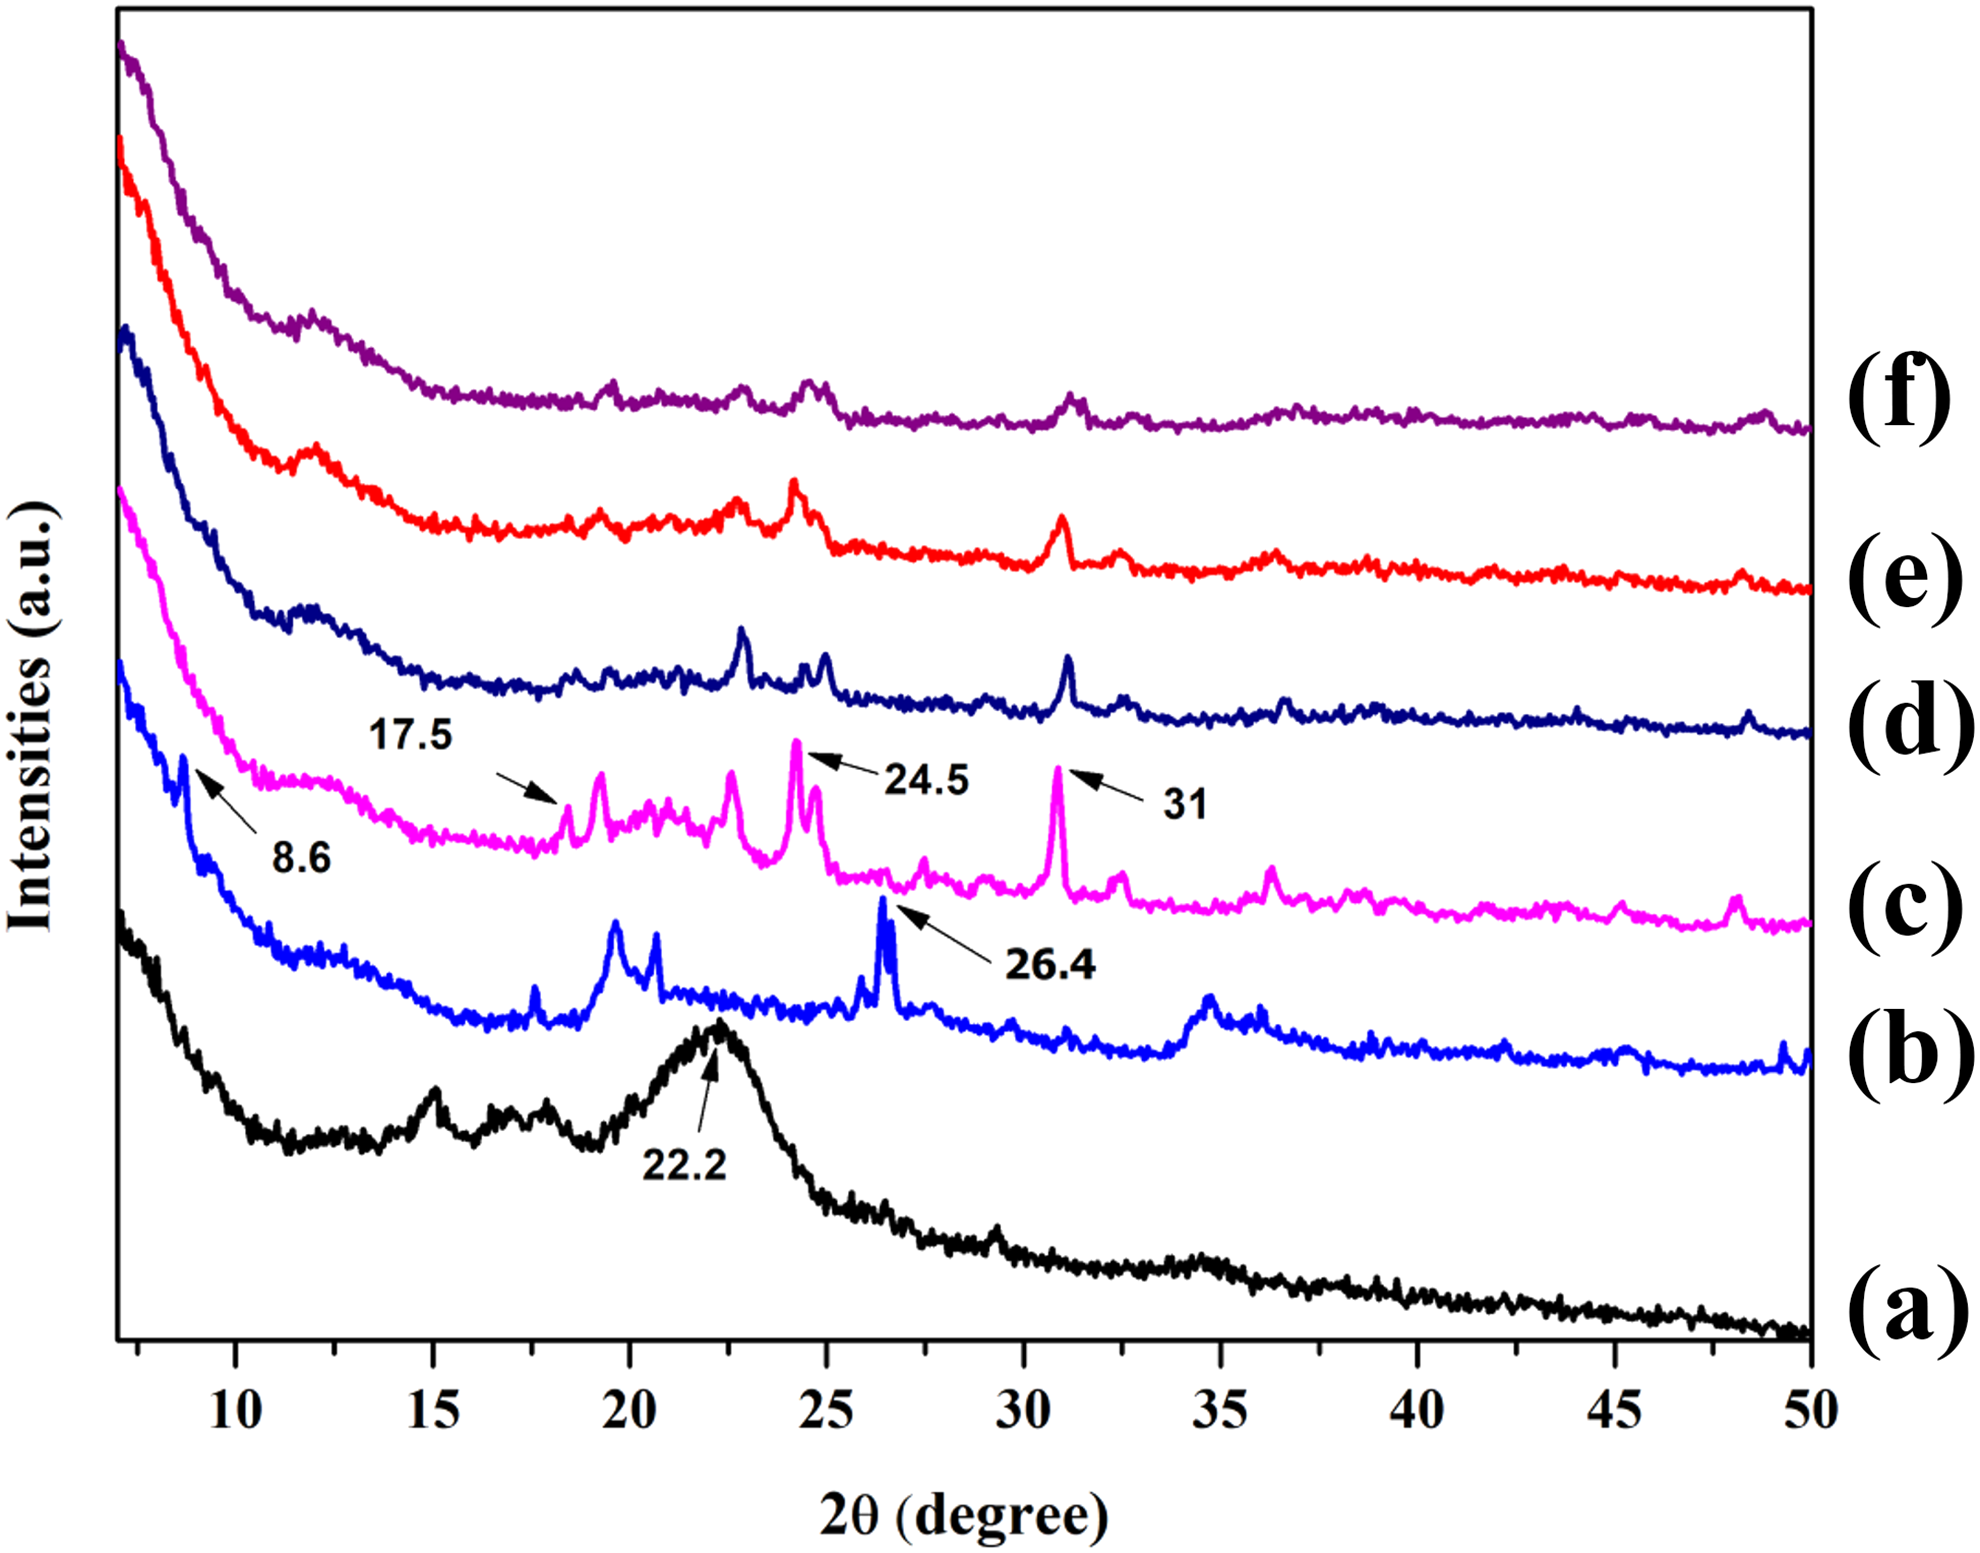
XRD plots of (a) RH, (b) MMT, (c) PRGLDM0, (d) PRGLDM2, (e) PRGLDM5, and (f) PRGLDM10. XRD: X-ray diffraction; RH: rice husk; MMT: montmorillonite clay.
Transmission electron microscopy
The morphological characteristics of the prepared RHPNC were elucidated by TEM. The TEM micrograph depicts the distribution of MMT nanolaminae in the composite as a dark slice. Figure 3(a) represents the RHPNC without MMT. The micrograph containing 5 phr MMT (Figure 3(b)) showed that clay layers had been delaminated into thin lamellae by PVC. This also indicated that clay was well dispersed into the PVC matrix. The micrographs of composites having 10 phr MMT showed that the thickness of the clay layers increased. This might be due to the agglomeration of clay at higher loading. Similar agglomeration was observed by Baishya and Maji 21 while examining the TEM micrograph of nanoclay-loaded wood/starch composite. TEM results suggested that MMT layers were delaminated and well dispersed in 5 phr MMT-loaded composites
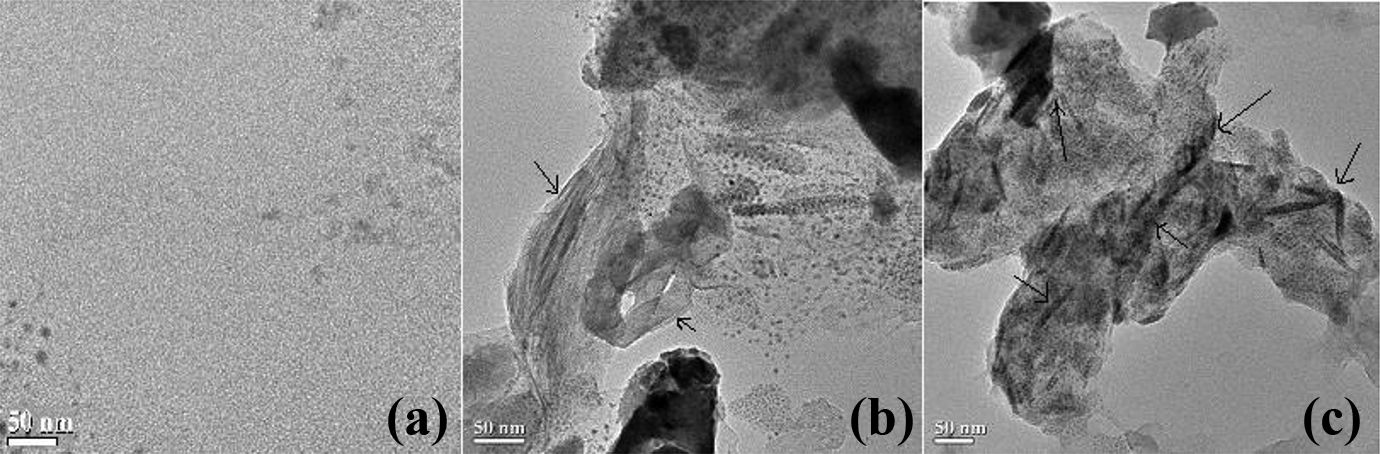
TEM micrograph of (a) PRGLDM0, (b) PRGLDM5, and (c) PRGLDM10. Transmission electron microscopy.
Scanning electron microscopy
The SEM micrograph of RHPNC with different percentage of MMT loading (0, 2, 5, and 10 phr) is shown in Figure 4. The fractured surface of the composite (Figure 4(a)) without MMT appeared rough mainly due to the presence of RH and other components. The adhesion among various components were good due to the presence of compatibilizer. PVC, RH, and other components are not properly identifiable due to better interaction among them. The micrographs of the fractured surfaces revealed that introduction of MMT to the RHPNC decreased the surface roughness (Figure 4(b) to (d)). The maximum decrease in surface roughness was shown by composite containing 5 phr MMT (Figure 4(b)). This might be attributed to the uniform dispersion of MMT in the composite. Further increase in MMT loading enhanced the surface roughness which might be due to the agglomeration of MMT into the composites as indicated also by FTIR and TEM study.
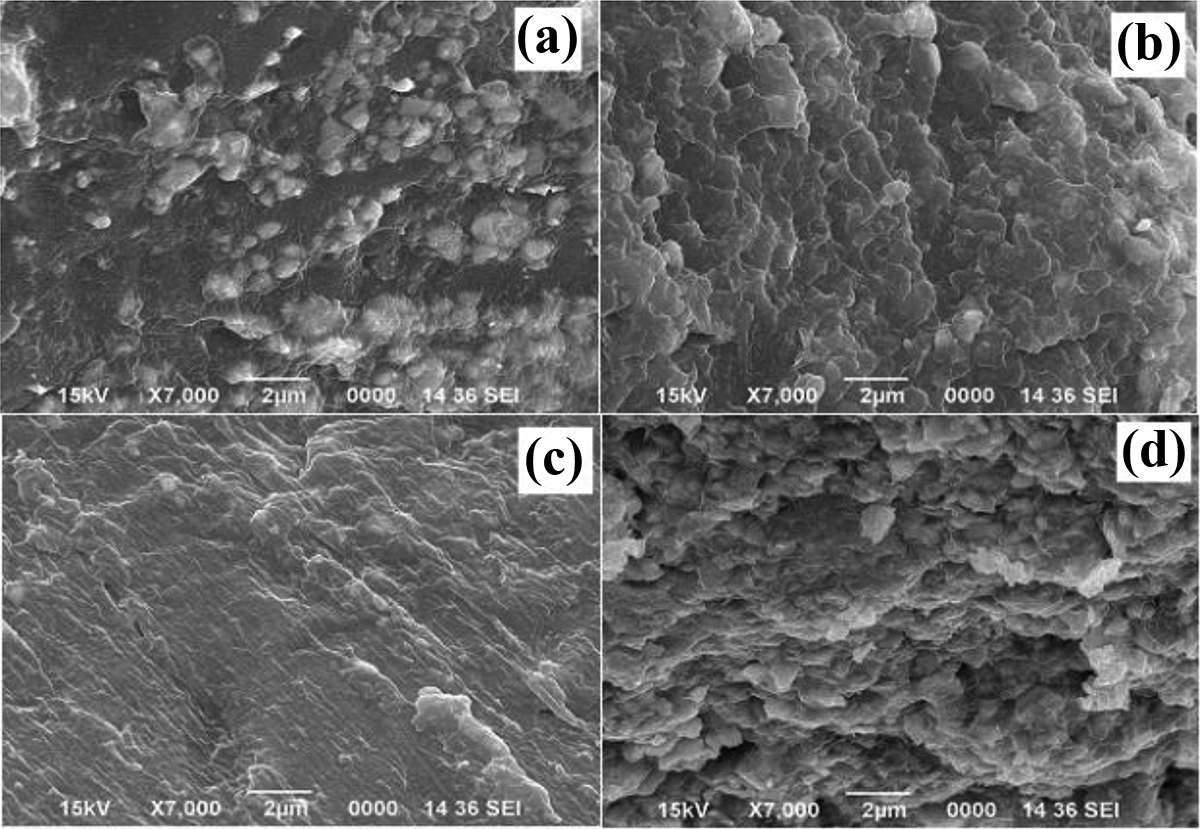
SEM micrograph of (a) PRGLDM0, (b) PRGLDM2, (c) PRGLDM5, and (d) PRGLDM10. SEM: scanning electron microscopy.
Dynamic mechanical analysis
Storage modulus
The storage modulus measures the elastic properties of the RHPNC against different temperature range. The storage modulus of RHPNC with different MMT loading is shown in Figure 5. It was observed that storage modulus of all the composites decreased with the increase in temperature. This might be due to the loss in stiffness of both RH and matrix. 28 However, storage modulus increased with the incorporation of MMT into the composite. This is an indication of the improvement in the elastic behavior of the composite. Composite having 5 phr MMT exhibited more storage modulus compared to either MMT free (PRGLDM0) or 10 phr MMT containing composites (PGRLDM10). Storage modulus was found to decrease when MMT concentration exceeds 5 phr. This indicated a decrease in the interaction between MMT, PVC, and RH.
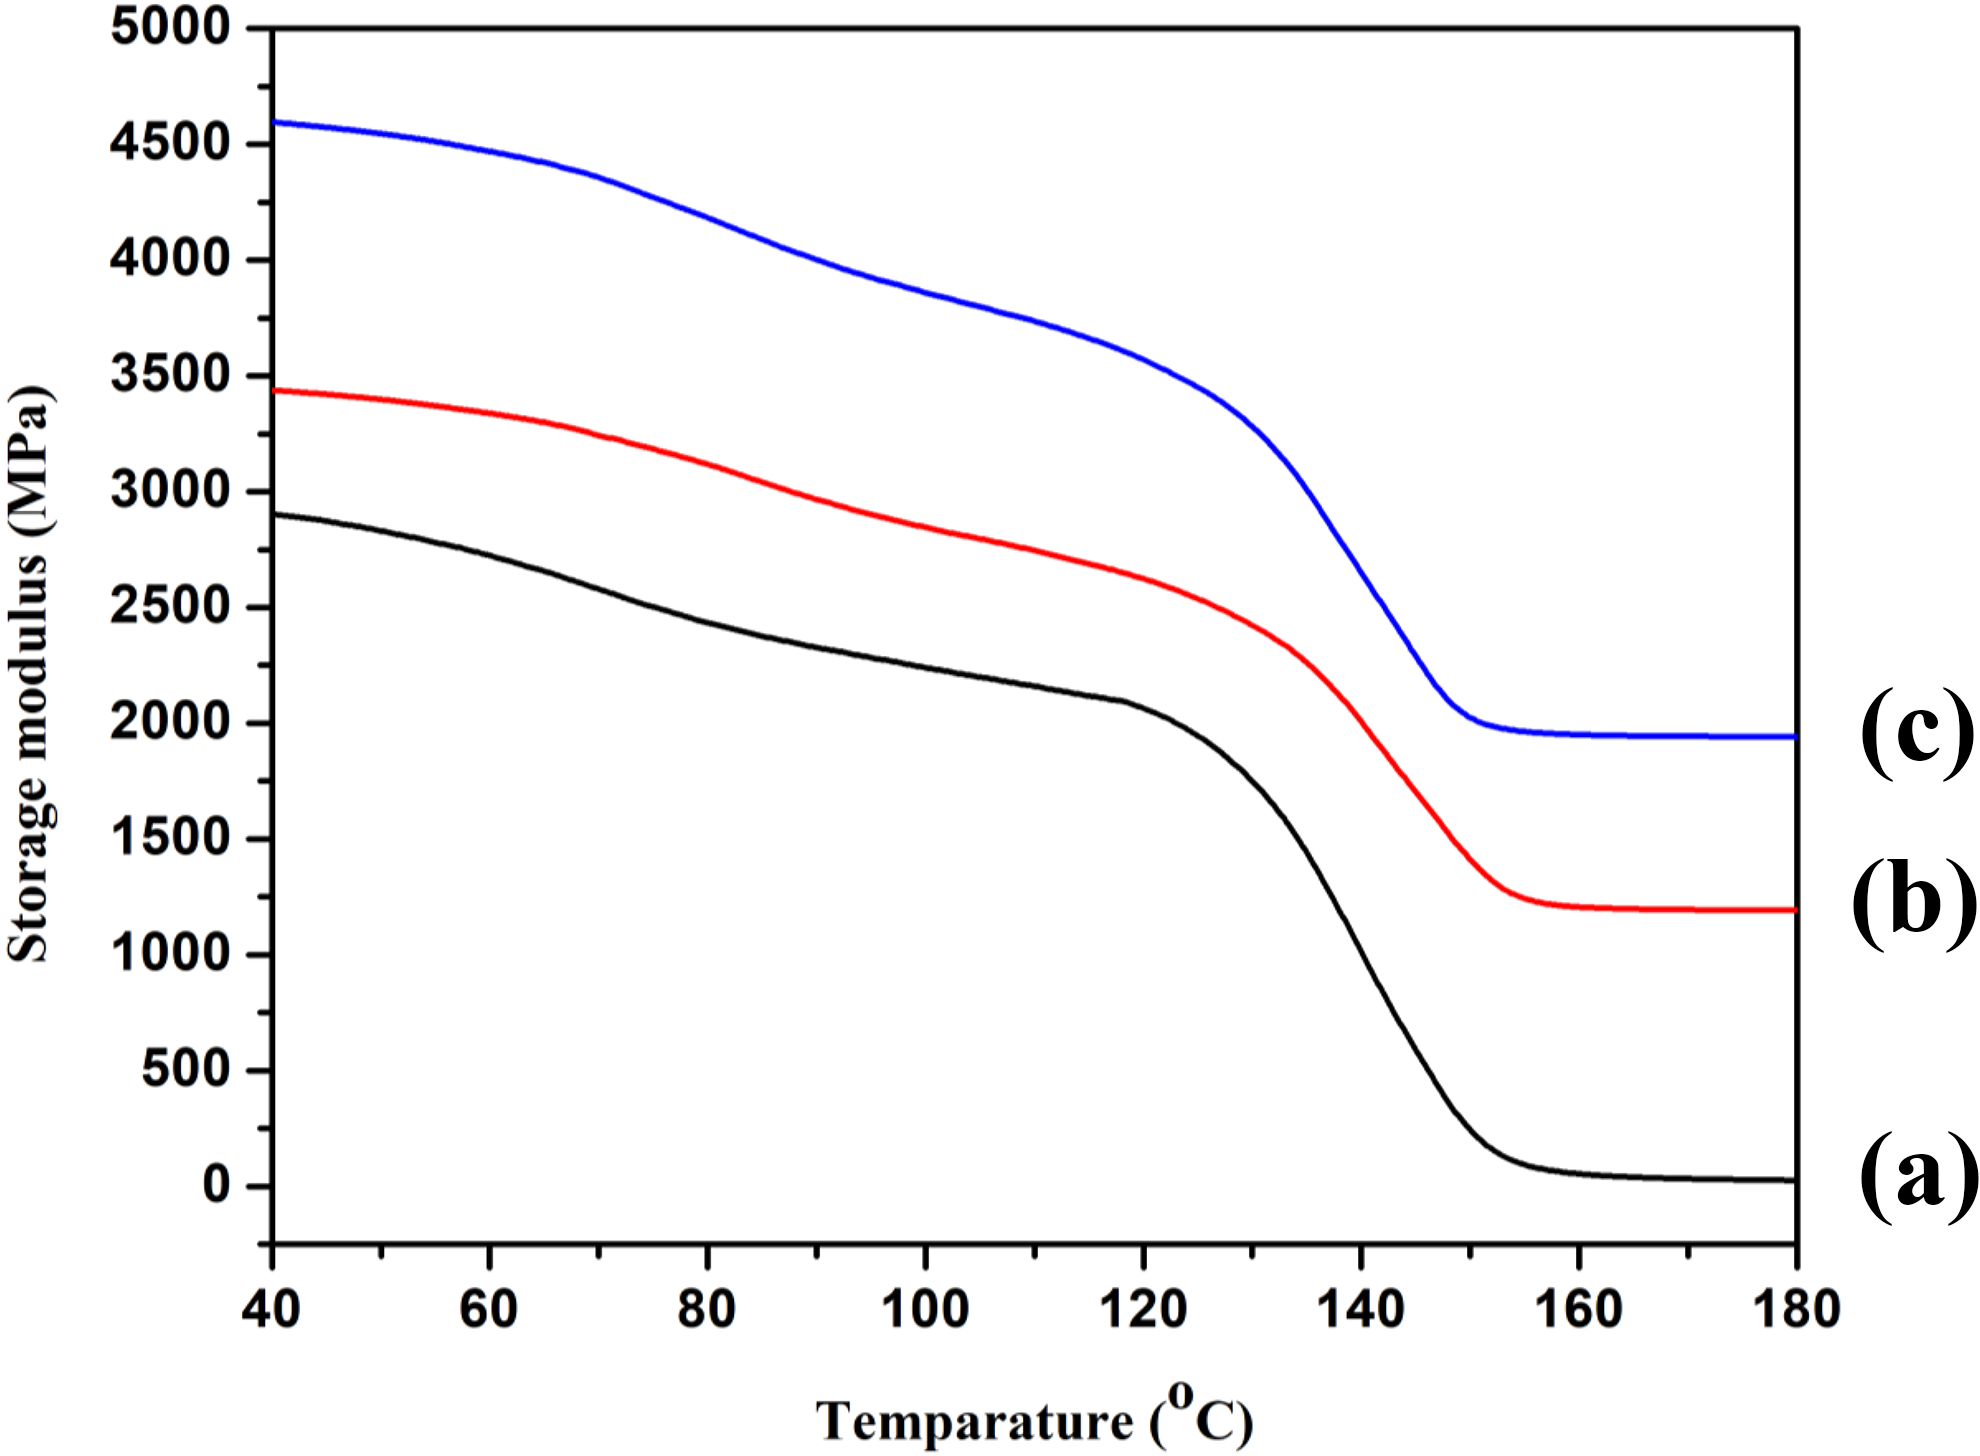
Storage modulus of (a) PRGLDM0, (b) PRGLDM10, and (c) PRGLDM5.
Loss modulus
Loss modulus (E″) indicates the viscous response of the composite material. Figure 6 represents the variations of E″ of RHNC with 0, 5, and 10 phr of MMT as a function of temperature. The E″ pattern followed the same trend as that of the storage modulus. Introduction of the MMT increased the E″ of the composites. The clay contains polar and nonpolar groups which enhanced the interfacial interaction between the reactants and improved its E″ value. 29 The E″ of the nanocomposites increased with increasing temperature, reached a maximum, and then decreased due to maximum dissipation of energy caused by the free movement of the polymeric chains. The E″ value increased with the addition of MMT upto 5 phr and then decreased on further addition of MMT. This improvement in properties of the composite containing 5 phr of MMT might be due to the increase in the interaction between PE-g-MA, PVC, and RH. The agglomeration of MMT at higher loading probably decreased the interaction and hence a decrease in both storage modulus and E″were observed.
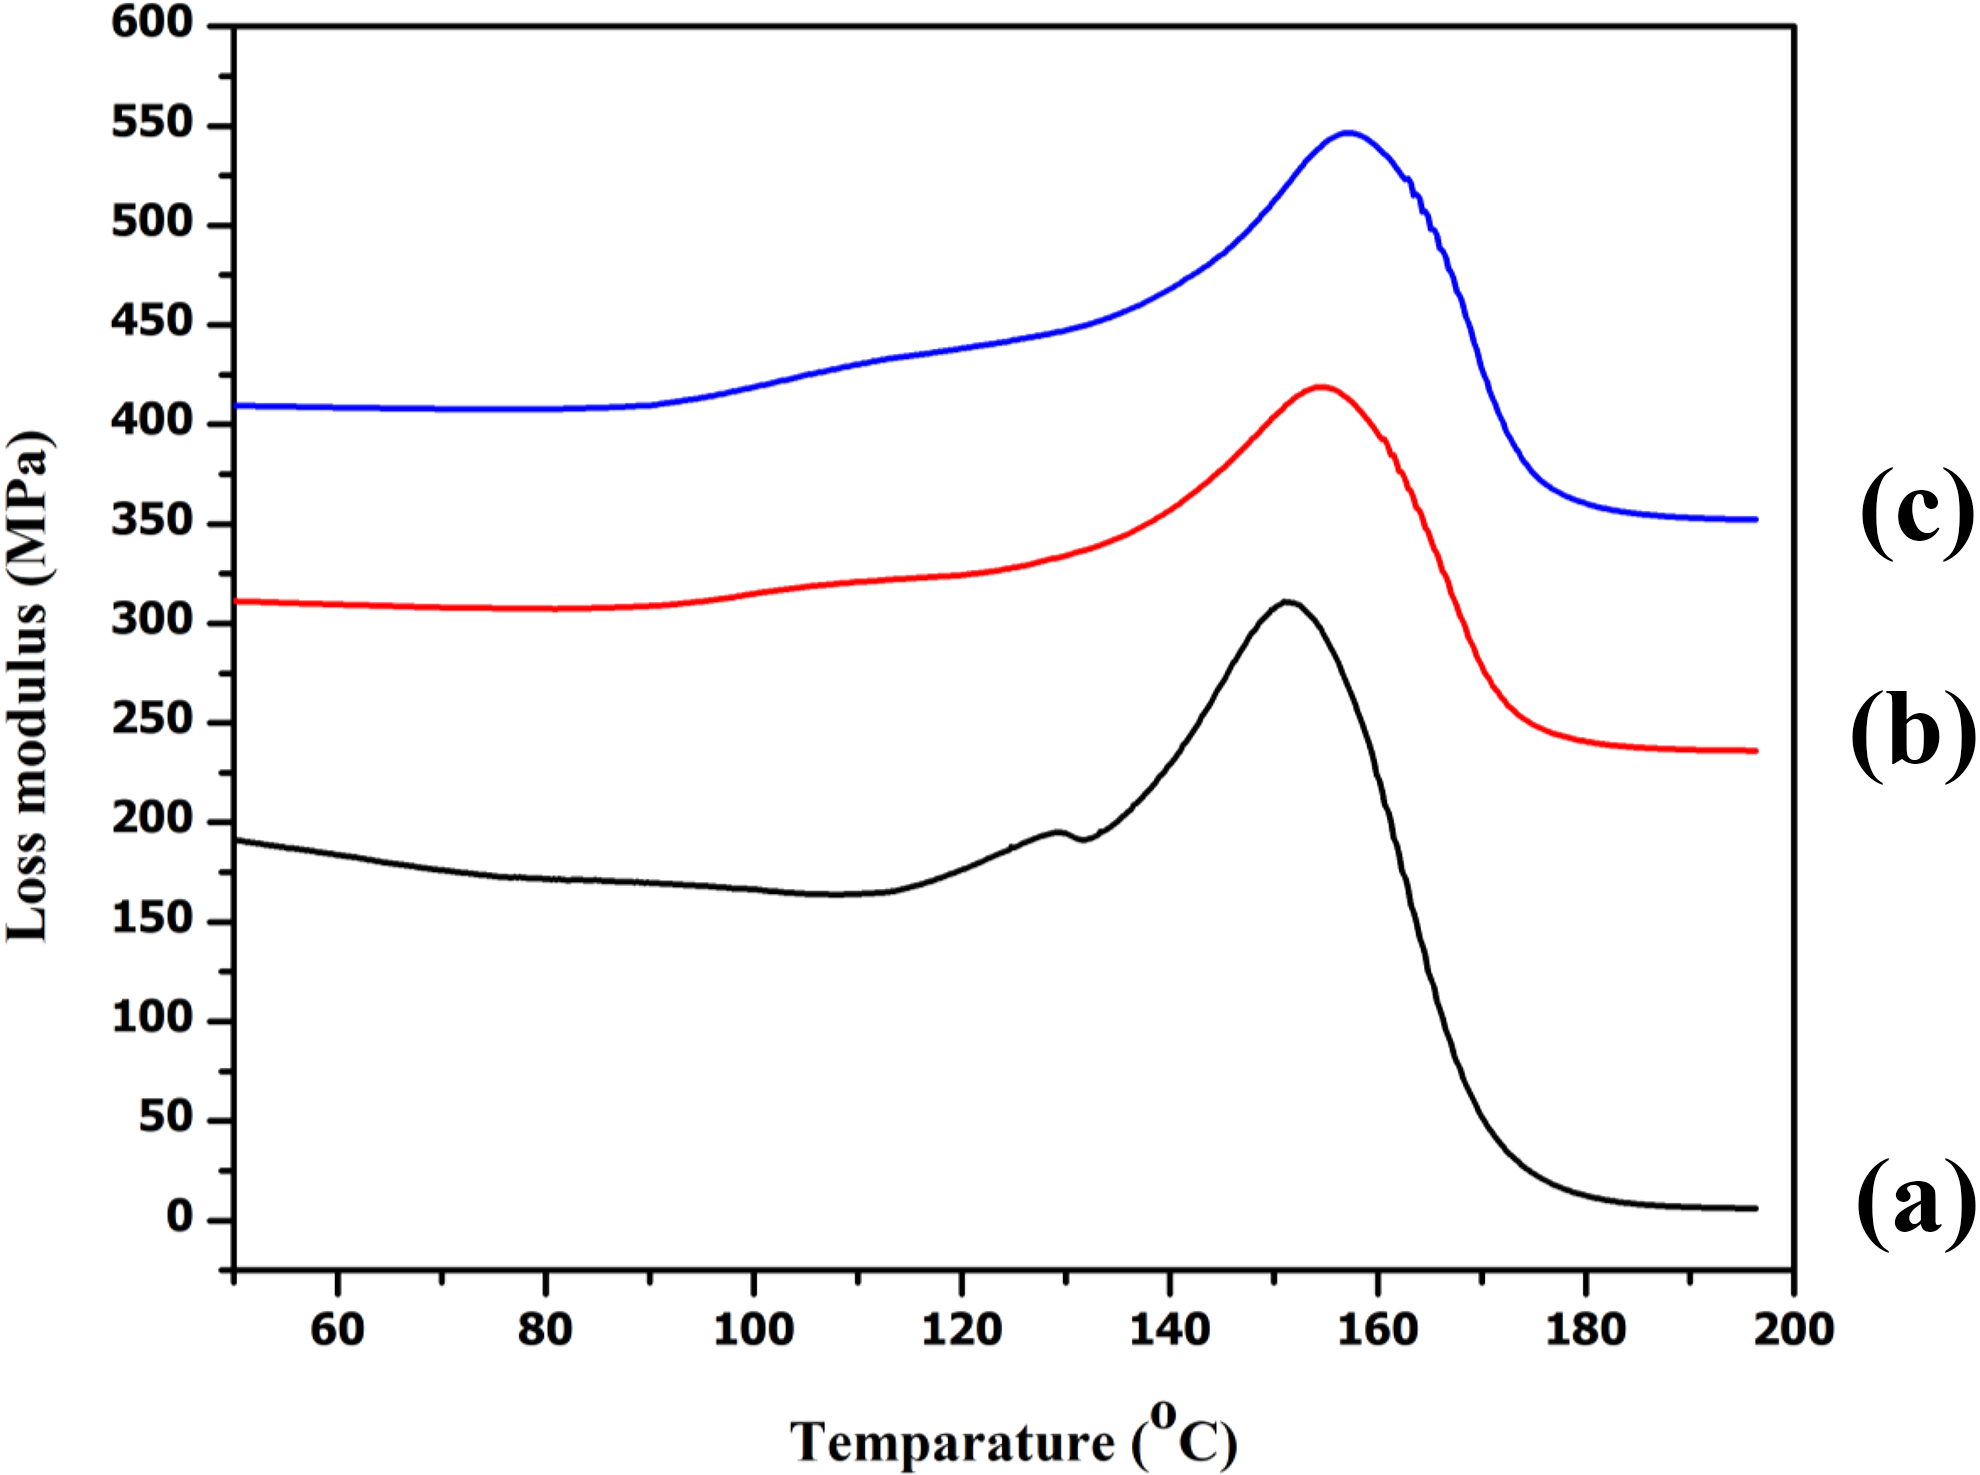
Loss modulus of (a) PRGLD, (b) PRGLDM10, and (c) PRGLDM5.
Mechanical loss factor
Dumping index or tan δ is shown in Figure 7. The position of tan δ peak was found to shift toward higher temperature with the addition of MMT into the composite. This might be due to the decrease in the mobility of the polymer chains inside the silicate layer of the clay. The hydroxyl group of clay, anhydride group of PE-g-MA, and the hydrocarbon part of PE enhanced the interaction between the reactants. A shifting and reduction in tan δ peak due to restricted movement of the polymer chains in the composite was reported in the literature. 30 However, at higher MMT addition (Figure 7(c)), the position of tan δ peak shift occurred at lower temperature. At higher clay loading, the agglomeration of clay might occurred which decreased the interaction among the reactants.
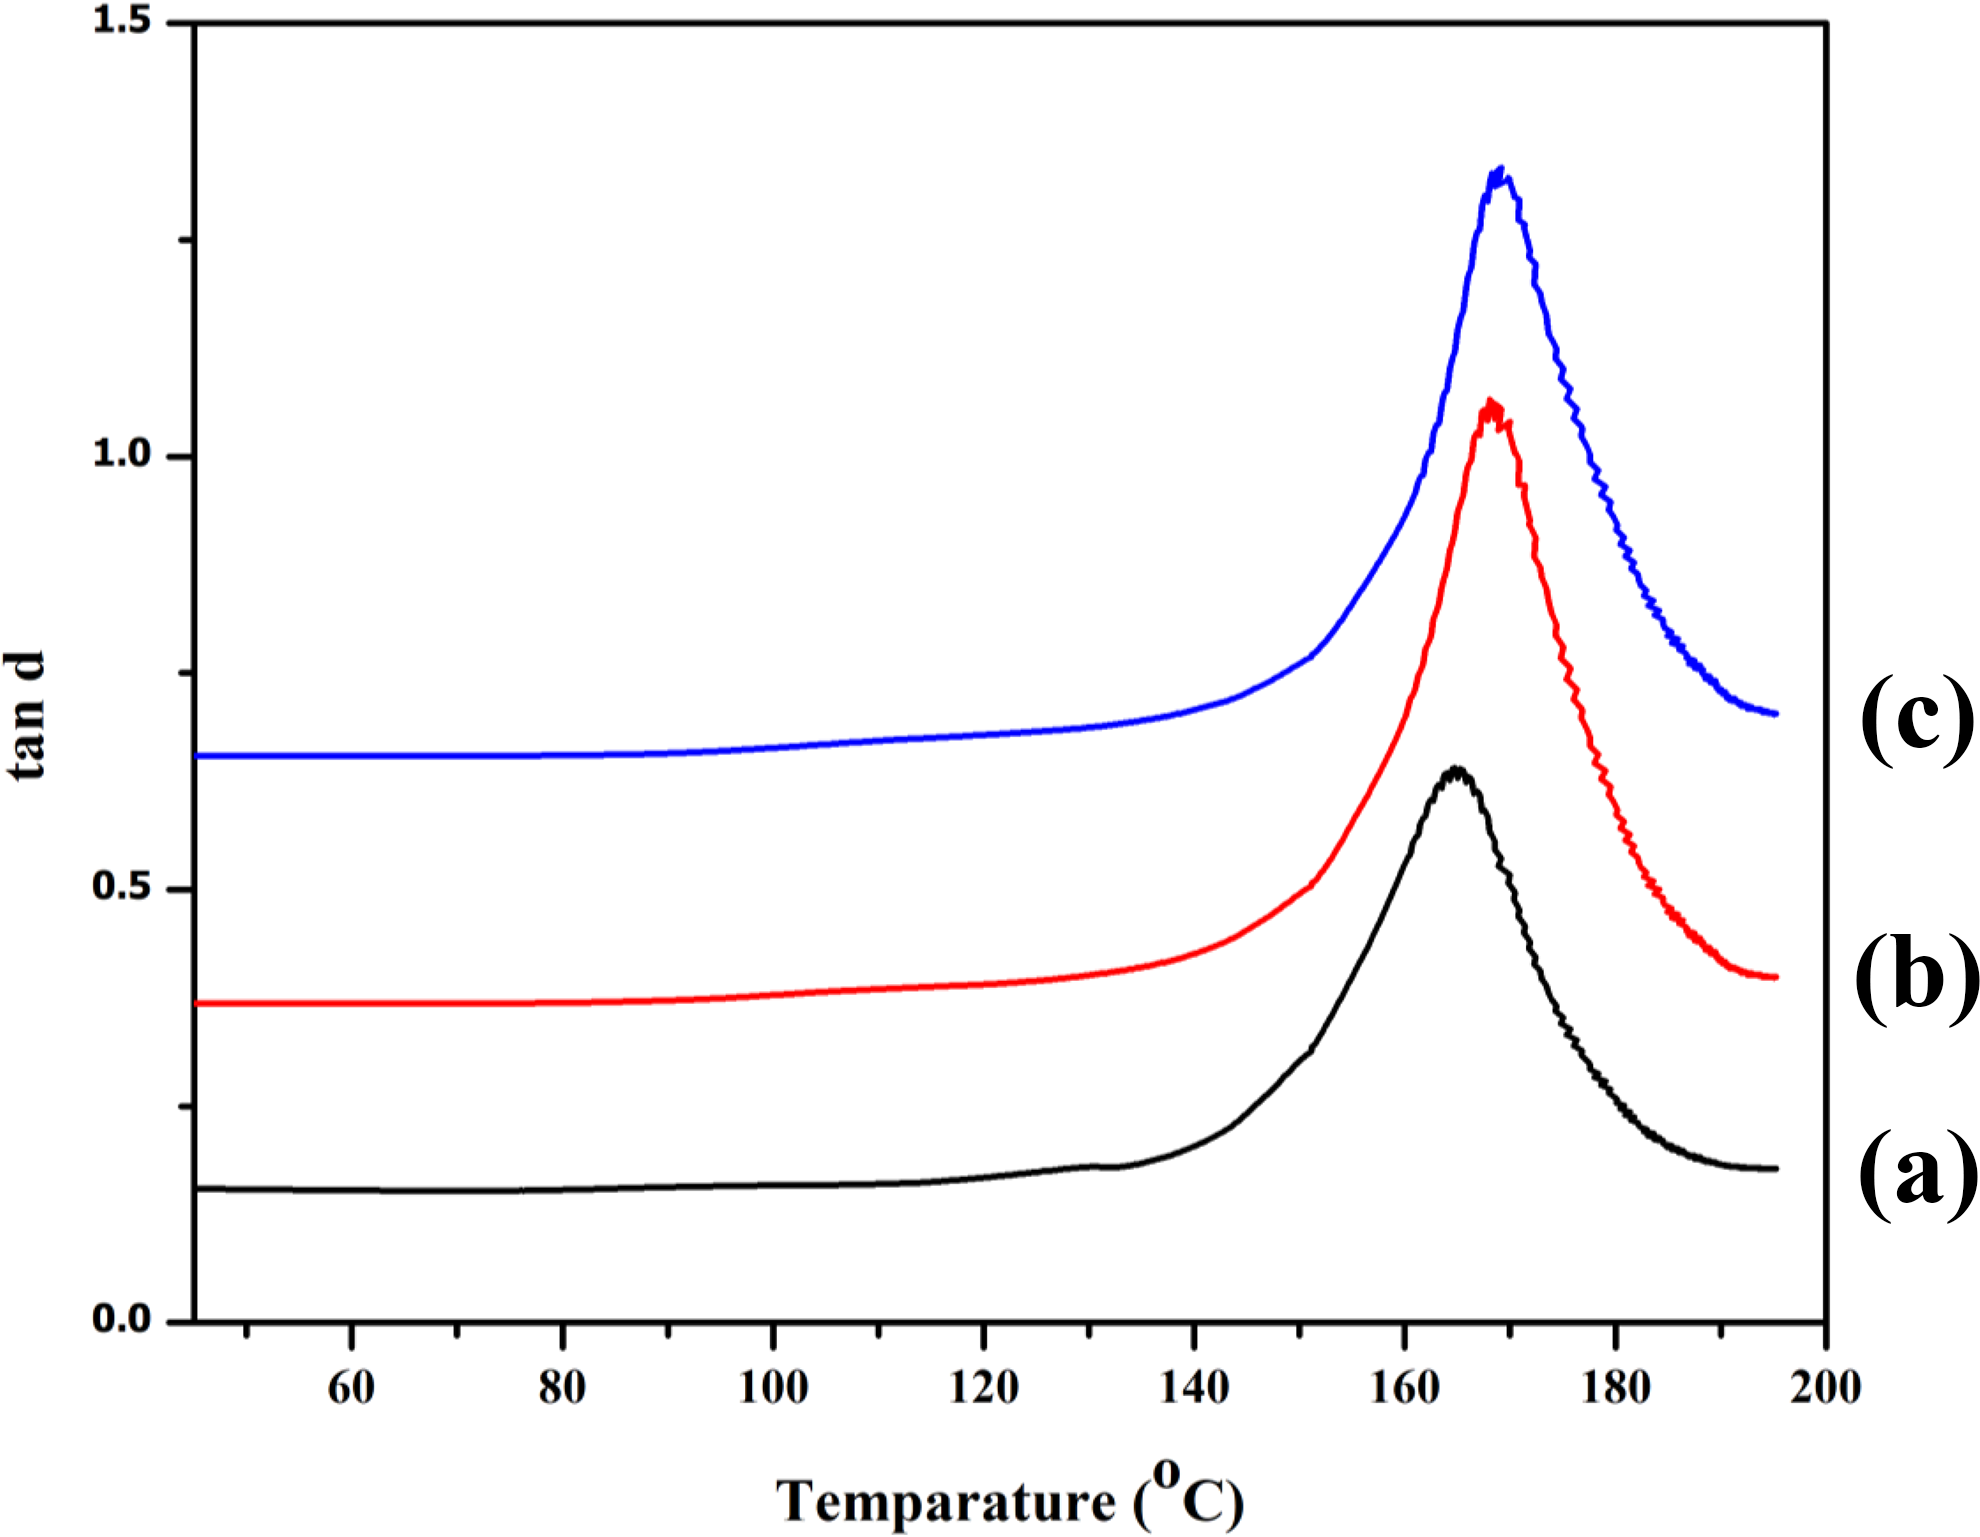
Tan δ of (a) PRGLDM0, (b) PRGLDM10, and (c) PRGLDM5.
DMA study showed that composites having 5 phr MMT exhibited an improvement in viscous response as well as elastic properties than either 2 phr or 10 phr MMT-added composites.
Thermal properties
Table 1 lists the initial decomposition temperature (T i), maximum decomposition temperature (T m), decomposition temperature at different weight loss (T D %), and residual weight (RW %) for the samples. The T i values of RH composite without MMT were in between those of PVC and RH. Incorporation of MMT to the polymer matrix increased the T i value in the composite. Both PVC and composite showed two stages of decomposition. T m values for PVC, neat PVC, RH flour, and RH/ PVC composites may be attributed to the α-cellulose decomposition 31 and dehydrochlorination of PVC. 32 In the RH composites, the T m value for both stages of pyrolysis shifted marginally toward higher temperature. T D values of MMT-treated RH composites were more compared to the clay untreated composite. The values were maximum when 5 phr MMT was used and after that the values decreased. This might be due to silicate layers of montmorillonite which produced a tortuous (twisted) path for diffusion of volatile decomposed products from the nanocomposite. 30 The lower T i and T m values observed in RH composite with 10 phr MMT was due to poor dispersion and aggregation of MMT in the composite. The high value of RW (%) in RH was due to the presence of silica present in the RH ash. These results suggested an improvement in the thermal stability of the composite due to the addition of MMT. The nanocomposite with 5 phr MMT loading had better thermal stability.
Thermal analysis of PVC, RH, and RHPNC.
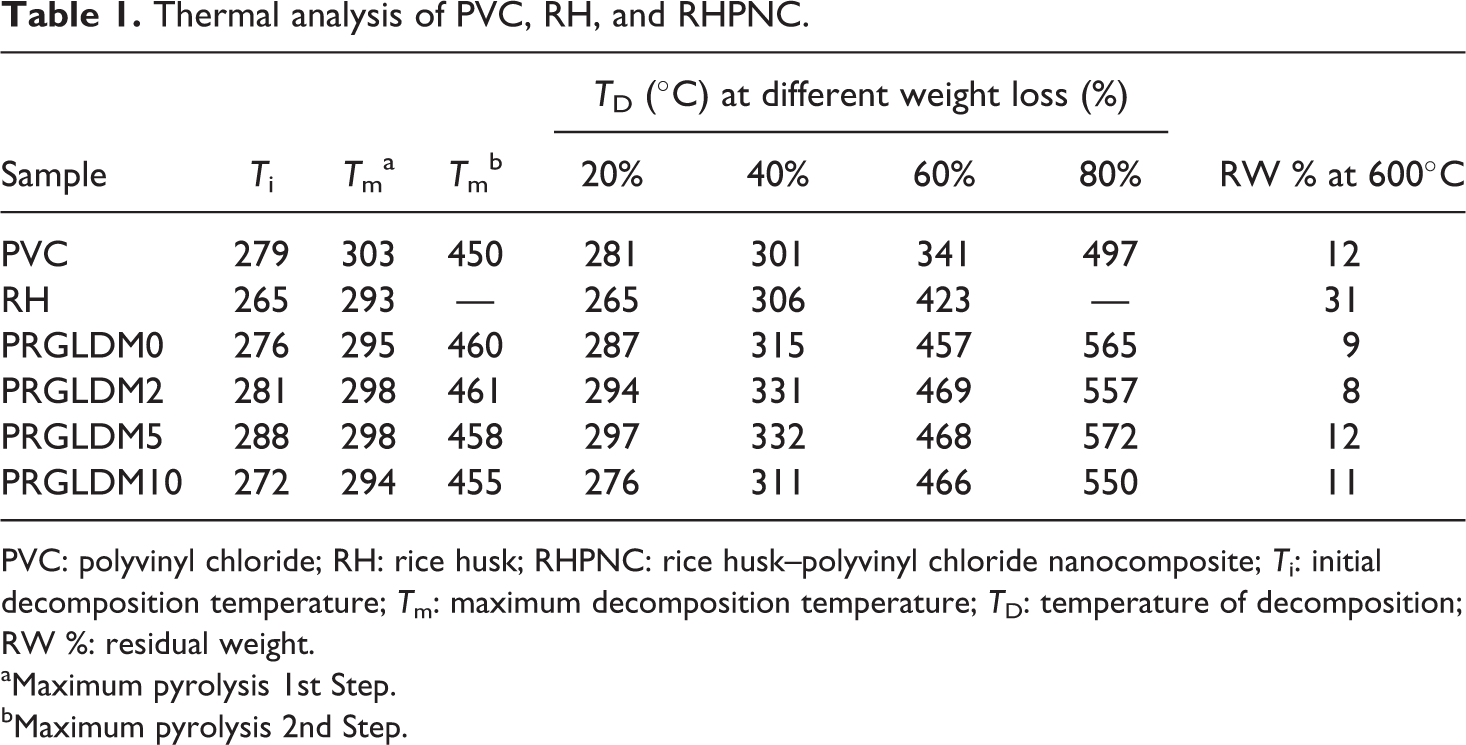
PVC: polyvinyl chloride; RH: rice husk; RHPNC: rice husk–polyvinyl chloride nanocomposite; T i: initial decomposition temperature; T m: maximum decomposition temperature; T D: temperature of decomposition; RW %: residual weight.
aMaximum pyrolysis 1st Step.
bMaximum pyrolysis 2nd Step.
Mechanical and hardness properties
The flexural strength and modulus of the nanocomposite with varying percentage of MMT are presented in Table 2. The results obtained in Table 2 are average values of five samples. Both flexural strength and flexural modulus were found to enhance with the incorporation of clay to the polymer composite. Both the values increased up to 5 phr clay loading and after that the values decreased. The increase in values might be due to the proper dispersion of silicate layers of MMT in polymer matrix and the restriction in the movement of the polymer chain. In 10 phr MMT composite, the agglomeration of clay intercalated between the silicate layers might took place and as a result of that both flexural strength and modulus were found to decrease. 33 This was in accordance with TEM results which reveal the occurrence of agglomeration of MMT at higher loading. Hardness value was also found to increase up to the addition of 5 phr of nanoclay in the composites and beyond those values decreased. The explanation for this trend was similar to that stated above. The flexural properties and hardness values of the samples were kept for 96 h in wet condition. Both flexural properties and hardness values were found to decrease in the range 2.5–4.0% and 1.5–3.1%, respectively, compared to those of dry samples. The trends for flexural and hardness values of wet samples were similar to those of dry samples. The water vapor penetrates into the composite and decreased the adhesion among different components resulting in a decrease of flexural properties.
Flexural properties and hardness properties of RHPNC.
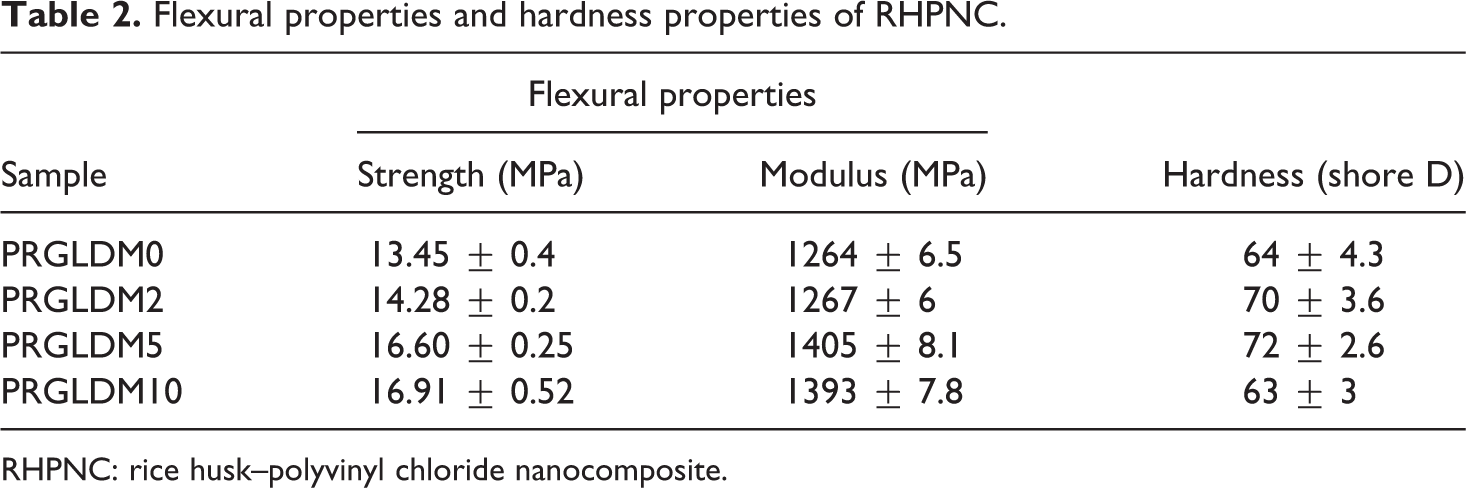
RHPNC: rice husk–polyvinyl chloride nanocomposite.
Water uptake study
The water uptake capacity of various RHPNC with variation in MMT loading is shown in Figure 8. It was observed that water uptake by the composites increased with time. It was also observed that initially the rate of water absorption was high and then it slowed down. Introduction of MMT decreased the water uptake capacity of the RHPNC. Among the various MMT-loaded composites, 5 phr MMT-loaded composite showed least water uptake value compared to those of composite containing 2 and 10 phr MMT. The reason for this decrease might be due to the silicate layers of the clay. The silicate layers act as a hindrance for water to permeate in the composite. 34 At 5 phr MMT loading, the clay layers become more delaminated and restricted the accessibility of water more into the composites and hence exhibited lowest water uptake value. The agglomeration of clay at higher MMT loading was responsible for showing higher water uptake by the composite.
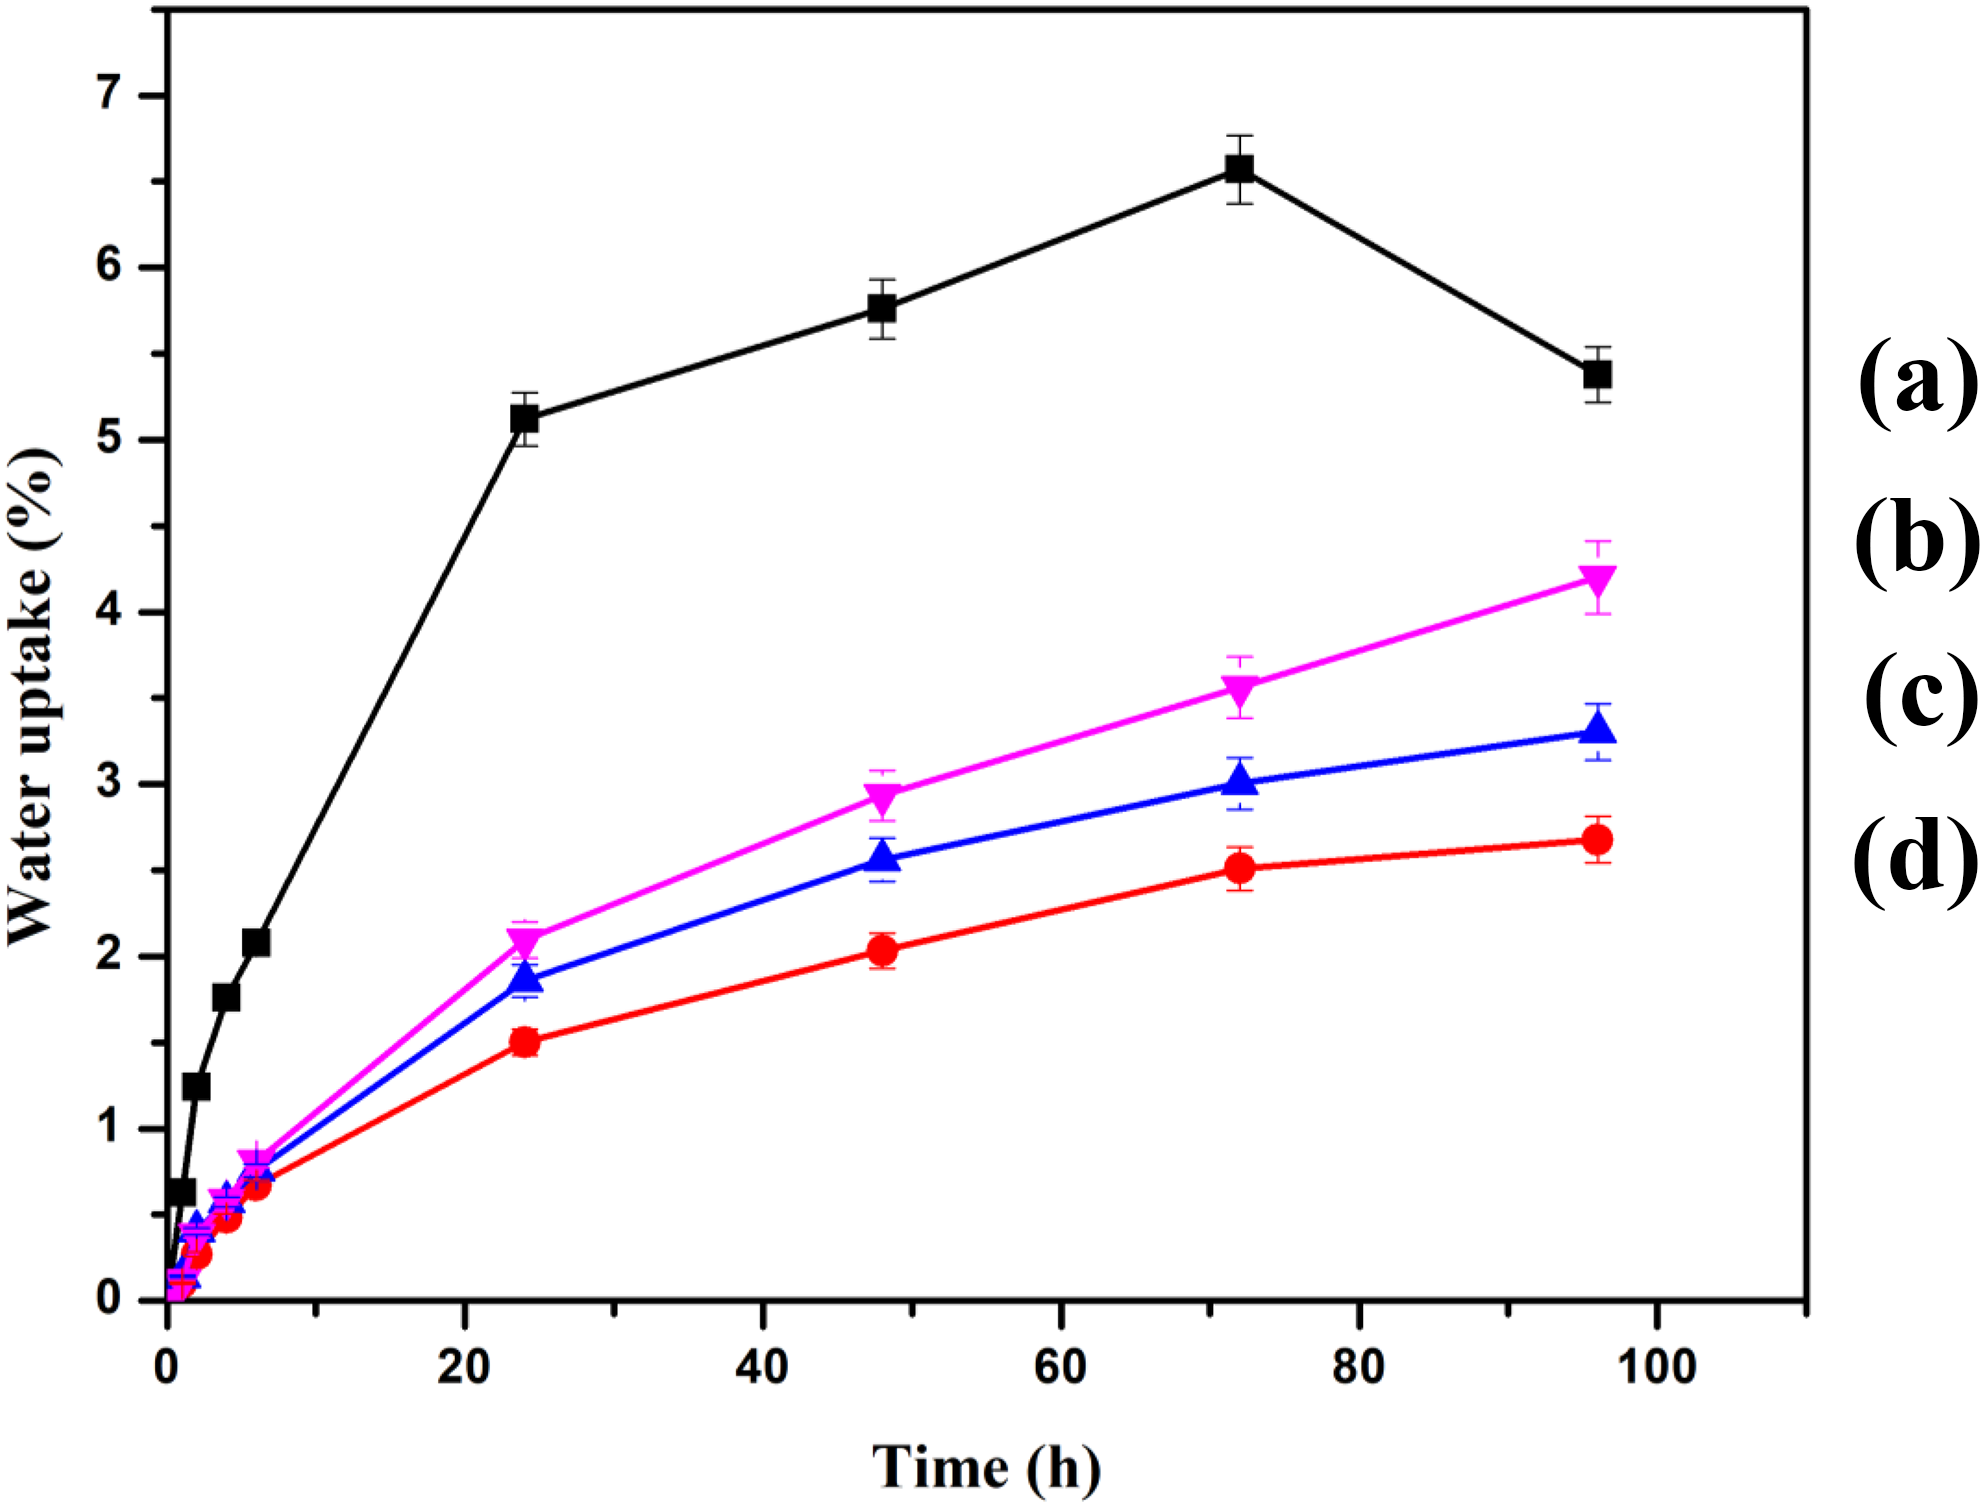
Water uptake of (a) PRGLDM0, (b) PRGLDM2, (c) PRGLDM10, and (d) PRGLDM5.
LOI test
The LOI values of RHPNC with or without clay loadings are presented in Table 3. It was observed that the RHPNC with MMT showed higher LOI values than MMT free composite. Among the clay composite, 5 phr MMT-loaded composite exhibited higher LOI value compared to the 2 and 10 phr MMT containing composite. During combustion, carbonaceous-silicate charred layer was formed on the surface of the composite which acted as an insulation for the underlying material and retarded the heat transfer, that is, delayed the decomposition rate. 35 The lower LOI value for RHPNC with 10 phr MMT might be due to the poor dispersion and agglomeration of MMT in the composite. Similar decrease in LOI value with the increase in MMT content was reported in the literature. 36
LOI of RHPNC samples.
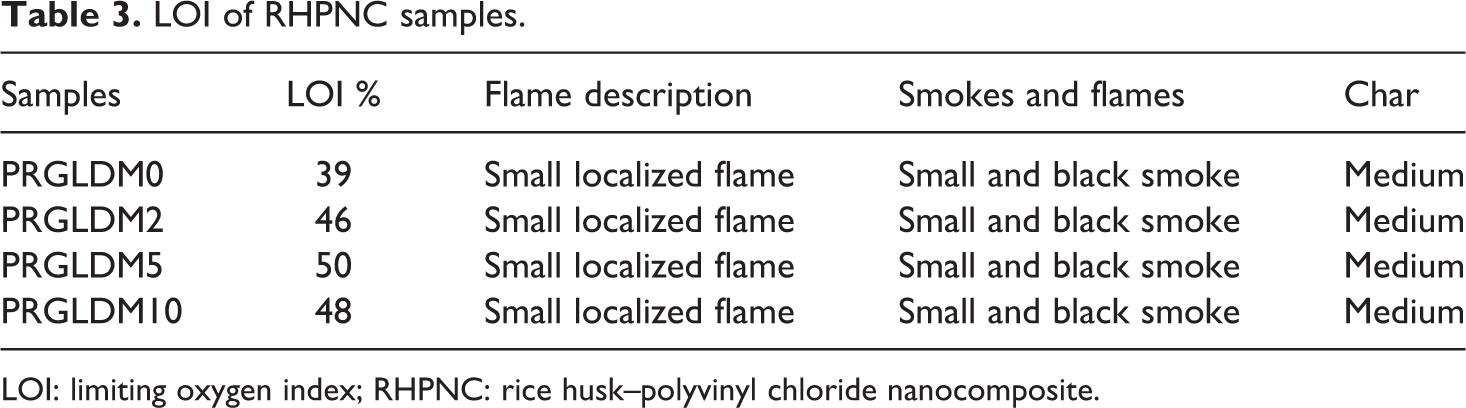
LOI: limiting oxygen index; RHPNC: rice husk–polyvinyl chloride nanocomposite.
Conclusion
In this study, a solvent-less low-cost approach was demonstrated to prepare nanocomposites based on waste renewable bioresource using RH, PVC, and MMT. This study showed an improvement of thermal, mechanical, and other physiochemical properties on the addition of MMT to the polymer matrix. FTIR study showed an improvement in the interaction between the components due to the addition of MMT. XRD study indicated the introduction of MMT nanolaminae into the amorphous region of RH cellulose/PVC composite. SEM study revealed the decrease in roughness due to the addition of MMT. Composite containing 5 phr MMT showed better thermal stability, flame-retardant properties, mechanical and water-resistant properties as evidenced by TGA, LOI, flexural testing, dynamic mechanical, and water uptake analysis. This process can be regarded as one of the vital processes for value addition of the waste bioresources which may be further utilized as an alternative to biocomposite-related applications. Further it could be concluded that a part of the PVC, a synthetic polymer, can be replaced by RH, a material from renewable resources without major altering the overall properties of the biobased composites.