
Abstract
Chitosan is a well-known biodegradable biopolymer, which possesses antimicrobial properties. In this study, the effect of chitosan incorporation on the morphology; thermal, mechanical, and rheological properties; and antibacterial and photodegradation behaviors of polyethylene (PE)/thermoplastic starch (TPS) blends were examined. PE/TPS blends were compatibilized with low-density PE-grafted maleic anhydride copolymer (PE-g-MA) compatibilizer. Scanning electron microscopy (SEM) and tensile test indicated that the addition of chitosan in powder form has a devastating effect on both mechanical and morphological properties of the blends. Therefore, chitosan was plasticized with acetic acid and glycerol (2 wt% chitosan dissolved in acetic acid/glycerol solution) prior to addition to the blends, which considerably improved the mechanical properties of the blends. Dynamic rheological experiments revealed a decrease in the complex viscosity of the blends with the addition of plasticized chitosan compared with unplasticized chitosan. SEM micrographs demonstrated more homogenous microstructure for the blends containing plasticized chitosan and PE-g-MA compatibilizer. Differential scanning calorimetry results indicated that unplasticized chitosan acts as a nucleation agent for PE crystallization. Antibacterial analysis indicated that the incorporation of chitosan had a significant effect on preventing from bacterial population growth. The major part of this article was to study the effect of ultraviolet (UV) exposure on the chemical structure and mechanical properties of the blends, using Fourier transform infrared spectroscopy and tensile properties examination. The results indicated that the slight amount of chitosan may significantly improve the photostability of PE/TPS blends against UV degradation. However, PE-g-MA compatibilizer dramatically decreased the UV resistance of the blends.
Introduction
Polyethylene (PE) is a commonly used polymer in food and nonfood products packaging due to its optical, barrier, and mechanical properties. With the increase in the population, demands for this material have increased more than ever. However, the same physical and mechanical properties that make PE a suitable polymer for various applications hinder its degradation in the environment. Accumulation of these plastics in the environment endangers the animal species such as marine and avian life. 1,2 A solution for this problem can be the addition of a biodegradable component to the synthetic polymer matrix.
The addition of numerous biodegradable materials to PE matrix such as cellulose 3 and lignin 4 has been investigated in the past two decades. Among these materials, chitosan has attracted the attention of the scientists and researchers. Chitosan as a polysaccharide is produced by deacetylation of chitin (found in crustaceans such as crab, shrimp, and lobster), which in addition to its biocompatibility possesses the antimicrobial, antifungal, and antiviral properties. 5 The major advantage of this material over other disinfectants is its lower toxicity to the mammalian cells and higher antibacterial activity. 5 Although chitosan is biocompatible and biodegradable, its antibacterial properties hinder its degradation in the environment; therefore, it is recommended to incorporate another component in PE matrix to accelerate the degradation of the blend’s microstructure. A proper choice for the third component can be starch, which is one of the most economical and abundant biopolymers. 6 –9 However, it is a brittle biopolymer, and its addition to PE matrix negatively influences the mechanical properties of the blends. Therefore, the researchers have modified starch using plasticizers such as glycerol, 10 sorbitol, and ethylene bisformamide, 11 called thermoplastic starch (TPS), which is less brittle compared with virgin starch and can be easily melted and flowed and makes it possible to be processed by injection molding, extrusion, and blow molding. The other problem with the addition of starch and chitosan to PE matrix is the incompatibility between hydrophobic PE and hydrophilic starch and chitosan. To overcome this problem, the compatibilizers such as stearic acid-grafted starch 12 and PE-grafted maleic anhydride (PE-g-MA) 13 have been used.
The main objective of this work is to prepare a biodegradable and antibacterial ternary blend of linear low-density PE, TPS, and plasticized chitosan for using in packaging industry. The blends are compatibilized with the PE-g-MA graft copolymer. In this study, the effect of chitosan incorporation on the morphology; thermal, mechanical, and rheological properties; and antibacterial behavior of PE/TPS blends are examined. Furthermore, the effects of ultraviolet (UV) exposure on chemical microstructure and mechanical properties of the blends are investigated.
Experimental
Materials
Linear low-density PE (LL0209AA) with a density of 0.92 g cm−3 and melt flow index (MFI) of 0.9 (g/10 min) was purchased from Tabriz Petrochemical Company (Tabriz, Iran). Medium–molecular-weight chitosan (75–85% deacetylated) was supplied by Sigma-Aldrich Chemicals Company (Kuala Lumpur, Malaysia). Corn starch (30 wt.% amylose and 70 wt.% amylopectin) was obtained from Glucosan Company (Tehran, Iran). PE-g-MA (2 wt% grafted MA, MFI: 3 g/10 min) was obtained from Aria Polymer Pishgam chemicals Company (Isfahan, Iran). Commercial glycerol was purchased from Mobtakeran Shimi Chemical Company (Iran). Escherichia coli (Persian type culture collection [PTCC] 1270) and Staphylococcus aureus (PTCC 1112) were supplied from microbial PTCC (Tehran, Iran). Nutrient agar (NA) and nutrient broth (NB) were obtained from Biolife (Biolife Co., Milan, Italy).
Blends preparation methods
For the preparation of TPS, corn starch powder was dried in a vacuum oven at 80°C for 24 h and then premixed with 35 wt% glycerol using a mechanical mixer. The mixing was stopped once starch was properly mixed with glycerol. To ensure the appropriate mixing, the compound was melt-mixed using a Brabender internal mixer (W50EHT) at 160°C and 60 r min−1.
To prepare plasticized chitosan, initially 100 ml acetic acid solution (2 wt% in water) was prepared using a stirring heater. While the solution temperature reached 80°C, 2 g chitosan was slowly added to the mixture and stirred until the resulting mixture was perfectly uniform; afterward, 2 g glycerol was added, and the mixture temperature was increased to 120°C to evaporate the excessive water as much as possible.
To prepare blends containing both starch and chitosan with a certain content, for each blend, a master batch containing the required amounts of starch–chitosan–glycerol were prepared by the addition of a predetermined amount of starch and glycerol to previously prepared chitosan–glycerol masterbatch. Then, the resulting mixture was placed in a vacuum oven at 80°C overnight.
To prepare the final PE/TPS/chitosan blends, PE was introduced into a Brabender internal mixer for 10 min at a rotor speed of 60 r min−1 at 160°C. After 3-min compounding, TPS masterbatch (containing TPS or starch/chitosan/glycerol mixture) was incorporated, and compounding was continued for another 3 min; PE-g-MA graft copolymer was added. The compounding proceeded until the internal mixer torque reached to a constant value.
To study the effect of UV exposure on the blends, the samples were placed in a box for 2 months under 18W UV exposure source with a length of 600 mm and a diameter of 25.6 mm. The bottom of the box was prepared in a semi-cylindrical shape, so that all samples had an equal distance from the UV source.
The acronym and composition of the prepared blends are summarized in Table 1.
Acronyms and composition of various PE/TPS/chitosan blends.
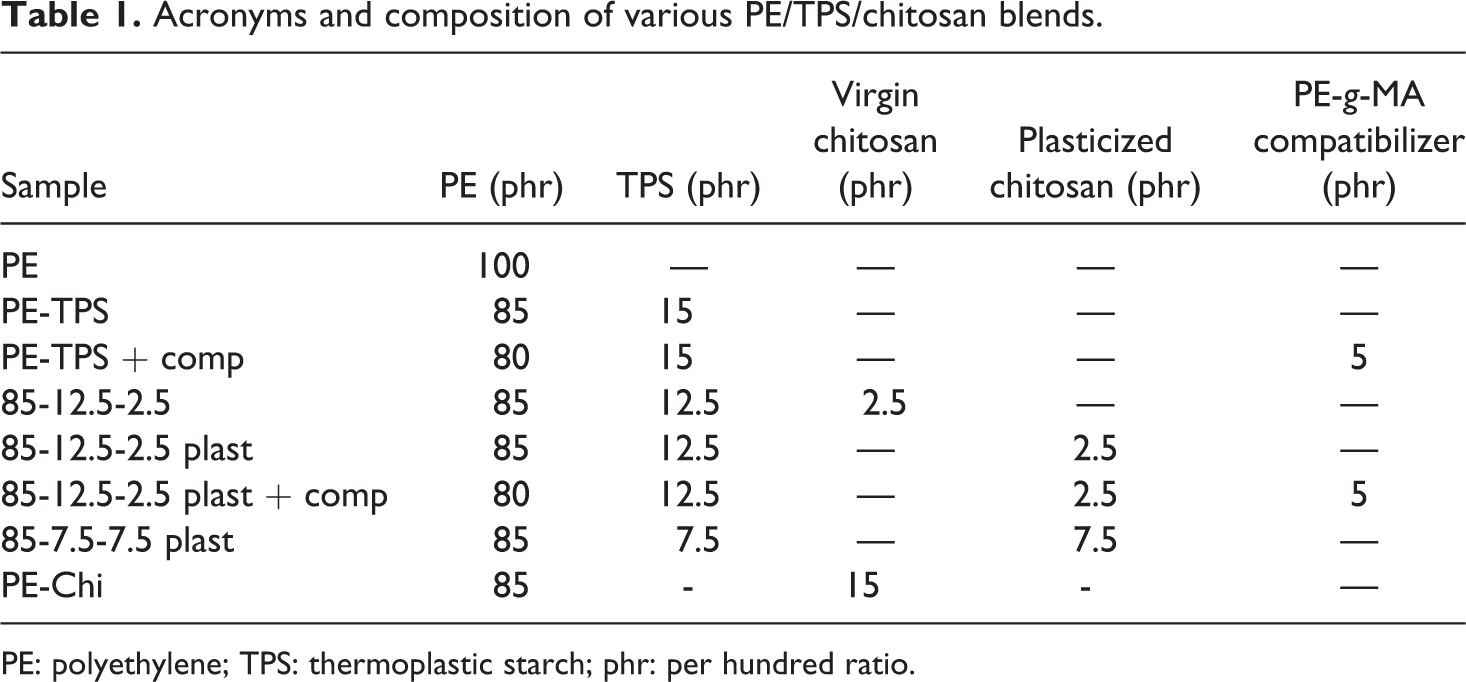
PE: polyethylene; TPS: thermoplastic starch; phr: per hundred ratio.
Characterization methods
For morphological studies, a scanning electron microscope (Cam Scan MV2300, Czech Republic) was used. The samples were cryo-fractured in liquid nitrogen; then, the fractured surface were etched using acetic acid at room temperature for 24 h to extract the starch and chitosan phase. Afterward, their surfaces were gold-coated before examination, and the micrographs were taken with different magnifications.
Dynamic rheological examinations (using a Physica MCR 301 dynamic rheometer; Anton Paar, Graz, Austria) of PE/TPS/chitosan blends were performed at a temperature of 160°C, angular frequencies of 0.01–100 s−1, and a strain of 1% under nitrogen purge. The geometry of parallel plates was utilized, and a disk with a diameter of 25 mm and a thickness of 2 mm was prepared by compression molding in a Brabender (polystat 200 T) hot press at a temperature of 160°C and a pressure of 50 bar to eliminate any entrapped air in the structure of the blends.
Mechanical property measurements of blends were conducted by a Zwick/Roell (Z010, Germany) tensile testing machine equipped with a 10-kN load cell and in accordance with American Society for Testing and Materials D638 standard. Specimens in dumbbell shape were prepared by compression molding in a Brabender (polystat 200 T) hot press at a temperature of 160°C and a pressure of 50 bar. The elongational rate was 10 mm min−1, and for each sample, at least three specimens were tested.
The thermal properties of the blends were characterized by differential scanning calorimetry (Netzsch DSC-200 F3, Selb, Germany). Samples were heated up from 25°C to 180°C, then cooled down to 25°C, and finally reheated to 180°C all at a rate of 10°C min−1. The peak temperature of the first cooling curve was considered as the peak of crystallization temperature (T c) and the peak temperature of the second heating curve as the peak of melting temperature (T m). The ultimate degree of crystallinity (Xc ) was calculated using the following equation:
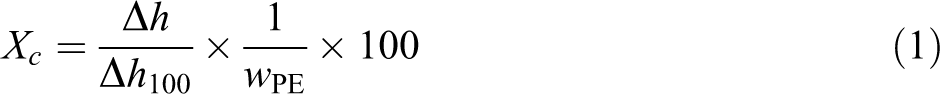
where Δh is the heat of crystallization of the samples and Δh 100 is the heat of crystallization for 100% crystalline PE, which was taken as 288 J g−1, and wPE is the weight fraction of PE in blends. 14
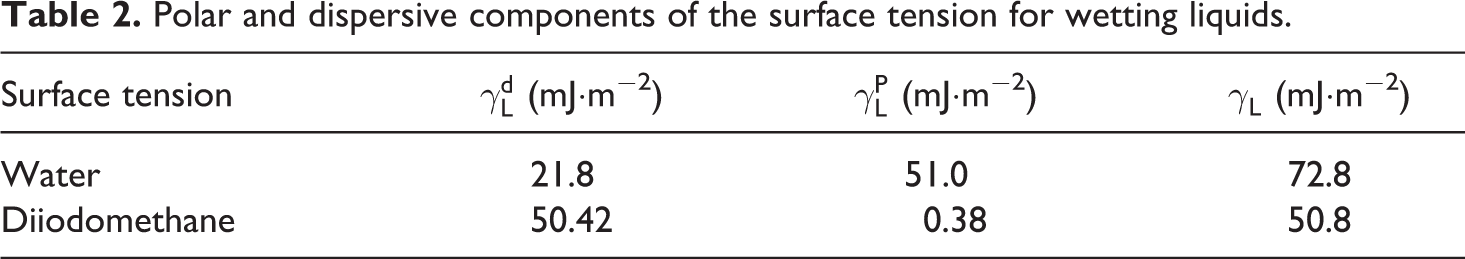
Water and diiodomethane contact angle measurements were carried out using a contact angle measurement system (COMS3MP, Bell, Italy) to assess the hydrophilicity and surface energy of the samples. Three disk-shaped specimens for each sample were prepared by compression molding in a Brabender (polystat 200 T) hot press and kept in a vacuum oven at 60°C for 24 h to remove any surface moisture, and the contact angle images were taken 3 s after the insertion of the drop onto the surface. Table 2 represents the polar and dispersive components of the surface tension for water and diiodomethane. 15
Polar and dispersive components of the surface tension for wetting liquids.
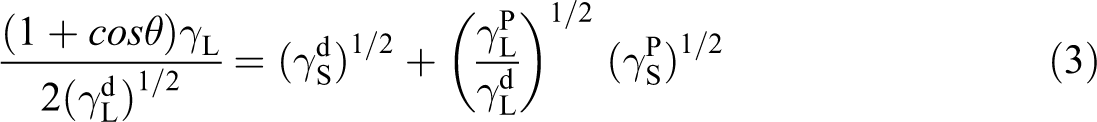
Surface tension and their polar and dispersive components of the blends were calculated using the following equation:

where γ is the total surface tension, γ
P is polar component for surface tension, and γ
d is the dispersive attraction of van der Waals forces. For both wetting liquids,
Antibacterial activities of PE/TPS/chitosan blends conjugated to the starch and chitosan were evaluated using a method described by Eskandari-Nojehdehi et al. 16 In this method, the bacteria species were inoculated on NA media at 37°C for 18–24 h. Five isolated colonies of the similar bacteria type were mixed in 10–15 ml sterile normal saline solution. Afterward, the concentration of bacteria suspension was adjusted to 0.5% McFarland standard, which had an absorbance value ranging from 0.08 to 0.10 (% absorbance unit) at 625 nm. Disk-shaped samples with a diameter of 5 mm were placed inside the cells of the 96-well plate, and140 µl of NB and 10 µl of the bacteria suspensions were then added into the well. The plate was shaken for 10 s, and the turbidity of the wells was measured using a microplate reader (DA 3200, Tabriz, Iran) at 26.1°C; then, the plate was transferred to incubator set at 37°C for further measurement after 48 h. Bactericidal activities of the prepared samples were stated as a difference between those two values (before and after incubation). In fact, the minimum value of this difference indicates the highest antibacterial activities for the prepared samples.
Fourier transform infrared (FTIR) spectra of the blends were recorded before and after UV exposure, using an FTIR spectrometer (Tensor 27; Bruker, Karlsruhe, Germany) with a measurement range of 400–4000 cm−1 and in attenuated total reflectance mode.
Results and discussion
Morphology of PE/TPS/chitosan blends
The morphology of polymer blends has an important role in identifying their mechanical and rheological properties and interfacial adhesion. Therefore, scanning electron microscopy (SEM) observations were conducted to investigate the morphology of PE/TPS blends. In Figure 1, the SEM images of the fractured surface of the samples are depicted. In these images, the dispersed phases (TPS and chitosan) were extracted by acetic acid from PE matrix, and the extracted samples were coated with a thin layer of gold before SEM examination.
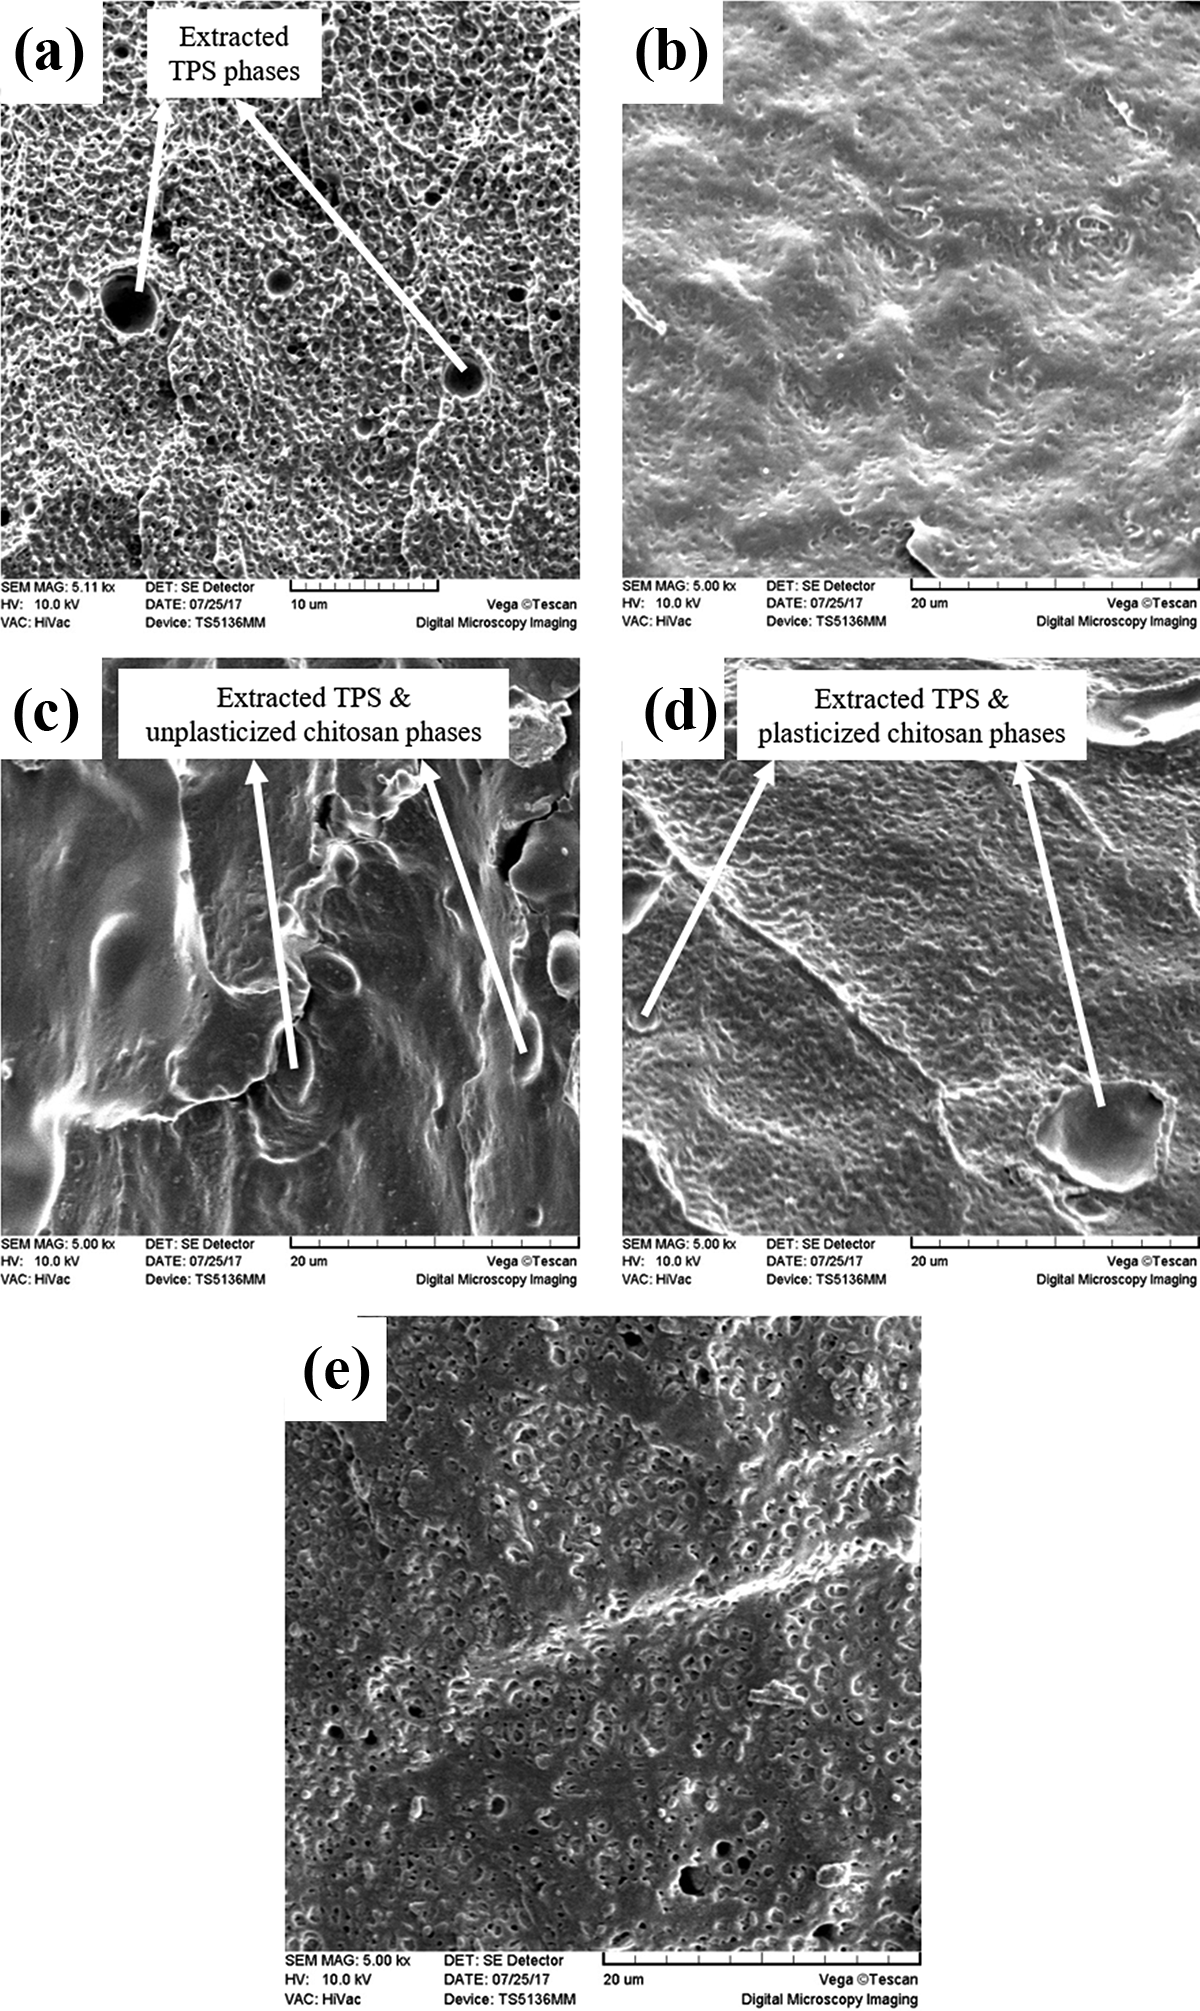
SEM micrographs of (a) PE/TPS 85-15, (b) PE/TPS/PE-g-MA 80-15-5, (c) PE/TPS/chitosan 85-12.5-2.5, (d) PE/TPS/plasticized chitosan 85-12.5-2.5, and (e) PE/TPS/chitosan/PE-g-MA 80-12.5-2.5-5, blends.
In Figure 1, it can be observed that the roughness of the fractured surface of PE/TPS sample and the average diameter of the dispersed phase have been decreased by the addition of PE-g-MA copolymer, due to its compatibilizing effect. The interaction of hydroxyl groups of TPS with MA units in PE-g-MA copolymer reduces the interfacial tension between the PE matrix and the TPS dispersed phase, which leads to a comparatively appropriate dispersion of starch phase in PE matrix. 13 The sample with 2.5 wt% unplasticized chitosan has a heterogeneous microstructure due to the agglomeration of cationic chitosan particles and their phase separation from the PE matrix. 17 Plasticization of the chitosan significantly improves the homogeneity of the PE/TPS/chitosan blends microstructure and subsequently alters their mechanical properties. Furthermore, the incorporation of PE-g-MA compatibilizer slightly improves the homogeneity of various phases. The mean size and normal size distribution of extracted disperse phases verify this issue (see Table 3). From the results of the mean diameter of dispersed phase in Table 3, it can be observed that by the addition of PE-g-MA compatibilizer the mean size of dispersed phase is decreased from 1.79 to 0.45 μm. This finding can be attributed to the enhanced interfacial adhesion between PE matrix and TPS phase by incorporating PE-g-MA copolymer. The small particle size of the PE/TPS/chitosan (85-12.5-2.5) plasticized and compatibilized blend might due to a reaction from –NH2 of chitosan and maleic anhydride (MAH) of PE-g-MA. 18 Moreover, the effect of unplasticized chitosan agglomeration on mean size of the dispersed phase is observed in Table 3.
Mean size of dispersed phase in PE/TPS/chitosan blends.
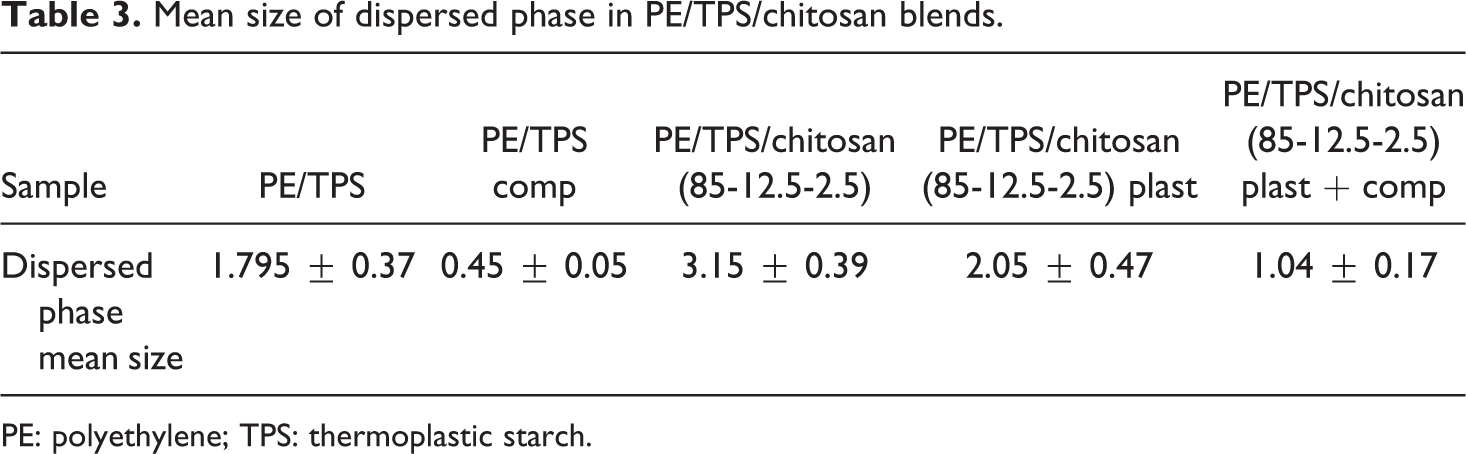
PE: polyethylene; TPS: thermoplastic starch.
Figure 2 illustrates the normal size distribution of dispersed phase in various PE/TPS/chitosan blends. It is clearly observed that by plasticizing chitosan the homogeneity of the blends microstructure is improved. Moreover, with the addition of PE-g-MA compatibilizer, both starch and chitosan have appropriate dispersion in PE matrix.
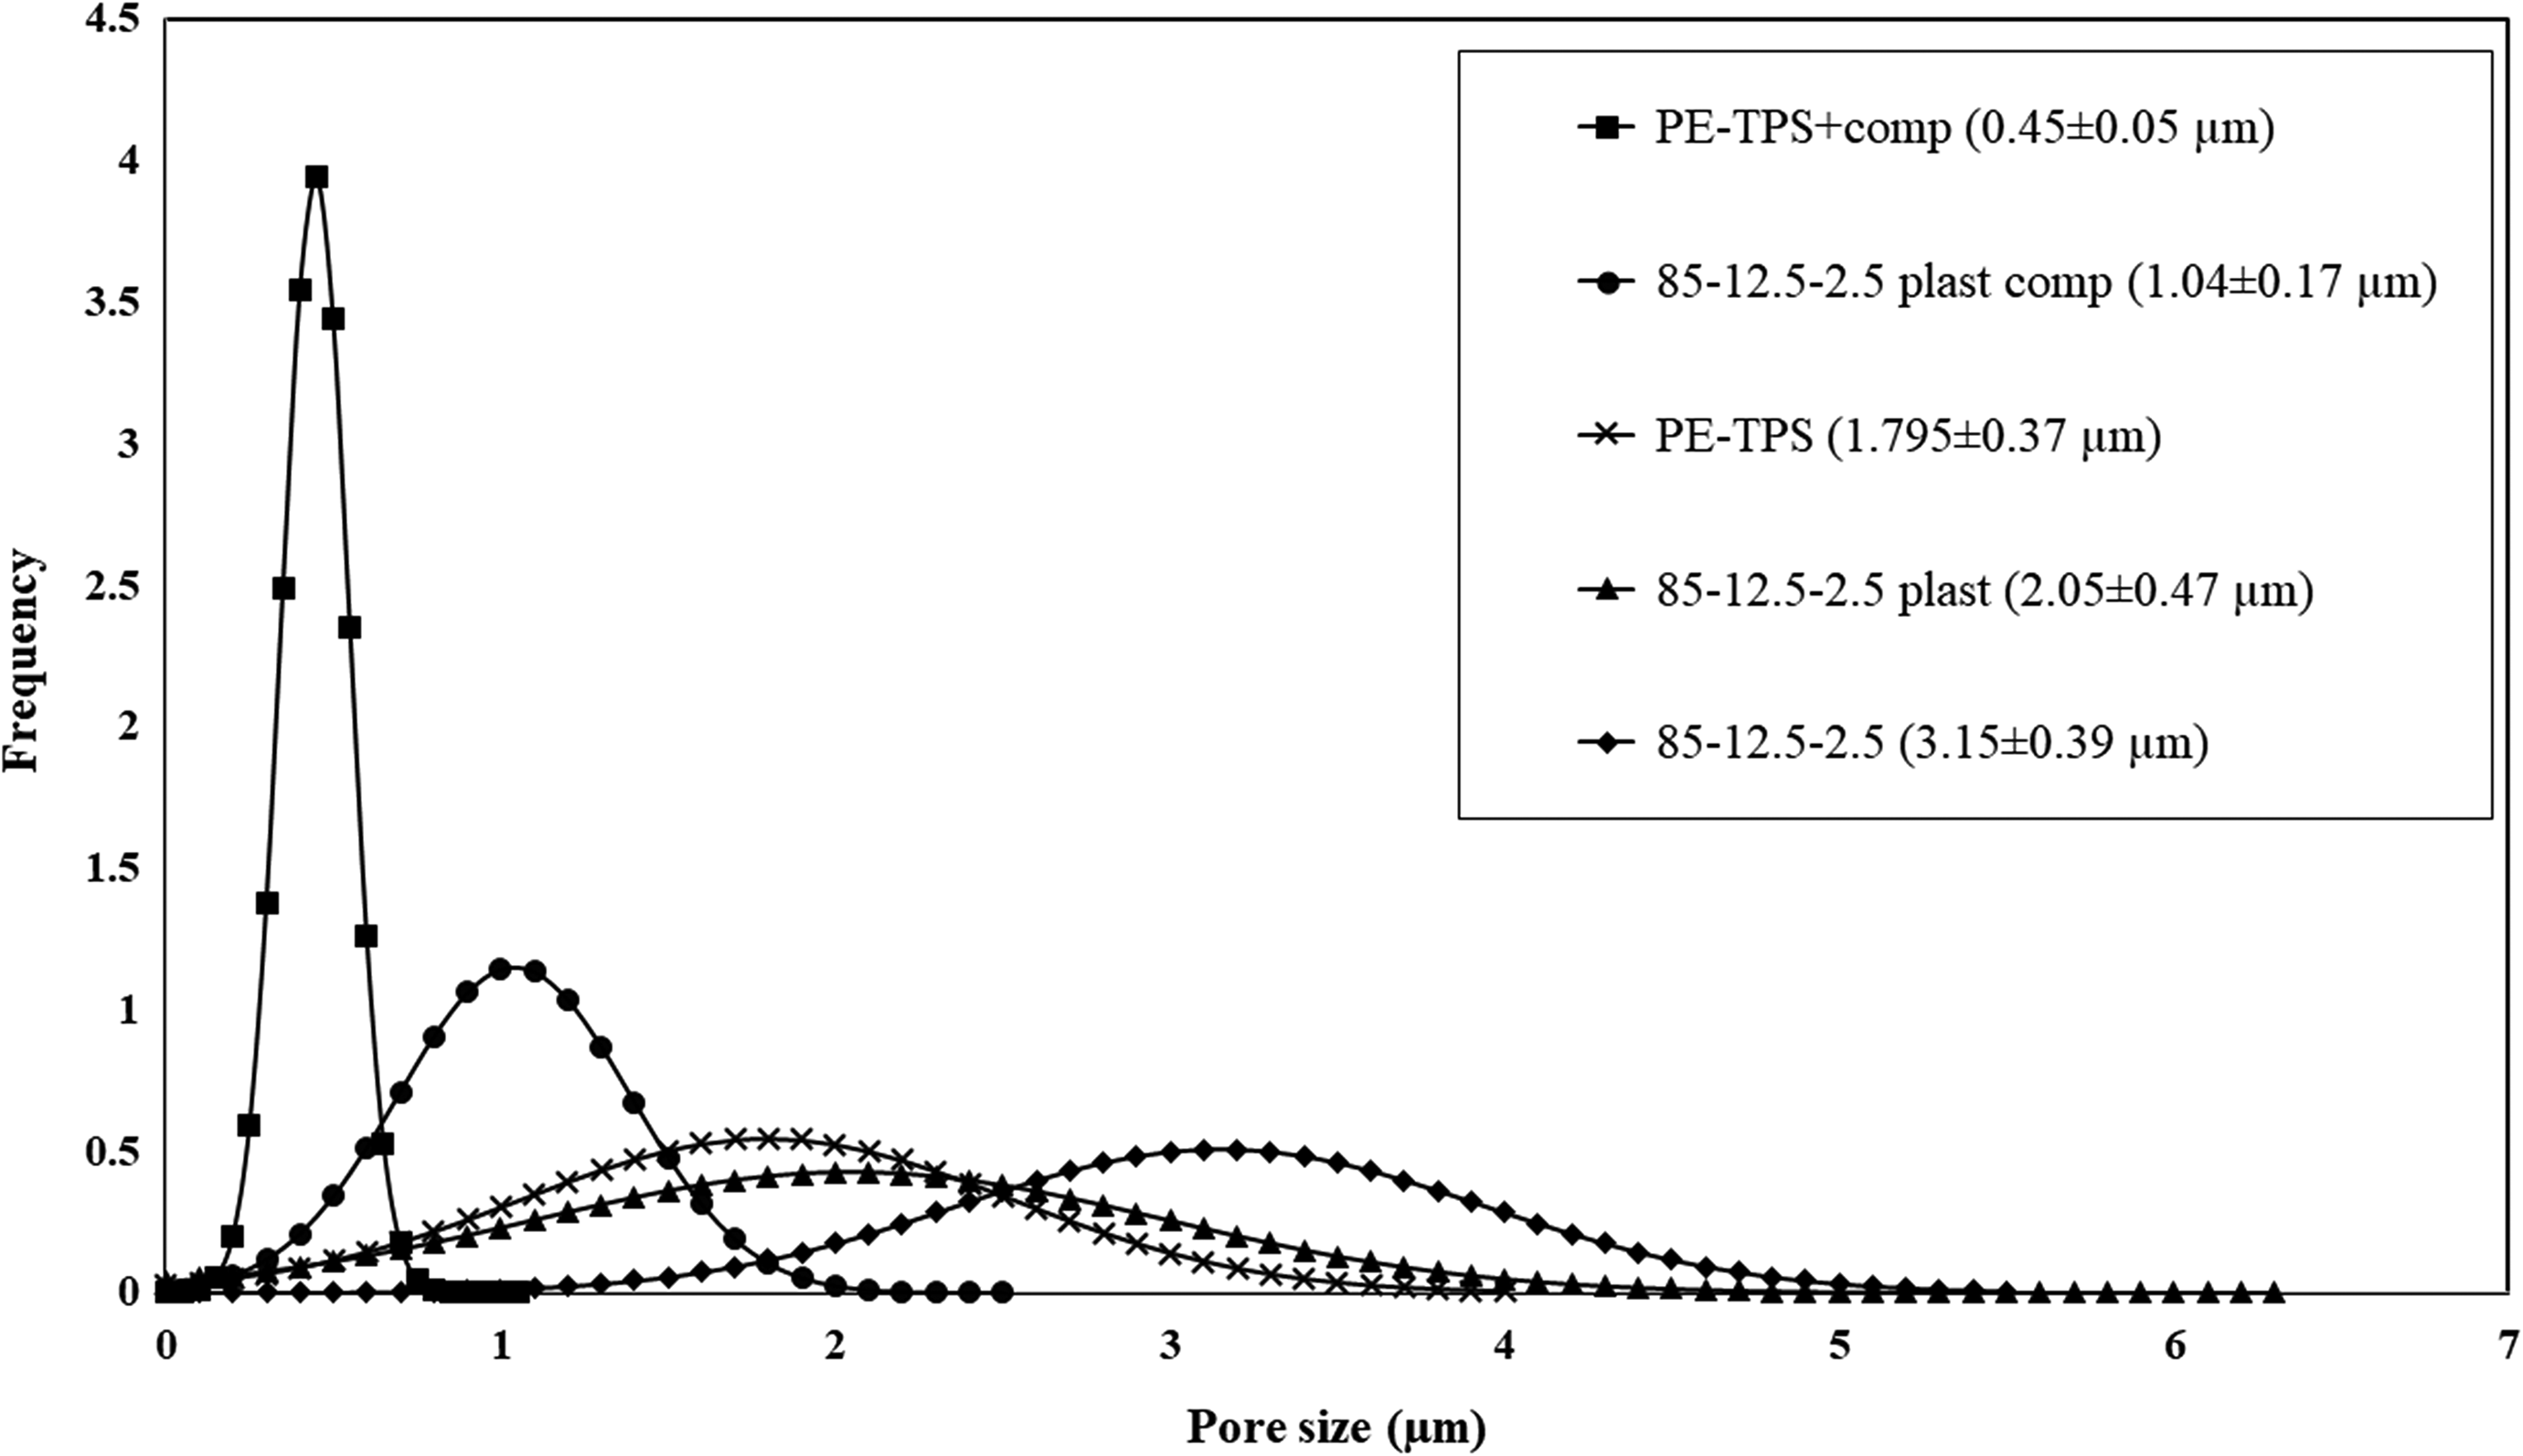
Normal size distribution of dispersed phase in various PE/TPS/chitosan blends.
Dynamic rheological properties
The rheology of thermoplastic blends is an ultimate concept to understand the relationship between their microstructure and processability. 17 Figure 3 illustrates the effect of various factors such as the addition of TPS, chitosan, plasticized chitosan, and PE-g-MA compatibilizer on the complex viscosity and storage modulus of PE/TPS/chitosan blends.
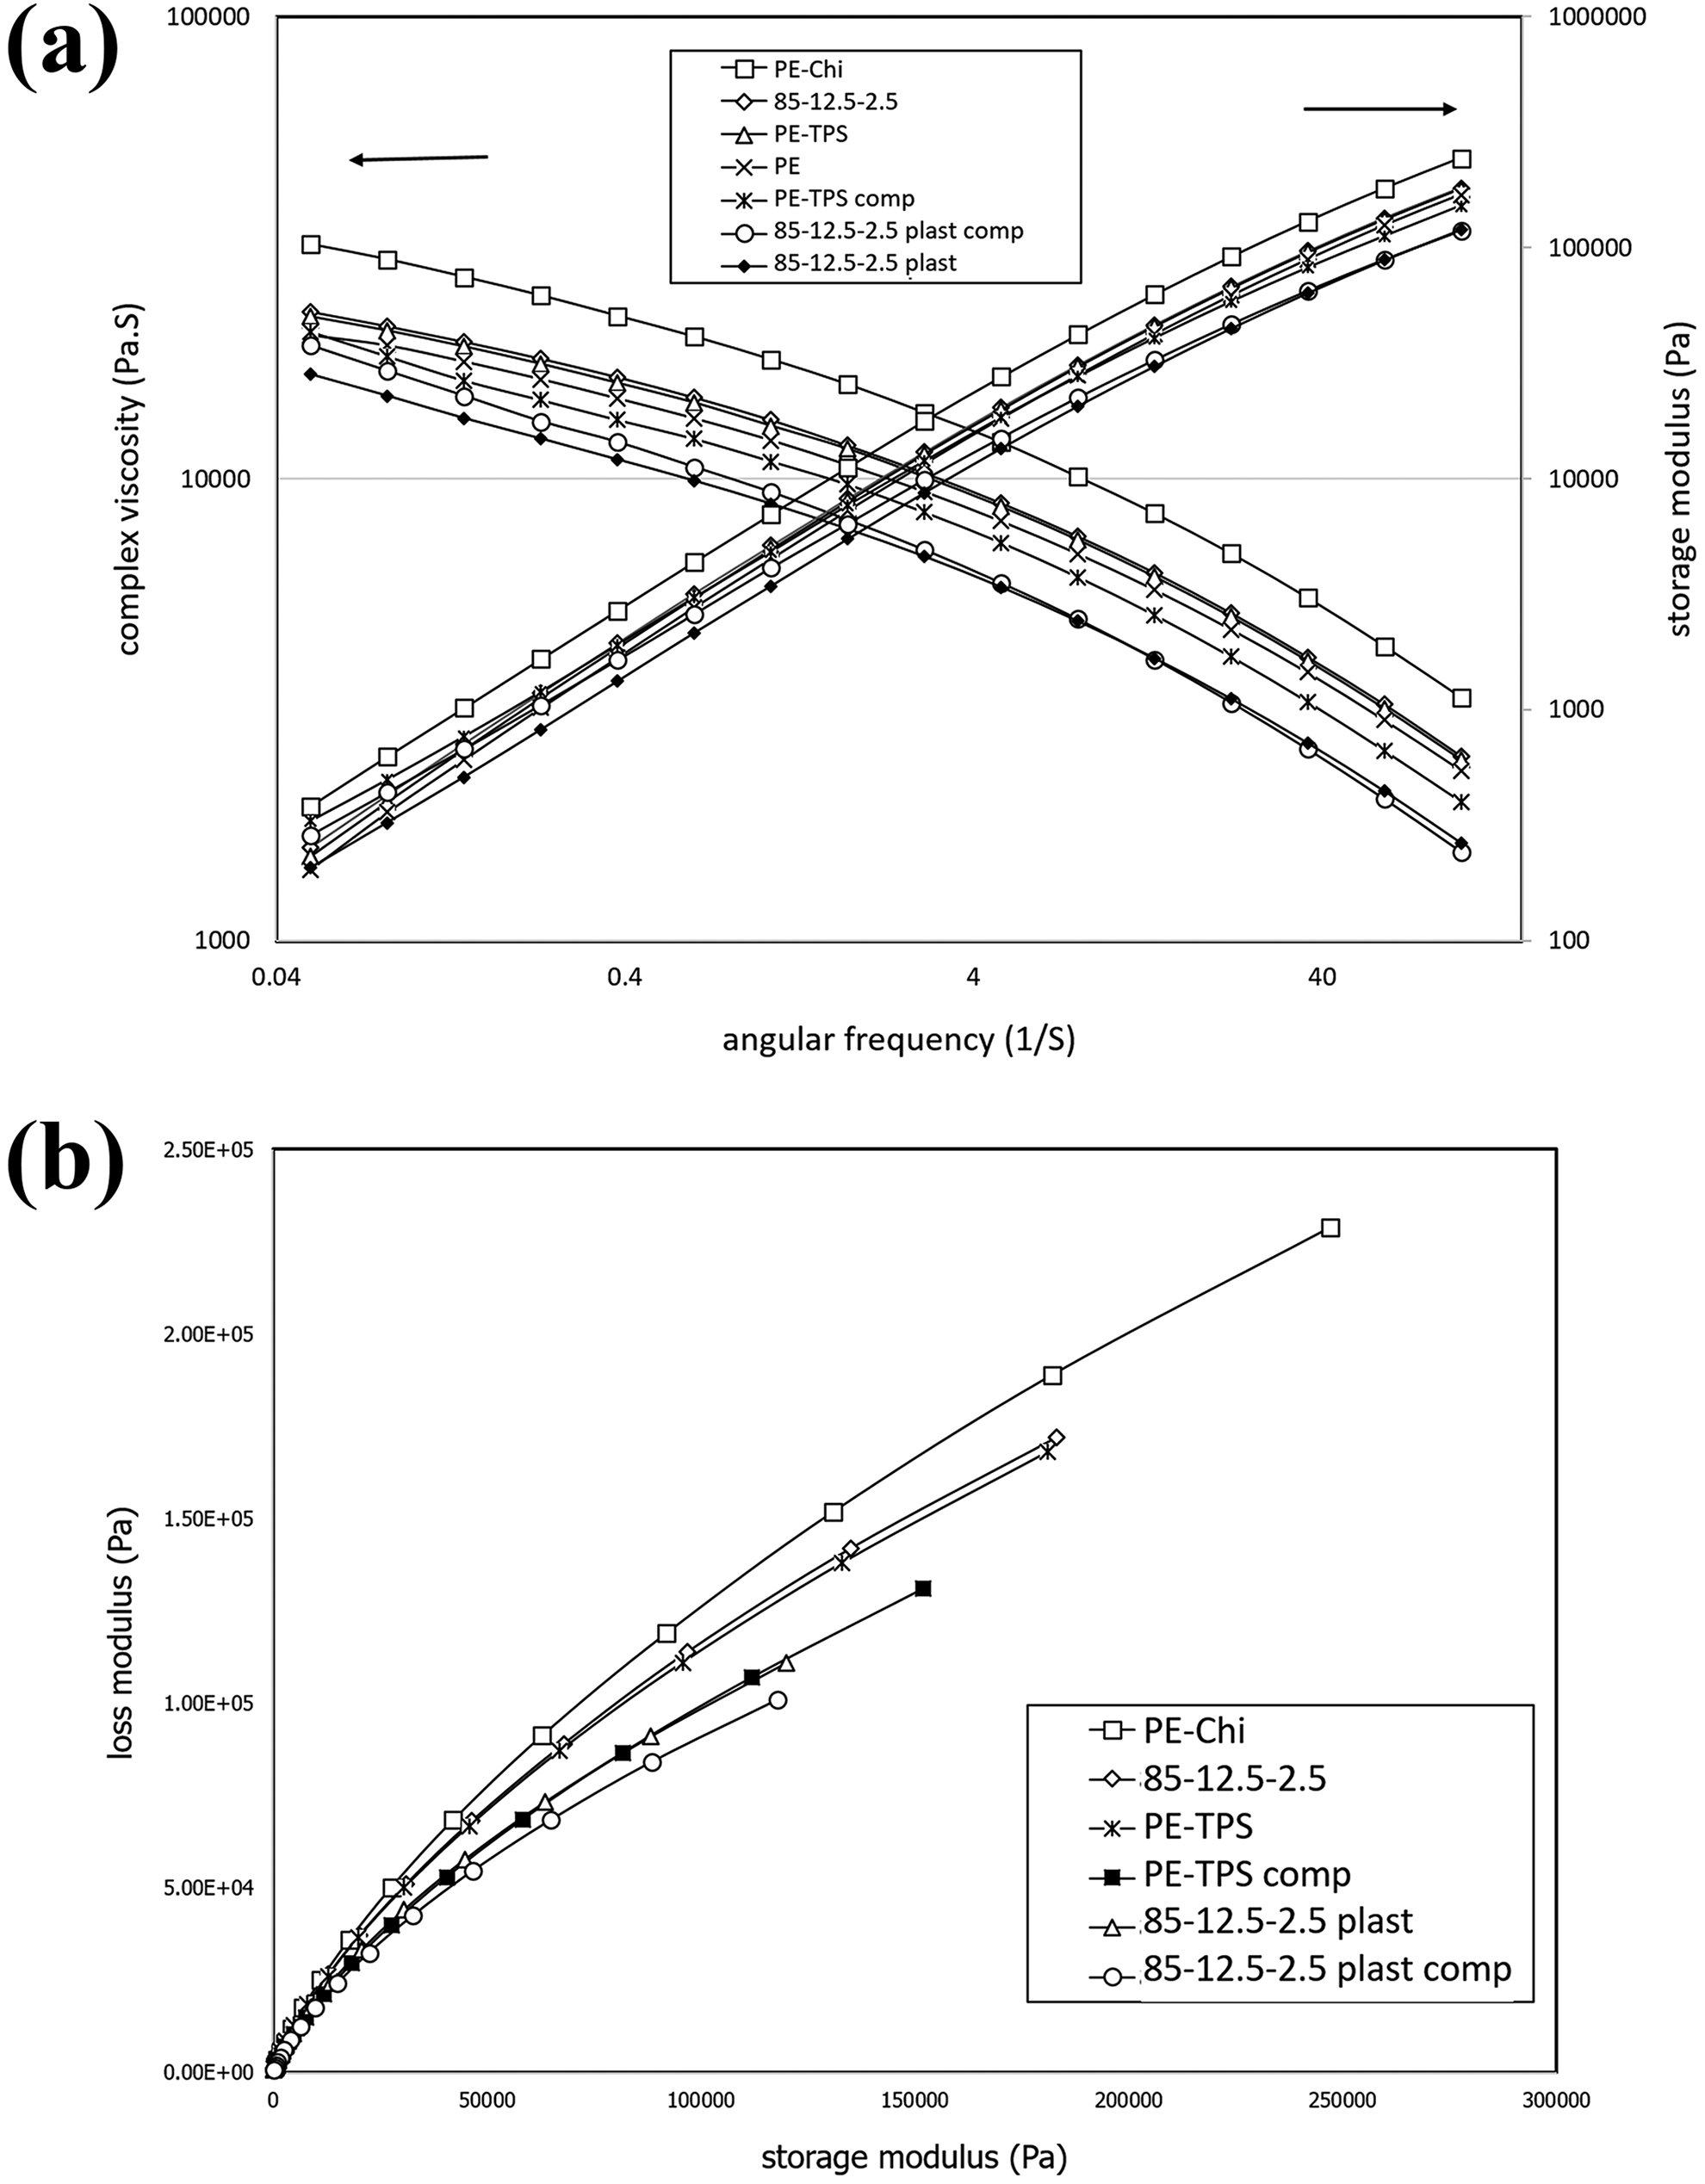
(a) Complex viscosity and storage modulus versus angular frequency diagrams for PE/chitosan 85-15, PE/TPS/chitosan 85-12.5-2.5, PE/TPS 85-15, PE, PE/TPS/PE-g-MA 80-15-5, PE/TPS/plasticized chitosan/PE-g-MA 80-12.5-2.5-5, PE/TPS/plasticized chitosan 85-12.5-2.5 and (b) Cole–Cole diagrams of PE/TPS/chitosan blends.
As it can be observed in Figure 3(a), all samples show shear thinning behavior due to the chains disentanglement and alignment in the flow direction during the shear force conduction. The results reveal that the blend containing 15 wt% chitosan has the highest complex viscosity, which may be attributed to the solid particles effect of uncompatibilized chitosan in PE matrix. 17 The same trend is expected for the blends containing TPS. 19 By decreasing the chitosan content from 15 wt% to 7.5 wt% and increasing TPS content, the complex viscosity is decreased, which can be related to the increase in glycerol plasticizer content, as well as the lower physical entanglement effect of TPS compared with chitosan on PE chains. 20 Furthermore, this trend is evident for samples containing 2.5 wt% chitosan. The complex viscosity in samples containing plasticized chitosan (85-12.5-2.5 plasticized and 85-14-1 plasticized) is lower than that in the blends containing unplasticized chitosan, due to the increase in glycerol content. Usually, by the addition of compatibilizer to a blend, due to increase in intermolecular interaction, the complex viscosity increases, but the unusual behavior that can be observed in Figure 3 is that the complex viscosity of compatibilized blends is lower than that of uncompatibilized blends. This behavior may be attributed to the higher MFI of PE-g-MA copolymer (3 g/10 min) compared with PE matrix (0.92 g/10 min).
Furthermore, Figure 3(a) depicts the storage modulus of PE/TPS/chitosan blends, in which PE/chitosan (85-15) blend has the highest storage modulus among the various blends. 17 To further investigate the blends compatibility, loss modulus (G″) versus storage modulus (G′) Cole–Cole diagrams 21 of the blends were plotted and depicted in Figure 3(b). According to this figure, PE-chitosan blend has the broadest arc, which represents its least phase compatibility and heterogeneous morphology. By decreasing chitosan content to 2.5 wt% and increasing the plasticized starch content in blends, the width of the arc decreases, which can be attributed to the blends’ homogeneous morphology, as well as plasticizing effect of glycerol, which decreases both storage and loss moduli. With further increase in glycerol content, the Cole–Cole arc becomes narrower (for “85-12.5-2.5 plast” sample in which both starch and chitosan are plasticized). The incorporation of PE-g-MA compatibilizer decreases the arc width further, which implies more homogeneous morphology for the compatibilized blends.
To fit the experimental data of the complex viscosity of the blends, Carreau–Yasuda model as an appropriate model for a wide range of shear rate is employed. If Cox–Mertz rule is applied to all samples, this model can be expressed as follows:

where
Carreau–Yasuda model parameters for various PE/TPS/chitosan blends.
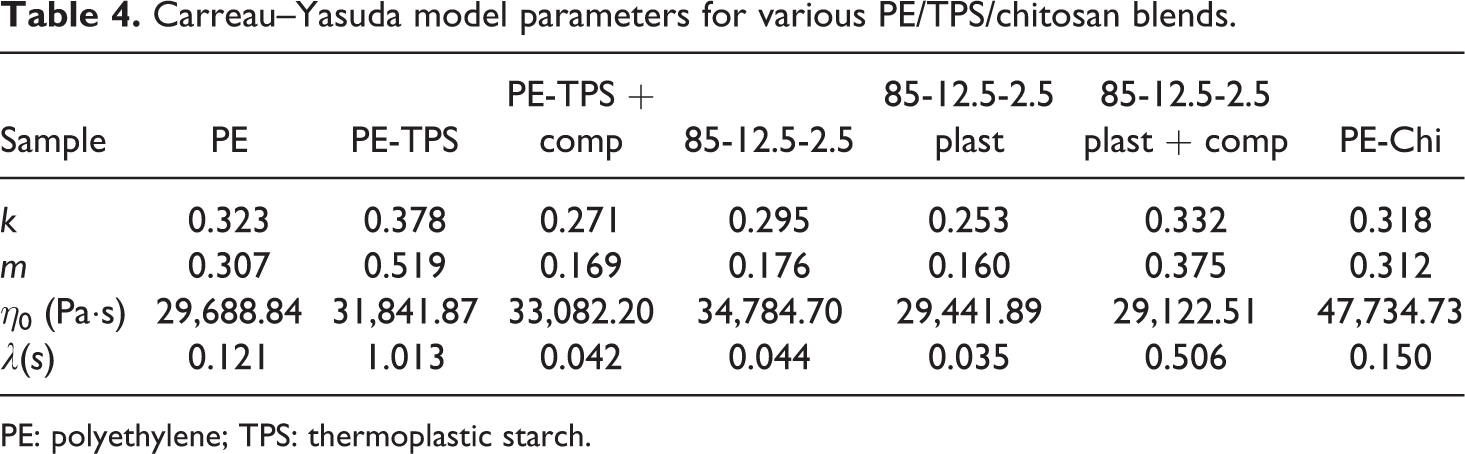
PE: polyethylene; TPS: thermoplastic starch.
Thermal properties
Figure 4 illustrates the DSC thermograms of PE/TPS/chitosan blends, and the results are presented in Table 5. Total degree of crystallinity (%X c) consists of two different issues. The first is nucleating effect, and the second is crystal growth. The effect of nucleating agents on %X c can be determined from crystallization onset temperature. According to results of T onset at Table 5, there is no significant change between onset temperature (less than 1°C) of PE and all samples containing TPS and plasticized chitosan phases. This can be due to the fact that plasticized starch or plasticized chitosan forms a separated phase from PE matrix; therefore, they cannot act as nucleating agents for PE chains. However, in the sample 85-12.5-2.5, in which unplasticized chitosan is added to the PE matrix, one can see that the onset temperature rises approximately up to 2°C; therefore, unplasticized chitosan can act as a nucleating agent. The curves of relative crystallinity versus time or temperature clearly show this effect. The growth of PE crystals is dependent on the interface of PE and TPS as well as chitosan. According to the results of Table 5, with the addition of 15 wt% TPS, the degree of crystallinity is decreased from 28.61% for PE sample to 20.77% for PE/TPS blend. Possible reason for this behavior may be as follows. First, the presence of TPS in PE matrix hinders the molecular motion of PE and also decreases the nucleus density. Other probable explanation can be related to the interfacial interaction between TPS-dispersed phase and PE matrix, which limits PE chains’ entrance into the crystal lamella and leads to a decrease in the PE/TPS blend crystallinity. With the incorporation of PE-g-MA compatibilizer to PE/TPS blend, PE crystallinity increases slightly compared with the uncompatibilized PE/TPS blend, due to the trans-crystallization of PE crystals in the interface of PE and TPS phases, and as a result, PE crystal growth could be enhanced in the interface of PE, PE-g-MA, and TPS phases. 13 With the incorporation of 2.5 wt% chitosan to PE/TPS blend, the degree of crystallinity increases from 20.77% for PE/TPS to 27.38% for PE/TPS/chitosan 85-12.5-2.5 blend, which may be attributed to the nucleating effect of chitosan particles. 23 By plasticizing the chitosan and addition of PE-g-MA compatibilizer, a slight increase in crystallinity is observed, which can be resulted from the improved interfacial adhesion as well as trans-crystallization phenomena. This effect is not observed at a higher chitosan content, regarding their agglomeration in the PE matrix. With the addition of TPS in PE matrix, melting temperature increases from 126.15°C to 127.4°C, due to higher heat capacity of starch. The presence of chitosan further increases the melting temperature up to 129.23°C, which can be attributed to higher heat capacity of chitosan compared with starch. Crystallization temperature of PE is 106.06°C and does not change significantly with the addition TPS and plasticized chitosan. A major change in T c occurred upon the addition of unplasticized chitosan in which the crystallization temperature rose approximately by 2°C, due to nucleating effect of unplasticized chitosan.
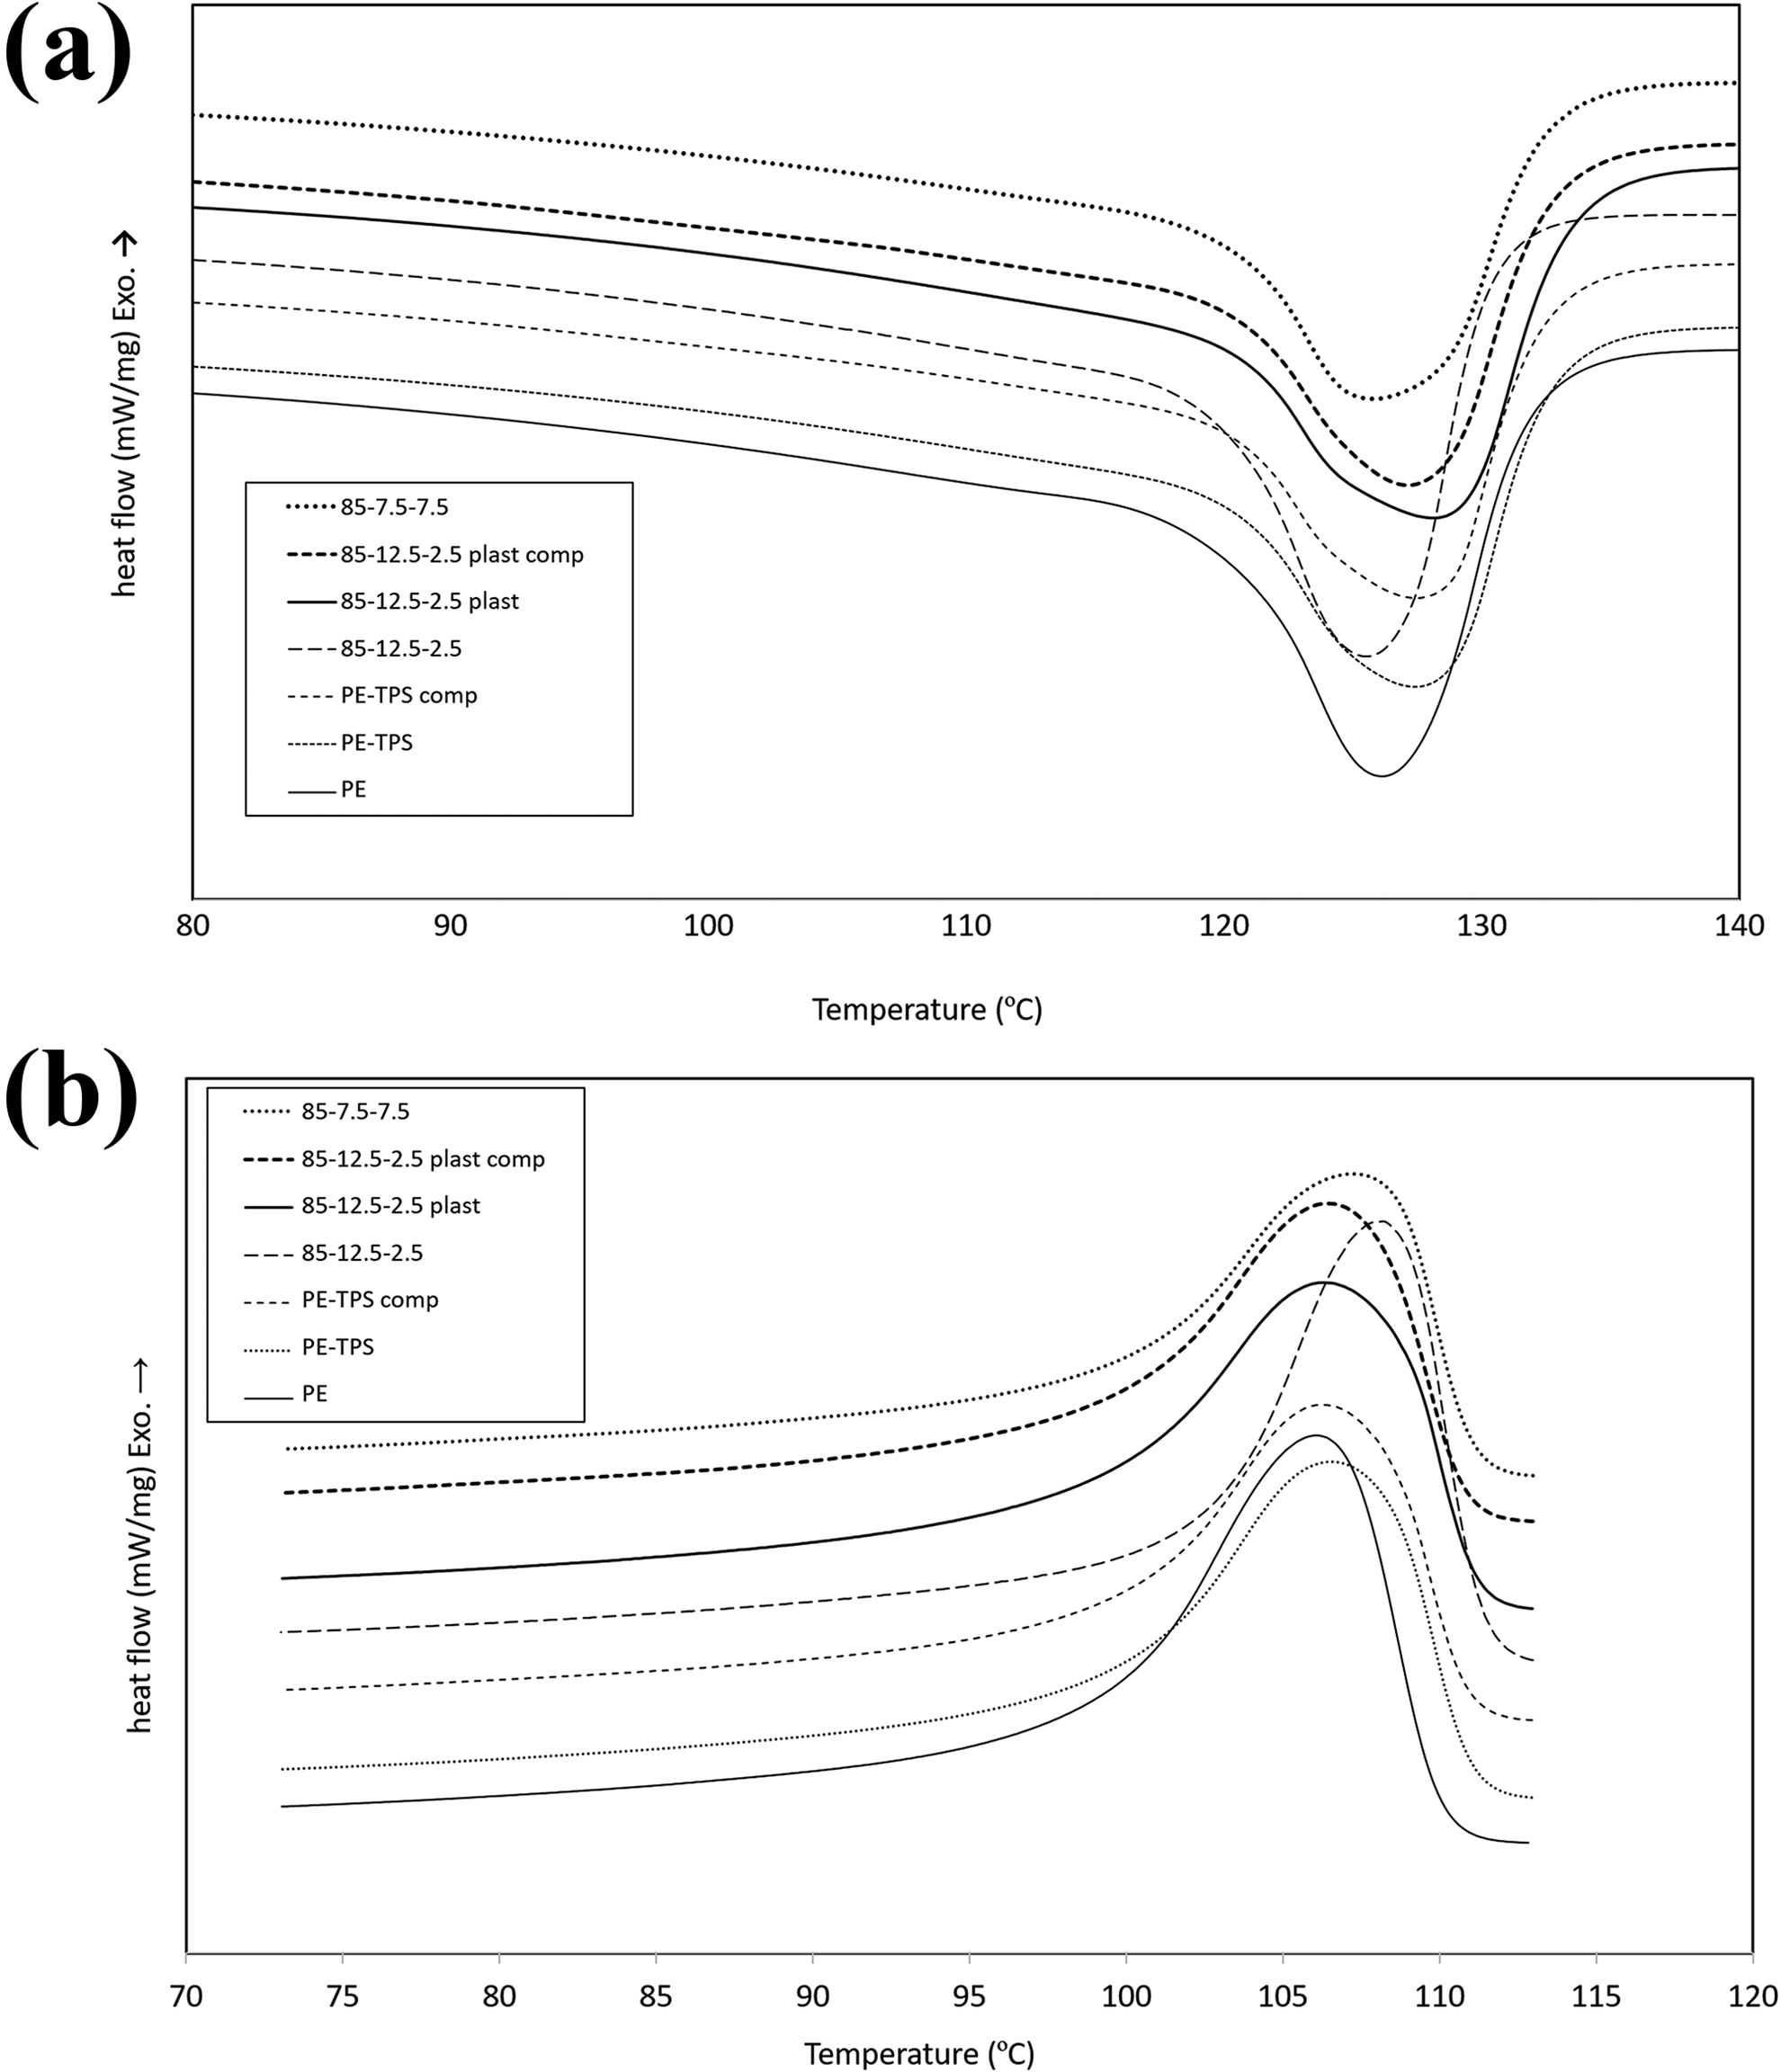
DSC thermograms of various PE/TPS/chitosan blends, (a) second heating and (b) first cooling cycles.
X c, T c(onset), T c, T 90%, and t 1/2 for various PE/TPS/chitosan blends.
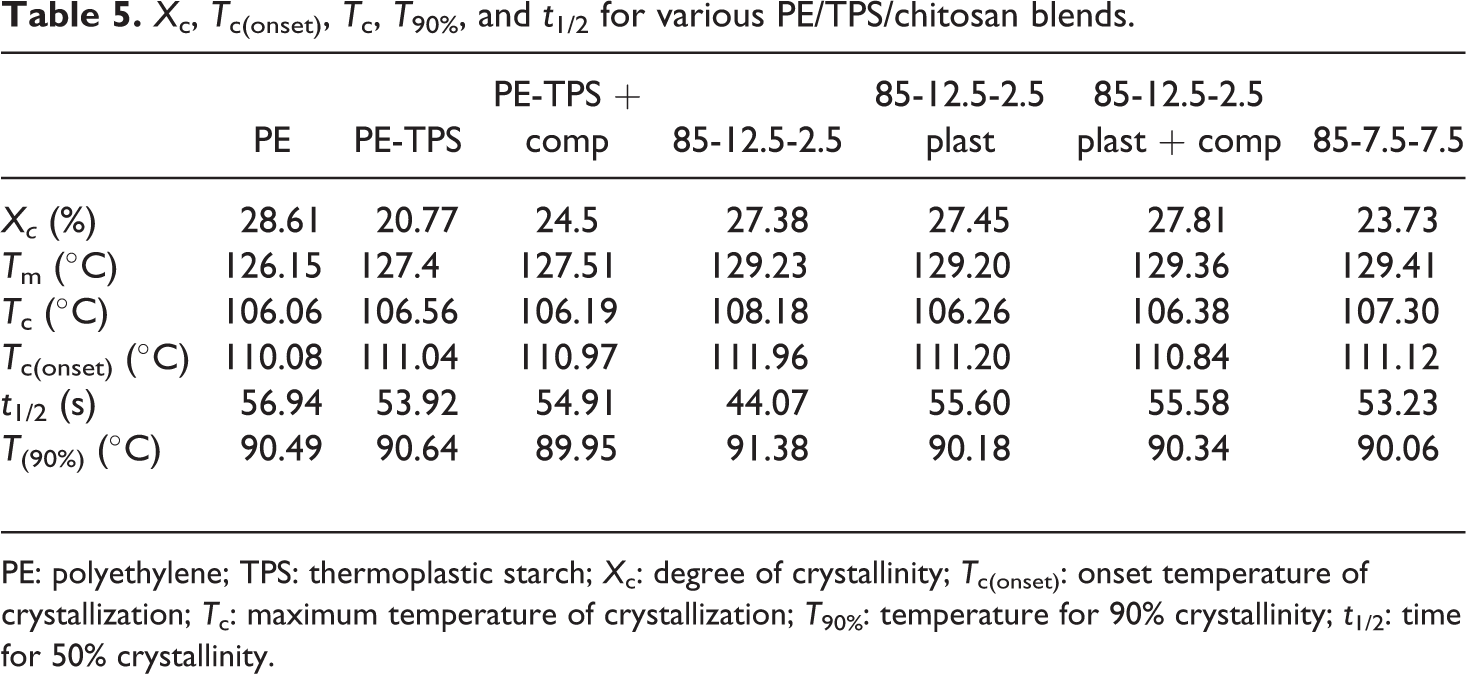
PE: polyethylene; TPS: thermoplastic starch; X c: degree of crystallinity; T c(onset): onset temperature of crystallization; T c: maximum temperature of crystallization; T 90%: temperature for 90% crystallinity; t 1/2: time for 50% crystallinity.
Development of relative crystallinity with time and temperature, which is presented in Figure 5, indicates that the addition of TPS, plasticized chitosan, and PE-g-MA copolymer has no significant effect on the evolution of the crystallization, except in PE/TPS/chitosan “85-12.5-2.5” sample, in which the crystallization process initiates earlier than that in the other samples. As mentioned before, this behavior may be originated from the nucleating effect of chitosan for PE crystals.
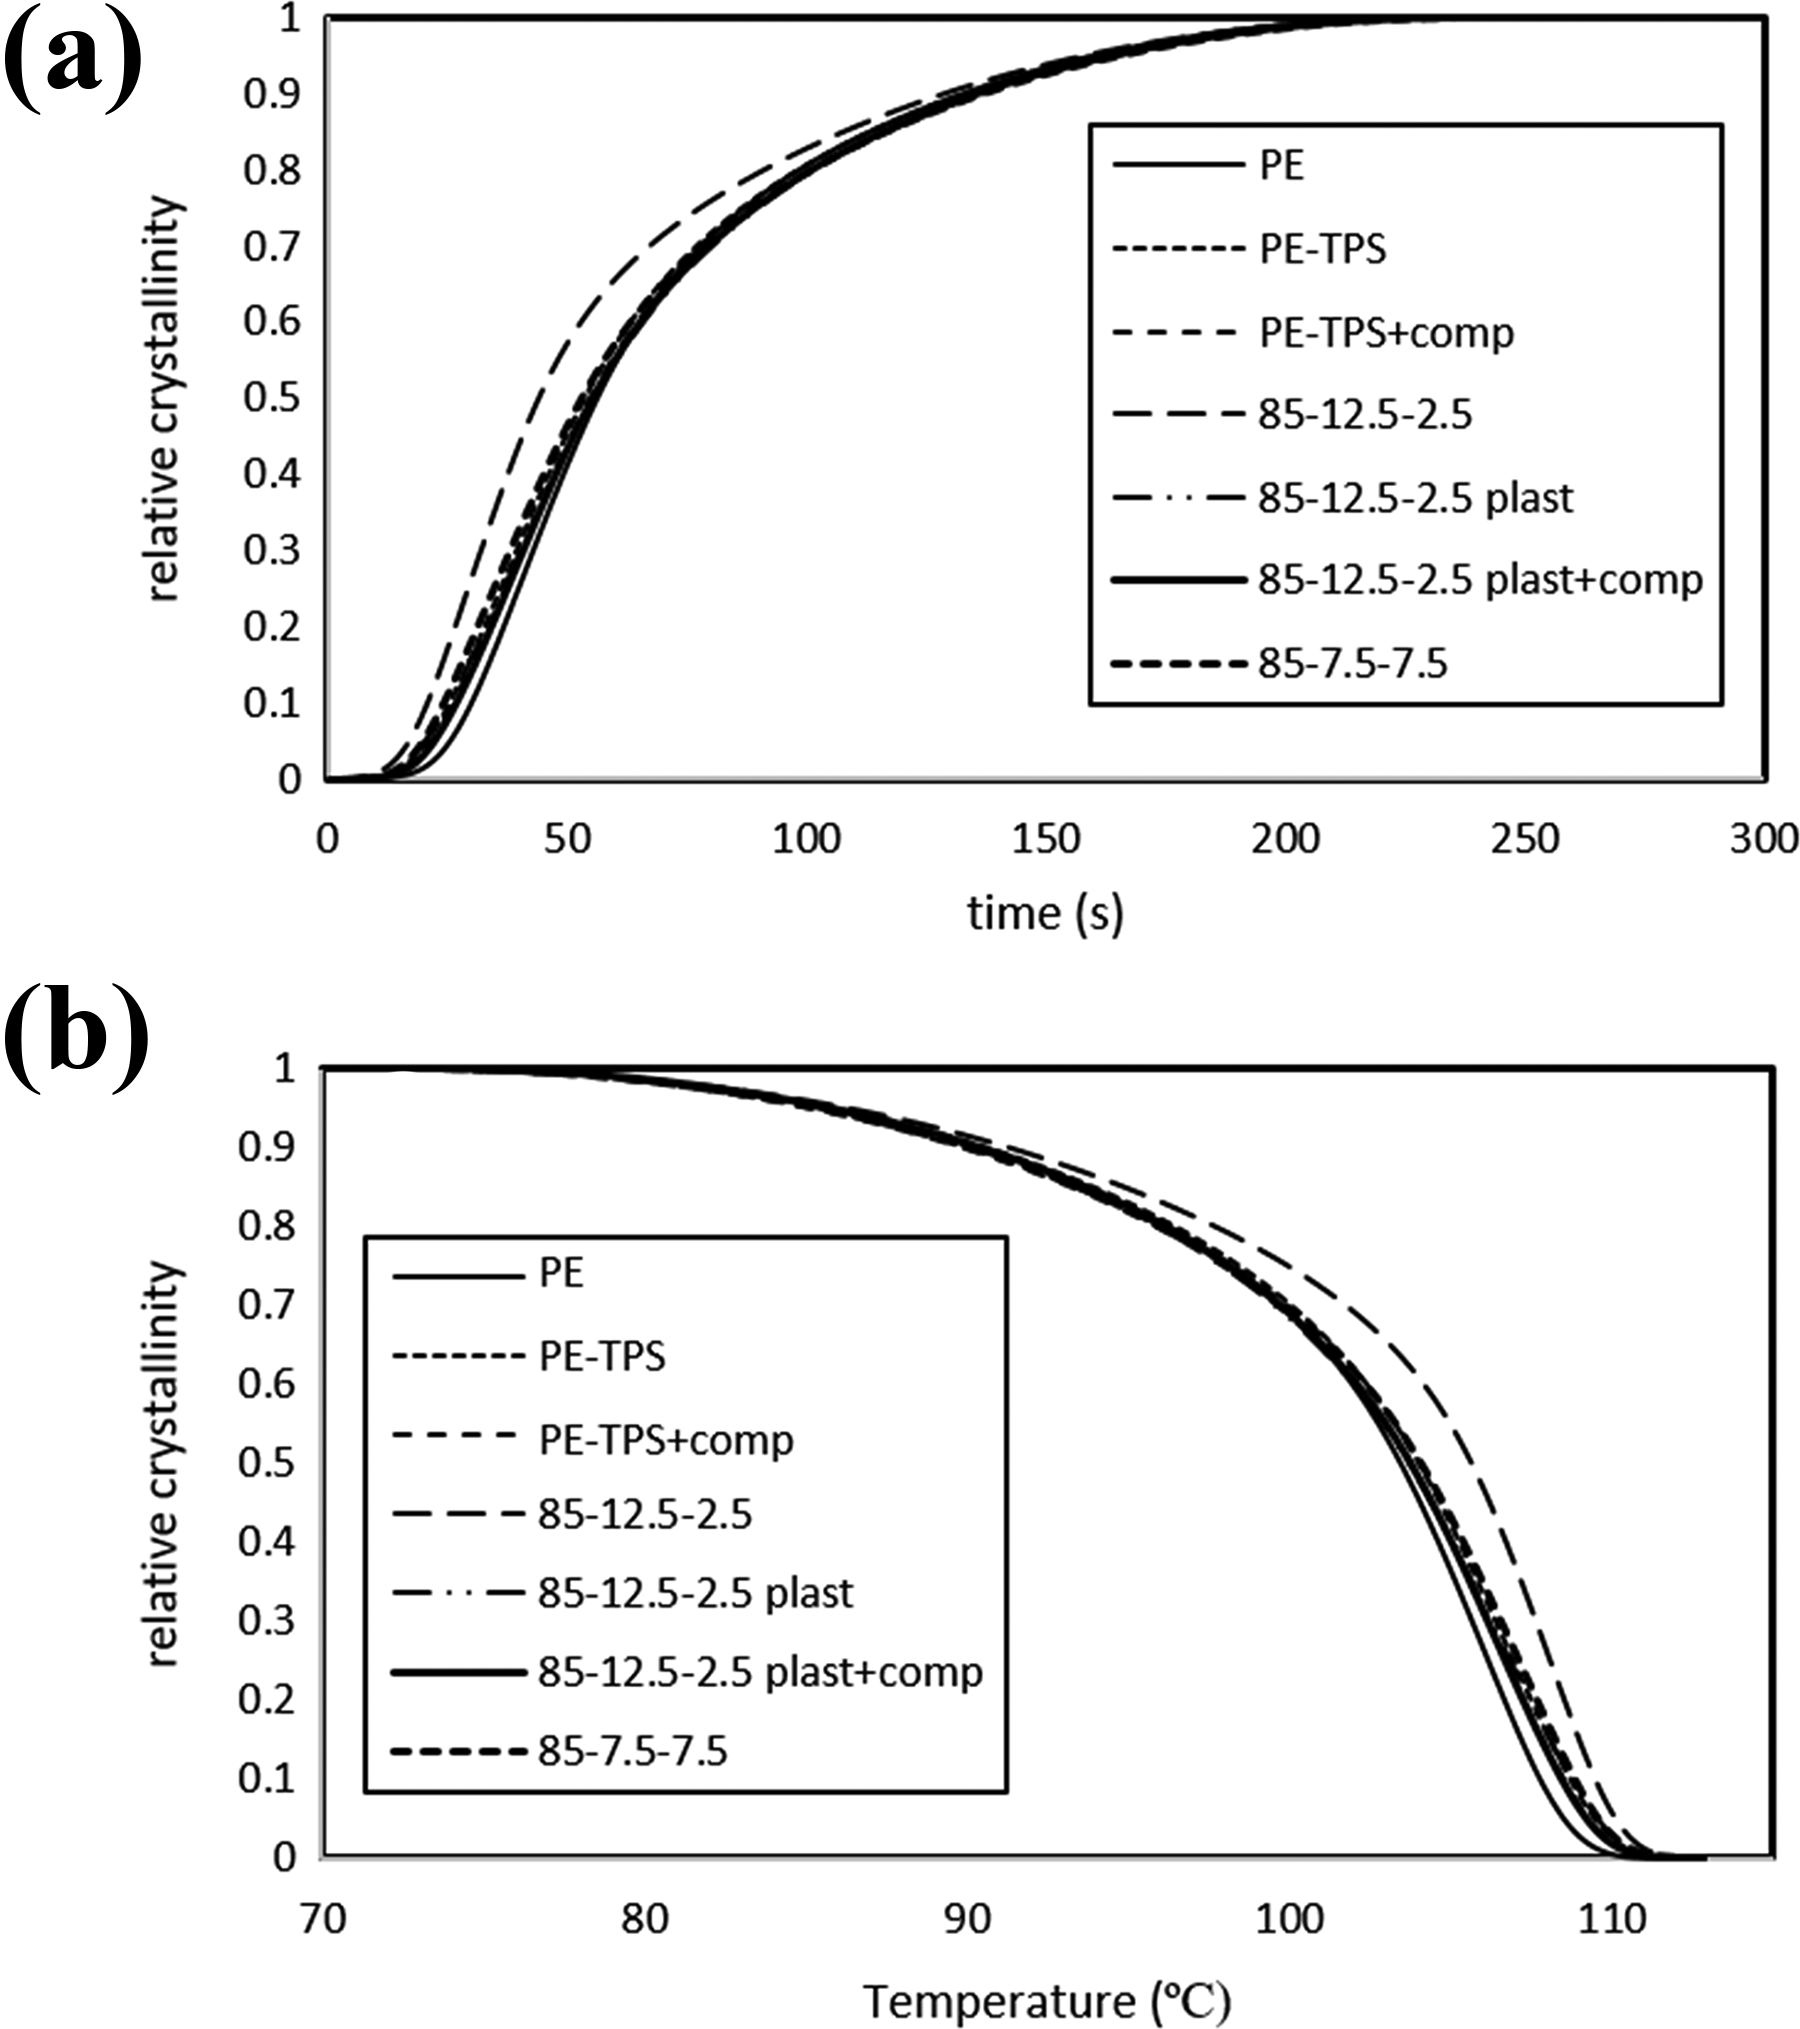
Relative crystallinity evolution of various PE/TPS/chitosan blends versus, (a) time and (b) temperature in cooling cycle.
Contact angle measurements
Table 6 represents the contact angle, surface tensions, and polar and dispersive components of various PE/TPS/chitosan blends. PE has water contact angle of 94.94°, which originates from its hydrophobic characteristics. The addition of TPS to PE decreases the blend contact angle to 74.28° due to hydrophilicity of starch and glycerol. The addition of PE-g-MA copolymer to PE/TPS blend decreases its water contact angle to 57.29°, which is originated from higher hydrophilicity of MA. 24 Chitosan is less hydrophilic than starch; therefore, in PE/TPS/chitosan “85-12.5-2.5” sample, the contact angle is reduced to 81.2°. By plasticizing chitosan and increasing its hydrophilic glycerol content, the contact angle value decreases to 77.9°, and the incorporation of PE-g-MA copolymer decreases that to 63.61°. 25
Contact angles, surface tensions, and their polar and dispersive components of various PE/TPS/chitosan blends.
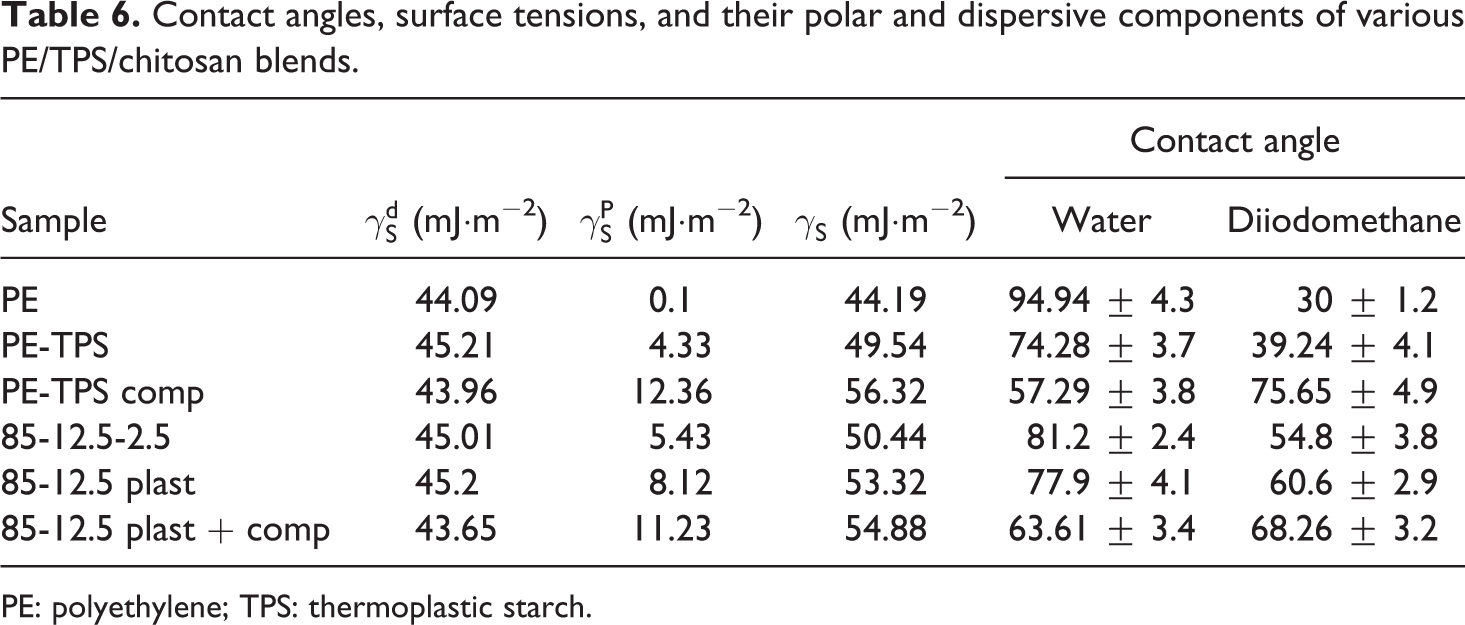
PE: polyethylene; TPS: thermoplastic starch.
The results of the surface tension and its components for various blends in Table 6 reveal that there is no significant change in
Antibacterial activity
Table 7 represents the antibacterial activity of PE/TPS/chitosan blends. These results indicate that PE has no significant effect on population growth of bacteria; however, the presence of starch in PE/TPS blend as a food source increases the bacteria population. Addition of PE-g-MA compatibilizer to PE/TPS blend significantly decreases the bacteria population, due to the antibacterial characteristics of maleic anhydride. PE/TPS blends containing chitosan similarly show antibacterial activity, which may be attributed to its antibacterial properties. Addition of PE-g-MA along with chitosan significantly controls the population growth of bacteria after 48 h.
Assessment of bacteria growth in the presence of various PE/TPS/chitosan blends.
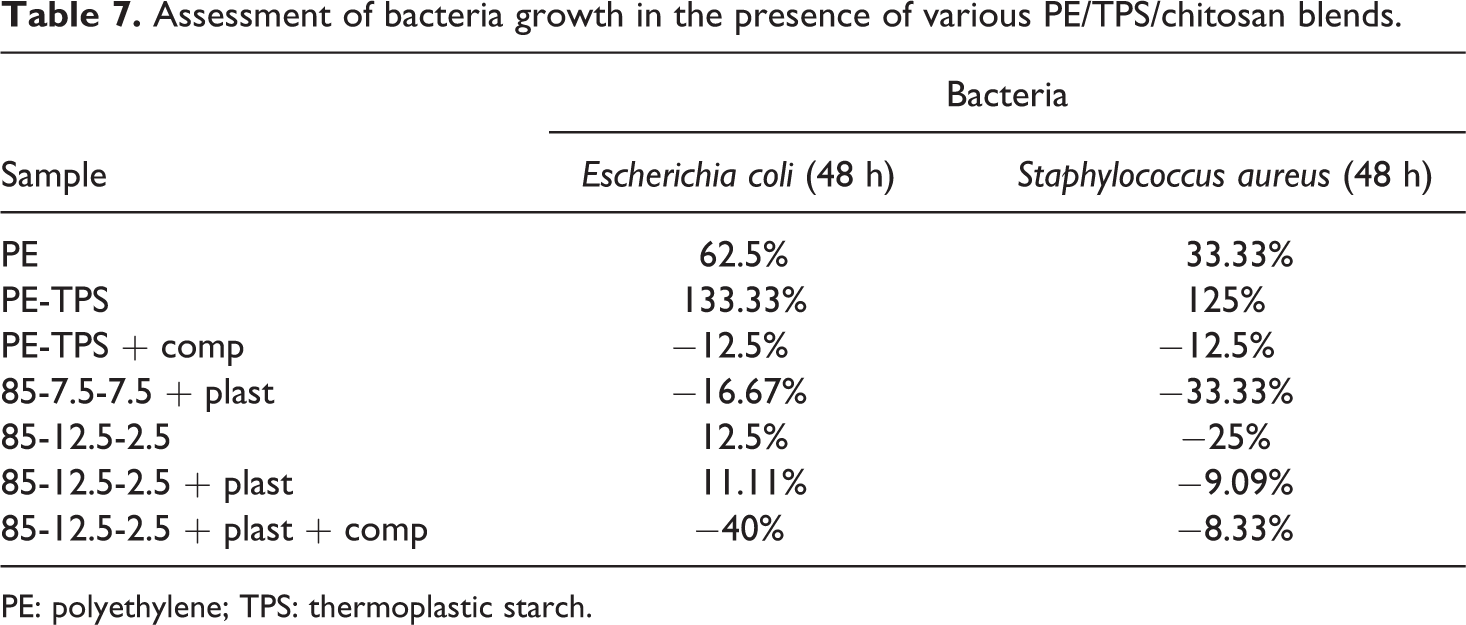
PE: polyethylene; TPS: thermoplastic starch.
Chemical analysis of UV-exposed samples
Infrared spectroscopy was performed to determine the changes in the chemical microstructure of the samples prior and after 2 month of UV exposure (illustrated in Figure 6). To obtain quantitative information on the effect of UV exposure on the chemical microstructure of the samples, carbonyl index of the blends was determined before and after UV exposure using the following expression 26 :
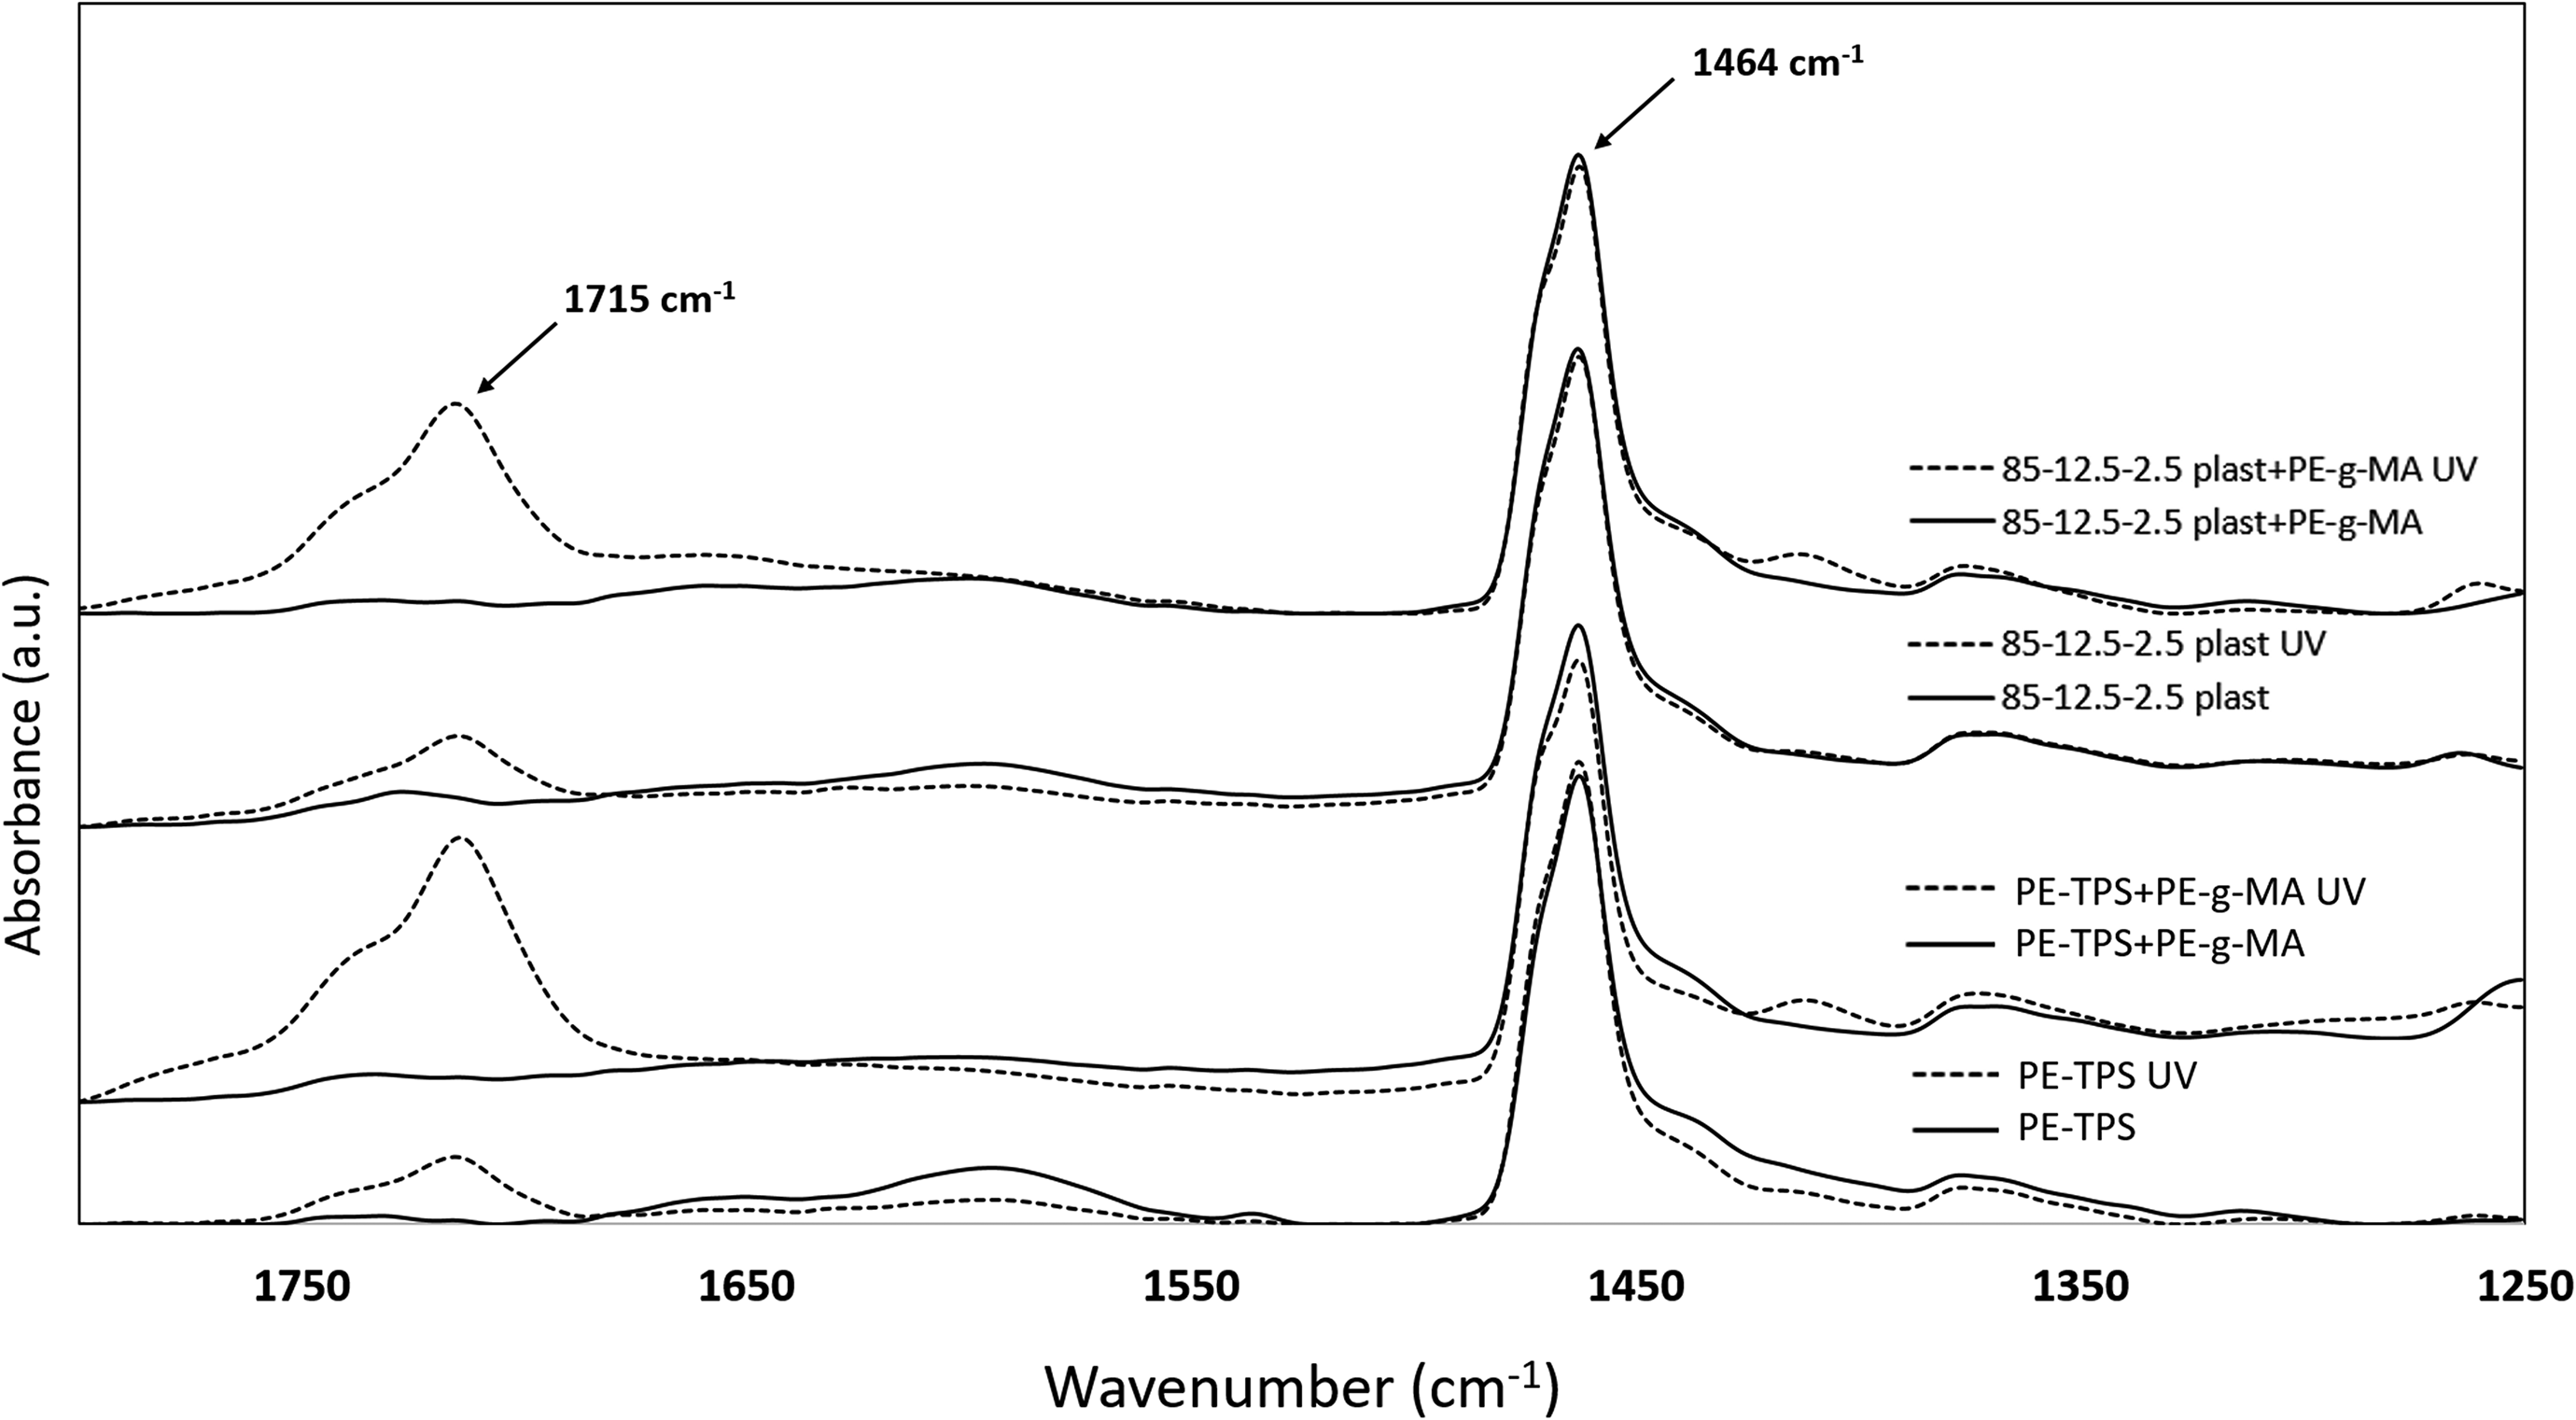
FTIR spectra of neat and UV-exposed samples of typical PE/TPS/chitosan blends.

Table 8 represents the changes in the carbonyl index of samples before and after UV exposure. According to these results, even before UV exposure, all the samples show a small trace of carbonyl groups, which can be attributed to degradation during the implementation. However, UV exposure significantly increases the carbonyl content of the samples. During UV exposure, the carbonyl index of PE increased from 0.018% to 0.026%. At the initial stages of photodegradation, the two important aspects are UV radiation and oxidizing agents. Figure 7(a) illustrates a summarized photooxidation mechanism of PE. UV exposure leads to the formation of radicals, which absorb oxygen and form hydroperoxides to create carbonyl groups (visible in 1715 cm−1 of FTIR spectra). In case of the incidence of Norrish type I and II degradation or both, additional peaks can be observed in FTIR spectra of the samples. However, after a specified period of UV exposure and dissociation of PE chains, it becomes possible for microorganisms to decompose the low–molecular-weight PE chains and produce CO2 and water as the final products. 27 The presence of starch as a biodegradable additive in PE matrix may synergistically increase the degradation rate of microstructure, as the increase in carbonyl index after UV exposure is increased from 76.47% to 517.52%. The addition of PE-g-MA copolymer not only improves the mechanical properties of blends but also positively affects the biodegradability of the blends by a significant increase in confidence interval (CI) from 517.52% for PE-TPS to 5939.27% for compatibilized PE-TPS sample. This behavior can be attributed to the unstable nature of MA against the UV exposure, which alongside of its own degradation leads to PE dissociation by generating free radicals to attack PE chains. 28 The remarkable results are obtained from FTIR analysis for the samples containing chitosan, in which CI is declined from 517.52% in PE-TPS blend to 321.24% in 85-12.5-2.5 plast sample. This finding can be attributed to higher dissociation energy required for the degradation of chitosan compared with the other components that protect PE/TPS blends from further photooxidation. However, the presence of MA in the compatibilized 85-12.5-2.5 plast sample shows the combined effects of chitosan UV resistance and maleic anhydride UV vulnerability, where the increase in CI value (between compatibilized PE/TPS and 85-12.5-2.5 plast samples) is 1384.1%.
Carbonyl index of various PE/TPS/chitosan blends before and after UV exposure.
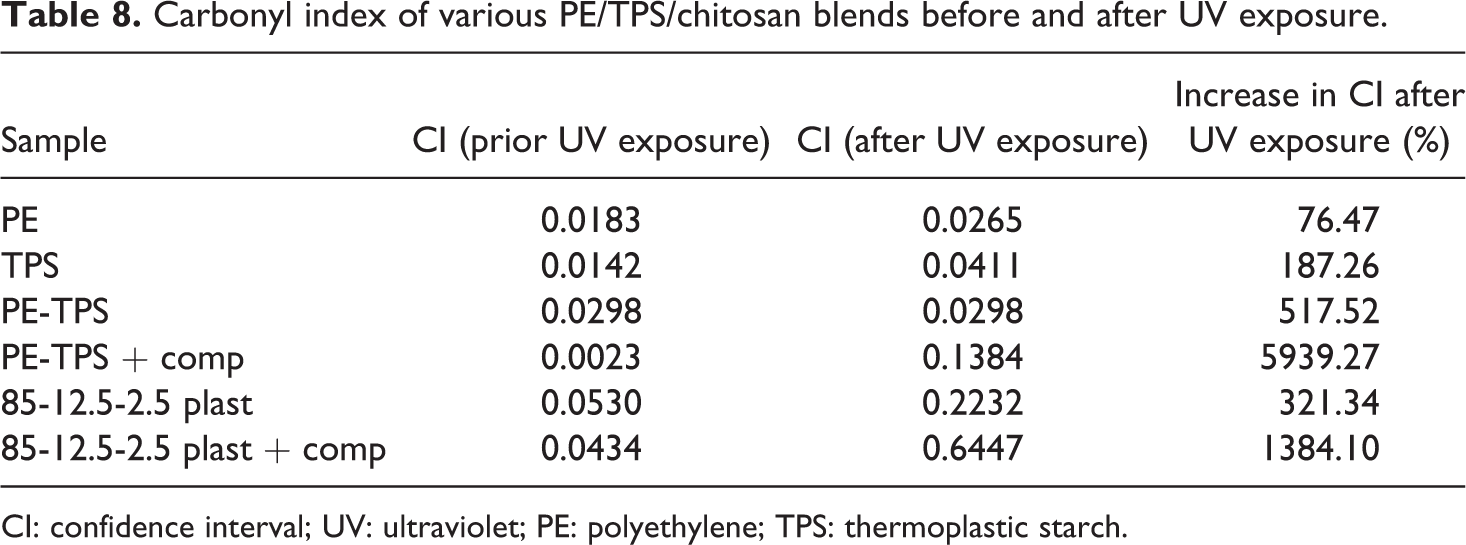
CI: confidence interval; UV: ultraviolet; PE: polyethylene; TPS: thermoplastic starch.
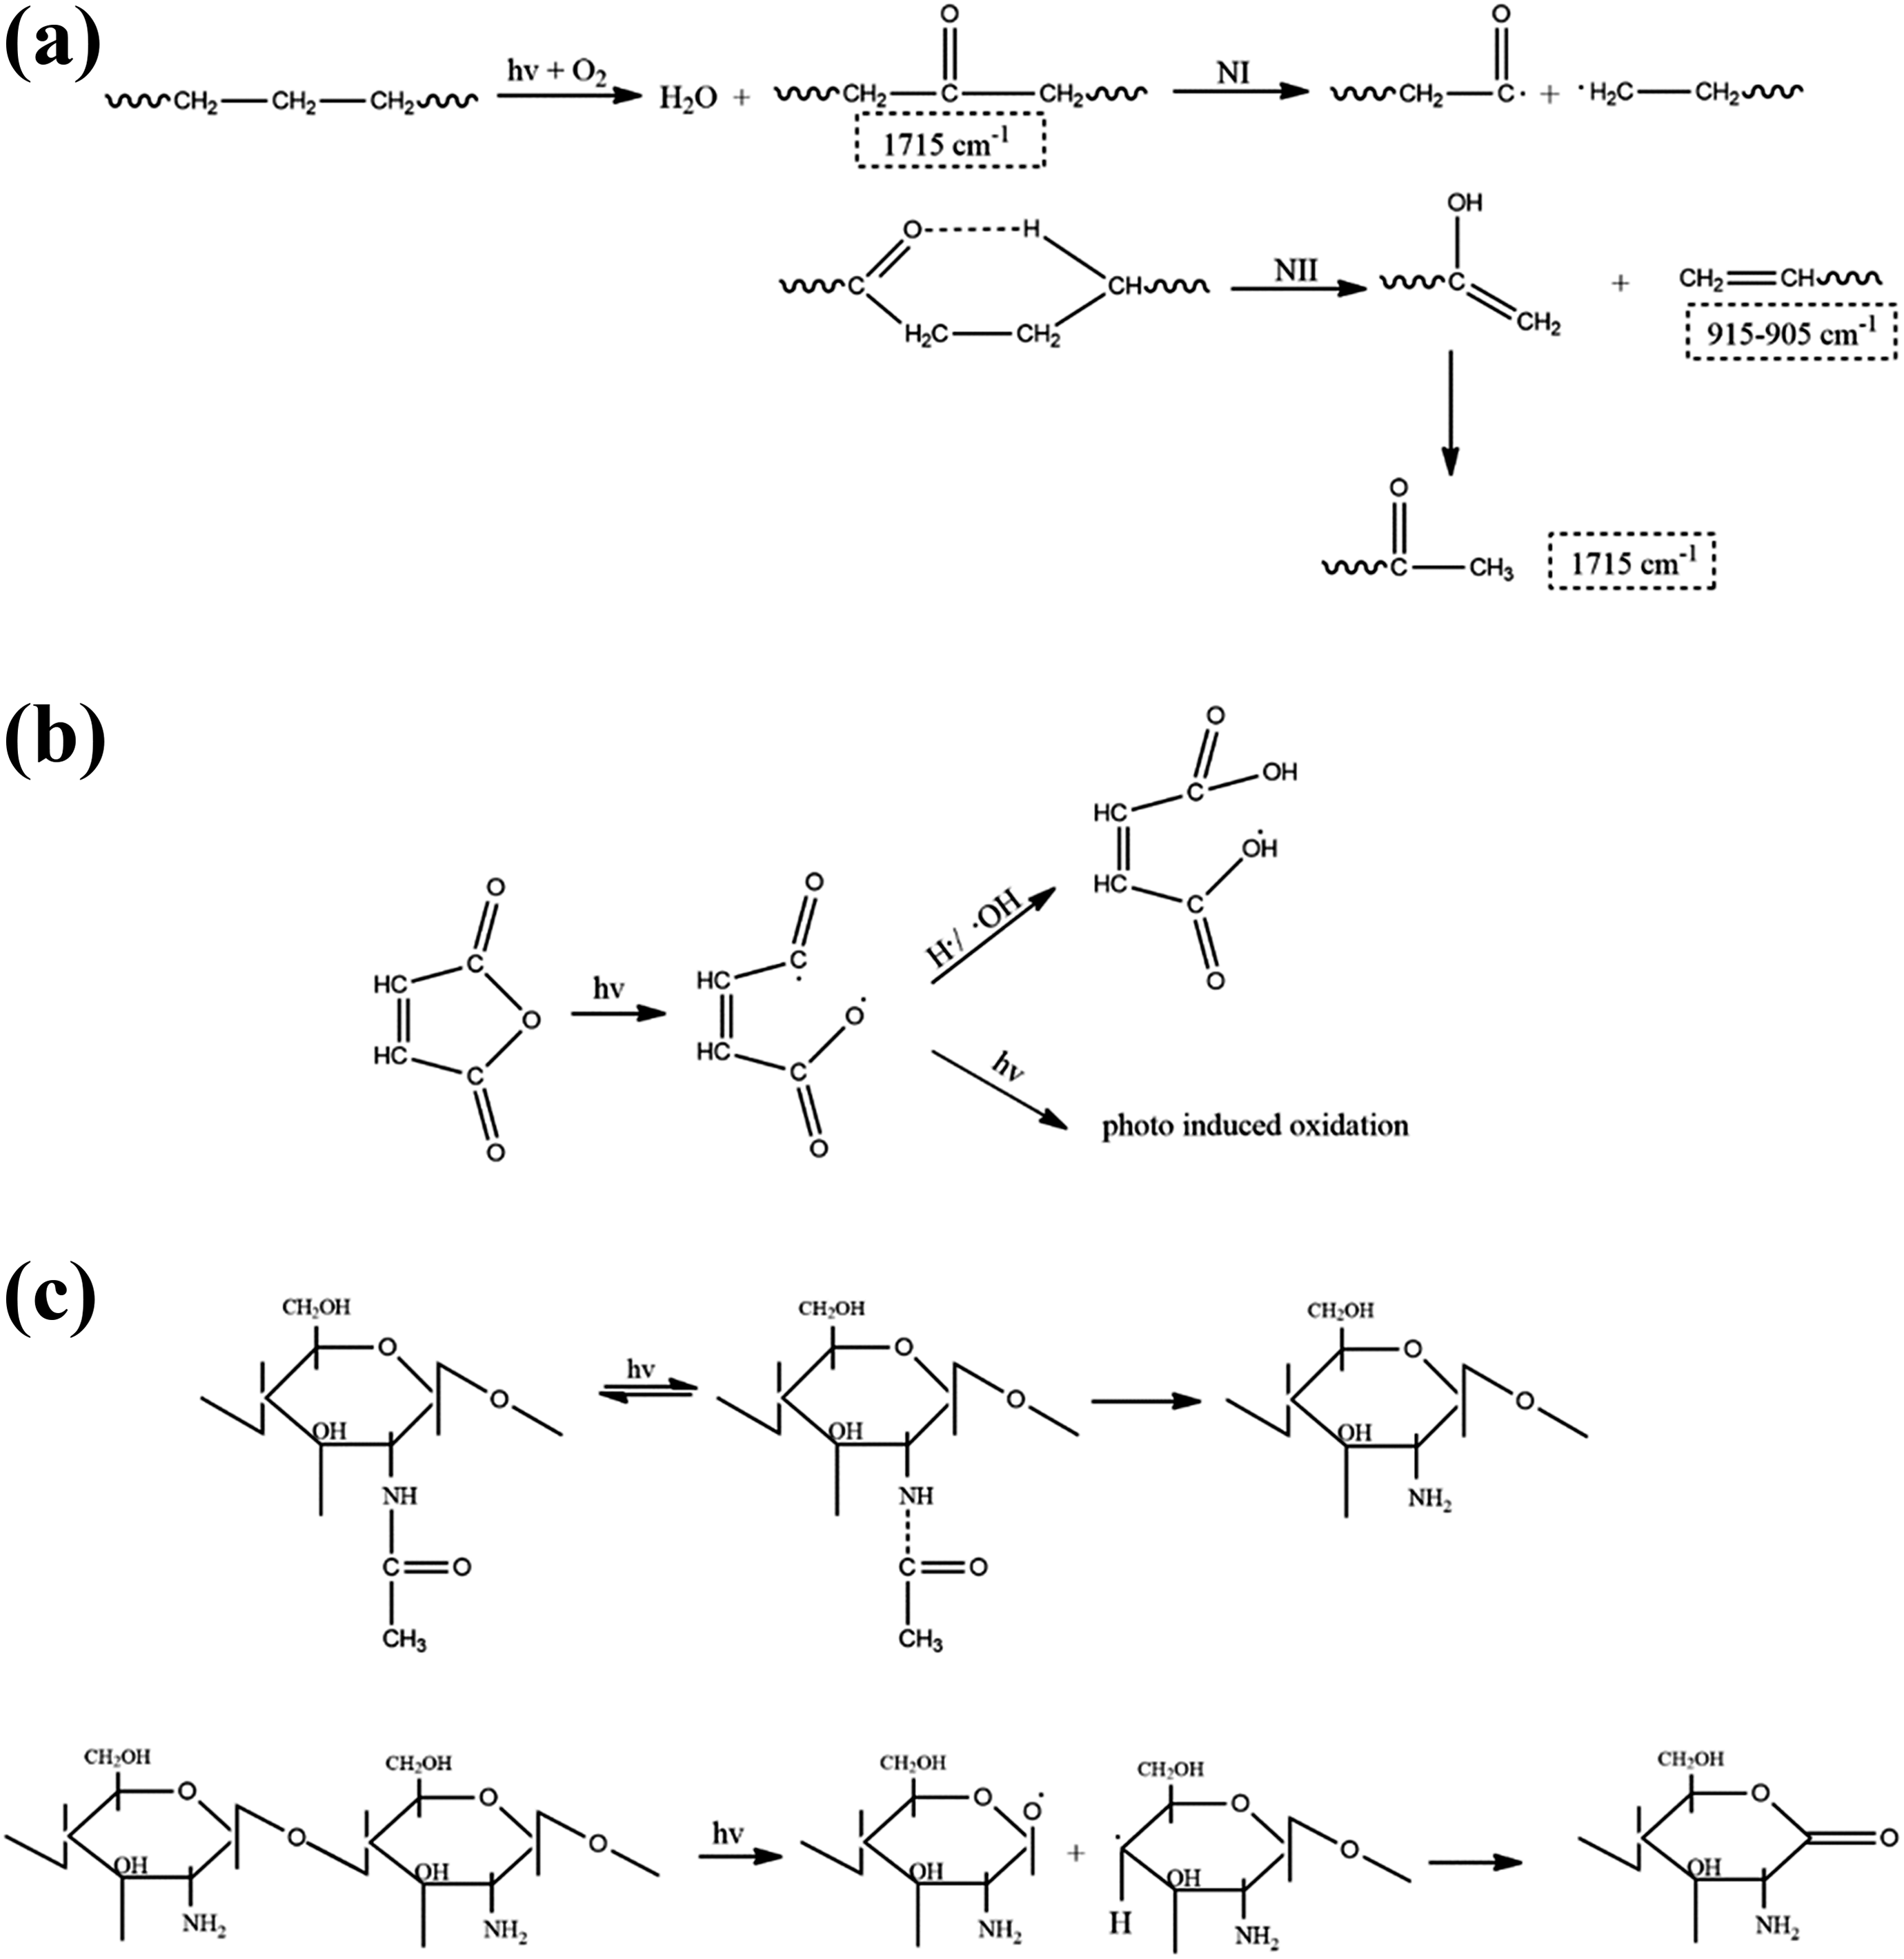
Proposed photodegradation mechanisms for (a) PE, (b) maleic anhydride, and (c) chitosan.
Mechanical properties before and after UV exposure
The tensile mechanical properties of various PE/TPS/chitosan blends are summarized in Figure 8. These results reveal that the presence of starch phase in PE matrix decreases the tensile strength. This behavior can be related to the fact that there is no proper adhesion between PE and starch phases, and the stress during the mechanical test is transferred to PE matrix; thus, PE/TPS yields and breaks in lower stresses.
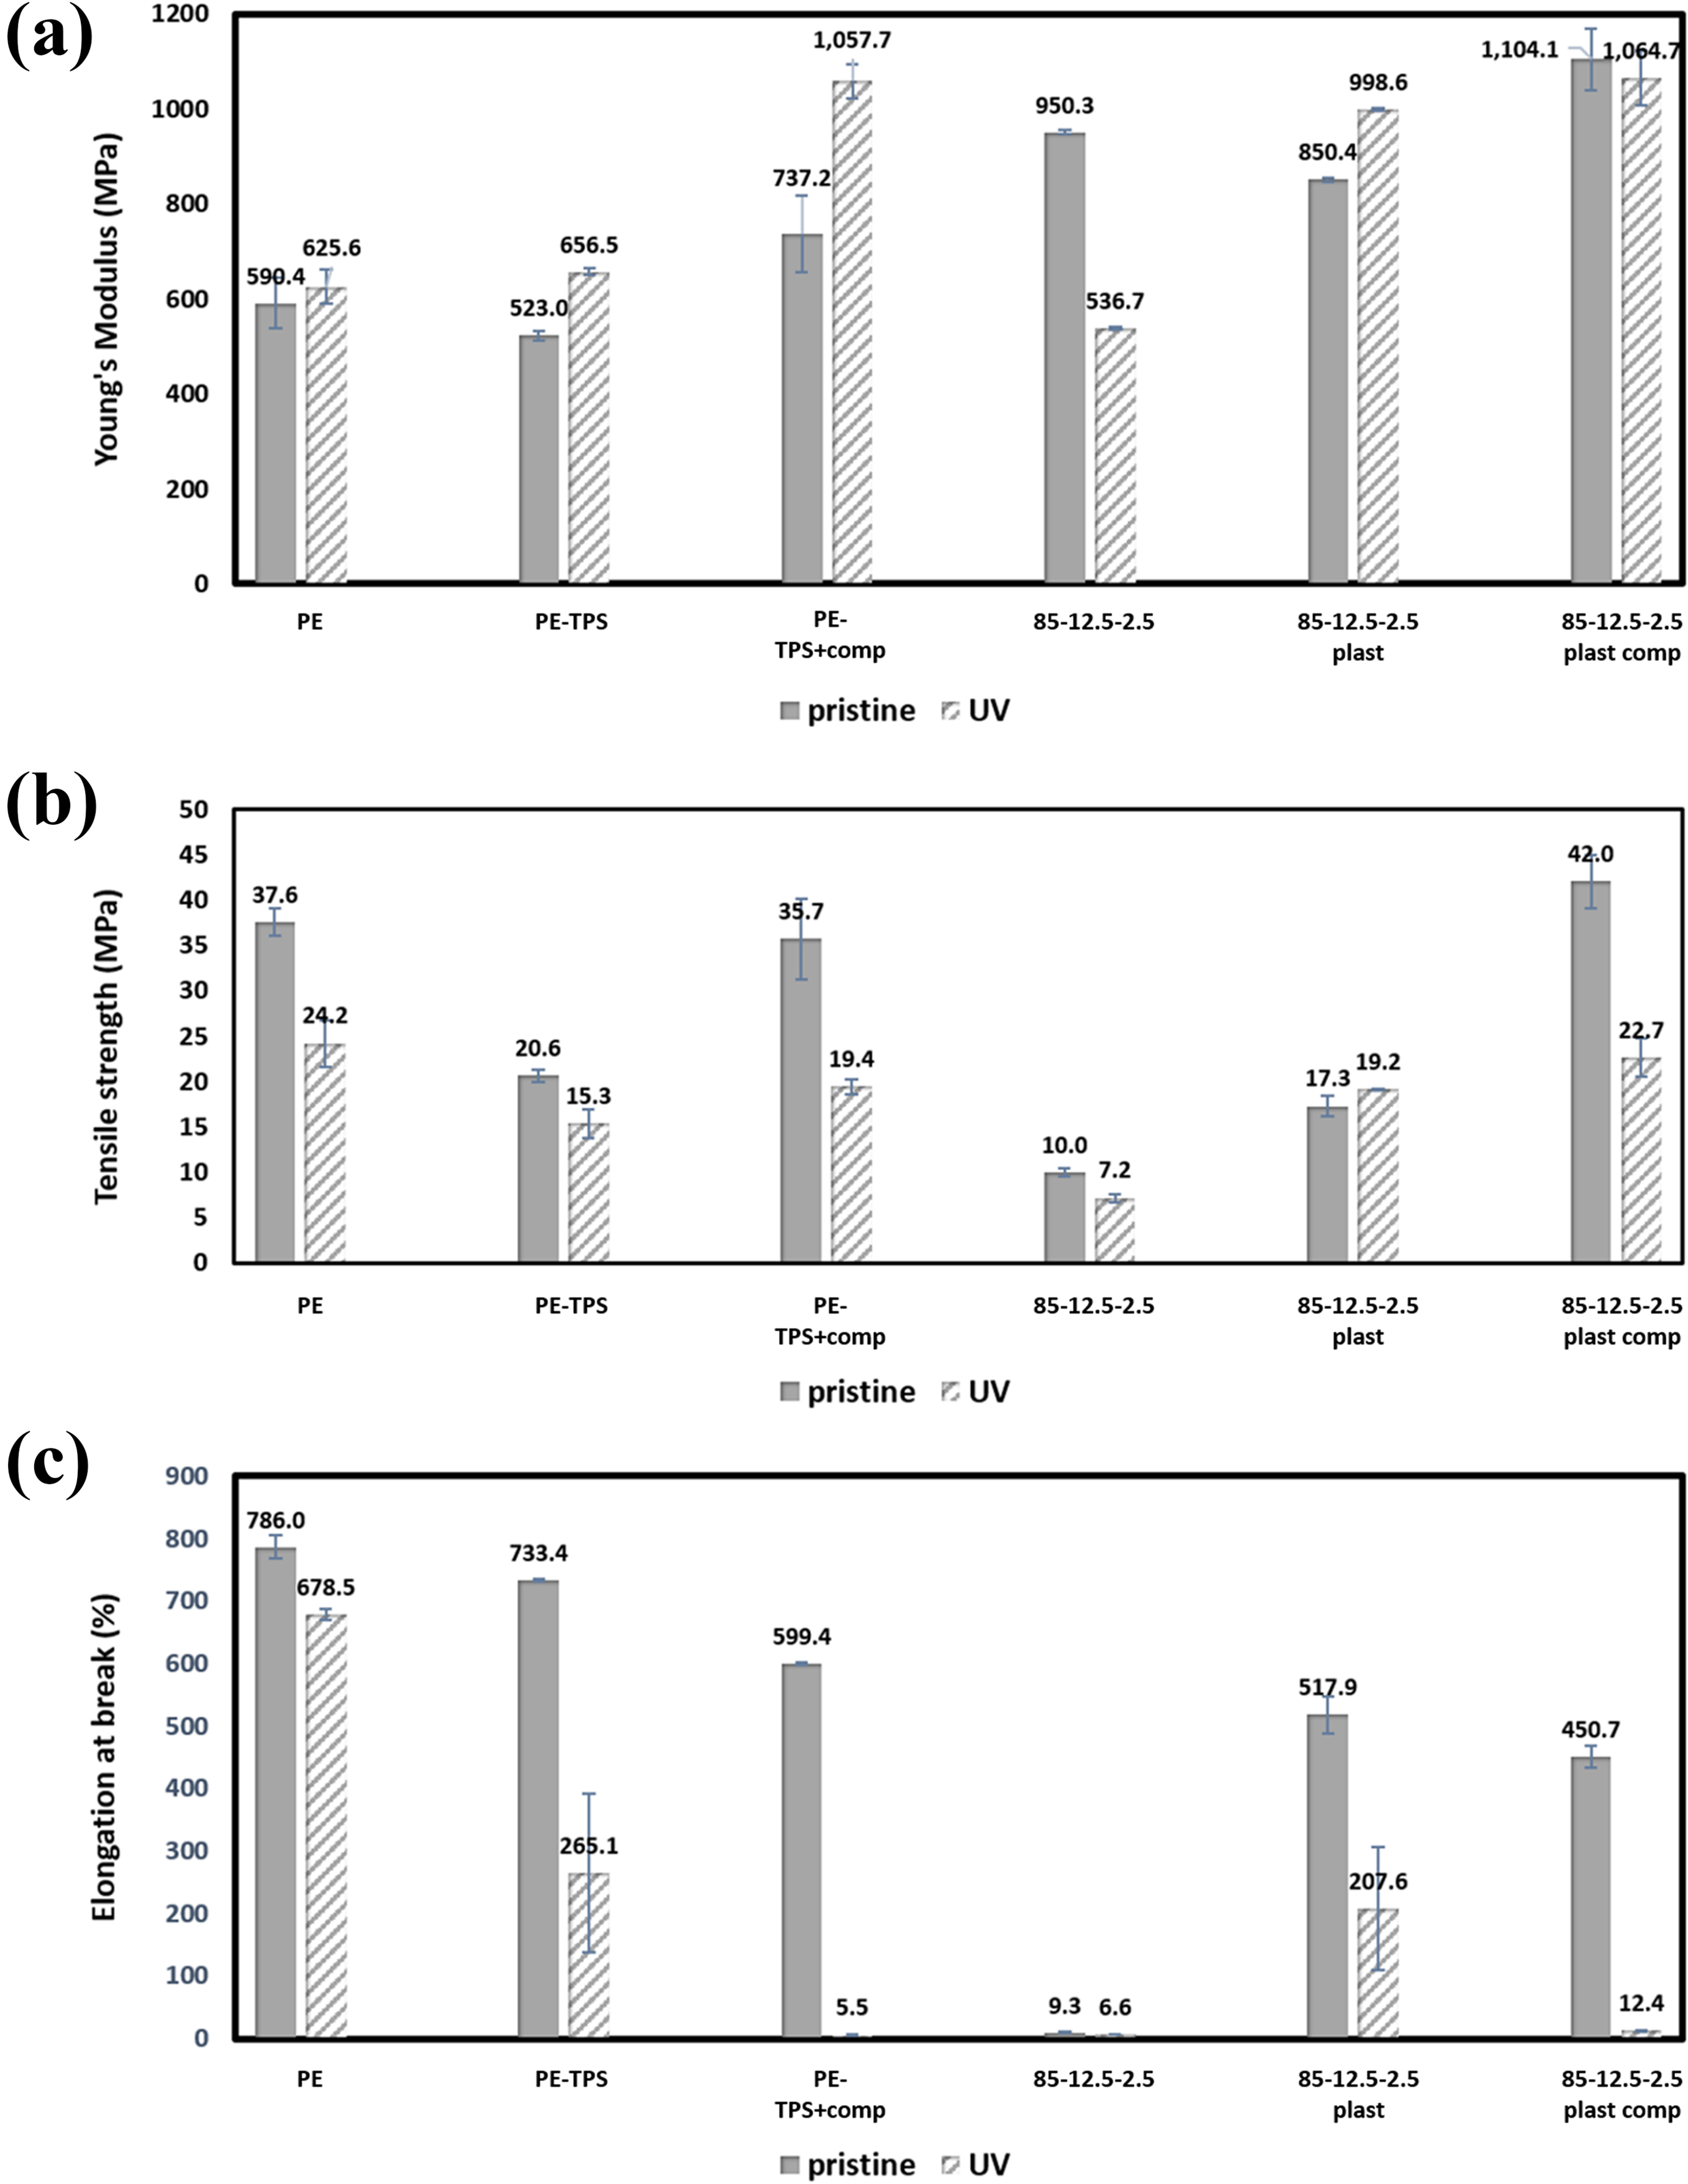
Mechanical properties of various PE/TPS/chitosan blends before and after UV exposure; (a) Young modulus, b) tensile strength, and c) elongation at break.
With the addition of PE-g-MA compatibilizer, the tensile strength of samples increases due to the enhancement in interfacial adhesion of PE and TPS. As starch is stiff and has higher modulus than that of PE, its incorporation increases the blends tensile strength. Incorporation of powder form chitosan to the blends has significantly decreased the tensile strength of the samples. This behavior can be related to the cationic nature of chitosan and its tendency to form agglomerate, which consequently reduces the tensile strength. On the other hand, by the addition of plasticized chitosan instead of its powder form (unplasticized chitosan) to the blends, the tensile strength of the blends increases, which can be attributed to the compatibilizing effect of glycerol and a decrease in dispersed size of chitosan.
Regarding the results of Figure 8, with the addition of TPS to PE matrix, elongation at break of the sample decreases slightly. The reason for such slight change is the lack of interfacial adhesion between PE and TPS. Addition of PE-g-MA compatibilizer decreases the elongation at break of the samples, which can be related to the improvement in interfacial adhesion between PE and TPS, as well as stress transfer from PE matrix to starch phase. As TPS is stiff and has lower elongation at break than that of PE chains, the compatibilized PE/TPS blend has lower elongation at break and higher modulus compared with uncompatibilized one. The same trend is observed while PE-g-MA compatibilizer is added to the blends containing plasticized chitosan.
Furthermore, Figure 8 represents the changes in the mechanical properties of the blends after UV exposure. According to these results, all samples show a significant increase in modulus except PE, which can be related to the extraction of glycerol plasticizer during the UV exposure. On contrary, two other mechanical properties are declined considerably. The reduction in tensile strength of the blends containing PE-g-MA copolymer is the most noticeable subject, due to the higher photodegradation rate of maleic anhydride, and the least remarkable reduction is in samples containing chitosan regarding its resistance against the UV degradation. Moreover, the elongation at break of the samples show a similar trend as the tensile strength, in which the samples containing PE-g-MA copolymer exhibit a brittle behavior, and their elongation at break do not exceed over 5.5% and 12.37% for the compatibilized PE/TPS and 85-12.5-2.5- plasticized blends, respectively.
Conclusion
Ternary blends of PE/TPS/chitosan were prepared by melt blending method. Addition of chitosan in powder form had a deteriorative effect on the mechanical properties of the blends. Therefore, a new route was developed to compensate this effect, in which chitosan was plasticized using glycerol and acetic acid solution. Morphological studies approved the effective incorporation of plasticized chitosan in which the average dispersed phase size in blends decreased from 3.15 µm to 2.05 µm. Investigation of mechanical properties verified this effect as well. Rheological studies revealed that the blend containing plasticized chitosan possessed higher homogeneity compared with unplasticized chitosan, and PE-g-MA compatibilizer enhanced this effect furthermore. Thermal analysis indicated that the plasticization and compatibilization had insignificant effect on crystallinity and melting temperature of the blends. Based on the contact angle measurements, the plasticization of chitosan had slightly decreased the water contact angle and increased water absorption. Chemical microstructure analysis and tensile test of UV-exposed samples illustrated that MA escalated the photodegradation rate, and on the other hand, chitosan improved the photostability of PE/TPS blends. The aim of this work was to examine the effect of chitosan incorporation on various properties of PE and TPS blends. The antibacterial activity results verified that this biopolymer possesses antibacterial characteristics in PE/TPS blends.