
Abstract
In this present work, hybrid polymeric nanocomposites are prepared with 4:1 ratio of polyurethane diol and polycaprolactone along with nickel oxide nanoparticle as filler. Fourier transform infrared studies were used to find the possible contact of nanoparticle along with the polymer hybrid. The composites prepared were in the nanoscale as revealed by X-ray diffraction, scanning electron microscopy (SEM), high-resolution SEM and transmission electron microscope. Their thermal behaviour is characterized by differential scanning calorimetric, thermogravimetry analysis and dynamic mechanical analysis studies, which reveals the influence of nanoparticle for various properties of the hybrid. Magnetic studies by vibrating sample magnetometry technique reveal that the composite prepared is ferromagnetic. Dielectric constant and conductivity investigations of polymer nanocomposites were investigated as a function of frequency and temperature. Redox electrochemical properties of nanocomposites studied by cyclic voltammetry reveal the potential of the material that can be used as an inexpensive metal catalyst in microbial fuel cells.
Introduction
Polymer hybrid is a commercial method to build up novel polymeric materials by simple methods with properties which are desirable or dissimilar from those of its individual polymers. Polymers may be miscible or immiscible depending upon the polymer–polymer interactions and the mixing process. 1 Polymer hybrids prove superior conductivity and enhanced mechanical strength than that of its constituent polymers. 2 –4 Polycaprolactone (PCL) is synthetic, biodegradable and biocompatible aliphatic polyesters, which is non-toxic for all living organisms. 5 On the other hand, polyurethane (PU), a man-made environmental polymer, 6,7 is derived from the condensation of isocyanates and polyalcohols. Previous reports are available for PU-PCL hybrid with shape memory effect for possible growth of cardiovascular implant. 8 PU–PCL hybrid was used in medical applications such as plastic reconstructive surgery, prosthetic socket cone production, radiotherapy patient immobilization and orthopaedic splinting or casting. 2,9 PU diol (PUD) belongs to the family of PUs, which is a man-made eco-friendly 3,10 polymer and used as a modifier for emulsions in wood, auto coatings, water soluble resins as well as appliances. Addition of nanostructured metal oxides with polymers can develop low weight nanocomposites with excellent mechanical, electrical, thermal and other multifunctional properties.
Nickel oxide (NiO) nanoparticle is an interesting material due to its useful electronic and magnetic properties 11 and used in diverse fields, such as fuel cell electrodes, catalysis, gas sensors, electro chromic films, lithium-ion batteries and smart windows. 12 –14 In the present work, NiO nanoparticles are incorporated in PUD/PCL hybrid to produce nanocomposites with a view to develop a novel ferromagnetic polymeric nanocomposite.
Experimental sections
Materials
PCL (Sigma Aldrich, Egmore, Chennai) with an average molecular weight (Mn) of approximately 45,000 was dehydrated in vacuum at 60°C for 4 h. PUD with Mn of approximately 320, 88 wt% in water and d = 1.14 g ml−1 at 25°C (Sigma Aldrich) was used after dehydration in a vacuum air oven. Analar grade 4,4′-diaminodiphenylmethane (DDM), hexamethylene diisocyanate (HDI), a catalyst dibutyltin dilaurate, and NiO nanoparticles were used as received with no additional refinement.
Methods
Fourier transform infrared (FTIR) spectroscopy measurements were recorded by means of JASCO-FTIR 4100/Japan spectrometer (Japan). X-ray diffraction (XRD) studies were carried out with X-ray generator model 3000 from Rich Siefert, Germany. A NETZSCH DSC 204 model was used to study the melting and crystallization temperature of the polymer hybrids. Thermogravimetry analysis (TGA) was carried out by a NETZSCH STA 449 F3 Jupiter. Dynamic mechanical analysis (DMA) measurement was recorded using DMA Q800 V20.6 Build 24 dynamic mechanical analyser. The exterior images of polymer nanocomposite were analysed by means of JEOL Model JSM – 6390LV instrument. High-resolution scanning electron microscopy (HR-SEM) images were obtained by FEI Quanta FEG 200 microscope. PHILIPS model CM 200 microscope (Johannesburg) was used to obtain transmission electron microscopy (TEM) and SAED images. The magnetization measurements were analysed by Lakeshore vibrating sample magnetometry (VSM) 7404 model (USA) for a specimen each of a particular concentration. The dielectric constant and conductivity were measured at various temperatures ranging from 30°C to 70°C using an LCR meter (Agilent 4284 A, California, USA) with different frequencies, namely, 1, 10, 100 and 1000 kHz, thrice for each loading of the composites. The measurement of cyclic voltammetry (CV) was carried out by electrochemical workstation 604D (USA electrochemical analyser; CH Instruments).
Preparation of hybrid polymer (PUD/PCL)
At first, 40 g of dehydrated PUD was taken in a preheated blender and it was heated at about 90°C. Then, 10 g of PCL was added by constant stirring at 415 r min−1 for 30 min. A PUD/PCL hybrid of ratio 4:1 was obtained. Literature revealed the homogeneity of the polymers in 4:1 blend than other ratios with good mechanical properties. Therefore, composite with 4:1 ratio was used for further evaluations.
Preparation of nanocomposites
The heating temperature was increased to 120°C (from 90°C used for preparing the hybrid) and stirred at a rotor speed of 415 r min−1. To this hybrid polymer, 0.5 g of NiO nanomaterial was added gradually and carefully with the mixture and stirred at 415 r min−1 for 45 min. One hour of sonication was made to disperse the nanoparticles constantly throughout the hybrid. Then, heating was discontinued and 12 ml HDI and 4 g DDM were supplemented and swirled. The synthesized nanocomposites were relocated into the mould and desiccated overnight at room temperature and dried for 1 h at 100°C in a vacuum air oven. Nanocomposites with 1.0, 1.5, 2.0 and 2.5 g of NiO nanomaterial were also prepared along with PUD/PCL hybrid following the method given above.
Results and discussion
FTIR spectroscopy
FTIR spectrum of PUD/PCL hybrid and NiO-filled nanocomposites are presented in Figure 1. N–H stretching of urethane bonds (NH–COO) was observed on 3320.82, 3328.53, 3319.86 and 3325.64 cm−1. 15 Bands at 2930.31, 2929.81, 2931.27, 2928.38, 2860.88, 2862.81 and 2863.77 cm−1 correspond to asymmetric and symmetric stretching vibrations of methylene groups in PU and PCL in the hybrid. No band was observed around 2255 cm−1 which imparts that isocyanate of HDI was completely drawn through the curing reaction. Bands at 1691.27, 1692.23 and 1693.19 cm−1 were observed for hybrid and the nanocomposites which are caused by urethane carbonyl group. 16 IR spectra for pure hybrid and nanocomposites of different compositions were observed with almost similar kind of bands. Consequently, it is observed from the IR investigation that the nano-metal particles have no chemical interaction with the hybrid; however, the little changes in absorption frequencies are attributed to the physical contact of polymer hybrid with the NiO nanoparticles. Therefore, it is apparent from the IR investigations that the materials prepared were complete composites and not a particular chemical compound.
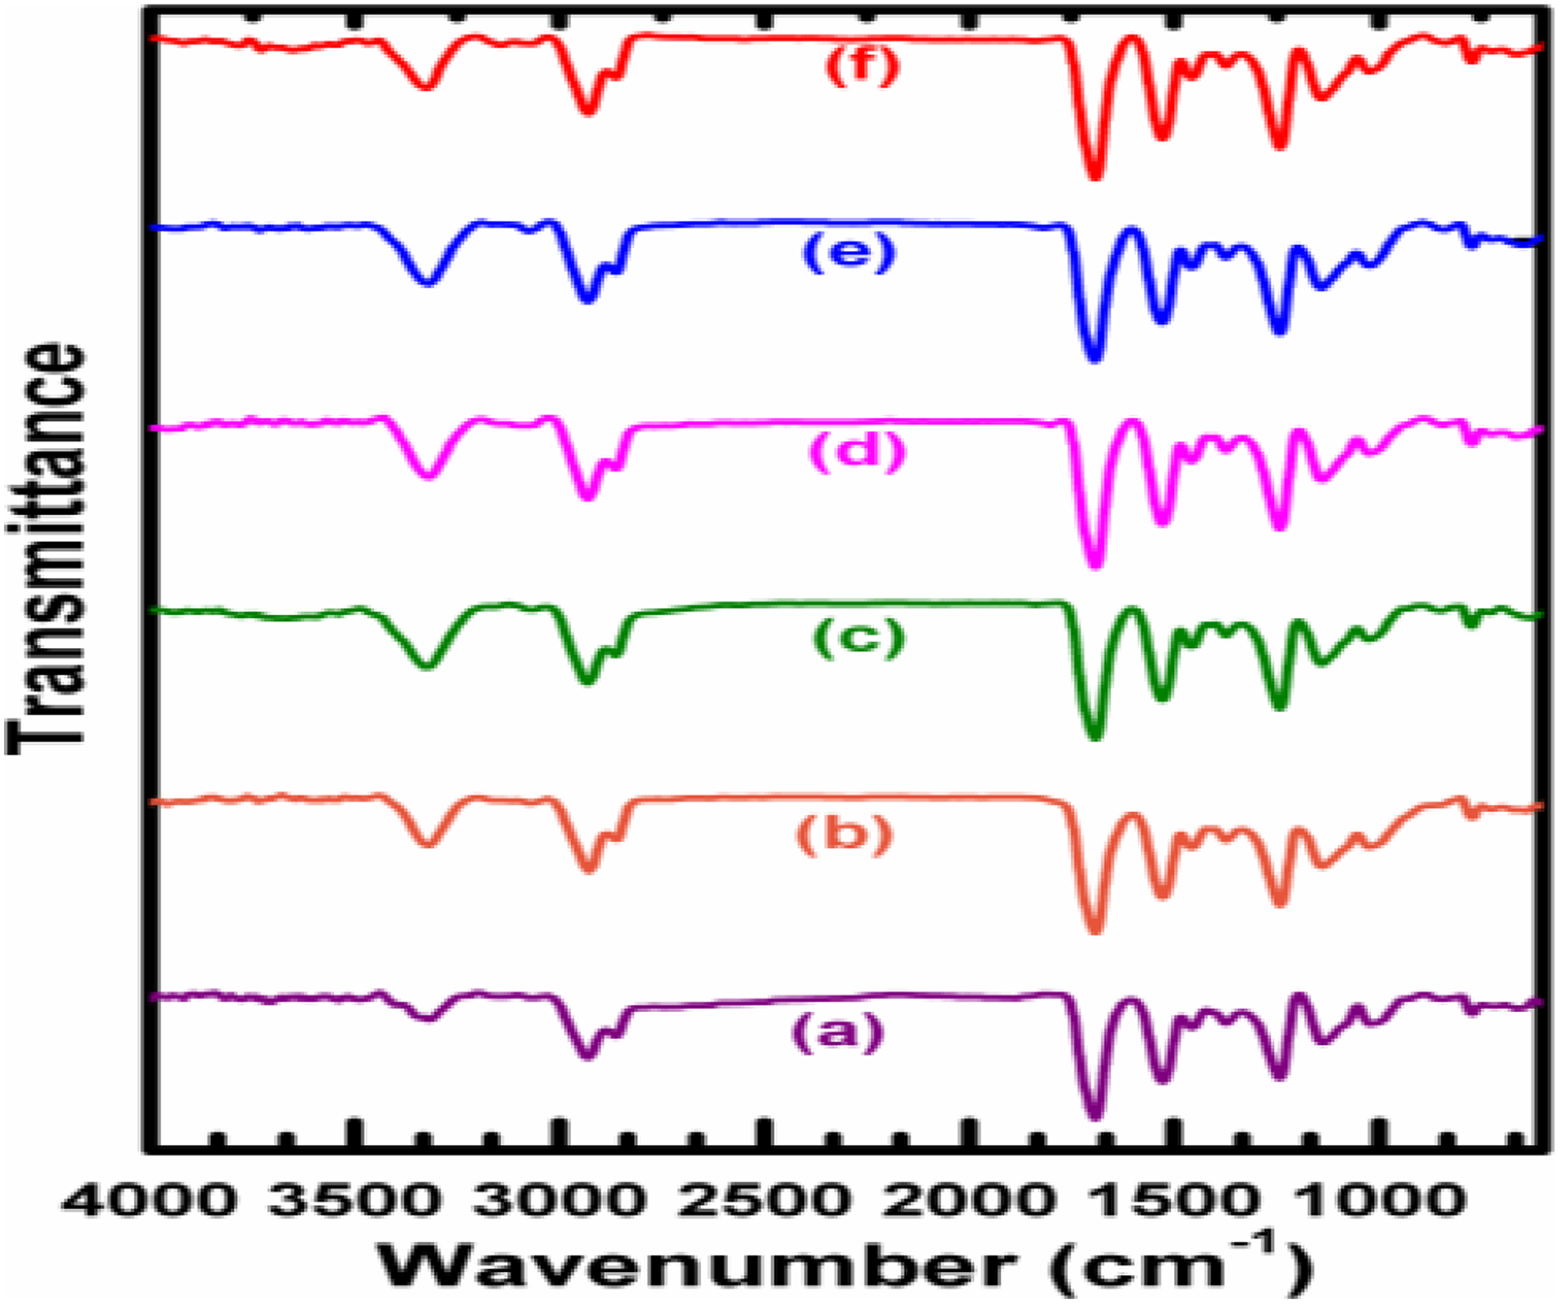
FTIR spectra of PUD/PCL-NiO nanocomposites. (a) Pure blend, (b) 0.5 wt% NiO nanocomposites, (c) 1.0 wt% NiO nanocomposites, (d) 1.5 wt% NiO nanocomposites, (e) 2.0 wt% NiO nanocomposites and (f) 2.5 wt% NiO nanocomposite.
XRD analysis
The XRD pattern of hybrid and various nanocomposites is presented in Figure 2. Between 10 and 80°, the diffracted intensities were recorded. Sharp crystalline peaks were observed for 2θ at 37.2683°, 43.3834°, 62.9405° and 75.4220° for phase cubic structure of NiO with diffracting planes (111), (200), (220) and (311), respectively. These values matched with the standard JCPDS file 73-1523. 17 XRD plot for PUD/PCL hybrid had a peak at 20.28°. XRD plots of various nanocomposites had peaks at 21.5524°, 21.7800°, 43.4803° and 62.9446°, which proved that NiO nanoparticles in the composites are in fact prevailing in the nanoscale. The XRD patterns evidently disclose the interfacial interactions of the hybrid with NiO nanoparticles. On the other hand, nanocomposites demonstrate more crystalline characteristics than that of pure hybrid. The crystalline nature points out that the NiO and polymer hybrid together formed advanced composite material of different compositions.
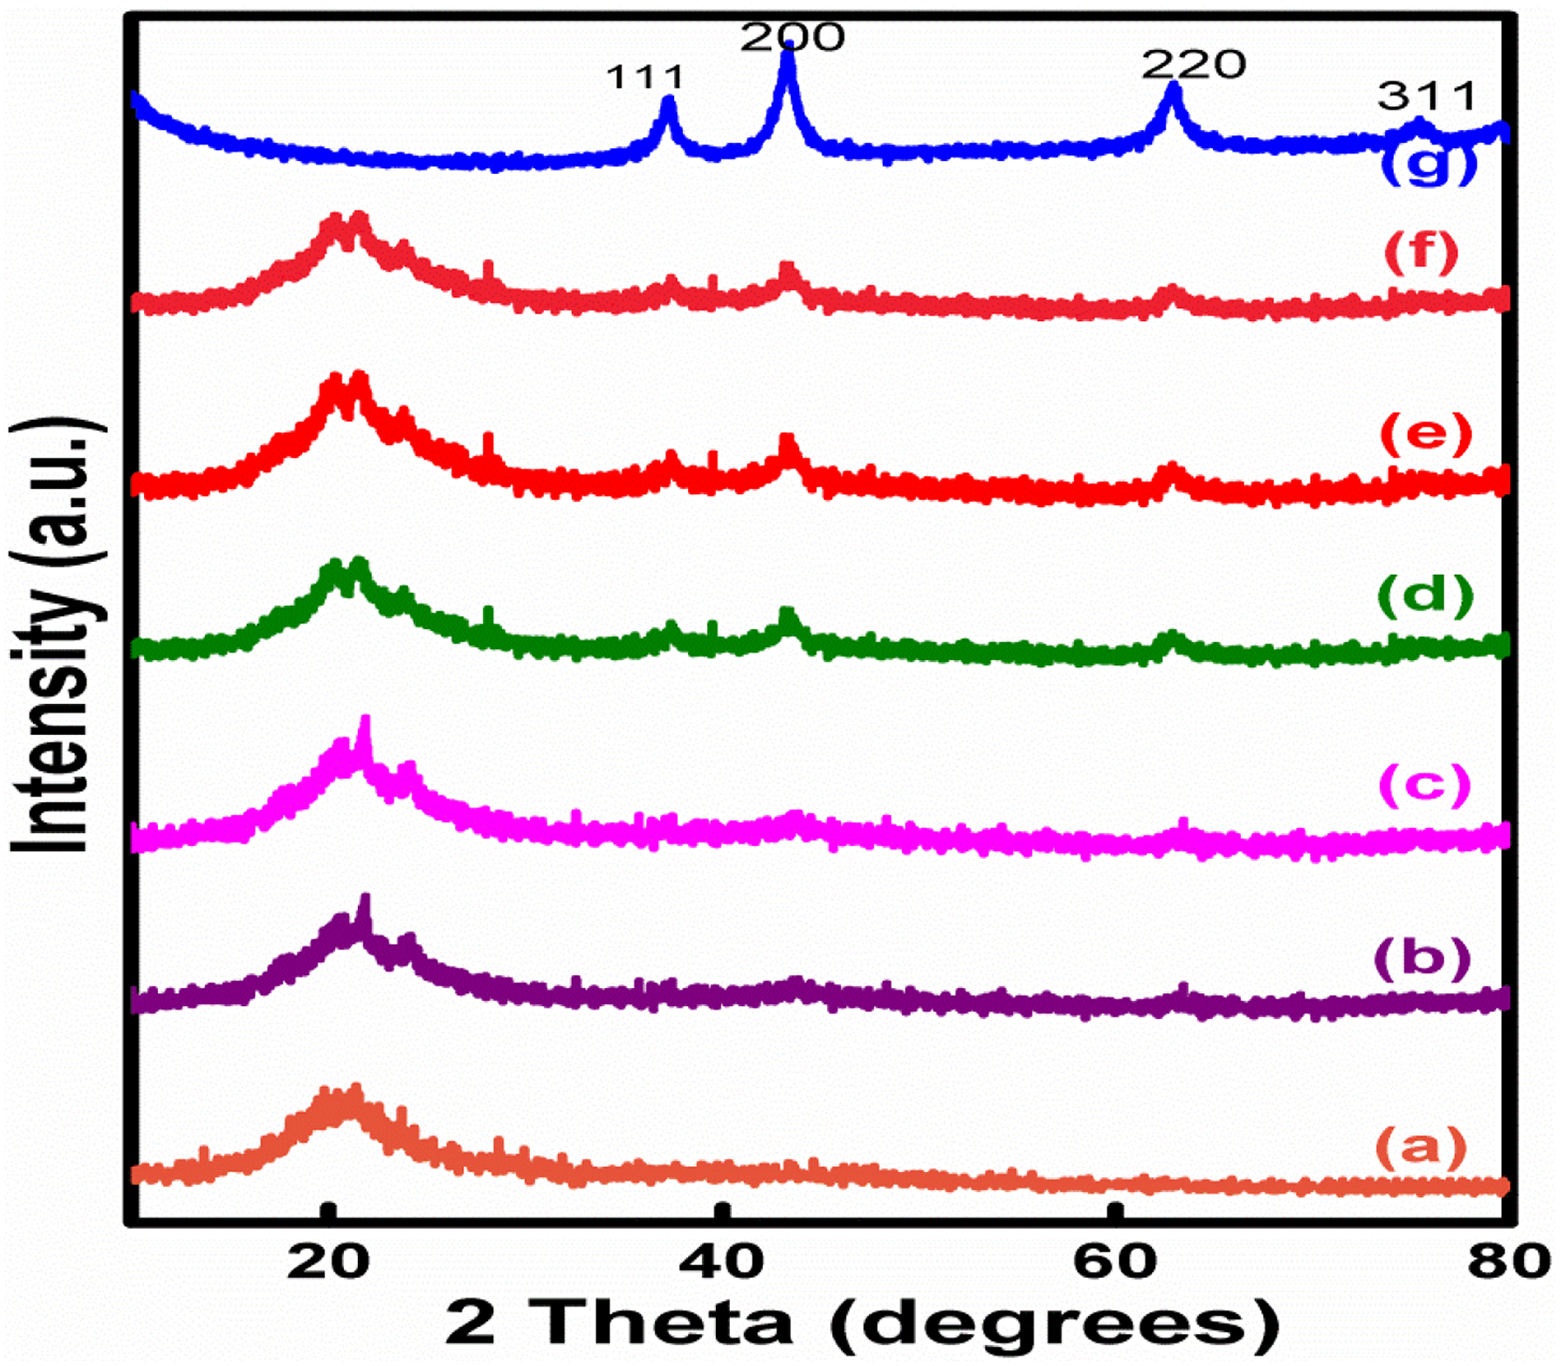
XRD pattern of PUD/PCL-NiO nanocomposites. (a) Pure blend, (b) 0.5 wt% NiO nanocomposite, (c)1.0 wt% NiO nanocomposite, (d) 1.5 wt% NiO nanocomposite, (e) 2.0 wt% NiO nanocomposite, (f) 2.5 wt% NiO nanocomposite and (g) NiO nanoparticle.
Thermogravimetry analysis
TGA and DTG investigations were carried out to analyse the thermal stability and thermal degradation of the PUD/PCL hybrid and various composites prepared and illustrated in Figures 3 and 4. Figures 3 and 4 clearly depict four mass changes for the composites. The first mass change was around 2.4% with the inflection temperature around 138°C corresponding to the dehydration of the samples. According to the literature, the thermal degradation of PU was established at 230°C, corresponding to the degradation of hard segments produced in urethane. 18,19 The presence of these groups in PU provides hydrogen bonding which provides high thermal stability. However, for the PUD/PCL hybrid and nanocomposites prepared, the mass loss was around 49% at the inflection temperature of around 275°C. The increase in inflection temperature occurred, as a result of the interaction of PU segment with PCL and nanomaterial. The thermogram also revealed a mass loss at 360°C corresponding to soft segment of PU. 20 The inflection temperature increases when the percentage of nanoparticles was enhanced, which reveals the interaction with the PUD/PCL hybrid. It was reported that the thermal decomposition temperature of pure PCL was 423°C. 21 Thermogram discloses the mass change at 455°C for the composites, corresponding to the thermal degradation of PCL component. The rise in temperature for the PCL degradation took place as a result of the interaction with nano-NiO particles. TGA clearly suggests that the thermal performance of the composites has markedly improved up on the addition of NiO nanomaterial to the hybrid. The thermal parameters of PUD/PCL-NiO nanocomposites obtained from thermogravimetric analysis are presented in Table 1.
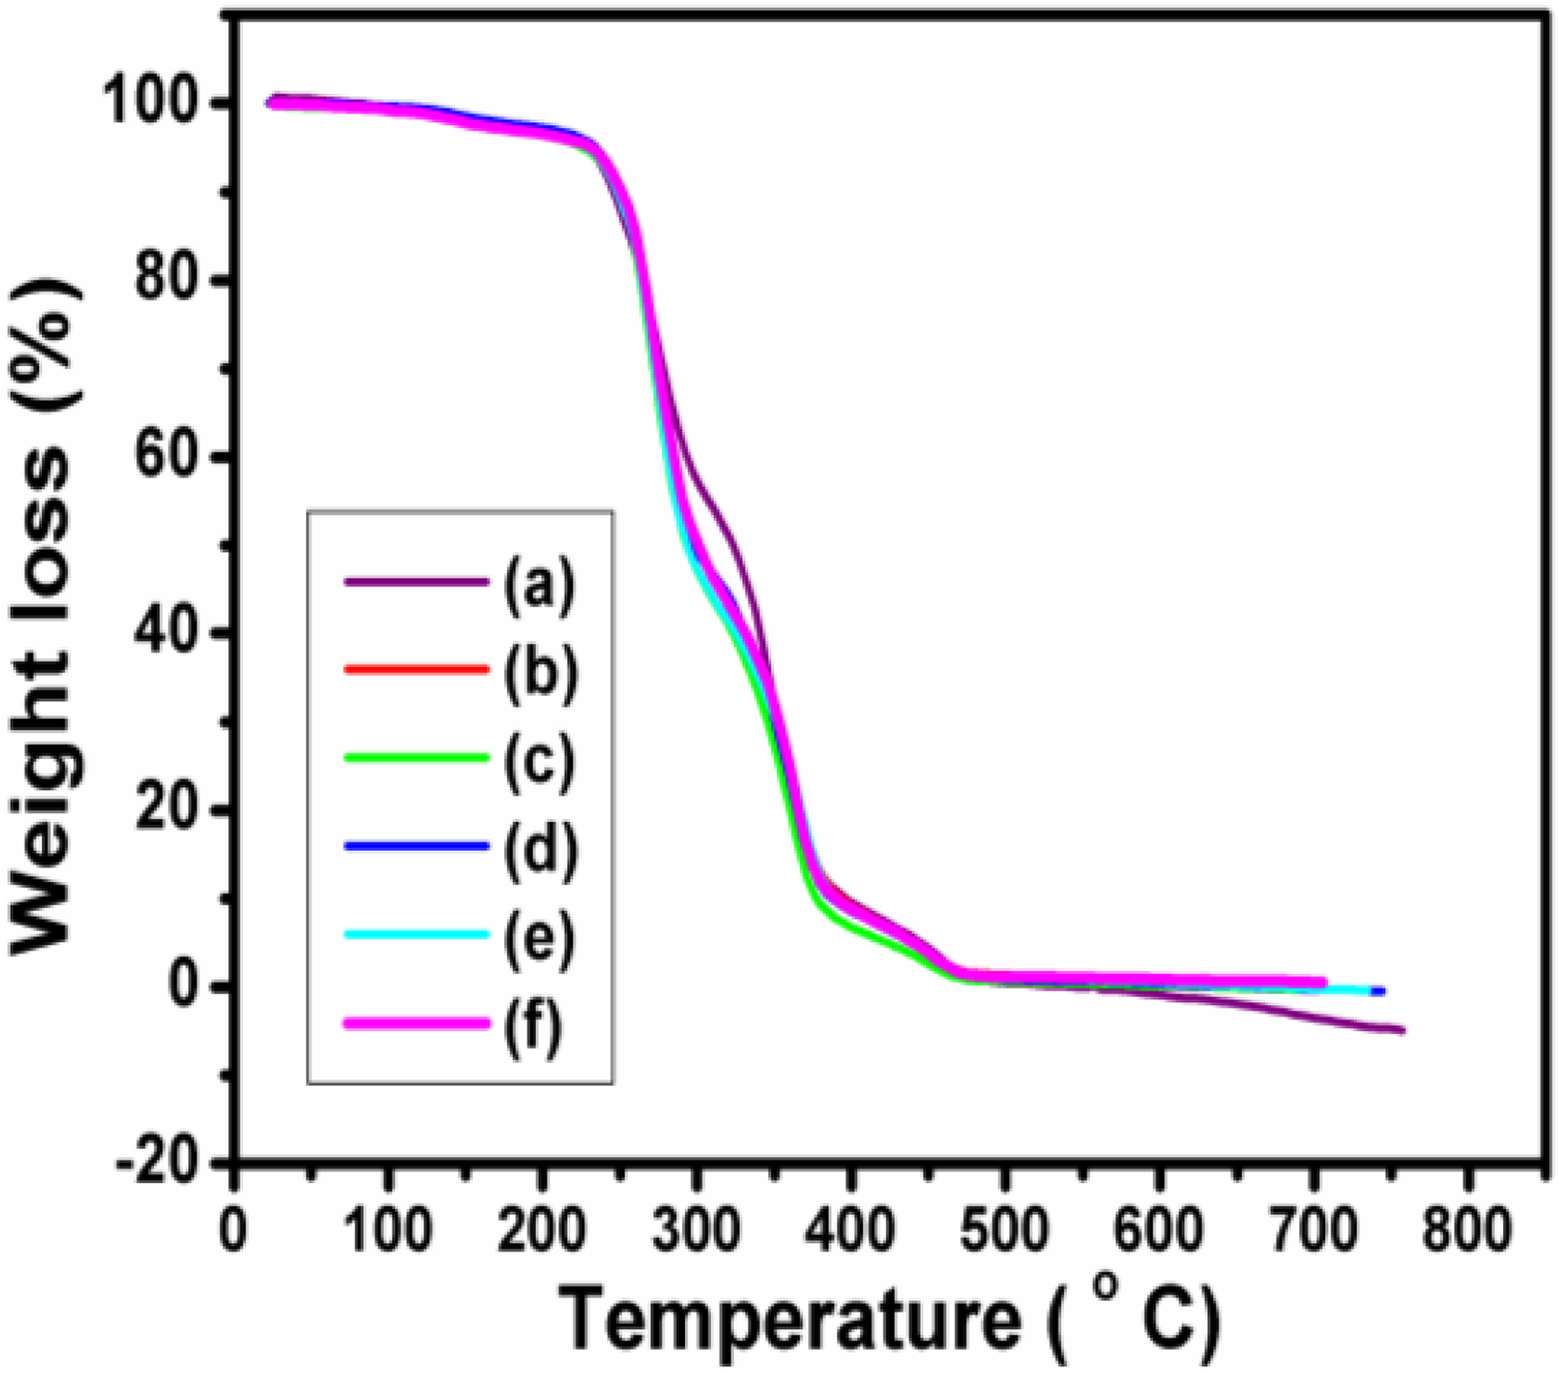
TGA thermograms of PUD/PCL-NiO nanocomposites. (a) Pure blend, (b) 0.5 wt% NiO nanocomposite, (c) 1.0 wt% NiO nanocomposite, (d) 1.5 wt% NiO nanocomposite, (e) 2.0 wt% NiO nanocomposite and (f) 2.5 wt% NiO nanocomposite.
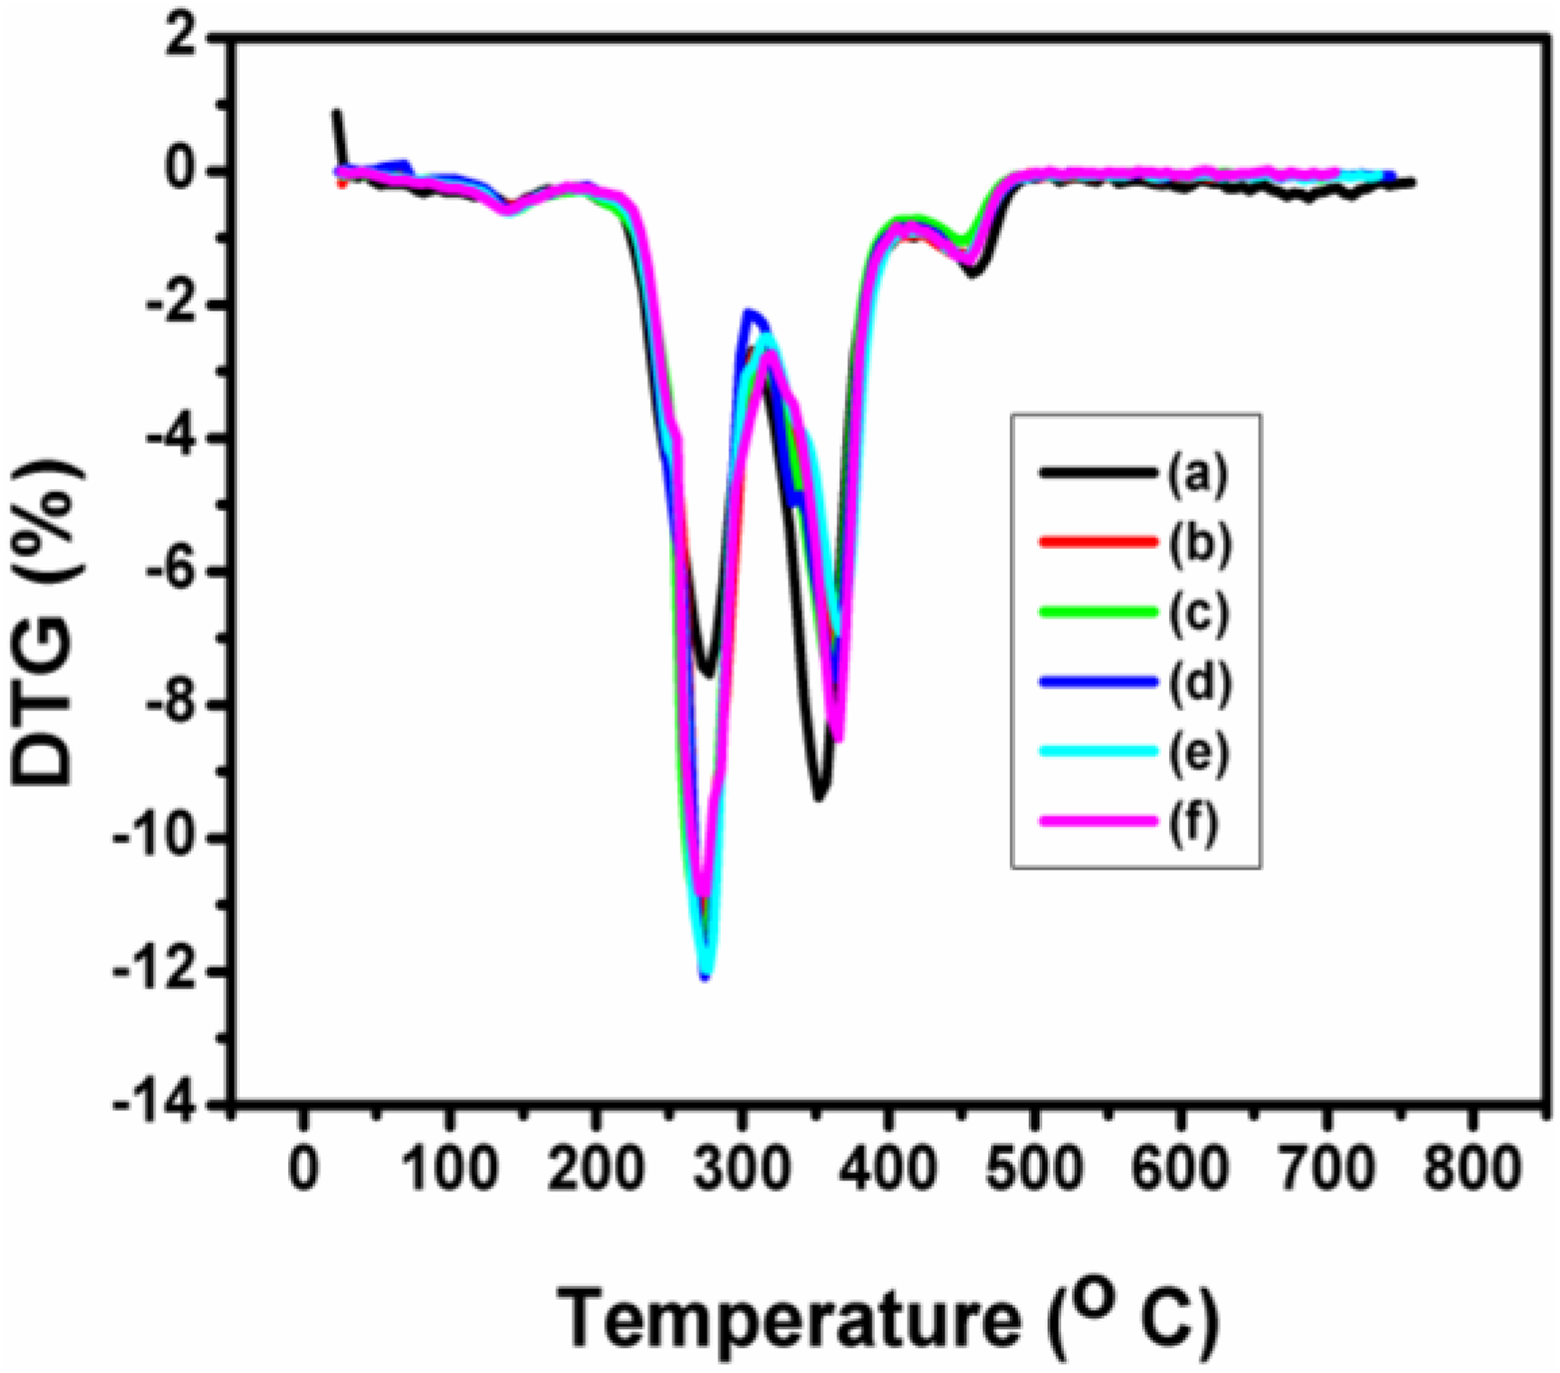
DTG thermograms of PUD/PCL-NiO nanocomposites. (a) Pure blend, (b) 0.5 wt% NiO nanocomposite, (c) 1.0 wt% NiO nanocomposite, (d) 1.5 wt% NiO nanocomposite, (e) 2.0 wt% NiO nanocomposite and (f) 2.5 wt% NiO nanocomposite.
Thermal parameters of PUD/PCL-NiO nanocomposites obtained from TGA thermograms.
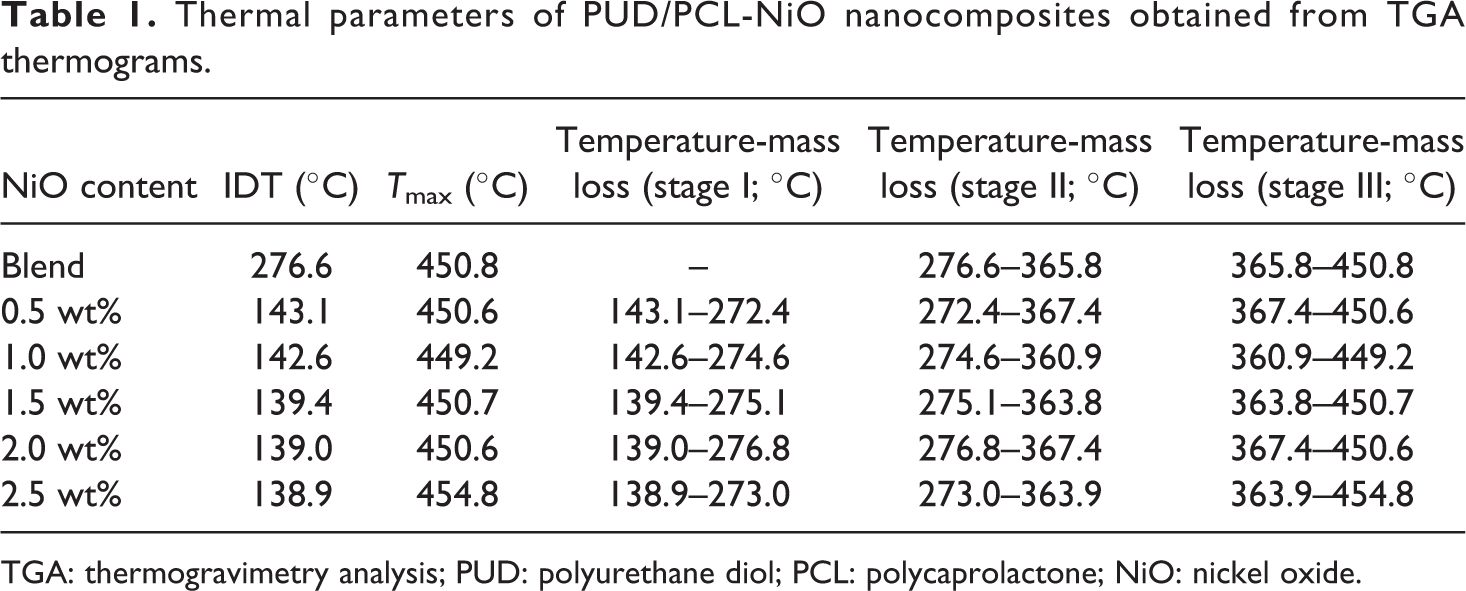
TGA: thermogravimetry analysis; PUD: polyurethane diol; PCL: polycaprolactone; NiO: nickel oxide.
DSC analysis
The thermal performance of the hybrid and nanocomposites were examined and displayed in Figure 5. It was already reported that when PU was added to PCL, the melting temperature (Tm) value decreased; however, a fixed proportion of the PUD/PCL hybrid was taken for the current work. 22 It is obvious from the investigation that PUD/PCL hybrid has a Tm of 31.8°C. The inclusion of nanoparticles in the PUD/PCL hybrid has increased the Tm of various nanocomposites from 31.8°C to 59.9°C. The rise in Tm values for various nanocomposites reflects the compatibility of the material 23 with the incorporation of increasing content of NiO nanomaterial. Glass transition temperature (Tg) is found to be around 21°C for the hybrid and nanocomposites. Literature review revealed one melting peak (Tm) for pure PCL alone. 23 But differential scanning calorimetric (DSC) thermogram of the PUD/PCL hybrid shows two thermal transitions. The lower thermal transition is at −41.8°C. It is attributed to the fixation of temporary shape, whereas the second thermal transition temperature at 31.8°C was attributed to the permanent shape. 6 However, when nano-metal particles were introduced into the polymer hybrid, the low thermal transition has disappeared. This trend is observed for various nanocomposites prepared. Table 2 shows the Tm and the Tg of pure hybrid and various concentrated NiO nanocomposites prepared.
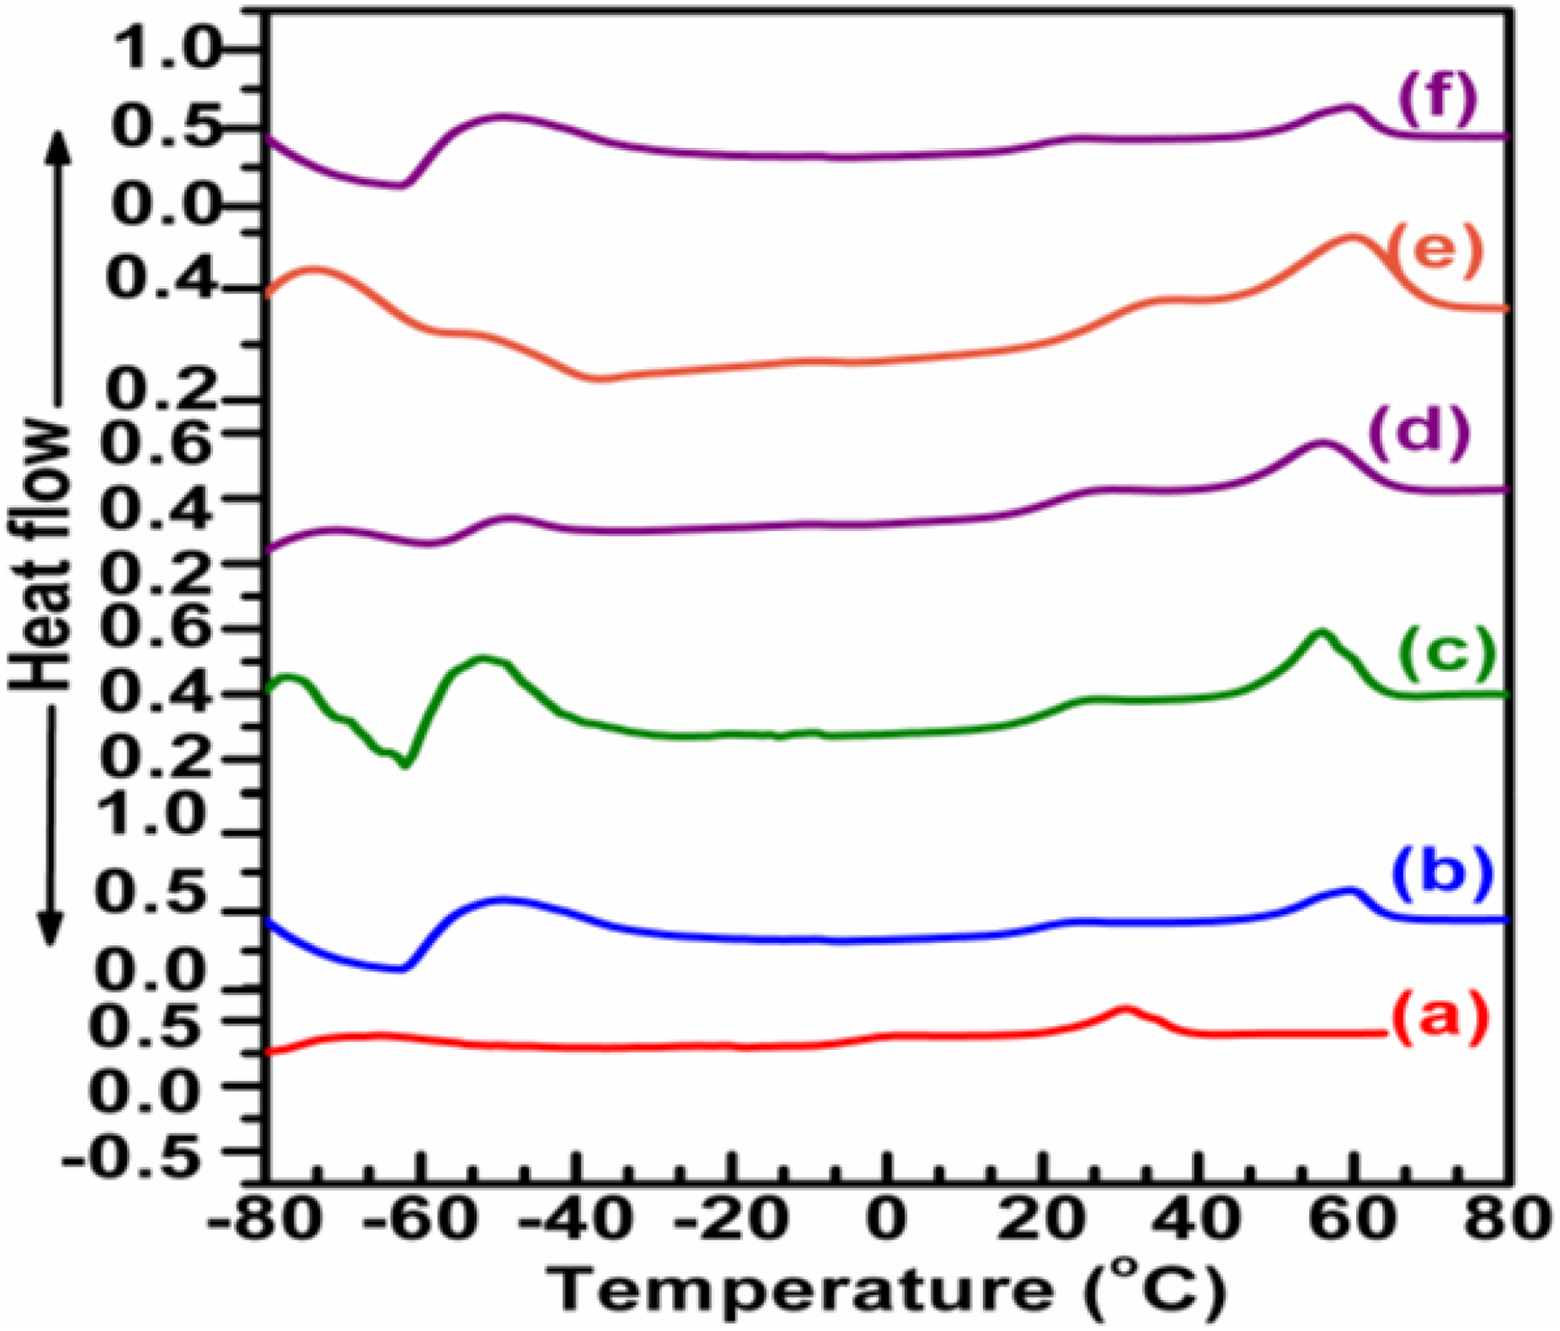
DSC thermograms of PUD/PCL-NiO nanocomposites. (a) Pure blend, (b) 0.5 wt% NiO nanocomposite, (c) 1.0 wt% NiO nanocomposite, (d) 1.5 wt% NiO nanocomposite, (e) 2.0 wt% NiO nanocomposite and (f) 2.5 wt% NiO nanocomposite.
Tg and Tm values obtained from DSC thermogram for PUD/PCL-NiO nanocomposites.
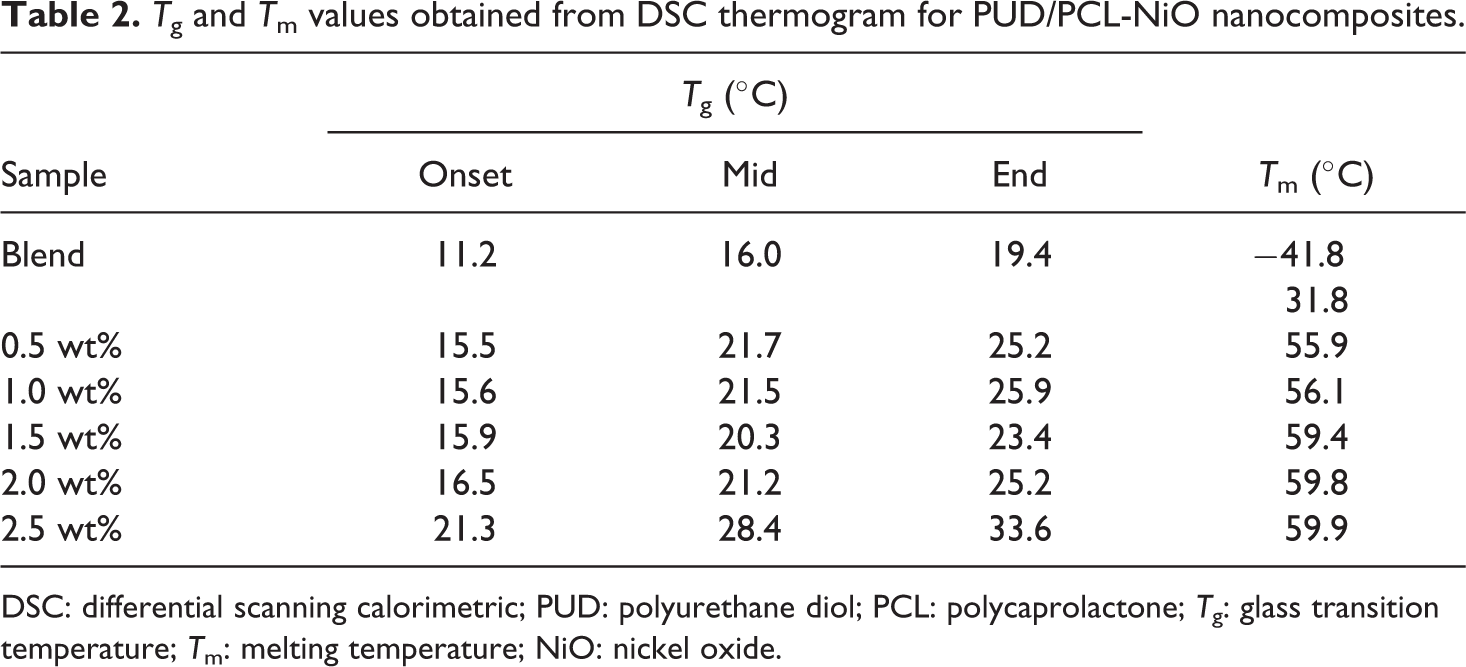
DSC: differential scanning calorimetric; PUD: polyurethane diol; PCL: polycaprolactone; Tg: glass transition temperature; Tm: melting temperature; NiO: nickel oxide.
Dynamic mechanical analysis
The dynamic mechanical properties of the PUD/PCL-NiO composites were examined by DMA over a range of temperature. A strain was applied and the resulting response was measured to determine the complex modulus from which the viscoelastic behaviour of the composites was evaluated. Figures 6 and 7 represent the storage modulus (EI) and loss modulus (EII) of the composites, respectively, as a function of temperature at 1 Hz.
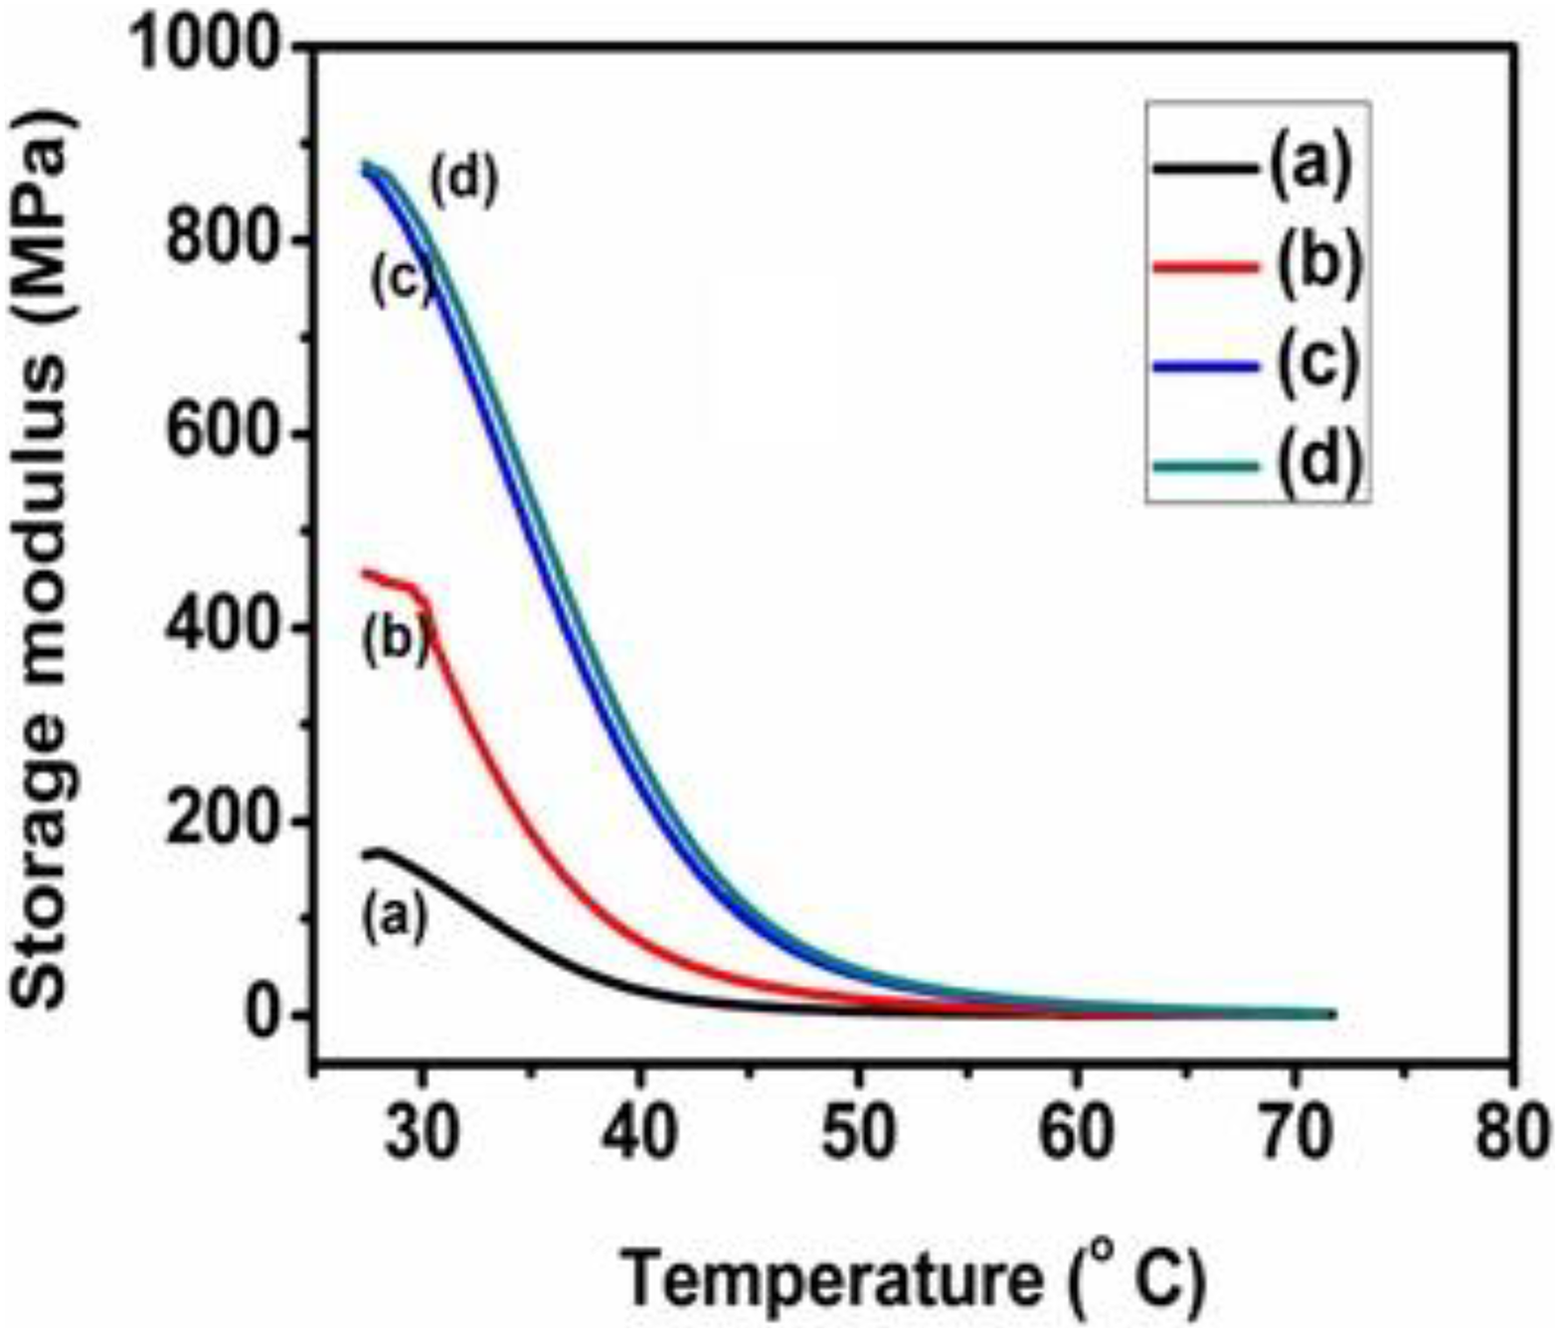
EI of PUD/PCL-NiO nanocomposites. (a) Pure blend, (b) 0.5 wt% NiO nanocomposite, (c) 1.5 wt% NiO nanocomposite and (d) 2.5 wt% NiO nanocomposite.
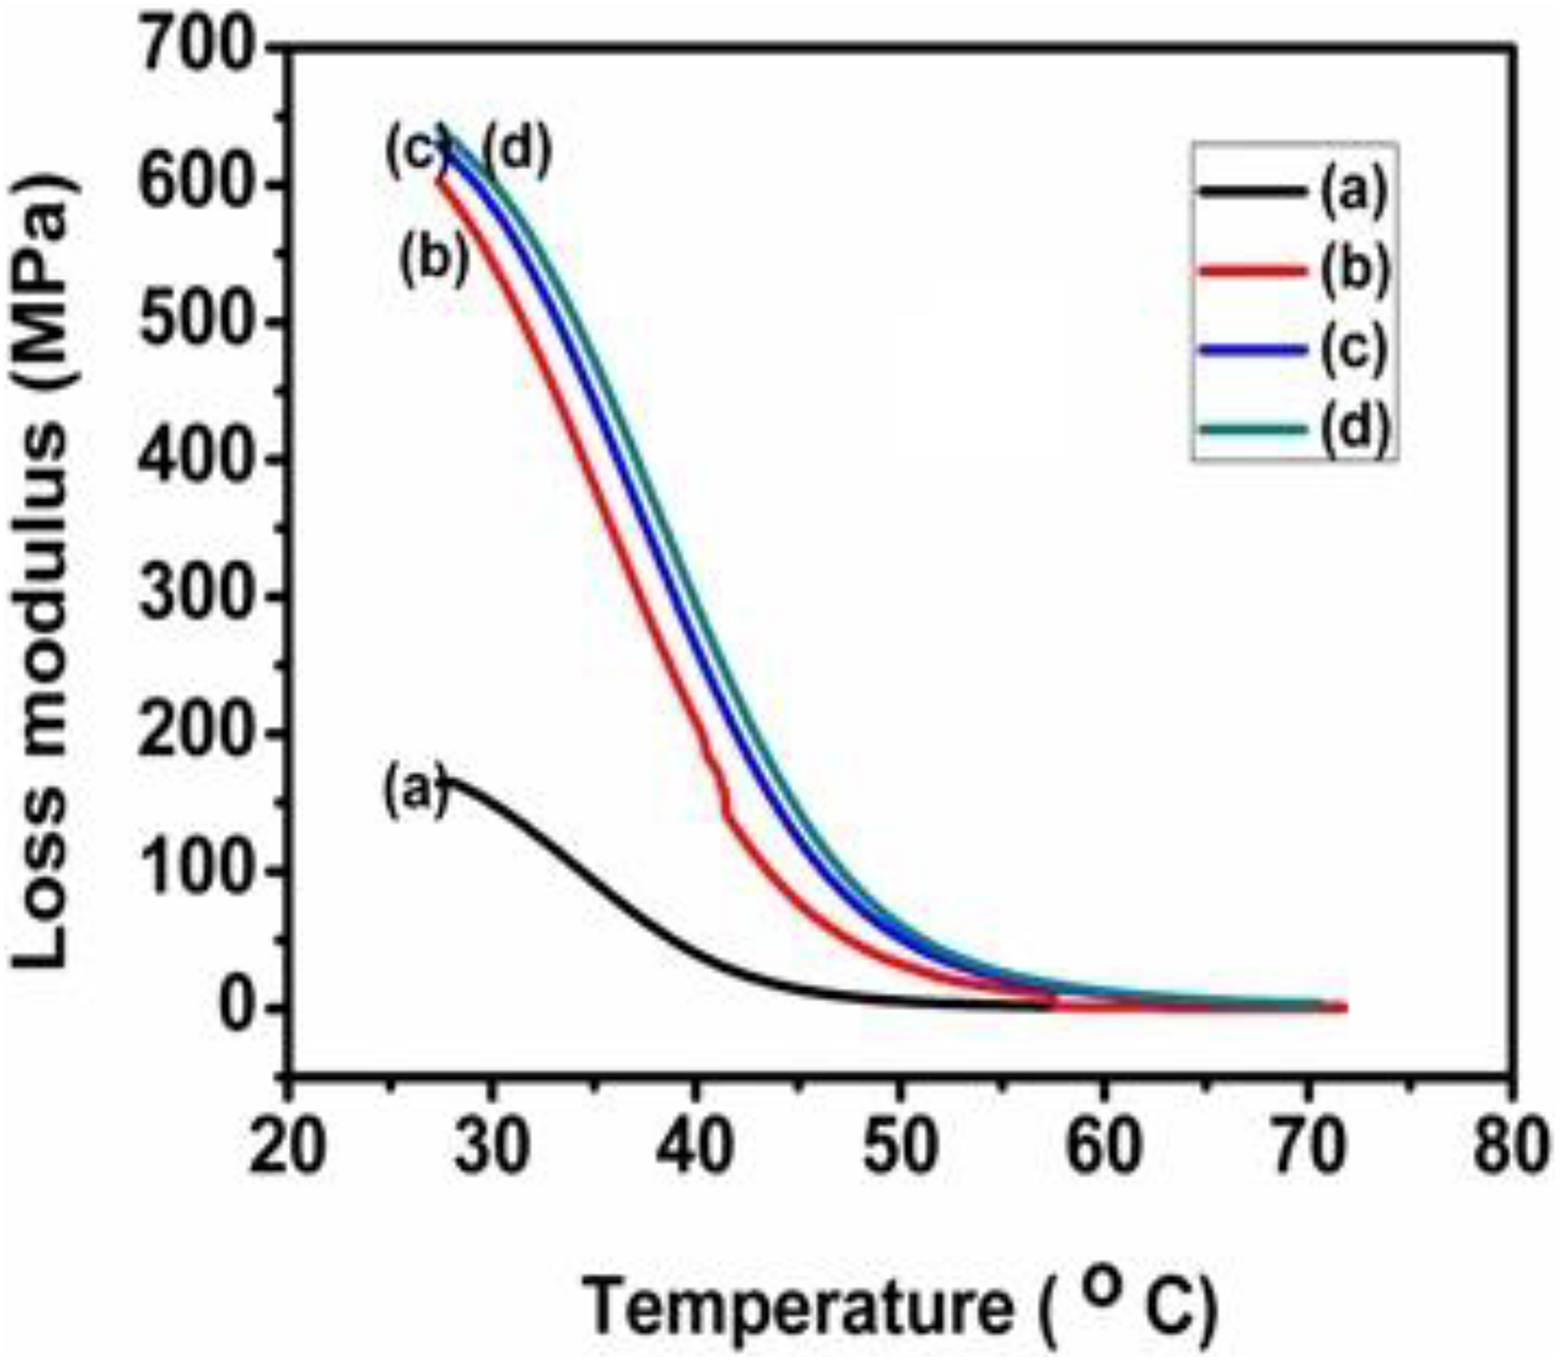
EII of PUD/PCL-NiO nanocomposites. (a) Blend, (b) 0.5 wt% NiO nanocomposite, (c) 1.5 wt% NiO nanocomposite and (d) 2.5 wt% NiO nanocomposite.
Variation of EI with temperature
The EI represents the stored energy available in the composites corresponding to the elastic portion. The value of EI was found to be very high for 2.5 wt% nanocomposite than the other combinations of composites and PUD/PCL hybrid. The decrease in the EI is monitored along the increasing temperature. At higher temperature, the EI drops owing to the loss in stiffness of the hybrid. EI for pure hybrid at 28.02°C is 167.9 MPa, whereas the incremental addition of nanoparticles to the PUD/PCL hybrid increased the value to 456.3, 870.8 and 879.8 MPa for other nanocomposites examined. The enhance EI is attributed to the presence of metallic nanoparticles in the hybrid which have more modulus than the hybrid alone. Therefore, the composites have better compatibility between nanoparticles and hybrid, which is reflected from the EI values. The effect of nanomaterials on the EI is evaluated by the following equation:

Where EI g is storage modulus in the glassy region and EI r is storage modulus in the rubbery region.
The low fractional values of C around 0.7 for various composites confirm the efficiency of the reinforcement. 24 The increased addition of nano metals decreases the value of C, revealing the effectiveness of the same in the reinforcement. As a result, the addition of nanoparticles provides better stress transfer for the composites and better adhesion between hybrid and nano-NiO. Further, absorption is increased when the nanoparticles were added in increased concentration to the hybrid that provides rigidity to the material. 25 In addition to the absorption of the nanoparticles to the polymer hybrid, effective cross-linking of the polymer chains through the nanoparticles also provides rigidity to the nanocomposites prepared. 26
Variation of EII with respect to temperature
EII represents the heat energy dissipated that is available in the composite corresponding to the viscous portion. With respect to temperature, EII gives the viscous response of the composite. This modulus is governed by the molecular motions within the composite material. Figure 7 depicts the variation of EII for hybrid and for various nanocomposites as a function of temperature at a frequency of 1 Hz. The maximum EII value corresponds to the Tg. When nanoparticles are added to the hybrid, EII shows a rising trend. The EII values for the different composites are comparatively similar when compared to the PUD/PCL hybrid. For pure hybrid, the EII values of composites are higher. On the other hand, after Tg, the EII values are similar, reflecting the characteristic similarity of the composites and the hybrid in the rubbery region. A slight decreasing rubbery stage is also observed for the increasing nanoparticles content. Tg obtained from EII curve is given in Table 3. Tg values obtained from EII are more realistic than the obtained values from damping factor and more closer towards the values obtained from DSC curves. The reinforcement of nanoparticles provides a toughening effect on the composite that is reflected from the increased Tg values of the composites. 27
Maximum tan δ and Tg values and Tg from EII curve for NiO nanocomposites.
Tg: glass transition temperature; EII: loss modulus; NiO: nickel oxide.
Variation of tan δ with respect to temperature
The loss factor or damping factor, tan δ is the ratio of the EII to the EI. It gives a measure of the energy lost in terms of recoverable energy that is lost through internal friction in a viscoelastic material such as polymer and composites. A low value of tan δ indicates that the material is elastic and a high value indicates a hard non-elastic material. The tan δ value of the hybrid as well as the nanocomposites is given in Table 3, which reveals that the composites are harder and less elastic than the hybrid. As the nanoparticles concentration increases, movement of molecular chains at the interface decreases and increases the damping factor. Tg corresponds to the maximum tan δ value, and subsequently the material moves to the rubbery region. In this region, the molecular segments are quite free to shift and this results in the lower tan δ value. The maximum tan δ is relatively higher for nanoparticles incorporated composites. As the value of damping factor increases, the composites have good interface adhesion between nanoparticles and polymer hybrid. The maximum tan δ in the case of nanoparticles added composite reflects the fact that stress transfer increases along with the interfacial interaction between the nanoparticles and the hybrid. Therefore, higher the tan δ value less is the degree of molecular mobility. Hence, it is apparent from the investigation that nanocomposites prepared have better stability than the pure polymer hybrid. 26
SEM analysis
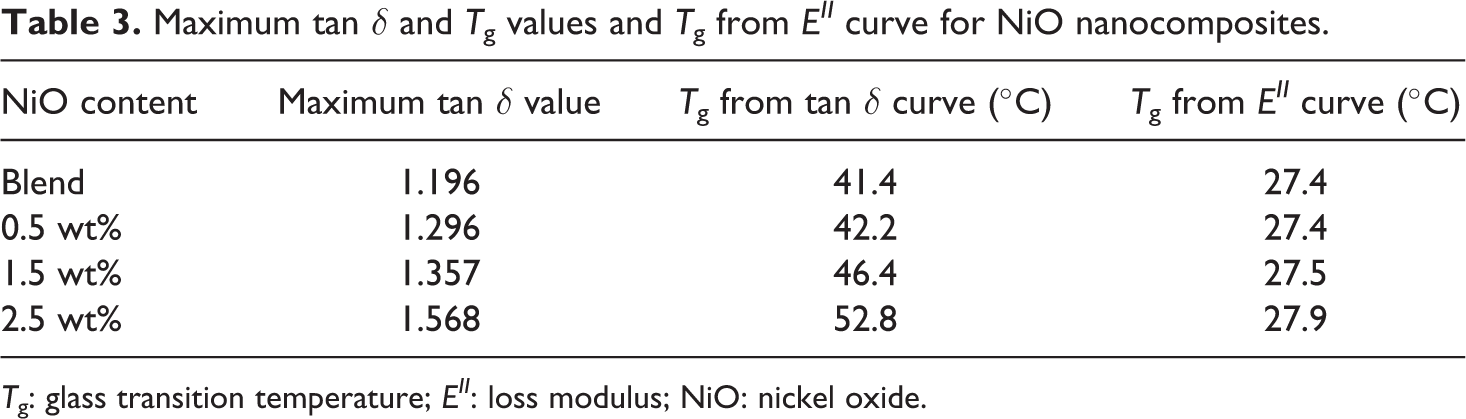
The surface morphology of the hybrid and NiO nanoparticles filled nanocomposites is displayed in SEM micrograph (Figure 8). Figure 8(a) shows the micrograph for the polymer hybrid of PUD and PCL, which discloses a uniform hybrid is obtained by miscibility between PUD and PCL. Figure 8(b) to (f) reveals the dispersion of nanoparticles (0.5–2.5 wt%) in the hybrid. In addition, it is observed that there are no cracks or fractures in the nanocomposites irrespective of the composition. The figures also reveal the homogenous nature of the composites.
SEM images of PUD/PCL-NiO nanocomposites. (a) Blend, (b) 0.5 wt% NiO nanocomposite, (c) 1.0 wt% NiO nanocomposite, (d) 1.5 wt% NiO nanocomposite, (e) 2.0 wt% NiO nanocomposite and (f) 2.5 wt% NiO nanocomposite.
HR-SEM analysis
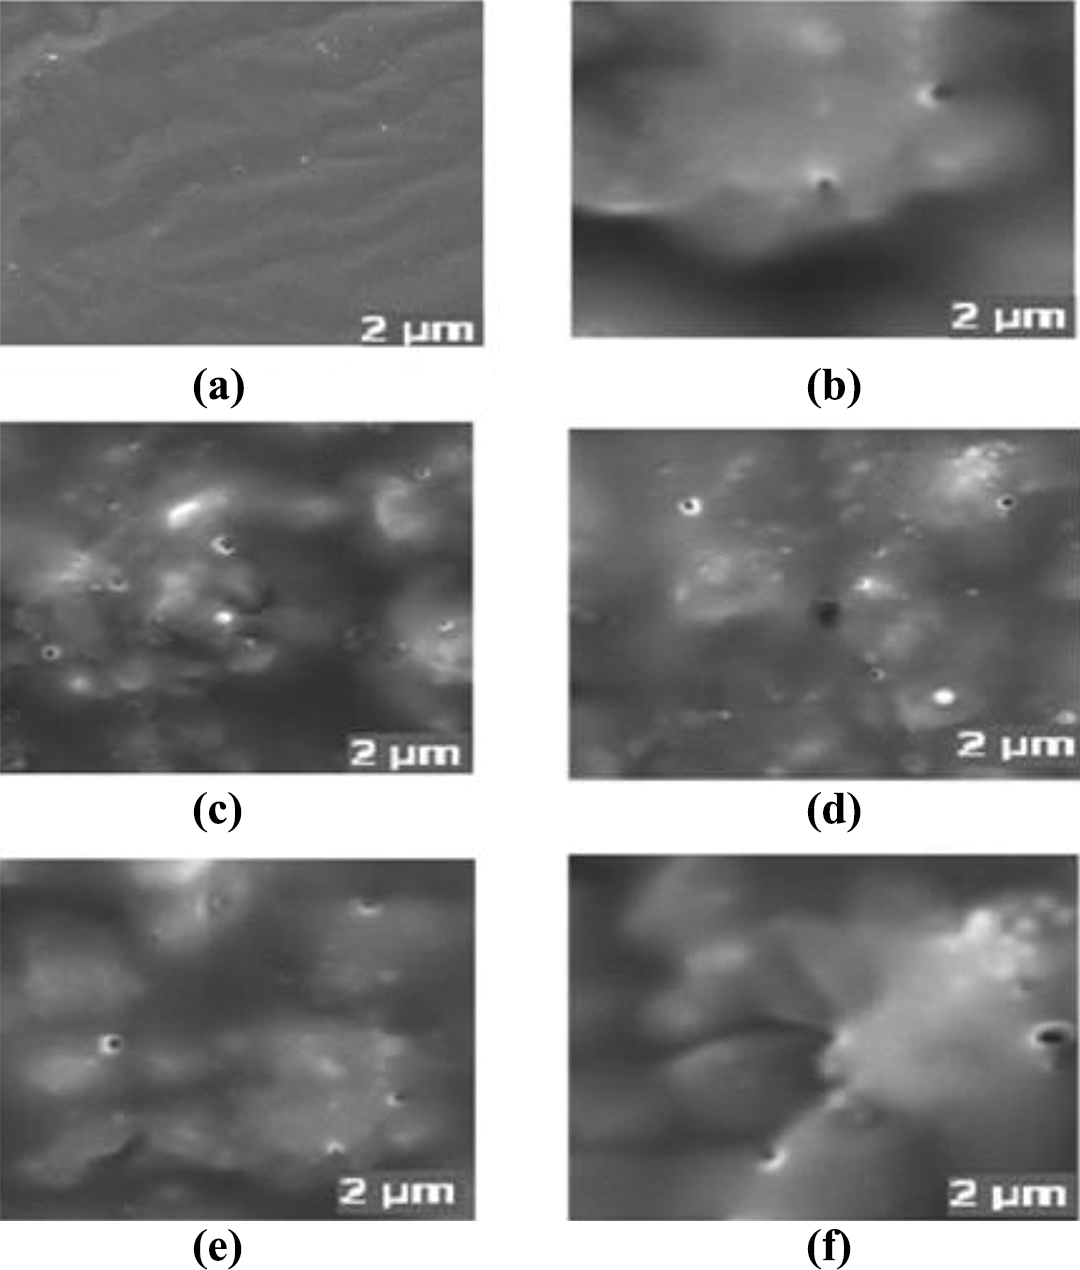
The HR-SEM micrographs (Figure 9) showed the surface morphology of NiO nanocomposites. They reveal that the two polymers utilized for composite preparation, PUD and PCL, are miscible with each other and then form a homogeneous hybrid. The size of NiO nanoparticles used for composite preparation is <50 nm.
HR-SEM images of PUD/PCL-NiO nanocomposites. (a) Blend, (b) 0.5 wt% NiO nanocomposite, (c) 1.0 wt% NiO nanocomposite, (d) 1.5 wt% NiO nanocomposite, (e) 2.0 wt% NiO nanocomposite and (f) 2.5 wt% NiO nanocomposite.
From the image, that the nanoparticles in the hybrid are spherically shaped. 27 Figure 9(c) shows 1.0 wt% NiO nanoparticles incorporated hybrid; the particle size ranges from 80 nm and rarely to 100 nm. Figure 9(d) shows 1.5 wt% NiO nanoparticles containing composite; the particle size of which ranges from 50 nm and seldom to 200 nm. Figure 9(e) shows 2.0 wt% NiO nanoparticles filled composite; the particle size is around 130 nm. Figure 9(f) shows 2.5 wt% NiO filled composite; the particle size of which ranges from 40 nm to rarely around 300 nm. This obviously indicates that as the concentration of nanoparticles to the hybrid increases, the particle sizes also raise but not to the extent of agglomeration. The figure highlights the fact that both polymers form a miscible hybrid and nanoparticles are present in the composites mainly as monomers, but also seldom present as dimer/trimer, but no agglutination has taken place. The images also revealed that nanocomposites are highly homogenous in nature.
TEM analysis
The TEM bright field image with corresponding selected-area electron diffraction patterns of the NiO nanoparticles in polymer hybrid is revealed in Figure 10(a) to (e). TEM images showed that the NiO nanoparticles from the hybrids are cubic-like structure and the average particle size is measured to be approximately 50 nm. TEM images clearly revealed that the nanoparticles in the composites prepared did not agglomerate with themselves and, therefore, one of the constituent exists in the nanoscale. Hence, the prepared composites prevailed as nanocomposites and the preparation method adopted in this work can be extended to prepare nanocomposites in the large scale. The SAED pattern was recorded from the individual nanocomposites which indicated that the NiO nanoparticles are visualized as spotty ring patterns without any additional diffraction spots and also indicated the crystalline nature of the nanoparticles added. Further, it also revealed the fact that nanoparticles added to the hybrid exist in nanoscale in the composites and not agglomerated. 28 Heating of nanocomposites for thorough drying also aids particle agglomeration in magnetic nanoparticle systems. 29
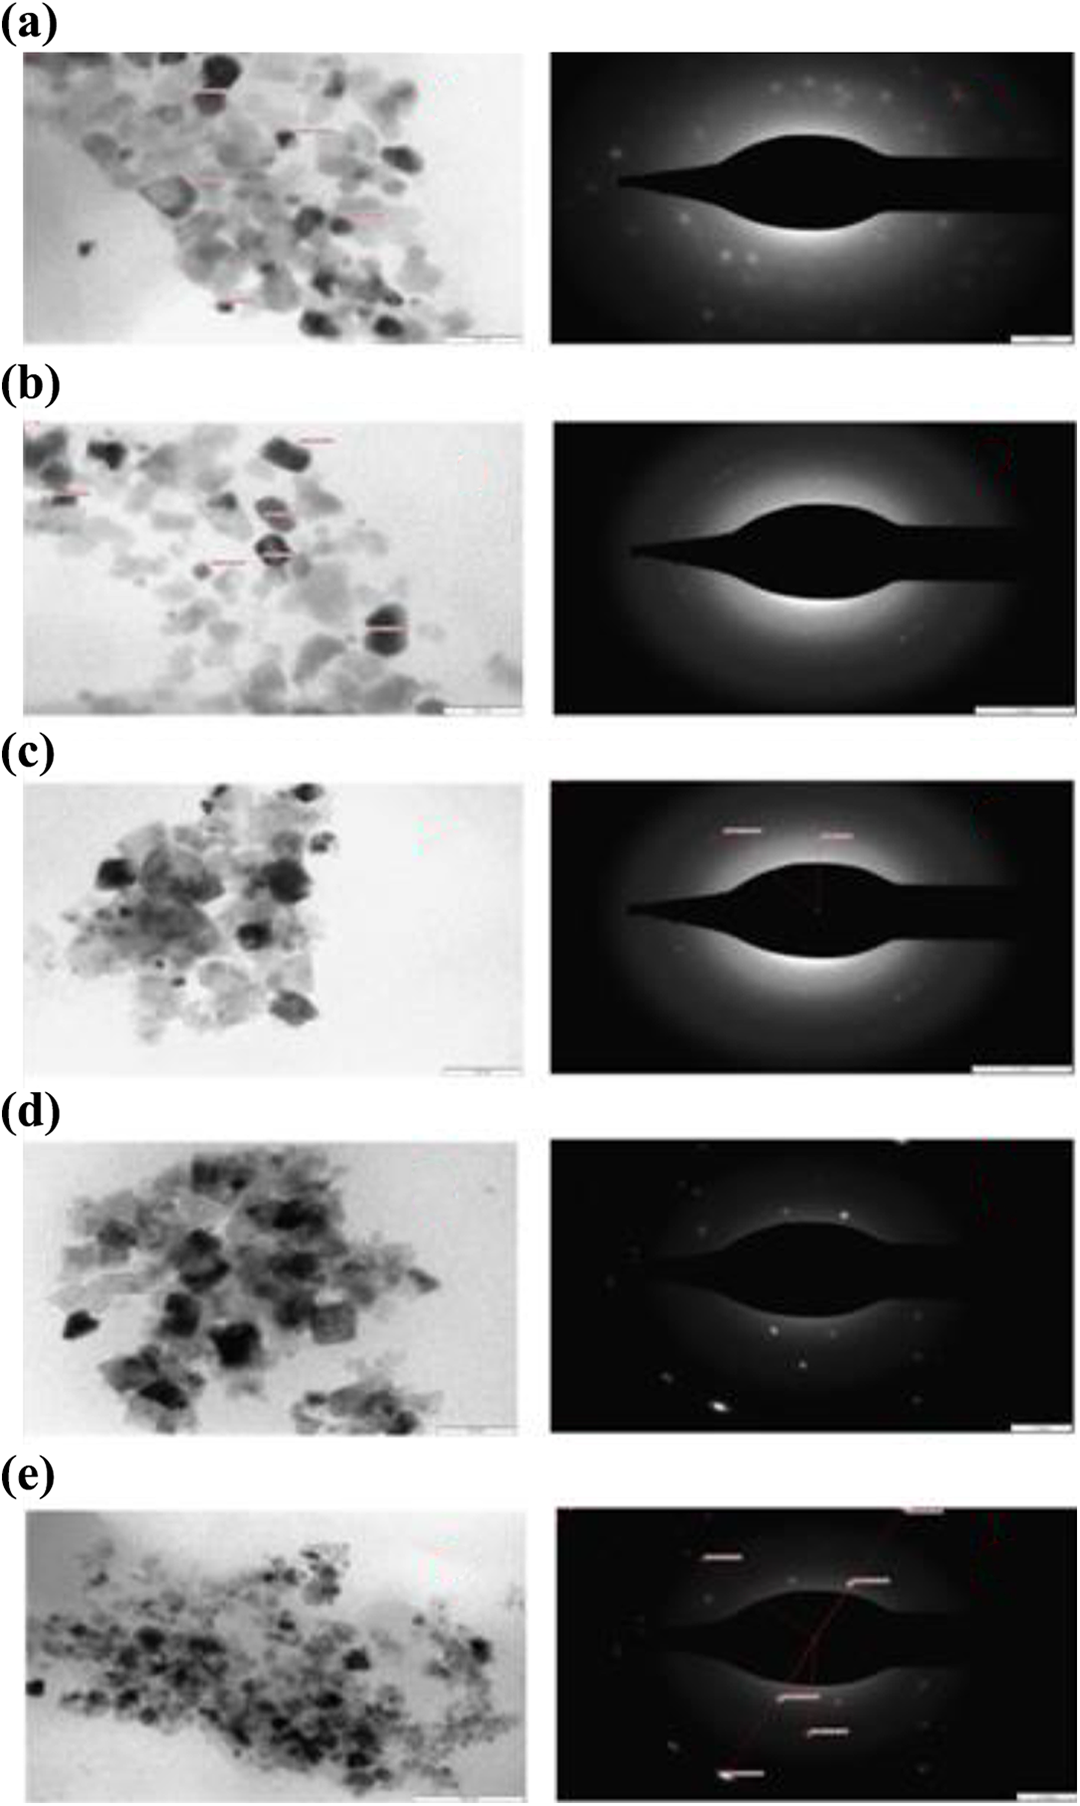
TEM images and SAED pattern for PUD/PCL-NiO nanocomposites. (a) 0.5 wt% NiO nanocomposite, (b) 1.0 wt% NiO nanocomposite, (c) 1.5 wt% NiO nanocomposite, (d) 2.0 wt% NiO nanocomposite and (e) 2.5 wt% NiO nanocomposite.
VSM analysis
The magnetic field versus magnetization curve at room temperature was recorded with the field strength of −15 kOe to 15 kOe. From these measurements, the saturation magnetization (Ms), remanence magnetization (Mr) and coercivity were derived and listed in Table 4. Figure 11 displays a typical hysteresis loop found at room temperature for pure hybrid and NiO nanoparticles reinforced polymer hybrid (0.5–2.5 wt%). The coercivity, Ms and Mr of nano-NiO were reported as 452.66 Oe, 1.19 emu g−1 and 98.4 × 10⁻³ emu g−1, respectively, and it exhibited ferromagnetic nature. 30 From Table 4, it can be seen that the coercivity is 97.27 Oe of PUD/PCL hybrids. Hence, the prepared hybrid is soft magnetic material, since the coercivity value is below 100 Oe. 31 However, when NiO nanomaterial is added to the hybrid, the coercivity increased in the range of 112.94–160.56 Oe (0.5–2.5 wt % nanocomposites) and makes themselves as magnetically hard nanocomposites. The hysteresis loop area of the nanocomposites depends on the concentration of NiO nanomaterial in the PUD/PCL hybrid. On the other hand, the Ms of various nanocomposites under investigation increased from 61.334 × 10⁻⁶ emu g−1 to 86.772 × 10⁻⁶ emu g−1. The raise in Ms value indicates the ability of the nanocomposites to increase the magnetic flux density as the loading of NiO is increased, which reveals the better magnetic properties of the composites prepared. The Mr of the various nanocomposites increased from 6.82 × 10⁻⁶ emu g−1 to 10.263 × 10⁻⁶ emu g−1, which is higher than the hybrid alone (6.6318 × 10⁻⁶ emu g−1). Mr values clearly review that greater the magnetic moment is sustained even after the elimination of external magnetic field for composites. The SQR value for NiO nanomaterial was found to have 82.68 × 10⁻³, indicating that they do not possess the properties of recording medium. 30 Studies indicate that NiO nanoparticles filled PUD/PCL hybrid exhibits a ferromagnetic character in contrast to anti-ferromagnetic bulk material. 30,32 This ferromagnetic behaviour takes place due to the presence of super paramagnetic metallic Ni cluster within the NiO lattice. 33 However, other studies reveal that the ferromagnetic behaviour arises in the NiO nanoparticles is not due to the presence of metallic or Ni2+ ions but due to the arrangement of NiO in the nanoparticles system. 34
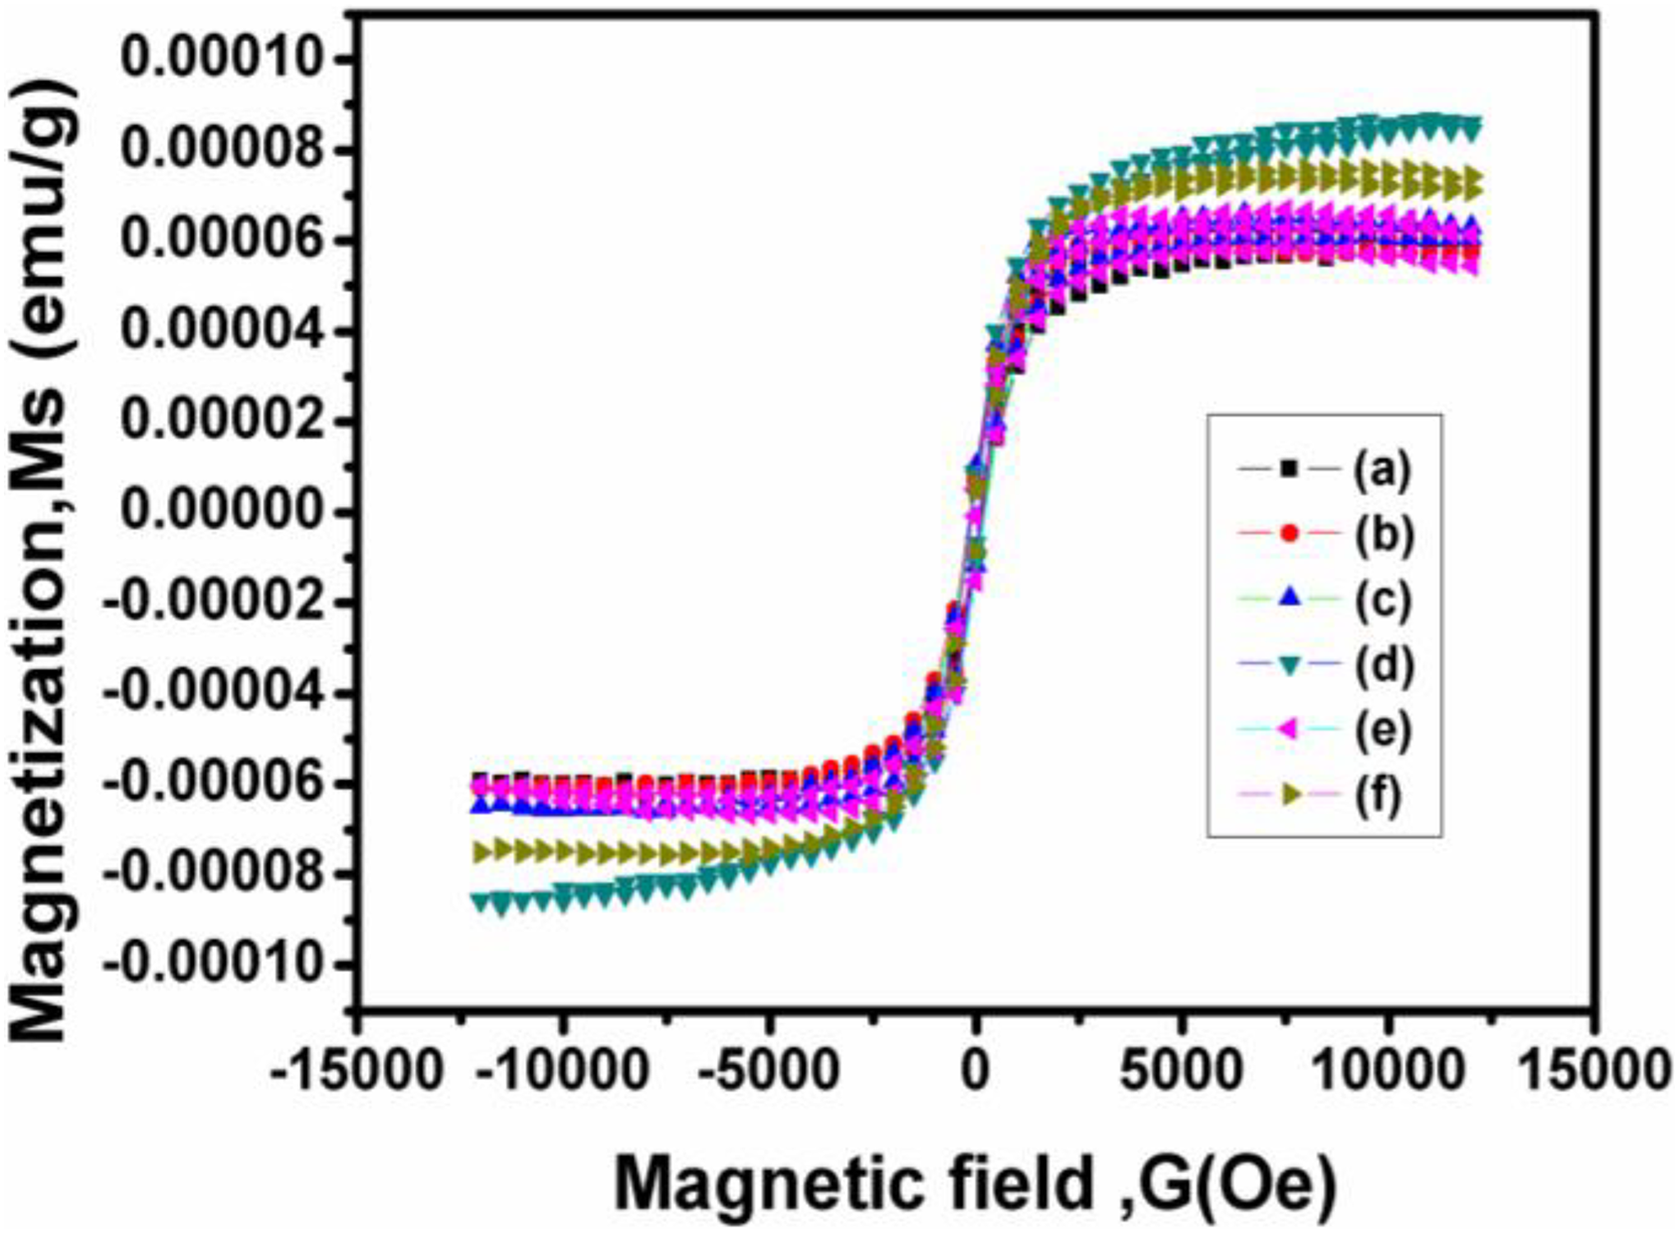
VSM of PUD/PCL-NiO nanocomposites. (a) Pure blend, (b) 0.5 wt% NiO nanocomposite, (c) 1.0 wt% NiO nanocomposite, (d) 1.5 wt% NiO nanocomposite, (e) 2.0 wt% NiO nanocomposite and (f) 2.5 wt% NiO nanocomposite.
Magnetic parameters for PUD/PCL-NiO nanocomposites.
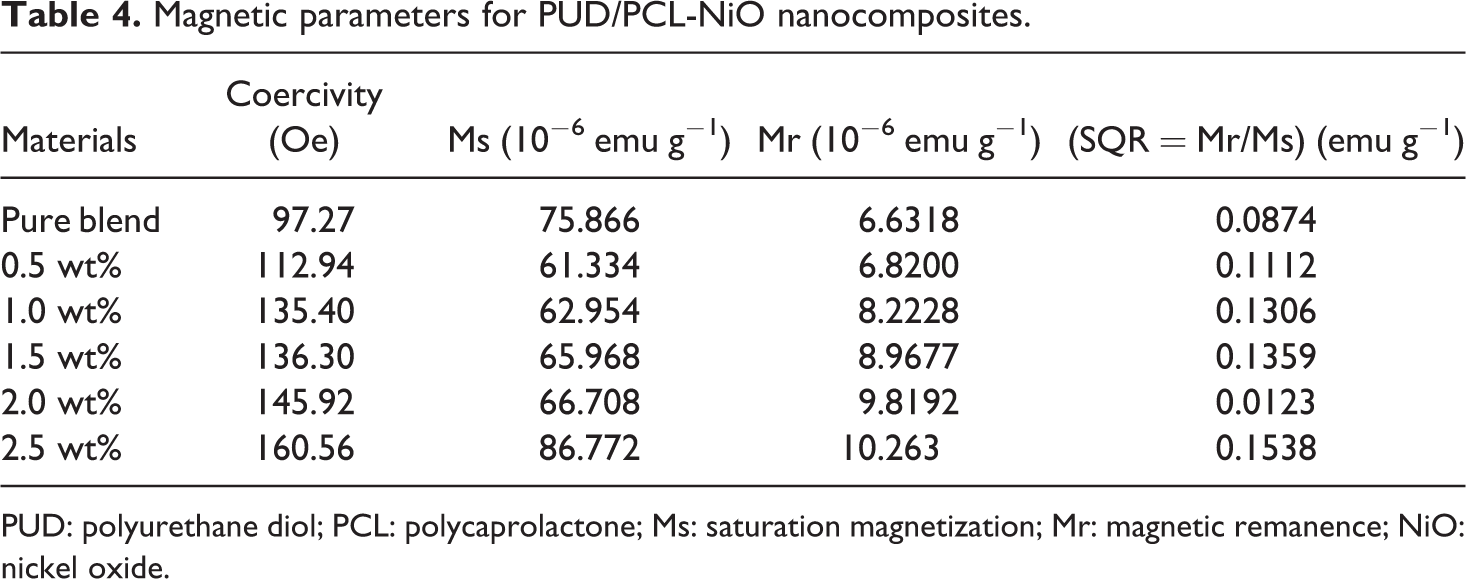
PUD: polyurethane diol; PCL: polycaprolactone; Ms: saturation magnetization; Mr: magnetic remanence; NiO: nickel oxide.
Dielectric constant variation with temperature
The dielectric constant variation as a function of frequency by dissimilar temperatures is revealed in Figures 12(a) to (d). The dielectric properties of a polymer and their blends are determined by the charge division and also by statistical thermal movement of its polar group. Below Tg, the dipoles cannot easily orient themselves; however, when the temperature increases, the polymer become soft; therefore, the mobility of main chain and the rotation of side groups get improved. Hence, increase of temperature increases the dielectric constant. 35 In case of polar polymers, the dielectric constant begins to drop at a certain frequency. It is observed from Figure 12(a) of frequency range 1 kHz, the dielectric constant value for blend is very low when compared to nanocomposites. Dielectric constant value for frequency 1 kHz gradually increased from 30°C to 50°C, subsequently, this value got decreased. But for higher frequencies (10, 100 and 1000 kHz), dielectric constant values gradually increased as the temperature is increased. This variation of dielectric dispersion is attributed to the usual movement of the molecules from individual arrangement to another around the skeletal bond connecting large-scale conformational rearrangement, which results in different orientation polarization. 36 In fact, DSC results show that for various composites under investigation, the melting points were found to be around 60°C. This will change the conformational arrangement of atoms/groups in the nanocomposites that resulted in the decreased value of dielectric constant above 60°C.
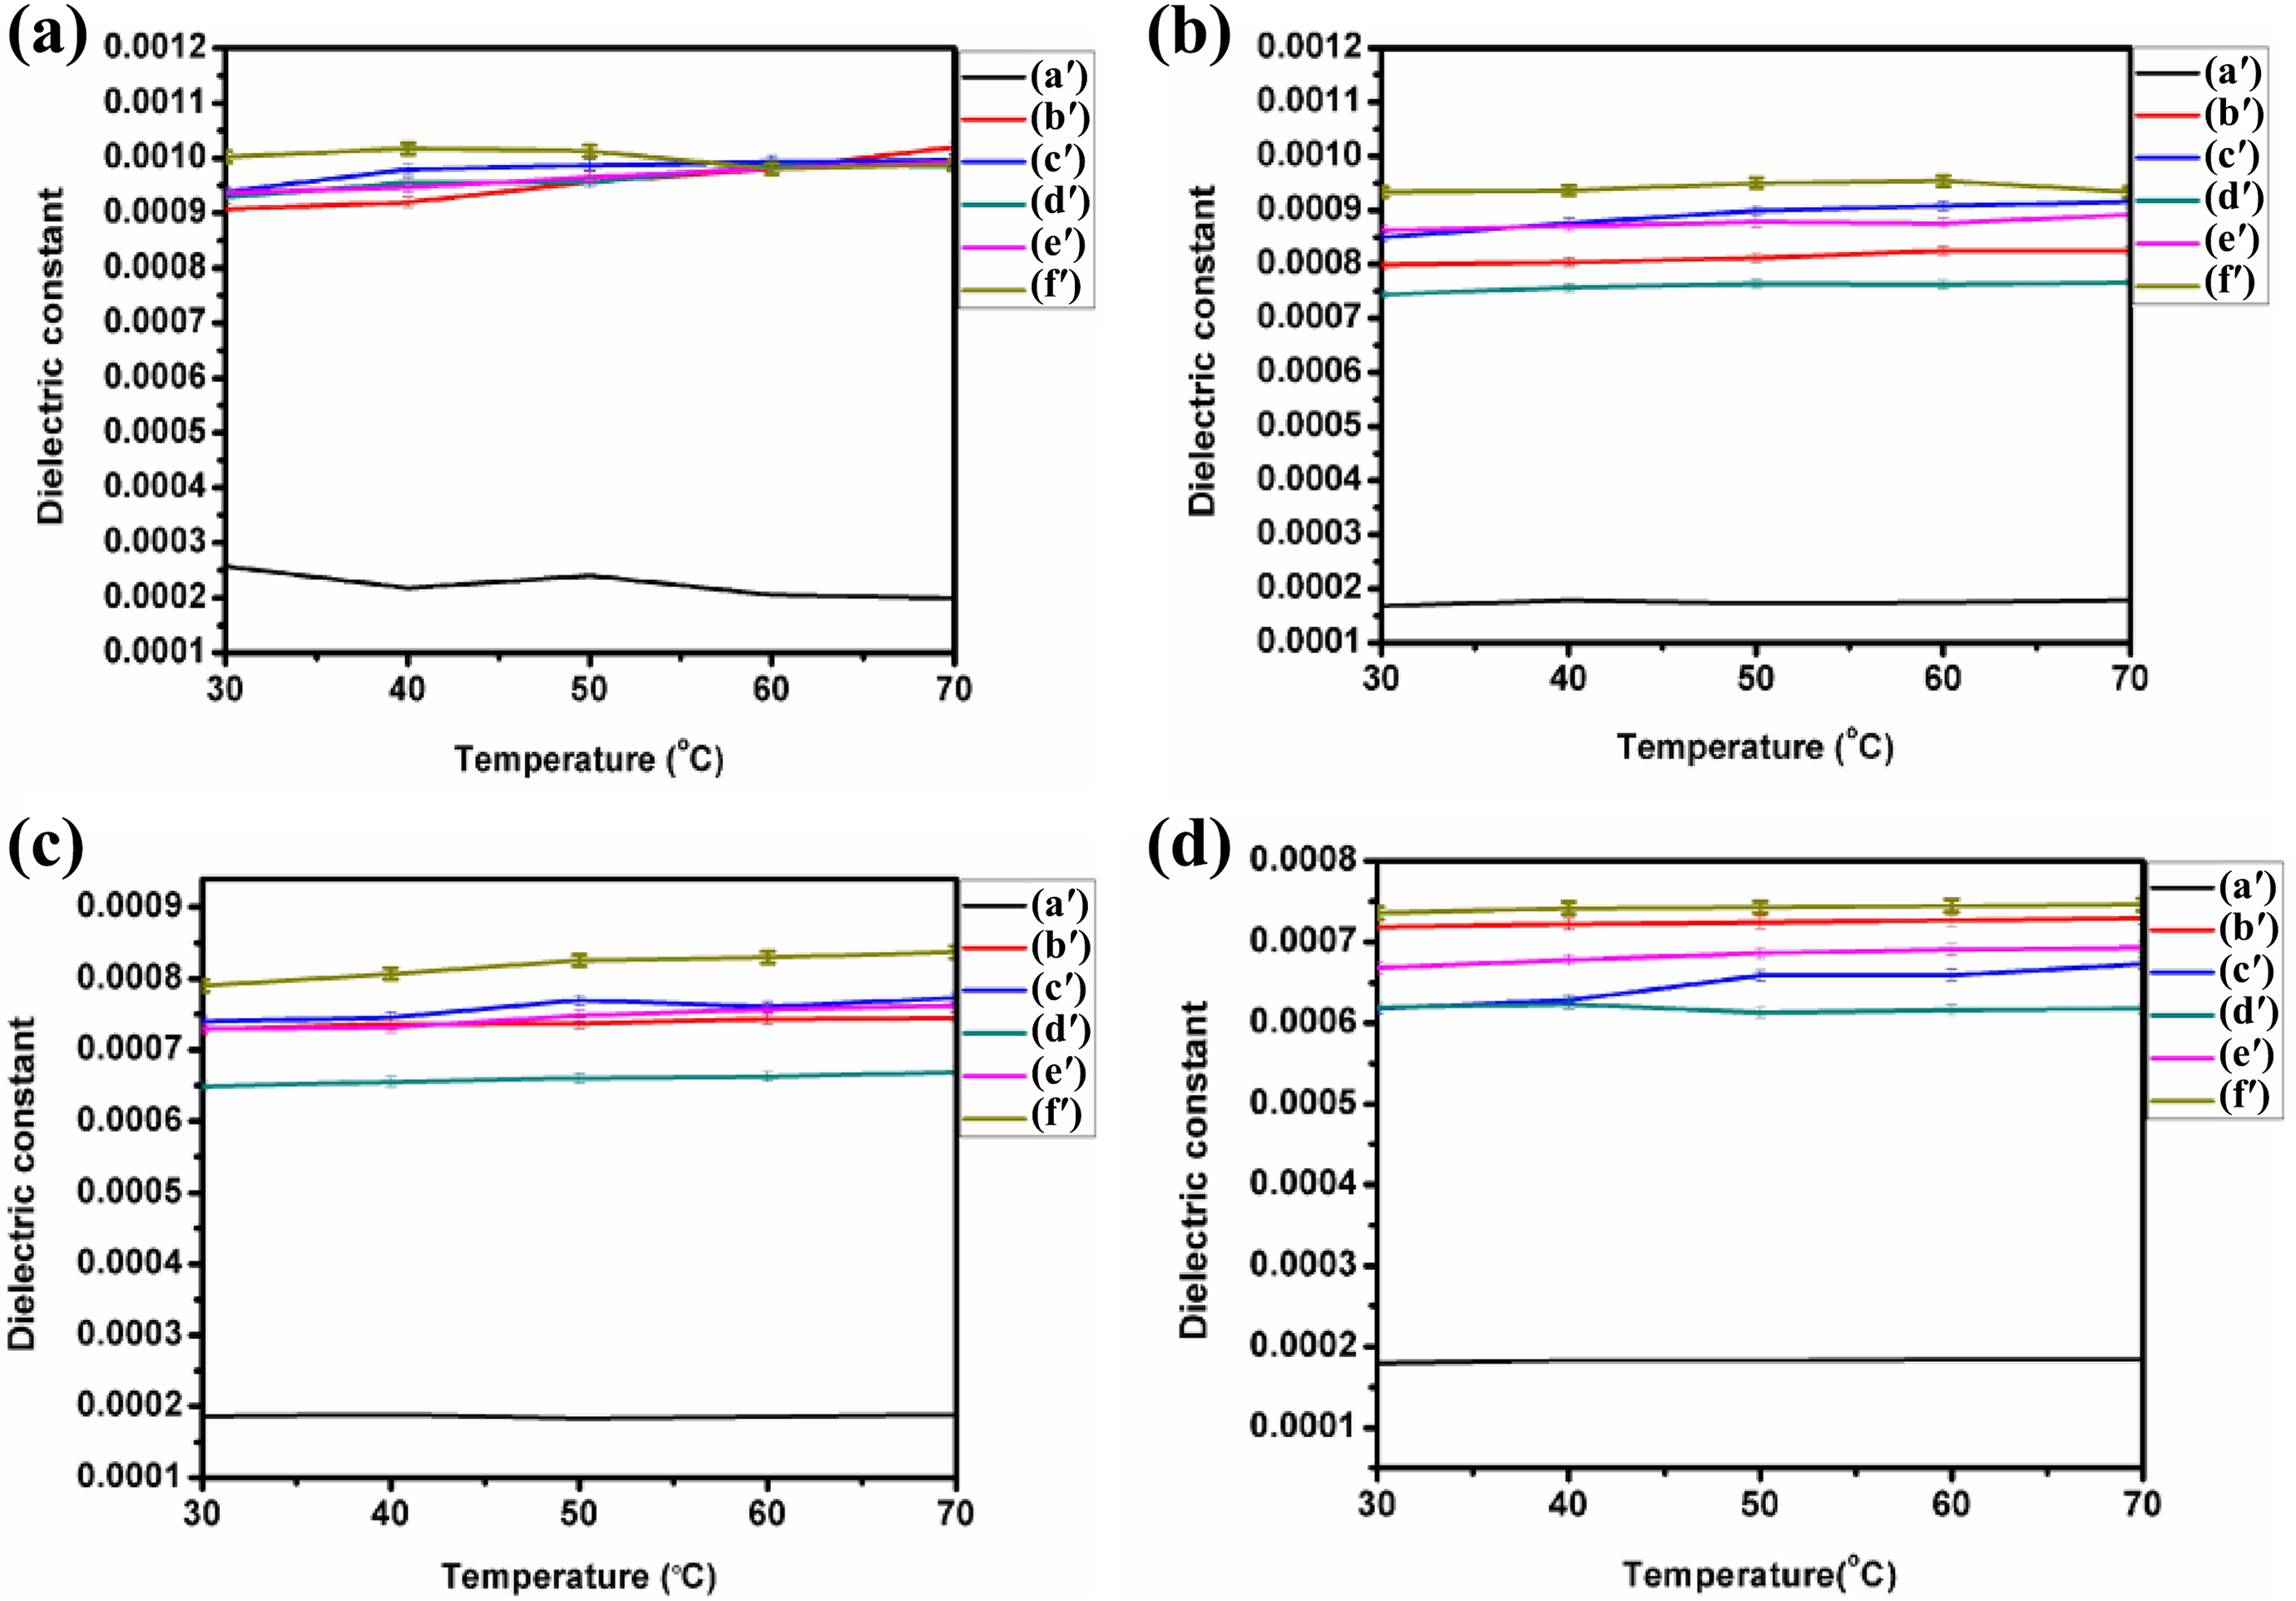
(a) to (d) Temperature and relative permittivity curves for frequencies 1,10,100 and 1000 kHz, respectively, for PUD/PCL-NiO nanocomposites. (a′) Blend, (b′) 0.5 wt% NiO nanocomposite, (c′) 1.0 wt% NiO nanocomposite, (d′) 1.5 wt% NiO nanocomposite, (e′) 2 wt% NiO nanocomposite and (f′) 2.5 wt% NiO nanocomposite.
Dielectric constant variation with frequency
Figure 13(a) and (b) depicts the variation of dielectric constant with frequencies at room temperature (30°C) and 70°C, respectively, for different concentration of NiO nanoparticles. It is noticed that as the frequency increases, the dielectric constant decreased at a fixed temperature. The high dielectric constant at lower frequency is owing to the interfacial polarization generated in between the polymer composites. On the other hand, at high frequency, the dipoles align themselves due to insufficient time with the applied electric field for the polymer composite and, therefore, lower the interfacial polarization. 37,38 It also shows the dielectric constant value for pure blend at room temperature is very low value, but the addition of NiO nanoparticles to the blend shows almost 10 times higher dielectric constant values. The frequency dependence at 70°C (Figure 13(b)) for blend has increased slightly. Small increases of dielectric constant values for other composites than at room temperature were also observed. The low value for blend may be due to the space charge polarization at sample electrode line but high value can be associated to the orientation polarization property owing to relaxing dipoles. 39
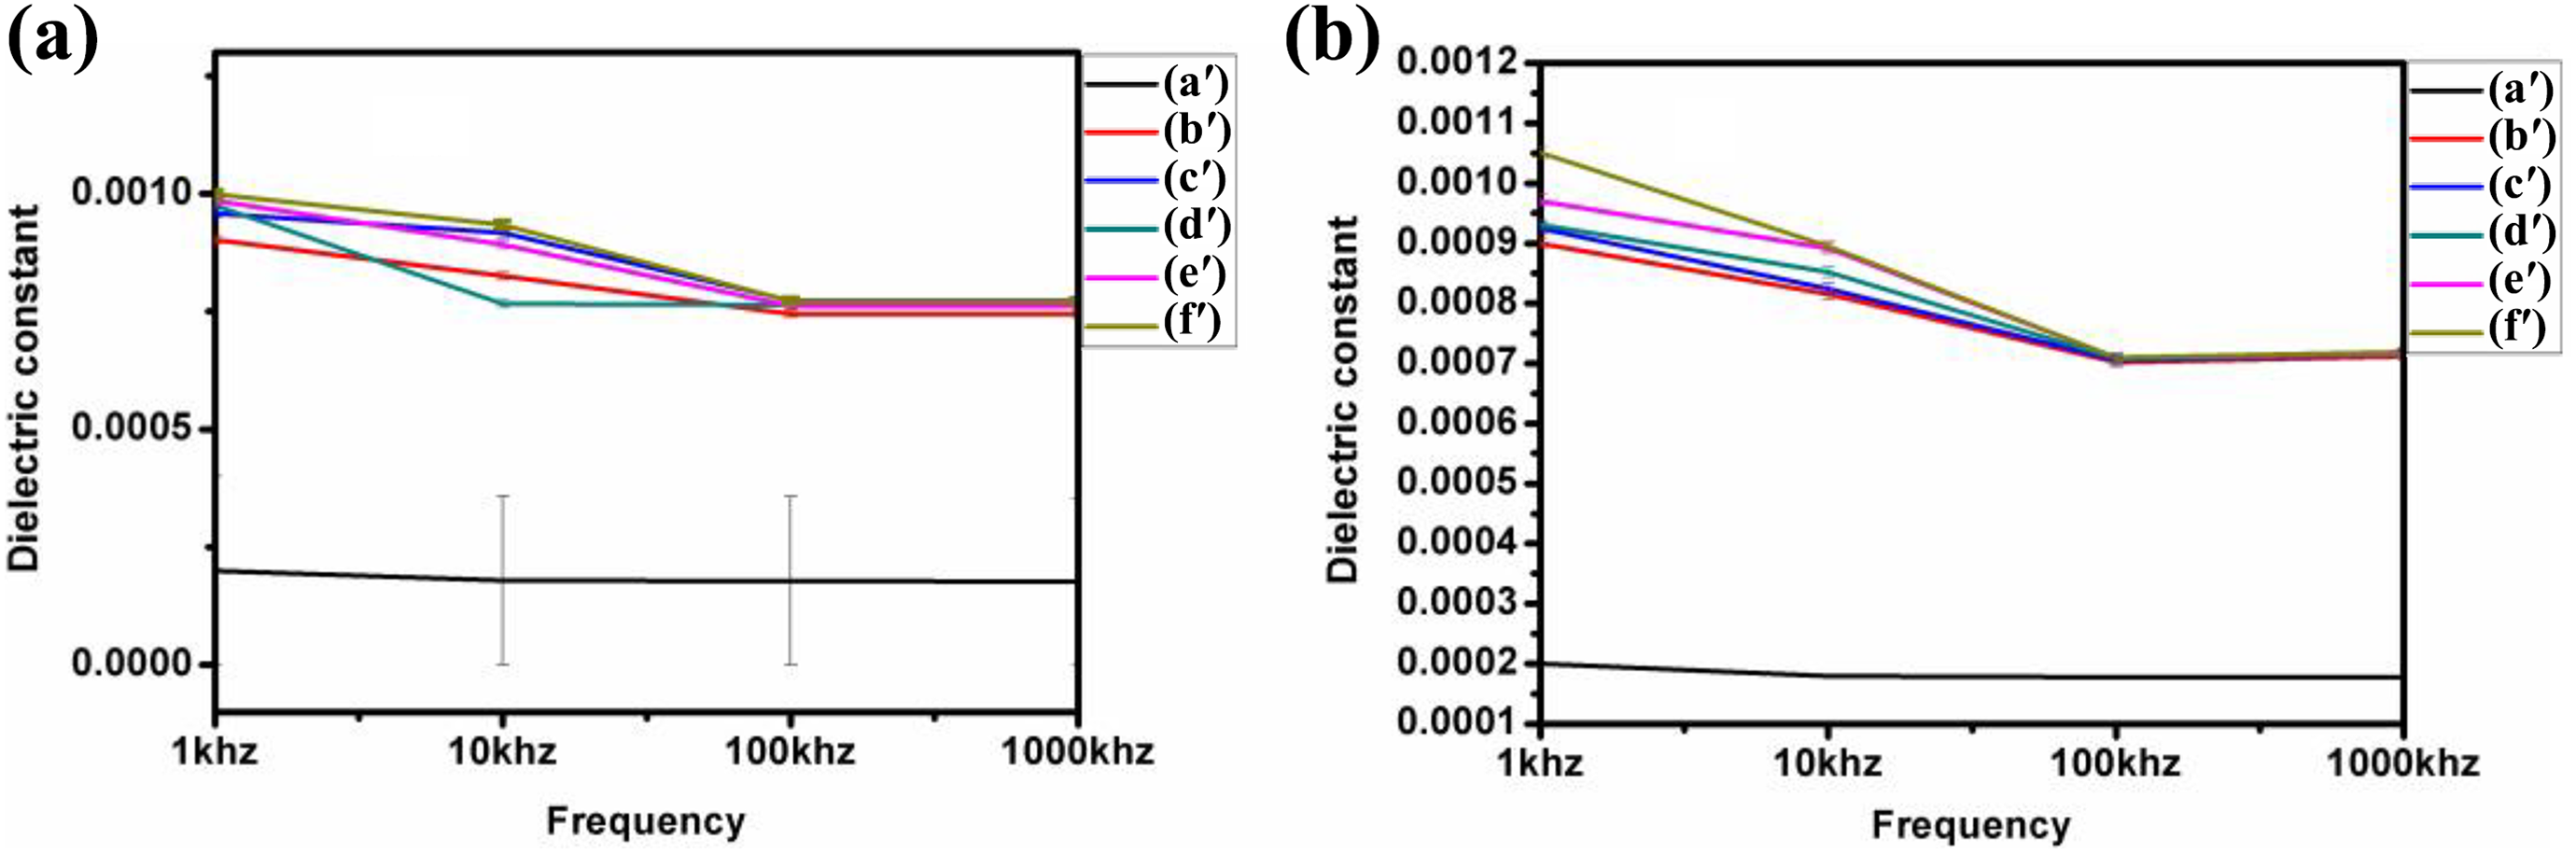
(a) and (b) Dielectric constant variation with frequency at room temperature (30°C) and 70°C for PUD/PCL-NiO nanocomposites. (a′) Blend, (b′) 0.5 wt% NiO nanocomposite, (c′) 1.0 wt% NiO nanocomposite, (d′) 1.5 wt% NiO nanocomposite, (e′) 2 wt% NiO nanocomposite and (f′) 2.5 wt% NiO nanocomposite.
Conductivity
Thermal dependence of electrical conductivity of PUD/PCL blend and PUD/PCL-NiO nanocomposites for various frequency ranges are revealed in Figure 14(a) to (c). The reported electrical conductivity of PU was from 10−12 to 10−8 S m−1 at room temperature. 40 PCL, on the other hand, has conductivity in the range of 1.86 × 10⁻¹¹ S cm−1 at room temperature. 41 But the conductivity value for NiO nanoparticles is the order of 0.1 × 10⁻⁷ S cm−1 at room temperature. 31 From the figure, the conductivity value for pure blend has increased from 4.6 × 10⁻⁷ to 3.5 × 10⁻⁶ S cm−1 for different frequency ranges selected. When the concentration of NiO to the blend increases, the conductivity values also increased for various frequencies examined. Electrical conductivity changes in the polymer nanocomposites depend on the conductivity of the filler particles present in the polymer matrix. 42 It is obvious from the figure that as the temperature is increased, conductivity of PUD/PCL-NiO nanocomposites increased with the increase in concentration of NiO nanoparticles. This change is attributed to the fact that as the temperature is increased, the charge carriers are thermally activated and the free volume was increased that results in the creation of more vacant sites for the motion of ions, which improved the conductivity. 39
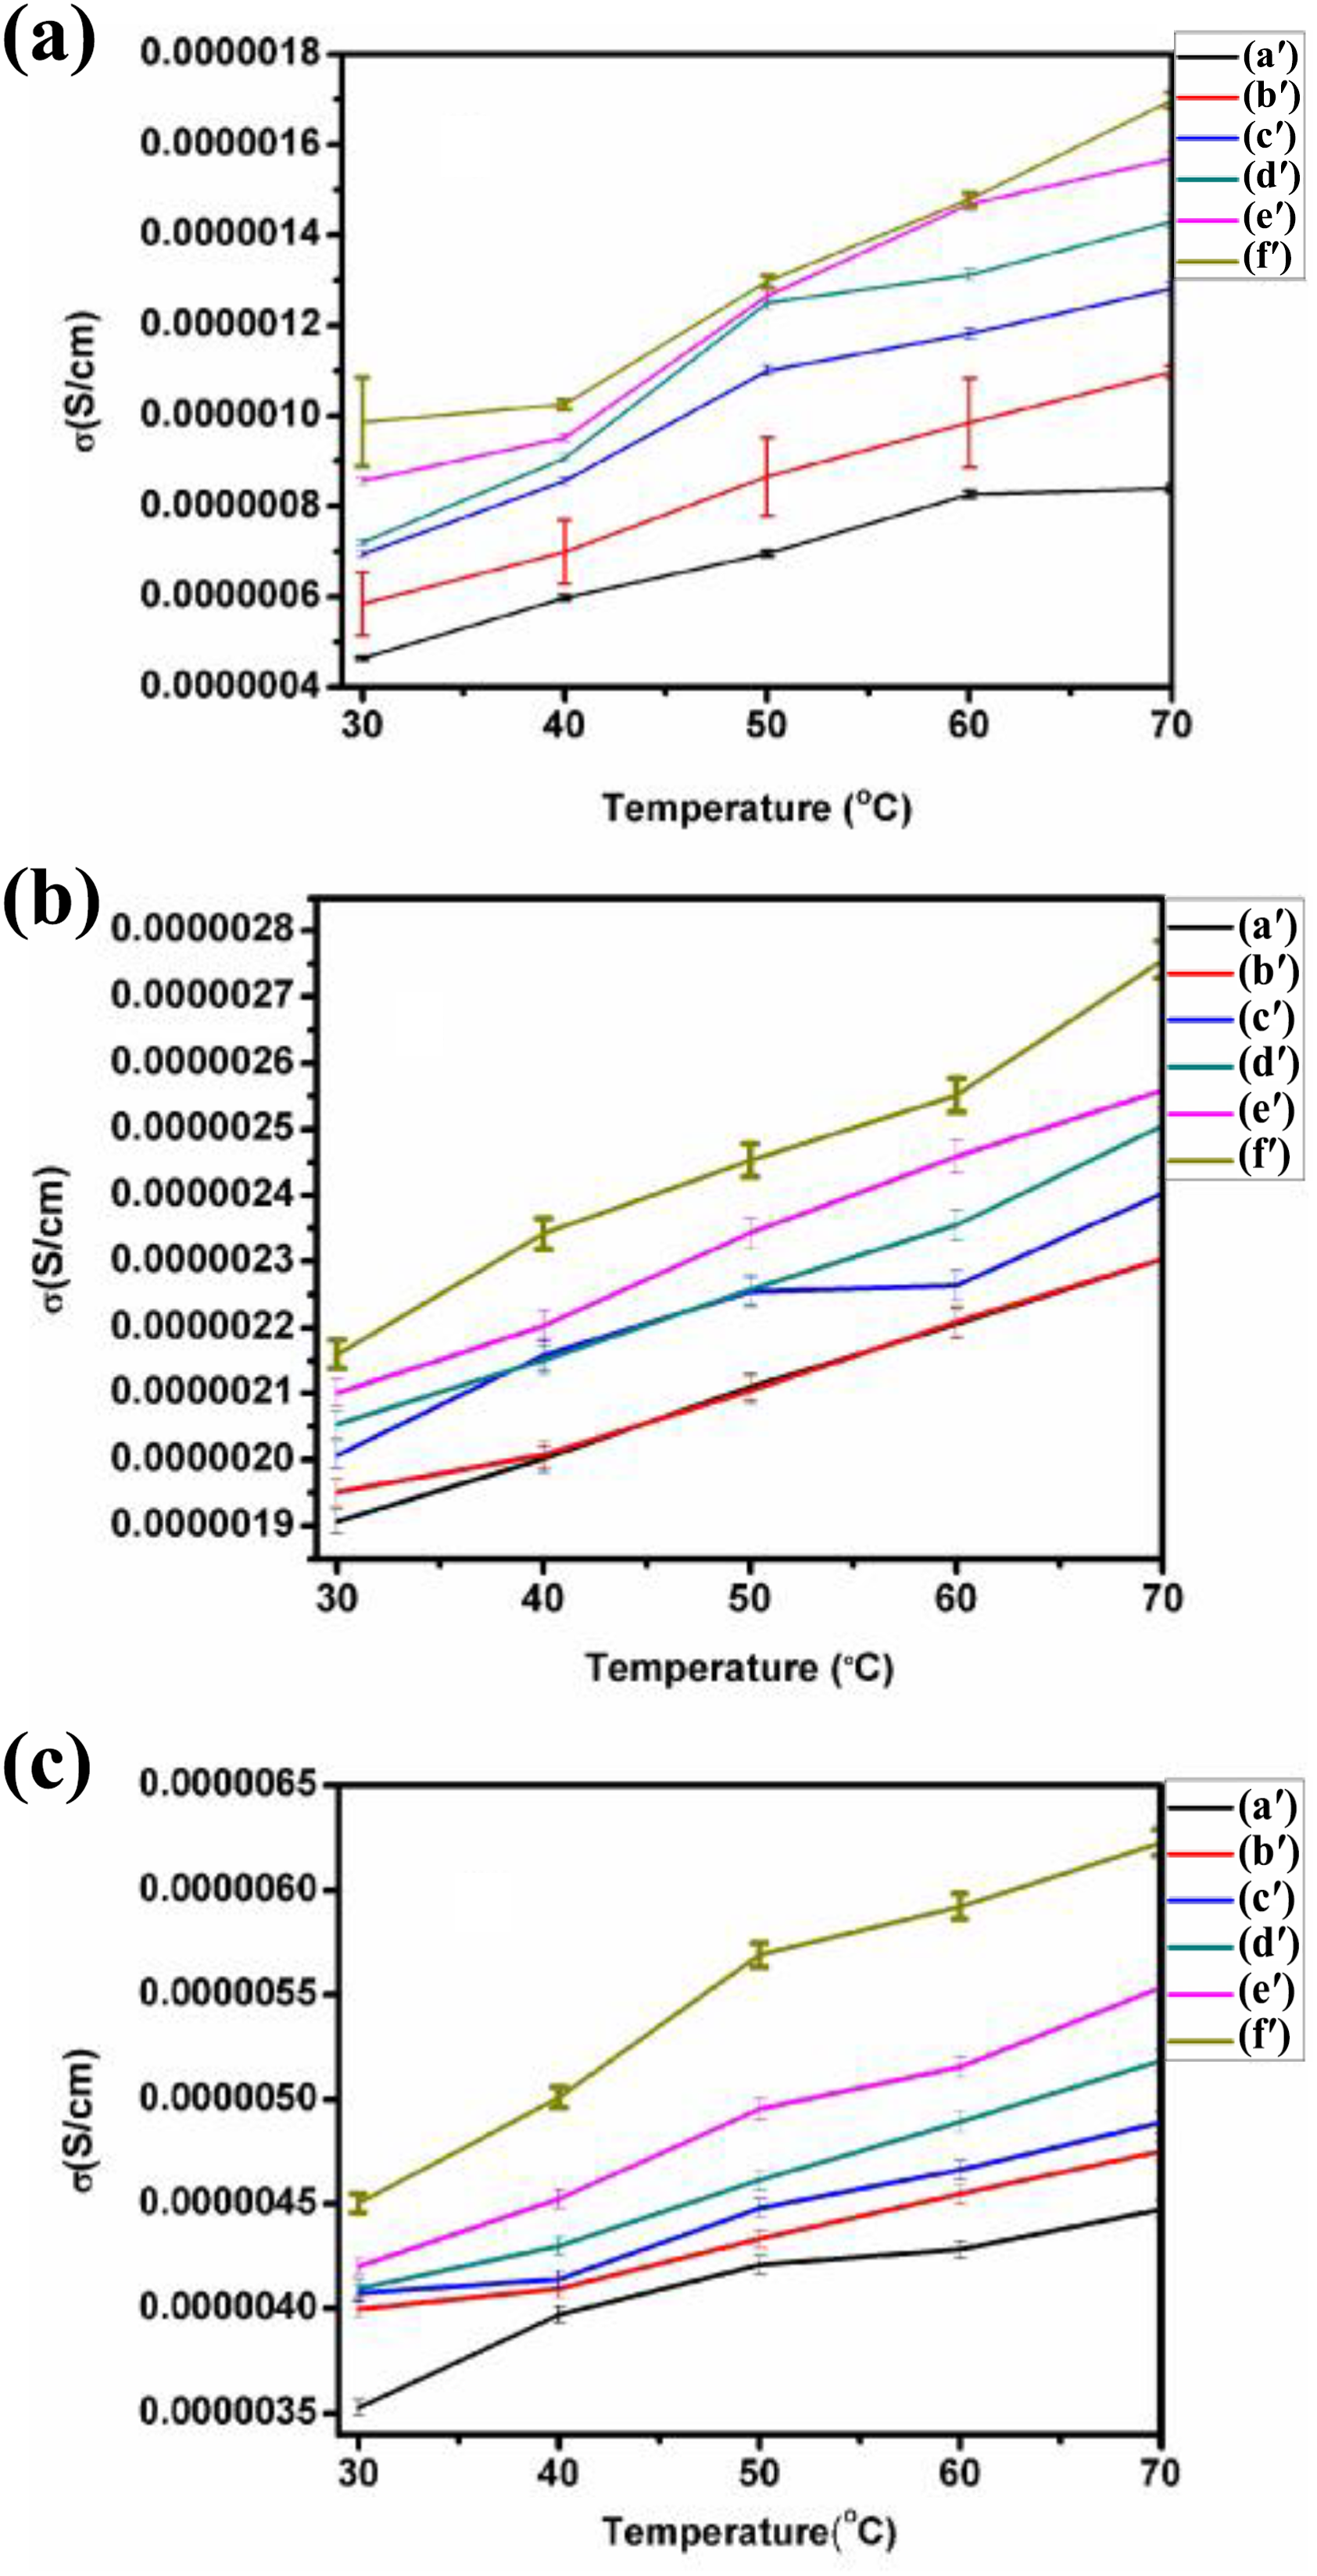
(a) to (c) Electrical conductivity for frequencies 1, 10 and 100 kHz for PUD/PCL-NiO nanocomposites. (a′) Blend, (b′) 0.5 wt% NiO nanocomposite, (c′) 1.0 wt% NiO nanocomposite, (d′) 1.5 wt% NiO nanocomposite, (e′) 2 wt% NiO nanocomposite and (f′) 2.5 wt% NiO nanocomposite.
Cyclic voltammetry
The electrochemical redox properties of PUD/PCL-NiO nanocomposites were analysed by CV techniques within the applied potential range of −0.8 to +1.0 V recorded by the scan rate of 50 mV s−1 with 1 M of potassium hydroxide solution at room temperature, as shown in Figure 15. The anodic and cathodic peak unambiguously demonstrates the reversible redox processes during the cyclic voltammetric measurements. The mechanism of NiO in alkaline electrolyte was reported as 43,44

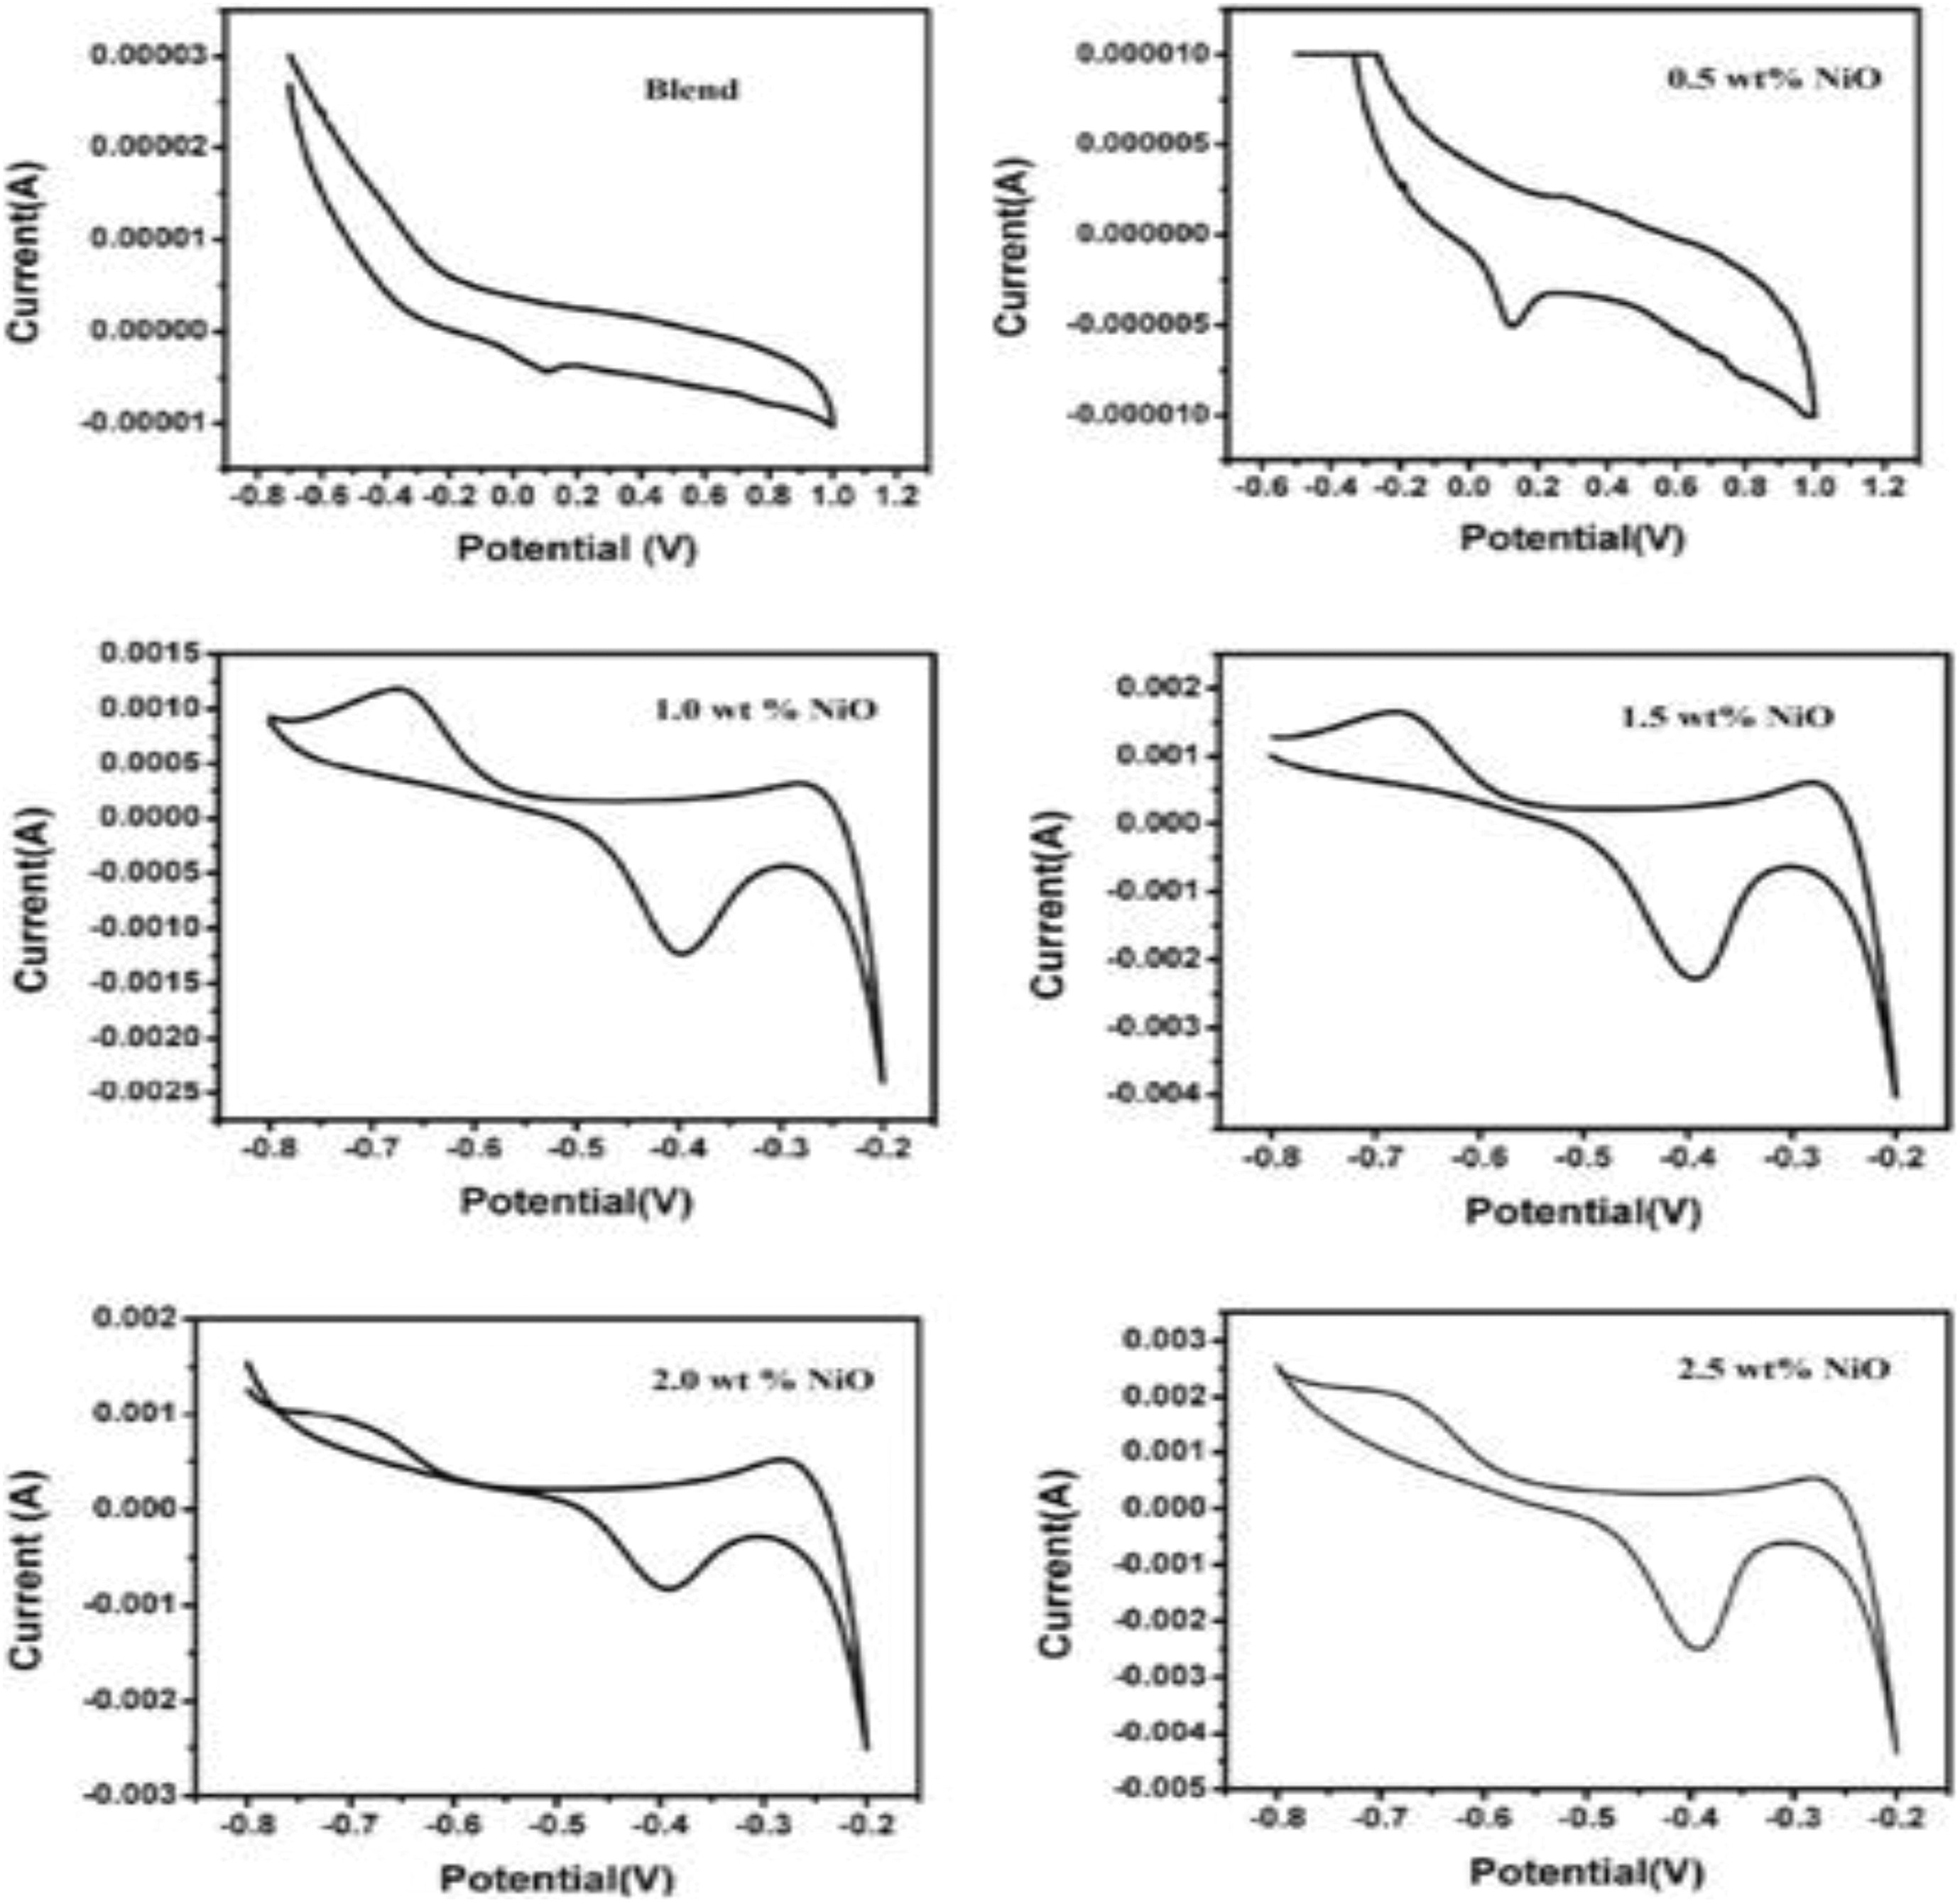
CV curves of various PUD/PCL-NiO nanocomposites.
The anodic and cathodic peaks correspond to the redox process, while charging NiO is oxidized to NiOOH but in discharging NiOOH is reduced to NiO. It is evident from the CV curves that the peaks correspond to the redox pair of Ni2+/Ni3+ by reversible faradaic reactions. Its corresponding current intensity is high due to the PUD/PCL-NiO composites with high concentration of NiO. The cathodic reduction potential values for the blend and 0.5 wt% nanocomposite are 0.117 and 0.124 V, respectively. But for blends with higher nanoparticles concentrations, namely, 1.0, 1.5, 2.0 and 2.5 wt%, reduction potential values are more negative at −0.382, −0.385, −0.392 and −0.395 V, respectively. The response current of the nanocomposites increases from the blend as the loading of the NiO is enhanced. NiO-CNT composites were reported to have potentials from −0.28 V to −0.178 V, which is similar to the values obtained in this work. Therefore, the nanocomposites prepared can be used as a non-precious metal promoter in microbial fuel cells. 45 The change in the reduction potential is due to the changes in the NiO concentration. The PUD/PCL-NiO nanocomposites, concentrations of NiO (0.5, 1.0, 1.5, 2.0 and 2.5 wt %) and their oxidation peak values range from −0.602, −0.666, −0.681, −0.676 and −0.706 V, which correspond to the redox reactions. The pair of redox peaks indicates that there are two sets of faradic reactions involved in the above reactions and the partial changes of the NiO nanocomposites coating on the electrode surface. 46
Conclusions
IR study demonstrates that the materials synthesized were nanocomposites since there is no chemical contact among NiO nanoparticles with polymeric hybrid. XRD results suggest that the prepared materials are crystalline in nature and along with HR-SEM and TEM images, they are confirmed to be as nanocomposites. TGA study indicates the improved thermal strength of polymer nanocomposites when compared to the individual polymers and PUD/PCL hybrid. The DSC thermogram gives the Tg values around 21°C for the prepared nanocomposites. DMA studies reveal that nanoparticles provide better stress transfer, adhesion for the composites than the hybrid, also impart toughening effect and thermal stability for the nanocomposites. NiO nanocomposites exhibit ferromagnetic property in contrast to anti-ferromagnetic bulk material. The dielectric constant values increase with increased loading of NiO nanoparticles in the composites. A 10-fold raise in dielectric constant values was observed for 0.5% nanocomposites when compared with the blend. As the nano-NiO loadings was increased in the composites, conductivity values also increased for various frequencies examined. Redox peaks obtained for the composites in CV studies reveal faradic cathodic and anodic processes. The cathodic potential observed was in comparison with the values already reported and, hence, can be used as a potential alternative for cathodic material in microbial fuel cells; advantage is a non-precious metal catalyst.