
Abstract
Polymer nanocomposites based on PP/Cu were obtained by the combining of ex-situ casting solution and hot pressing methods. The structure of polymer nanocomposites was characterized by XRD, SEM, EDS, AFM and FT-IR spectroscopy analysis. The thermal properties were analyzed using differential scanning calorimetry (DSC) and thermogravimetric analysis (TGA). It was found that the addition of copper nanoparticles to the PP polymer matrix increases the thermal stability of the polymer, and this thermal stability reaches its maximum value at 3% content of copper nanoparticles in the polymer. The reason for the increase in the thermal properties of nanocomposites is associated with the formation of a more perfect, dense and ordered structure of PP-based composites and the fact that nanoparticles play the role of a nucleus of crystallization for polymer matrices.
Introduction
In the past decade, nanocomposites based on polymer matrix have received considerable physical and chemical properties. The thermal stability of polymers and polymer based-composite materials is one of the most important characteristics when choosing a field of application. Changes in polymeric materials by exposure to elevated temperatures and oxygen in the air lead to a sharp drop in physical and mechanical properties, the release of low molecular weight products often toxic and fire hazardous. The thermo-oxidative properties of polymers depend mainly on the chemical composition and structure of the polymer chain, the structure (crystallinity degree and orientation) of the material, the nature, and the concentration of fillers. In the investigation of the polymer-based nanocomposites’ thermal stability, various nanocomposites system have been involved in, such as PP/Al2O3, 1 PP/ZnO, 2 PP/SiO2, 3 PE/TiO2, 4 PP/TiO2, 5 PP/Cu2O, 6 PP/silsesquioxane, 7 PP/ZrO2, 8 PP/Fe3O4,9,10 PP/Ag2S, 11 PE/silica, 12 PE/CNT/TiO2, 13 PP/MCWNT, 14 PE/MCWNT, 15 PVDF/SiO2, 16 PVDF/ZnO, 17 PVDF/clay, 18 PVDF)/graphene 19 etc. The literature review demonstrates that the incorporation of nano-sized mineral materials or other metal oxides will affect the thermal stability of nanocomposites. Almost all these nanocomposites show better thermal stability than their polymer matrix. However, the thermal stability of polymer/metal-based nanocomposites has been rarely investigated. It is still unclear whether the thermal stability of polymer/metal-based nanocomposites is similar to that of polymer/non-metal–based ones or not. Polypropylene (PP) is one of the most prevalent synthetic polymer that is widely applied in various fields. Because of combination of low cost, high chemical resistance, and well balanced mechanical properties, isotactic polypropylene (iPP) is one of the most widely used thermoplastics. Polypropylene (PP) polymer is also possessed several applications, such as automotive components, aerospace, laboratory equipment’s, plastic parts, food packaging, geotextiles and containers. Unfortunately, the relatively low fire resistance and thermal characteristics restrict the conditions and fields of its practical application. Polypropylene is also considered a fairly easily oxidized material at temperatures above 140°C in air and is combustible (oxygen index is 17.4). It is due to the mobility of the hydrogen atom and the methyl group at the tertiary carbon atom. At the first stage, the oxidation of methyl groups occurs, as a result of which hydroperoxides are formed and accumulated in PP. Their decomposition leads to the appearance of free radicals, which start a chain reaction of oxidative destruction, accompanied by the breaking of the polymer backbone. It should be noted that the combustion of PP due to its poor coking properties is accompanied by the formation of burning droplets, which contributes to the spread of fire. Therefore, various stabilizers, antioxidants, and anti-pyrenees are necessarily introduced into PP. Two types of stabilizers are used: (1) interacting with primary radicals, suppressing the development of a chain oxidation reaction, for example, butylhydroxytoluene, (2) causing the decomposition of hydroperoxide groups formed in the first stage of PP oxidation, for example, phosphites and thioethers. Often both types of stabilizers are combined to obtain a synergistic effect. To abandon organic stabilizers, active research is currently underway on the effect of various inorganic fillers on the oxidation and combustion of PP. The incorporation of inorganic nanoparticles in polymer has been found to improve the thermal, mechanical, electrical, corrosion resistance, and antimicrobial properties of the polymer.20–22 The addition of nanofillers generally increases the overall performance of polymers and is attributed to the high specific surface area of nanoparticles which can significantly increase the interfacial interactions between the polymer and filler.
The aim of the present study is the investigation of the structure and thermal properties of metal–polymer nanocomposites, containing copper nanoparticles in different concentrations in the polypropylene matrices.
Experimental methods and materials
Materials
Copper sulphate (CuSO4×7H2O, 98% chemically pure, Merck CAS No 7758-99-8); sodium tetrahydroborate (NaBH4, 632287 Aldrich); sodium oleate (PLC Pcode C18H33NaO2 PLC 113655, 98% chemically pure); isotactic polypropylene (PP brand Sigma Aldrich P code 1001326963); toluene (PLC 141745); deionized water.
Synthesis of PP/Cu based nanocomposites
Copper nanoparticles were synthesized by chemical reduction process using copper (II) sulfate (CuSO4×7H2O) and sodium tetrahydroborate (NaBH4) as precursor substances and sodium oleate as surface-active substance according to the scheme:

A series of nanocomposite samples with different contents of copper nanoparticles from 1 to 10 wt.% were prepared by the ex-situ method. The synthesis of polymer nanocomposites based on PP/Cu was carried out as follows: 0.5 g of PP powders was dissolved in toluene at a temperature of 120°C. Copper nanoparticles at various contents were added to a polymer solution with a solvent and mixed for 2 h until a homogeneous mixture was obtained. The resulting homogeneous mixture was transferred to a Petri dish and dried for several days. To completely remove the solvent from the volume of the polymer matrix, the nanocomposites were dried in a vacuum oven at a temperature of 120 C for an hour. Then, at the melting point of PP (180°C) and a pressure of 10 MPa, thin nanocomposite films with a thickness of 100 μm were obtained. The films were cooled in water, and the cooling rate was 200°C/min.
Characterization techniques
X-Ray Diffraction
X-ray diffraction (XRD) analysis was performed with a diffractometer Rigaku Mini Flex 600 XRD (Cu Kα radiation = 1.54060 Å; 30 kV and 15 mA) at room temperature. XRD patterns were collected in the range of 2θ = 10°–100° with a step size of 0.02° scan and a time per step of 3 s.
Scanning electron microscopy
The morphology of the polymer nanocomposites were determined by means of a scanning electron microscope model Jeol JSM-7600 F. The images of the nanocomposite samples were taken by the use of scanning electron microscopy (SEM, Jeol JSM-7600 F). Scanning was performed in low electron detecting (LEI) and COMPO modes at an accelerating voltage of 15 kV and a working distance of 15.2 mm. Energy dispersive micro-X-ray analysis was performed using the device X-Max 50 (Oxford Instruments). In order to make their surface conductive, the samples were coated with a thin films of platinum using a sputtering technique.
Atomic-force microscopy analysis
The atomic-microscopic analysis of nanocomposites was carried out on an AFM Integra Prima (NT-MDT). For AFM analysis, special silicon cantilevers with a tip radius of 20 nm and a resonance frequency of 1–5 Hz were used. The measurements were carried out in the semicontact mode in air, where the scanning frequency and the number of scan lines in the image were 1.969 Hz and 256 Hz, respectively.
FT-IR analysis
Polymer nanocomposite structure was studied by IR spectroscopy (spectrometer Varian 3600 FT-IR) at 4000-400 cm−1 at room temperature.
Differential scanning calorimetry
The polymorphic structure, melting temperature, crystallization temperature, and crystallinity degree of all the samples were determined by means of differential scanning calorimetry (DSC 2920 calorimeter, TA Instruments). The heating and cooling rate were set at 10°C/min, and a high purity nitrogen with a flow rate of 70 mL/min was used to avoid oxidation of the samples, and 10 mg of each sample was first melted by heating up to 200°C from −40°C (5 min hold), and then they were crystallized by cooling to −40°C (5 min hold). In order to remove the thermal history of the samples, the thermal program was repeated twice. Melting and crystallization temperatures were determined and the crystallinity degree of the samples was calculated according to equation (1):
The crystallinity degree was calculated using the following equation:
Thermogravimetric analysis
Thermogravimetric analysis of samples was performed using an SDT Q600 (TA Instruments) analyzer. Nanocomposites samples were heated from 30°C up to 650°C under a nitrogen flow rate of 100 mL/min and with a heating rate of 10°C/min.
Results and siscussion
X-ray analysis
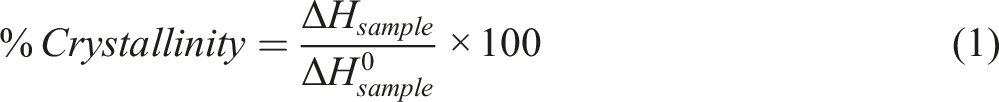
Figure 1 shows the diffraction pattern of copper nanoparticles. The main peaks at 2θ equal to 42.94° (111), 50.49° (200), and 74.18° (220) belong to cubic copper nanoparticles. These peaks were quite consistent with those of the standard JCPDS Card No. 04-0836 for the standard spectrum of the pure fcc (face-centered cubic) metallic Cu.23–25 In addition, there are few other diffraction peaks of copper oxide particles overlapping with the Cu phases confirming the presence of oxide shell around the as-synthesized copper nanoparticles. It is assumed that copper oxide particles are located on the surface of metal particles due to the partial oxidation of the surface of copper. According to the XRD results, it can be concluded that the synthesized nanoparticles in the core consist of metal nanoparticles, and the surface is covered with a shell of copper oxide. Synthesized nanoparticles are well structured, and the amorphous phase in the sample is practically absent. Diffraction pattern of copper nanoparticles.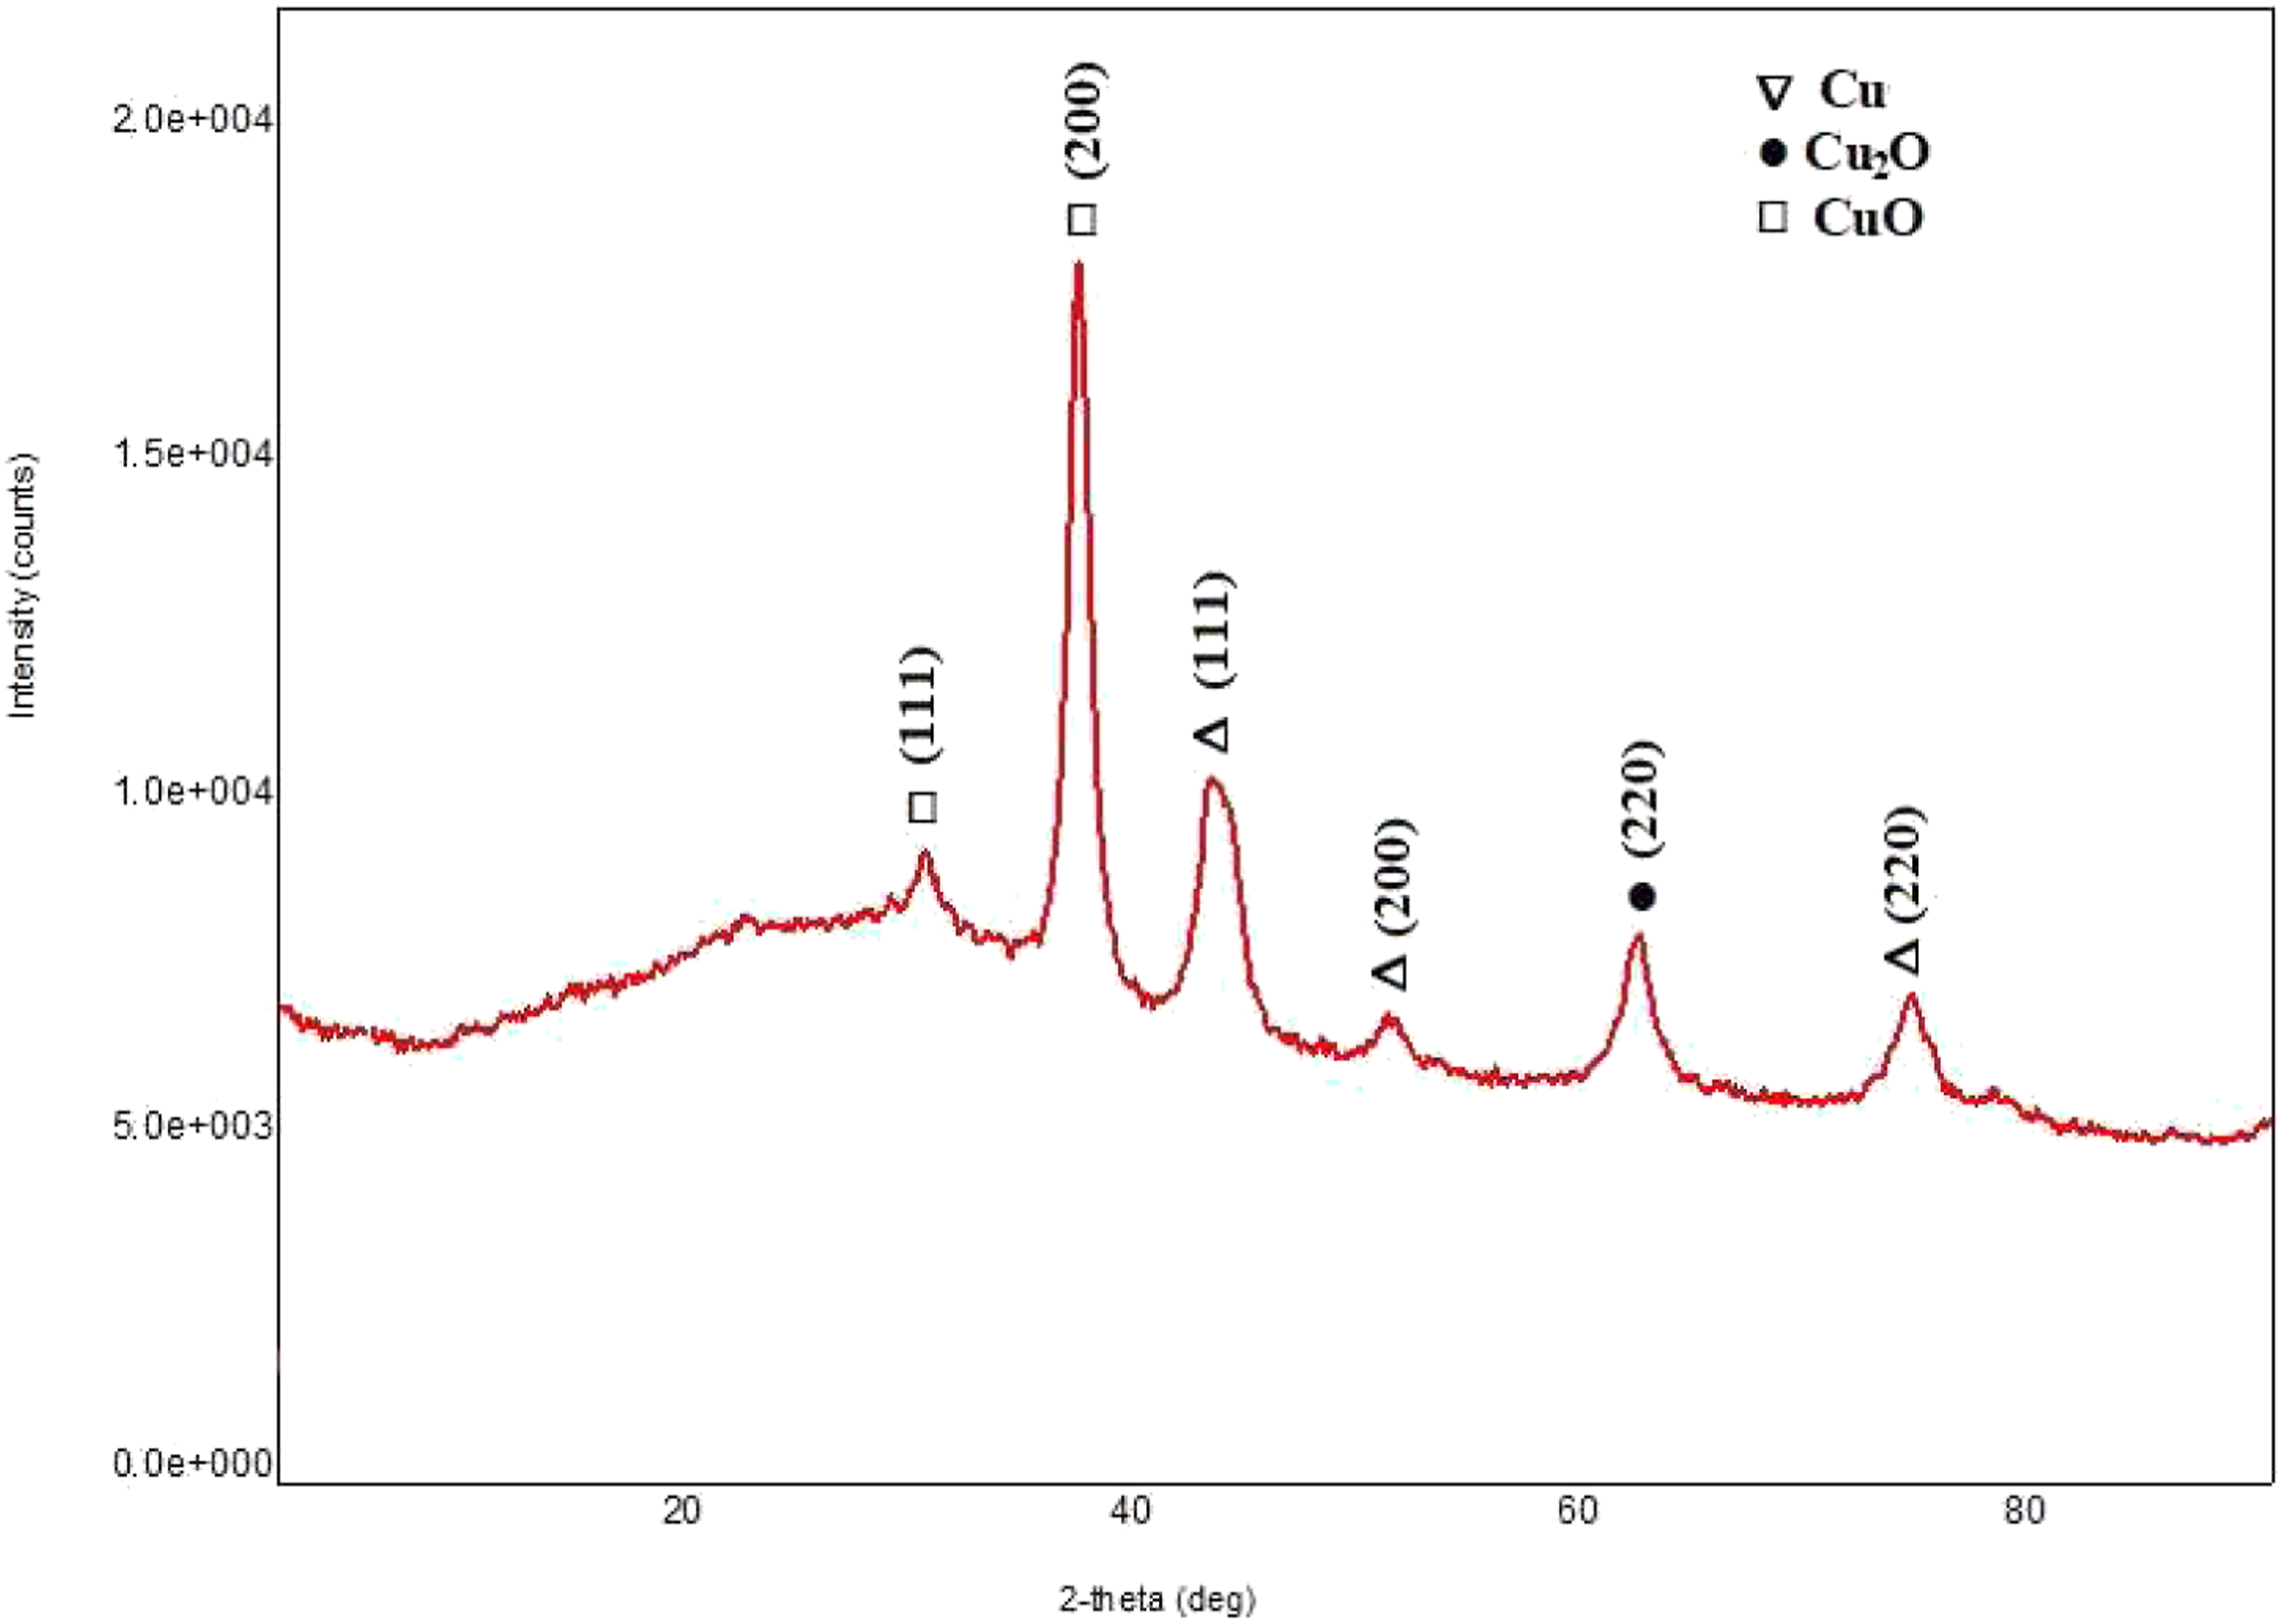
The diffractograms of the PP and the nanocomposites for the concentrations of 3, 5, 10% Cu nanoparticles are shown in Figure 2. The XRD pattern of PP shows five major peaks in the 2θ range of 5–30° without any peculiar peak corresponding to beta (β) and gamma (γ) form of PP crystals, confirming the presence of only monoclinic α-form of PP crystal. As can be seen from Figure 2, with the introduction of Cu nanoparticles into the PP matrix, the intensity of peaks at 13,71°; 16,54°, and 18,2°, corresponding to the crystalline phase of polypropylene, decreases. The peaks of nanocomposites' components were observed at the diffraction pattern of the PP/Cu nanocomposite. XRD diffractograms for pure PP (1) and PP/1%Cu (2), PP/3%Cu (3), PP/5%Cu (4) based nanocomposites.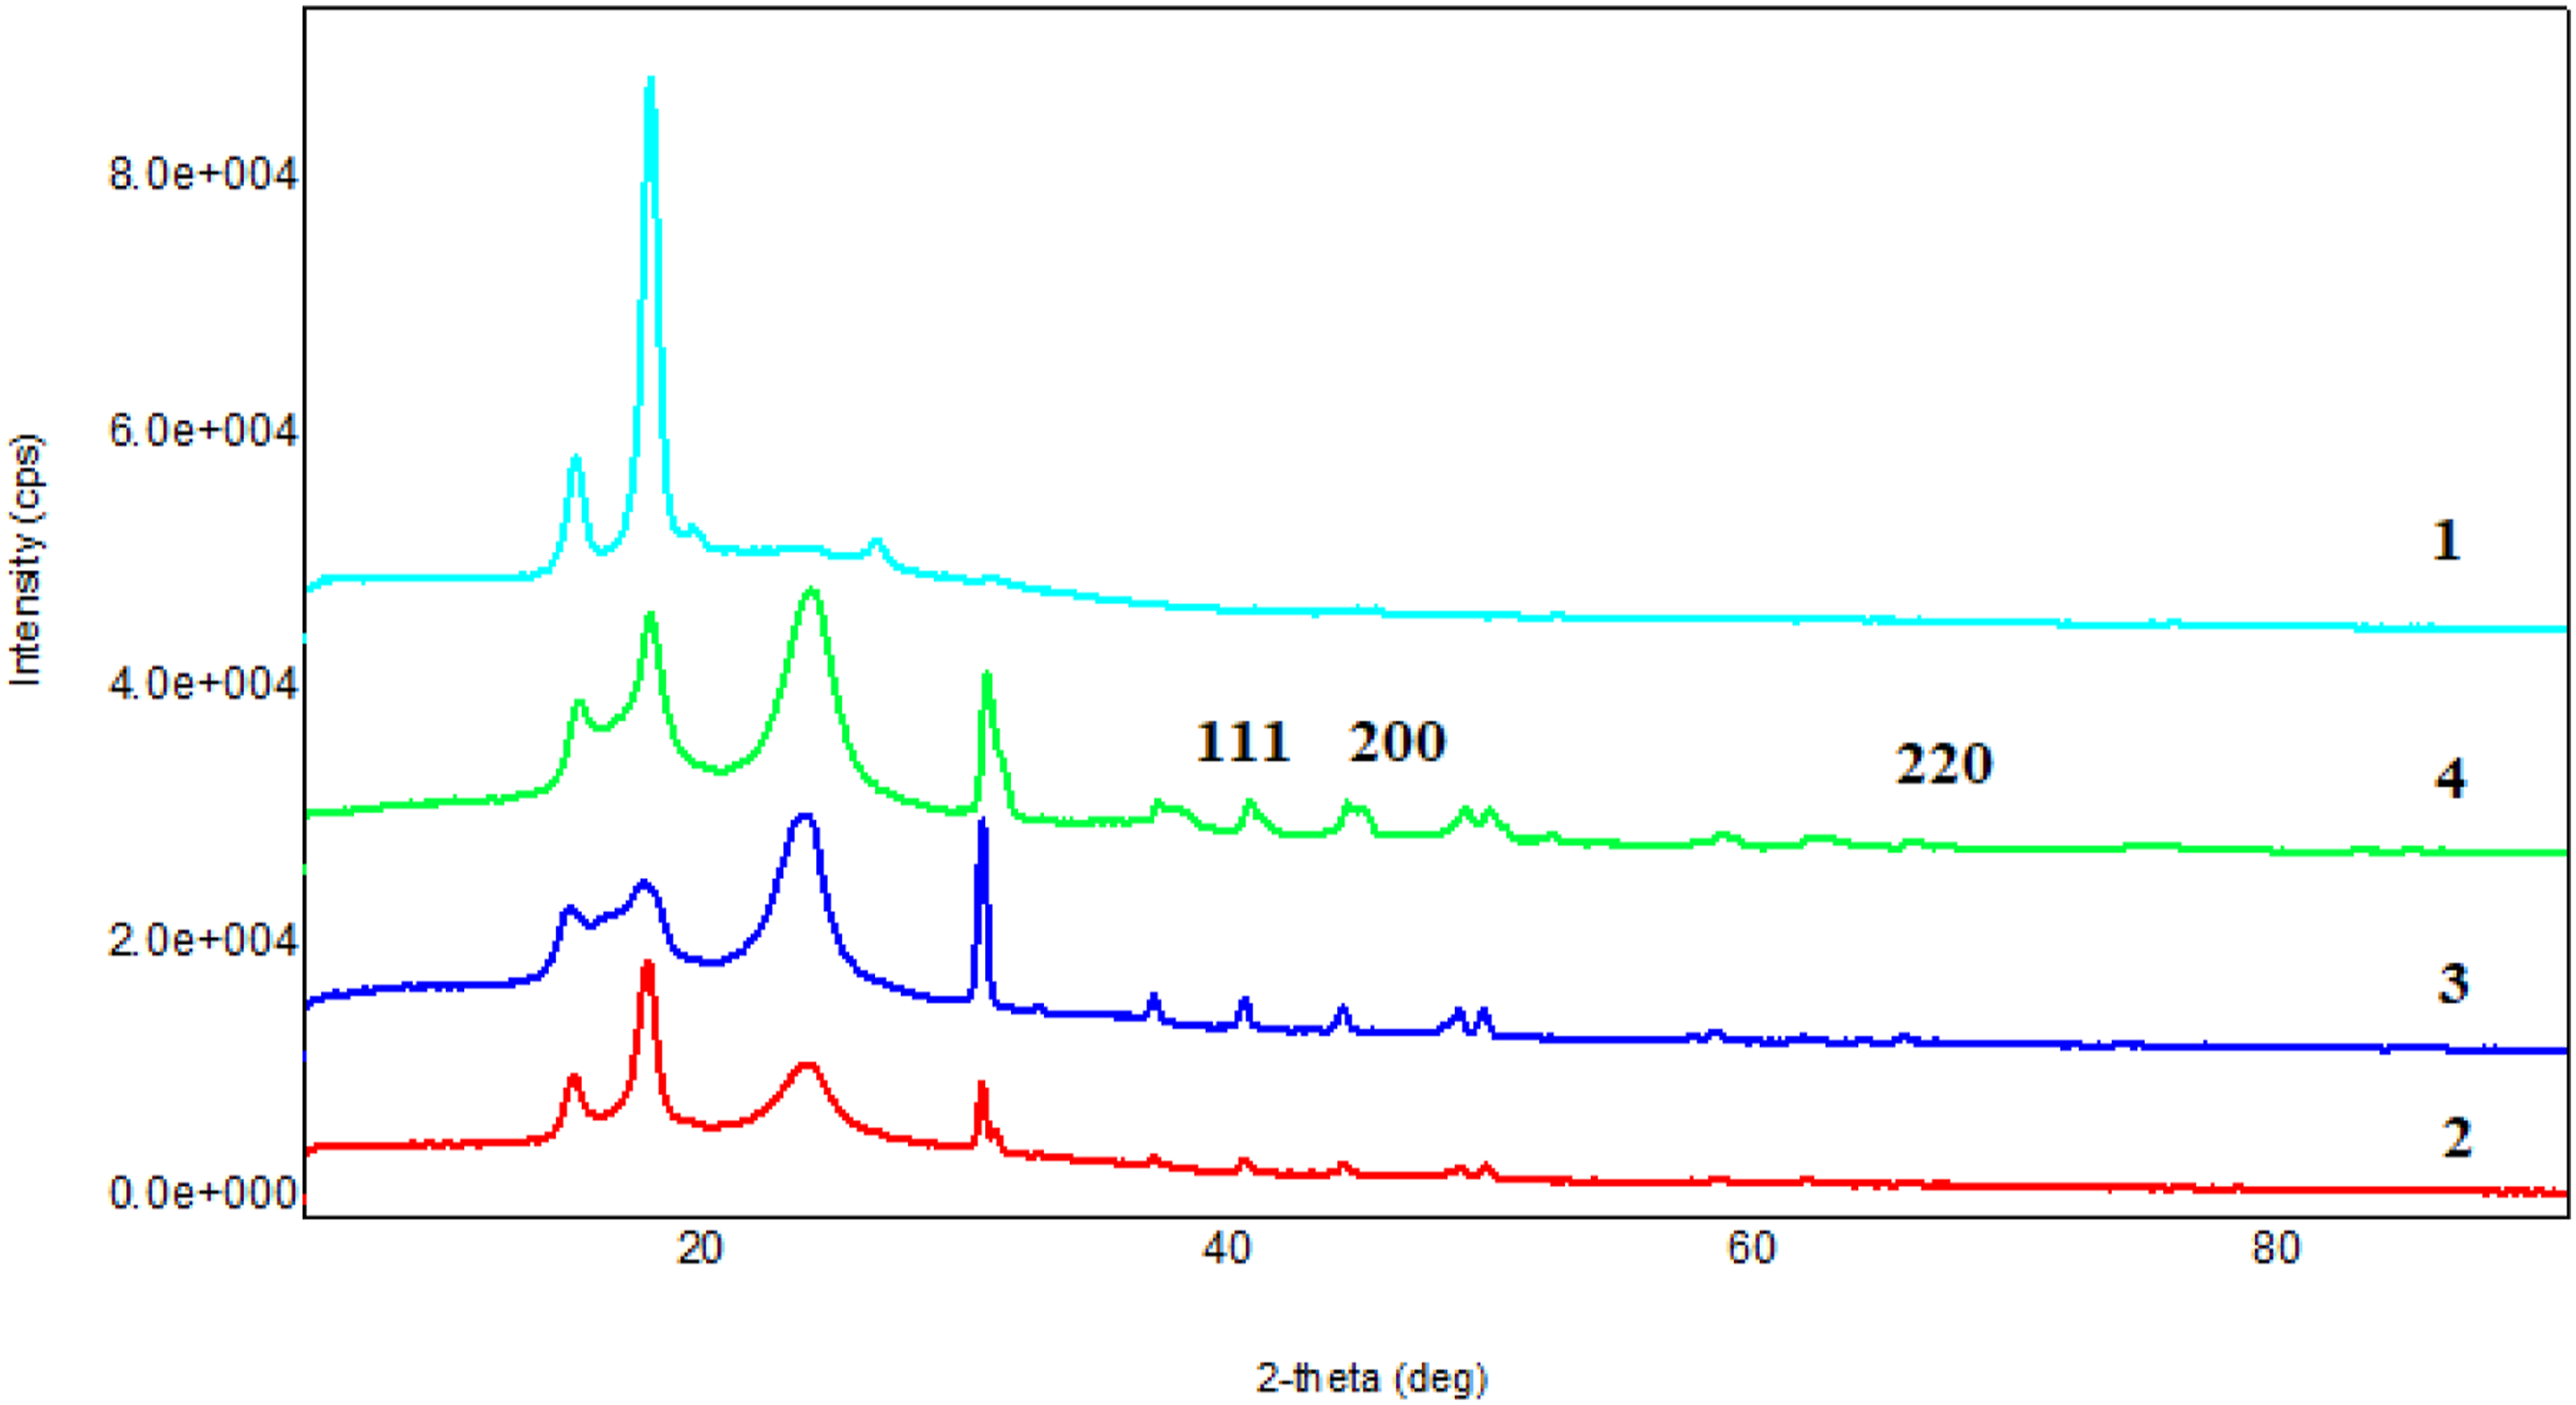
FT-IR study of polymer nanocomposites
The IR spectra of PP and polymer nanocomposites based on PP/Cu have been investigated. Figure 3 the IR spectra of pure PP and nanocomposites based on PP/Cu are shown. It is known that absorption bands in the region of 2800–3000 cm−1 correspond to stretching vibrations of CH2 and CH3 groups; absorption bands in the region of 1500-1300 cm−1 to deformation vibrations of CH2 and CH3 groups and absorption bands at 1200-800 cm−1 correspond to pendulum vibrations of CH2 and CH3 groups with stretching vibrations of the carbon skeleton of a polypropylene molecule. It was found that when Cu nanoparticles are introduced into the PP matrix, the intensities of many characteristic absorption bands of polypropylene in the range of 2800–3000 cm−1, 1500-1300 cm−1, and 1200-800 cm−1 decrease. Consequently, the IR study of the PP/metal-based nanocomposites shows that the introduction of copper nanoparticles does not cause changes in the chemical structure of the polypropylene polymer but only changes in the physical structure of the polymer due to interfacial interactions of polypropylene with copper metal nanoparticles.26–28 IR spectra of polypropylene (a) and nanocomposites based on PP/1%Cu (b), PP/3%Cu (c) and PP/5%Cu (d).
SEM analysis of nanocomposites
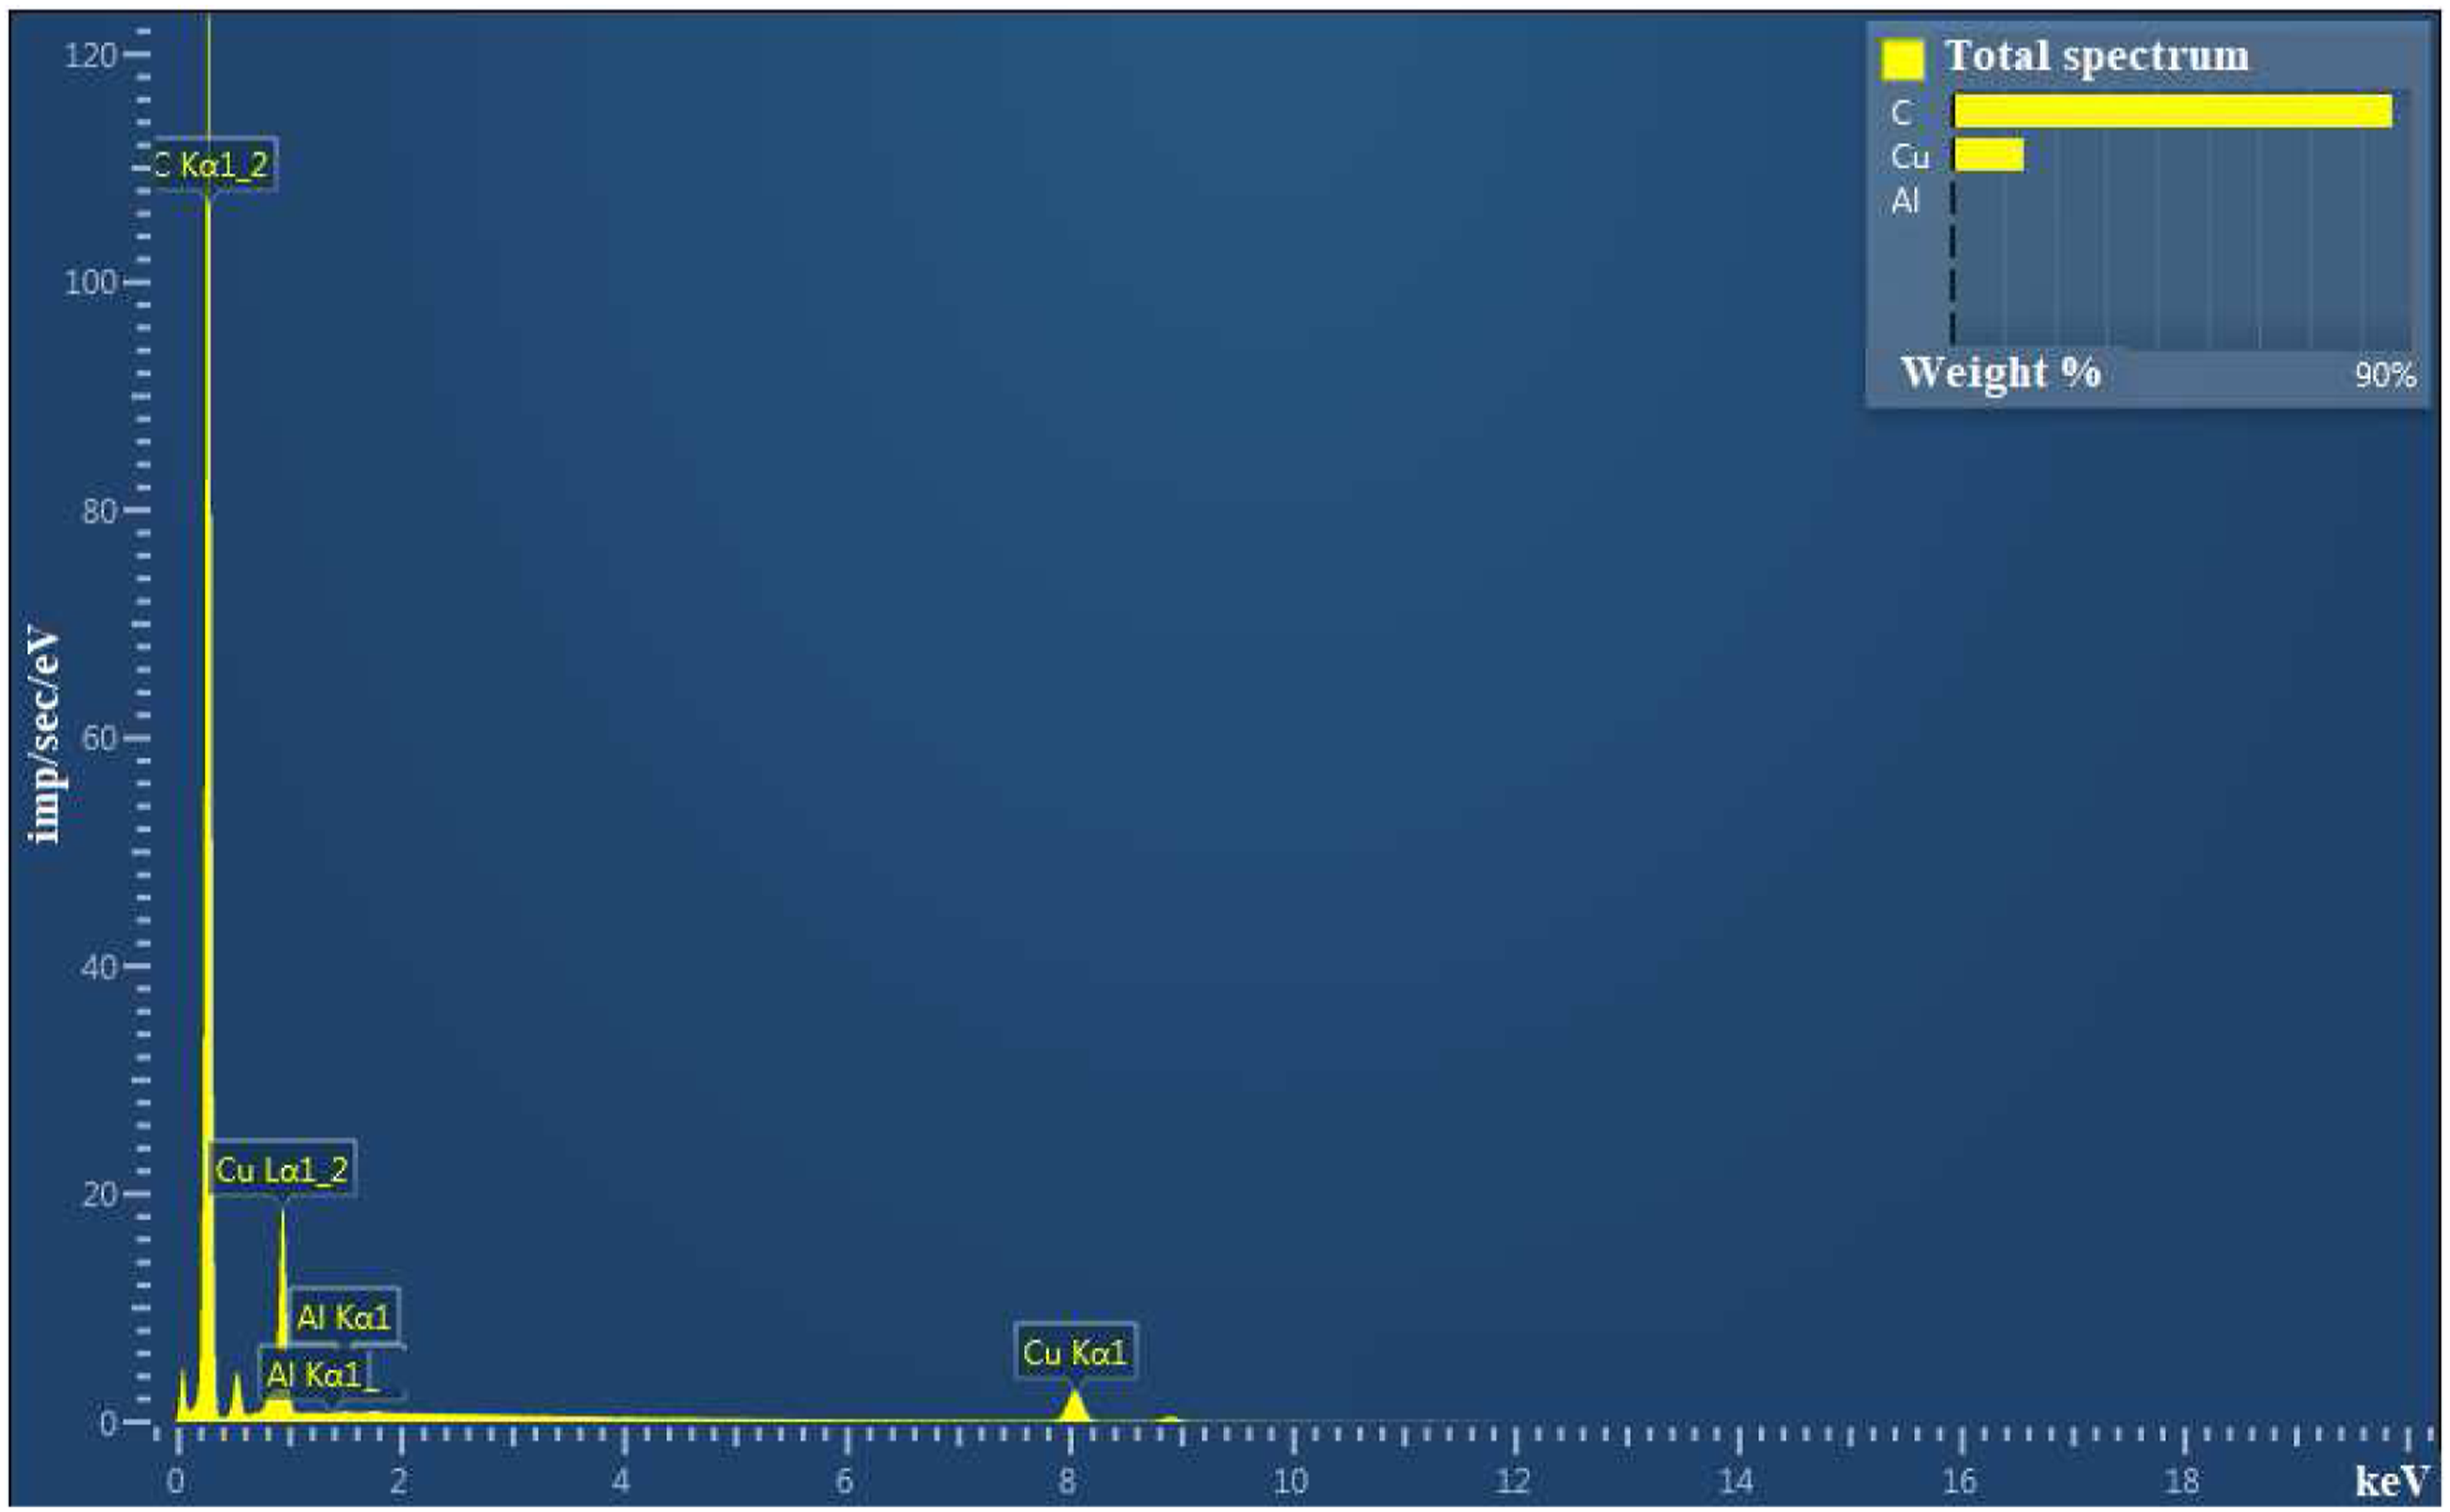
Figure 4 shows SEM images of PP and PP/Cu nanocomposites. It can be seen from SEM images that when Cu nanoparticles are introduced into the PP matrix, a change in the supramolecular structure and the formation of nanocomposites with a relatively ordered structure occur. With the introduction of 3% and 5% Cu into the polymer, the average diameter of the nanoparticles is 50–62 nm, and 60–72 nm, respectively. SEM images show that with an increase in the content of copper nanoparticles in the polymer, the number and the distribution of nanoparticles in the polymer also increase Figure 5 shows the EDS spectrum and mapping of nanocomposites by elements over the entire area of the plot. As can be seen, mainly Cu nanoparticles prevail in the polymer matrix, i.e., the nanocomposite consists mainly of Cu nanoparticles. According to the SEM data for the film, the copper nanoparticles distribute uniformly over the volume of the polymer matrix, which is testified by the absence of discontinuities along the particle and polypropylene matrix interfaces.
29
SEM images of PP (a) and polymer nanocomposites on the base PP/3%Cu (b) and PP/5%Cu (c). EDS spectrum of nanocomposite based on PP/Сu.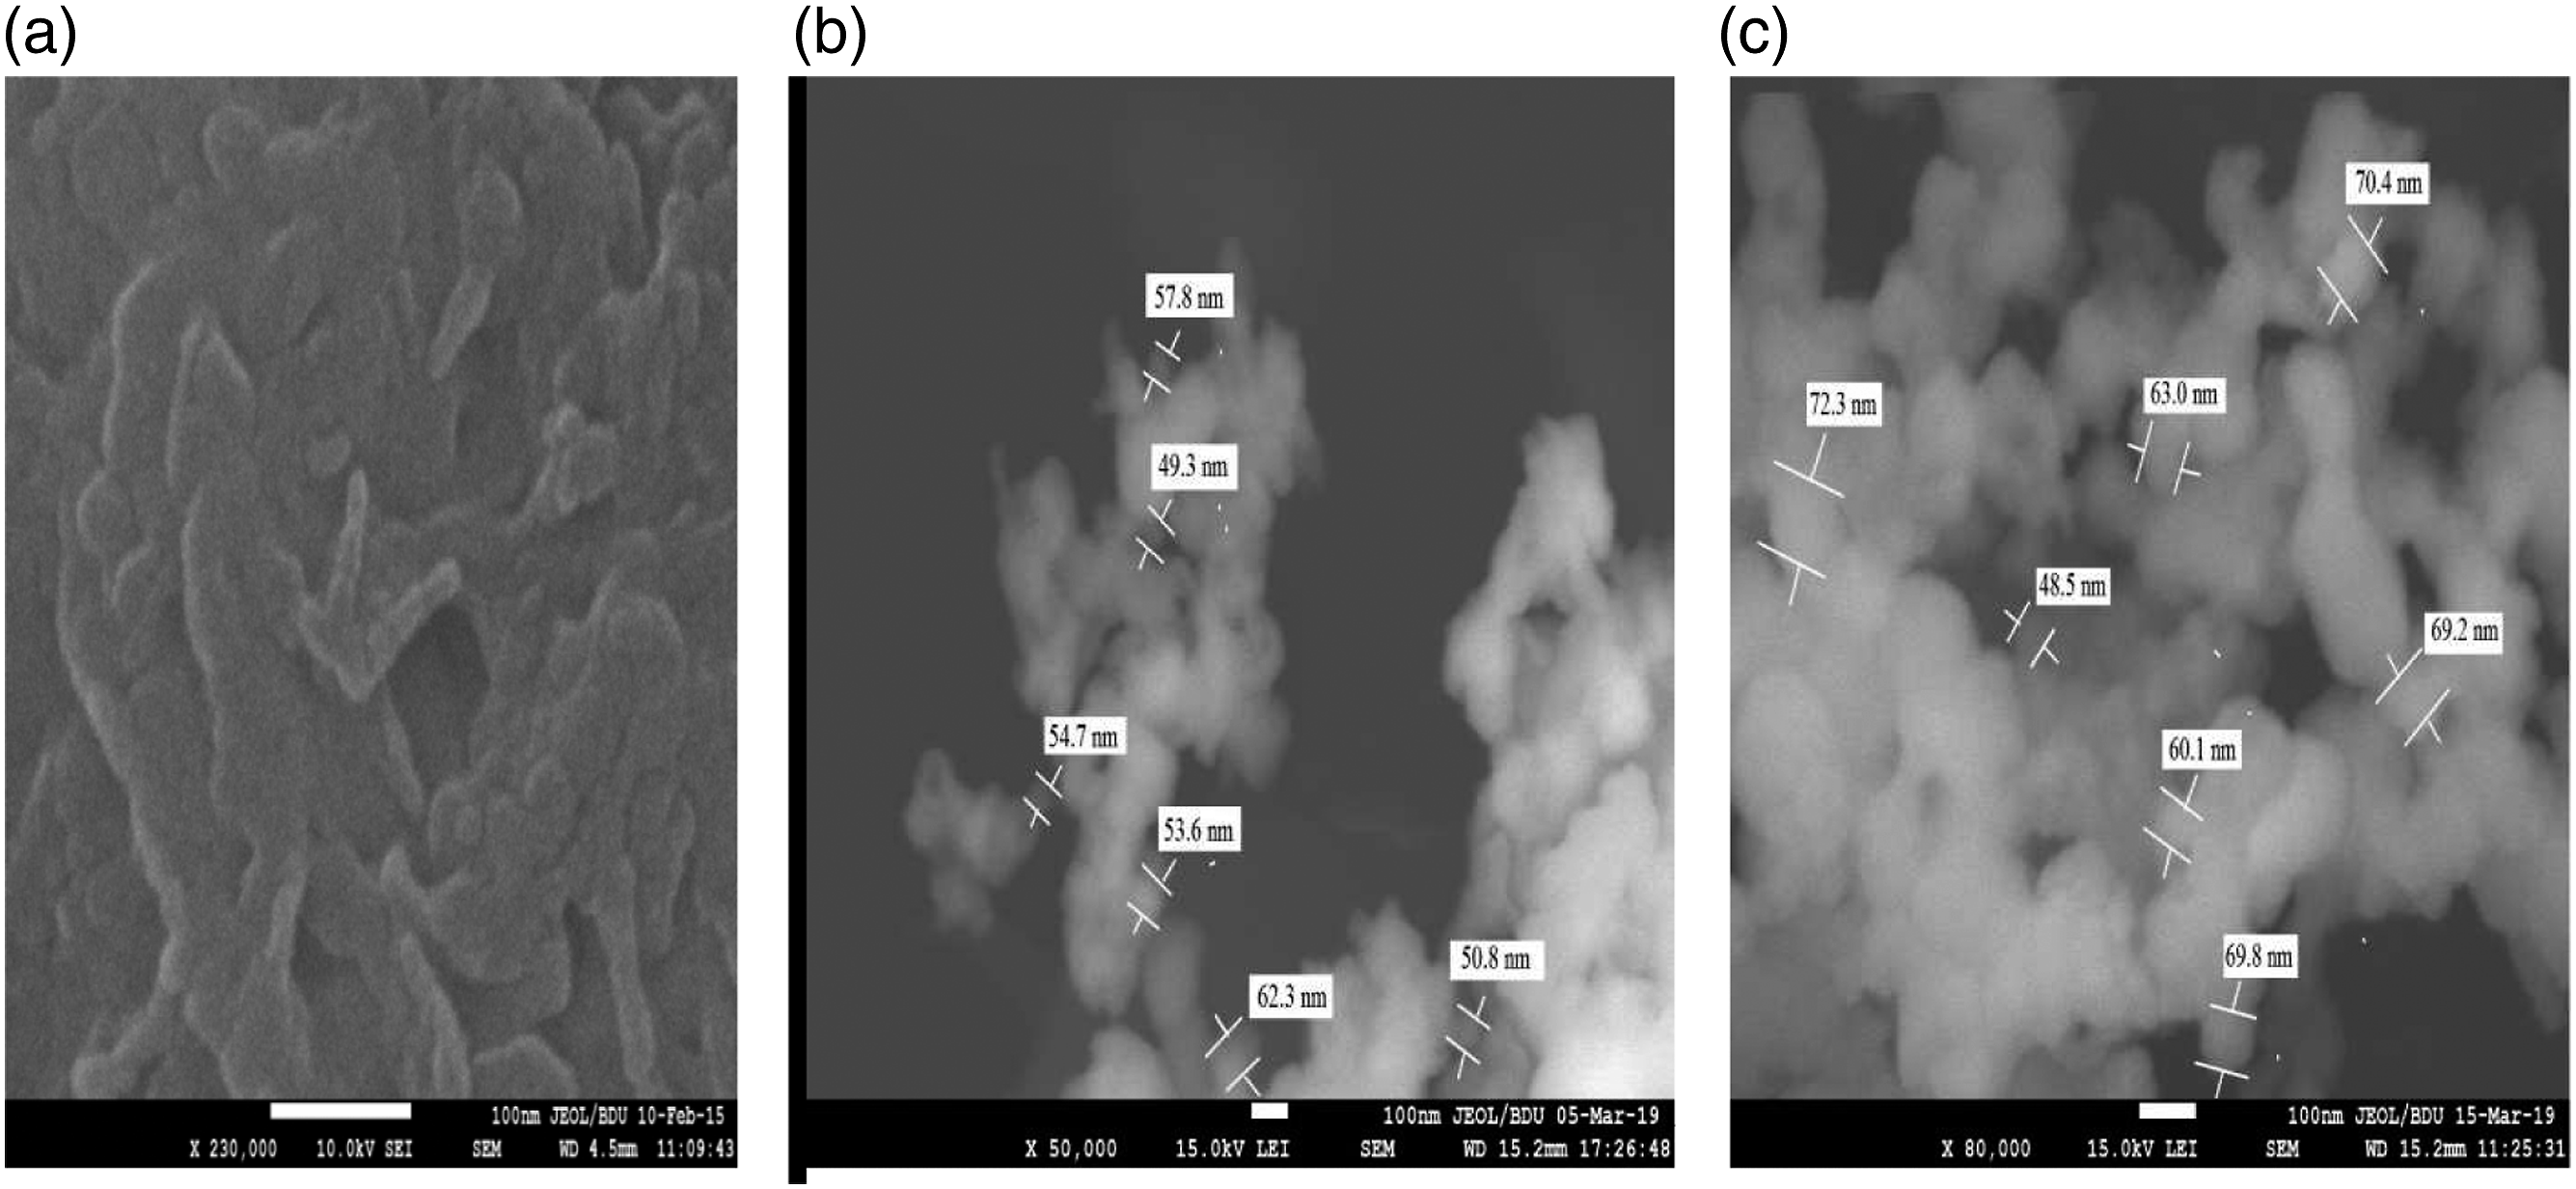
AFM analysis of nanocomposites
Figure 6 shows AFM 3D images of PP/Cu-based nanocomposites with different volume contents of Cu nanoparticles. So, for 1% Cu nanoparticles content in polypropylene, the distribution of copper nanoparticles, coated with the shell of copper oxide particles and the supramolecular structure is more ordered than at high copper contents in the polymer. It can also be seen from AFM images that with a further increase in the copper content in the polymer, agglomeration occurs. This result correlates well with the average surface roughness of nanocomposites. AFM 3D images of polymer nanocomposites based on PP/Cu: (a) PP/1%Cu, (b) PP/3%Cu, (c) PP/5%Cu.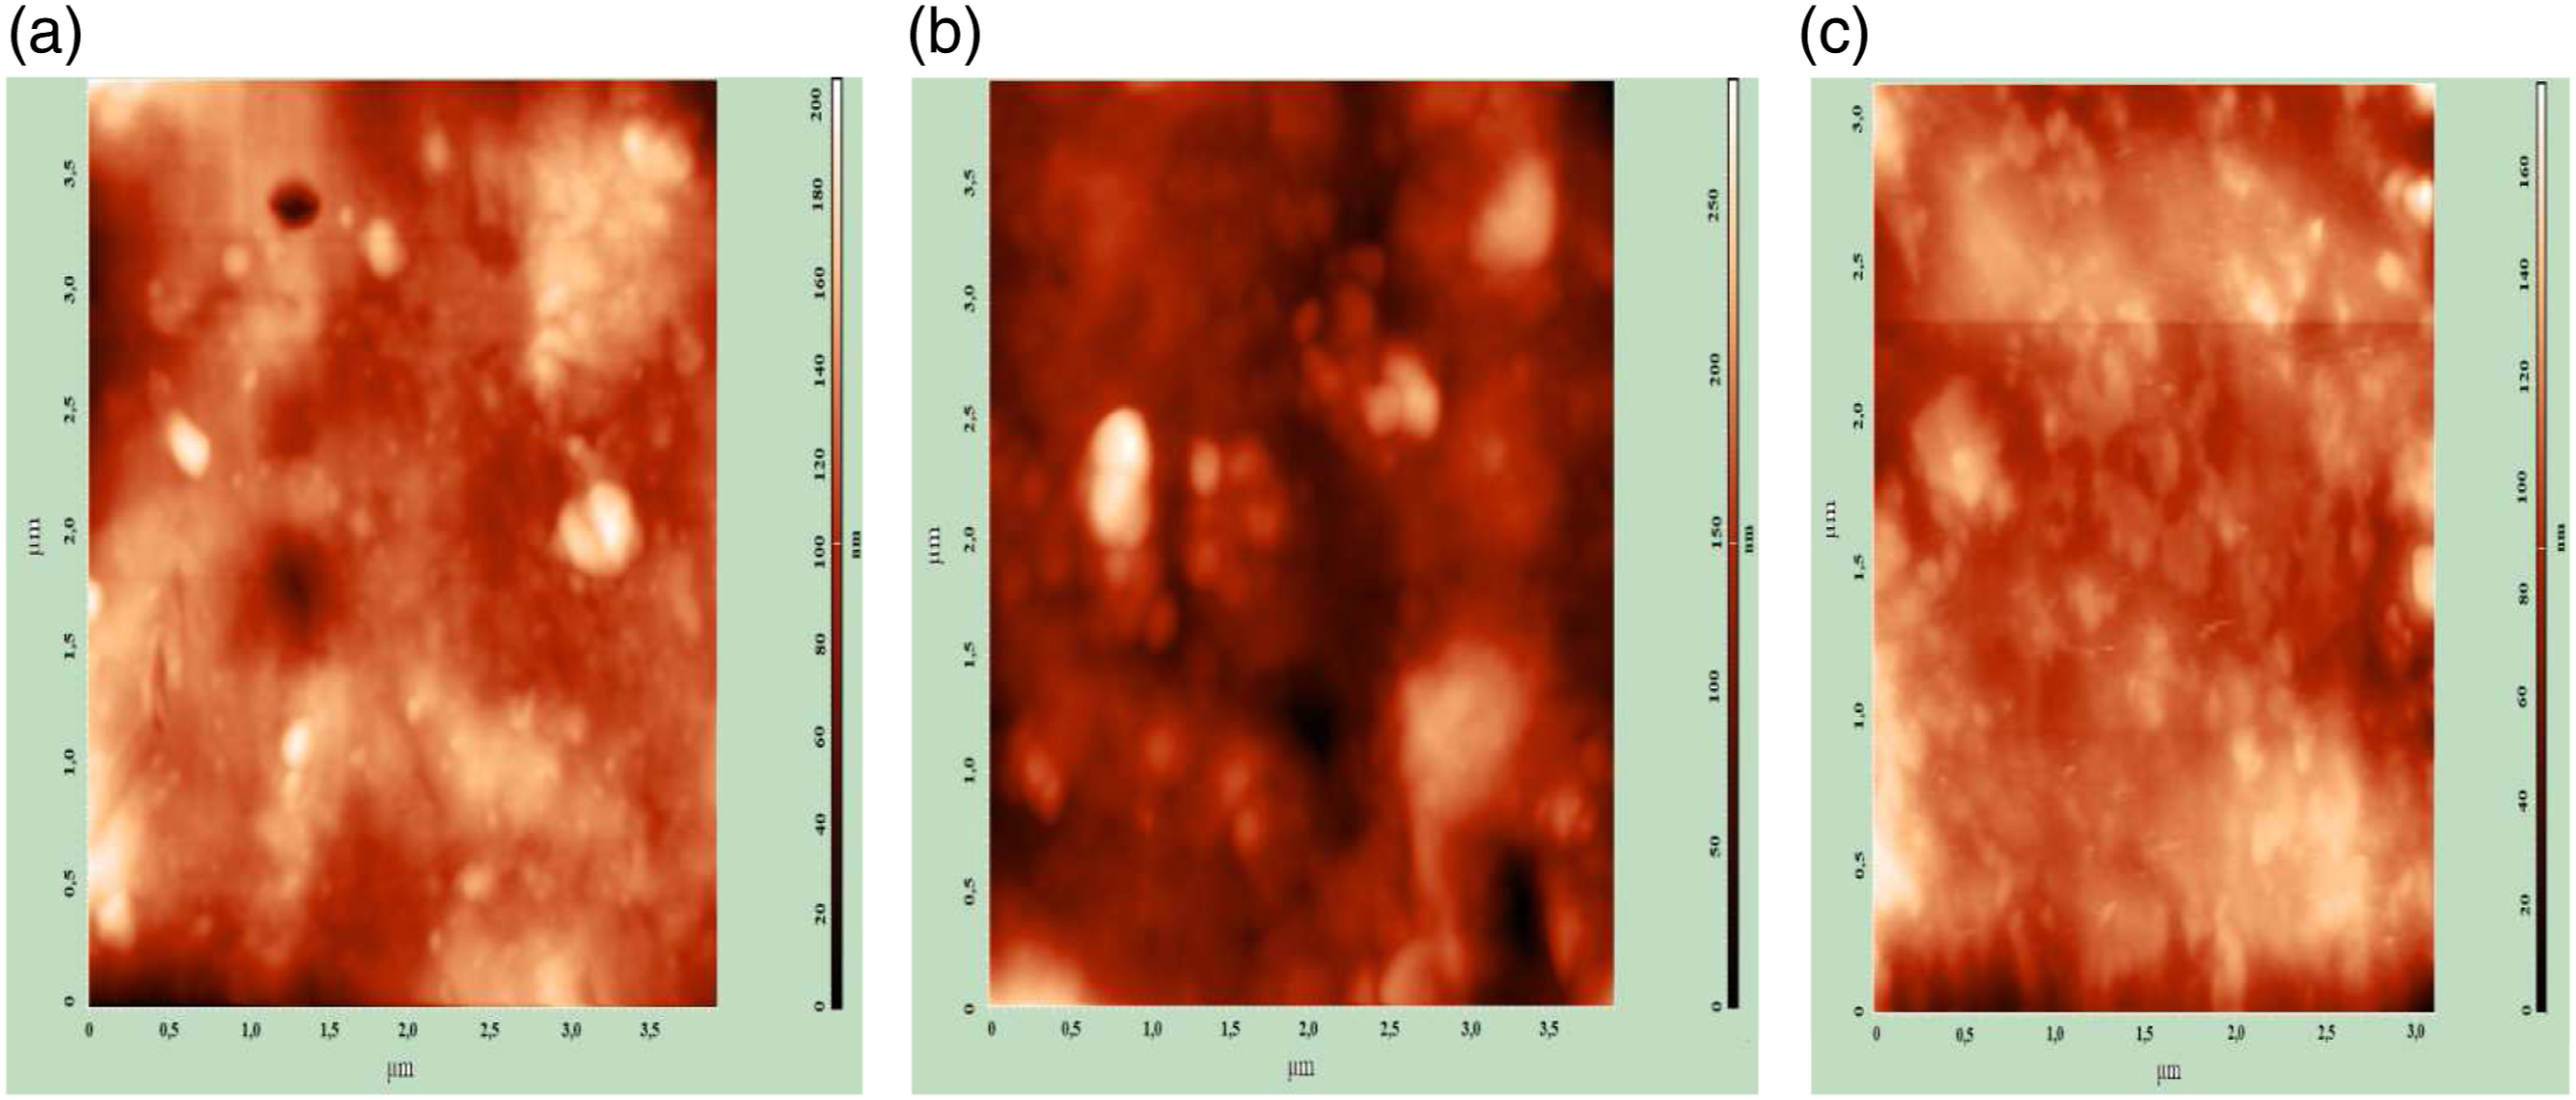
Figure 7 shows histograms of the root mean square surface roughness of nanocomposites based on PP/Cu. The average surface roughness for the PP/1%Cu, PP/3%Cu, and PP/5% Cu nanocomposite is 20–80 nm,−80−140 nm and -50−250 nm, respectively. Hence, it can be concluded that at low contents of nanoparticles in the polymer matrix, the supramolecular structure of PP/Cu based nanocomposites is more ordered than at high contents of nanoparticles in the polymer. A histogram of the image of the surface roughness of nanocomposites based on PP/Cu: (a) PP/1%Cu; (b) PP/3%Cu; (c) PP/5%Cu.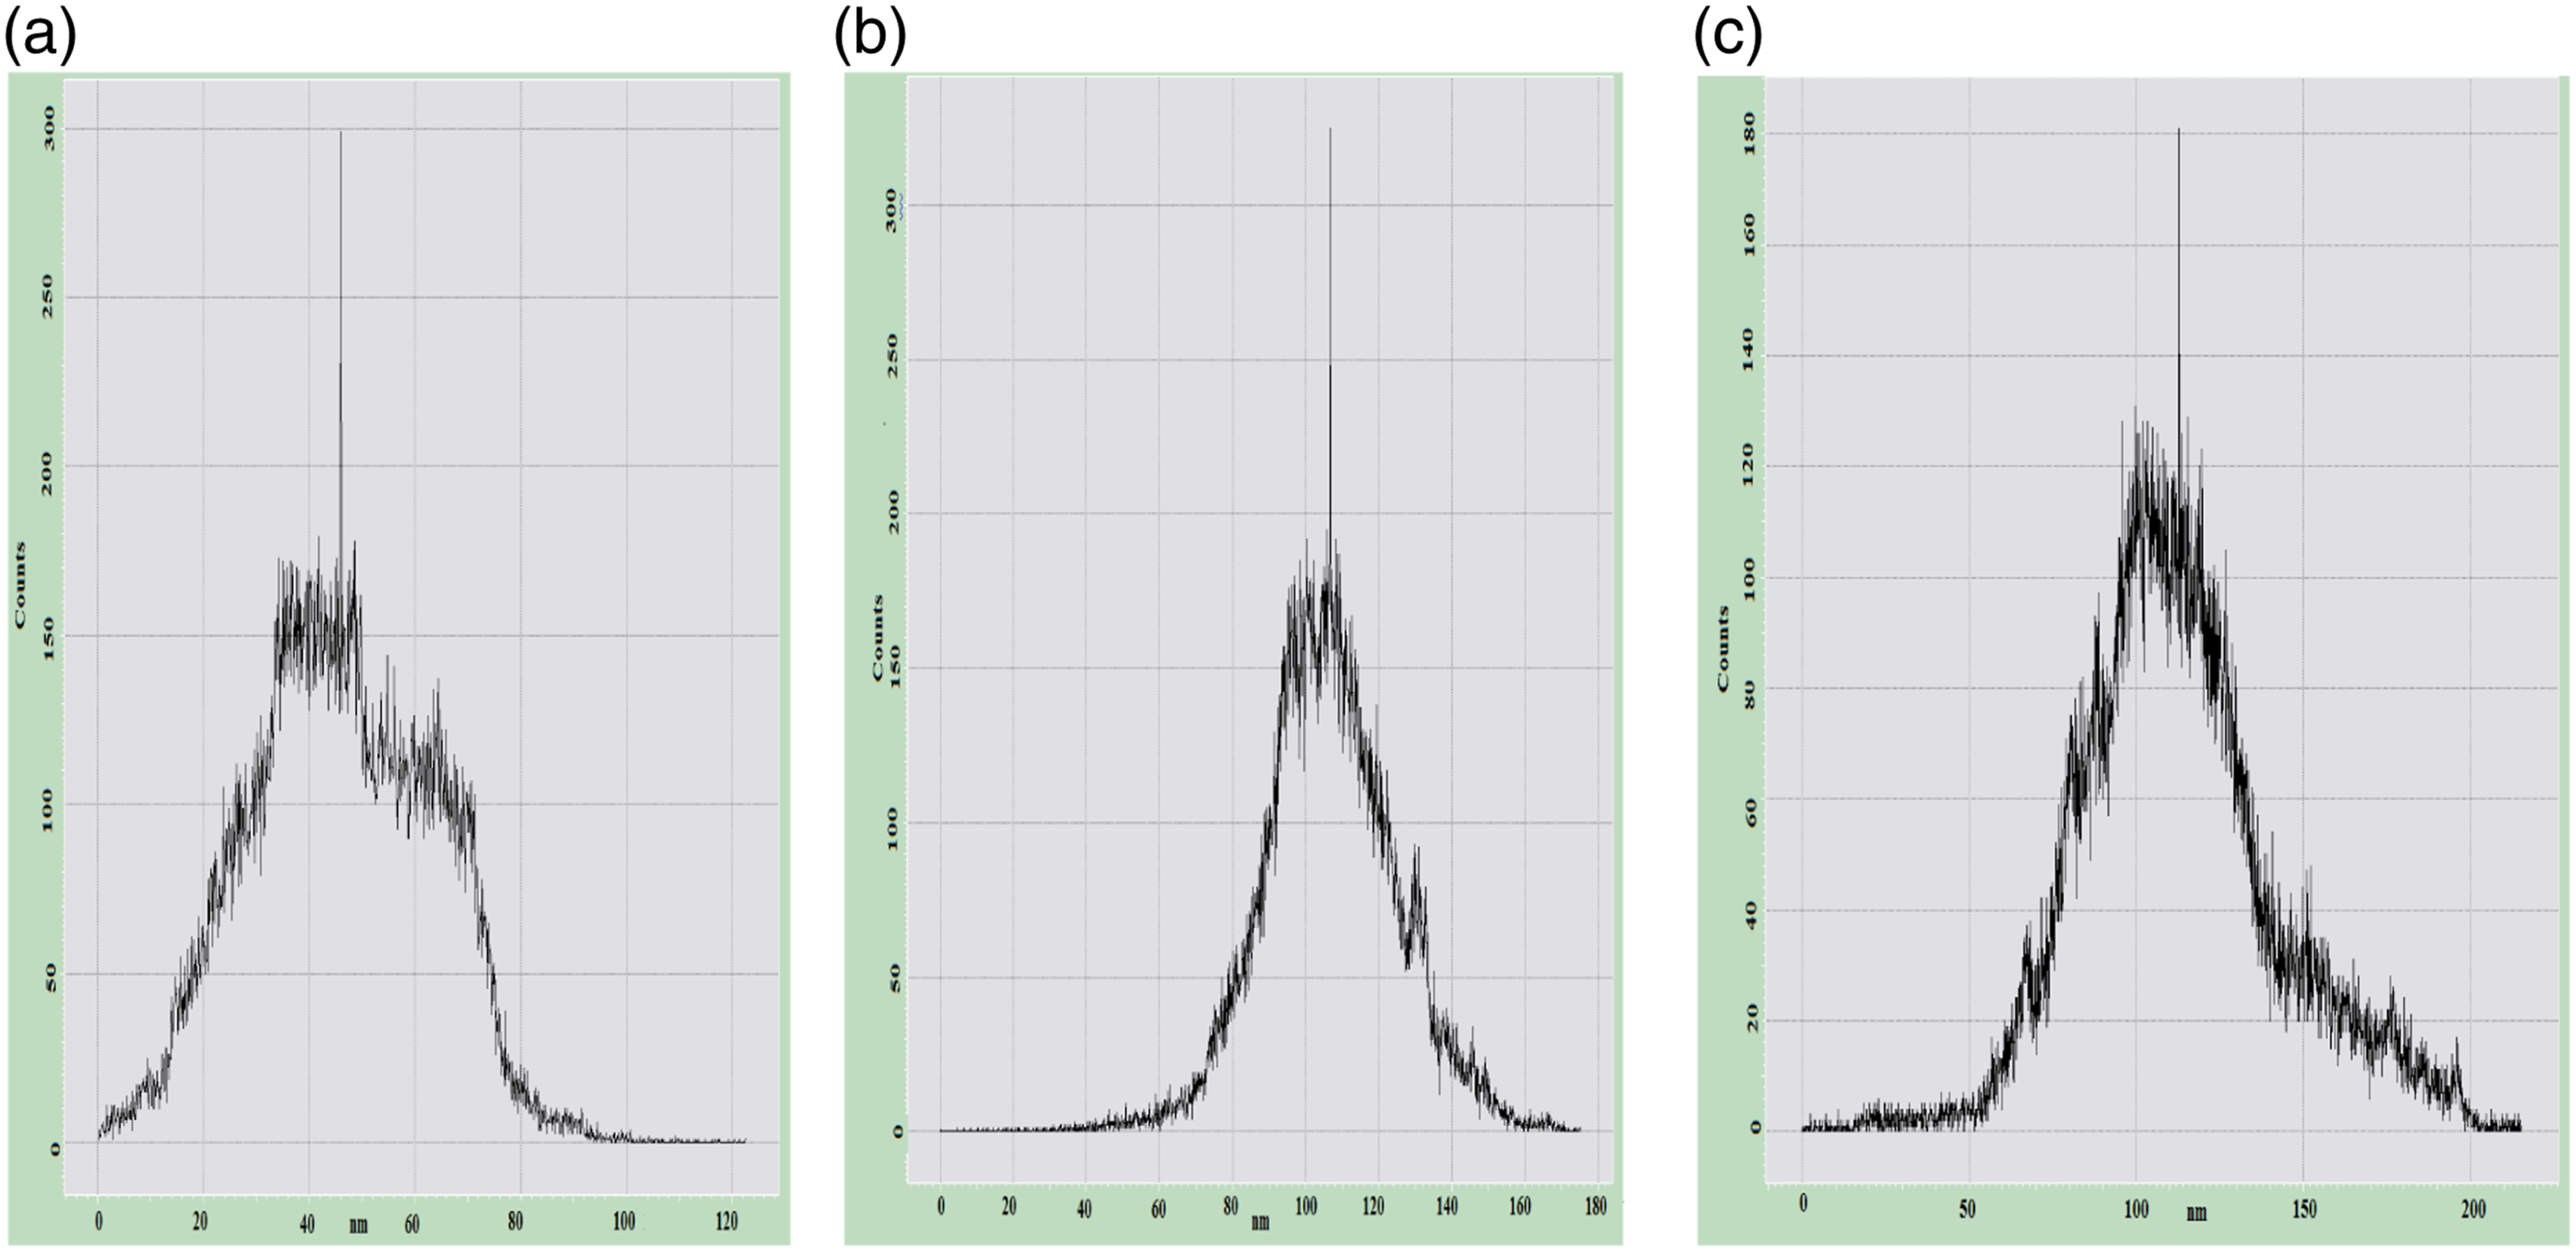
TGA analysis of nanocomposites
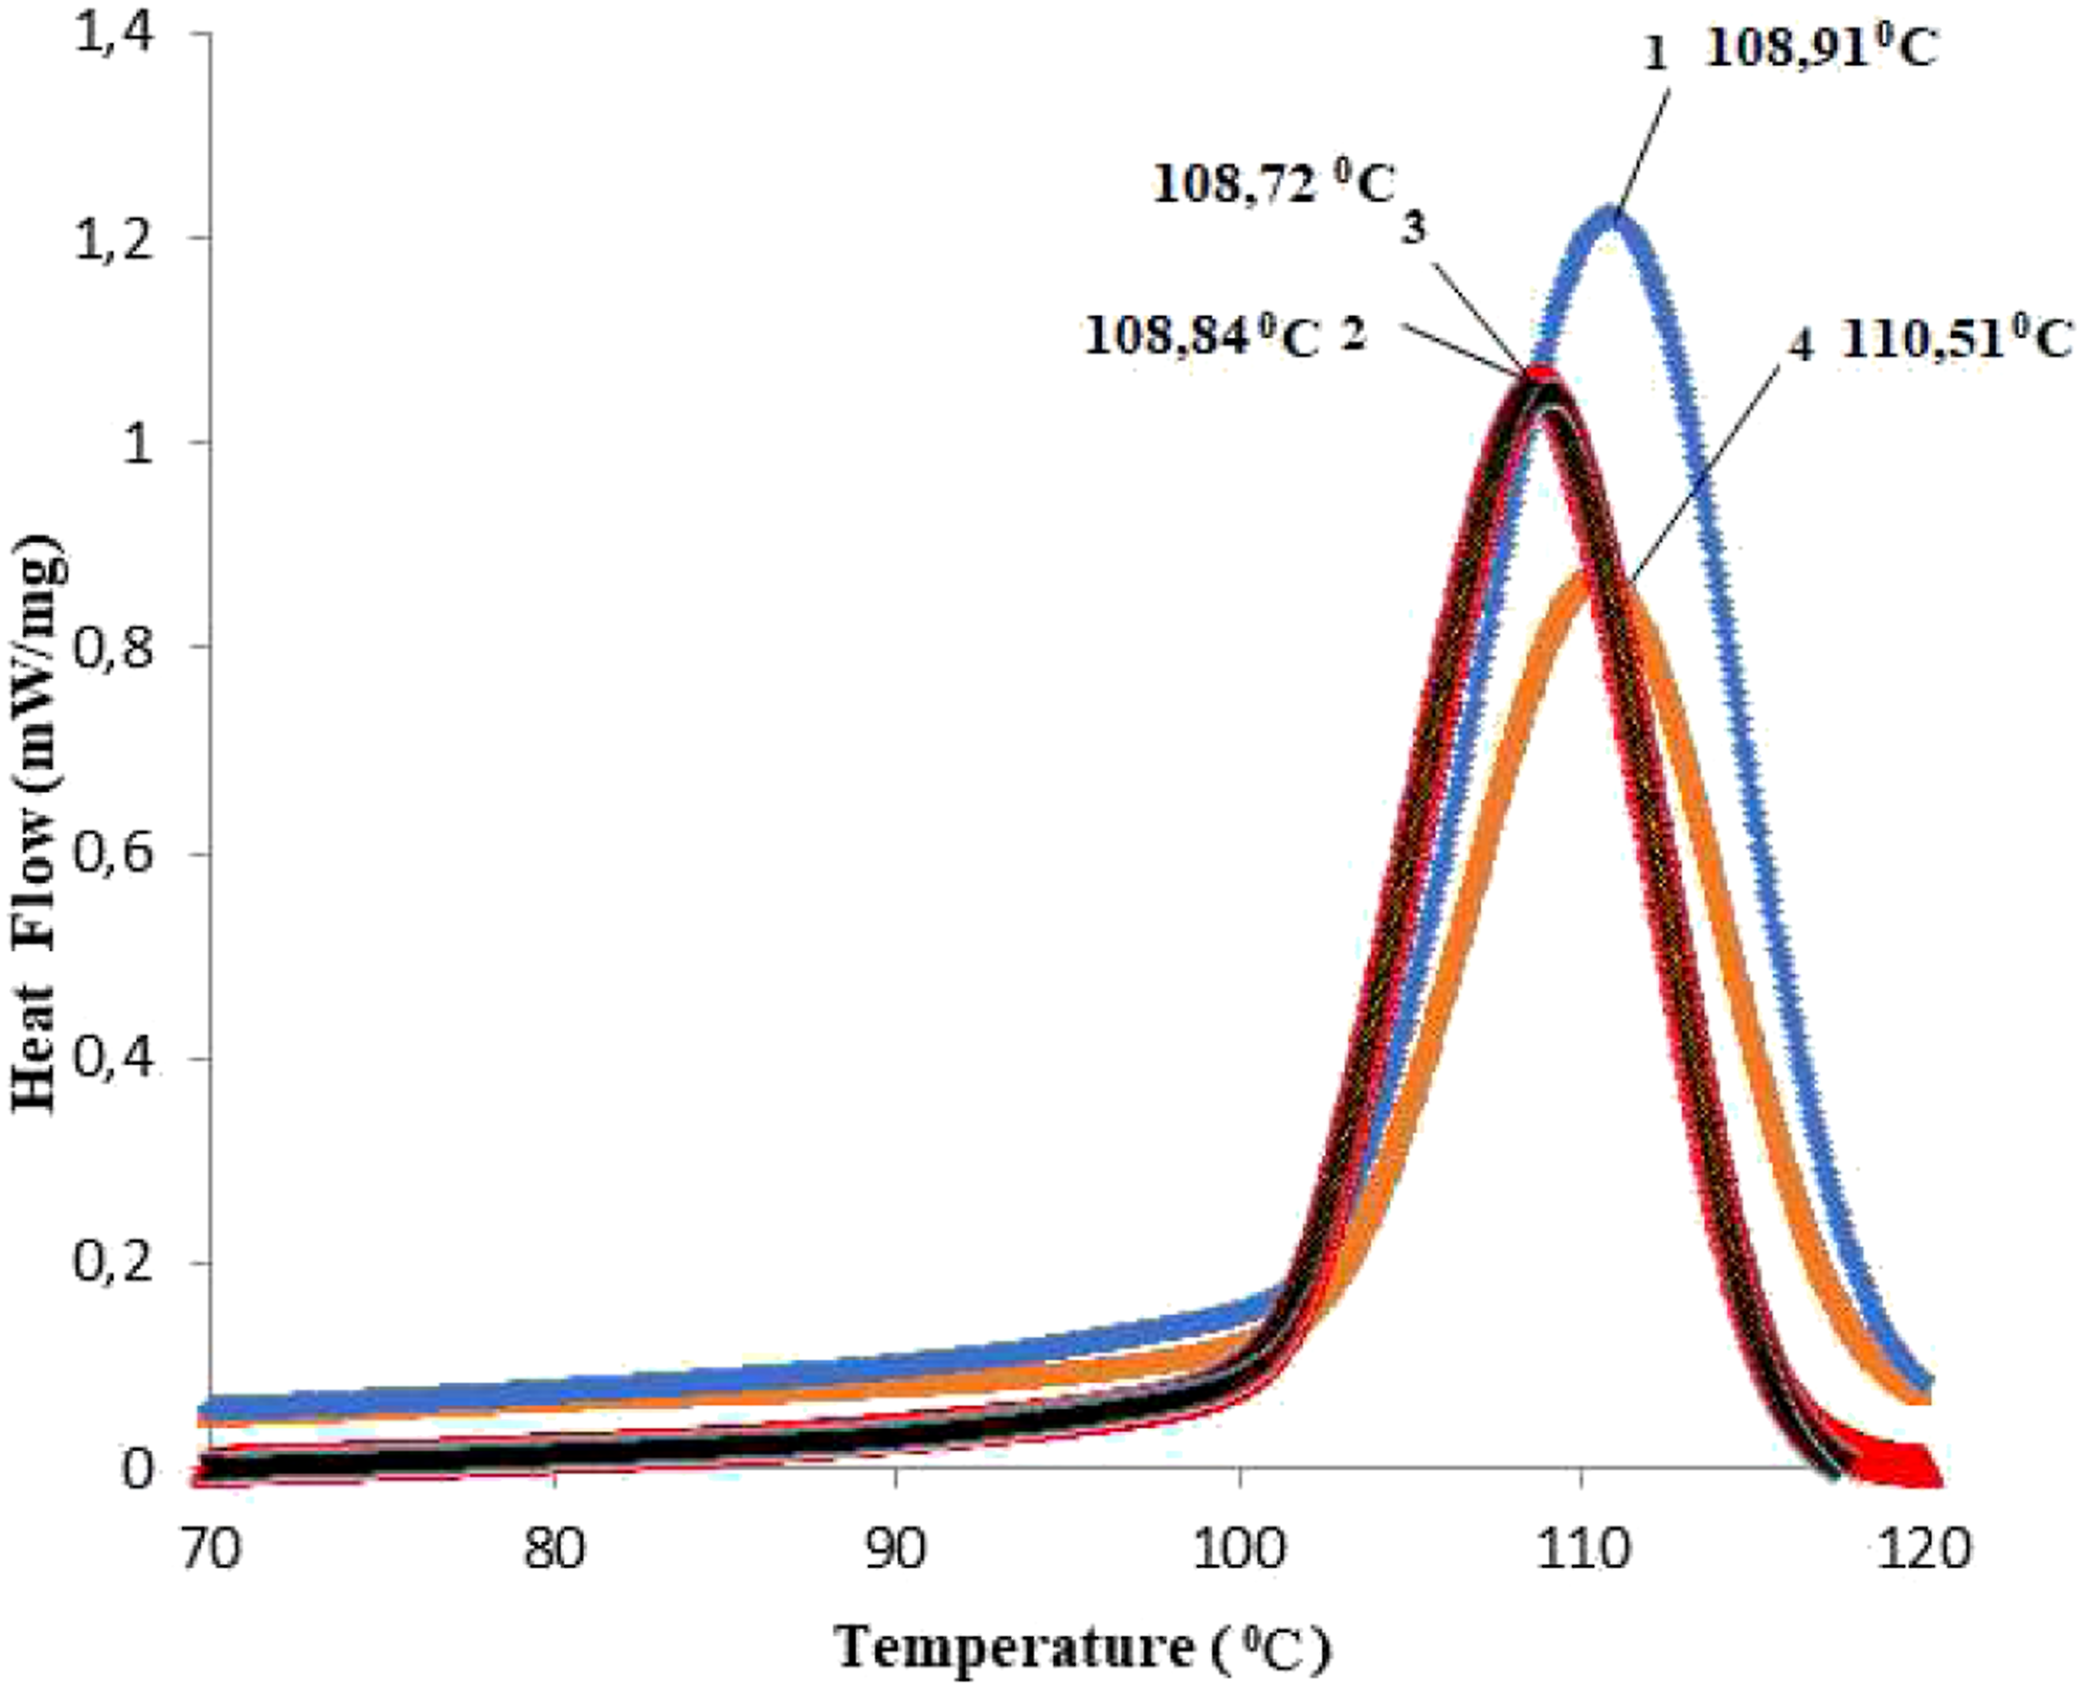
Figure 8 shows TGA curves of PP and PP/Cu nanocomposites with different amounts of copper nanoparticles with 1, 3, 5, and 10% by weight concentration. For all curves, onset temperatures that denote the temperature at which the weight loss begin are determined. As can be seen in Figure 1, for all PP/Cu, decomposition occurs in a single-step process. The presence of copper nanoparticles in PP increases its thermal stability.Thermal stability generally increases with an increasing amount of copper nanoparticles covered by a copper oxide layer. TGA curves of isotactic polypropylene (PP) and nanocomposites based on PP/1%Cu (2), PP/3%Cu (3); PP/5%Cu (4) and PP/10%Cu (5).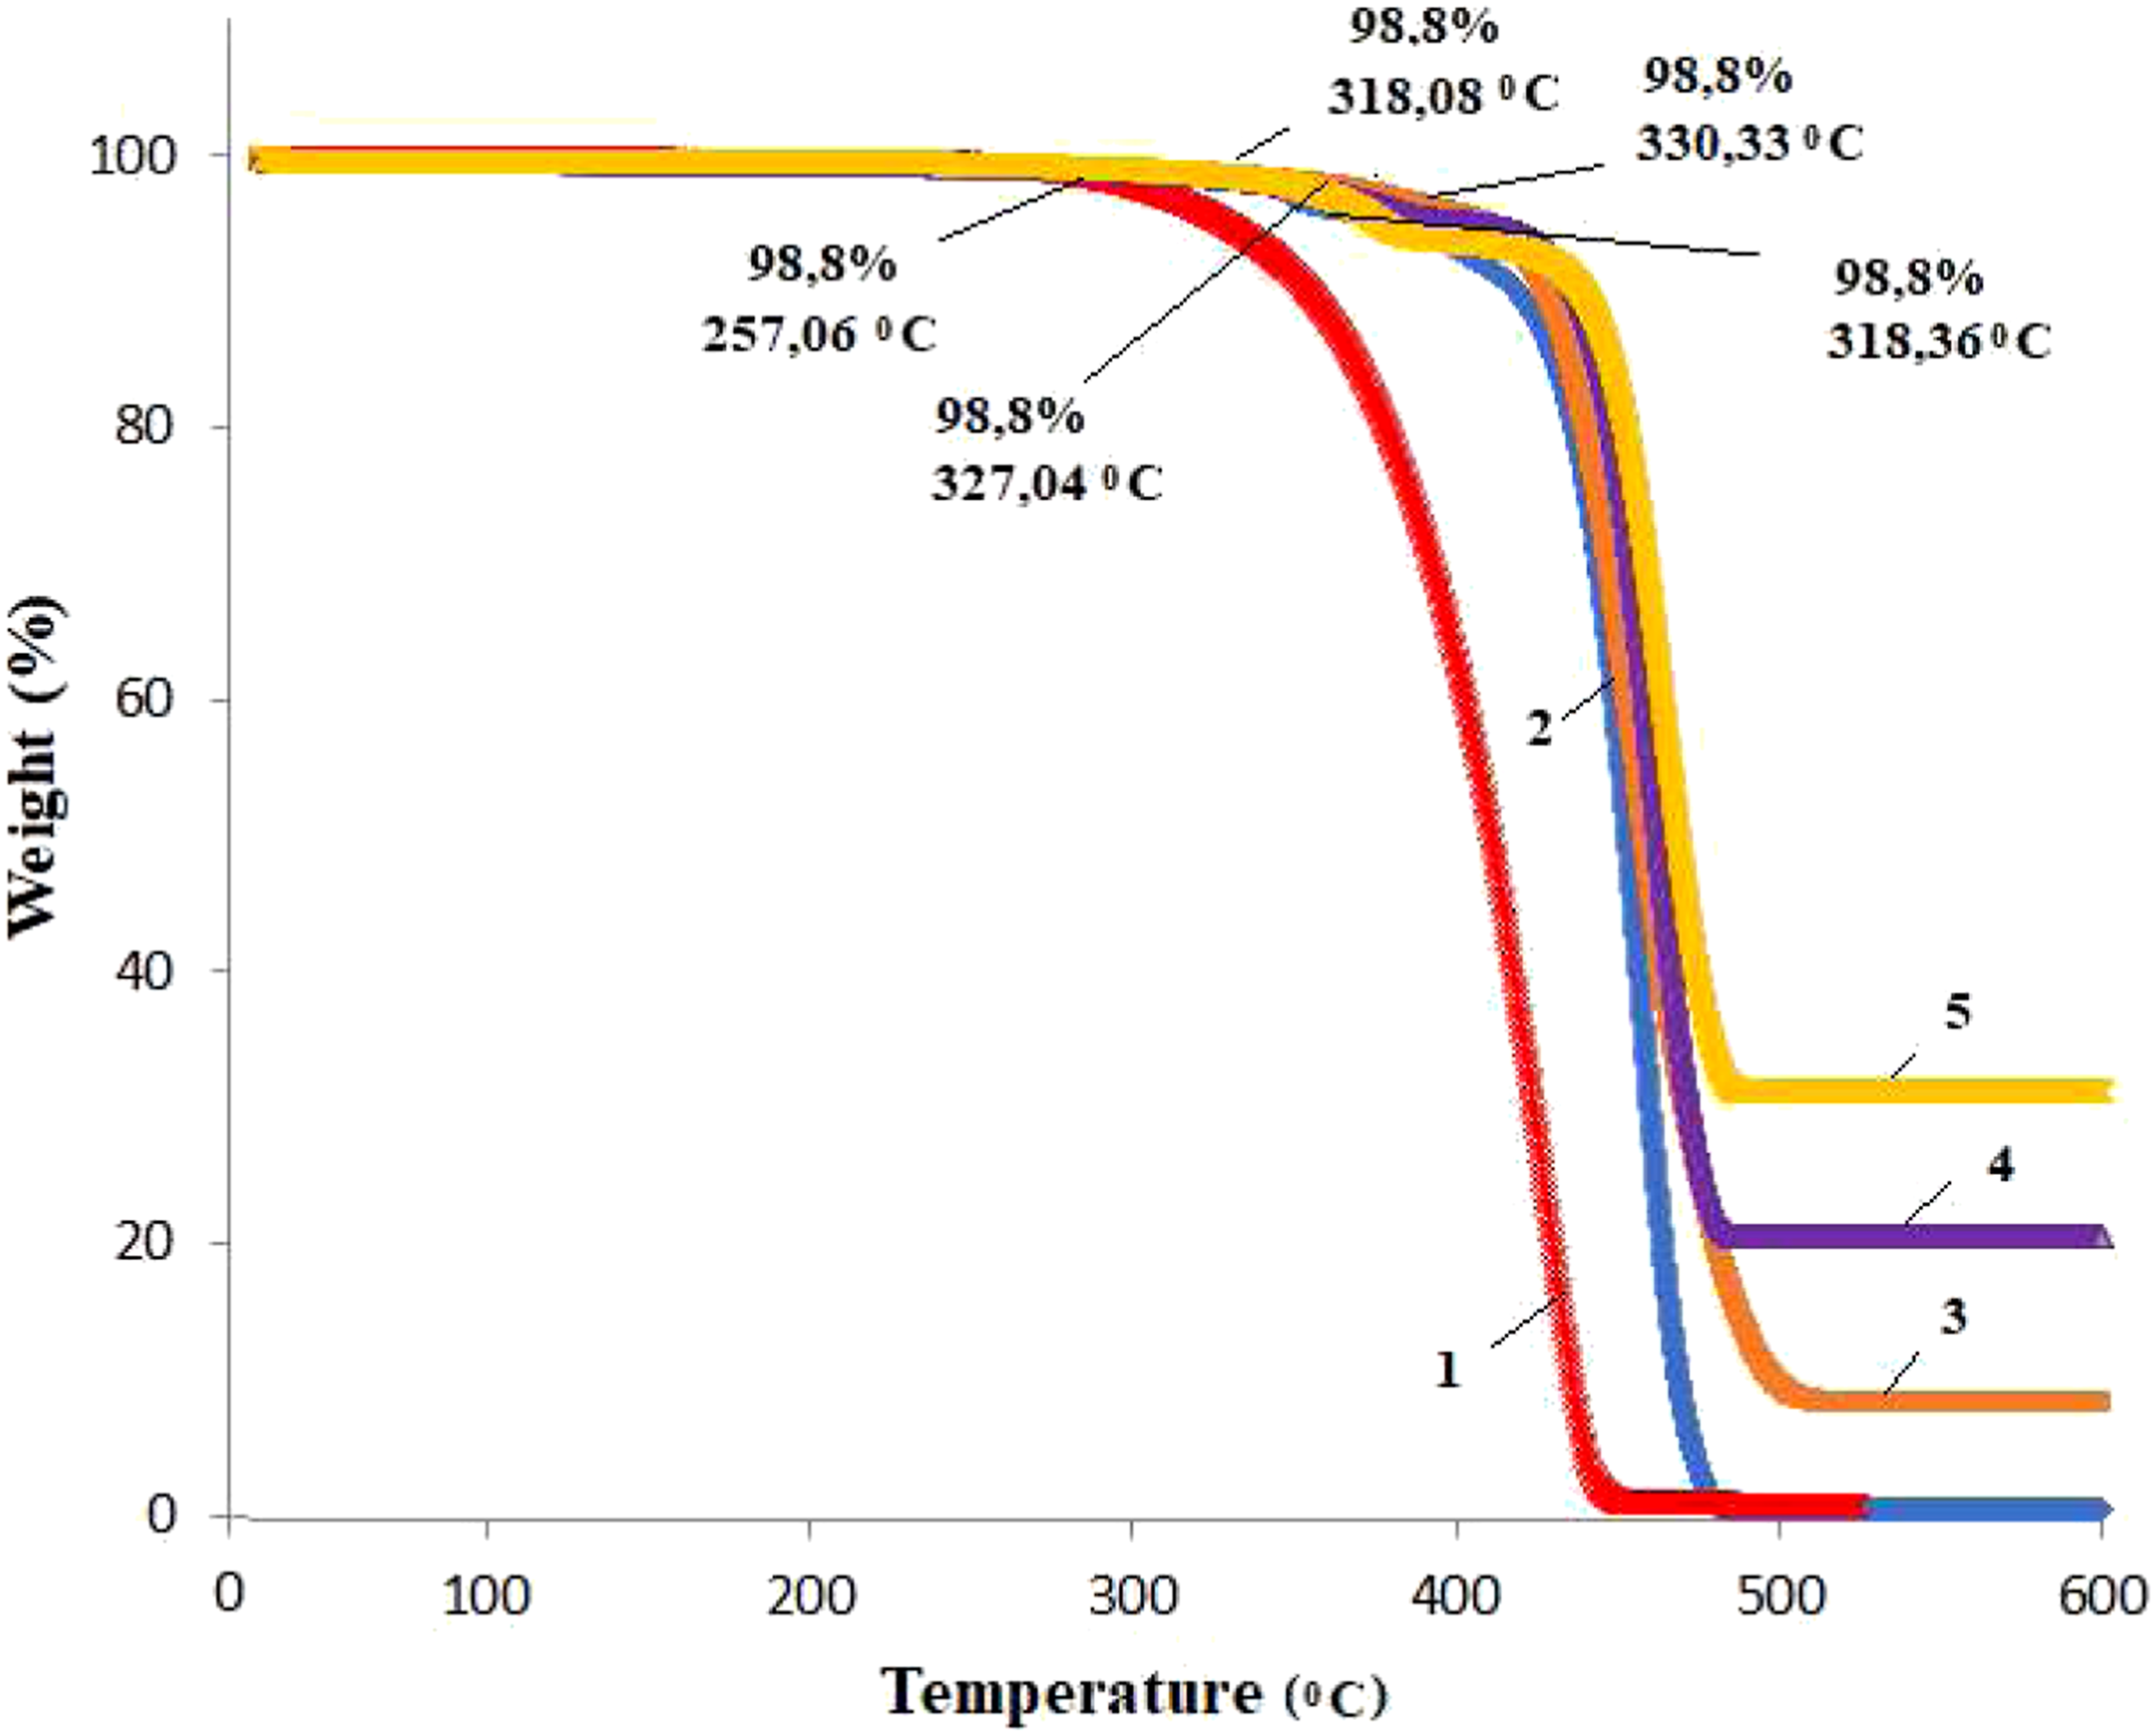
It can be seen that PP begins to undergo thermo-oxidative degradation at a temperature of 257.06°С with continuous weight loss up to 448.05°С. At a temperature of 448,05°С, there is a 99% loss of the total weight of the PP. The area after 448,05°С corresponds to gradual weight. When Cu nanoparticles are added to the PP polymer matrix at a 1% Cu content, the onset temperature of the start of thermo-oxidative degradation for PP/Cu based nanocomposites shifts toward high temperatures and amounts to 318.36°С. The loss of mass continuously continues to 479.13°C, after which the loss of mass ceases. At a content of 3% Cu in PP, the onset temperature of thermooxidative degradation for nanocomposites shifts to a temperature of 330.33°С, and mass loss continues to 485.62°С.
So for the nanocomposite, with the introduction of 1% Cu content in the polypropylene polymer, thermal stability increased by 61°C, with 3% nanoparticle content in PP - 73.27 C, with 5% content −61.02 C; at 10% content −69.96 C. Consequently, taking into account that PP is a part of widely used thermoplastic polymers, it can be concluded that an increase in the thermal stability of PP by almost 73.27°C will expand the possibilities of using polymeric nanocomposites based on PP/Cu in various field of industry and techniques.
The effect of copper nanoparticles on thermal stability on PP.
A further increase in the Cu content in the PP polymer matrix slightly decreases the temperature of the onset of thermal-oxidative degradation of polymer nanocomposites based on them. So, at 5% copper content onset temperature for nanocomposites is about 318.08°С and weight loss goes up to 480.55°С. For 10% copper content - 327.04°С with continuous weight loss up to 481.56°С. Therefore, it was found that the addition of copper nanoparticles to the PP polymer matrix increases the thermal stability of the polymer and this heat resistance reaches its maximum value at 3% content of copper nanoparticles in the polymer. A further increase in the content of Cu nanoparticles in the matrix leads to an insignificant decrease in the initial thermal limit to lower temperatures.30,31 Krishnaiah and et al. in work 32 observed that thermal stability of polypropylene-based nanocomposites filled with halloysite nanotubes increased in comparison to pure PP. The highest thermal stability was observed for the sample that contained 6% wt of halloysite nanotubes. Its thermal stability increased by only 18°C. In another work 33 Krishnaiah and et al. studied the thermal stability of polypropylene based nan composites reinforced by surface-treated short sisal fibers and halloysite nanotubes. They observed that the thermal stability was enhanced further by 60°C, with the incorporation of silane-grafted halloysite nanotubes into the PP composite containing treated sisal fibers, compared to the composites containing untreated halloysite nanotubes and sisal fibers. They concluded that the improved thermal stability was probably due to good interfacial bonding between the nanoparticles and PP polymer.
DSC analysis of polymer nanocomposites
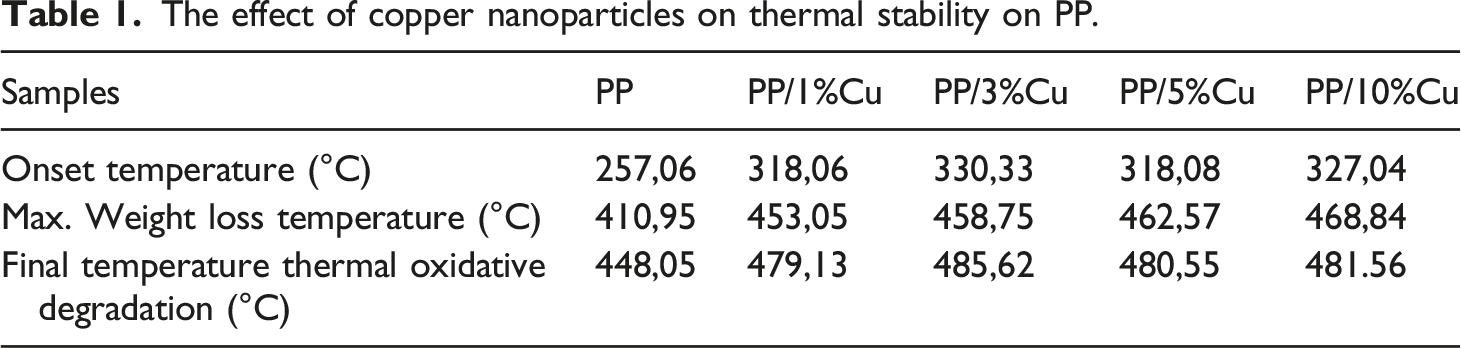
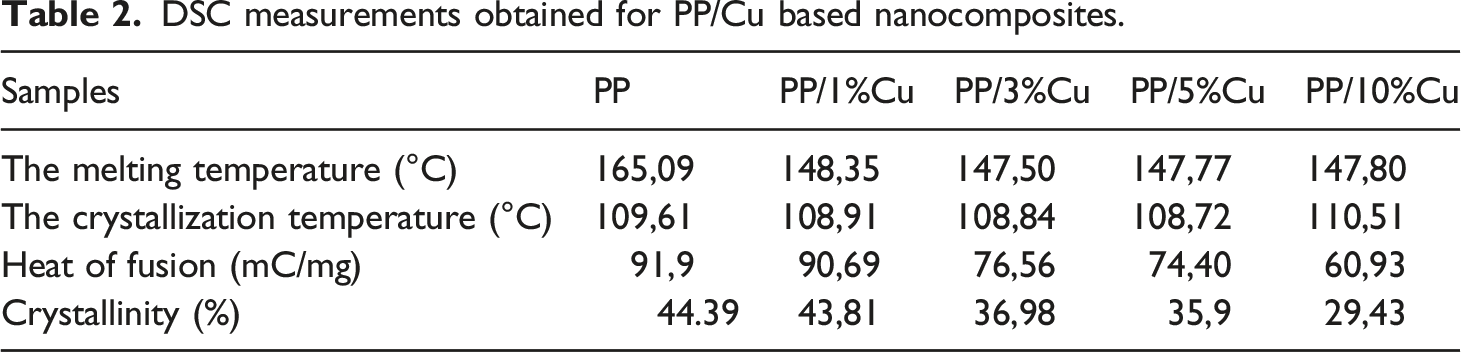
Information of the thermal phase transitions in PP and PP/Cu-based nanocomposites can be obtained from calorimetric analysis. Figures 9 and 10 show DSC melting curves for nanocomposites based on PP/Cu. From previous studies of polypropylene-based nanocomposites, it is known that the melting point of pure polypropylene is 165.09°С, and the crystallization temperature is 109.61°С.8–10,30,31 It was found that with an increase in the content of Cu nanoparticles in the PP matrix, the melting temperature of nanocomposites slightly decreases, and the crystallization temperature slightly increases. It is also known from the literature that only strong nucleating agents are capable of shifting crystallization peaks towards high temperatures, while weak nucleating agents don’t have this ability.34–36 Hence, it follows that copper nanoparticles are not very strong nucleating agents for the polypropylene polymer matrix. DSC melting curves for nanocomposites based on PP/Cu: (1). PP/1%Cu; (2). PP/3%Cu; (3). PP/5%Cu; (4). PP/10%Cu. DSC crystallization curves for nanocomposites based on PP/Cu: (1). PP/1%Cu; (2). PP/3%Cu; (3). PP/5%Cu; (4). PP/10%Cu.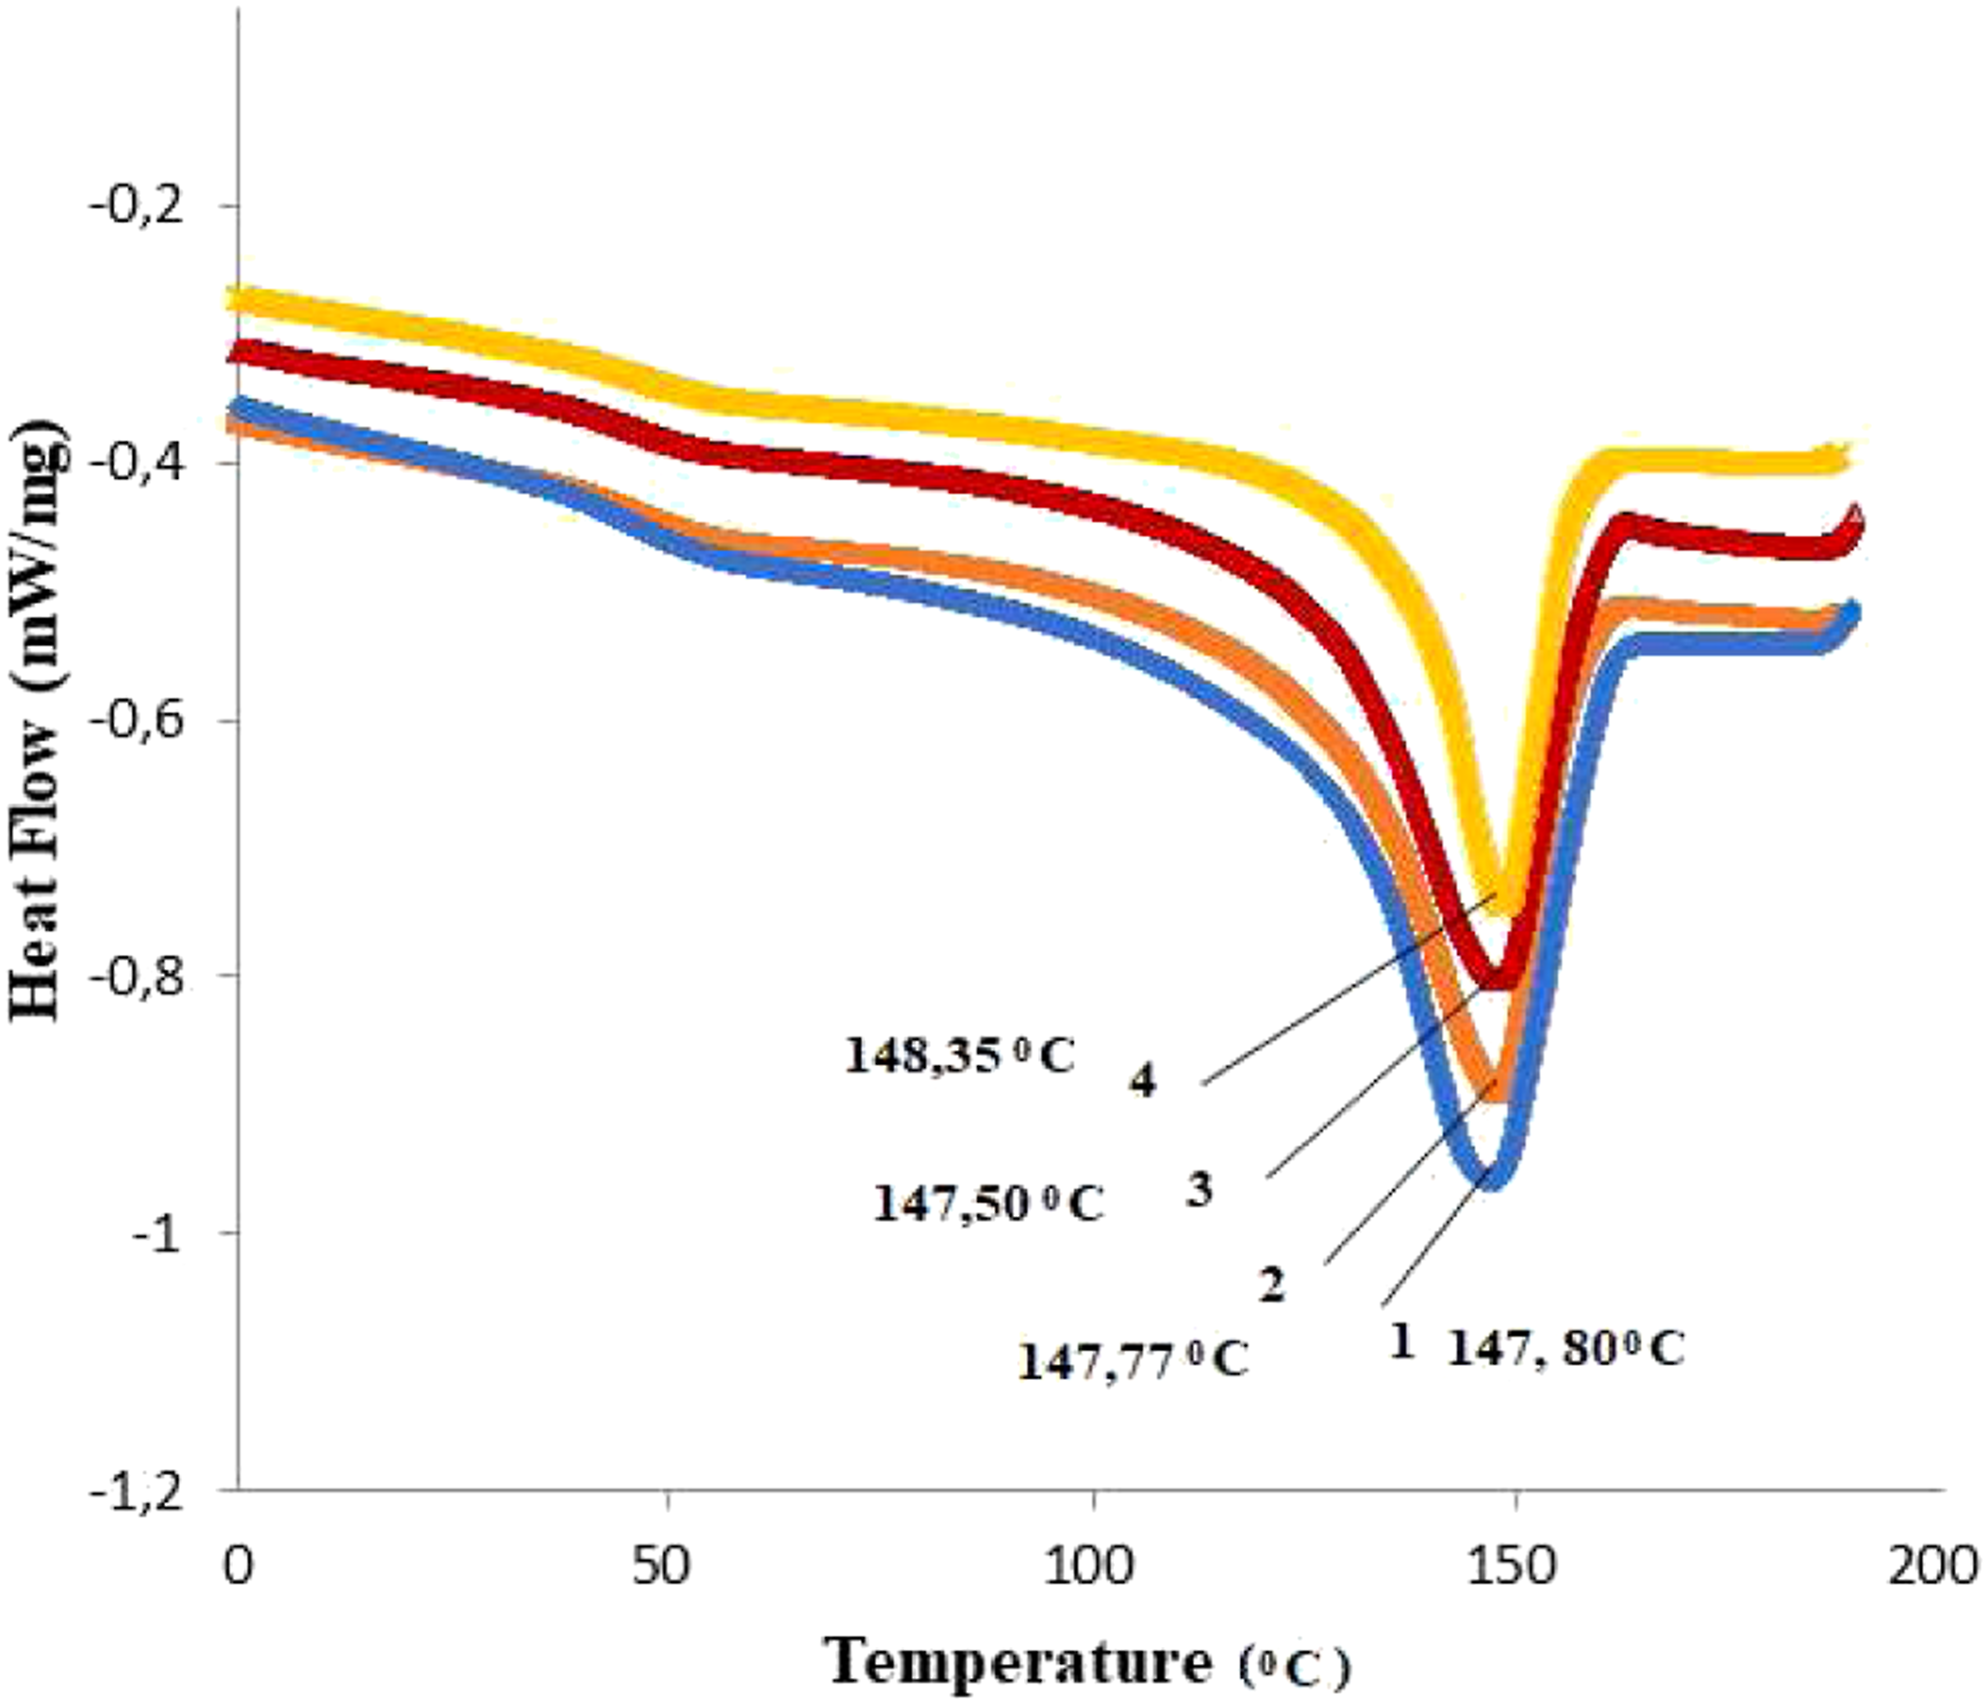
DSC measurements obtained for PP/Cu based nanocomposites.
The dependence of the mechanical strength for nanocomposites based on PP/Cu on the content of copper nanoparticles has been studied (Figure 11). It was found that the mechanical strength for PP/Cu-based nanocomposites increases to 3% of the content of copper nanoparticles and then decreases. Dependence of the mechanical strength of nanocomposites based on PP/Cu on the content of copper nanoparticles.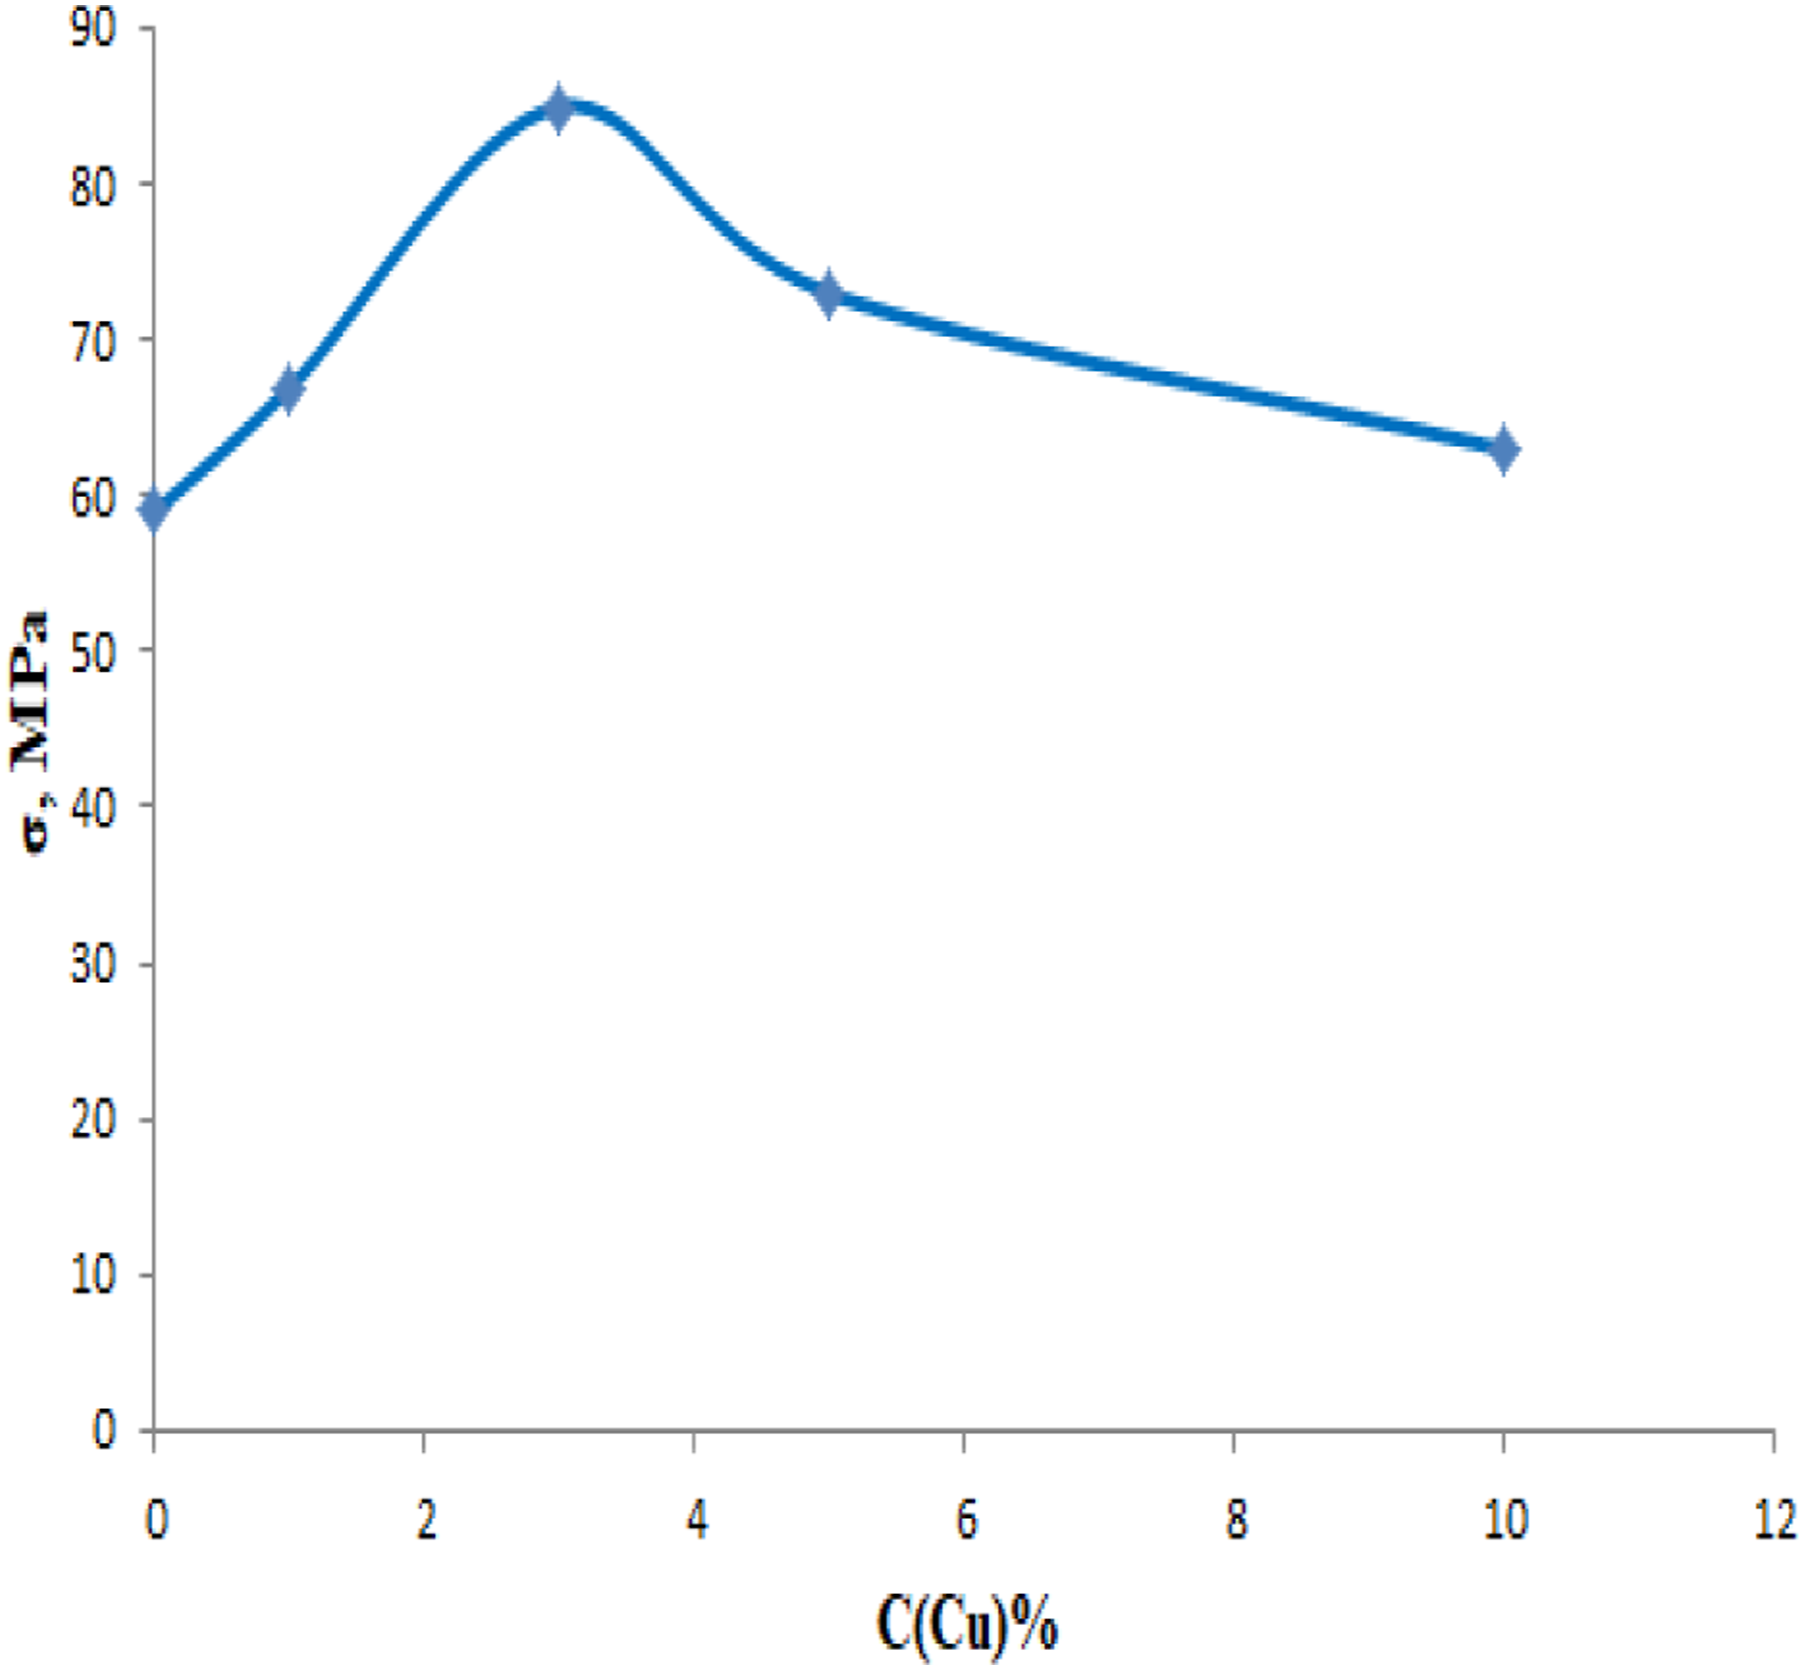
The increase in the mechanical strength of the nanocomposite to 3% content copper nanoparticles, in the polypropylene is associated with the structuring of the polymer matrix. It is assumed that up to 3% of the content of Cu additives in PP, nanoparticles play the role of a nucleus of crystallization for polymer matrices. It has been established that when polypropylene is reinforced with copper nanoparticles, the interfacial adhesion between the nanoparticles and the polymer increases due to the large specific surface area of the nanoparticles, which in turn leads to an increase in the thermal and mechanical properties of the polypropylene based nan composites. 32
Conclusion
Polymer nanocomposites based on PP/Cu were obtained by the combining of ex-situ casting solution and hot pressing methods. The structure of polymer nanocomposites was characterized by XRD, SEM, EDS, AFM, and FT-IR spectroscopy analysis. The thermal properties were analyzed using differential scanning calorimetry (DSC) and thermogravimetric analysis (TGA). It was found that the addition of copper nanoparticles into the PP matrix increases the thermal stability of the polymer, and this thermal stability reaches its maximum value at 3% content of copper nanoparticles. A further increase in the content of Cu nanoparticles leads to decrease in onset temperature towards low temperatures. It was found that with an increase in the content of Cu nanoparticles in the PP matrix, the melting point of nanocomposites decreases, while the crystallization temperature remains almost unchanged. It was established that with the introduction of copper nanoparticles into the polypropylene matrix, the crystallinity degree of PP/Cu-based nanocomposites decreases for all contents of copper nanoparticles.
Footnotes
Declaration of conflicting interests
The author(s) declared no potential conflicts of interest with respect to the research, authorship, and/or publication of this article.
Funding
The author(s) received no financial support for the research, authorship, and/or publication of this article.