
Abstract
Electrically conductive nanocomposite system based on poly(butyl methacrylate) (PBMA) with different contents of neodymium-doped titanium dioxide (Nd-TiO2) was prepared by in situ free radical polymerization method. The effect of Nd-TiO2 on the morphology and structural properties of the composites was carried out by scanning electron microscope (SEM) and X-ray diffraction analysis (XRD). The temperature-dependent AC conductivity and DC electrical conductivity of PBMA/Nd-TiO2 nanocomposites were studied with respect to the different volume fraction of Nd-TiO2 nanoparticles. SEM and XRD patterns revealed the uniform dispersion and structural regularity of nanoparticles in the polymer matrix. The AC conductivity of PBMA and its composites were found to be increased with an increase in temperatures and frequencies. The activation energy and exponential factor were analyzed from AC conductivity and both results indicate the hopping conduction mechanism present in PBMA/Nd-TiO2 nanocomposite, which is responsible for the variation of conductivity with temperature also. The DC conductivity of nanocomposites was higher than pure PBMA and the conductivity increases with increase in the concentration of Nd-TiO2 nanoparticles. Experimental and theoretical investigations based on McCullough, Bueche, Scarisbrick, and Mamunya modeling were carried out to observe the DC conductivity differences induced by the addition of Nd-TiO2 nanoparticles in PBMA matrix. Among the various modeling studied here, Mamunya model shows better agreement with the experimental conductivity.
Keywords
Introduction
Polymer nanocomposites are ubiquitous in industrial and research fields due to their extraordinary properties. 1 –4 The addition of nanofillers to polymer matrix causes an enhancement in the thermal, optical, electrical, and mechanical properties of the polymer matrix by the synergetic interaction between the nanofillers and the polymer. 5 –7 The uniform dispersion of nanoparticles in polymers brought significant changes in the molecular dynamics of polymer matrix around the surface of nanoparticles leads to the unpredictable change in the properties of polymer matrix. 8 –10 However, the extent of interfacial interaction of nanoparticles with the polymer matrix greatly depends on the size, the shape, and the nature of filler particles. The proper orientation and homogeneous dispersion of nanoparticles in the polymer matrix are easy as compared to microfillers, which are due to nanometer dimension and high surface energy of nanoparticles. 11 –13 The insulating polymers can be converted into the conducting one by the addition of nanoparticles at the percolation threshold. 14,15
Nanocomposites prepared by mixing the organic polymer with inorganic metal oxide nanoparticles got significant attention due to their excellent electrical and optical properties. 6 –18 Among the metal oxide nanoparticles, TiO2 is one of the most important nanoparticles because of its unique electrical and optical properties. 19 The surface modification by doping can further enhance the properties of nanoparticles. 20,21 The inclusion of conducting nanoparticles imparts a significant change in the electrical properties of the polymer matrix. The properties of composites also depend on the matrix composition and the way of fabrication of composites. Polyacrylates composites are preferred due to their good conductivity even at low temperature. 22 Moreover, the combination of polyacrylate with metal oxide nanoparticles results in composites having better electrical property, thermal, and mechanical stability. However, the proper inclusion of nanoparticles in the polymer is a great challenge due to the high adhesion of the nanoparticles leads to agglomeration. So, in situ polymerization method is executing in the synthesis of composites to ensure the homogenous dispersion of nanoparticles in the polymer matrix. 23
The electrical conductivity of insulating polymer can be enhanced by proper dispersion of conductive fillers. 24 There is an increased demand for flexible conductive composite by the incorporation of the relatively small amount (1–15 phr) of conductive fillers, which convert the thermoplastic material into a semiconductive one. 25 Based on the literature review, the electrical properties of thermoplastic nanocomposite based on poly(butyl methacrylate) (PBMA)/neodymium-doped titanium dioxide (Nd-TiO2) have yet to be published. Theoretical modeling studies are the best method to get proper idea about the actual phenomena occurs behind the enhanced electrical conductivity. There are many promising theoretical models for DC conductivity studies of polymer composites. The objective of the present article is to investigate the structural and electrical transport of PBMA nanocomposite with various loading of Nd-TiO2 nanoparticles. AC conductivity and activation energy of PBMA/Nd-TiO2 nanocomposite in a wide frequency and temperature range were studied here. Another aim of this work is to study the role of Nd-TiO2 nanoparticles in the DC conductivity of PBMA matrix and the experimental conductivity of the system has been correlated with different theoretical models for studying the conducting mechanism in PBMA/Nd-TiO2 nanocomposites.
Experimental
Materials and methods
Butyl methacrylate (Himedia, Mumbai, India), titanium isopropoxide (Ti (OPr)4 (Aldrich, Mumbai, India ), neodymium oxide (Aldrich,Mumbai, India), toluene, azobisisobutyronitrile (AIBN), cetyltrimethylammonium bromide (CTAB), nitric acid (HNO3), and ethanol were purchased from Merck (India) and are used in the synthesis without further purification.
Synthesis of Nd-TiO2nanoparticles
The Nd-TiO2 nanoparticles were prepared through the sol–gel process using titanium isopropoxide as the precursor and Nd2O3 as the dopant precursor. In a typical procedure, the titanium isopropoxide was mixed with ethanol and to this, the dopant solution prepared by dissolving 1.5 wt% of Nd2O3 together with HNO3 in ethanol was added slowly with constant stirring. After 20 min, few drops of water were added. This solution first became sol and then converted into a gel. The gel was allowed to stirring for 12 h and then dried. The dried powder was calcined at 550°C for 4 h and immediately stored in a desiccator.
Synthesis of PBMA/Nd-TiO2 nanocomposites
The PBMA with varying concentration of Nd-TiO2 nanoparticles was prepared by a simple in situ free radical polymerization method. Different contents of nanoparticles (0, 3, 5, 7, and 10 wt%) were dispersed in toluene containing CTAB through ultrasonication. This solution was then poured into butyl methacrylate monomer under constant stirring. The whole solution was again ultrasonicated for 20 min and the polymerization was carried out at 85°C for 90 min using AIBN as an initiator. The polymer composite formed was separated by precipitation method and the product washed with water and dried under vacuum for 48 h at 50°C.
Characterizations
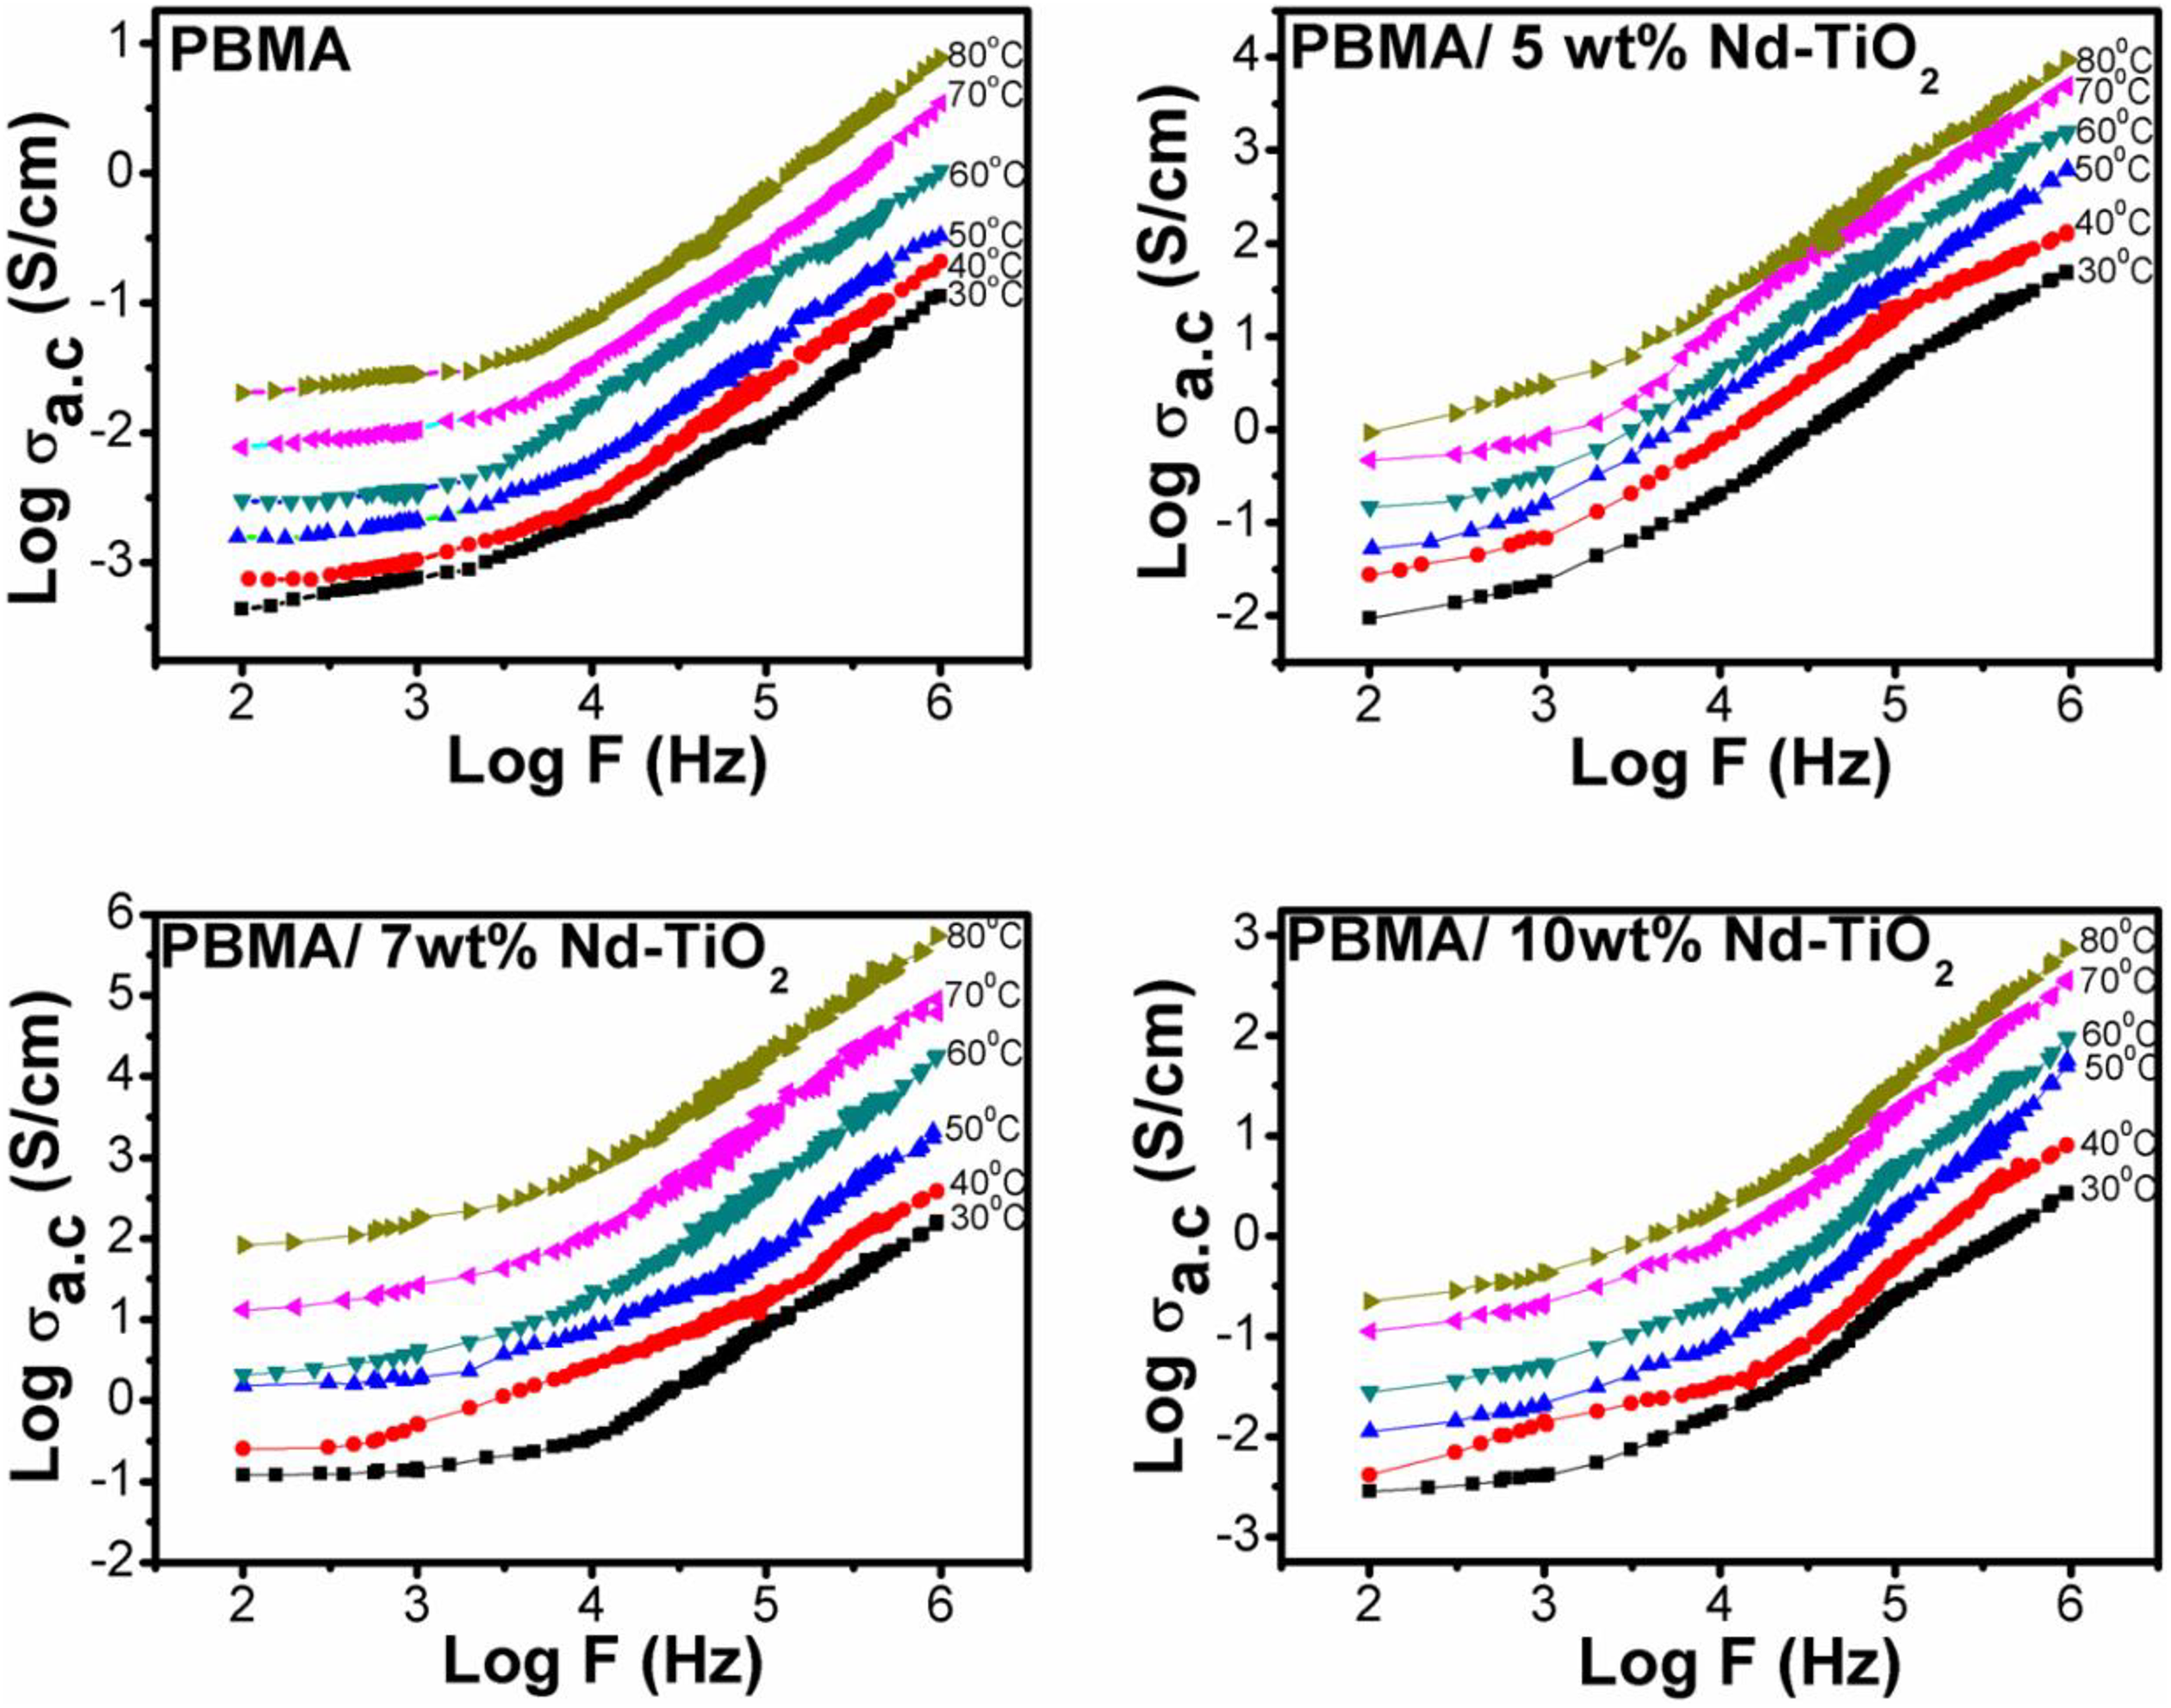
X-ray diffraction patterns of the nanocomposites were recorded using a Rigaku Miniflex 600 diffractometer . The diffractogram was measured at an operating 2θ range from 1° to 80° at a speed rate of 2°/min. Surface morphology of the fabricated polymer nanocomposites was investigated by a Hitachi S-3000 H scanning electron microscope (Tokyo, Japan). Electrical properties of the composite materials were measured using a sheet (circular shape of 0.3–0.5 mm thick and 1.2 cm diameter). The AC conductivity and dielectric parameters of the nanocomposites were measured by an automatic Hewlett Packard LCR meter (HP: 4284A, USA) in the frequency range of 102 to 106 Hz at different temperatures. The electrical conductivity was measured from dielectric data using the equation
and the conductivity was calculated by the equation

where d is the thickness of the sample, C is the capacitance, A is the area of the cross section of the sample,
Results and discussions
XRD analysis
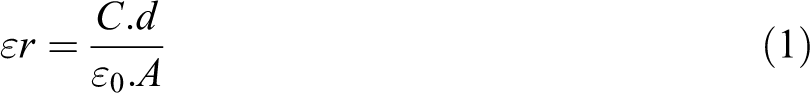
The XRD patterns of Nd-TiO2, PBMA, and PBMA/Nd-TiO2 nanocomposites are shown in Figure 1. The crystalline peaks of Nd-TiO2 appear at 2θ = 25. 3°, 37.8°, 47.6°, 54.2°, 62.4°, 69.3°, and 76.1° are representing the (101), (004), (200), (211), (204), (220), and (215) crystal reflection planes, respectively. 26 The XRD pattern of pristine PBMA displays a broad peak around 2θ = 18.8°, which represents its characteristic amorphous nature. Interestingly, the XRD patterns of PBMA/Nd-TiO2 composites display major peaks of Nd-TiO2 nanoparticles along with the amorphous peak of PBMA, which undoubtedly shows the attachment of nanoparticles within the macromolecular chain of PBMA and leads to the formation of some crystalline region. This indicates the interaction of nanoparticles with the PBMA matrix. It can also be seen from the figure that the intensity of the diffraction peaks slightly increases with an increase in the concentration of nanoparticles.
XRD patterns of PBMA and PBMA/Nd-TiO2 nanocomposite. PBMA: poly(butyl methacrylate); Nd-TiO2: neodymium-doped titanium dioxide.
SEM analysis
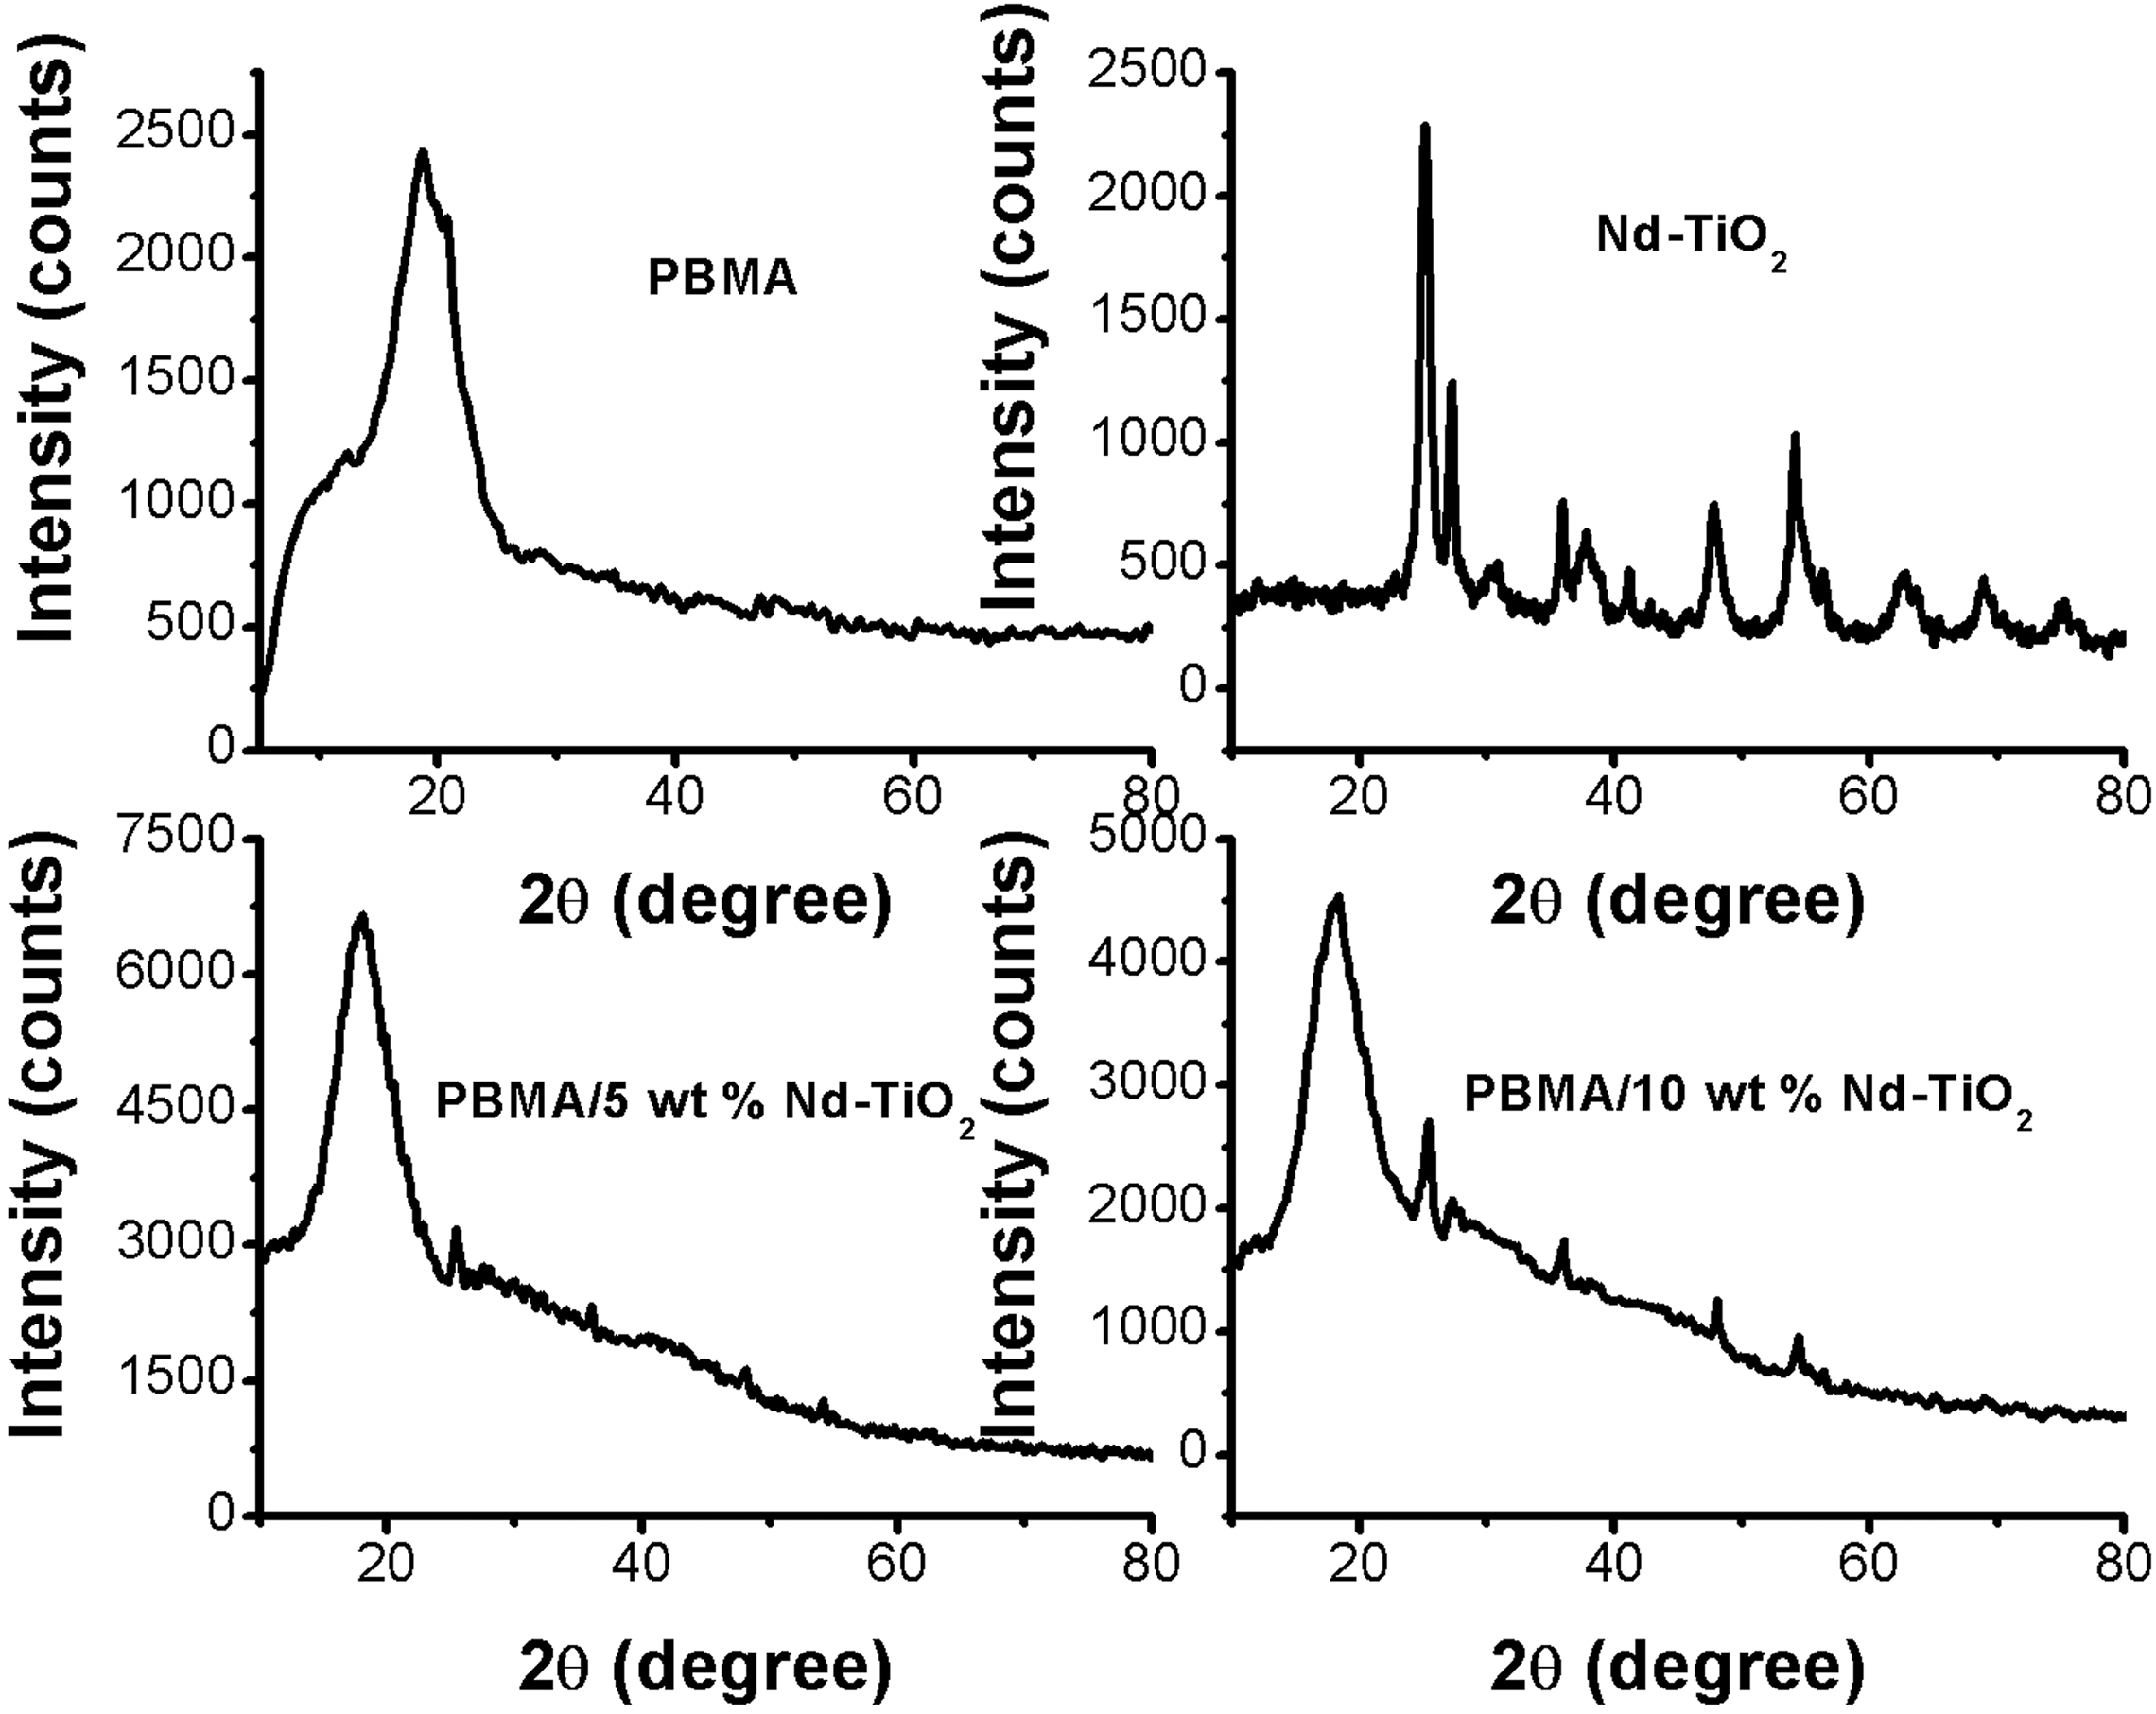
Figure 2 displays the SEM surface images of PBMA and PBMA/Nd-TiO2 nanocomposites. The SEM image of pure PBMA shows a homogenous morphology. However, the incorporation of Nd-TiO2 nanoparticles in PBMA affects the uniform surface morphology. The PBMA with 7 wt% Nd-TiO2 shows the uniform dispersion of Nd-TiO2 nanoparticles and this indicates the strong interfacial interaction of nanoparticles with the PBMA chains. However, the dispersion of nanoparticle in the polymer becomes poor at higher loading (10 wt%). This is due to the presence of agglomerated Nd-TiO2 nanoparticles.
SEM images of (a) PBMA, (b) PBMA/7 wt% Nd-TiO2, and (c) PBMA/10 wt% Nd-TiO2. PBMA: poly(butyl methacrylate); Nd-TiO2: neodymium-doped titanium dioxide.
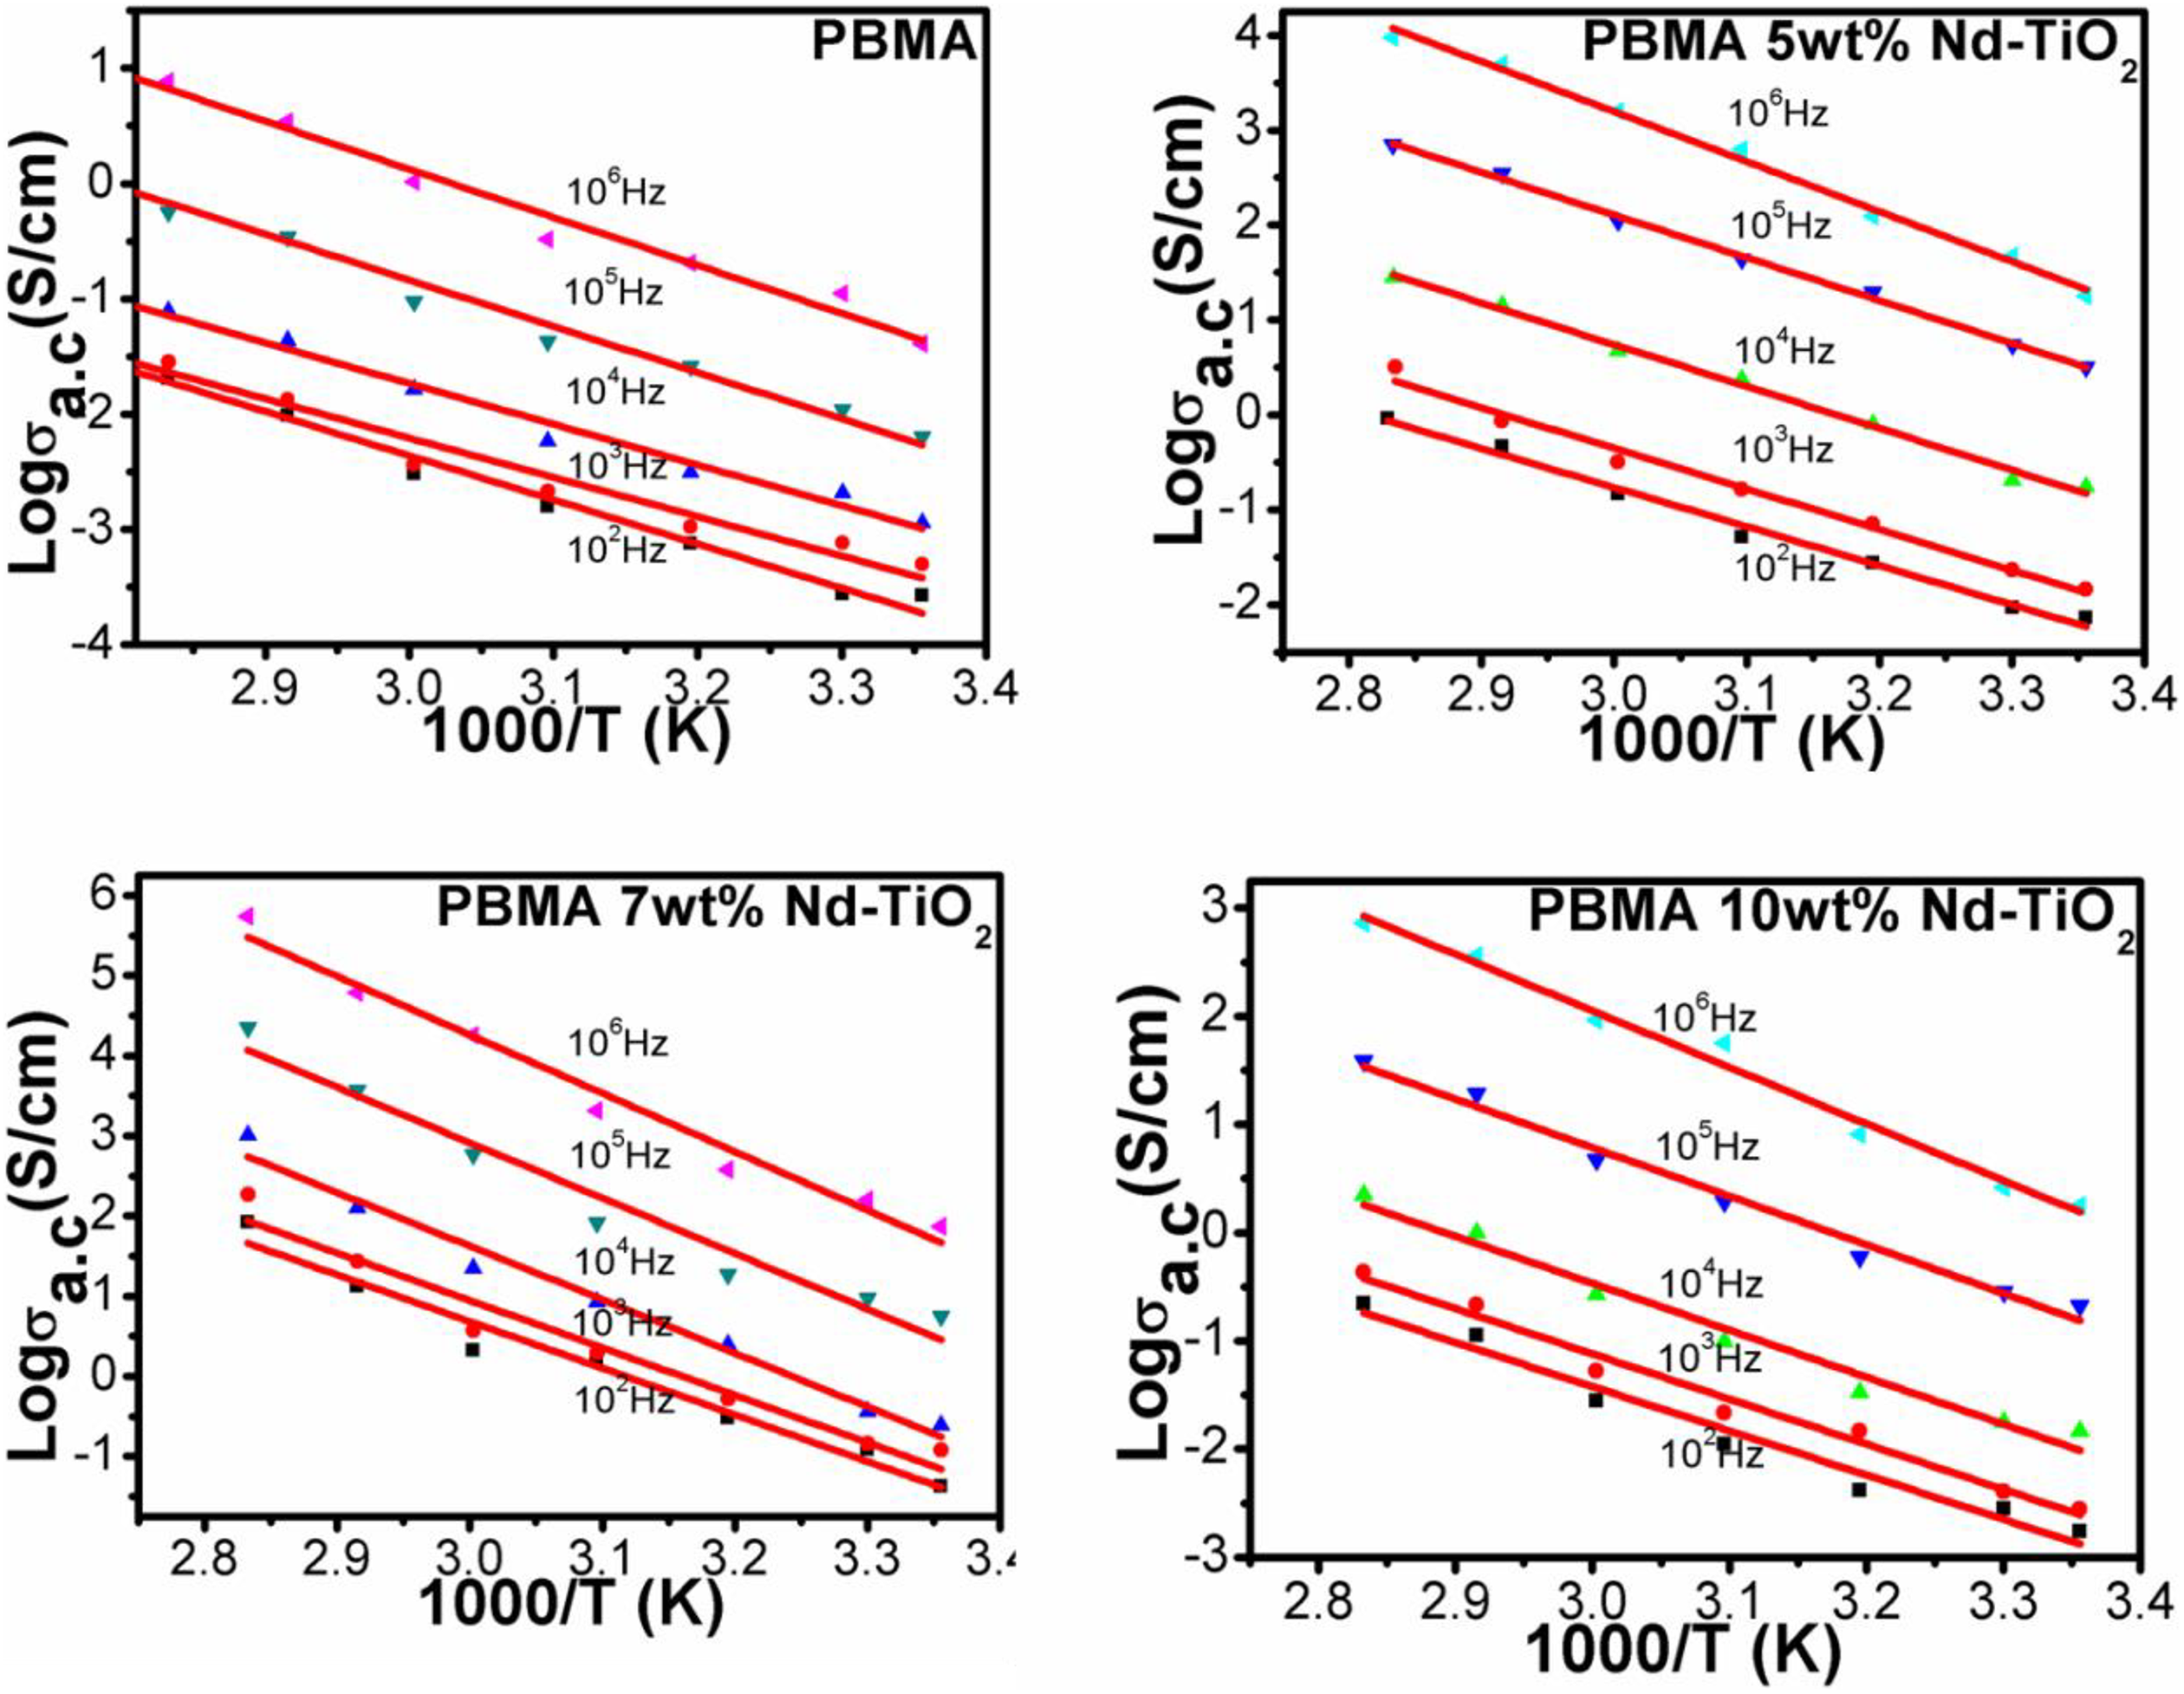
Temperature dependent AC conductivity
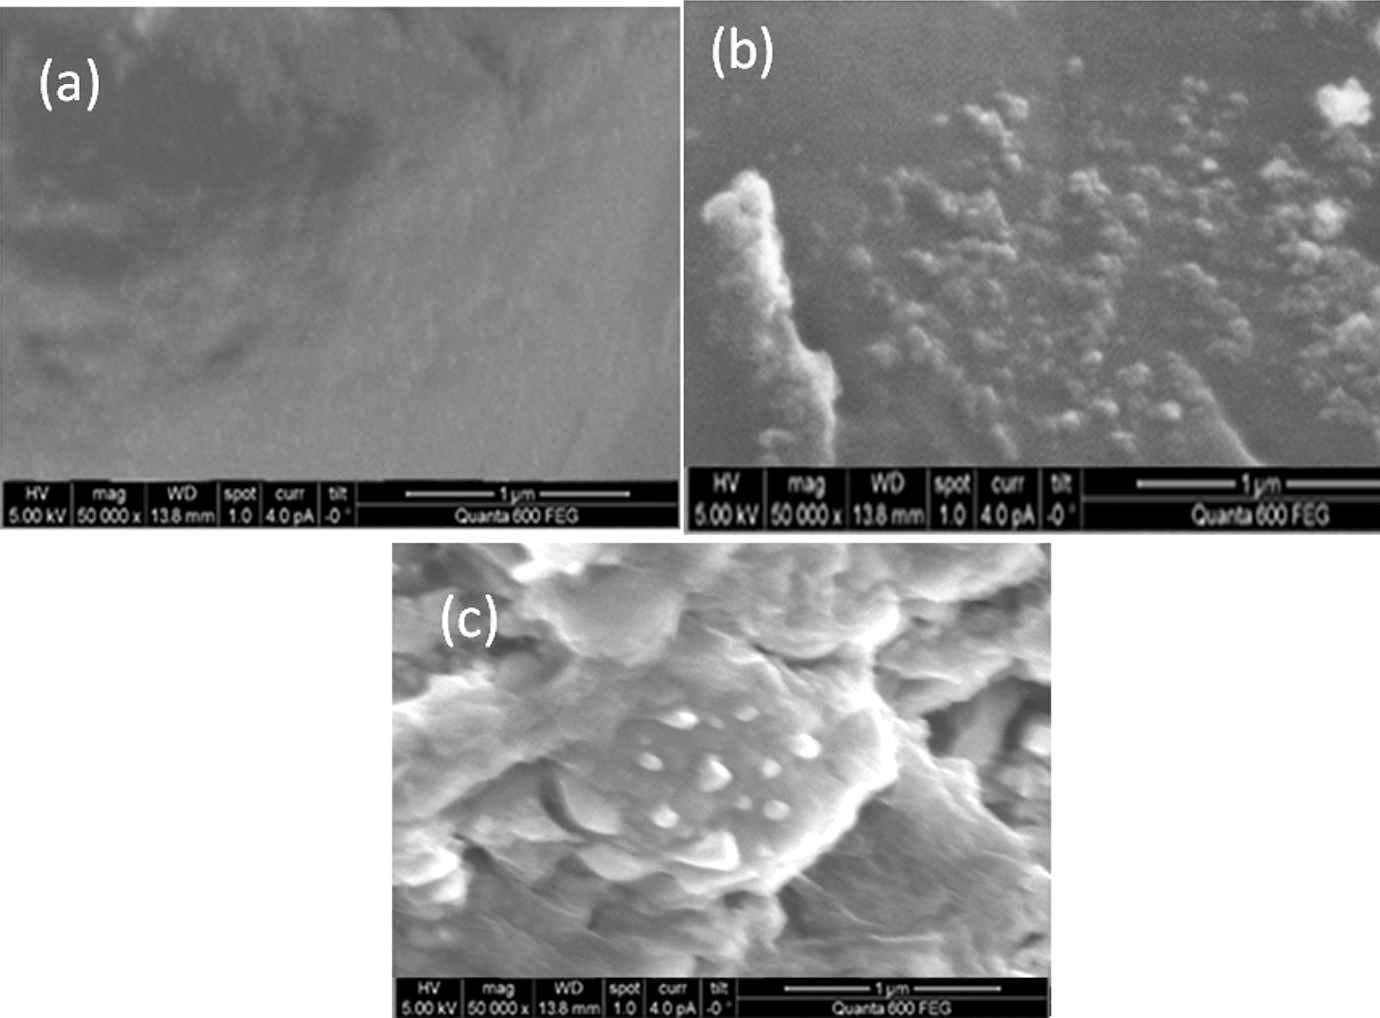
Figure 3 shows the AC conductivity plots of PBMA/Nd-TiO2 nanocomposites at different temperatures (298–353 K). The linear nature of the plots (log F vs. log σ ac) clearly indicates the typical semiconducting behavior of PBMA/Nd-TiO2 nanocomposites. It is clear from the figure that the conductivity increases with increase in temperature, which might be due to the increase in mobility of charge carriers. The increase in conductivity with frequency can be explained by the hopping conduction mechanism present in the PBMA/Nd-TiO2 nanocomposites, and the higher conductivity at higher frequency indicates the contribution from polarization effect along with hopping of charge carriers. 27 The results also showed that the conductivity of PBMA is greatly enhanced by the addition of Nd-TiO2 nanoparticles and the maximum conductivity is obtained for 7 wt% of Nd-TiO2 composite. The improvement in conductivity with the addition of nanoparticles is due to the increase in the number of charge carriers which increases the interfacial polarization and thereby an increase in the hopping of charge carriers. As the concentration of nanoparticles increases, the distance between charge carriers decreases and hence hopping of charge carriers also increases. The unexpected decrease in conductivity of 10 wt% samples might be due to the presence of agglomerated nanoparticles, which results in large separation between conducting particles and leads to lesser hopping of charge carries.
The temperature-dependent AC conductivity of PBMA with various contents of Nd-TiO2. PBMA: poly(butyl methacrylate); Nd-TiO2: neodymium-doped titanium dioxide.
Figure 4 shows the activation energy of PBMA/Nd-TiO2 nanocomposites. The activation energy obtained from the slope of the plots is tabulated in Table 1. The lower values of activation energy indicate that the hopping conduction mechanism present in the PBMA/Nd-TiO2 nanocomposites is due to electronic conduction rather than ions. 28 The dependence of AC conductivity with angular frequency can be expressed as σ ac = Aω s where’s’ is an exponent whose value lies between 0 and 1. The value of “s” indicates the extent of interaction of charge carriers in the lattice and also the type of conduction mechanism present in the composites.
The activation energy of PBMA with different contents of Nd-TiO2 nanoparticles. PBMA: poly(butyl methacrylate); Nd-TiO2: neodymium-doped titanium dioxide.
Activation energy of PBMA and its composites with Nd-TiO2 nanoparticles.
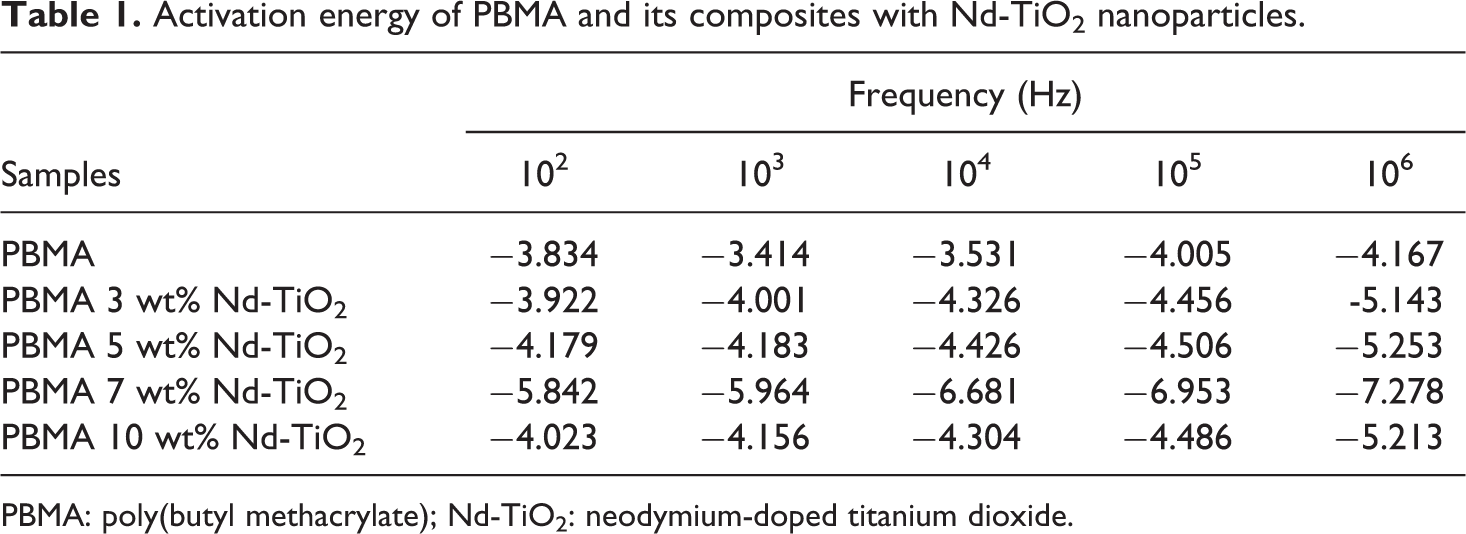
PBMA: poly(butyl methacrylate); Nd-TiO2: neodymium-doped titanium dioxide.
Table 2 represents the value of “s” obtained from the slope of the plot log σ ac versus log ω. The nature of conducting mechanism in polymer nanocomposite is explained on the basis of small polaron and large polaron assisted tunneling. In small polaron models, the “s” value decreases with temperature while in large polaron the “s” value increases with temperature. 29 In the present study, the value of “s” decreases with temperature and hence this system follows small polaron-assisted tunneling or hopping mechanism.
Frequency exponent ‘s’ at different temperatures from the AC conductivity of PBMA and its nanocomposites.
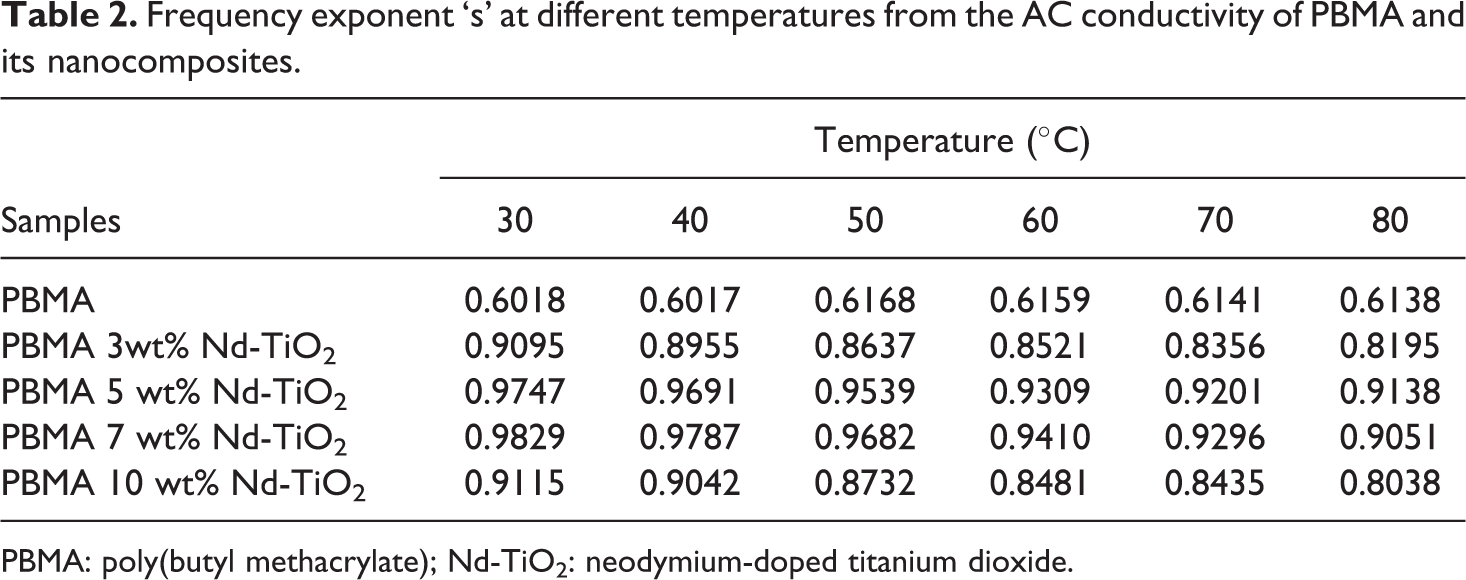
PBMA: poly(butyl methacrylate); Nd-TiO2: neodymium-doped titanium dioxide.
DC conductivity
Figure 5 represents the DC electrical conductivity (current vs. voltage) plots of PBMA/Nd-TiO2 nanocomposites. Significant enhancement in the DC electrical conductivity is observed in the case of PBMA/Nd-TiO2 nanocomposites with the addition of Nd-TiO2 nanoparticles. As the PBMA/Nd-TiO2 nanocomposites follow hopping or tunneling charge carrier mechanism (revealed from AC conductivity results), the conductivity increases with filler concentration due to increase in the number of charge carriers. 24,30 Further, as the amount of nanoparticles increases the interfacial interaction between PBMA and Nd-TiO2 nanoparticles increases and therefore the contribution from polarization effect is also added to the conductivity along with hopping effect.
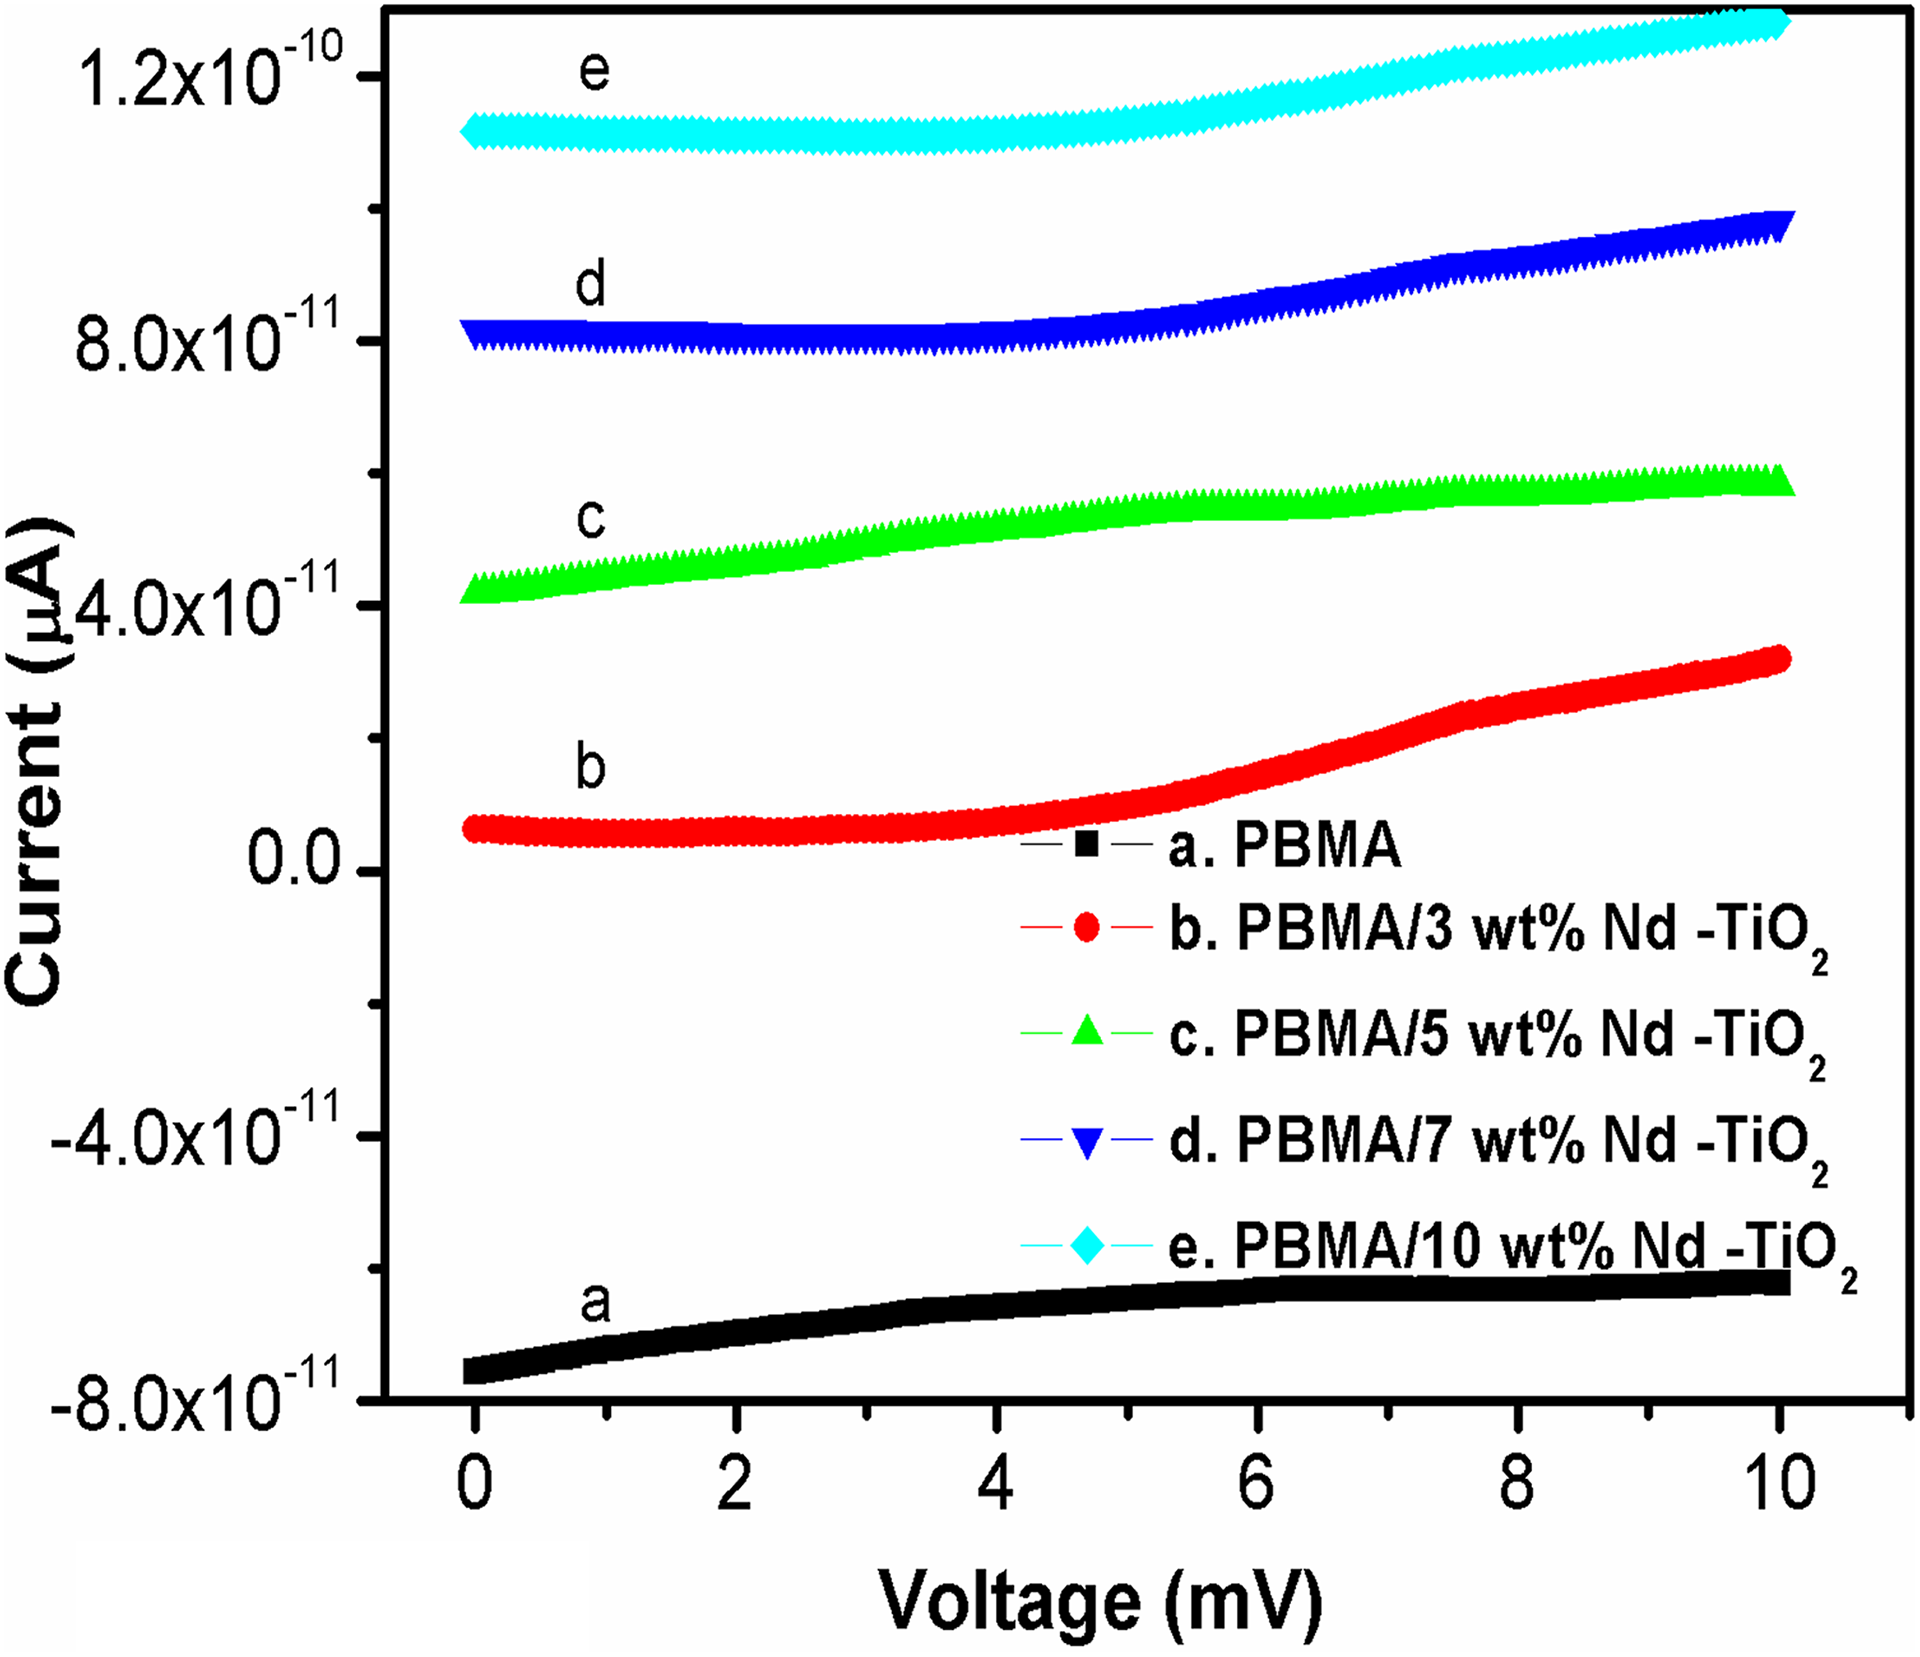
DC conductivity of PBMA with different concentrations of Nd-TiO2 nanoparticles. PBMA: poly(butyl methacrylate); Nd-TiO2: neodymium-doped titanium dioxide.
Percolation in PBMA/Nd-TiO2 nanocomposites
The variation in DC electrical conductivity of PBMA/Nd-TiO2 nanocomposites is given in Figure 6. As depicted in the figure, the addition of nanoparticles enhances the DC electrical conductivity of PBMA matrix almost two orders by the addition of 10 wt% nanoparticles. The curve shows a percolation threshold at 3 wt%. Above the percolation threshold, there is a marginal increase in conductivity up to 7 wt%. Below the percolation threshold, the conducting particles are separated with interruptions in the conducting path and it shows a slight increase in conductivity with the addition of nanoparticles. 31 The percolation threshold attained is an indication of the improved conductivity of the system, which arises from the greater hopping of charge carriers through the conducting path.
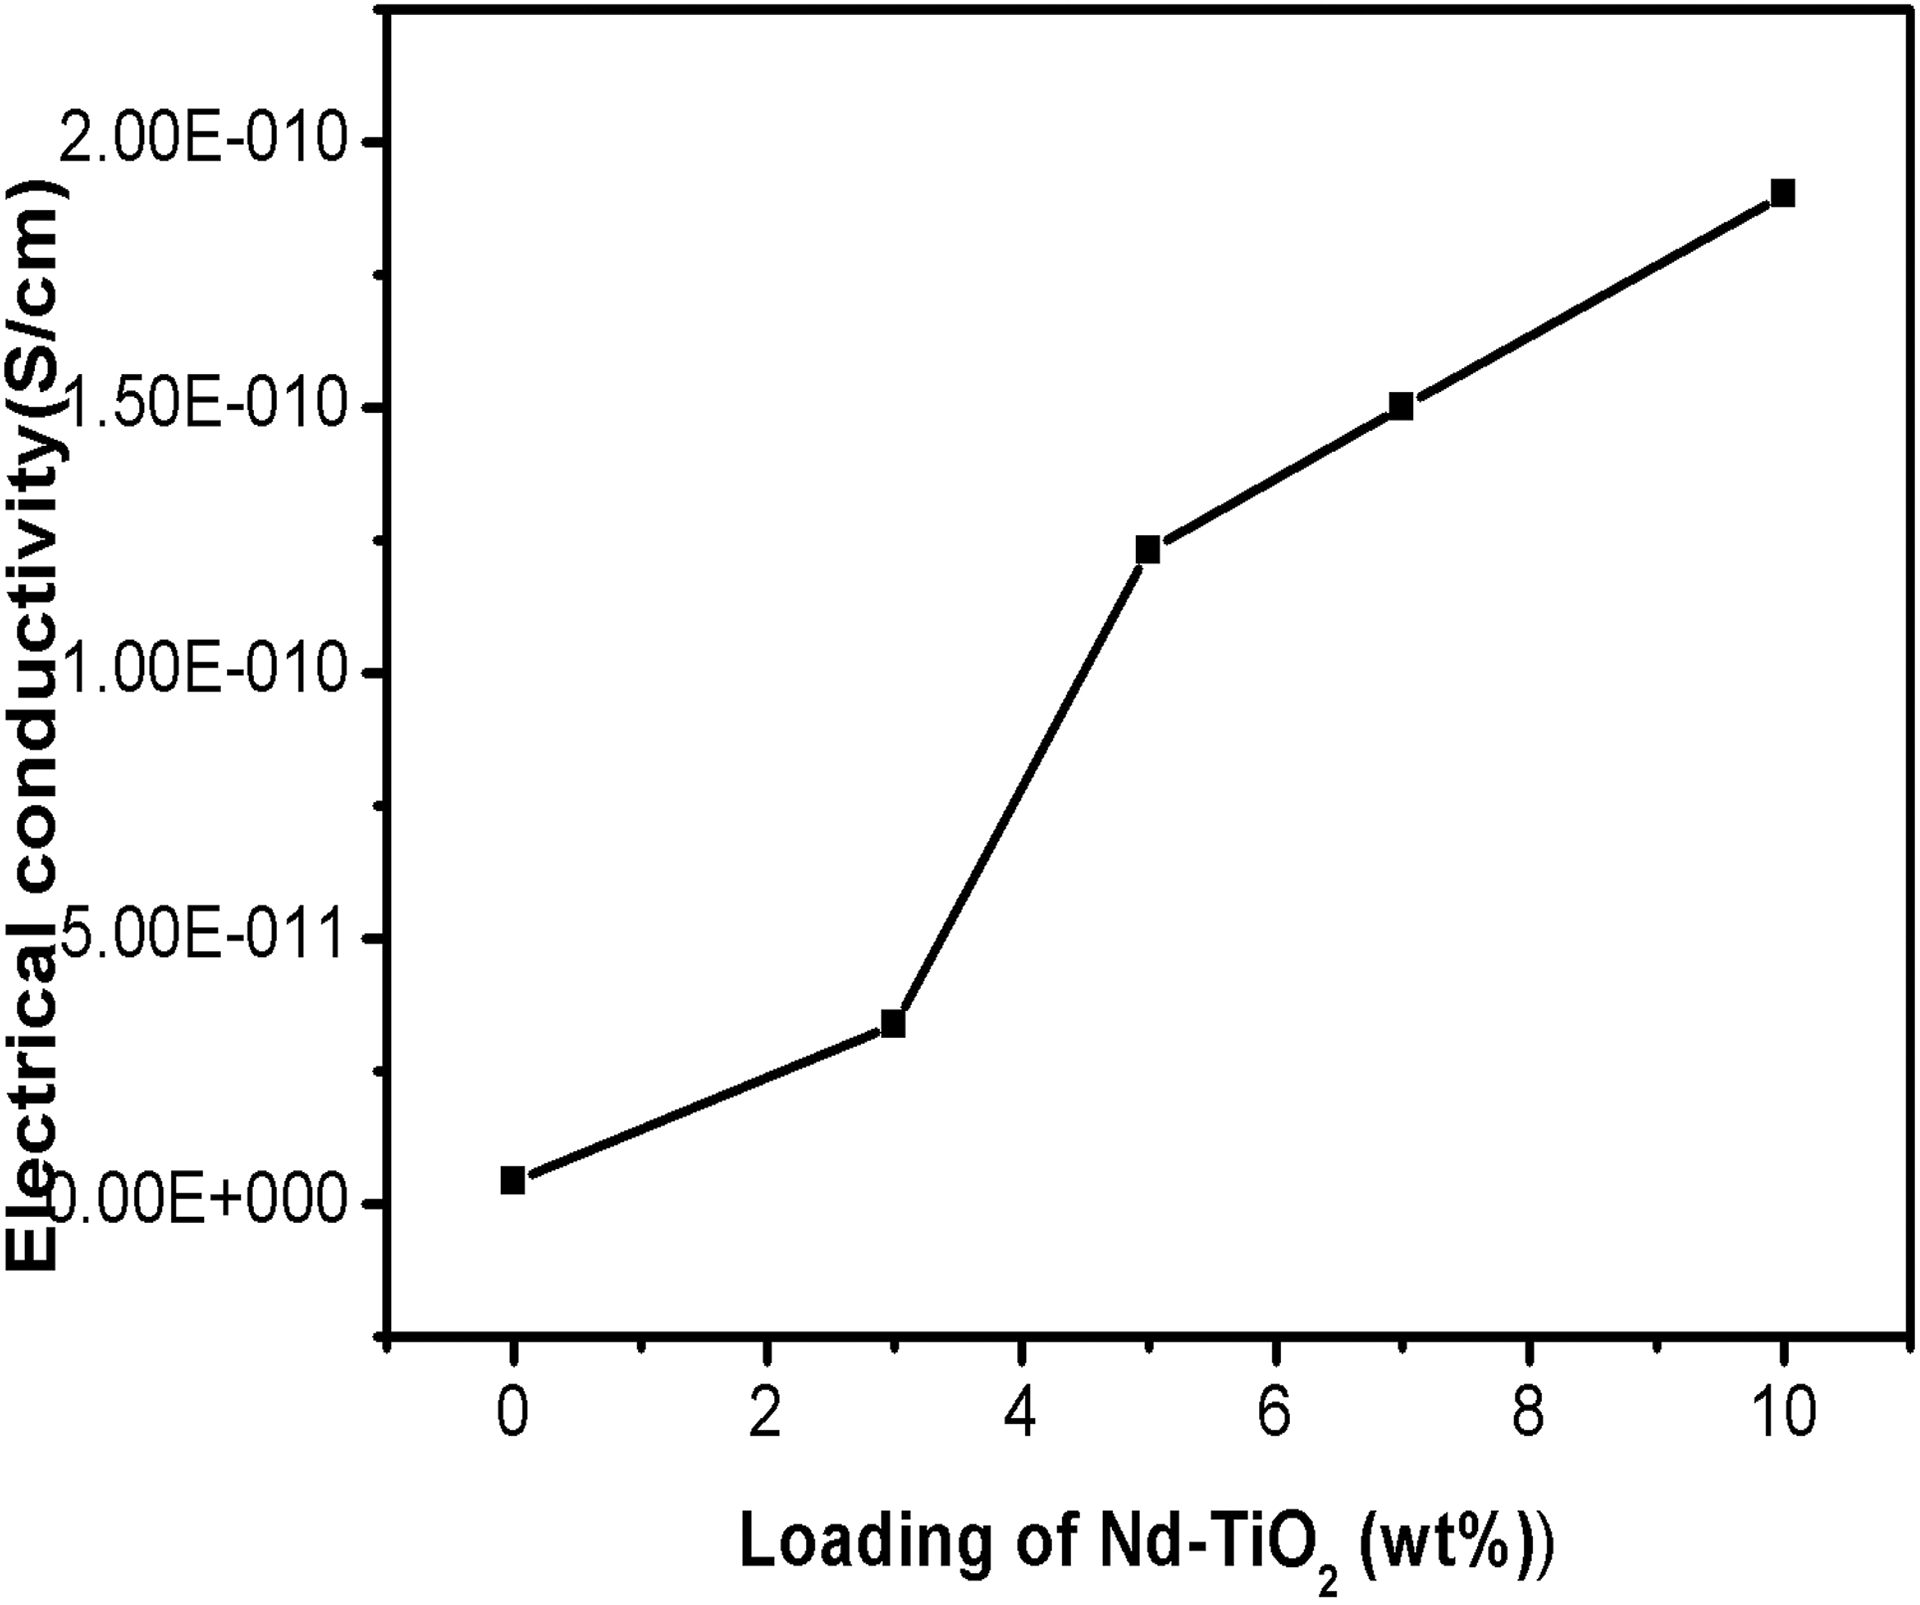
Variation electrical conductivity of PBMA with nanoparticles loading. PBMA: poly(butyl methacrylate).
Theoretical modeling
Theoretical modeling is used to study the conducting mechanism present in the polymer composites. The DC electrical conductivity of metal oxide nanoparticles filled polymer is discrete in nature and therefore at a particular concentration, the conductivity shows an abrupt increase called percolation threshold. Further, the conductivity of composites depends on various factors such as percolation threshold, surface energy, aspect ratio, filler volume fraction, and so on. Many theoretical modeling has been reported based on these factors for predicting the conductivity studies of polymer composites. 25 Various theoretical modelings such as McCullough, Bueche, Scarisbrick, and Mamunya equations are used to study the DC electrical conductivity of PBMA/Nd-TiO2 nanocomposites.
McCullough model
McCullough model predicts the DC conductivity of composites by the relation given in equations (3) to (5). In this model, the conductivity of composites depends on a parameter λ, which indicate the extent of interaction between the filler and polymer matrix, which in turn relates to the size, shape, aspect ratio, and volume fraction of filler. 24,32
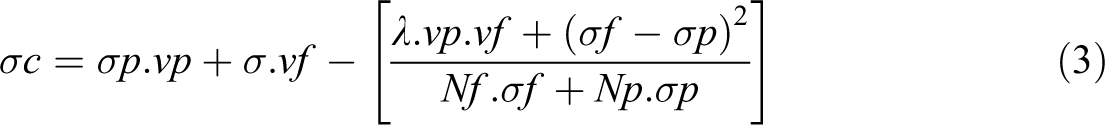
where σc is the conductivity of composite, σp and vp are the conductivity and volume fraction of polymer matrix, respectively, and σf and vf are the conductivity and volume fraction of filler, respectively. The Nf and Np are defined as


λ is the structural factor that determines the extent of conducting network formation in the polymer matrix and its value varies from 0 to 1. Figure 7 represents the conductivity of PBMA/Nd-TiO2 nanocomposites based on experimental and theoretical modeling. It can be seen that the conductivity obtained from McCullough model shows a large deviation from the experimental conductivity in the entire volume fraction of fillers. So McCullough model is not applicable to study the conductivity of PBMA/Nd-TiO2 nanocomposite.
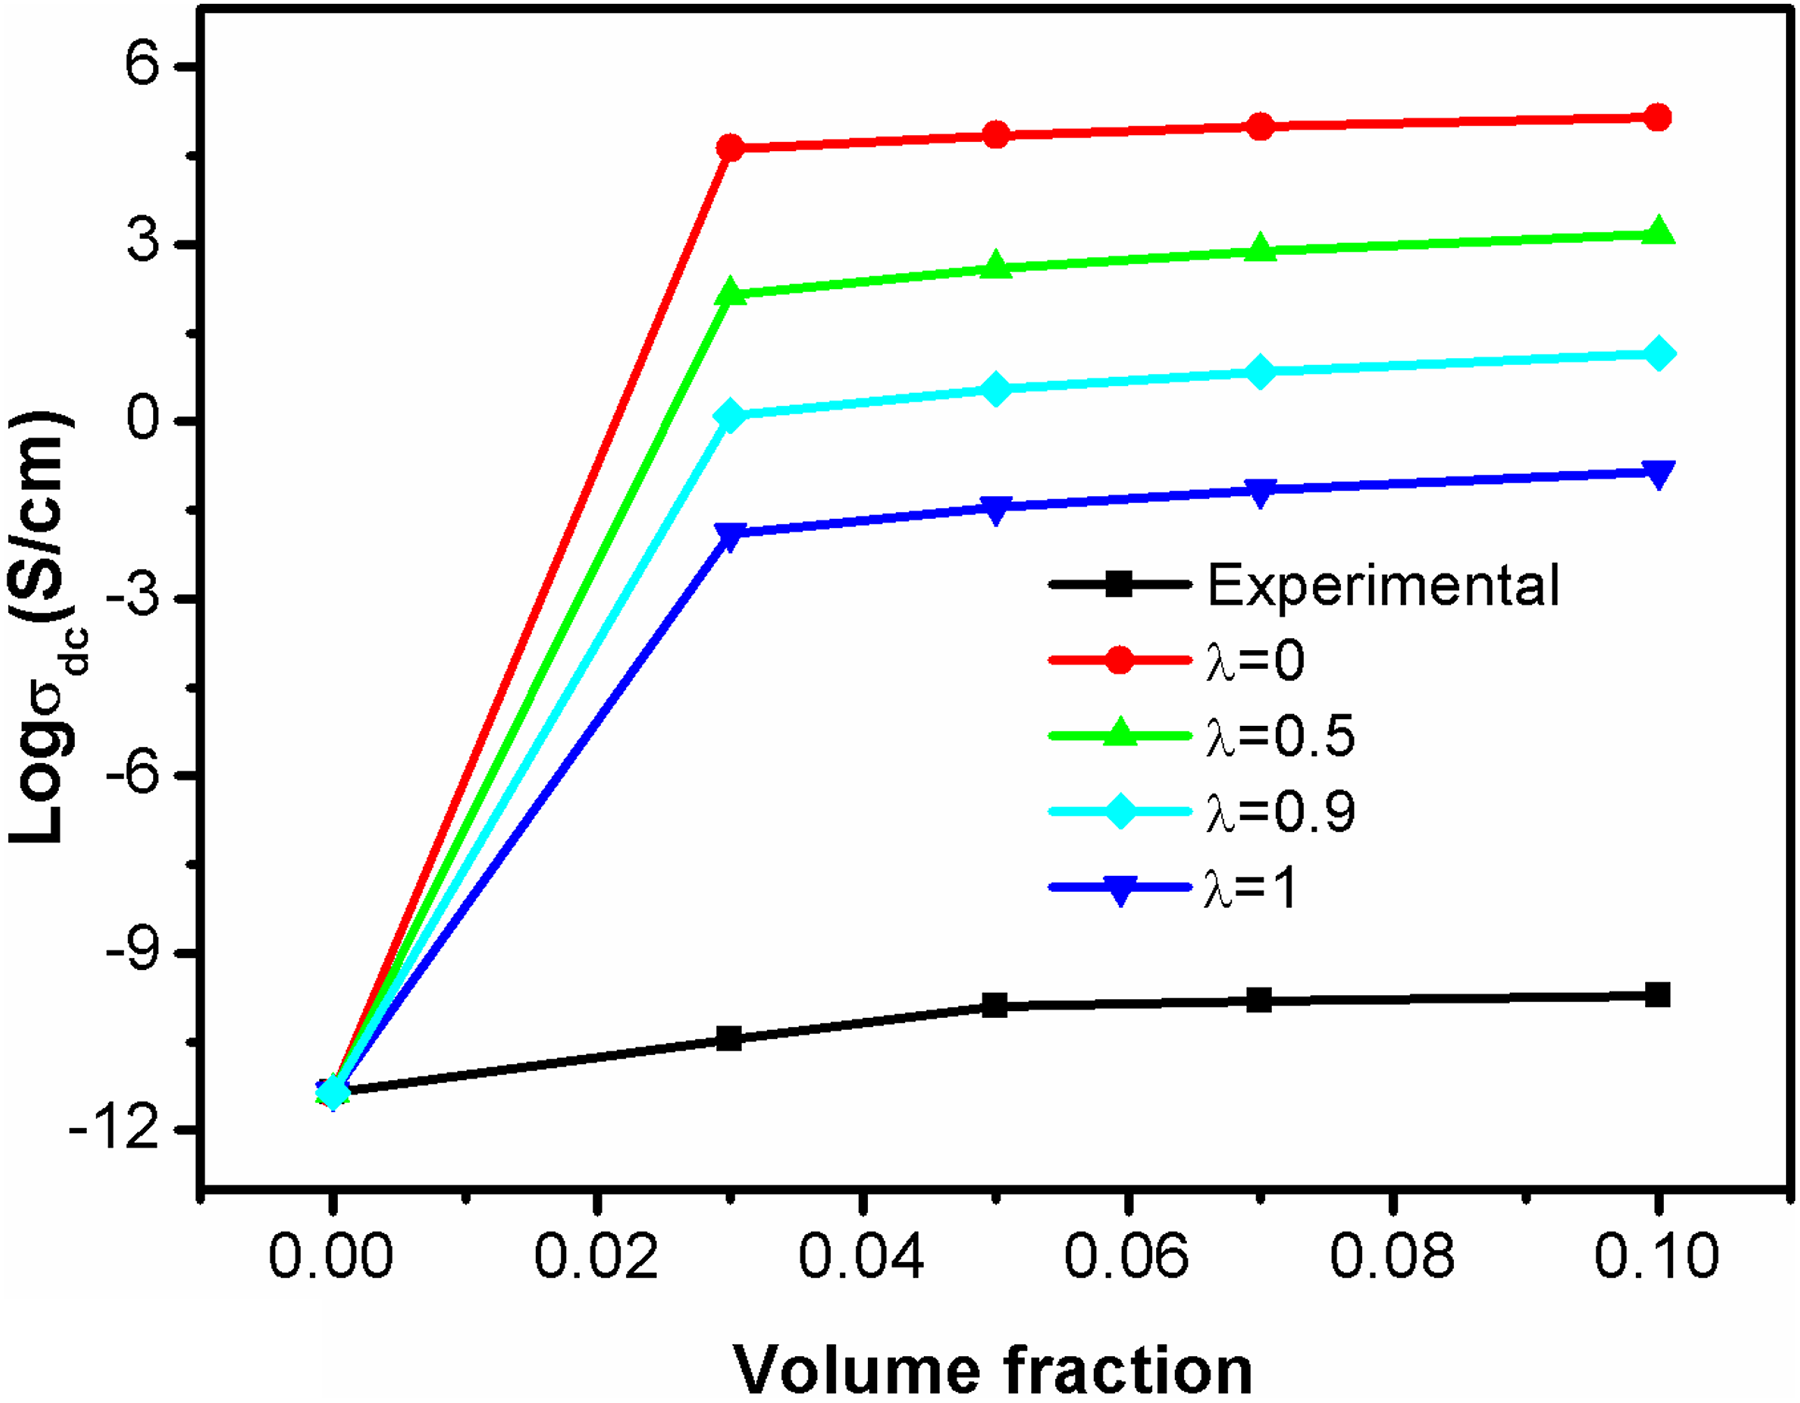
Theoretical and experimental conductivity based on McCullough model.
Bucehe model
Bueche proposed a theoretical equation for the DC electrical conductivity of binary system containing conducting the filler particles dispersed in an insulating polymer matrix. 33 The conductivity of polymer composites is calculated using the following equation:

where σc denotes the conductivity of composite, and σf and vf denote the conductivity and volume fraction of filler, respectively. The experimental conductivity and theoretical conductivity (Bueche model) of PBMA/Nd-TiO2 nanocomposites are presented in Figure 8.
Theoretical and experimental conductivity based on Bueche model.
The theoretical conductivity obtained from Bueche model shows a large deviation from the experimental one. Since the Bueche model is simply additive in which the total conductivity is sum of the conductivity of filler and the polymer matrix. Therefore, Bueche model applied for polymer composites where the individual components in the composites have almost the same electrical conductivity. In the present study, the difference in conductivity is due to the higher conductivity of the metal nanoparticles than the polymer.
Scarisbrick model
Scarisbrick suggested a statistical model for the DC electrical conductivity of binary composites using the following equations. Scarisbrick model suggests that the conducting filler particles are oriented in a regular manner within the insulating polymer, and hence there is an effective particle to particle contact within the polymer matrix. 34 Here, the conductivity mainly depends on the arrangement of filler in the polymer and the concentration of filler particles

where σc and σf are the conductivity of the composite and conducting filler particle, respectively; vf is the filler concentration; and C is the geometrical factor, which depends on the arrangement and interfacial interaction of nanoparticle with the polymer matrix and its value varies from 1 to 3 × 10⁻³

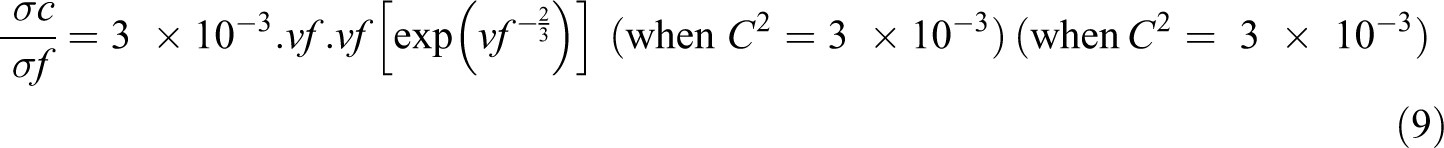
The plots for the conductivity of PBMA/Nd-TiO2 nanocomposites using Scarisbrick model along with experimental conductivity are given in Figure 9. Scarisbrick model shows greater deviation from the experimental conductivity in the entire range of filler concentrations. 25 So this model is not useful for predicting the conductivity of polymer composites like PBMA/Nd-TiO2 nanocomposites.
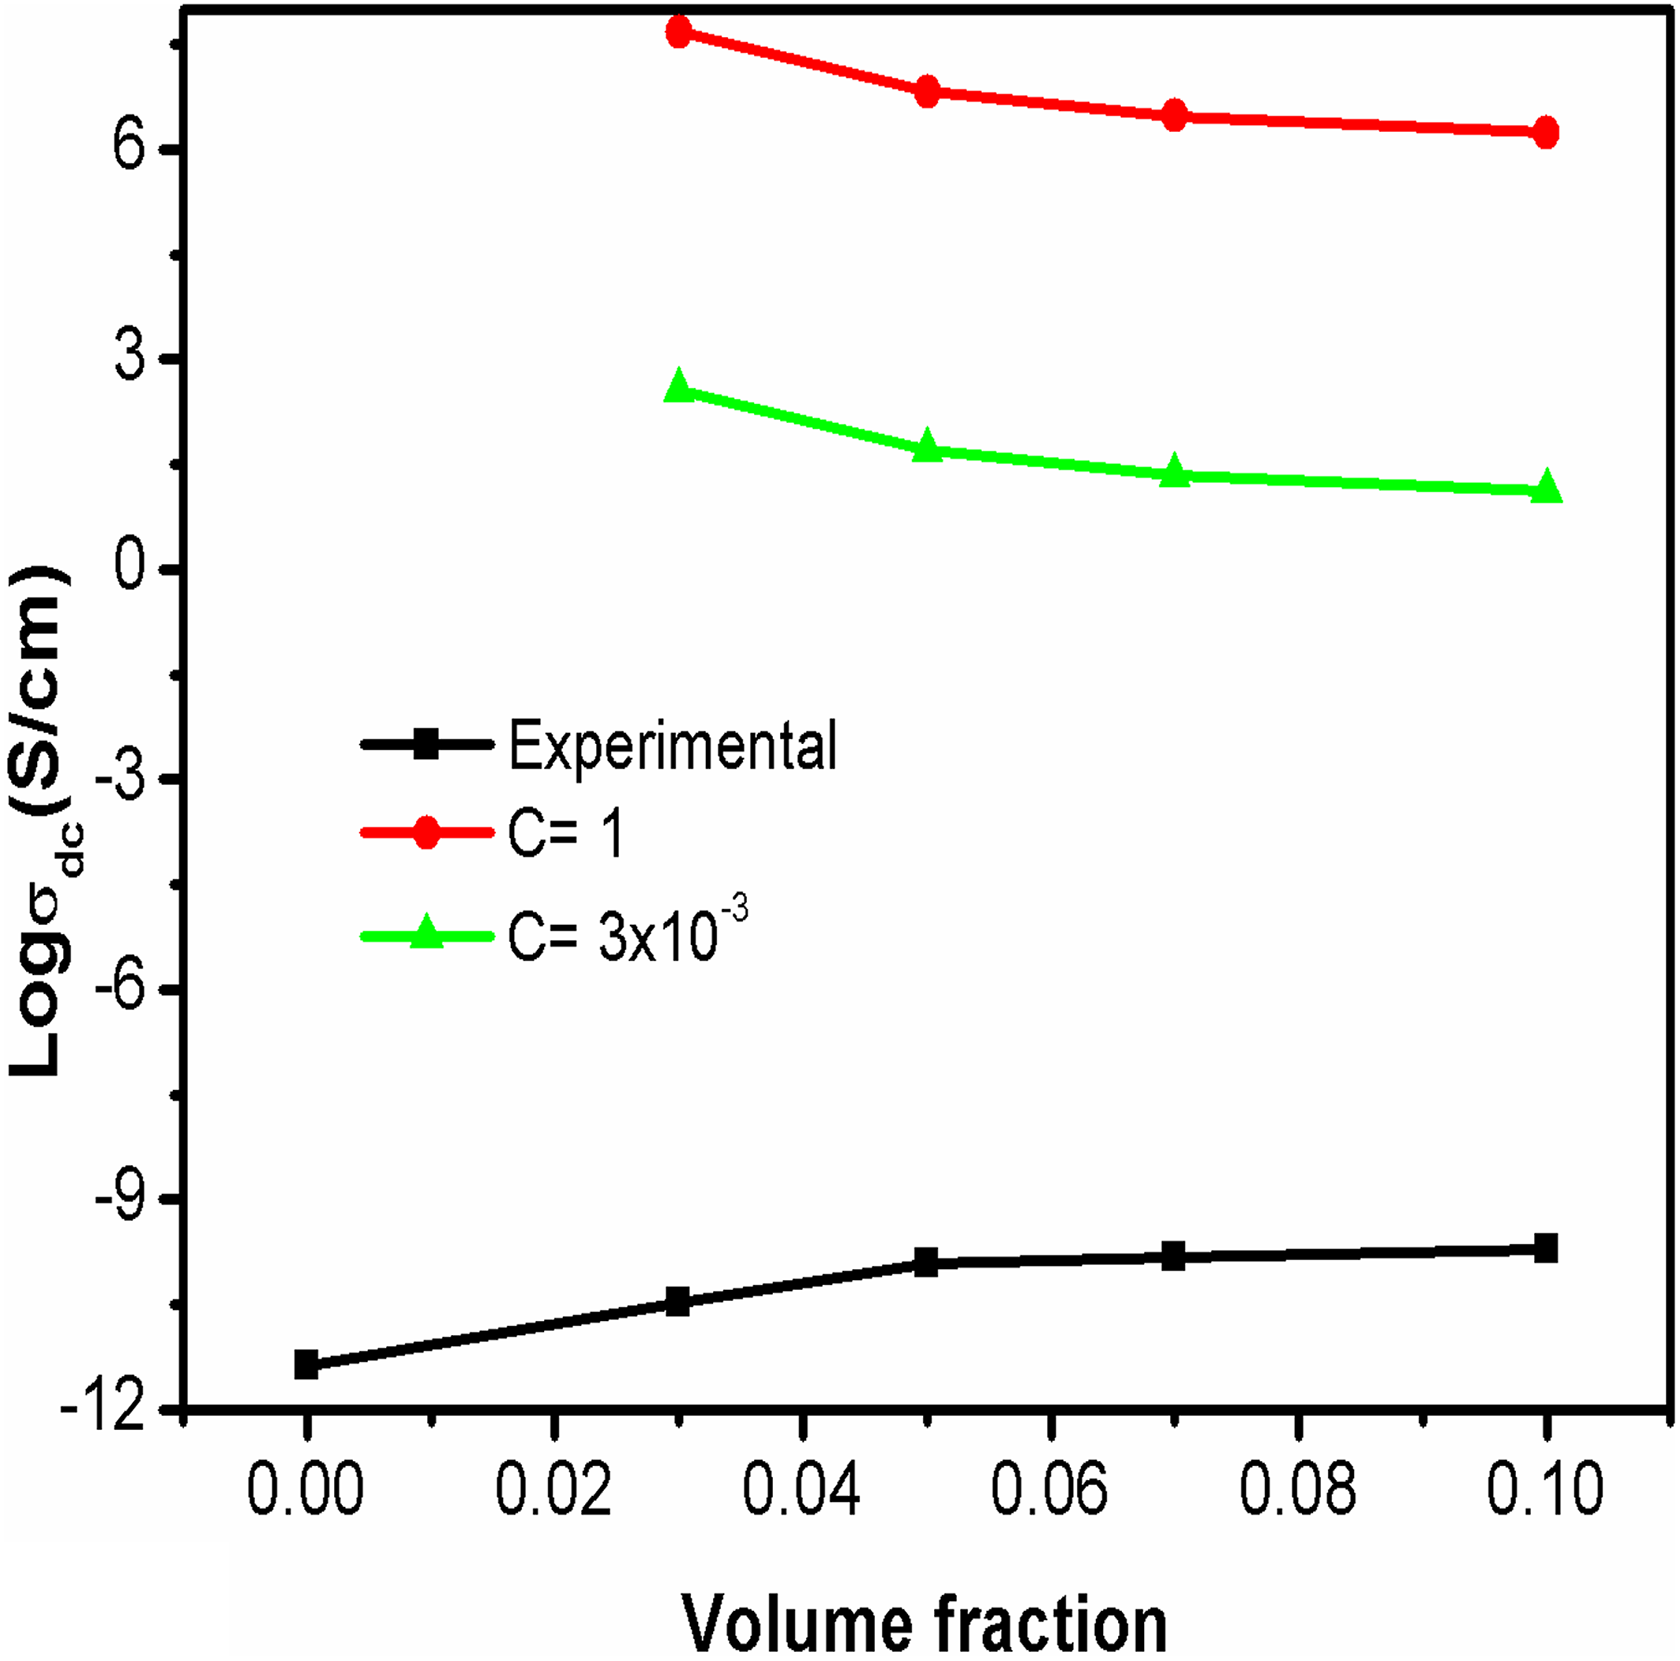
Theoretical and experimental plots of electrical conductivity based on Scarisbrick.
Mamunya model
Mamunya derived a theoretical equation for calculating the electrical conductivity of polymer composites by considering various factors such as volume fraction of filler, aspect ratio, percolation threshold of filler, the surface energy of filler, interfacial interaction as well as the distribution of filler within the polymer matrix, and so on. 35 The percolation threshold depends mainly on the interaction of filler with the matrix as well as the size and amount of filler. 36

where σ is the conductivity of the composite, σc is the conductivity of the composite at percolation threshold, σF is the conductivity at maximum volume fraction of filler F, φ is the volume fraction of filler,


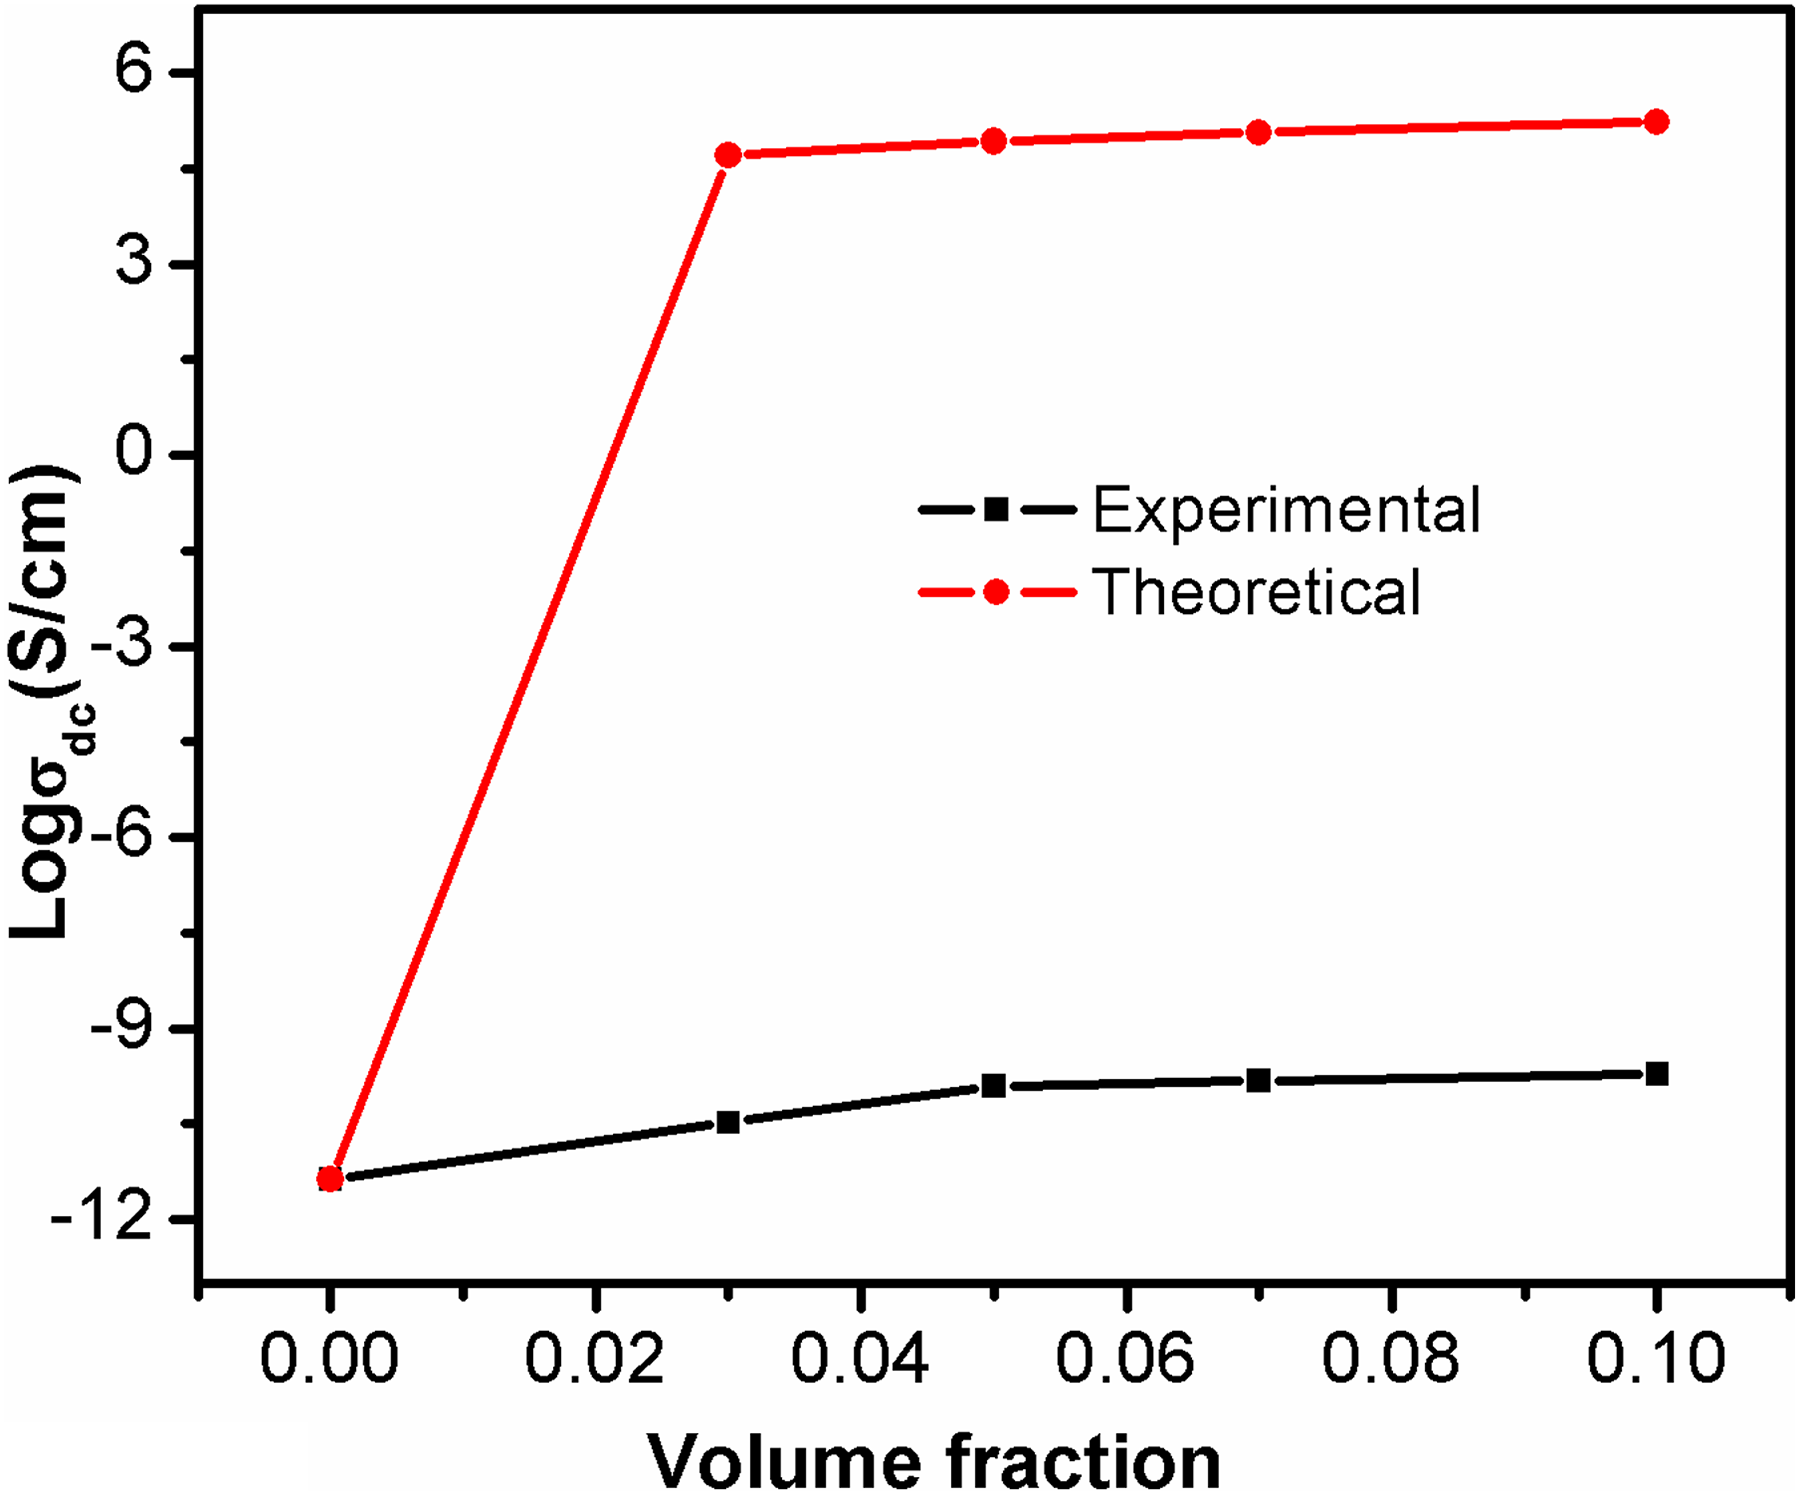
Here, K is a constant whose value depends on the extent of interaction of filler with the polymer matrix, A and B are constants, and γ pf is the surface tension at the interface of polymer matrix and filler. The theoretical and experimental conductivity of PBMA/Nd-TiO2 nanocomposites is presented in Figure 10. Theoretical conductivity shows close relation with experimental conductivity in all concentration of filler loading. So it can be concluded that the conductivity of PBMA/Nd-TiO2 nanocomposites is governed by the conductivity at percolation threshold as well as the degree of interaction of filler with the polymer matrix. Further, the result indicates that the strong interfacial interaction between PBMA matrix and filler was responsible the improved conductivity of PBMA/Nd-TiO2 nanocomposites. The mismatch at low concentration is obviously due to the unavailability of conducting particles to form the continuous conducting path.
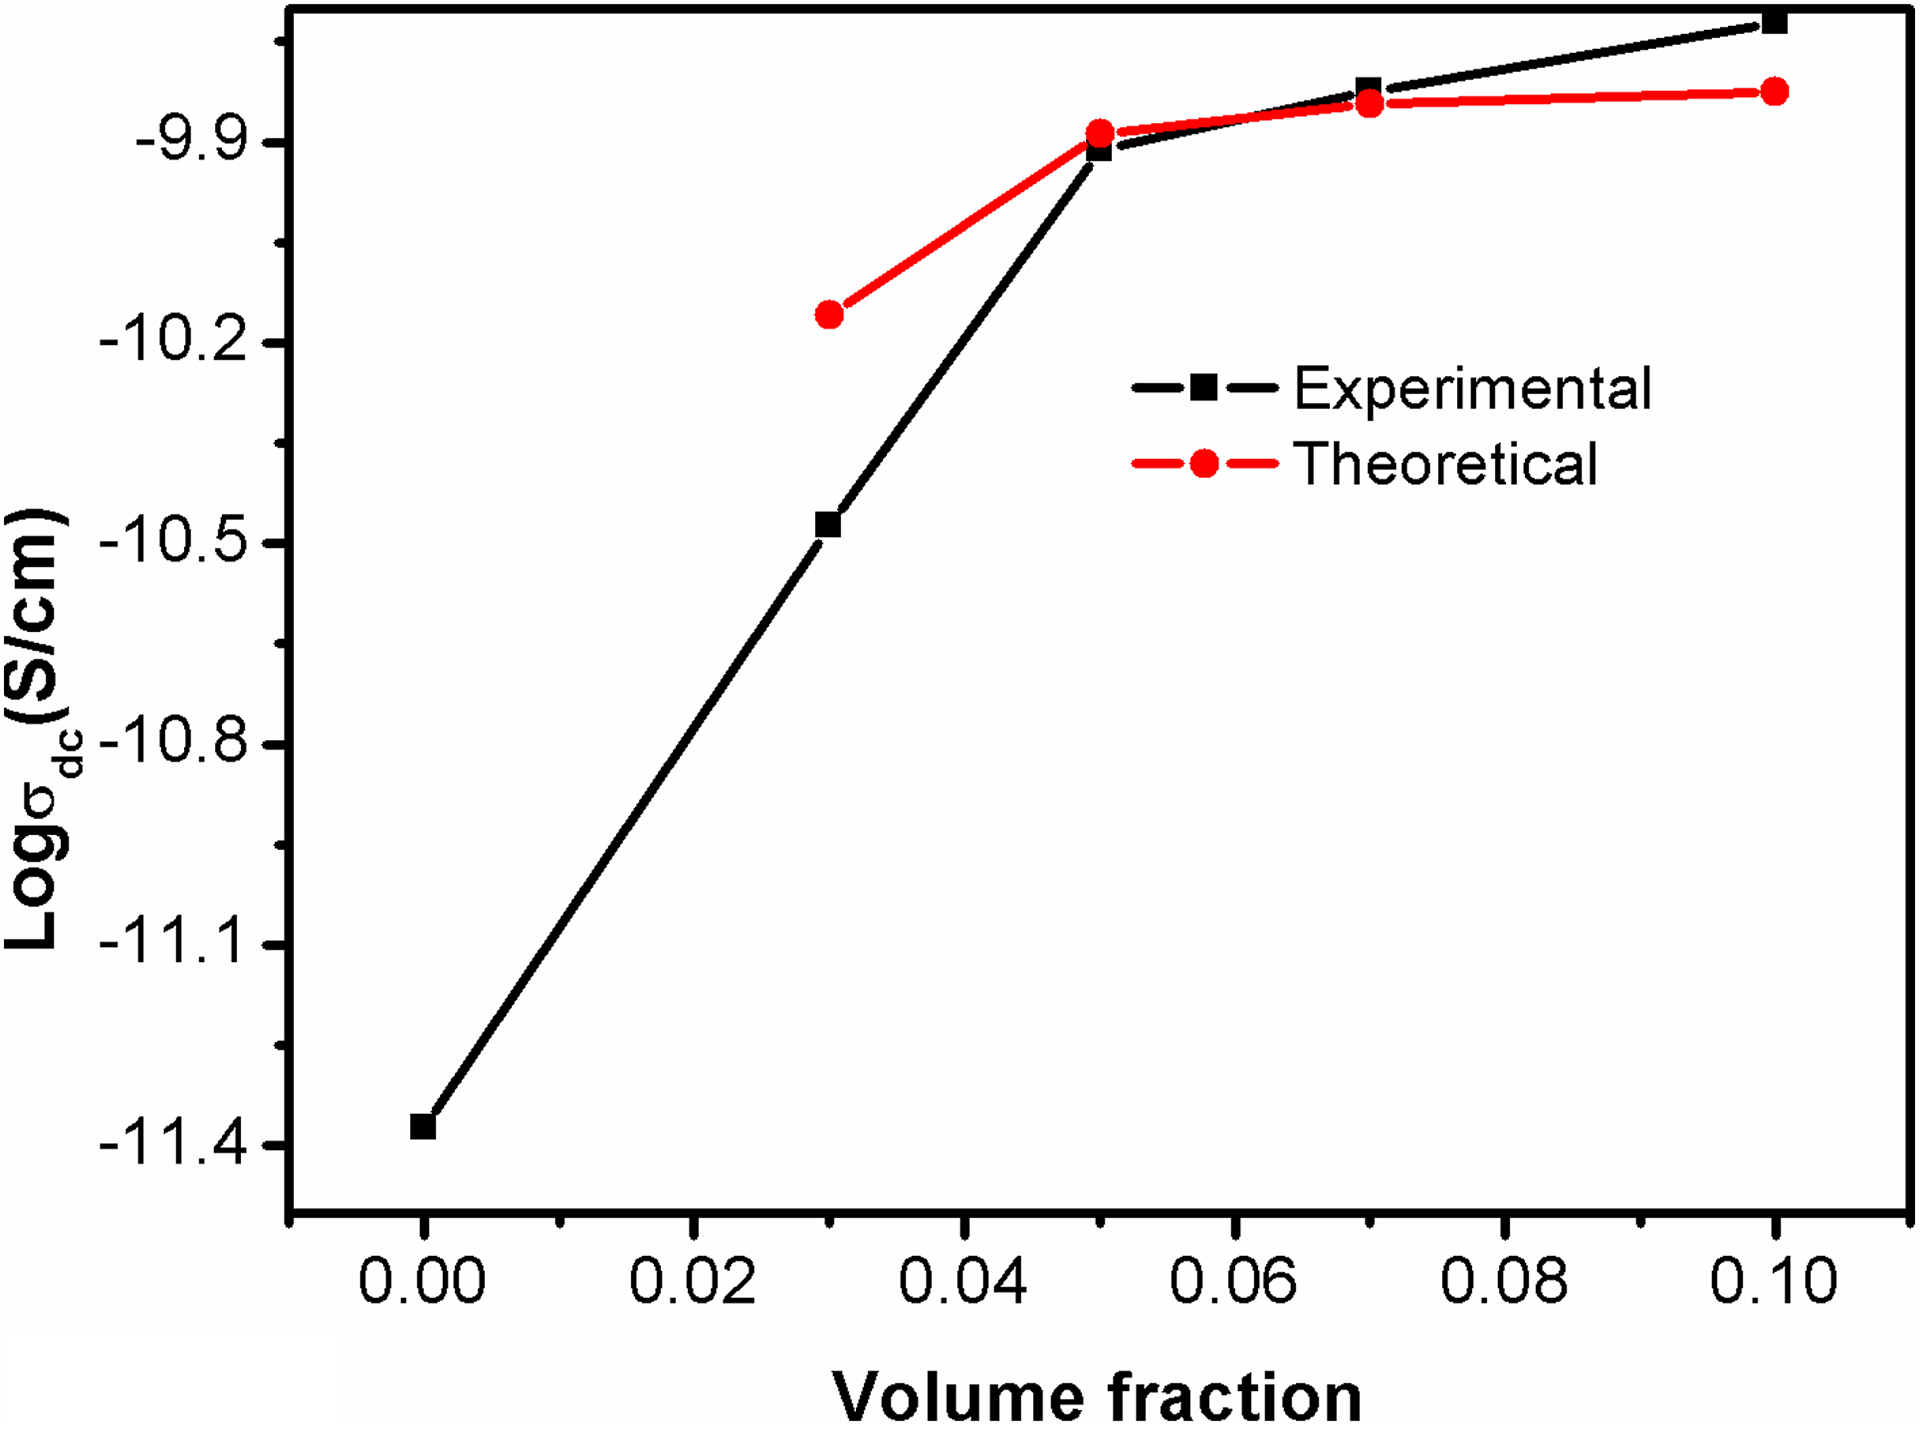
Theoretical and experimental conductivity based on Mamunya model.
Conclusions
The work highlights the structural and electrical transport properties of in situ polymerizedPBMA nanocomposite with different contents of Nd-TiO2 nanoparticles. The dispersion of nanoparticles within the PBMA matrix was evidenced by SEM and XRD measurements. The effect of Nd-TiO2 on AC conductivity and activation energy of PBMA nanocomposites was studied. The AC conductivity of nanocomposites was higher than pure PBMA and the magnitude of conductivity increased with increase in temperature. The higher AC conductivity of nanocomposite at higher temperature was due to the increased segmental movement of composite material. The result from activation energy showed that the incorporation of additive significantly reduces the activation energy of the composite as compared to pure PBMA material. Further, the decrease in activation energy in the AC conductivity was found to be dependent on the concentration of nanoparticles (up to 7 wt%) in the PBMA matrix, which indicates the hopping conduction mechanism operates in the PBMA/Nd-TiO2 nanocomposites. Among the nanocomposites, the 7 wt% sample shows the maximum AC conductivity. The DC conductivity of nanocomposites was higher than the pure PBMA and the conductivity increases with the loading of nanoparticles. The formation of conducting network increases the chance for the hopping that results in an increase in the DC conductivity. The change in DC conductivity with different level of additive was correlated with various theoretical conductivity models such as McCullough, Bueche, Scarisbrick, and Mamunya. The theoretical conductivity obtained from Mamunya model was in good agreement with the experimental conductivity of PBMA/Nd-TiO2 nanocomposites. Conduction process in Mamunya model supports the degree of interaction of filler with the polymer matrix.