
Abstract
The use of polyamide (PA) composites in a variety of thermal conditions can enormously affect their durability that is a very important issue for designers and users. In this study, mechanical and tribological behaviors of PA66 reinforced by various weight fractions of short glass fiber were investigated. All studied materials were subjected to accelerated thermal aging tests. Three-point bending flexural tests were carried out to determine the mechanical behavior. Reciprocating tribotester was employed to determine friction and wear behaviors. Tribological tests were carried out without lubrication and under ambient conditions. Ball on flat contact configuration was adopted for friction tests. Wear tests were carried out against an abrasive counterface. Results showed that flexural strength and elastic modulus increased when increasing glass fiber rate for all tested materials. In the contrary, coefficient of friction and wear resistance decreased. Results showed that the thermal aging increased the flexural features and reduced the coefficient of friction. The effect of thermal aging on the wear resistance depends on the reinforcement rate.
Introduction
Reinforced polyamides (PAs) are widely used in a variety of structures and applications, from automobile industry to biomechanics, such as stressed functional automotive and safety parts. These composites form an important class of tribo-materials. Fibers acting as a hard phase are frequently incorporated into PA matrix to improve their friction and wear performances. A number of researchers investigated the mechanical and tribological behaviors of divers PAs matrix as PA66, 1 –11 PA6, 12 –14 and PA12 15 reinforced with divers kinds of fibers under dry or humid conditions. Prediction of the durability of such composites is a very important issue for designers and users. Indeed, their use in a variety of conditions such as weather exposure and aggressive elements (sunlight, ultraviolet (UV) exposure, water, etc.) can enormously affect their durability. According to the severity of these conditions (high and/or low temperatures, water attack, UV exposure, and saline atmosphere), different mechanisms may occur separately or simultaneously and decrease the performance of composite materials. Several researches investigated the effect of hygrothermal aging on the mechanical performance of glass fiber–reinforced PA6 16 –22 and PA66. 23,24 The effect of thermal aging on the mechanical and tribological behavior of PA66 reinforced with glass fibers was not sufficiently studied in the literature, so this work is a contribution to the best understanding of the effect of this type of aging on the flexural, friction, and wear behaviors of this composite material. This article investigates the effect of thermal aging on the flexural, friction, and wear behaviors of unreinforced and short glass fiber–reinforced PA66. The tribological properties of these materials are evaluated under dry reciprocating sliding conditions against a hard material as 100Cr6 for friction test and a SiC abrasive counterface for wear test.
Material and methods
Materials
The material investigated in this study is a short glass fiber–reinforced PA66 with different weight fractions. To produce composites with 10 and 20 wt% glass fiber content, a combination of two commercial products was performed: PA66 (HERAMID A NAT) and PA66 containing 30 wt% glass fibers (HERAMID A NAT FV030) provided by Radici Group. These new reinforced materials are respectively designated PA66GF10 and PA66GF20. The commercial reinforced PA is designated PA66GF30. The unreinforced material is designated PA66GF00. A glass type E with small diameter was employed to reduce microcracks and to have a very good mechanical performance. Samples for flexural and tribological tests were obtained by molding injection at 50% relative humidity. Plates have dimensions of 125 × 105 × 4 mm3. Detailed description of this composite was given in previous works. 1 All specimens were dried in an oven at 70°C during 24 h. Then cooled at room temperature in a desiccator before testing them.
Aging test
Since natural aging tests are time consuming, accelerated aging tests were generally used in order to reproduce the service conditions of the tested materials and to evaluate the durability of the used materials. The accelerated thermal aging was conducted at 140°C for 120 h. After heating and at the given aged time, samples were removed and cooled in a desiccator to avoid the humidity absorption, and immediately experiments were carried out.
Mechanical tests
To evaluate mechanical properties, flexural tests were carried out using a three-point bending test according to ASTM D-790. 25 Support span was 70 mm (Figure 1).
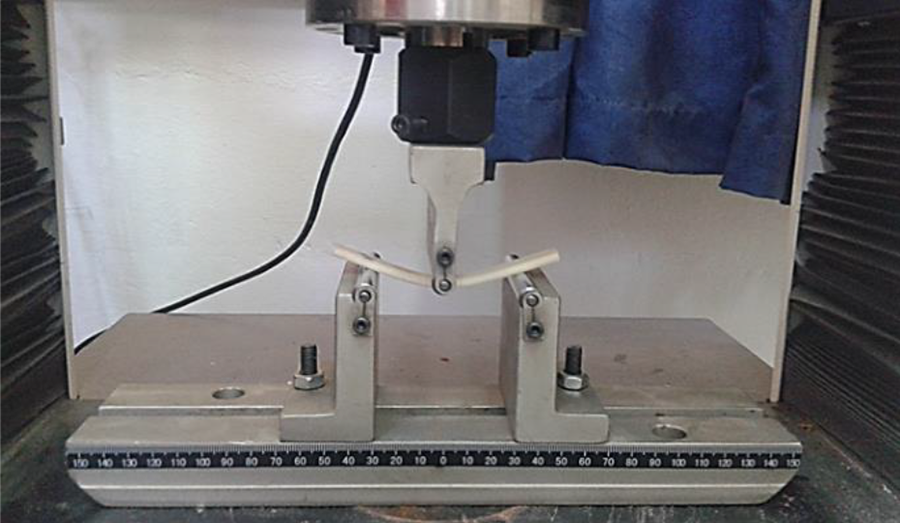
Set-up of flexural test.
The applied crosshead speed was 5 mm per min. The load was placed midway between the supports. Each sample was loaded until the core broke and their average is reported. For each material, three samples were tested. The samples were machined to a size of 105 × 10 × 4 mm3 from the rectangular plate. The flexural strength (σ F), modulus (E F), and strain to failure (ε F) are given as follows
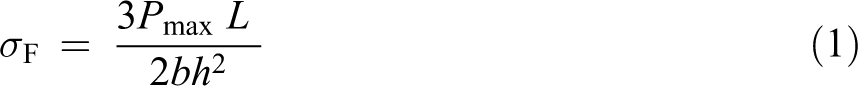
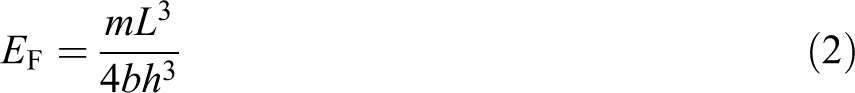
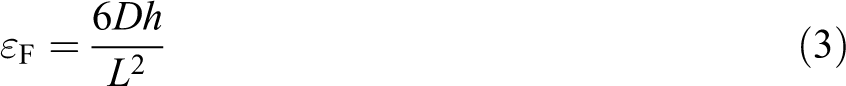
where L, b, and h are the span (length), width, and depth (or thickness) of the sample, m is the slope of the tangent to the initial straight-line portion of the load–deflection curve, D is the maximum deflection before failure, and P max is the maximum load encountered before failure.
Tribological tests
Friction and wear tests were performed on a reciprocating tribometer (Figure 2). The test method and the apparatus architecture are described amply in previous works. 26,27 Friction tests were carried out using prismatic samples (15 × 15 × 4 mm3) sliding against a ball bearing steel 100Cr6 (ϕ 20 mm) illustrating a ball on flat contact configuration.
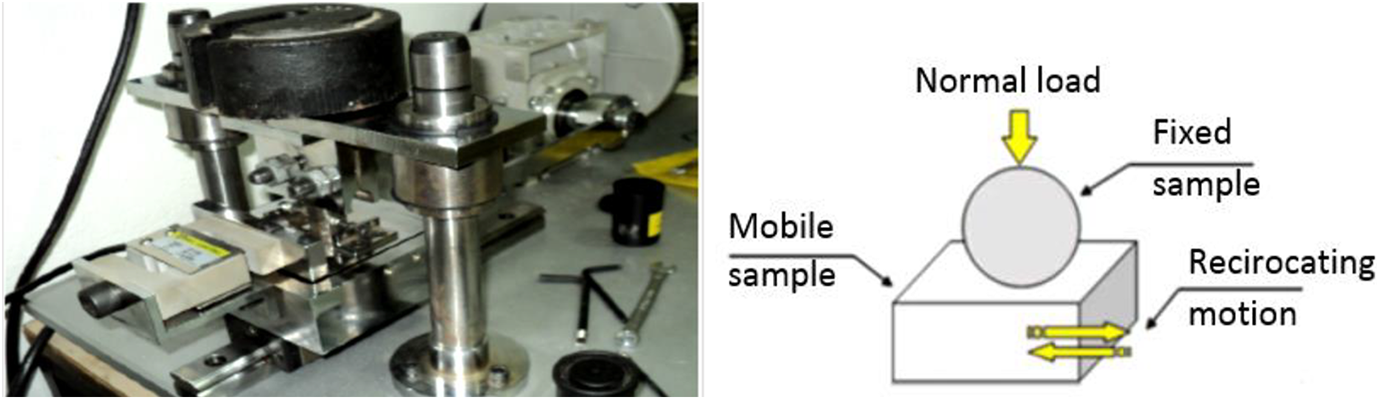
Reciprocating tribometer and illustration of the contact configuration.
Wear tests were carried out using prismatic samples similar to which used for friction tests but sliding against an abrasive paper. Samples for friction and wear tests were cut from the rectangular plate. The conditions of both friction and wear tests are summarized in Table 1.
Conditions of the friction and wear tests.
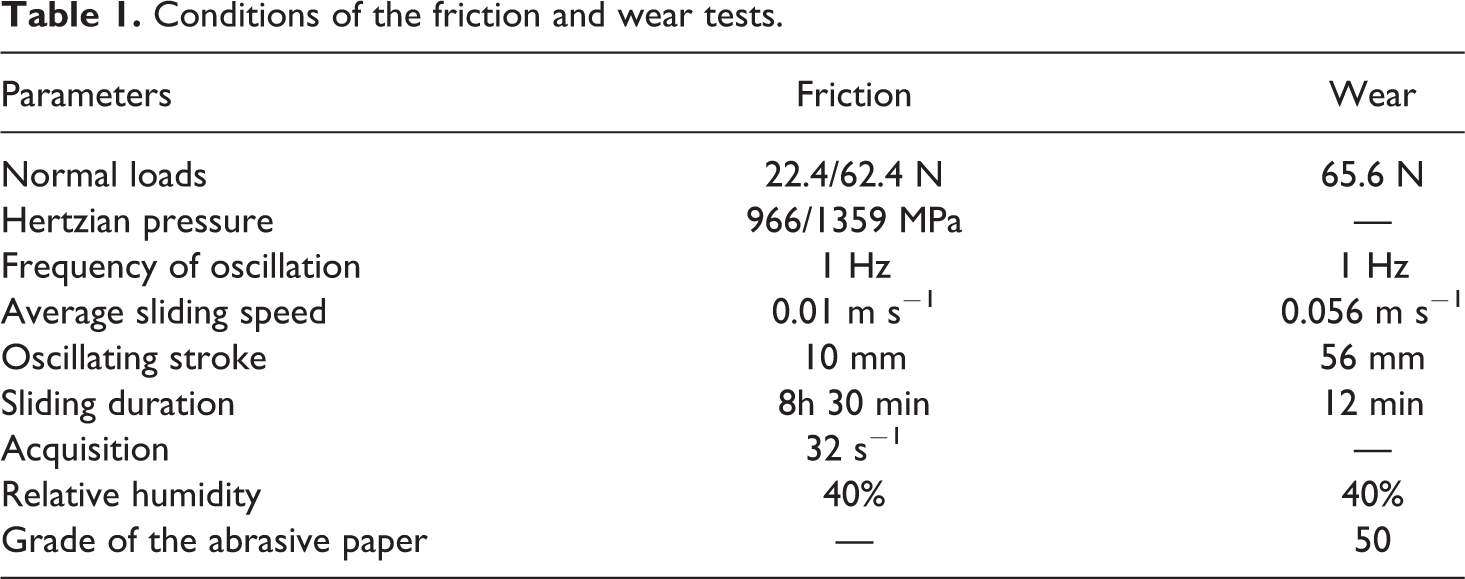
The coefficient of friction µ was calculated as the ratio of the friction force and the normal force. The wear rate was calculated as the difference of weight of the sample before and after the wear test divided by the initial weight (in percent).
Results and discussion
Effect of aging on the flexural behavior
Figure 3 shows flexural stress–strain curves of unreinforced and short glass fiber–reinforced PA66 samples (10%, 20%, and 30% by weight). For each category, untreated, dried, and thermal aged specimens were compared. Results showed that decreasing moisture rate into composite increased flexural modulus and flexural strength for unreinforced and reinforced samples. Indeed, the lowest mechanical properties are obtained with untreated sample (because of water uptake) whereas the highest ones are obtained with thermal aging (the most dried).
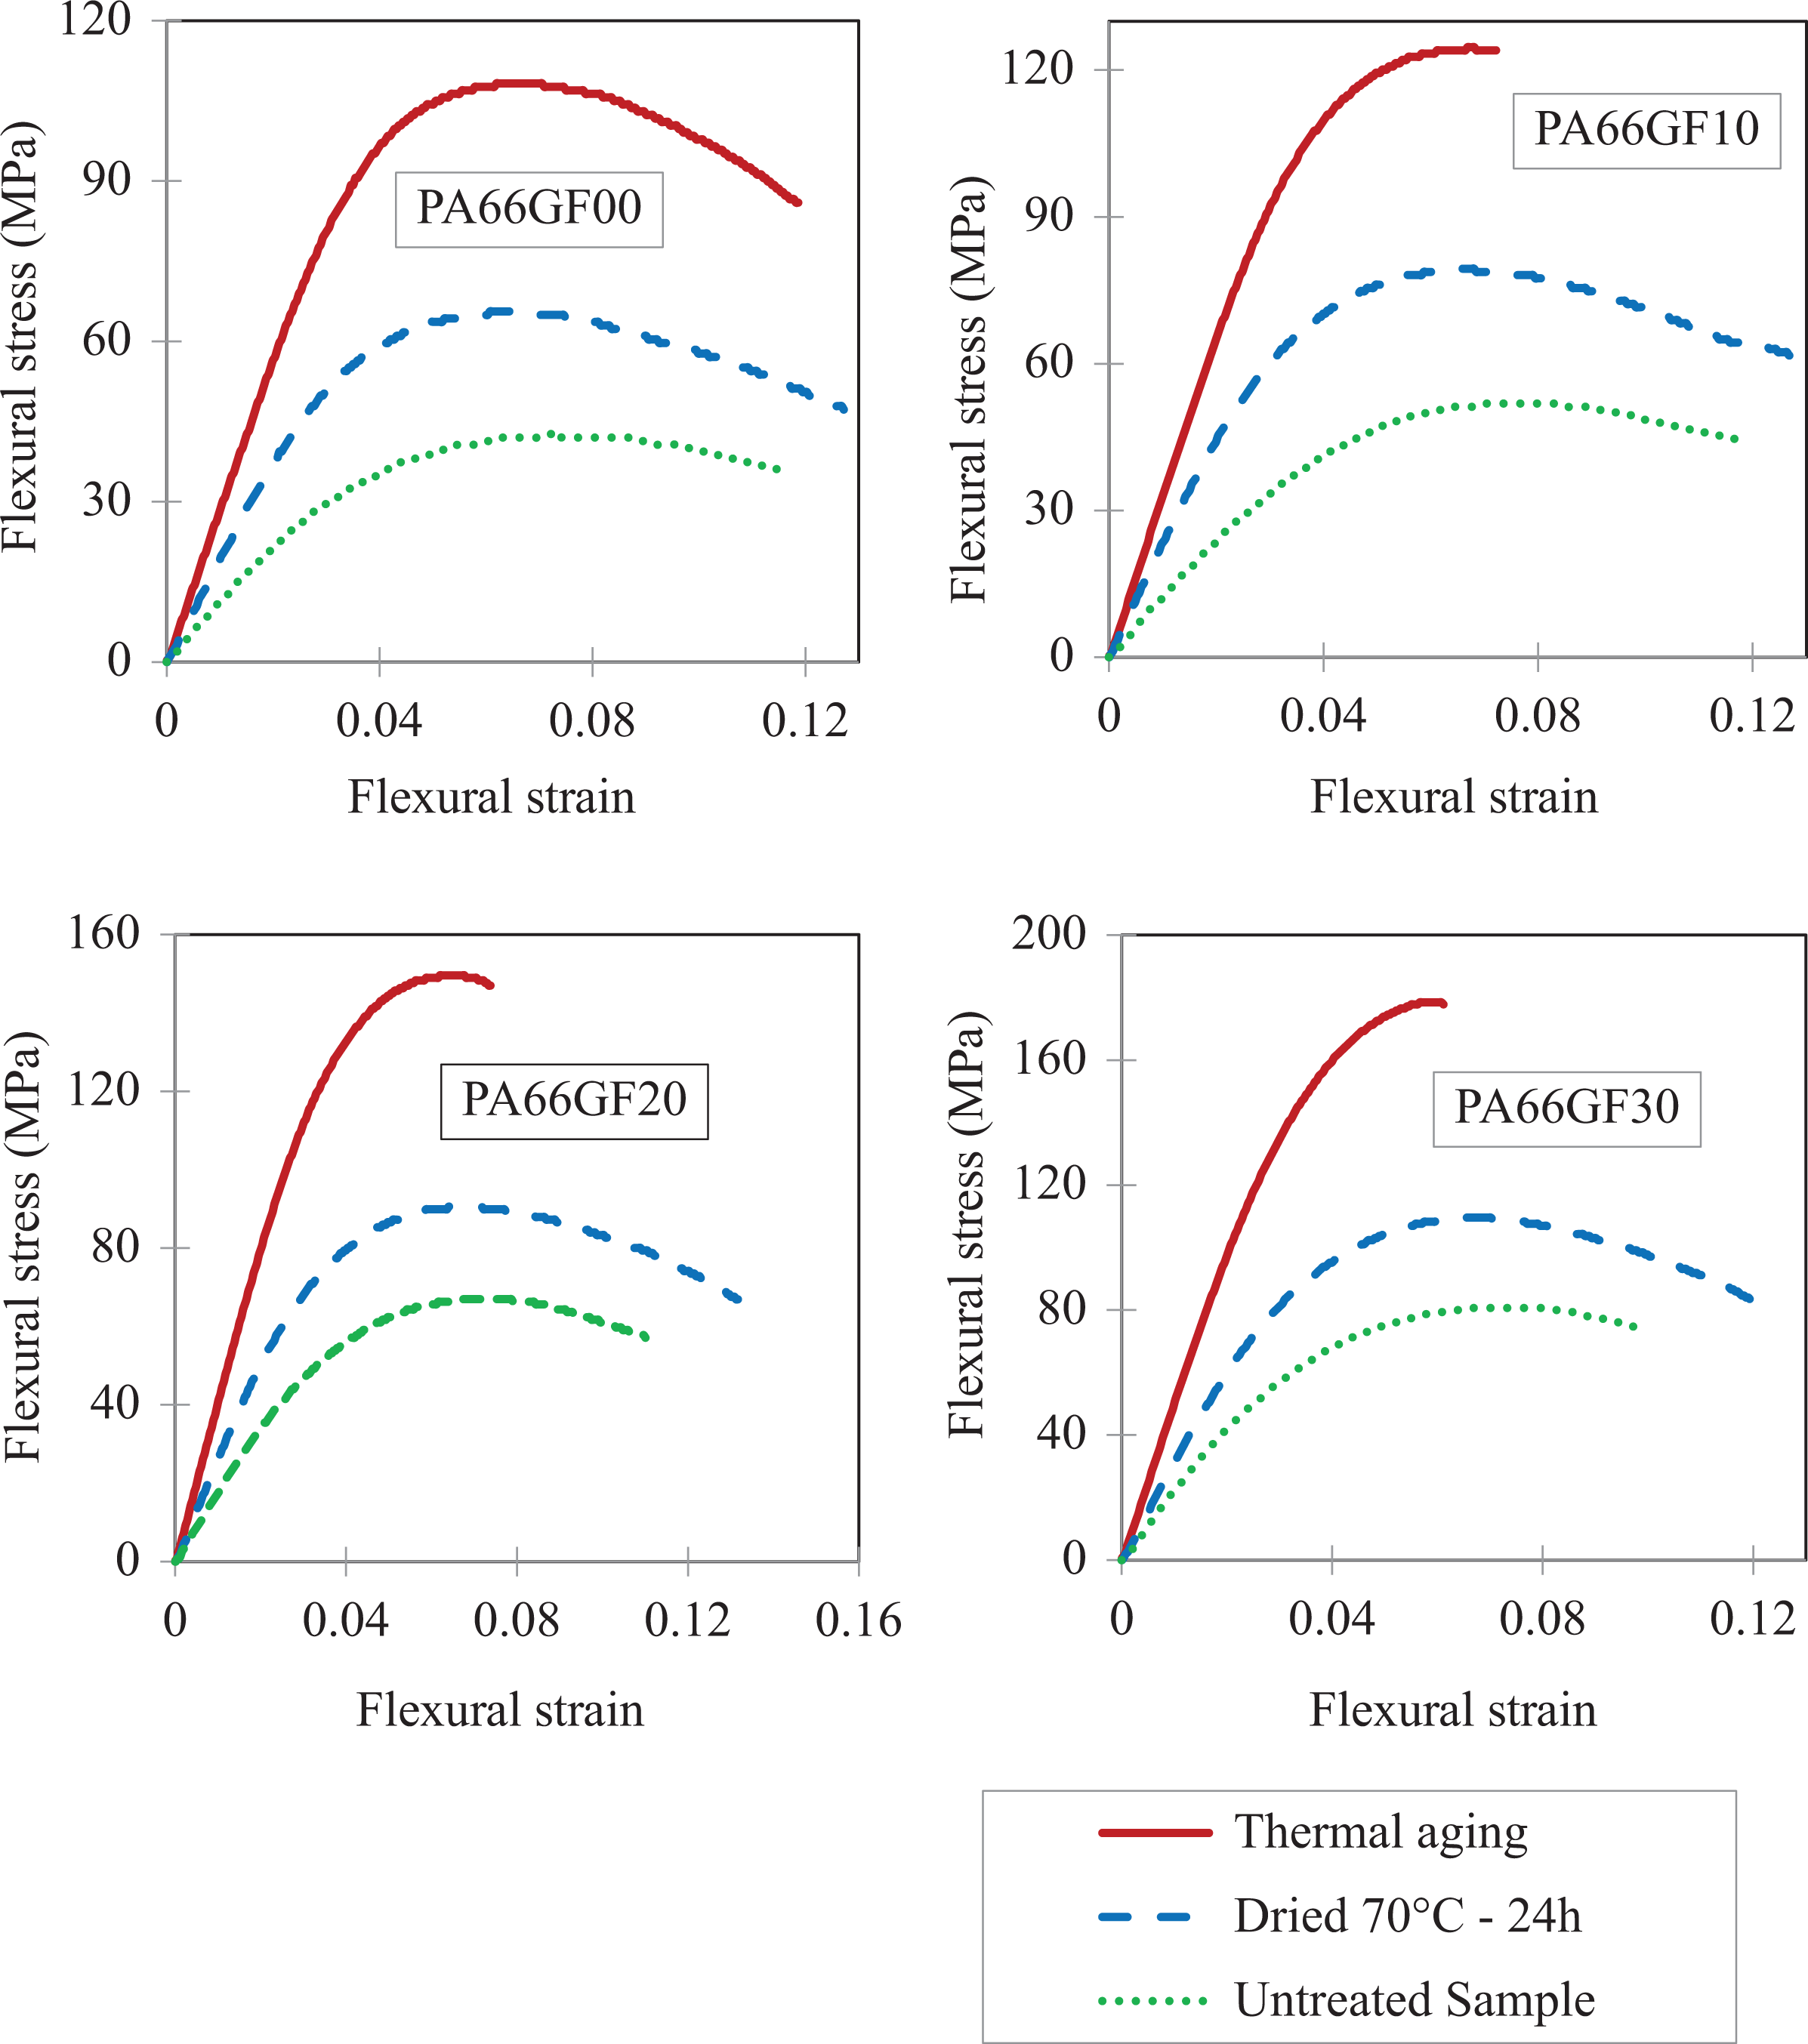
Flexural stress–strain curves versus aging conditions.
In PA thermoplastics, the polar amide groups generate strong interactions in the crystalline and amorphous phases, with hydrogen bonds being established between neighboring molecules. Despite their strong interactions, these hydrogen bonds exhibit a disadvantage as they can lead to water absorption. The water molecules in the amorphous phase can interact with the amide groups, which consequently weaken the preexisting interchain hydrogen bonds. Eventually, this can increase the chains mobility of the PA (plasticization effect). Meanwhile, swelling effect can also occur since a certain amount of water is absorbed by the PA. 28,29 The plasticization highly impacts the PA properties as it reduces its glass transition temperature. 30 It also influences the mechanical properties of the PA matrix such as a reduction of the strength and modulus. 31 The swelling effect of PA matrix can induce a mismatched fiber–matrix volume expansion and thus creating a residual stress which in turn can reduce the fiber–matrix interfacial properties. 32,33 Table 2 recaps quantitatively the effect of aging on the maximum obtained flexural stress. The standard deviations are indicated between two brackets and they are calculated for three replicates.
Effect of aging on the maximum obtained flexural stress (MPa).
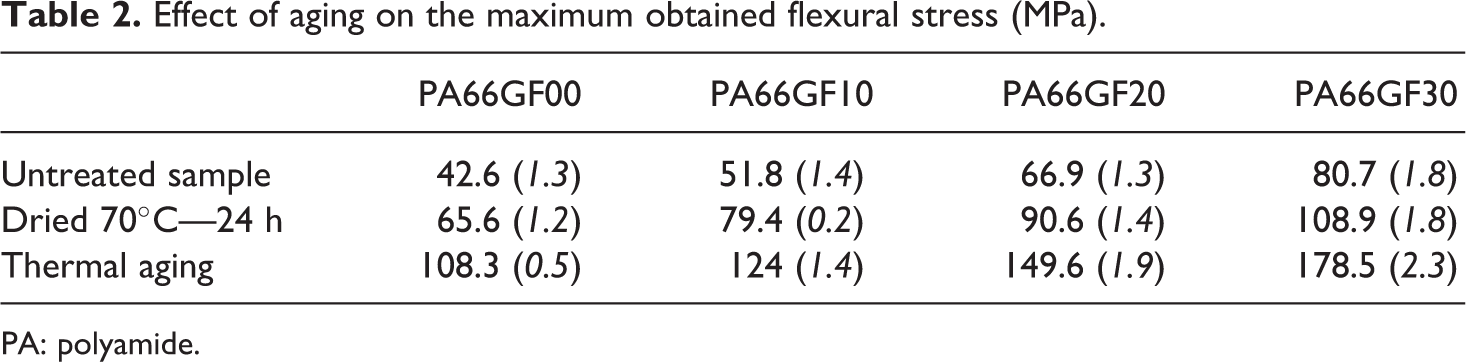
PA: polyamide.
Figure 4 illustrates three samples of short glass fiber 30% by weight-reinforced PA66 (PA66GF30) after flexural test. As shown in the figure, the thermal aged sample and the dried sample were broken (brittle fracture) during test whereas the untreated sample was deformed without fracture.
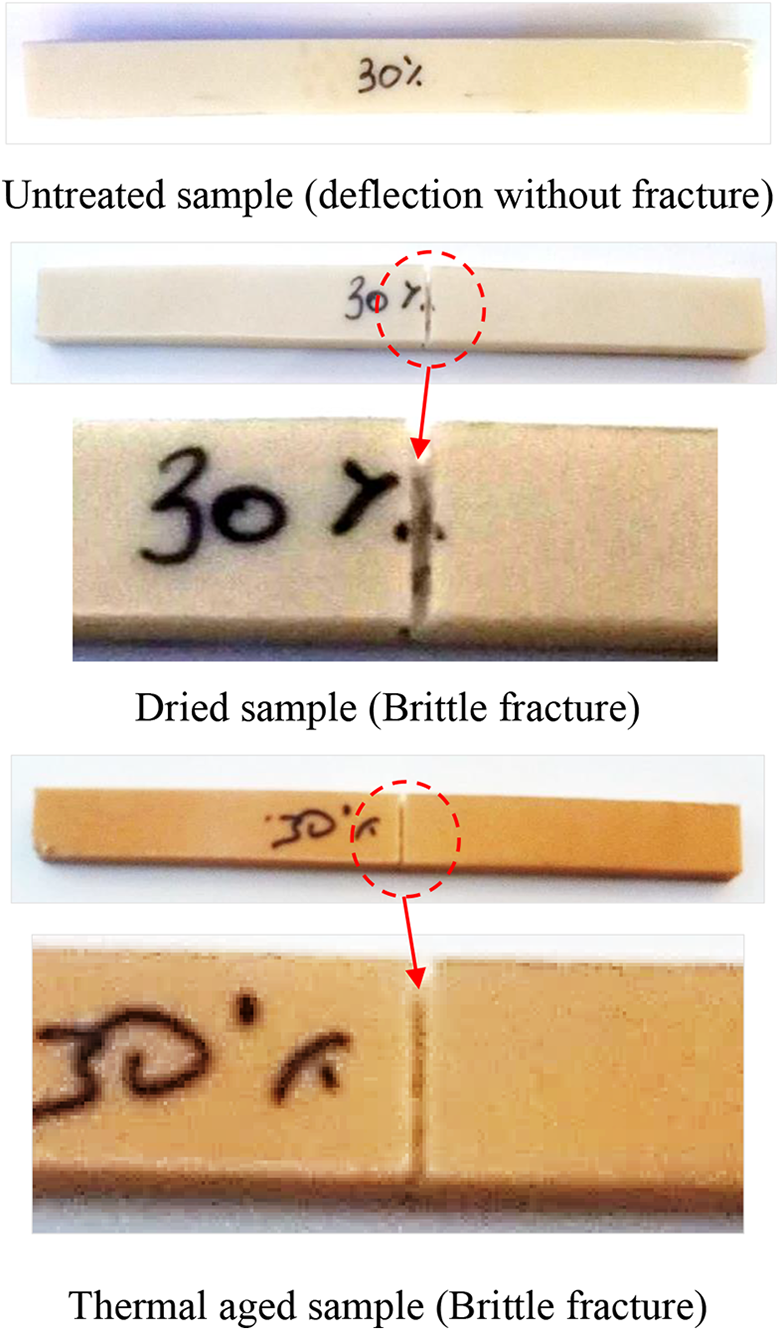
Aspects and modes of failure after flexural tests for PA66GF30 samples.
The breaking of samples was encountered also with the other fractions of reinforcement for dried and thermal aged samples. For the untreated and all unreinforced samples (with all aging conditions), no rupture was observed in the end of the flexural test. As seen in the photos, there is a change mainly in the color of thermal aged sample.
Effect of reinforcement on the flexural behavior
Figure 5 shows flexural stress–strain curves of untreated, dried, and thermal aged specimens. For each category, unreinforced and short glass fiber–reinforced PA66 samples (10%, 20%, and 30% by weight) were compared. Results showed that increasing glass fiber weight fraction improved flexural modulus and flexural strength for aged and unaged samples. This improvement in the strength properties is in good agreement with literature data 4,34 and can be explained by the contribution of the glass fiber as a brittle and tough material.
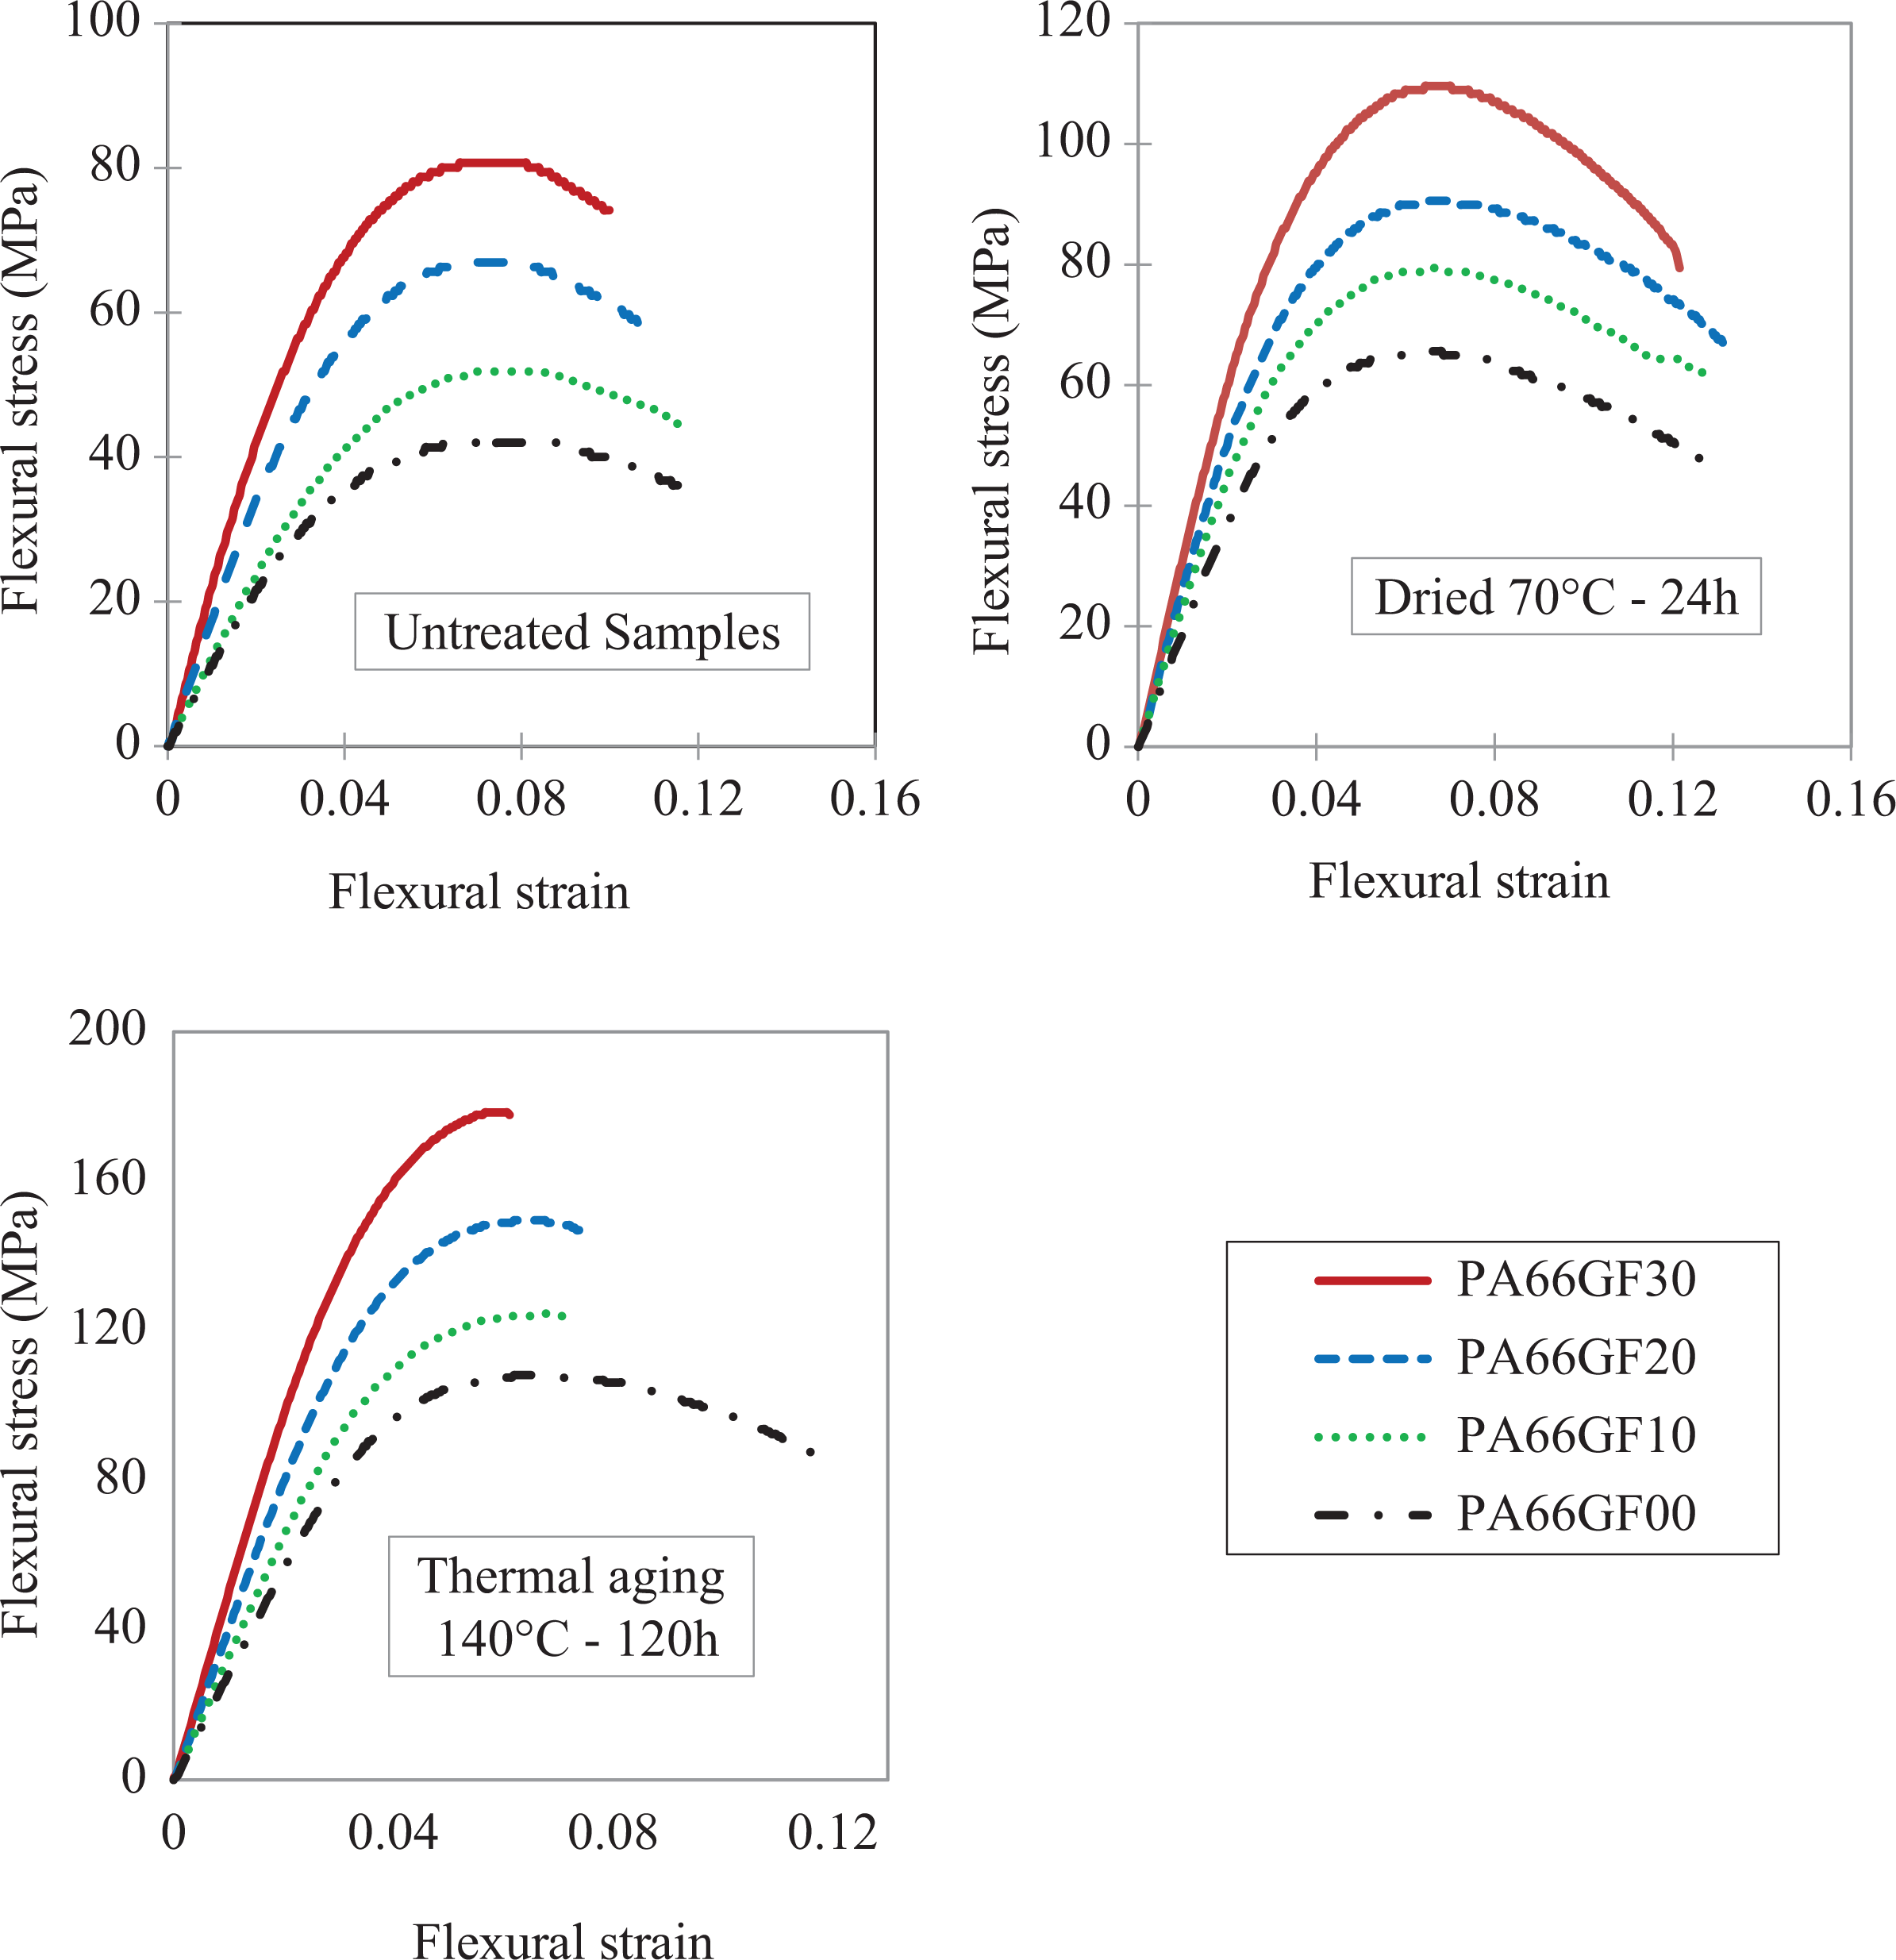
Flexural stress–strain curves versus glass fibers weight fractions.
Effect of aging on the friction behavior
Figures 6 to 8 show the variation of the coefficient of friction as function of sliding time for unreinforced and short glass fiber–reinforced PA66 samples (30% by weight). For each category, dried and thermal aged specimens were compared. Results showed that decreasing moisture rate into composite decreases the stationary coefficient of friction for unreinforced and reinforced samples. Indeed, the lowest coefficient of friction is obtained with thermal aging (the most dried). Results obtained in Figure 7 confirm the obtained results. Indeed, the some order of the coefficient of friction curves was found when normal load is augmented to 62.4 N.
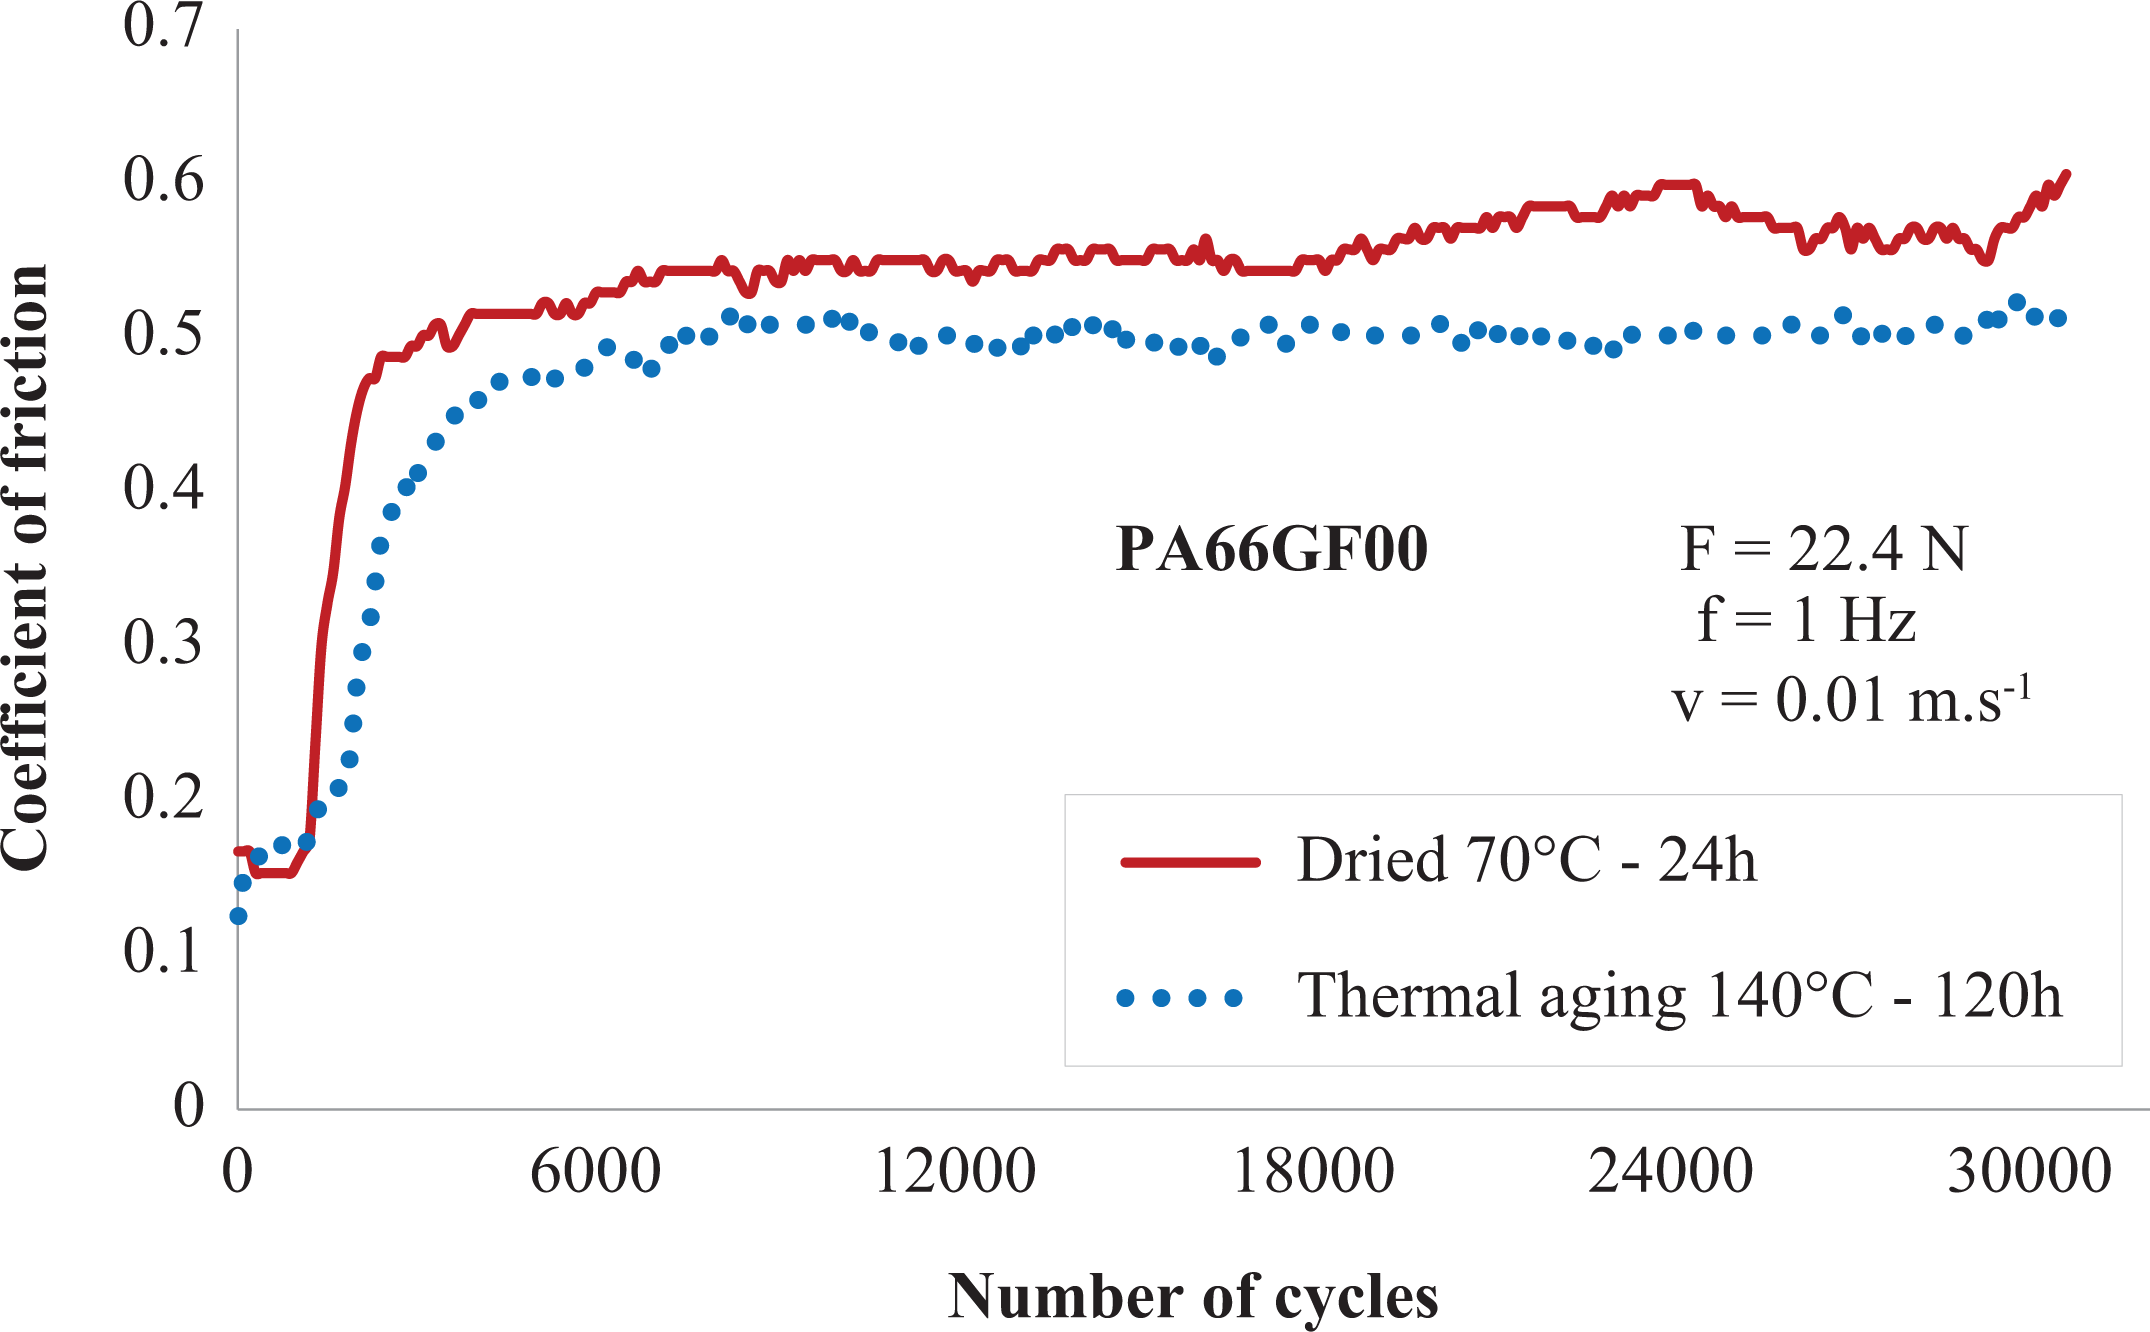
Coefficient of friction versus aging conditions for unreinforced samples (F = 22.4 N).
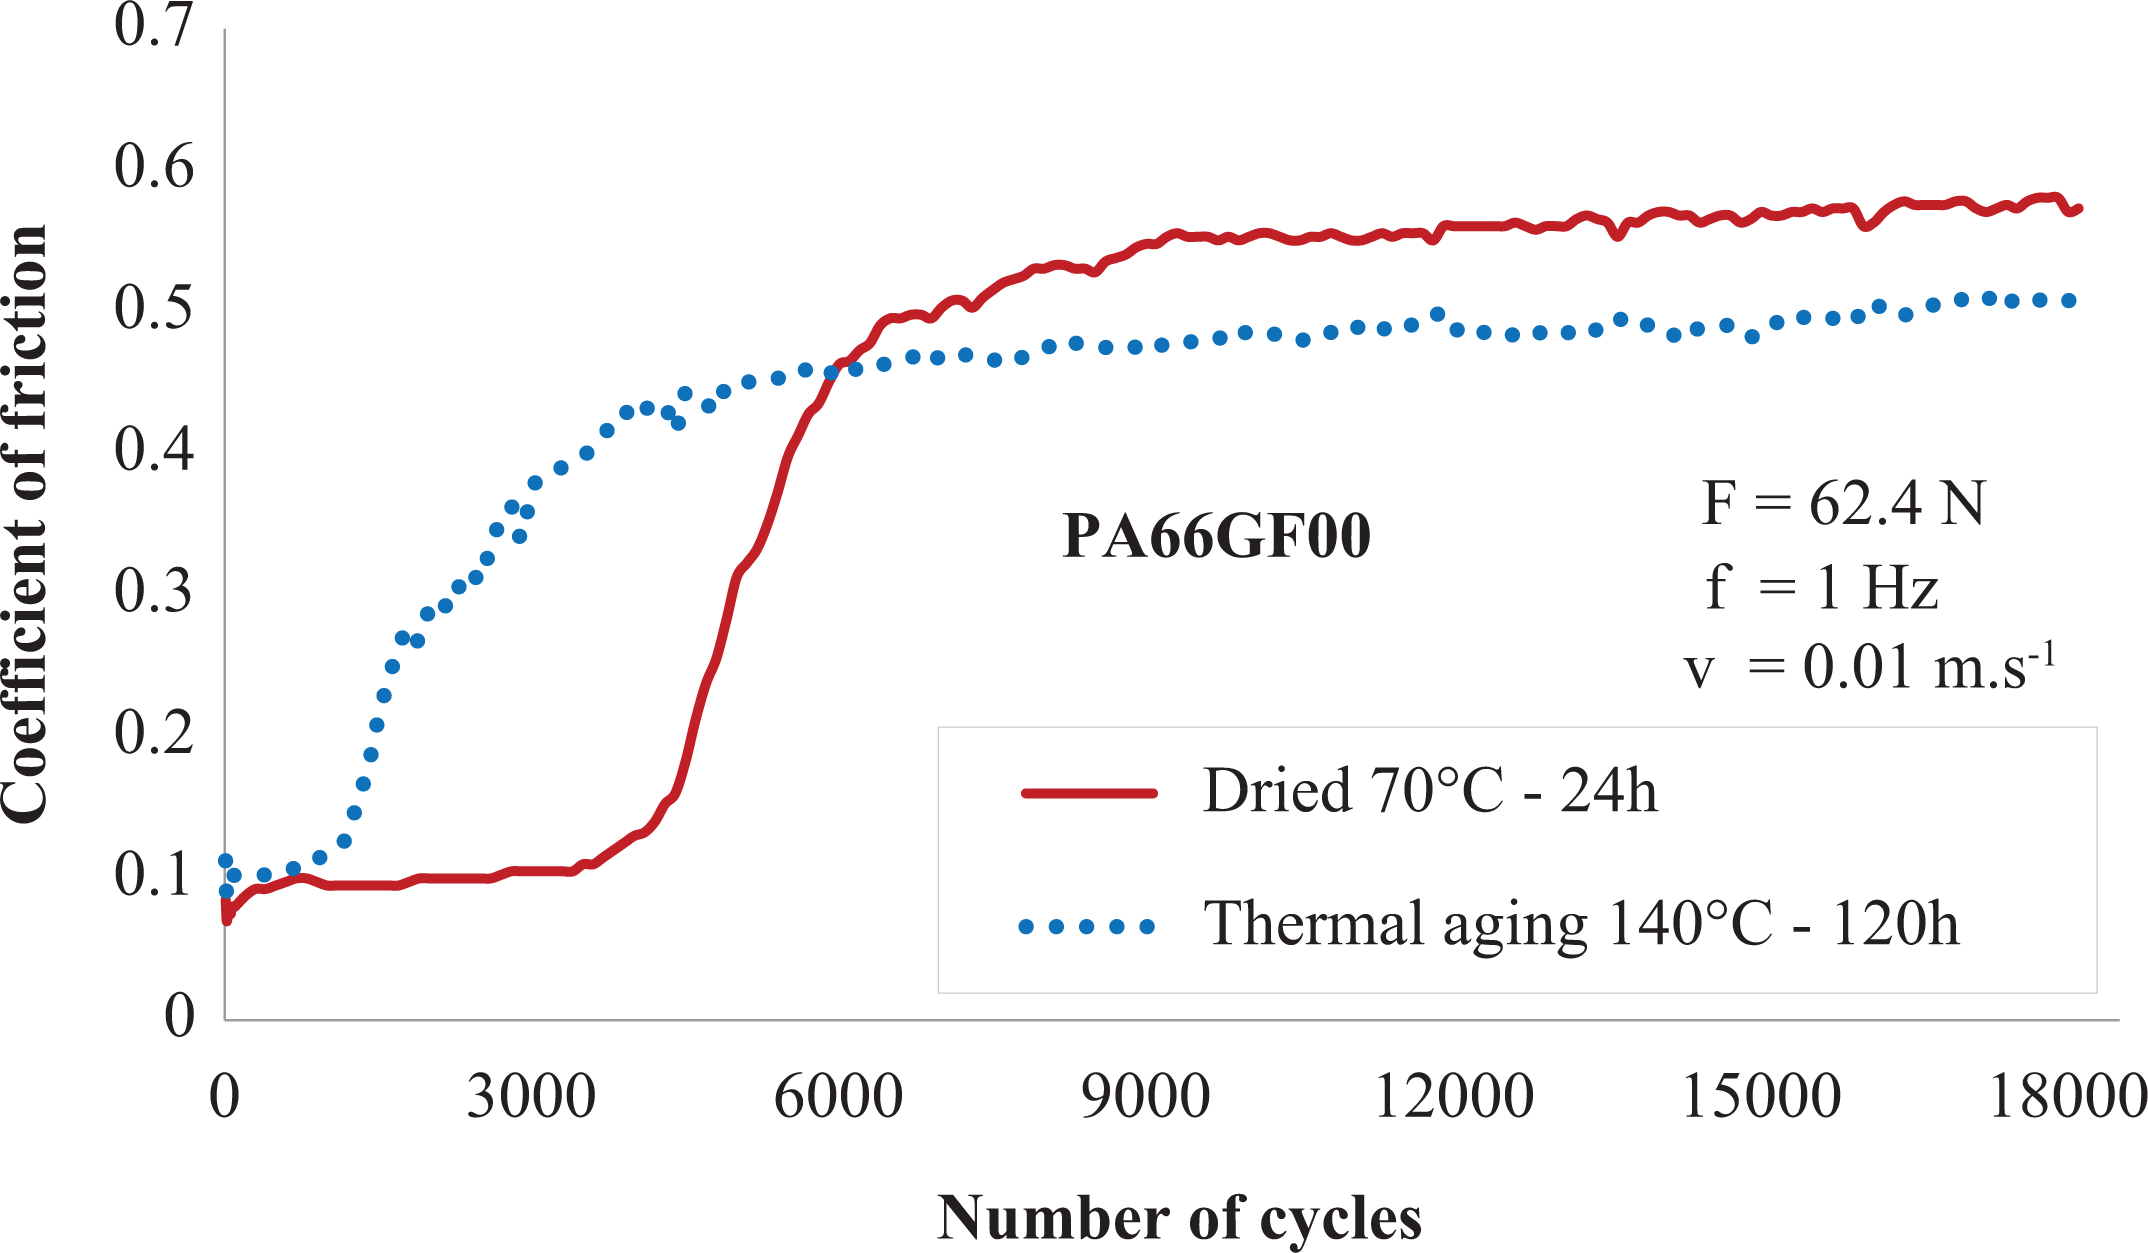
Coefficient of friction versus aging conditions for unreinforced samples (F = 62.4 N).
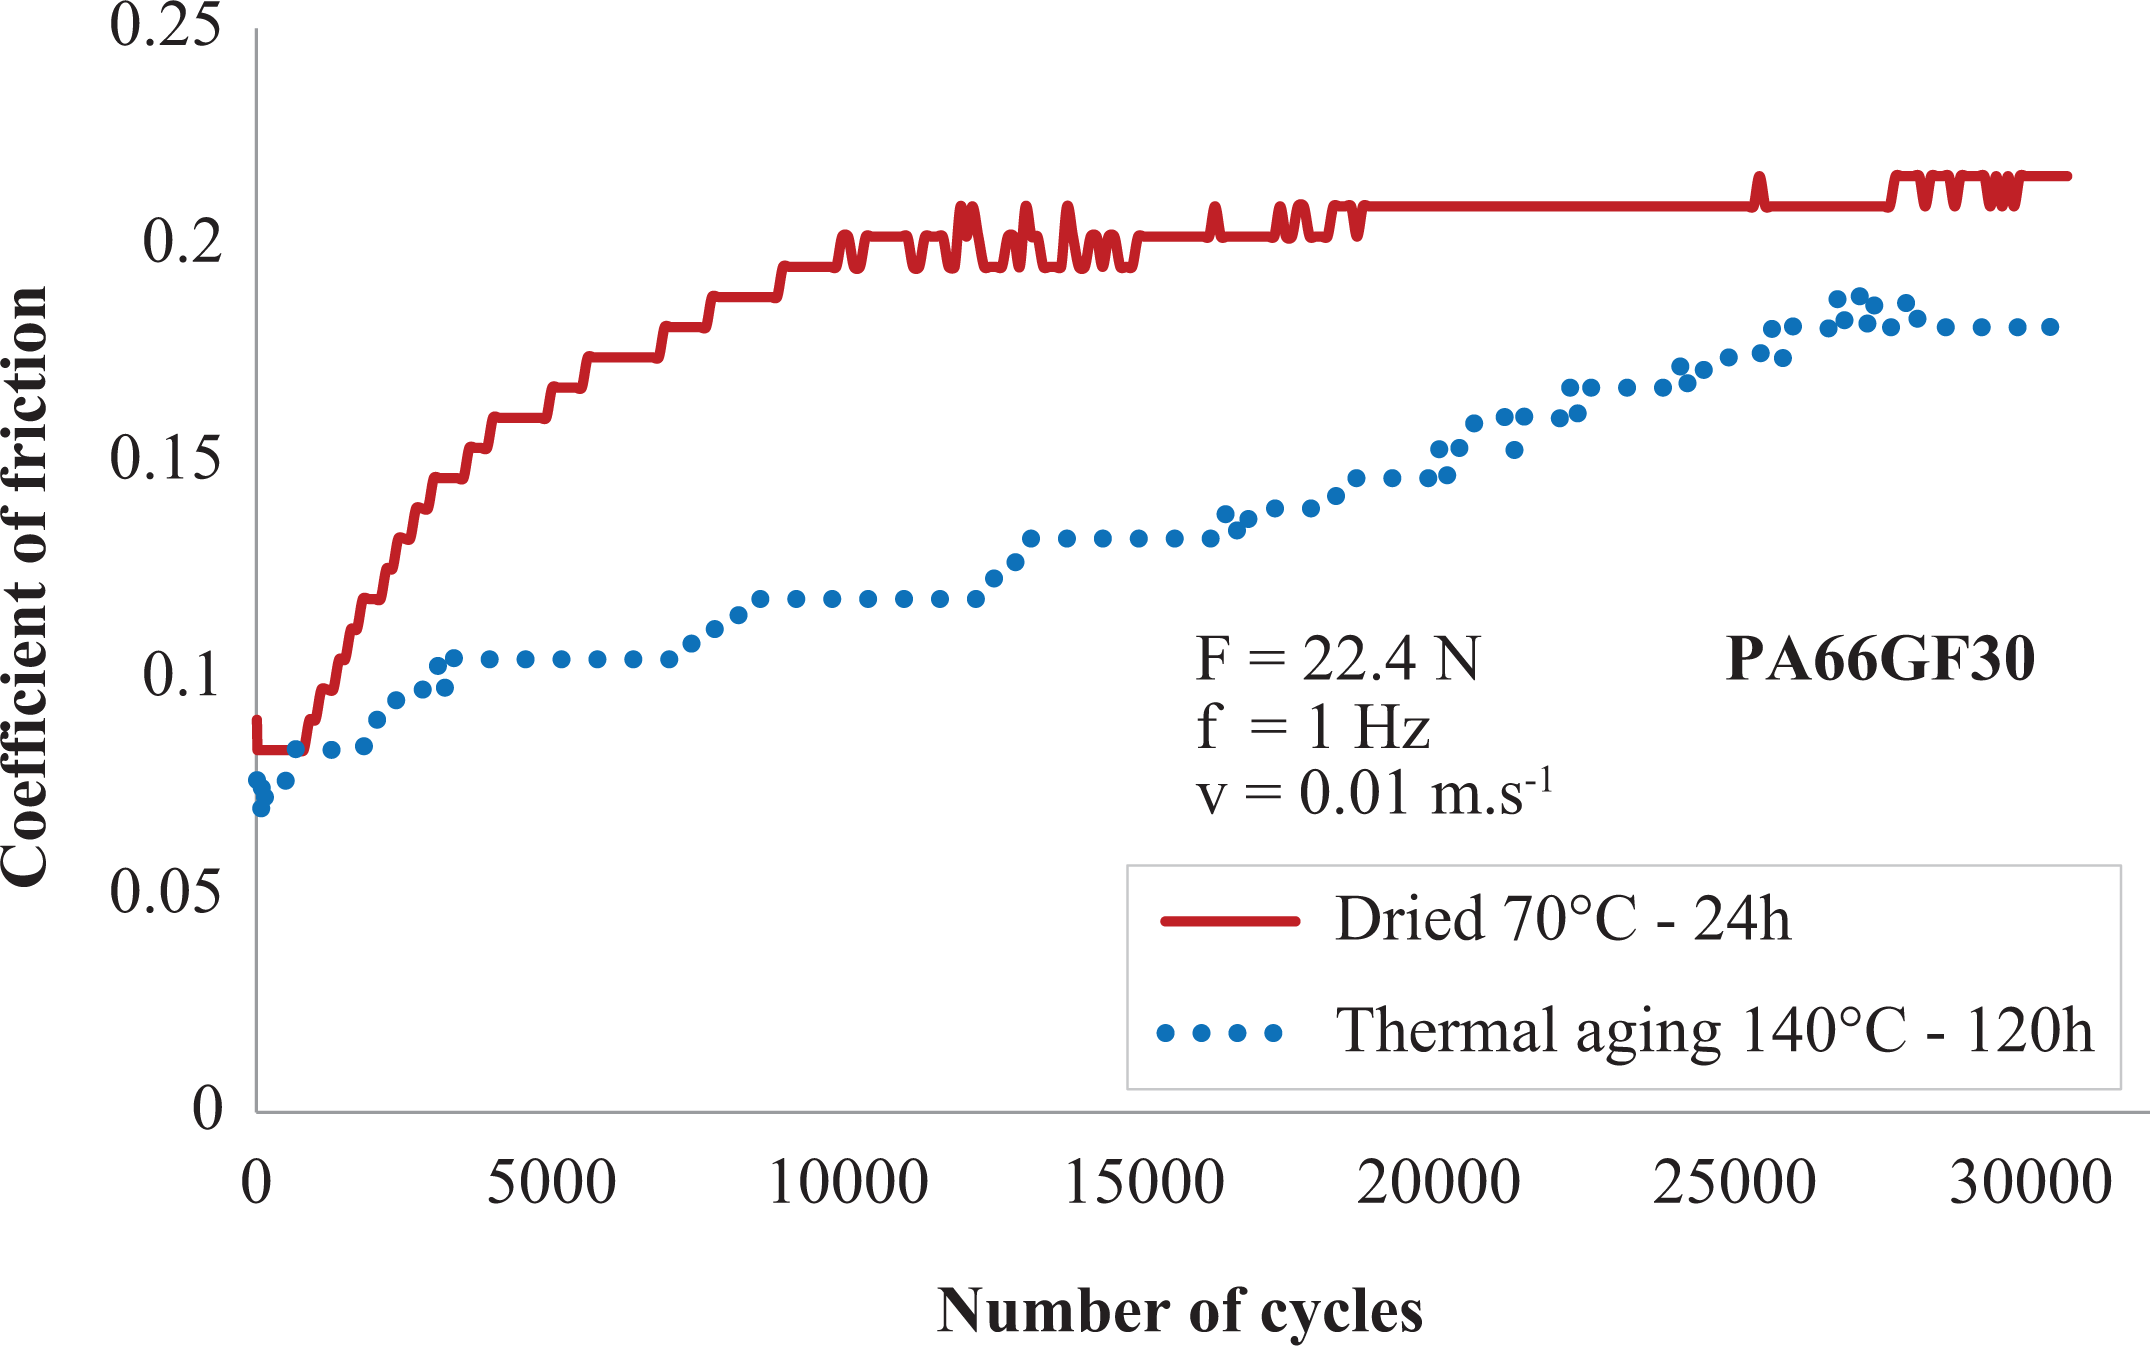
Coefficient of friction versus aging conditions for reinforced samples (F = 22.4 N).
Results obtained in Figure 8 confirm, also, the obtained results. Indeed, the some order of curves of the coefficient of friction was found when the studied material is reinforced with glass fiber (30% by weight).
When PA66 absorbs water molecules, scission of the hydrogen bonding between amide functional groups takes place because of hydrophilicity of the polar amide functional groups in PA66. 35 The weakening of water-absorbed PA66 becomes more severe at elevated temperatures at which the amide groups are decomposed to carboxyl, amine, and imide groups. 36 The change in the molecular structure of PA66 after water adsorption reduces its strength and dimensional stability 37–40 and affects its friction and wear effects. Stuart and Briscoe 41 reported that water absorption increased the friction coefficient of PA66 by increasing the contact area. Table 3 recaps quantitatively the effect of aging on the maximum obtained coefficient of friction.
Effect of aging on the maximum obtained coefficient of friction.
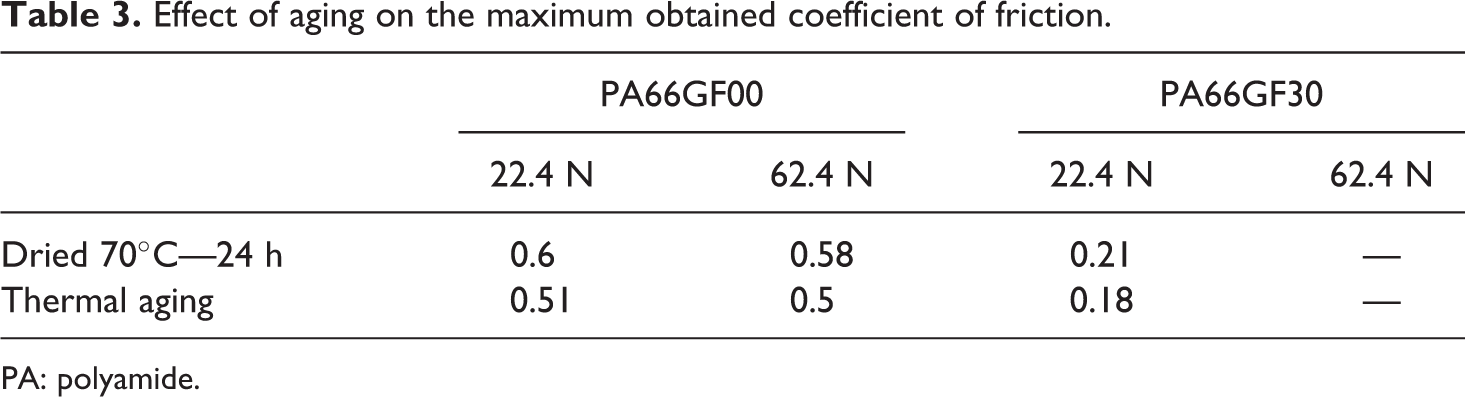
PA: polyamide.
Effect of reinforcement on the coefficient of friction
Figure 9 shows that increasing glass fiber content decreases the stationary coefficient of friction for aged and unaged samples. This behavior can be explained by the dominance of a friction mechanism relative to the other when increasing glass fiber rate. Indeed, the contact between the two antagonists will evolve from a sliding contact between a hard surface and another relatively soft, which promotes a soft abrasive friction mechanism, to a contact between two relatively hard surfaces, when the fiber content increases, favoring the predominance of a severe abrasive friction mechanism.
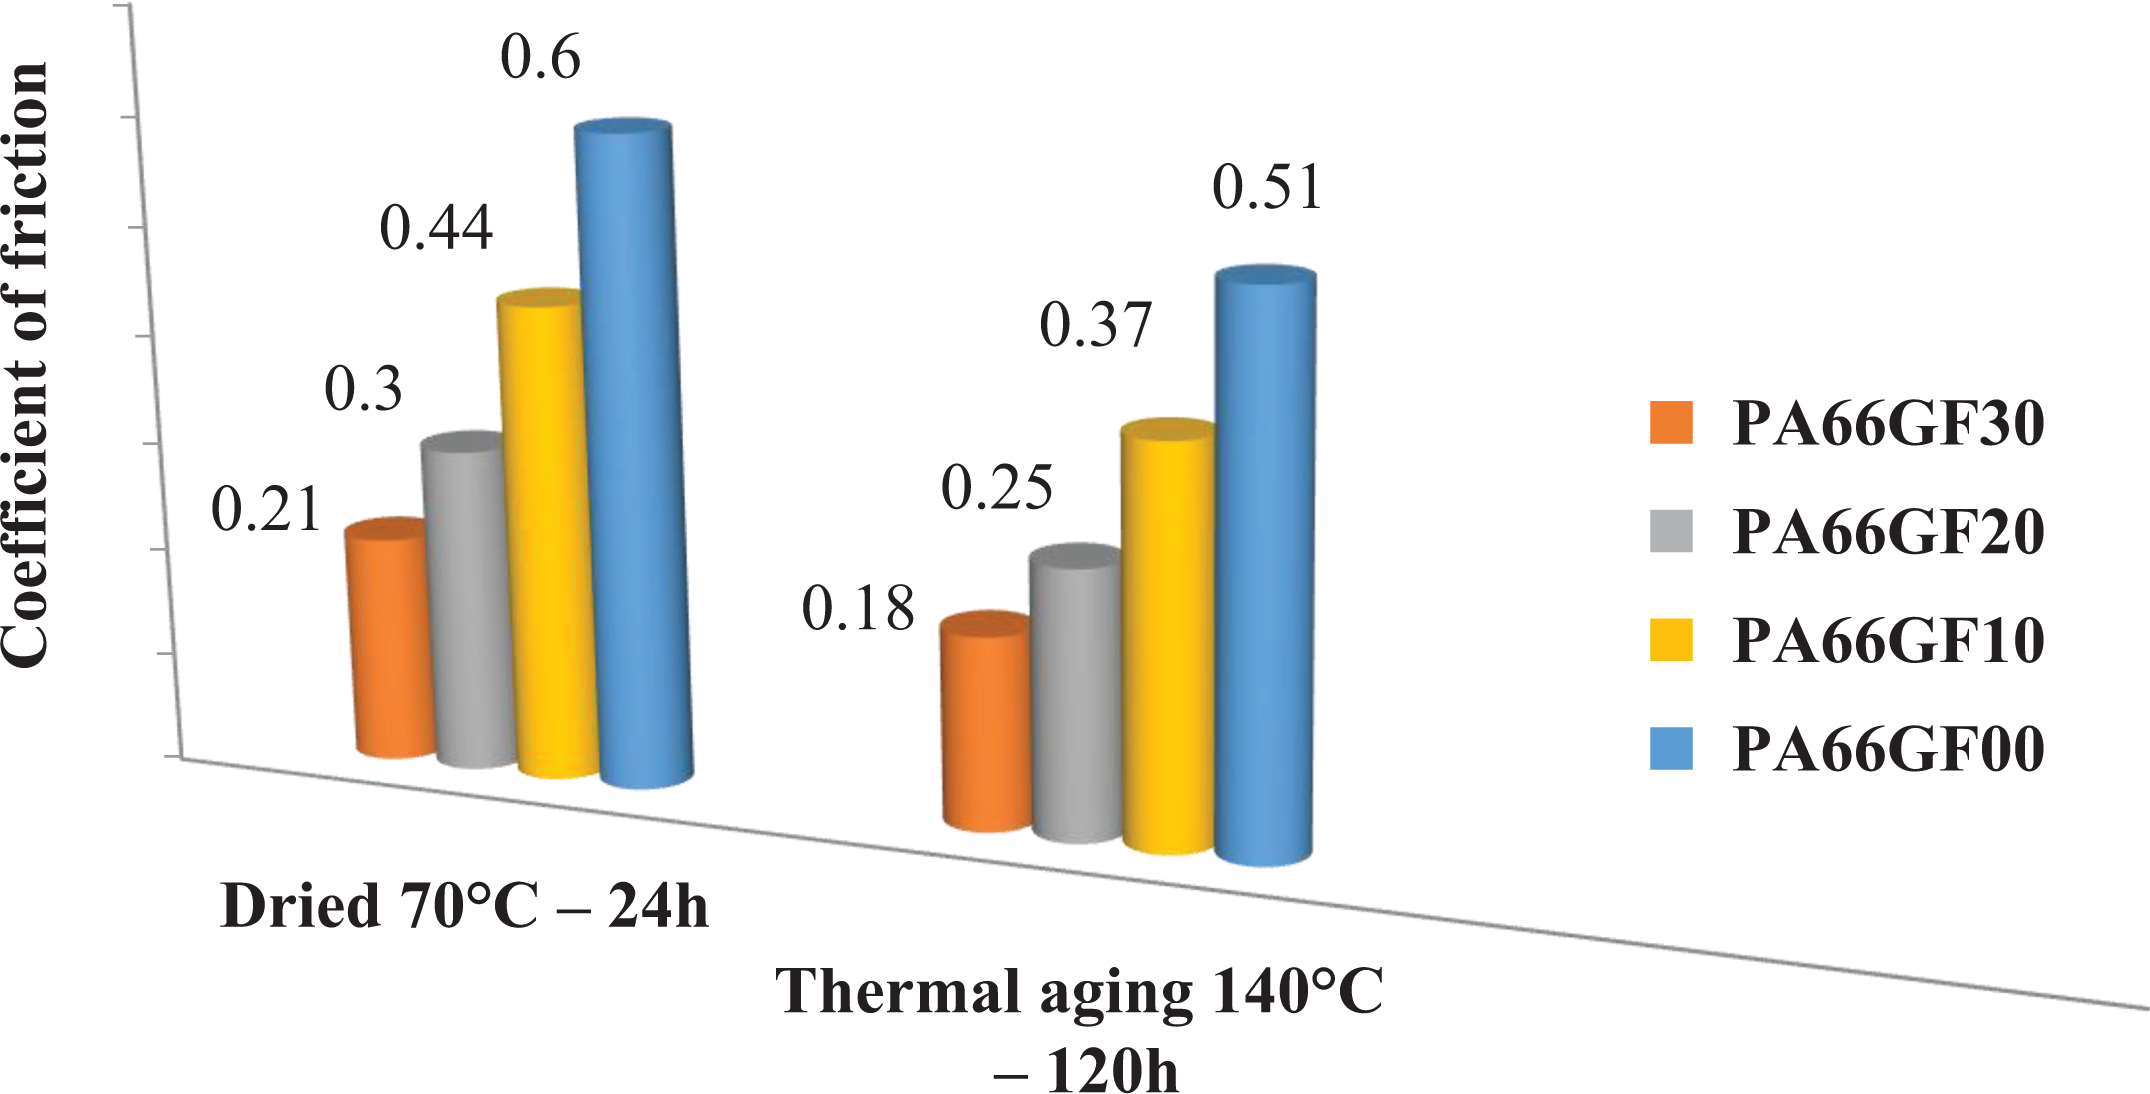
Stationary coefficient of friction versus glass fibers weight fractions for all aging conditions.
Kim et al. 23 confirmed these results and showed that the short glass fibers in the PA66 composite decreased the friction coefficient by producing contact plateaus with a high density of glass fibers on the composite surface.
Effect of aging and reinforcement on the wear
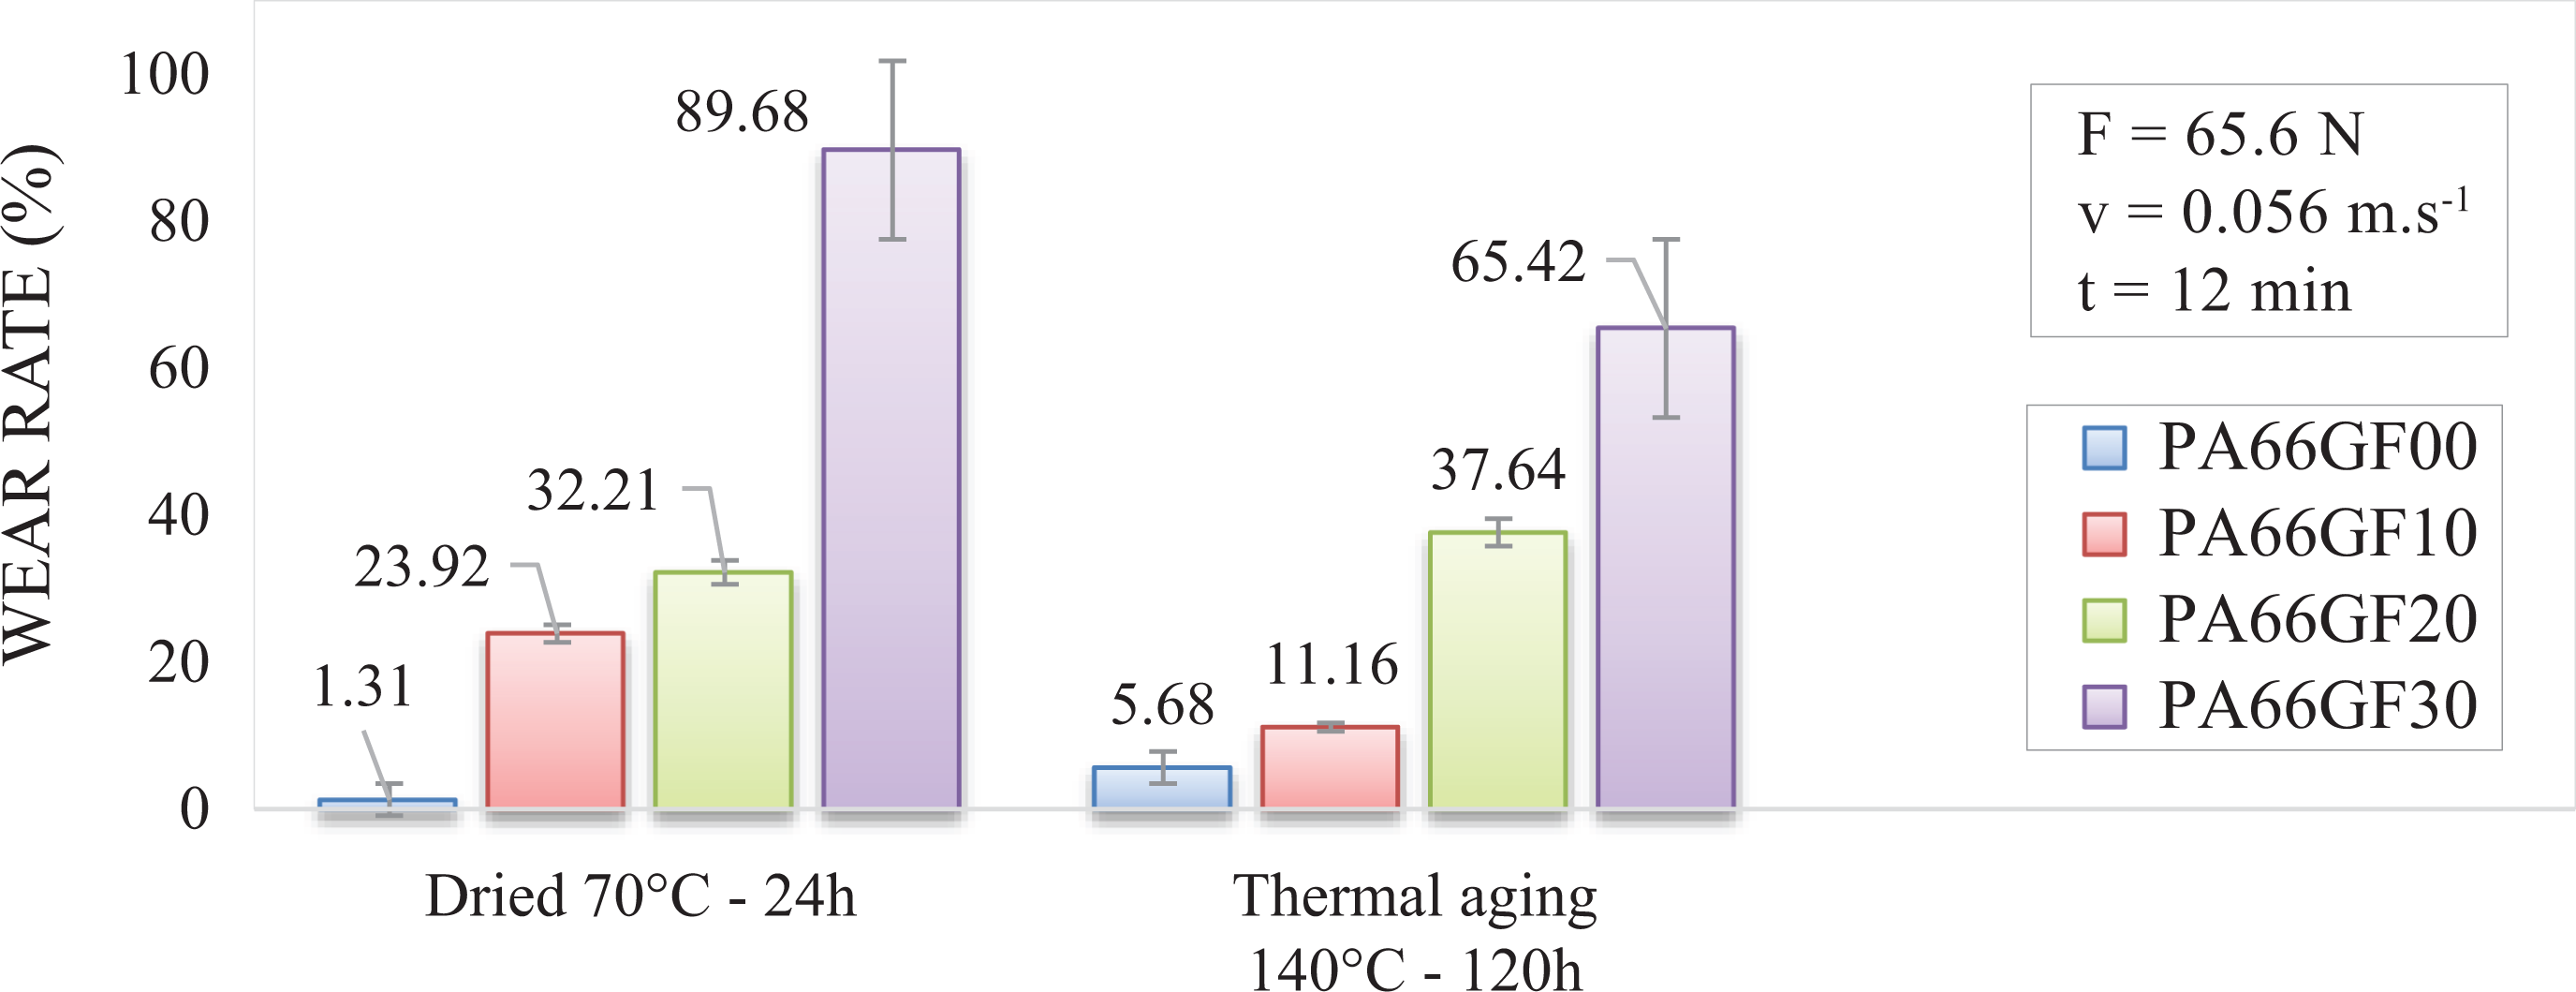
Figure 10 shows the impact of aging on the wear rate. As shown, the effect of aging differs when varying glass fiber weight fractions, so there is no unified effect on the wear rate for all reinforcement rates. Table 4 recaps quantitatively the effect of aging on the average obtained wear rate.
Wear rate versus aging conditions for all glass fibers weight fractions.
Effect of aging on the average obtained wear rate.
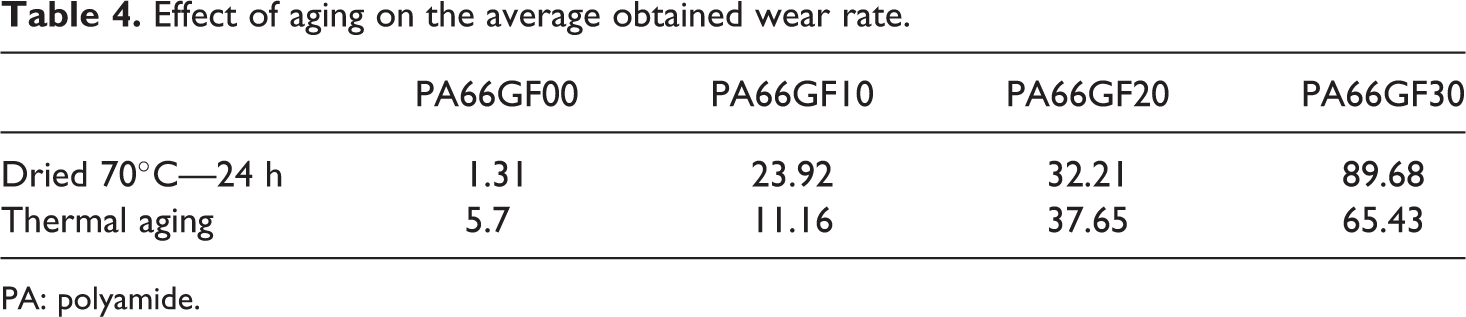
PA: polyamide.
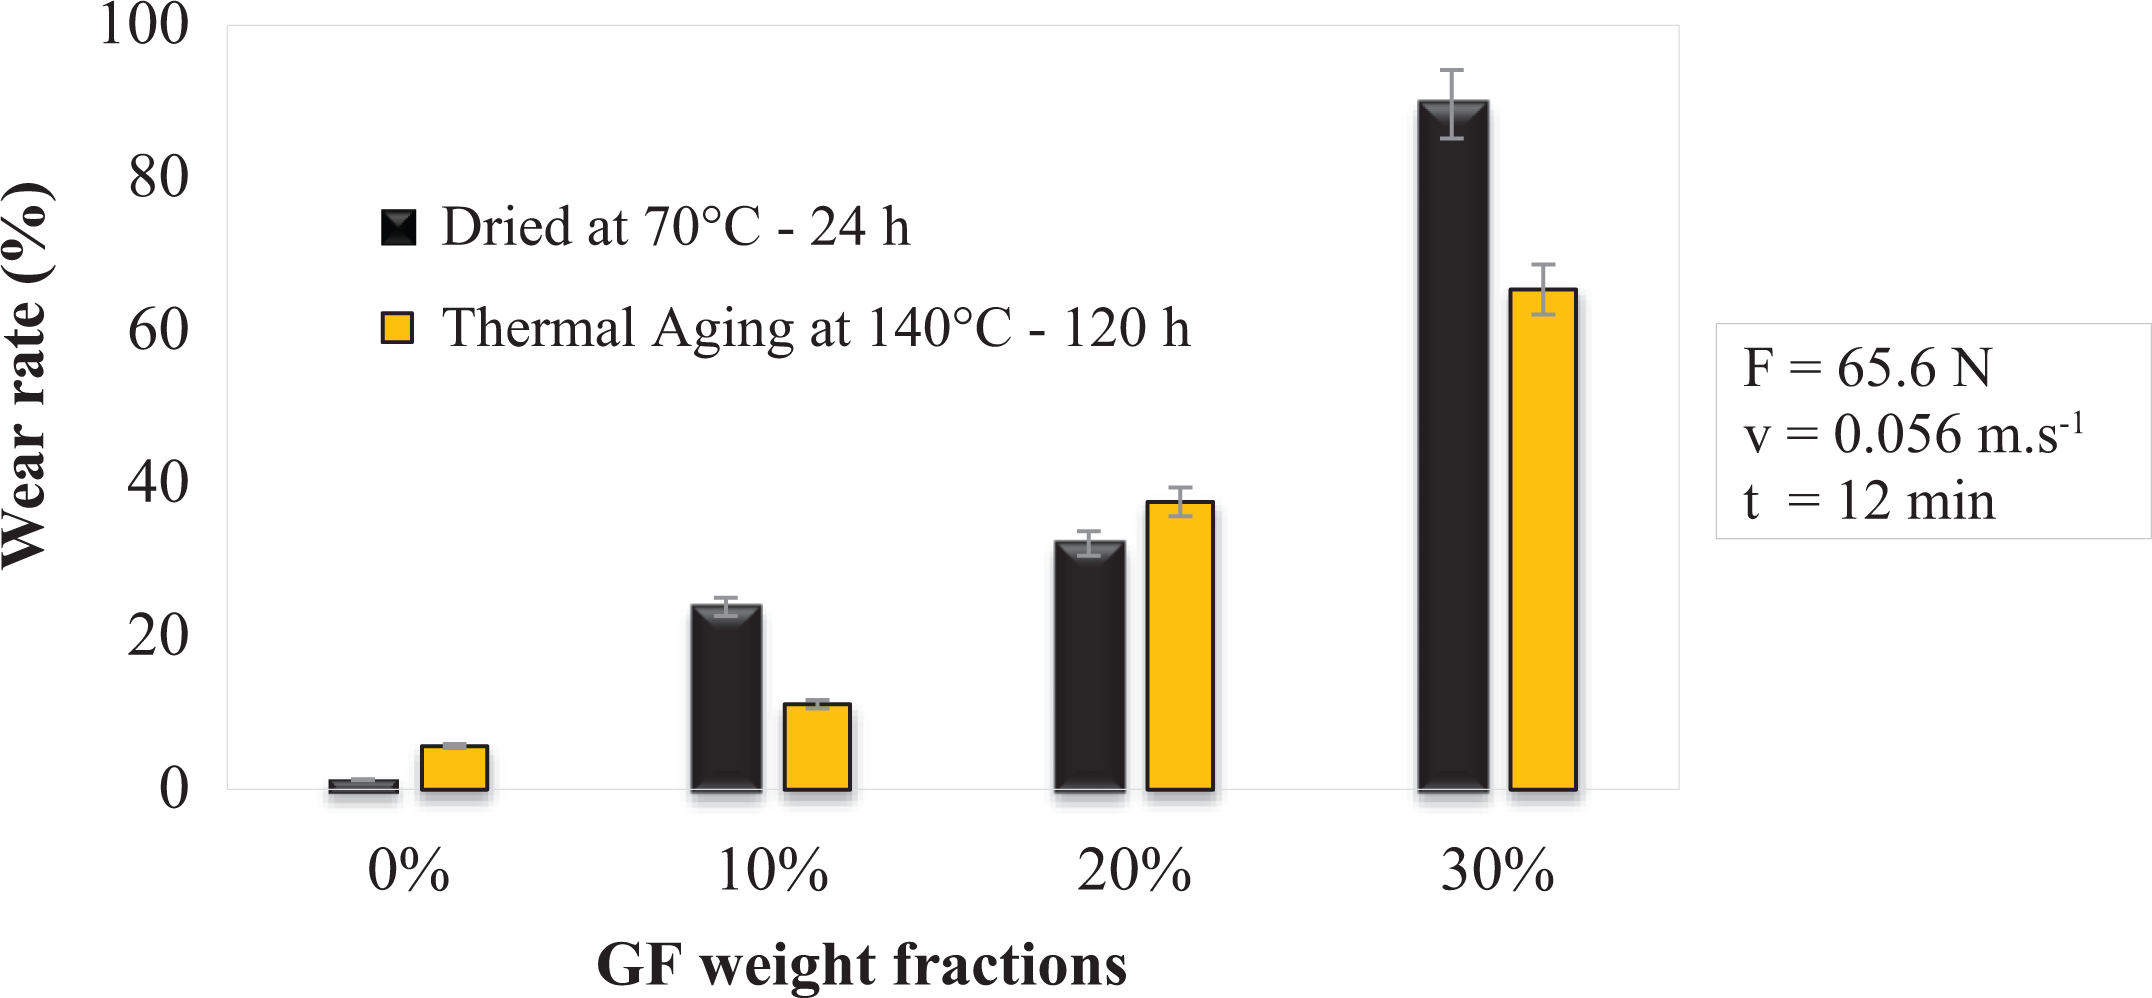
Figure 11 shows the impact of reinforcement on the wear rate. As shown, when the content of glass fiber is increased, the wear rate increases. These results are in agreement with those found by some researchers 9,11 but in disagreement with another works 5,6,9 and 2,8 Kim et al. 23 contradict these results and showed that the short glass fibers in the PA66 composite improved the wear resistance by a strong reinforcement.
Wear rate versus glass fibers weight fractions for all aging conditions.
When accessing a rate of 30%, there is a jump in the obtained wear rate values and the gap is more significant than which obtained for the other percentages. This wear behavior can be explained by an excessive fragility of this composite (PA66GF30) which facilitates the breakness under dynamic sliding.
Mechanisms of wear
Figure 12(a) shows the surface of PA66GF30 before the friction test. This micrograph indicates the presence of two phases: a blackish PA66 matrix and whitish short glass fibers. Figure 12(b) to (d) illustrates typical SEM micrographs showing the effect of reinforcement and sliding time on the wear track. Zone A indicates the neat surface, zone B the track of wear, and zone C the wear debris. The arrow indicates the sliding direction, which is in these examples perpendicular to the fiber direction. The width of the abrasive wear track is smaller for unreinforced samples and increased when increasing sliding time.
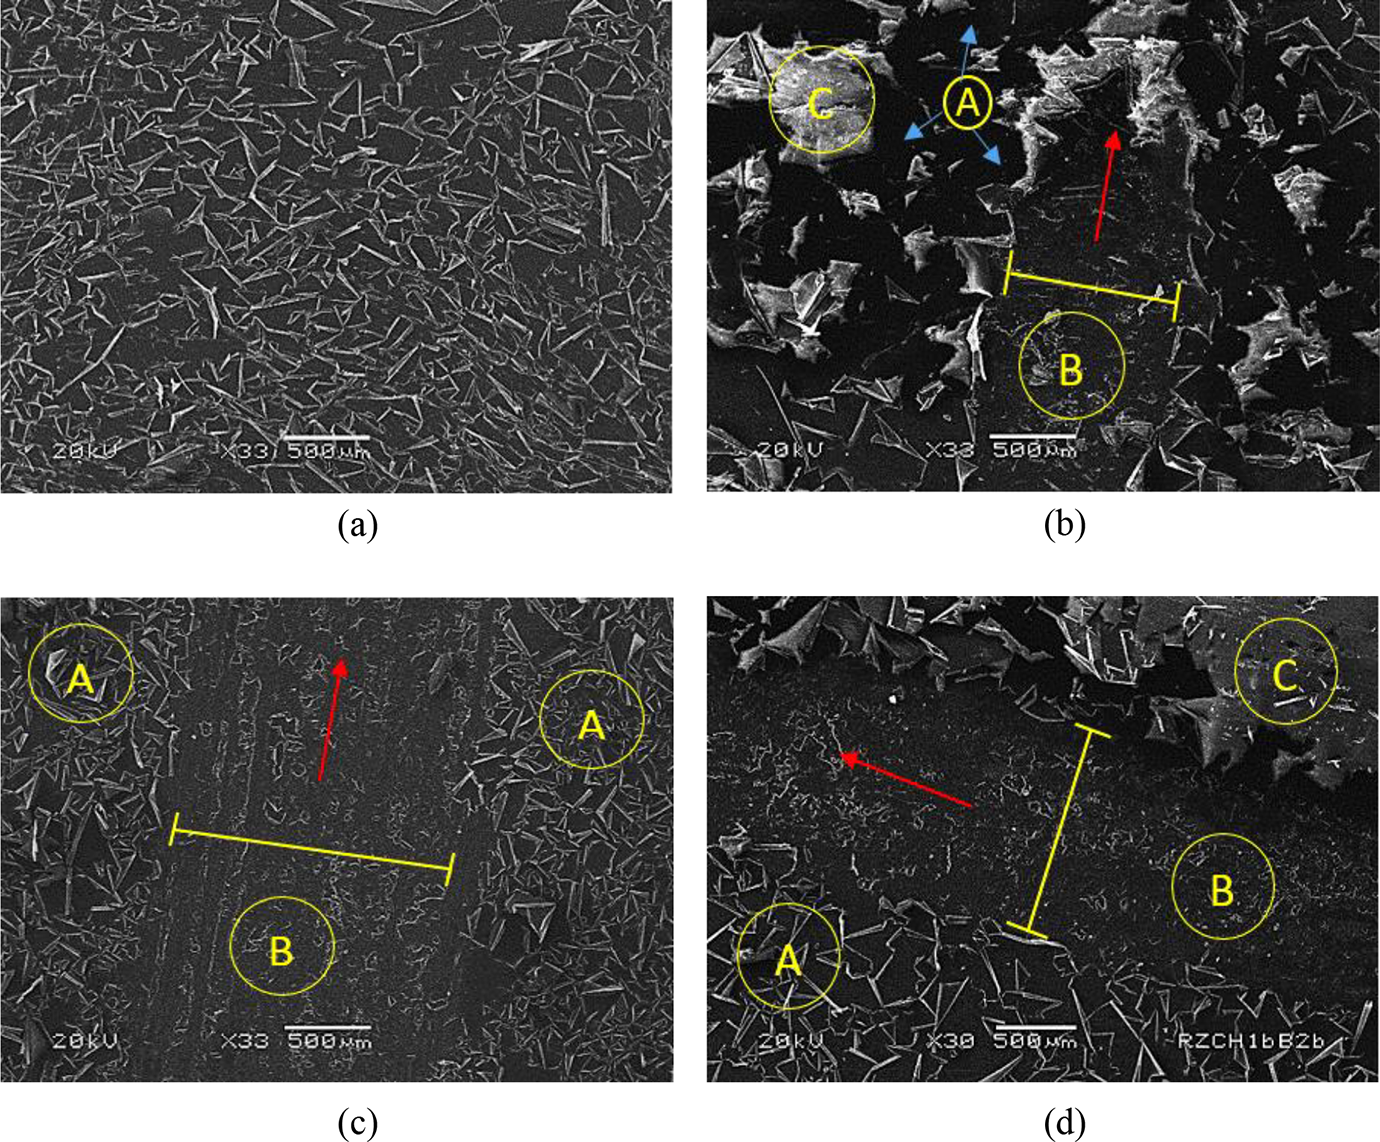
Typical SEM micrographs showing the effect of reinforcement and sliding time on the wear track: (a) PA66GF30 (neat surface), (b) PA66GF00 (30,600 cycles), (c) PA66GF30 (43,200 cycles), and (d) PA66GF30 (30,600 cycles). PA: polyamide.
Indeed, the width of the wear track is about 1.3 mm for PA66GF30 and about 0.95 mm for PA66GF00 when the number of cycles is 30,600. When increasing the number of cycles to 43,200, the wear track increased to about 1.6 for PA66GF30. The SEM micrographs show that there is mostly an abrasive process of wear for reinforced and unreinforced specimens. Adherence of debris to metal counterface is reduced under very abrasive conditions. Larger asperities on metal counterface deform polymer surface, giving rise to ploughing, micro-cutting, and formation of abrasive wear tracks. For unreinforced nylon (PA66GF00), essentially plastic deformation of polymer occurs during sliding wear. For reinforced samples, glass fibers were worn by abrasive action of metal asperities. Particles of glass debris also combined to accelerate this abrasive action. Typically, the diameter of the glass fibers is reduced prior to fracturing into shorter lengths due to the effect of the alternating stress system followed by debonding from the polymer matrix.
Conclusions
The effect of thermal aging on the flexural, friction, and wear behaviors of monolithic PA66 and glass fiber–reinforced PA66 was investigated. Results showed that decreasing moisture rate improved the mechanical properties and decreased the stationary coefficient of friction for reinforced and unreinforced samples. Thermal aging caused an increase in the maximum flexural stress to about 39% for PA66GF00, PA66GF20, and PA66GF30 and to about 36% for PA66GF10 in comparison with drying treatment. In comparison with untreated samples, the increase in this property was respectively to about 60%, 55%, 55%, and 58%. In the contrary, thermal aging has decreased the stationary coefficient of friction to about 15% and 14% in comparison with drying treatment for respectively PA66GF00 and PA66GF30 samples under a load of 22.4 N. When normal load was increased to 62.4 N for PA66GF00, the difference was reduced to a close value of 14%. Increasing glass fiber weight fraction improved, also, the flexural mechanical properties and decreased the stationary coefficient of friction for aged and unaged samples. Increasing glass fiber content increased the wear rate. Varying moisture rate using thermal aging did not influence the wear rate similarly when varying glass fiber weight fraction.