
Abstract
Exfoliated graphene nanoplatelets (3 phr) were incorporated into polypropylene with increasing concentration of treated and untreated kenaf flour 0, 10, 20, 30, and 40 wt%, respectively, and prepared via melt-extrusion using corotating twin screw extruder. The resulting nanocomposites were characterized in terms of electrical, thermomechanical, thermal conductivity, thermal behavior, heat deflection temperature (HDT), and mechanical, morphological, and structural properties. Fourier transform infrared spectroscopic results demonstrate that the fibers interacted with the matrix and affected the mechanical behavior. The effective thermal conductivities decreased with increasing fiber content, while HDT of the nanocomposites was found to significantly increase, respectively. The electrical properties decreased with increasing fiber content. However, despite the decline in electrical conductivity, the composites were still relatively conductive for applications such as sensors and electromagnetic shielding after fiber inclusion.
Introduction
Generally, polymers are perceived as thermal and electrical insulators. Inclusion of conductive fillers such as carbon derivatives, fibers, and metallic powders into an insulative polymer matrix enhances the conductivity of the resulting nanocomposites. 1 In recent times, conductive polymer nanocomposites have attracted high interests from both the industrial sector and the academia. The conducting materials exhibit some superior properties in comparison with metals. Such properties include corrosion resistance, capability of tailoring the conductivity attributes to meet the application requirements, lightweight, and good processability potentials. 2 Recently, emerging advancements in lignocellulose-based fiber-reinforced polymer composites have escalated the need to procure alternatives exhibiting potentials of replacing metals in the automotives, electronics, construction, aerospace, and gas and oil industries especially where thermal and electrical conductivities are critically vital. For instance, electrically conducting polymer composites may exhibit suitability for radio frequency interference shielding or electromagnetic interferences applications, conductive adhesives in electronics packaging, self-regulation heating devices, and static charge dissipative materials. 3 Moreover, due to their lower thermal expansion co-efficiency, superior thermal and electrical conductivities, and superior corrosion hindrance in comparison with metals, carbon-affiliated fillers are utilized as excellent conductive reinforcements for polymeric composites. 4
In recent times, there has been an increasing progress in utilization of exfoliated graphene nanoplatelets (GNPs) as multifunctional phase in polymer nanocomposites. 5 These GNPs exhibit array of properties similarly related to carbon nanotubes such as flame retardancy, thermal and electrical conductivities, and mechanical, thermal, and physical properties in addition to the low cost and layering microstructures of nanoclay. However, in recent decades, environmental challenges such as materials sustainability and environmental concerns have attracted much interest. These challenges have aroused great interests in investigations concerning natural materials such as natural fibers derived from plants and their subsequent polymer-affiliated composites. In recent research, various fibers derived from natural sources such as sisal, walnut, coconut, kenaf, jute, flax, and hemp have been utilized as polymer composite fillers. 6 The accruable benefits of using these natural fibers over other conventional polymer reinforcements include lightweight, availability, low cost, ease of processability, nil propensities to cause skin irritability, biodegradability, and zero abrasion to processing equipments. 7
In previous years, research have been carried out on the electrical and dielectric properties of natural fiber–reinforced polymer composites. 8 And these studies demonstrated enhancement in electrical conduction and dielectric attributes with inclusion of natural fibers. 8 –10 Nevertheless, the conductivity elucidation of natural fiber–affiliated polymer composites is not in comparison with the run of the mill conductive polymer composites, which exhibits relative superior conductivity than the fiber-filled composites. Hence, this expresses potentials of restricting utilization of natural fiber–affiliated polymer composites in electronics. Polypropylene (PP) belongs to the polyolefins group and is a semicrystalline and apolar thermoplastic polymer utilized in numerous applications. It is fabricated through chain-growth polymerization from propylene monomer.
Research investigations have been widely conducted on fabrication of low-cost conductive polymer composites elucidating appropriate conductivity for numerous applications. A recent study fabricated an ecobenign vapor sensor through the inclusion of ramie fiber into conducting polymeric composites. Results demonstrated that the conductive nanoparticles agglomerated and formed a conductive network across the ramie fiber. The inclusion of ramie fibers enhanced sensory stability of the vapor sensors while still maintaining the electrical conductivity. 11 This phenomenon is expected to open windows of opportunity for natural fiber–affiliated polymeric composites. Another study undertook a comparative analysis of the electrical conductivity of sisal/coir hybrid fiber–filled natural rubber (NR) composites subjected to varying chemical treatments such as acetylation, alkaline modifications, and benzoylation. 12
Thus, the aim of the present study is to analyze the influence of increasing inclusion of kenaf fiber of varying loadings (10–40 wt%) on flammability and electrical and thermal properties of GNPs-filled PP composite. This investigation focused on the preparation and characterization of electrical and thermal conductivities, heat deflection temperature (HDT), and mechanical and thermal stability properties of the composites.
Experiment
Materials
Heterophasic PP copolymer, SM 240 grade of density of 0.96 g cm−3, with a melt flow index of 35 g/10 min (230°C and 2.16 kg load) was purchased from Lotte Titan Chemicals, Malaysia. The compatibilizer maleic anhydride grafted polypropylene (MAPP) was purchased from DuPont, Dow Elastomers (Wilmington, DE, USA). Kenaf fiber was obtained from Malaysian Agricultural and Development Institute, Kuala Lumpur. Exfoliated graphite nanoplatelets, GNP-M5 grade composed of 99.5% carbon and GNPs of average diameter 5 μm and average thickness of 6 nm, were purchased as dry flour from XG Sciences, Inc., East Lansing, Michigan, USA, and applied as received. The calculated Brunauer, Emmett, and Teller (BET)-specific surface area of GNP powder utilized in present study is 158 m2 g−1 obtained from laboratory evaluation.
Measurement of BET-specific surface area
The BET surface area was assessed using Gemini V Surface Area Analyzer of isotherm nitrogen adsorption set at 77 K. Prior to BET assessment, the samples underwent degassing at 350°C for 4 h under atmospheric pressure. Equation (1) was used in calculating GNP-specific BET surface area. Table 1 elucidates parameters applied in the following equation
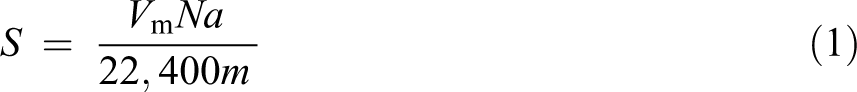
Elucidation of BET equation parameters.
BET: Brunauer, Emmett, and Teller; GNP: graphene nanoplatelet; STP: Standard Temperature and Pressure.
Preparation of composites
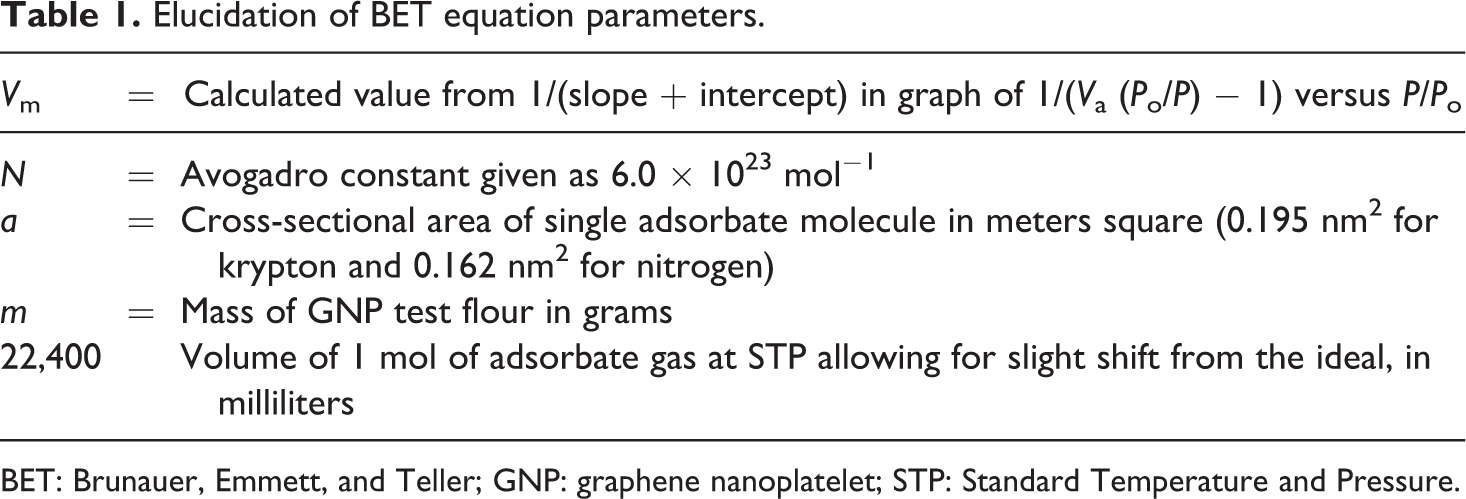
PP heterophasic copolymer of SM 240 grade with density of 0.96 g cm−3 and melt flow index of 35 g/10 min (230°C and 2.16 kg load) was dried in a vacuum oven at 80°C for 24 h and maleic anhydride (MA) was dried for 5 h at temperature of 60°C. Kenaf core fiber was grounded and sieved using mesh of <500 μm via sieve shaker equipment to obtain powdered kenaf core fibers of sizes <500 μm in longitudinal orientation. In order to minimize the moisture content, the powdered kenaf particles were oven dried at 60°C for 24 h. Kenaf flour underwent esterification by immersion in a solution of 340 ml of xylene composed of 18.5 g of MA and 1.5 g of benzoyl-perioxide which acted as catalyst while heating and maintaining reflux temperature of 140°C for about 4 h. The esterified flour underwent separation from the solution by washing, utilizing distilled water to extricate unreacted substrates. The flour underwent drying at 70°C in a vacuum oven until attainment of constant weight. The composite formulations are shown in Table 2. All the composites were melt intercalated through the utilization of Brabender (Germany) PL 2000 Plastic Coder counter rotating double screw extruder (with 4-mm rod-die, L/D = 30 and D = 25 mm). Extruder melt pressure was about 12 bars with optimized temperature of 185°C maintained consistently from the feed zone to the die head zone to avoid fiber degradation at higher temperatures. All materials were melting intercalated in a single step process with various corresponding amounts of GNPs according to the sample formulation. The screw speed was consistently maintained at 60 r min−1. After melt intercalation, the extrudate was immediately pelletized. In order to eradicate moisture, the pellets were oven dried at 80°C for 24 h before injection molding into standardized samples. Tensile, flexural, and notched Izod impact tests specimens were prepared using JSW model NIOOB 11 Muraron-Japan injection molding machine (Japan) at temperature range of 185–200°C. As reflected in the formulation, the content of the treated and untreated fibers was increased from 10 wt% to 40 wt%, respectively. The concentrations of GNPs were calculated on per hundred of total composites while 3 phr was selected as consistent inclusion for all composites.
Compounding formulation for composites.
PP: polypropylene; GNP: graphene nanoplatelet.
Characterization
Arc resistance
Arc resistance facilitates insight into the resistance of reinforced polymers to elevated power discharges across their surfaces. Arc-resisting measuring equipment was utilized in measuring arc resistance of the samples according to ASTM D 495. This measurement technique was used in applying a 10 kV voltage with a restrained arc discharge of 10 mA across the samples. Moreover, the samples were maintained within two electrodes in shape of a chisel in separation by a distance of 0.635 cm.
Volume and surface resistivity
ASTM D 257 was utilized in determining volume and surface resistivity and measurements conducted with a Keithley-electrometer model 610C (USA) using disc-shaped sample sizes of 100 mm deriving values for volume resistivity relative to the following equation

where A represents area = 19.6, t = sample thickness, and R v is given as volume resistance. Thus, surface resistivity is attained using the expression, surface resistivity (Ω) = A × R s, where A is given by area = 18.8 and R s is the resistance of the surface.
Vicat softening temperature
This was determined using ASTM D 1525. It is the temperature a circular cross section needle of 1 mm2 underwent penetration of 1 mm depth into a composite sample. The sample sizes used were of cross section 10 × 10 mm2.
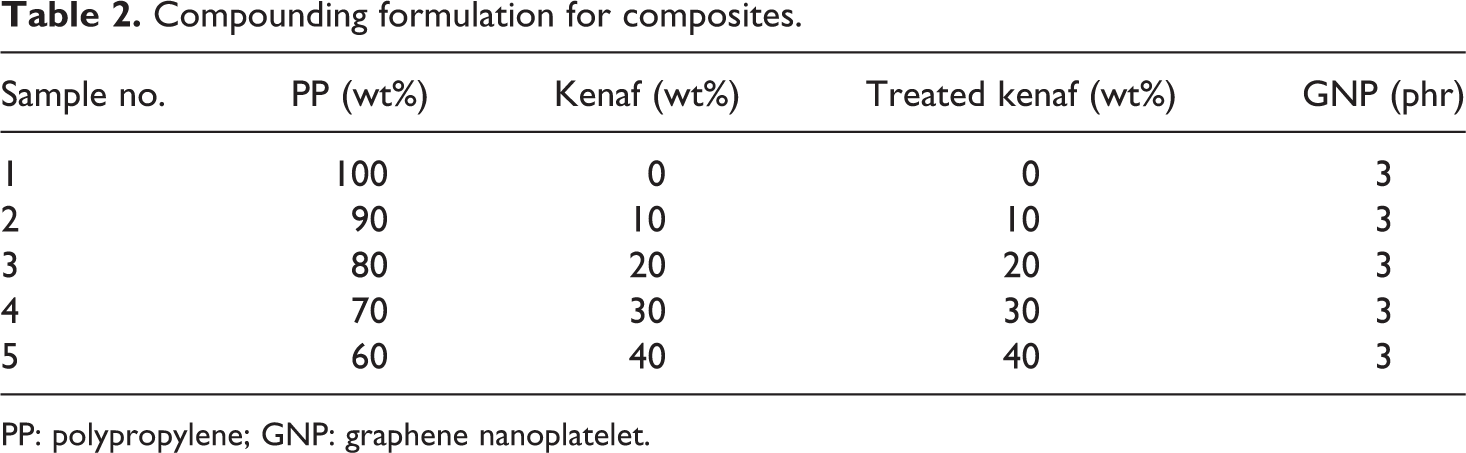
Thermal conductivity
Steady-state technique using Cussons thermal conductivity equipment (Manchester) was employed for thermal conductivity measurement according to ASTME 1530 using samples of dimensions 10 × 10 × 3 mm3. Fourier’s law viz. equation was used in calculating thermal conductivity, K, for one-dimensional heat flow 13

At steady equilibrium state conditions, the total heat transfer rate, Q, is given by Fourier’s equation (4). Elucidation of equations (3) and (4) parameters is presented in Table 3 13

Elucidation of thermal conductivity K and total heat transfer rate Q parameters.
Heat deflection temperature
HDT according to ASTM D648 was conducted using GOTECH GT-HV2000 W HDT/VICAT (Taiwan) equipment with samples of sizes 120 × 4 × 4 mm3. Initially, a load of 0.46 MPa (66 psi) was enforced, subsequently followed by a higher loading of 1.80 MPa (264 psi). Temperature values at each specific loading and deflection were collected.
Differential scanning calorimeter
The melting and crystallization parameters of the nanocomposites were characterized via differential scanning calorimetry (DSC) (NETZSCH DSC 200 F3, Germany), using 6.7-mg samples sealed in aluminum (AL)-pans. The set temperature was increased from 30°C to 300°C at a heating rate of 10°C min−1 and after 1-min period, it was recycled back at the rate of 10°C min−1. The fusion enthalpy, ΔHf (PP) was measured, and the degrees of crystallinity, Xc (PP) were calculated using the following equation
where
Morphology
The degree of distribution of GNPs in matrix was observed using transmission electron microscopy (TEM) and field emission scanning electron microscopy (FESEM). FESEM micrographs of the fractured surfaces of samples were obtained using ZEISS SUPRA 35VP (Germany). The nanocomposites specimens were gold coated using Balzers union MED-010-coater (Germany) and carbon conductive adhesive 502. FESEM micrographs were effectively collected. TEM micrographs were collected using samples of sizes 0.2 × 1 cm2 on a ZEISS LIBRA-120 TEM. The ZEISS LIBRA-120 TEM (Germany) is an energy-filtering TEM equipped with a Gatan-Ultrascan (USA) 1000 2k × 2k charge-coupled device (CCD)-camera operating at an accelerating voltage of 120 kV.
Thermal stability
Thermogravimetry analysis (TGA) for thermal weight loss as function of temperature was carried out using NETZSCH TG 209 F3 TGA using samples of weight 10 mg for each run. The thermal decomposition of each sample was investigated under nitrogen atmosphere. Each sample was heated to 600°C at ambient temperature at a heating rate of 10°C min−1 and weight loss recorded as function of temperature.
X-ray diffraction analysis
X’Pert, X-ray diffractometer (Siemens XRD D5000, Germany) with nickel-filtered copper (Cu) Kα radiation at an angular incidence of 10–80° (2θ angle range) was used in collecting XRD patterns. XRD scans of hybrid synergistic nanocomposites were collected at 40 kV and 50 mA at an exposure time of 120 s. The determination of distance between nanofiller layers using Bragg’s equation (6) is one of the major uses of XRD 15

where θ = angle between incident rays and the surface of the crystal, λ = X-ray wavelength = 0.154 nm (Cu Kα ), n = 1, and d = spacing between layers.
Mechanical properties
The tensile bar samples were tested using the universal materials tensile tester EZ 20KN, LLYORD instrument (Sussex, England) according to ASTM D 638 standard at a cross head speed of 50 mm min−1. Five samples from each composition were tested along with neat blend specimens for comparison. The three-point loading applying center loading technique was applied for flexural test (ASTM D790). Samples for flexural tests were placed on a supported beam. The span distance was set at 50 mm and the strain rate (compressed speed) was 3 mm min−1.
Fourier transform infrared spectroscopy
Fourier transform infrared (FTIR) spectroscopy was carried out on a PerkinElmer (USA) 1600 infrared spectroscopy with the objective of finding any chemical interaction between the nanofillers and matrix via the potassium bromide method using a ratio of 1:100 before converting to thin pellet. FTIR spectra of the coated pellet were recorded using a Nicolet AVATAR 360 (USA) at 32 scans with a resolution of 4 cm−1 and within the wave number range of 4000–800 cm−1. The points of notable transmittance peaks were determined using the “find peak tool” provided by Nicolet OMNIC 5.01 software.
Fire tests: Cone calorimeter, UL-94-V, and limiting oxygen index
Samples of sizes 100 × 100 × 3 mm3 with regard to ISO 13927 standard were utilized in deriving flammability data for heat release rate (HRR), effective heat of combustion (EHC), mass loss rate (MLR), and other essential parameters of using the mass loss calorimeter (MLC; Fire Testing Technology, UK). A 35 kW m−2 external radiant heat flux was applied in conducting the fire tests. MLC results were reproducible within ±10%. Each test was conducted in duplication. Limiting oxygen index (LOI) was determined according to ASTM 2863 standard using FTT-oxygen-index equipment (Fire testing technology, UK) and samples of dimensions 75 × 6.5 × 3 mm3. Underwriters laboratory vertical flammability tests (UL-94-V) according to ASTM D 3801 standards was also used in classifying fire using samples of dimensions 127 × 12.7 × 3 mm3.
Results and discussion
Arc resistance
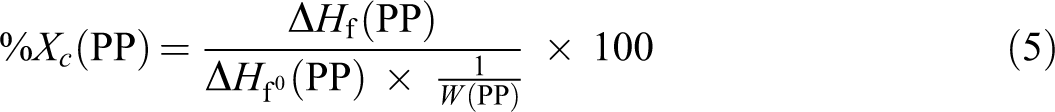
Figure 1 demonstrates the arc resistance of samples. Results reveal that arc resistance minimized up to 20% of kenaf flour loading in PP matrix. The treated rice husk expressed an increase in arc resistance unlike the untreated samples. This is attributed to the compatibility existing between the nanofiller, the matrix, and treated kenaf flour.
Arc resistance of samples.
Volume and surface resistivity
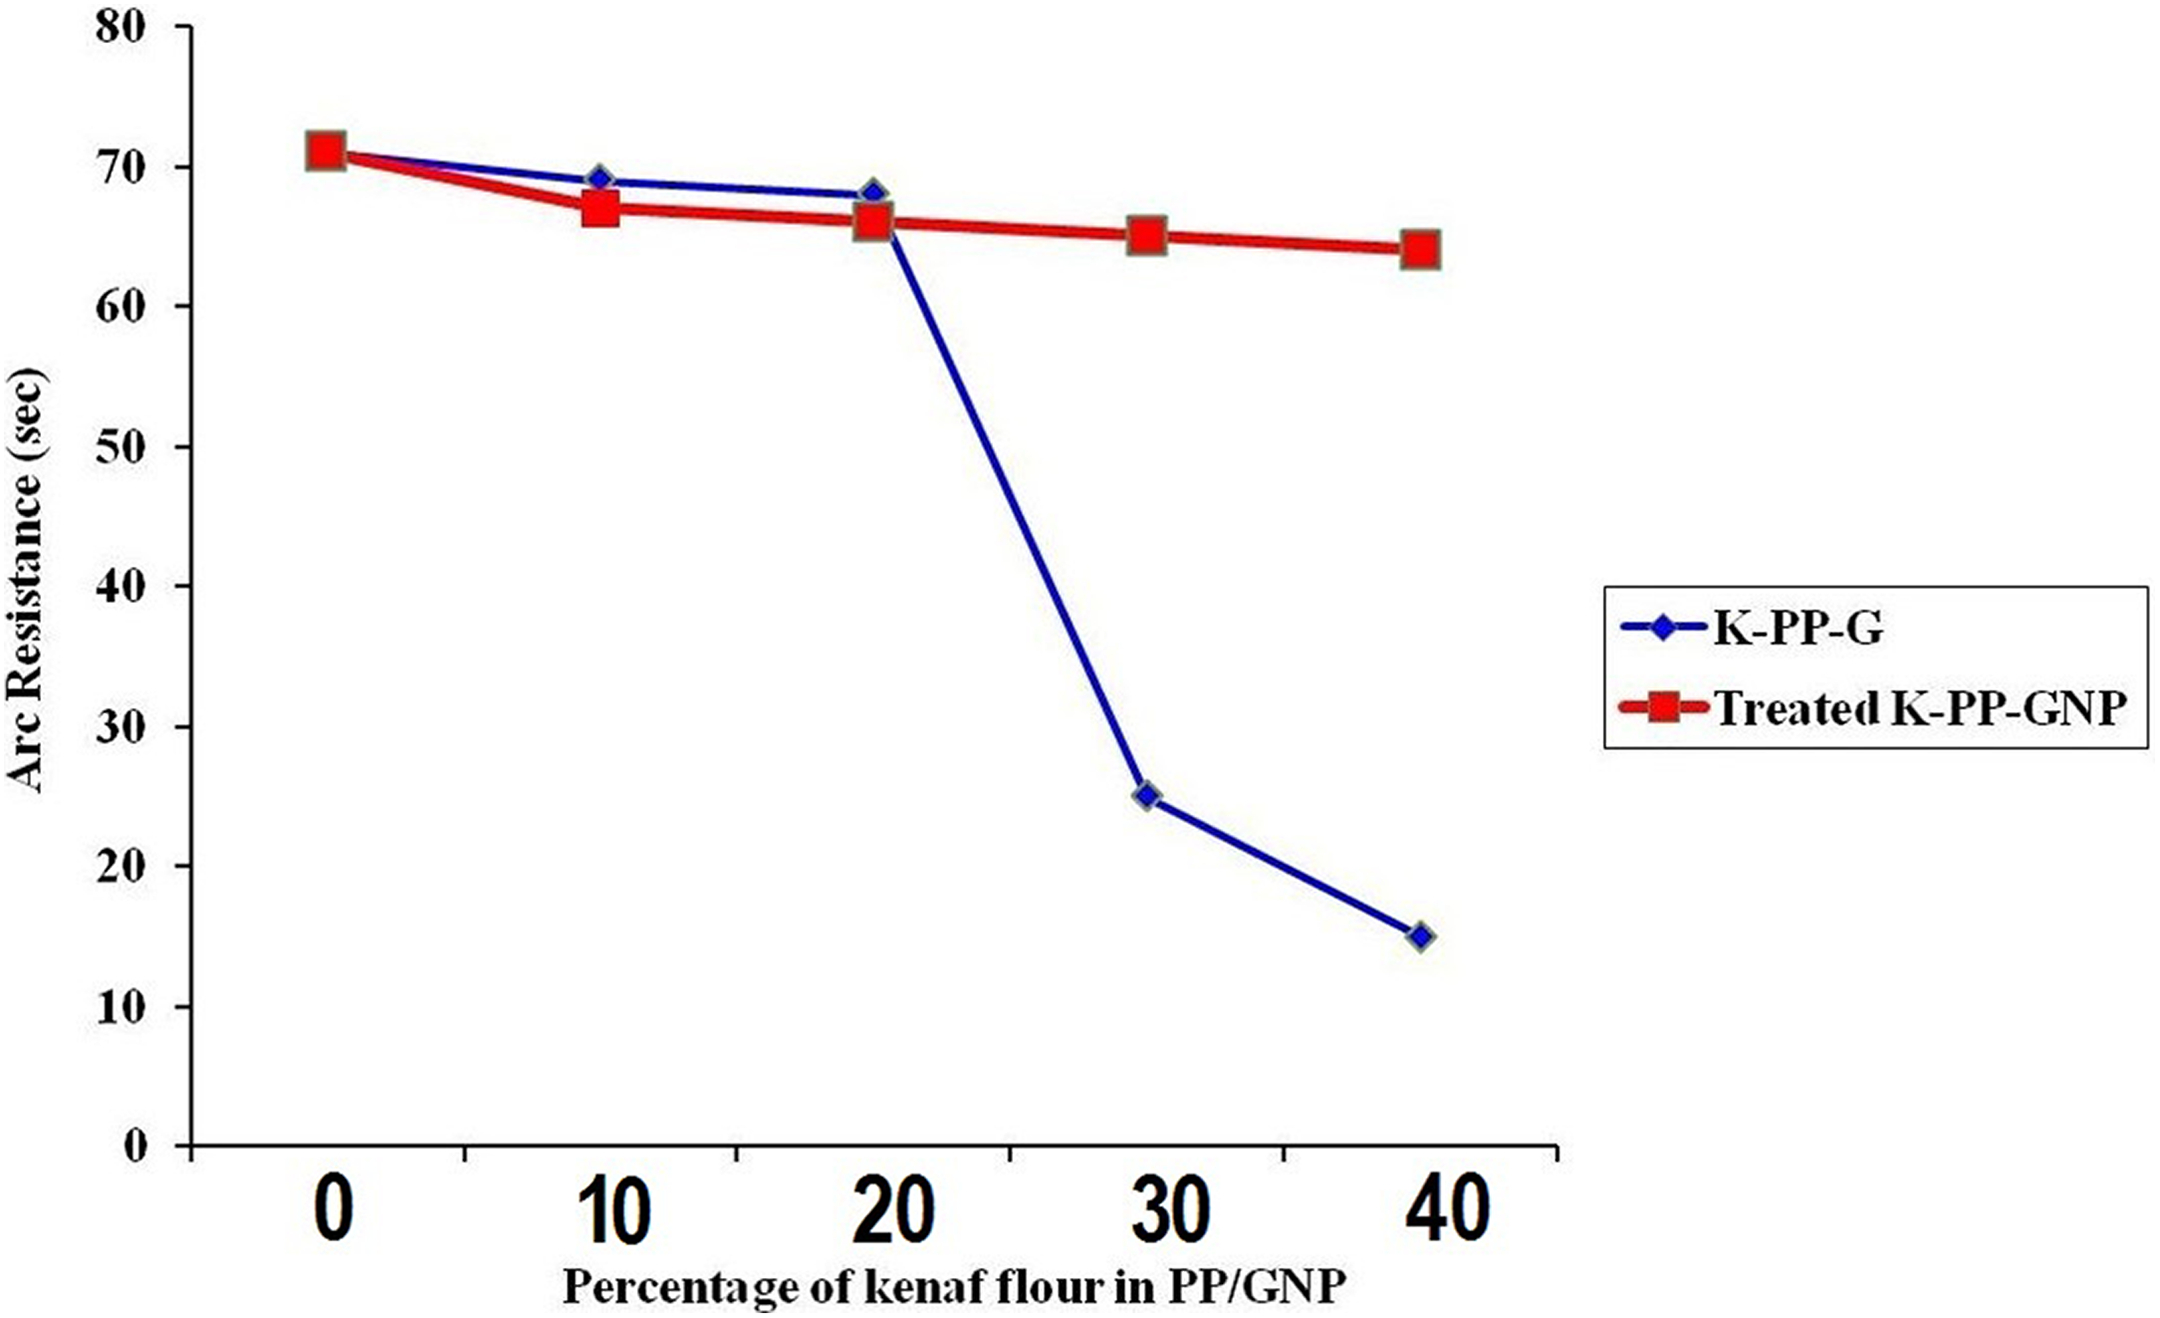
Figure 2 reveals the variation of volume resistivity of kenaf flour PP/GNP nanocomposite with increasing inclusion of kenaf flour. The volume resistivity sharply decreased at 10 wt% kenaf flour loading. Beyond this point, further inclusion did not cause any significant variation in volume resistivity. A similar trend was observed for treated kenaf PP-GNP materials. In this behavior, untreated kenaf flour volume resistivity demonstrated superiority in comparison with treated kenaf PP/GNP nanocomposites. The inherent hydrophilic nature of kenaf flour tended toward absorption of water, though minimized after treatment while increasing 10 wt% kenaf volume resistivity of PP/GNP nanocomposites. GNP assisted in stabilizing the formulation. Further, the inclusion of treated kenaf in nanocomposites resulted in minimization of resistivity as result of increment in ionic concentration due to esterification.
Volume resistivity.
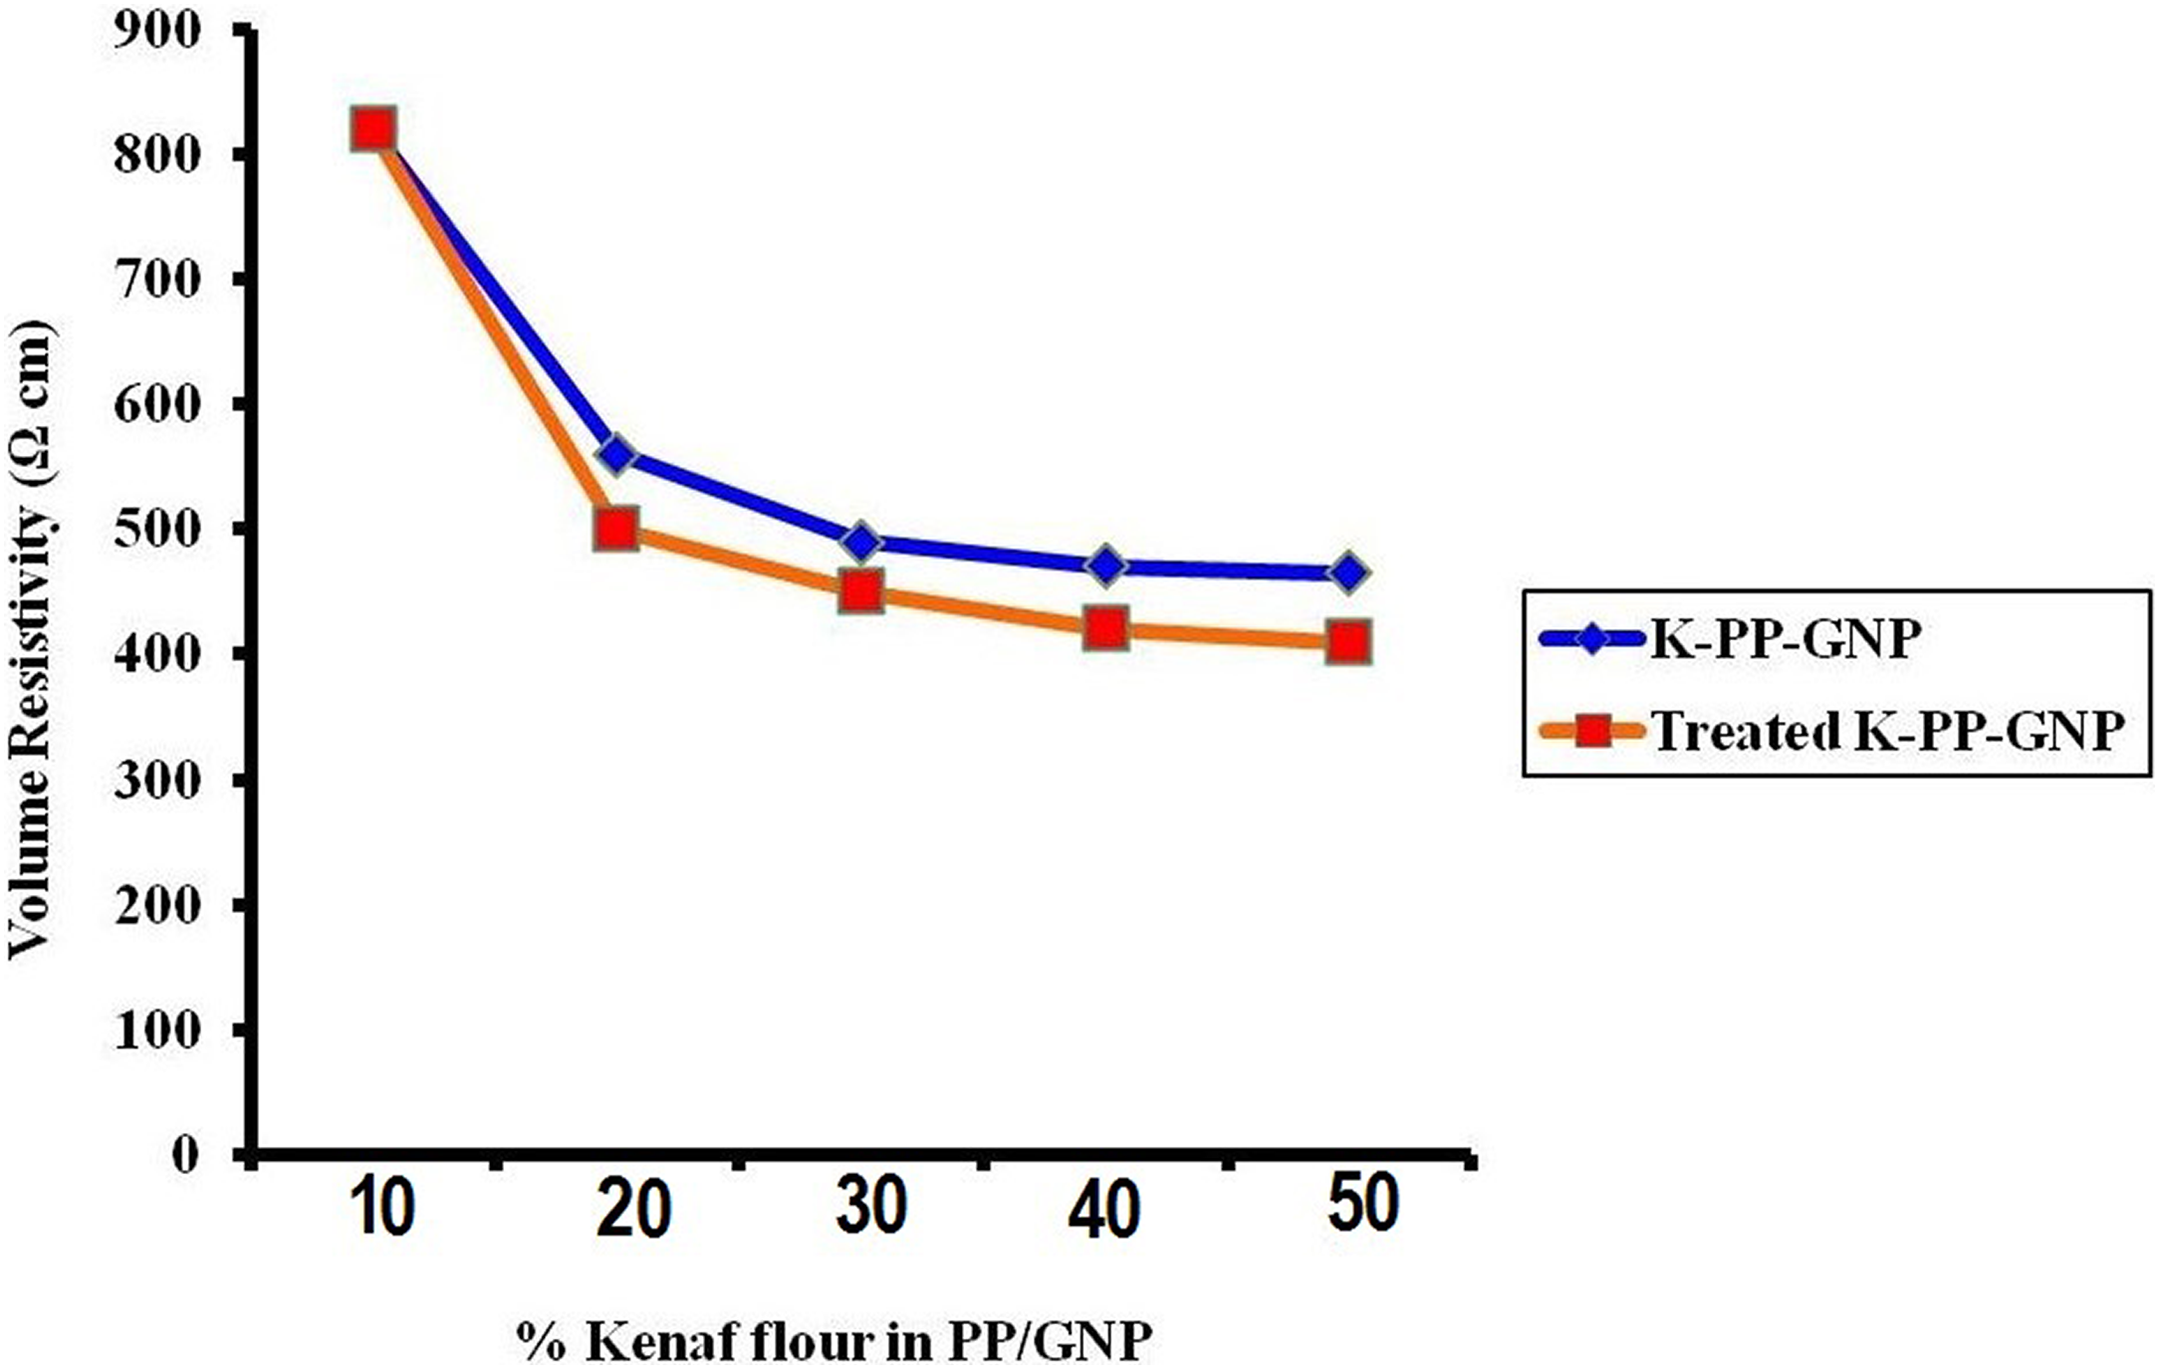
Figure 3 reveals the surface resistivity dependence of kenaf flour concentration in PP/GNP nanocomposites. Surface resistivity minimized with increasing the inclusion of both treated and untreated kenaf flour in PP/GNP. This behavior is ascribed to the presence of extraneous materials and moisture on the surface of the fiber. Kenaf flour is an agricultural product and its chemical constitution is function of the cellulose type and percentage. Though restrained largely by GNP, cellulose has affinity to moisture absorption, thus increasing the inclusion of kenaf flour in PP matrix enhanced affinity to moisture absorption resulting in reduced surface resistivity.
Surface resistivity.
Vicat softening temperature
Figure 4 expresses the occurring changes in Vicat softening temperature (VST) of treated and untreated kenaf flour PP/GNP nanocomposites. The inclusion of 20% kenaf flour maintained VST. However, further inclusion of kenaf flour in PP/GNP slightly increased VST in both scenarios. From the foregoing result, it can be deduced that treatment of kenaf flour does not affect the thermal deformation behavior of the nanocomposites.
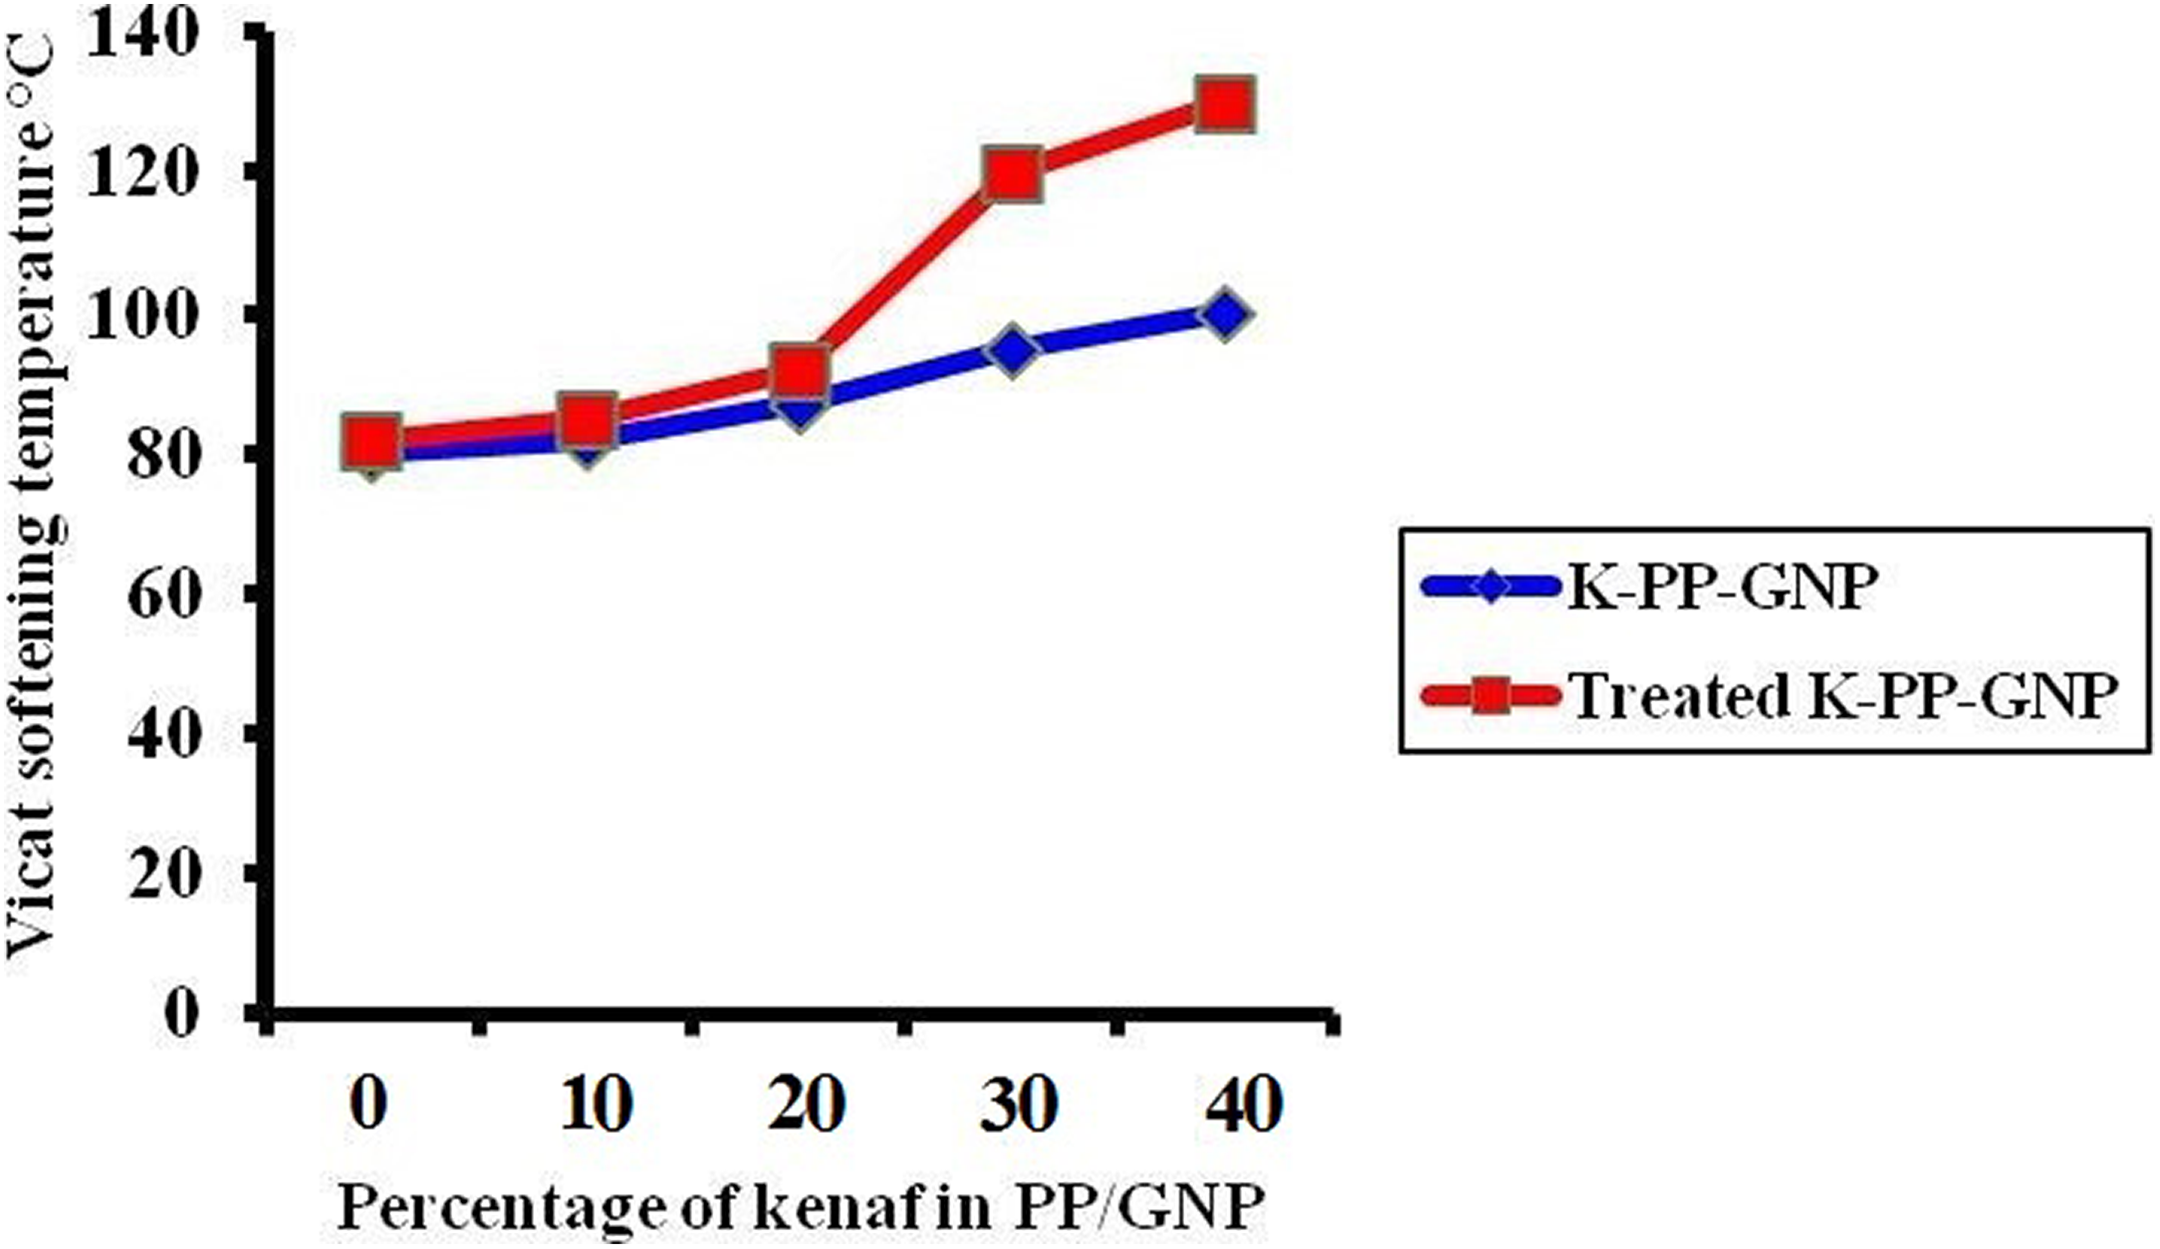
Vicat softening temperature of nanocomposites.
Thermal conductivity
The thermal conductivity of polymer nanocomposites is mainly influenced by two main parameters including lattice phonon gyration and heat transfer of electrons. 16,17 The influence of increasing concentration of treated and untreated kenaf flour on PP/GNP is shown in Figure 5.
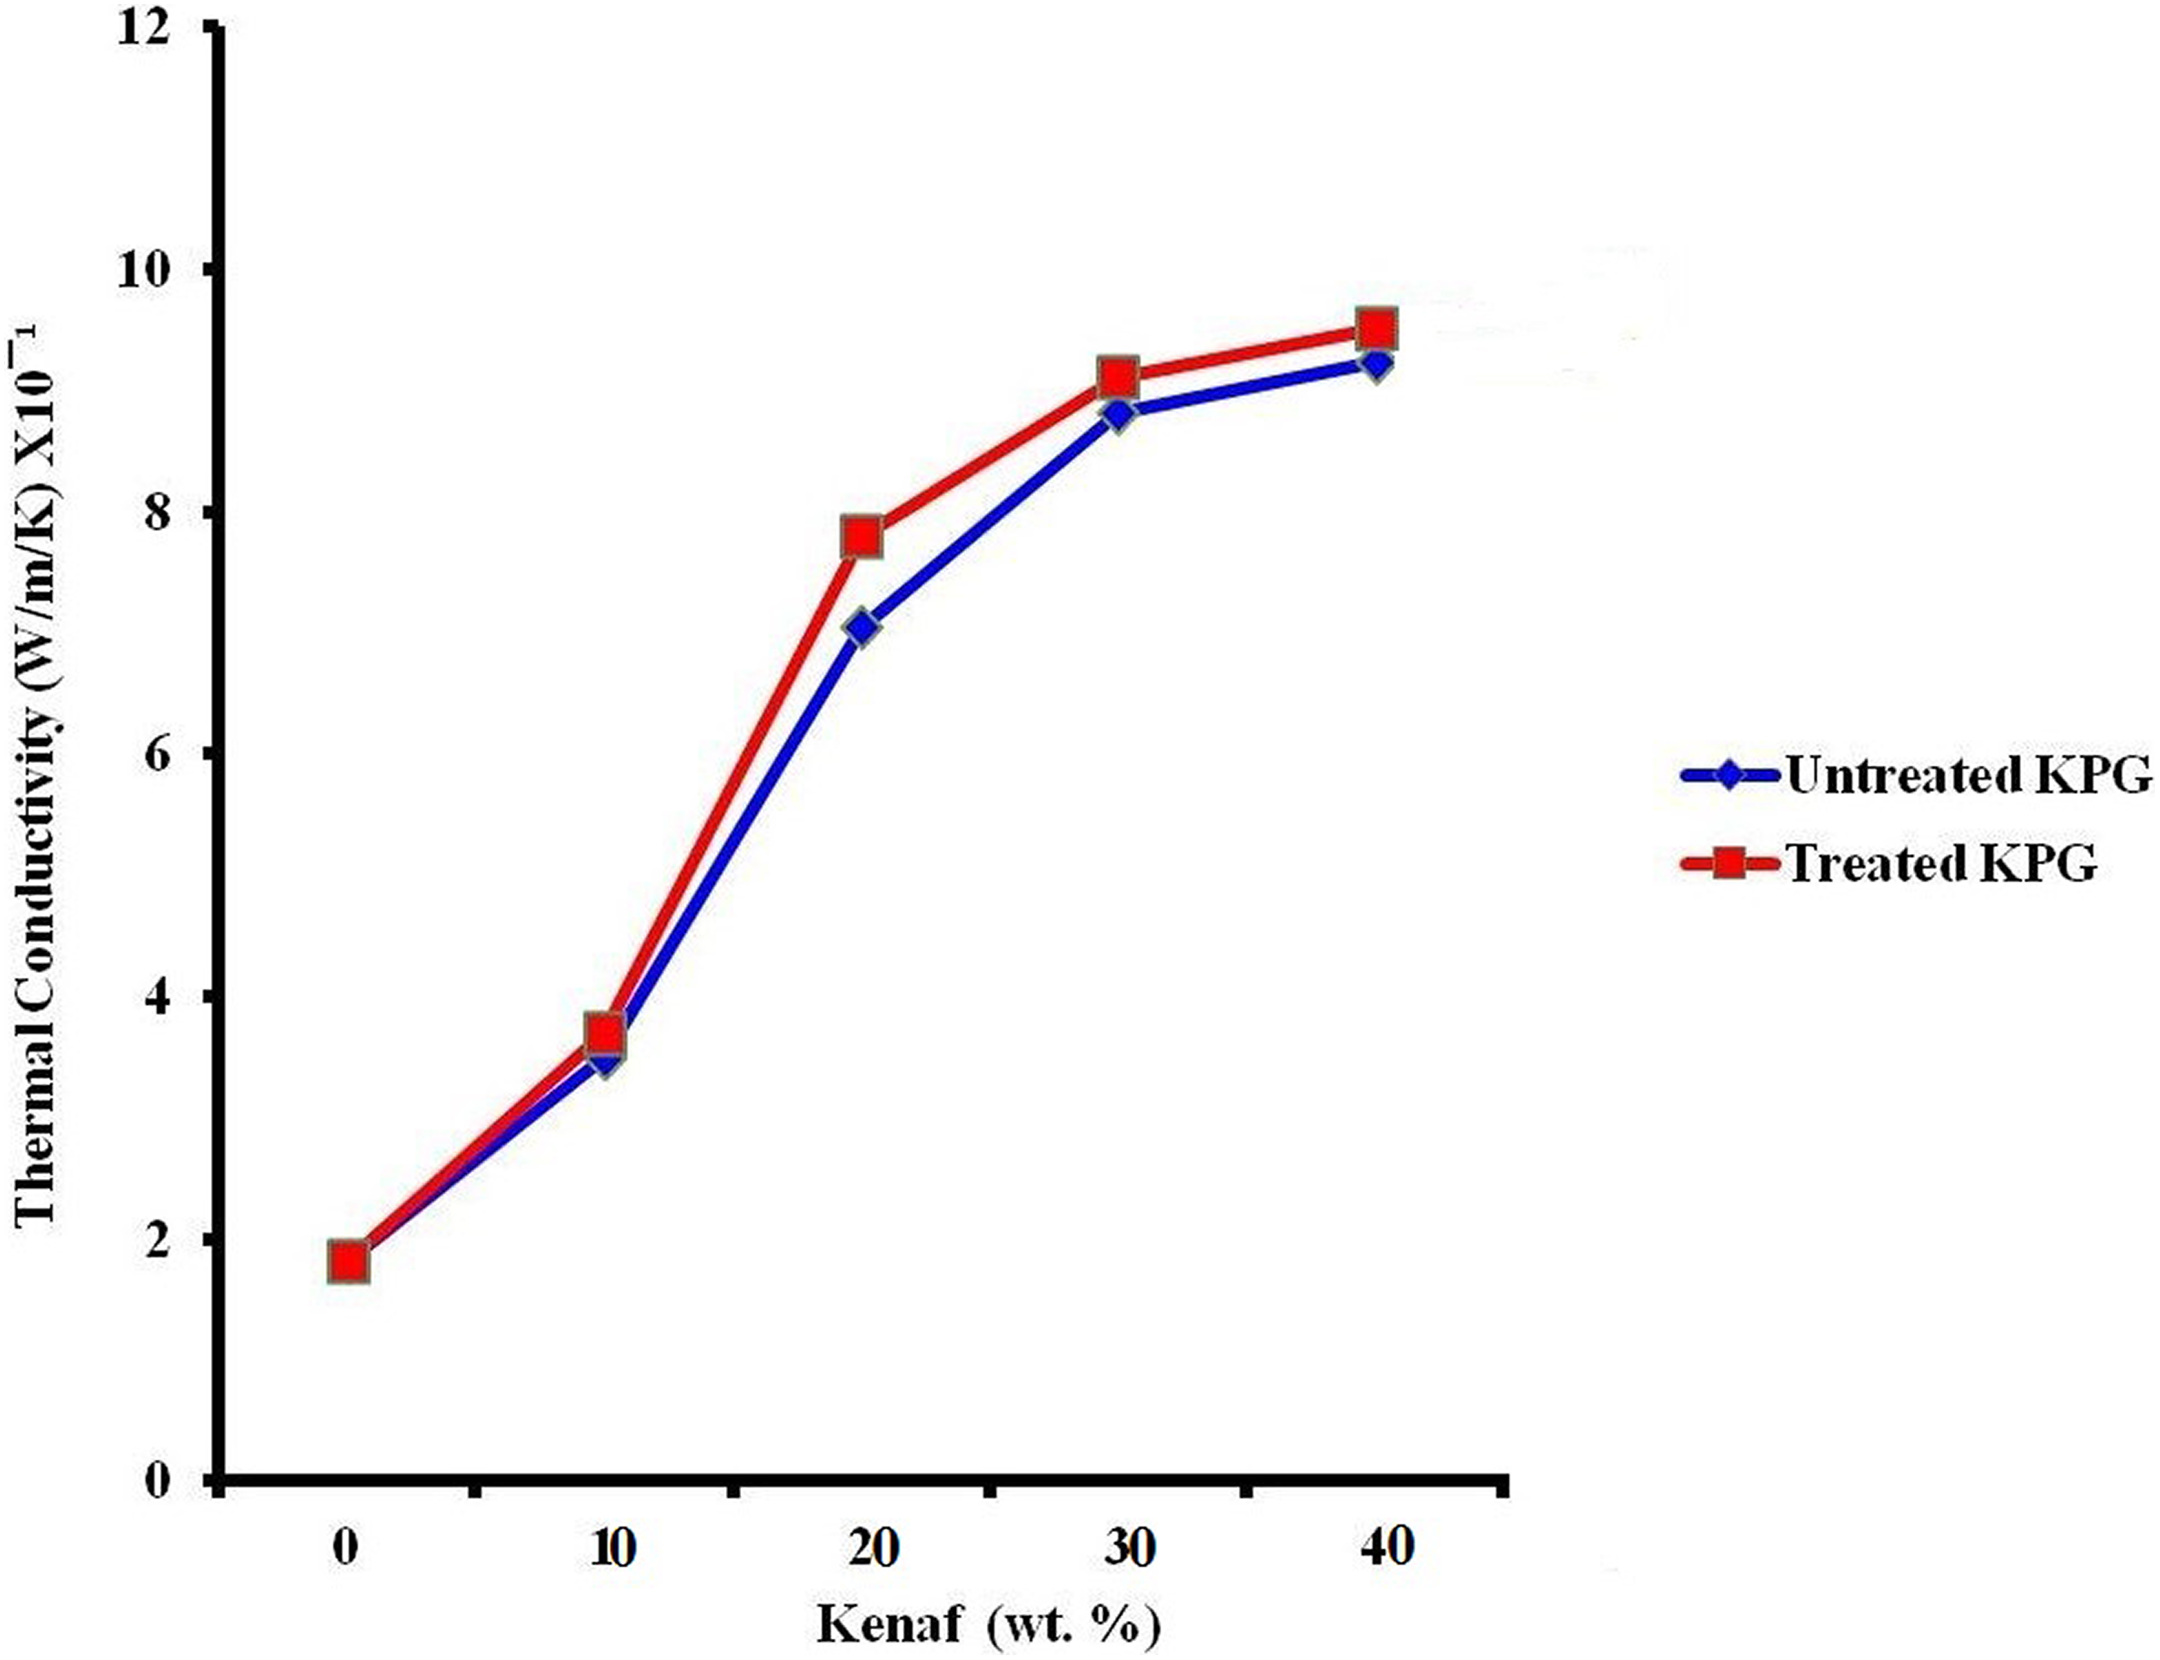
Thermal conductivity of untreated and treated KPG nanocomposites.
Results implied that GNP strongly influenced thermal conductivity of the nanocomposites. The thermal dissipation increased from 1.80 × 10⁻¹ W m−1·K−1 for pristine PP to 9.8 × 10⁻¹ W m−1·K−1 for treated Polpropylene kenaf graphene nanocomposite (KPG) nanocomposites and 9.6 × 10⁻¹ W m−1·K−1 for untreated KPG, respectively. This shows an increase of about 80%. Hence, from the foregoing discussion, it can be concluded that the synergy of GNP-kenaf flour is effective for improving heat dissipation for both treated and untreated kenaf flour–filled polymer nanocomposites. This improvement is attributed to GNPs with intrinsic thermal conductivity in range of 3000–5000 W m−1·K−1 which absorbed the fiber forming a conductive pathway through the material. 17 Similar behaviors have been demonstrated in recent studies. 6,18,19
Heat deflection temperature
The HDT of hybrid treated and untreated KPG nanocomposites is shown in Figure 6.
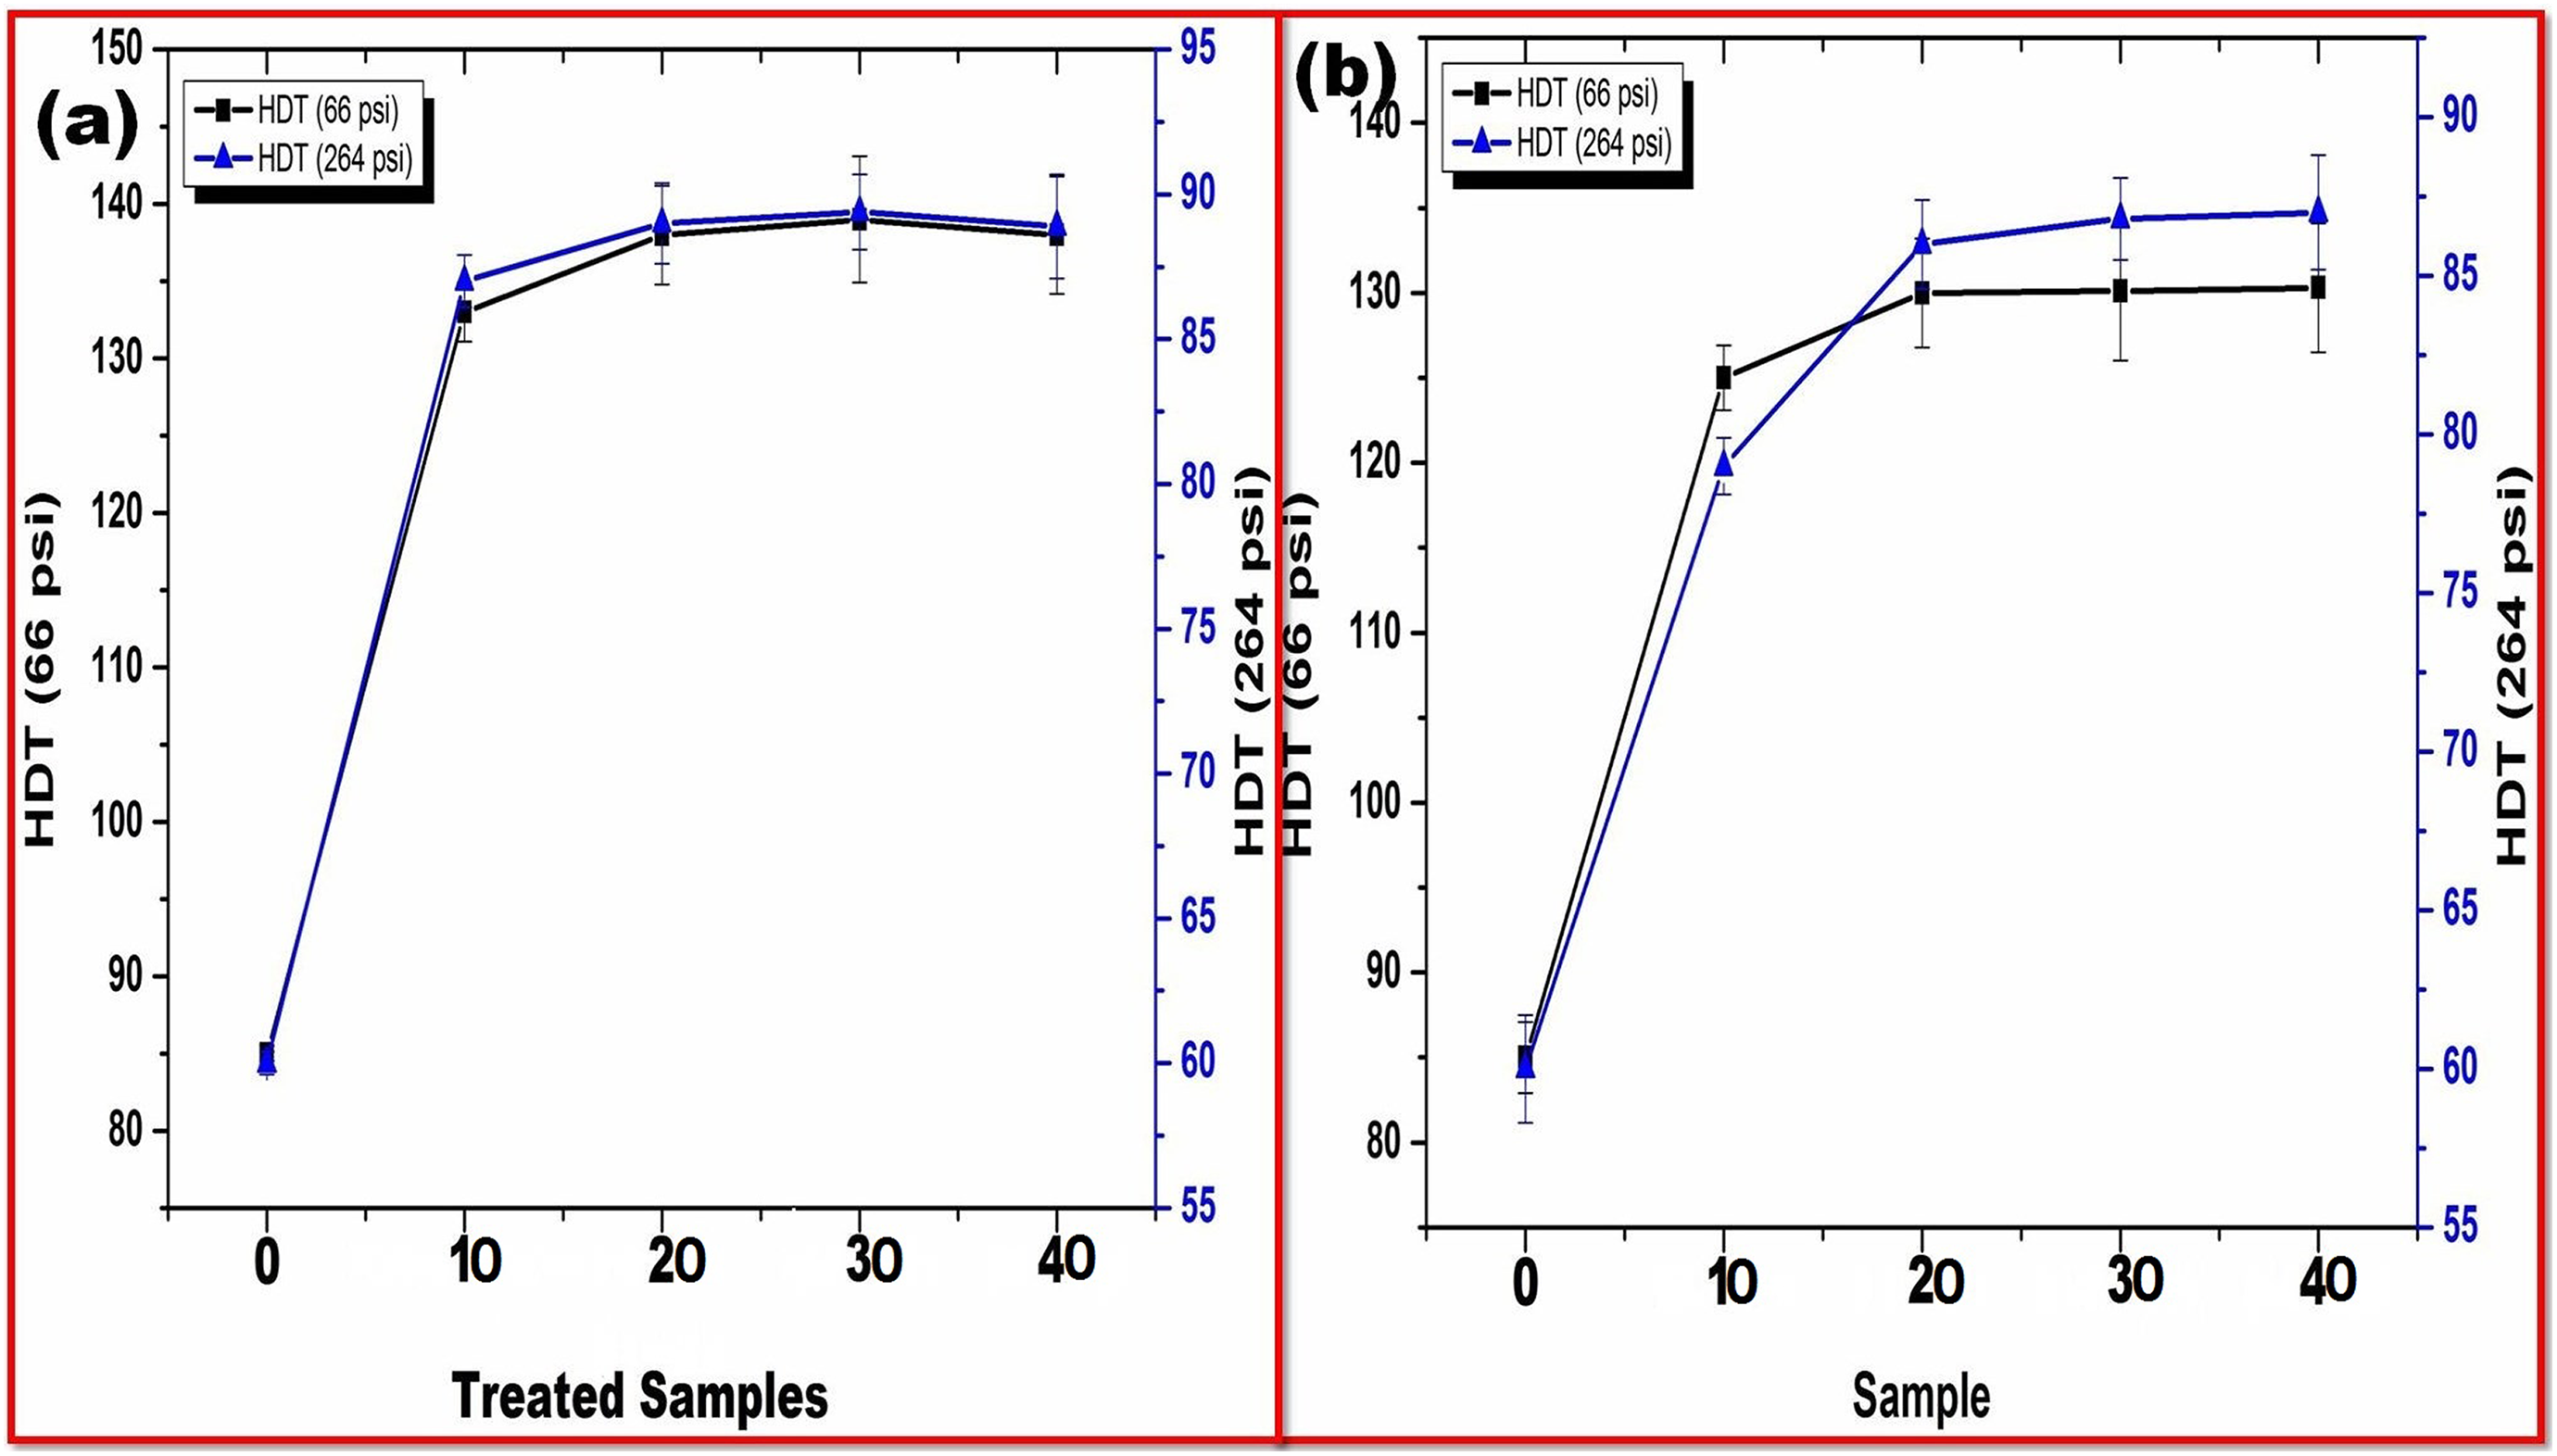
HDT of (a) treated and (b) untreated KPG nanocomposites.
Usually, HDT expresses materials propensity to maintain specific loads at increasing temperatures. It is the temperature at which composite materials with a specific loading and bending force is deflected by 0.010 in or 0.25 mm. HDT is also recognized as deflection temperature under load or heat distortion temperature. According to ASTM D 648, two varying loads of 0.46 MPa (66 psi) and 1.8 MPa (264 psi) are applied. The HDT graph in Figure 6 demonstrates the relative service behavior of the nanocomposites when employed as high temperature load-bearing components.
From Figure 6(a) with regard to 0.46 MPa (66 psi) loading of treated hybrid nanocomposites, HDT steadily improved from 85°C of pristine PP to 133°C at 10 wt% inclusion of treated kenaf. On inclusion of 20 wt%, HDT increased to 138°C which later increased to 139 and 138°C, respectively. In comparison with pristine PP, this is about 36, 38, 39, and 38% increases, respectively. This is attributed specially to synergy attained between treated kenaf flour and GNP in addition to superior thermal and high modulus of graphene at 1000 MPa. This is also ascribed to the interconnectivity and the tortuosity effect, high melting temperature, and high modulus of GNP. It is perceived that the inclusion of GNP and kenaf fibers resulted in restraining of PP macromolecular chain. From Figure 6(b), it was observed that treated kenaf expressed slight superiority in comparison with untreated KPG. Generally, polymer macromolecular chain motion was increasingly restrained by nanofiller inclusion resulting in improved HDT of nanocomposite systems. 20,21
FESEM analysis
Analyses of the surface topography of polymer nanocomposites have elucidated the degree of nanofiller distribution in polymer matrices. Figure 7(a) and (b) reflects typical FESEM micrographs of treated and untreated KPG nanocomposites.
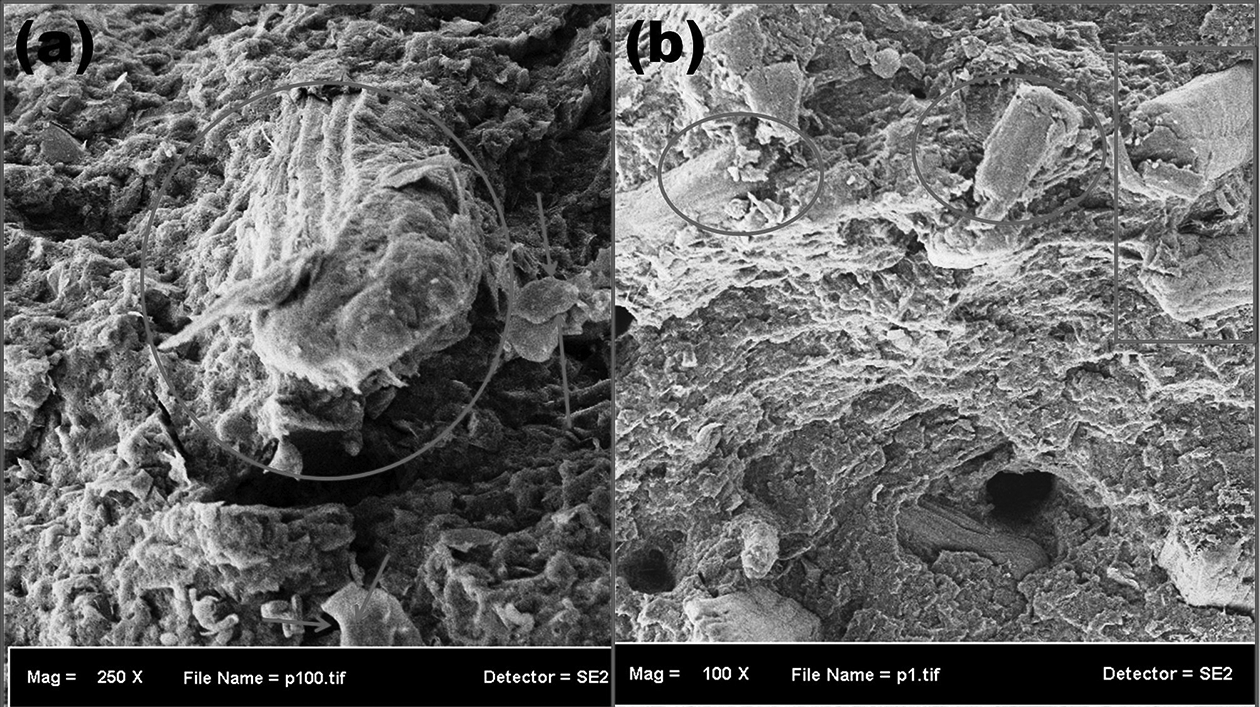
(a) Treated KPG and (b) untreated KPG nanocomposites.
From Figure 7(a) and (b), exfoliation of GNP is observed amidst kenaf fibers as depicted by grey arrows and circles, respectively. Homogeneous distribution of GNP flakes can easily be sighted with kenaf fiber pullout.
TEM assessment
Typical TEM micrographs are obtained from samples to gain elucidated comprehension of the degree of attained homogeneity in distribution of nanoplatelets and fillers in matrix. TEM technique is a dependable method for assessing the dispersion of nanofillers in polymer matrix. The properties of nanoparticle filled nanocomposites depend on the degree of nanoparticle dispersion in polymer matrix, and this determines their efficiency at improving nanocomposite properties such as thermal, electrical, and mechanical properties. Typical dispersion states found in the nanocomposites are shown in TEM micrographs in Figure 8(a) and (b) for treated and untreated KPG nanocomposites.
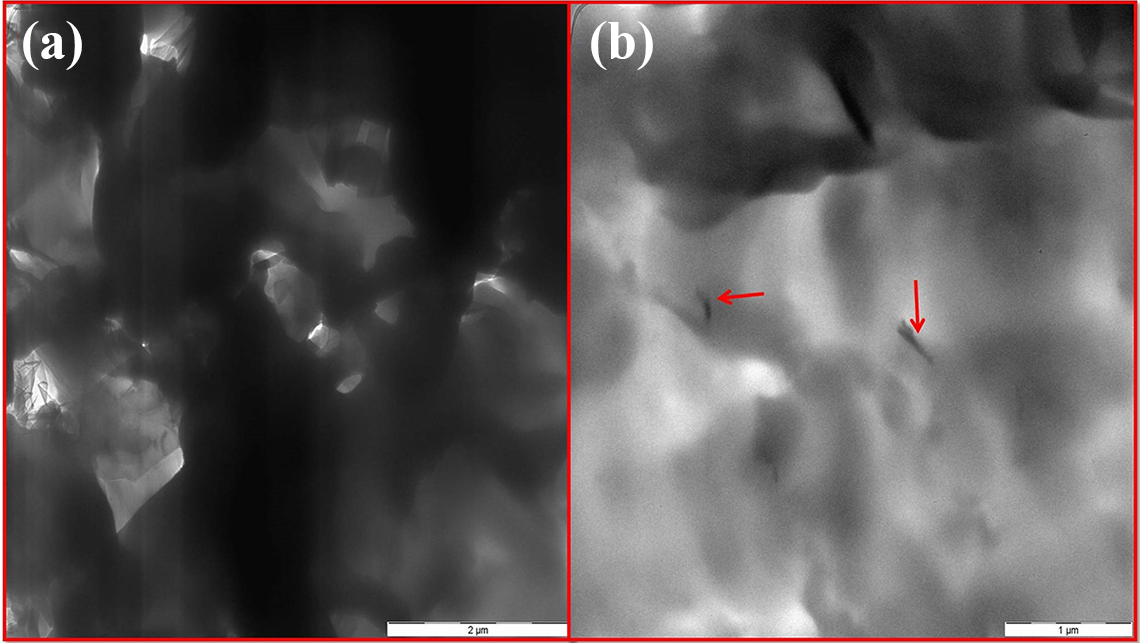
TEM micrographs of (a) treated KGP (b) untreated KGP nanocomposites.
In Figure 8(a), the interconnectivity of GNP sheets in treated kenaf materials apparently can be observed in the matrix exhibiting an overlap of graphene sheets over each other. The interconnective microstructure is very efficient at improving properties of nanocomposites such as fire retardancy and heat dissipation. Although the excess shearing did not result in fragmentation of the sheets, it promoted a high degree of homogenous distribution of nanoparticles. In Figure 8(b), careful perusal reveals exfoliated graphene sheets and the interaction of GNP with the polymer matrix especially MAPP. The folding of the off-plane graphene sheets as depicted by arrows can be observed engulfed by the matrix as represented by the hazy gray surrounding with enhanced bonding by the compatibilizer. MAPP enhanced homogeneous distribution of nanofillers in polymer matrices thereby promoting the enhancement of wear and toughness mechanism of the matrix due to effective mingling with matrix. Extruder shear compounding results in wrinkling and crumpling of exfoliated single layers of graphene sheets because of the thin thickness of graphene particles as shown in Figure 8(b).
Thermal degradation analysis
The thermogravimetric curves and derivative thermogravimetric curves of pristine PP and treated and untreated KPG nanocomposites are shown in Figure 9(a) and (b), respectively.
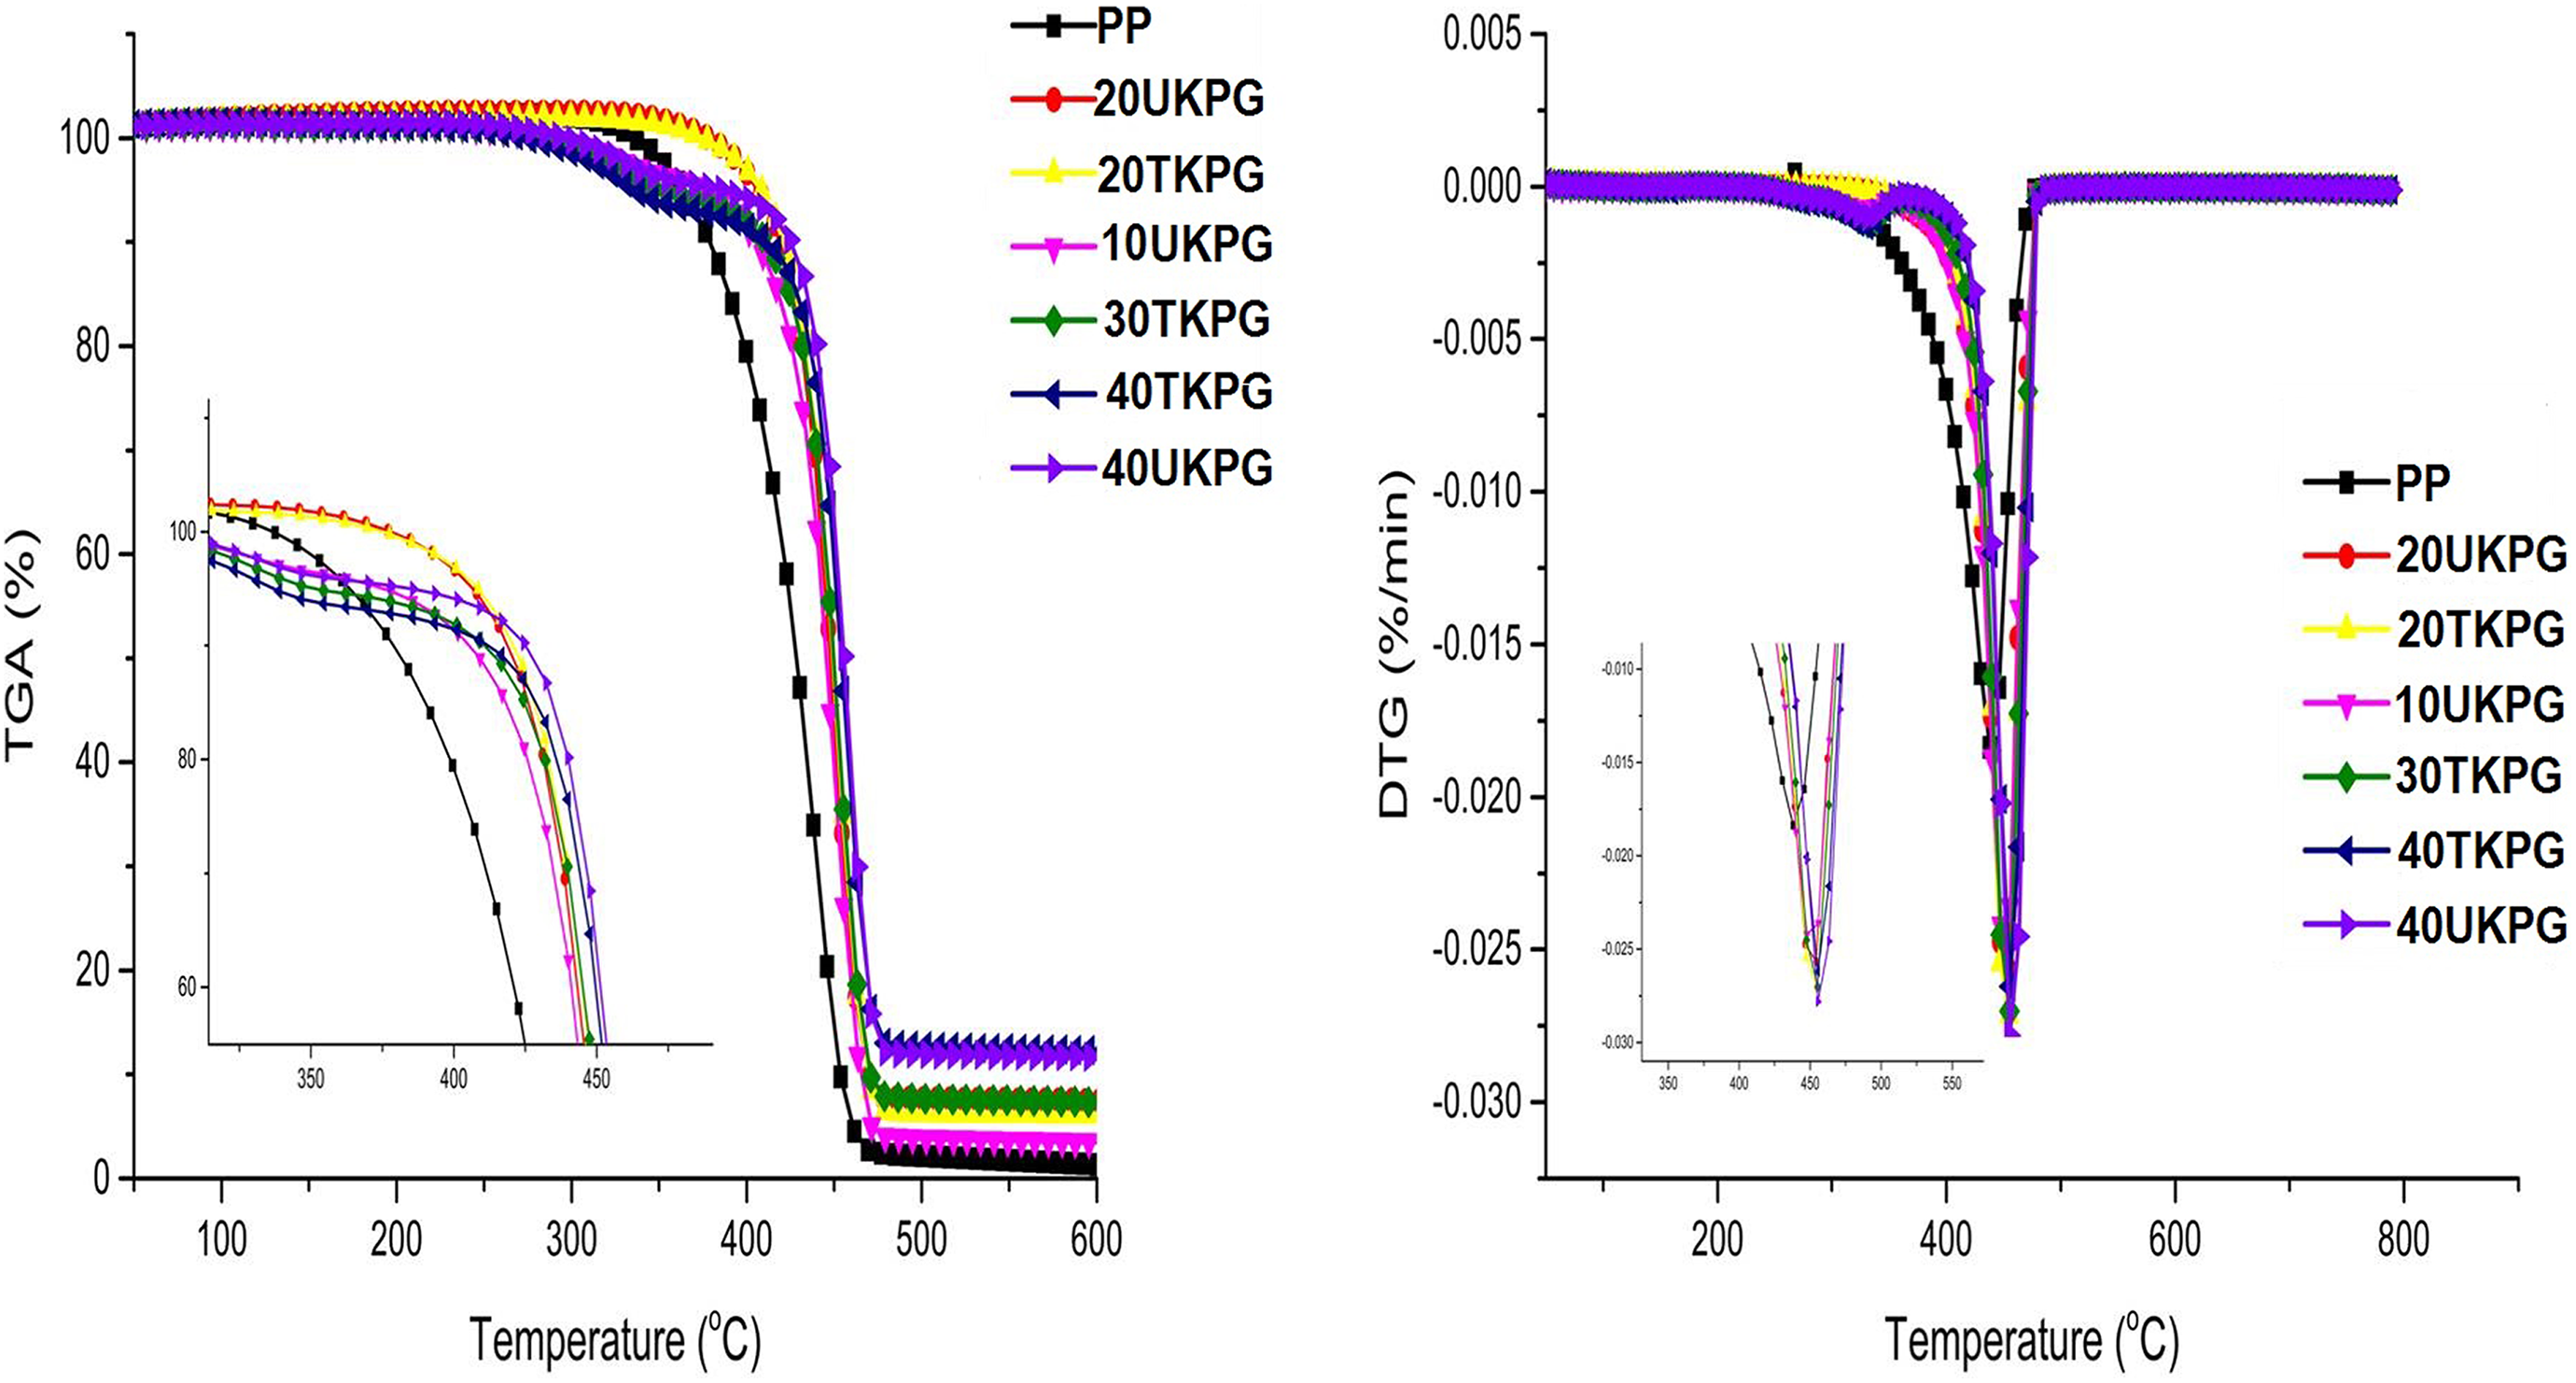
(a) TGA and (b) DTG curves of treated and untreated nanocomposites.
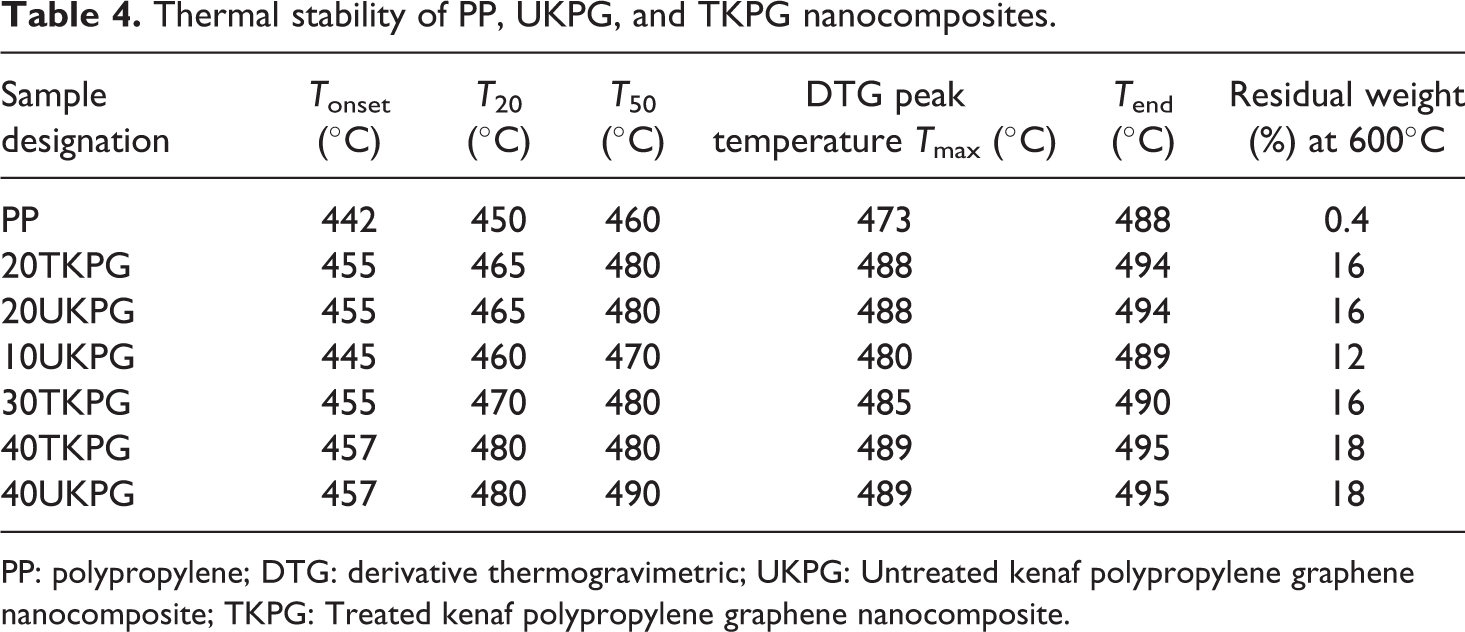
TGA is used in the measurement of the amount and rate (velocity) change in mass of a sample as a function of temperature or time in a predetermined atmosphere. TGA provides important information that can enable selection of suitable materials for specific end use application, enhance quality of product, and predict performance of product. The fabrication of lignocellulose fiber-based plastic nanocomposites entails compounding of fibers at high temperatures. This is capable of thermally degrading fibers and inducing inferior properties in the composites. Thermal stability of pristine polymer and treated and untreated composites was studied under nitrogen atmosphere. In all studied specimens, weight losses occurred around 100°C due to loss of moisture. The thermal decomposition of all materials exhibited a single-step thermal decomposition procedure implying efficient compatibilization of the composites. The results reveal influence of increasing inclusion of treated and untreated kenaf flour on the thermal stability of KPG hybrid nanocomposites. From Table 4, T 20 and T 50 including the maximum decomposition temperatures T max are notably high for all the composites containing GNP compared to pristine PP. Interestingly, the 40 wt% treated and untreated fibers exhibited the highest thermal stability. This trend has also been reported in some similar studies 22 –24 and ascribed to high fiber content and high aspect ratio of GNP which serve as a protective barrier inhibiting the emission of gaseous molecules during thermal decomposition and the homogenous and uniform distribution of GNP. Evenly distributed GNP inhibited the supply of oxygen through the formation of charring layers on the composites surface, thereby improving the thermal stability. The highest amount of char residue was also observed at this threshold. A similar report was observed in another study. 24 This implies that the thermal stability of nanocomposites was enhanced by the inclusion of GNP.
Thermal stability of PP, UKPG, and TKPG nanocomposites.
PP: polypropylene; DTG: derivative thermogravimetric; UKPG: Untreated kenaf polypropylene graphene nanocomposite; TKPG: Treated kenaf polypropylene graphene nanocomposite.
FTIR analysis
The samples were analyzed using FTIR in order to enable the observation of any occurring chemical changes. Figure 10 displays the FTIR spectra of KPG nanocomposites.
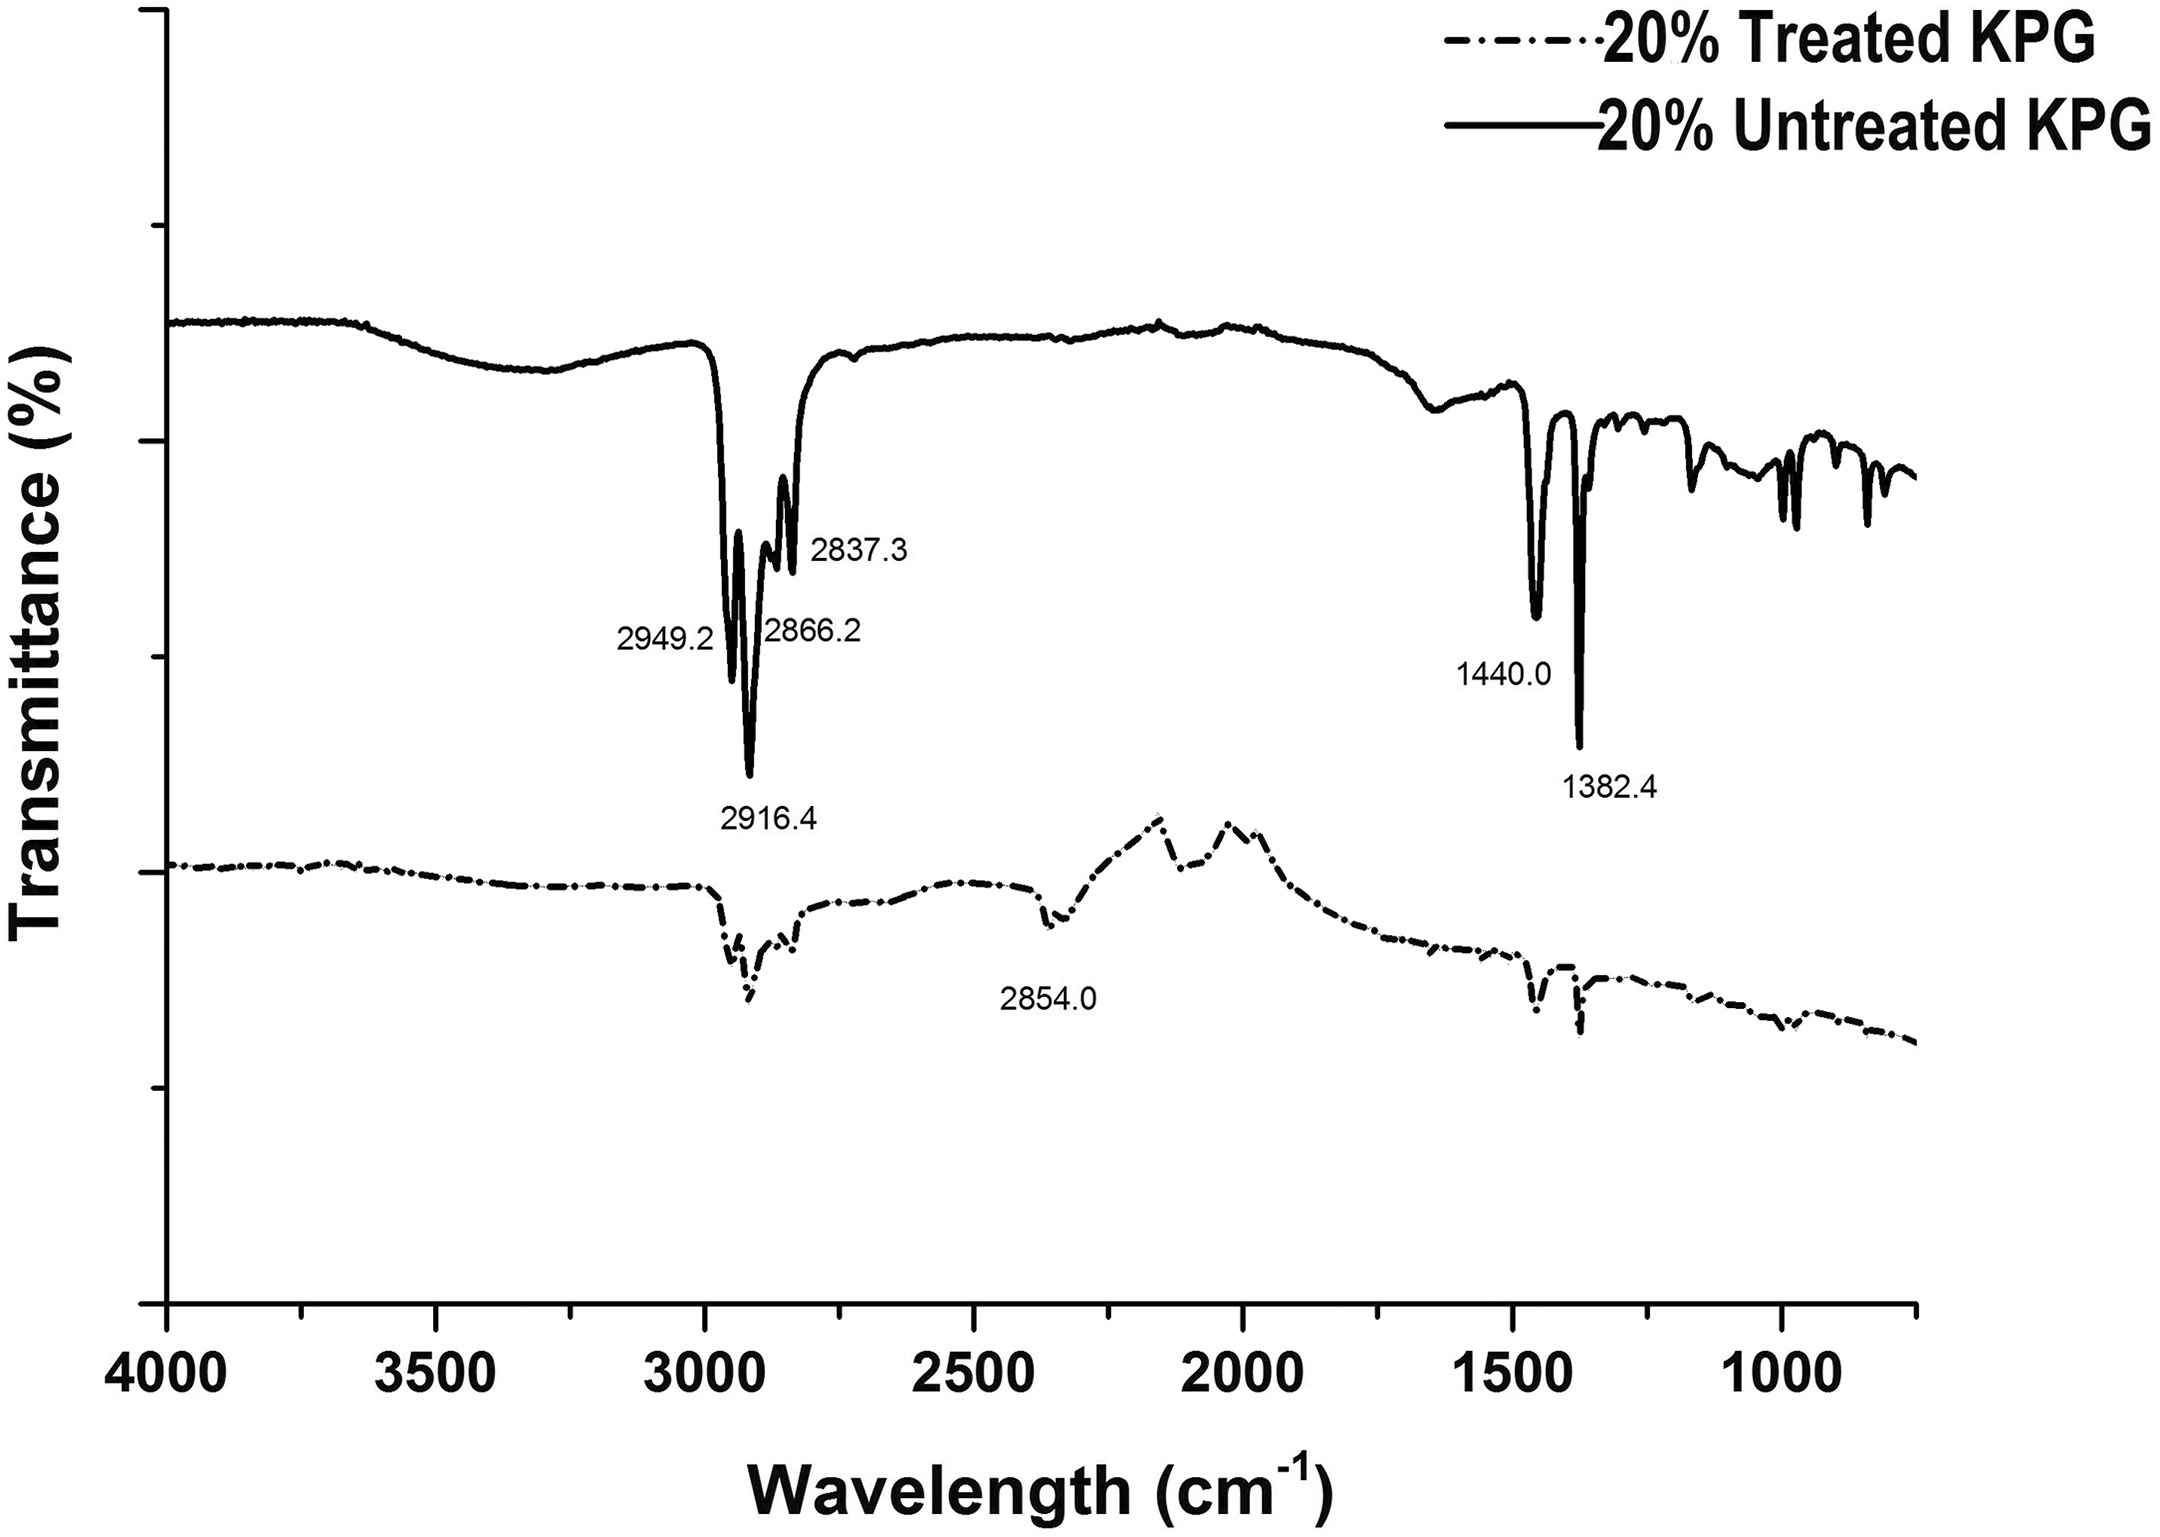
FTIR spectra of KPG nanocomposites.
In the spectrum of exfoliated graphene nanoplatelets (xGNP), no visible peaks were observed. The FTIR spectra data of the sample reveal the presence of various linkages such as ester group, carboxylic acids, oleifinic double bonds, and other characteristic peaks. The peaks at 800 cm−1 are ascribed to C–H outer bending vibration, and C–H in-plane bending and out-of-plane wagging 6 while peaks at 977.12–997.2 cm−1 are attributed to the strong C–H and O–H bending of carboxylic acids. The peak absorptions at 1375.2 cm−1 are the medium C–H rock vibrations of alkanes. 25 The characteristic absorption peaks at 1456 cm−1 represent the C–H bending vibrations of alkenes, while 1558 cm−1 represents the strong intensity of C=C stretch vibration of aldehydes functional groups. The biocomposite peak at 1560 cm−1 represents C–C–C symmetric stretching while the peak at 1653 cm−1 represents the keto form stretching frequency of C=O. The low absorption peaks at 1774 and 1778 cm−1 are assigned to the symmetric C=O stretching of MA functional groups on MA-g-PP indicating that functional groups of MA reacted with the hydroxyl group of kenaf in KPG nanocomposites forming covalent bond and esterification reaction. 26 The peaks are characteristics of the diametric form of a dicarbonylic acid and cyclic anhydride. This is confirmed by low stretching vibration of ester carbonyl groups (C=O) between 1741 cm−1 and 1739 cm−1 which have resulted in the esterification reaction between free OH groups of kenaf fiber and the MA functional groups of MA-g-PP. Thus, ester bonding in the hybrid nanocomposites provided better wettability and dispersion which enhanced mechanical and thermal properties. The band at 2360.87 represents the medium intensity of carboxylic O–H stretching vibration while the bands between 2916 cm−1 and 2949.16 cm−1 represent the stretching of the C–H bonds. The absence of graphite and graphite oxide (GO) bands reveals the purity of xGNP used in this study. These characteristic strong graphite and GO peaks are situated at 3400 cm−1 (O–H) stretching vibrations, 1720 cm−1 representing C=O stretching vibrations, 1220 cm−1 representing the C–OH stretching, and 1060 cm−1 representing the C–O stretching. This implies that the interactions occurring between xGNP and kenaf fibers are mainly physical because xGNP has nil polar groups. Similar observations have been reported. Thus, no chemical interaction occurred between the polymer matrix and xGNP due to lack of any structural changes in the composites. Hence, any property improvements in the composites are ascribed to physical interactions between xGNPs and kenaf/MA-g-PP/polymer matrix system which enhanced interfacial adhesion of matrix to xGNP sheets.
X-ray diffraction analysis
X-ray diffraction analysis is usually used in detection of d-spacing between nanofiller crystal planes in polymer, in addition to the level of aggregation or delamination of nanofillers in the polymer matrix. In the present study, XRD revealed dispersion degree and crystallography of hybrid treated and untreated kenaf in PP matrix. Figure 11 displays the XRD characterization of hybrid nanocomposites.
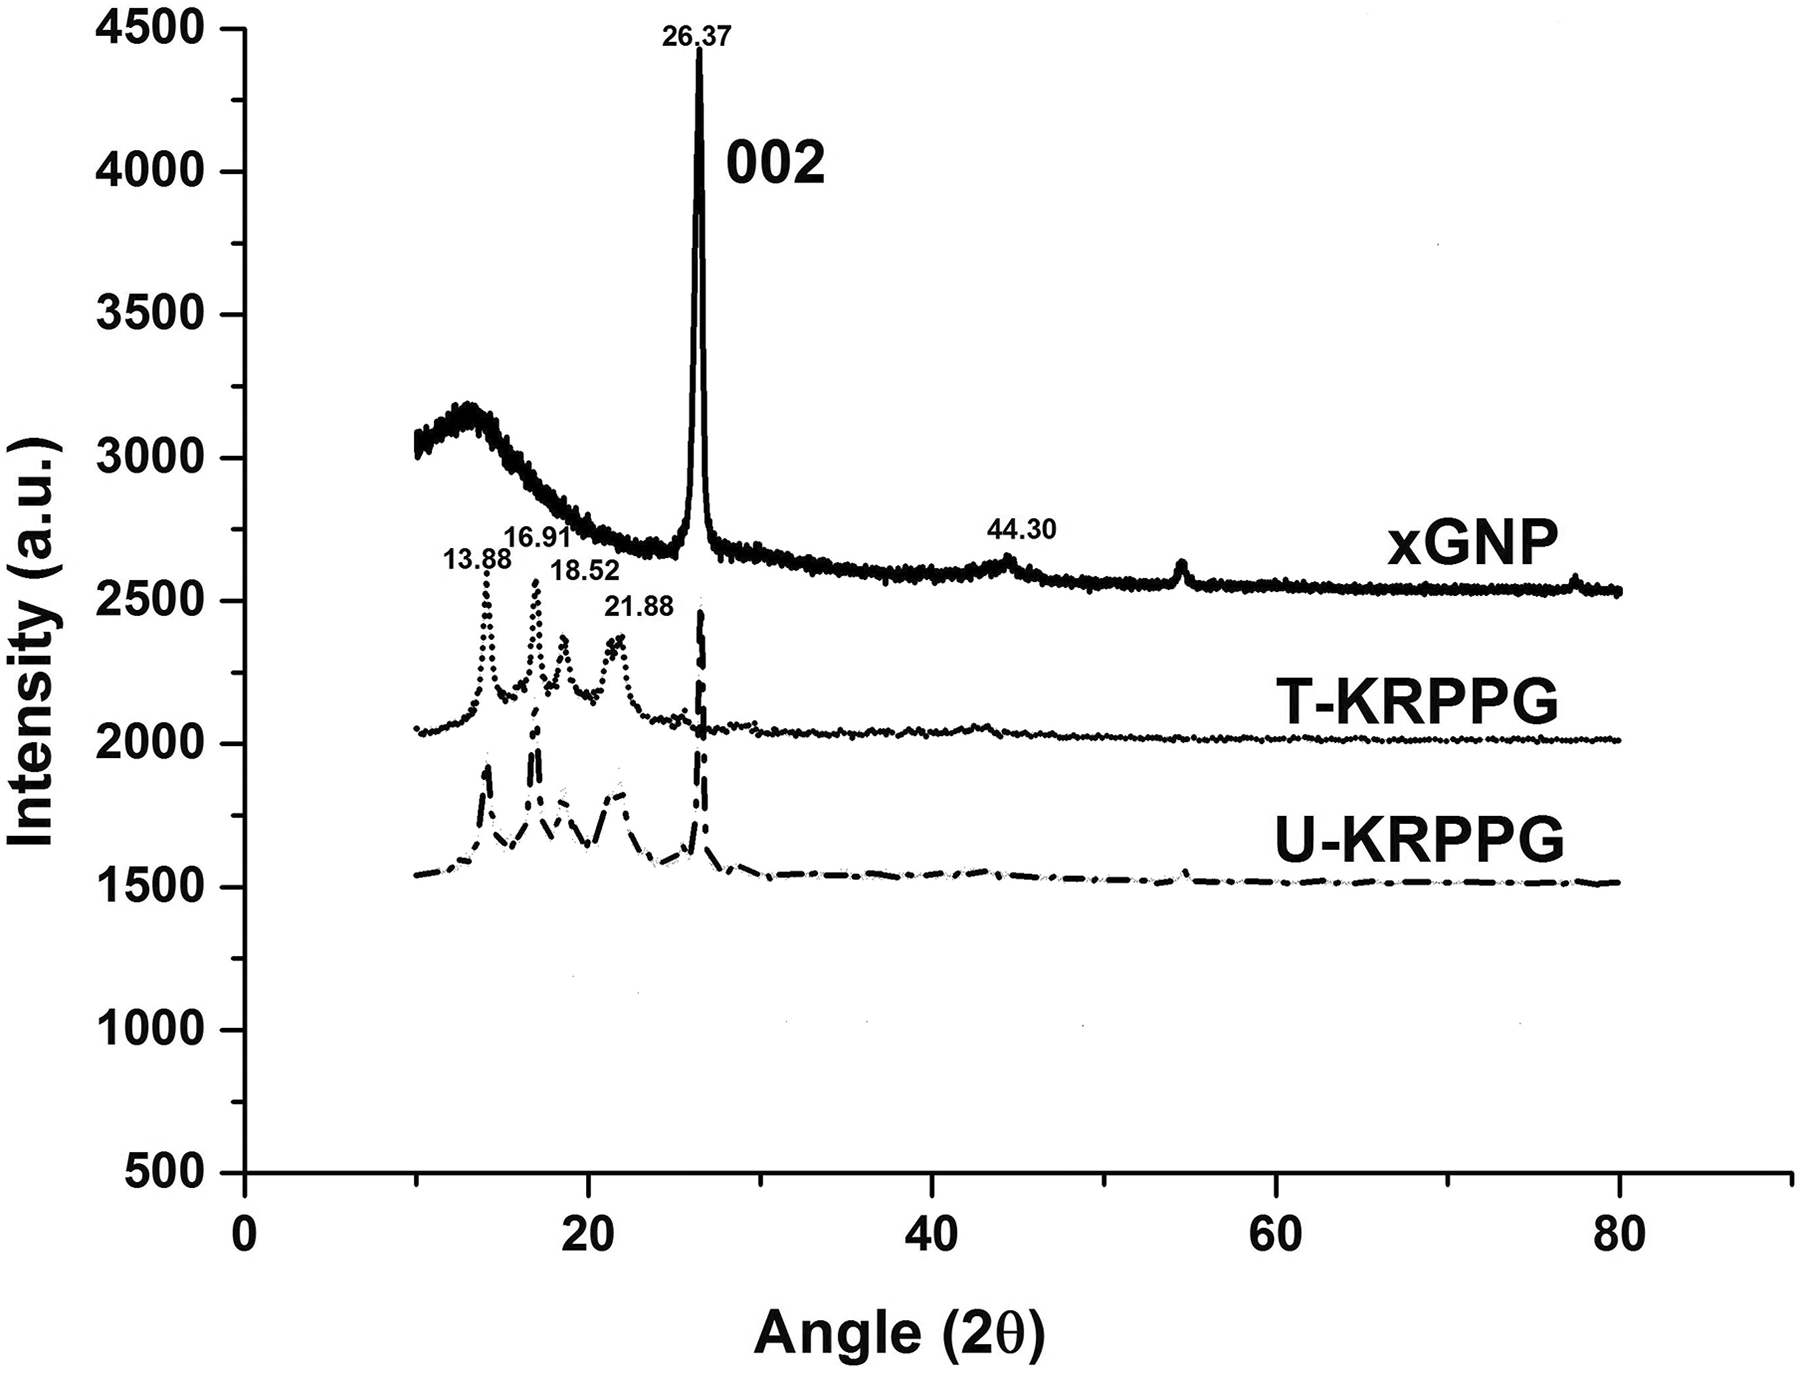
XRD characterization of hybrid nanocomposites.
The crystalline forms of PP commonly present include α-monoclinic, β-hexagonal occurring under specific conditions such as temperature gradients, shearing forces presence, or β-nucleating agents, γ-triclinic, and δ-smectic which is commonly observed in low molecular weight PP. 25 The diffraction pattern characteristic peaks of GNPs exhibited the 2H-graphene characteristic peaks at 26.6 (d = 3.35 Å) and 54.7° (d = 1.68 Å) 2θ for GNP. In graphene spectrum, only the 26.6° (d = 3.35 Å) characteristic peak of graphene is observed in untreated KGP. In treated KGP spectrum, a notable peak is situated at 2θ = 18.4°, in addition to the prominent 2H-characteristic graphene peak at 26.6° (d = 3.35 Å) and 54.7° (d = 1.68 Å) 2θ. In XRD spectrum of pristine PP, four peaks corresponding to the α-form crystals are observed. The presence of GNP induces α-crystals at 2h = 15.6° [110], 21.2° [131], 18.4° [130], 17.1° [040], and 16.95° [040]. Similar observations have been repeated elsewhere. 26 The attained synergism between GNP and both treated and untreated kenaf flour shifted the diffraction curves and a new peak was generated at 2θ = 16° representing the crystal plane of [300] corresponding to β-crystal form. Therefore, we can conclude that both α- and β-crystal forms of PP coexist in KGP nanocomposites. The presence of stronger graphite peaks in nanocomposites is attributed to filler agglomeration and aggregation due to relative distribution and high degree of GNP alignment in hybrid nanocomposites as evidenced by TEM and FESEM images. This is in addition to filler–filler interaction due to unavailability of encapsulating polymer for a perfectly homogeneous dispersion of GNP and fibers as shown in FESEM and TEM images, respectively. Hence, it can be concluded that GNPs in nanocomposites may not have been substantially exfoliated and homogeneously distributed in matrix though agglomeration, wrinkling, and crumpling of graphene sheets occurred in during shearing in extruder as shown in FESEM images.
Fire analysis
The curves depicting HRR, MLR, and total heat release (THR) of varying concentrations of treated and untreated nanocomposites are shown in Figures 12(a) and (b) and 13, respectively. The corresponding data are shown in Table 5. The data in Table 5 revealed that the inclusion of high degree of both treated and untreated kenaf resulted in escalating HRR and peak heat release rate (PHRR) continuously. The THR demonstrates similar trend. However, low fiber inclusion at 10 and 20% formed a synergy with GNP to reduce the composite flammability. A similar study reported that the inclusion of graphitic nanofillers significantly improved flame retardancy. The broad descending plateau of HRR curves at low fiber loading resulted in the formation of GNP barricading char layer indicating a large reduction in heat released because of improved fire repression. The char structures of PP, PK, 40UKPG, 40TKPG, 10TKPG, 20TKPG, and 20UKPG are shown in Figure 14(a) to (g).
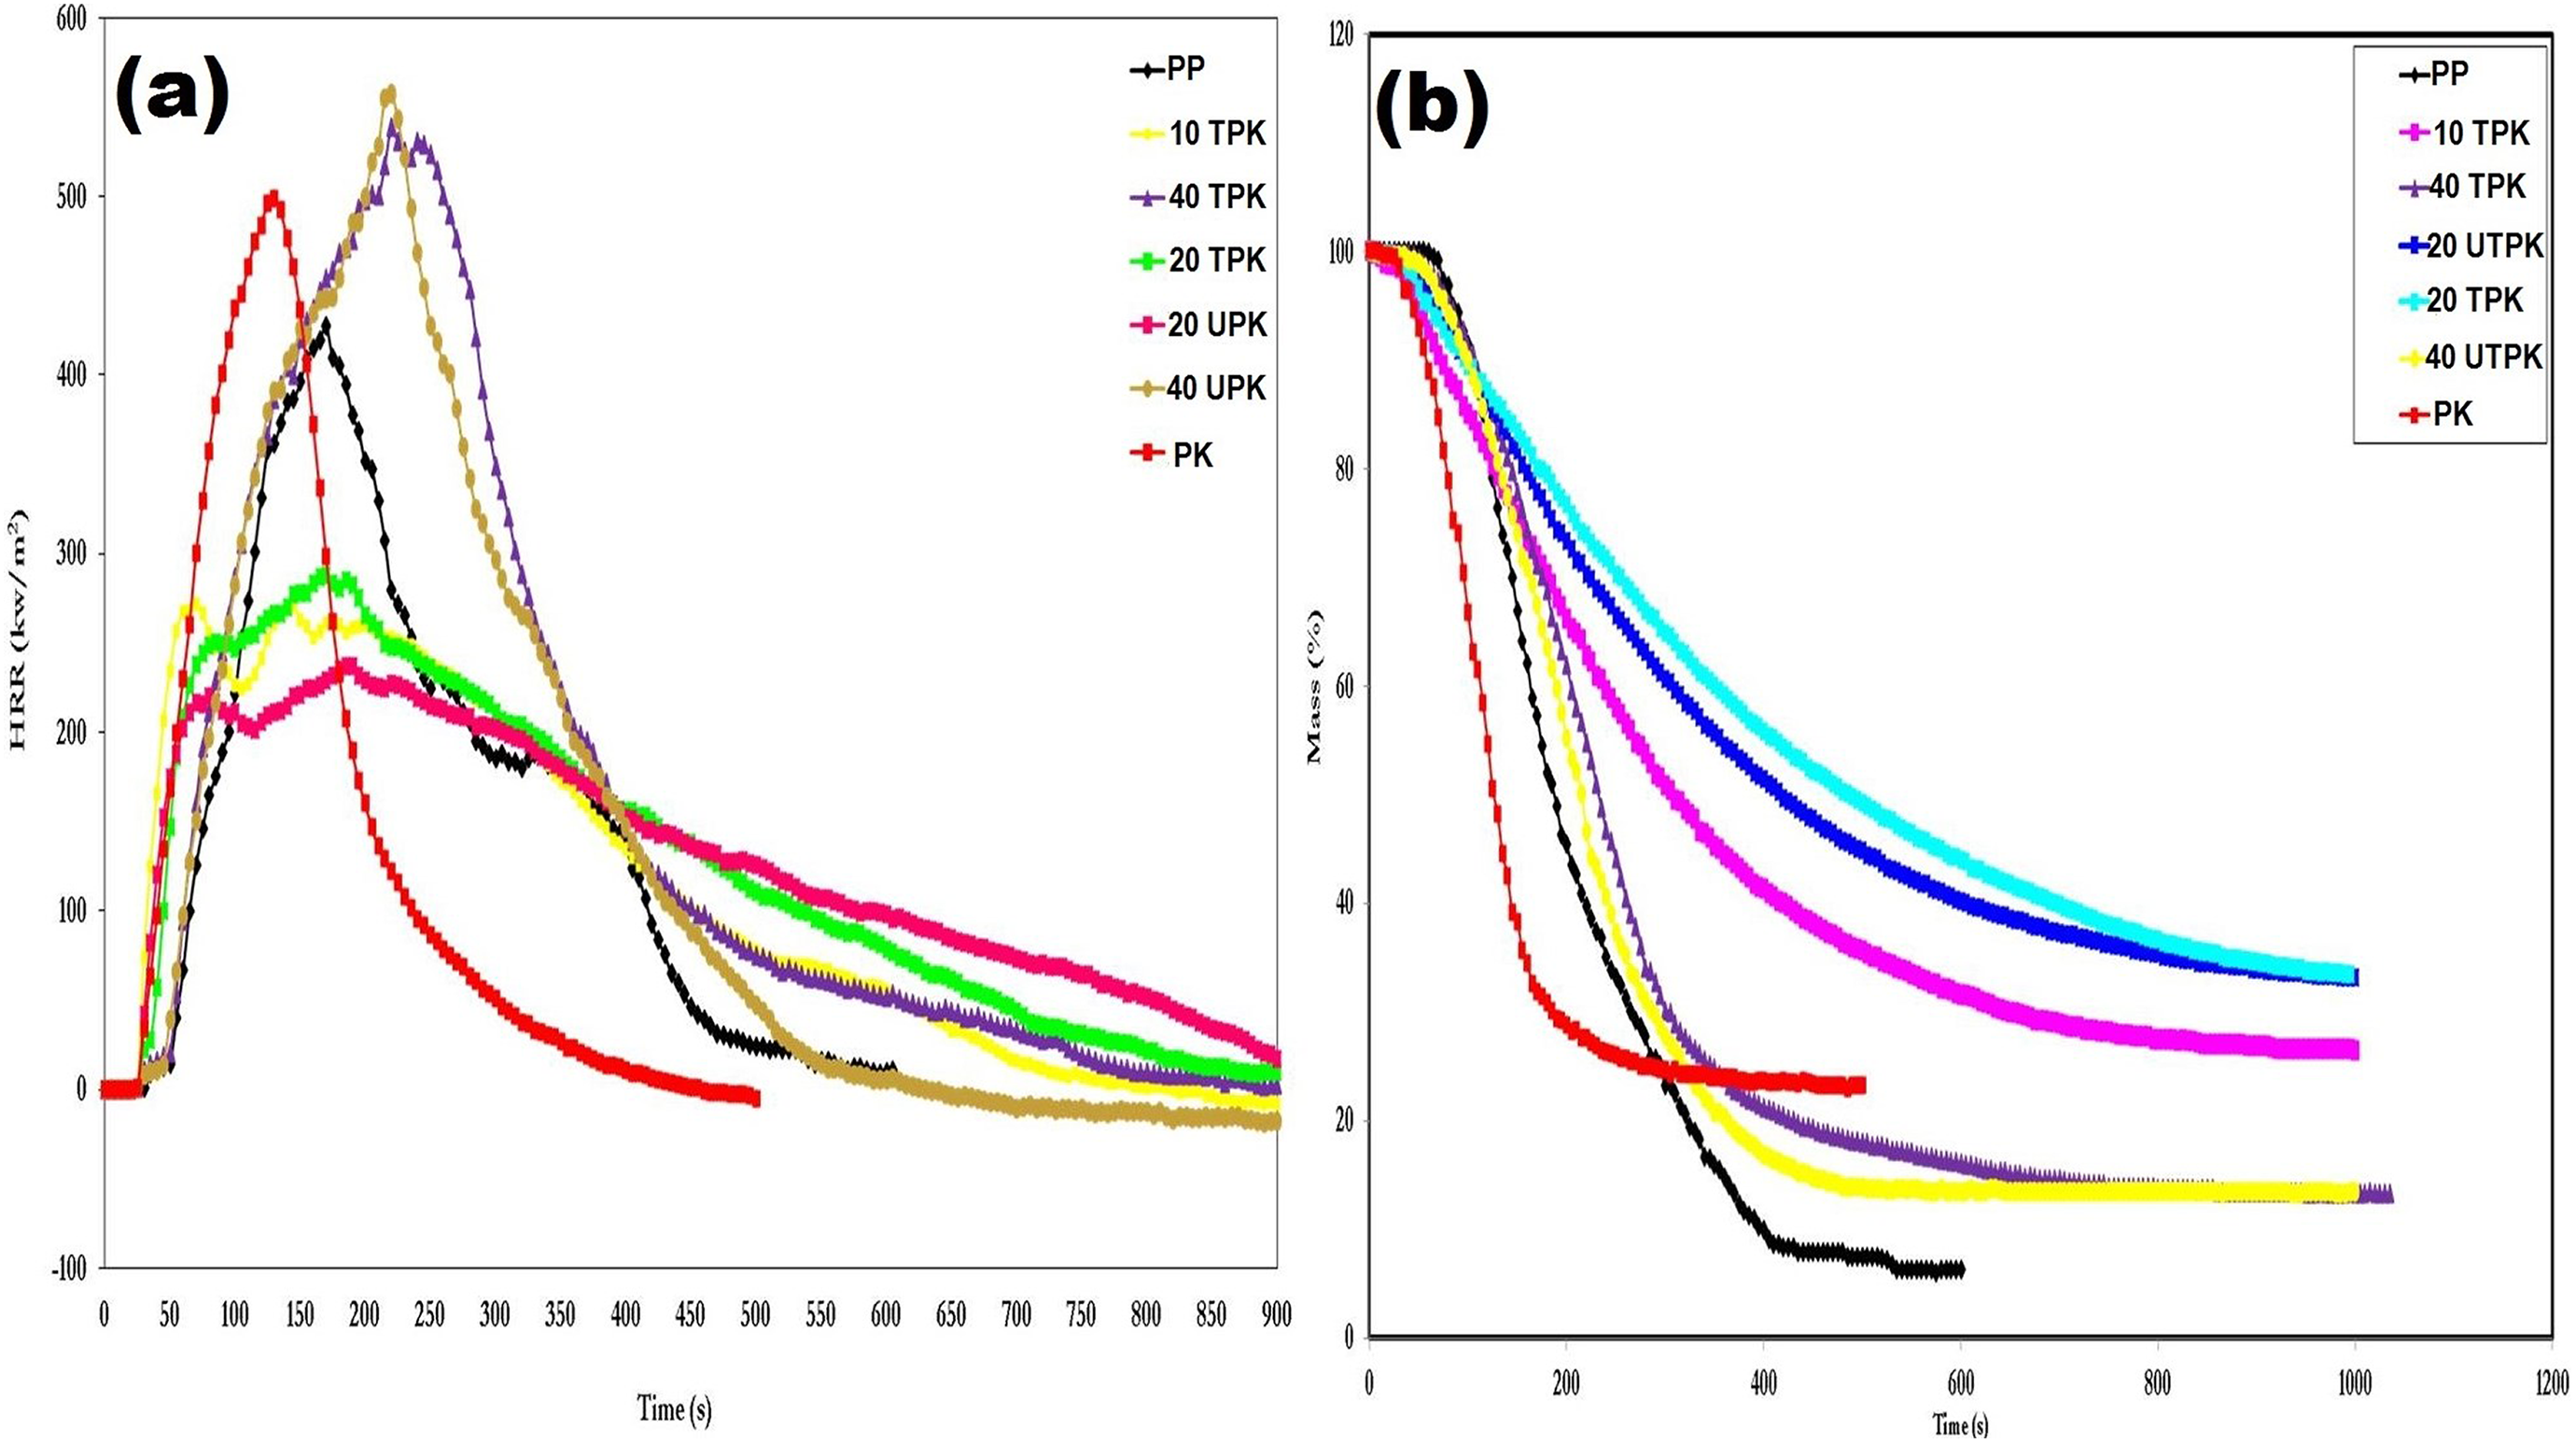
(a) HRR and (b) MLR of treated and untreated KPG nanocomposites.
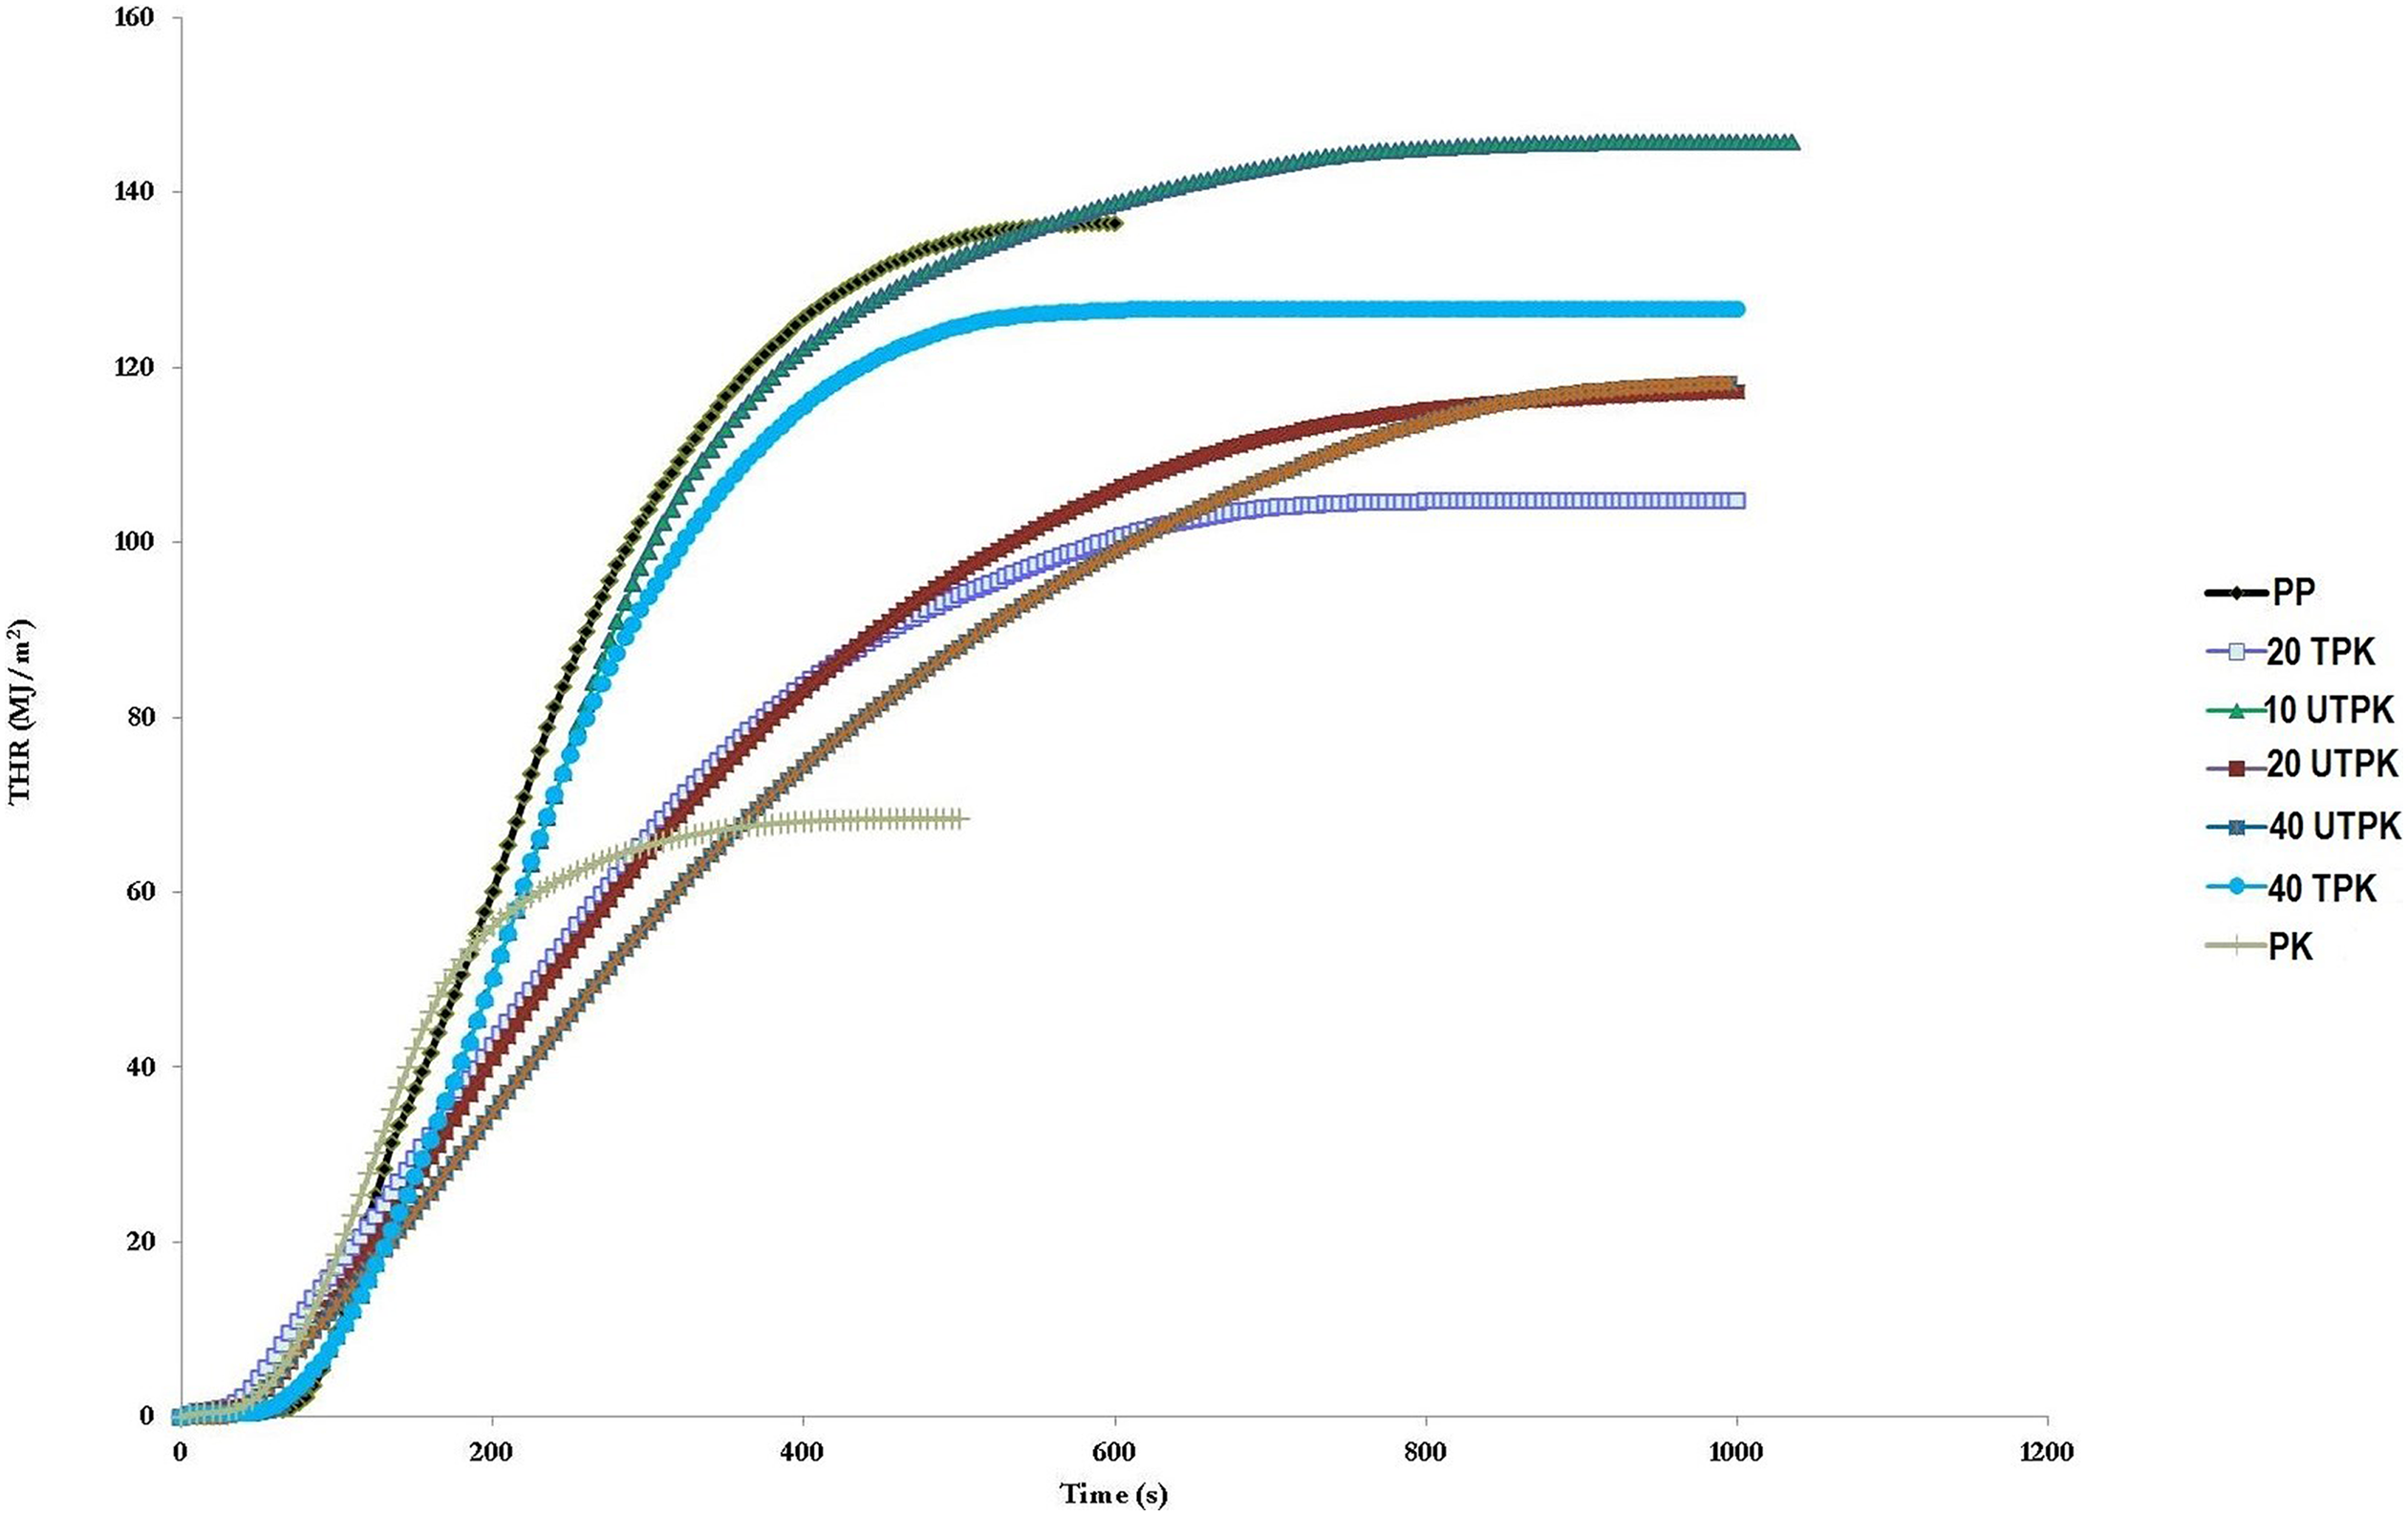
THR of treated and untreated KPG nanocomposites.
Fire data of KPG nanocomposites.a
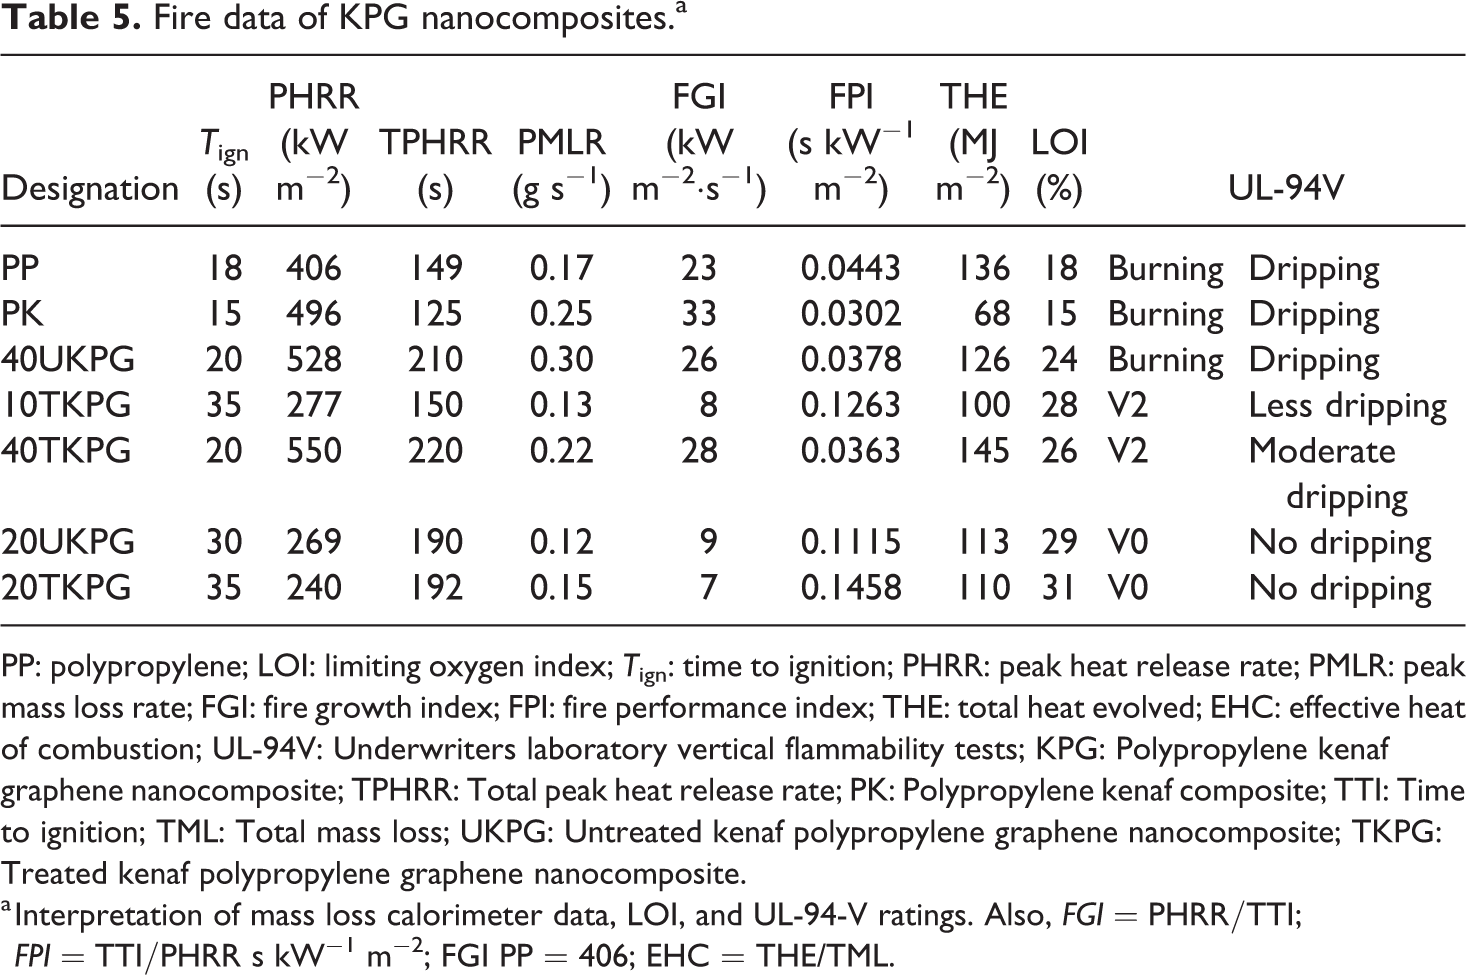
PP: polypropylene; LOI: limiting oxygen index; T ign: time to ignition; PHRR: peak heat release rate; PMLR: peak mass loss rate; FGI: fire growth index; FPI: fire performance index; THE: total heat evolved; EHC: effective heat of combustion; UL-94V: Underwriters laboratory vertical flammability tests; KPG: Polypropylene kenaf graphene nanocomposite; TPHRR: Total peak heat release rate; PK: Polypropylene kenaf composite; TTI: Time to ignition; TML: Total mass loss; UKPG: Untreated kenaf polypropylene graphene nanocomposite; TKPG: Treated kenaf polypropylene graphene nanocomposite.
a Interpretation of mass loss calorimeter data, LOI, and UL-94-V ratings. Also,
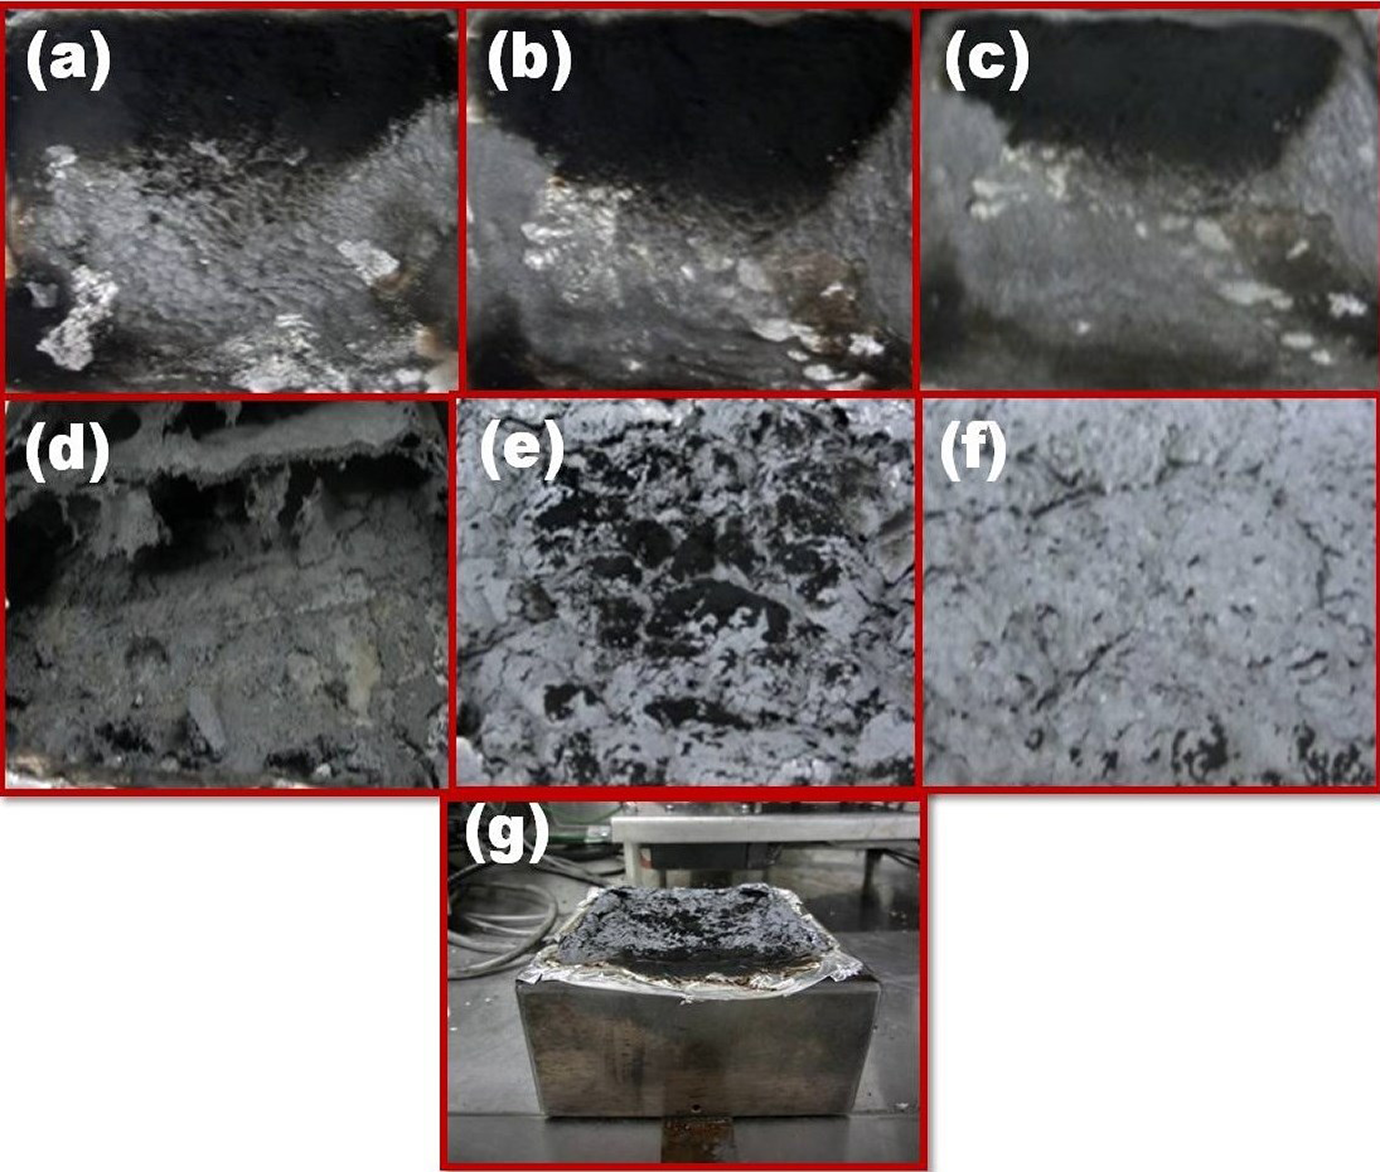
(a) to (g) Char structures of nanocomposites.
From char structures of PP, PK, 40UKPG, and 40TKPG in Figure 14(a) to (d), respectively, it can be observed that the materials burnt rapidly leaving minor char residues. This demonstrates relatively high flammability of these materials as revealed in Figures 12(a) and (b) and 13 of HRR, MLR, and THR, respectively. On the other hand, the char structures of 10TKPG, 20TKPG, and 20UKPG reveal enhanced residue char structure implying a relatively strong flame regression as a result of synergy attained between GNP-kenaf in PP composites as further elucidated in Table 5.
Thermal behavior analysis
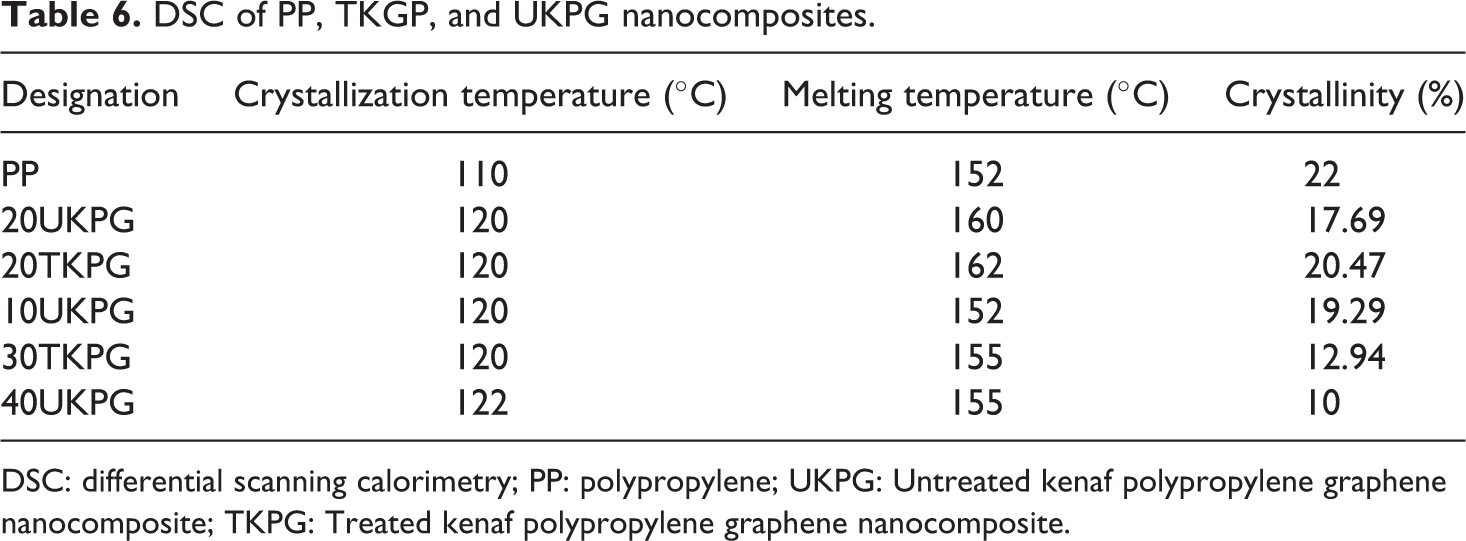
Thermal behaviors of the nanocomposites with regard to melting and crystallization temperatures were measured using DSC to facilitate in-depth comprehension of the synergistic influence of treated and untreated —GNP-kenaf on crystallization of the nanocomposites, respectively. Figure 15 shows the heating and cooling scans of DSC measurements for UKGP and TKGNP nanocomposites, respectively. The equivalent thermal data are shown in Table 6.
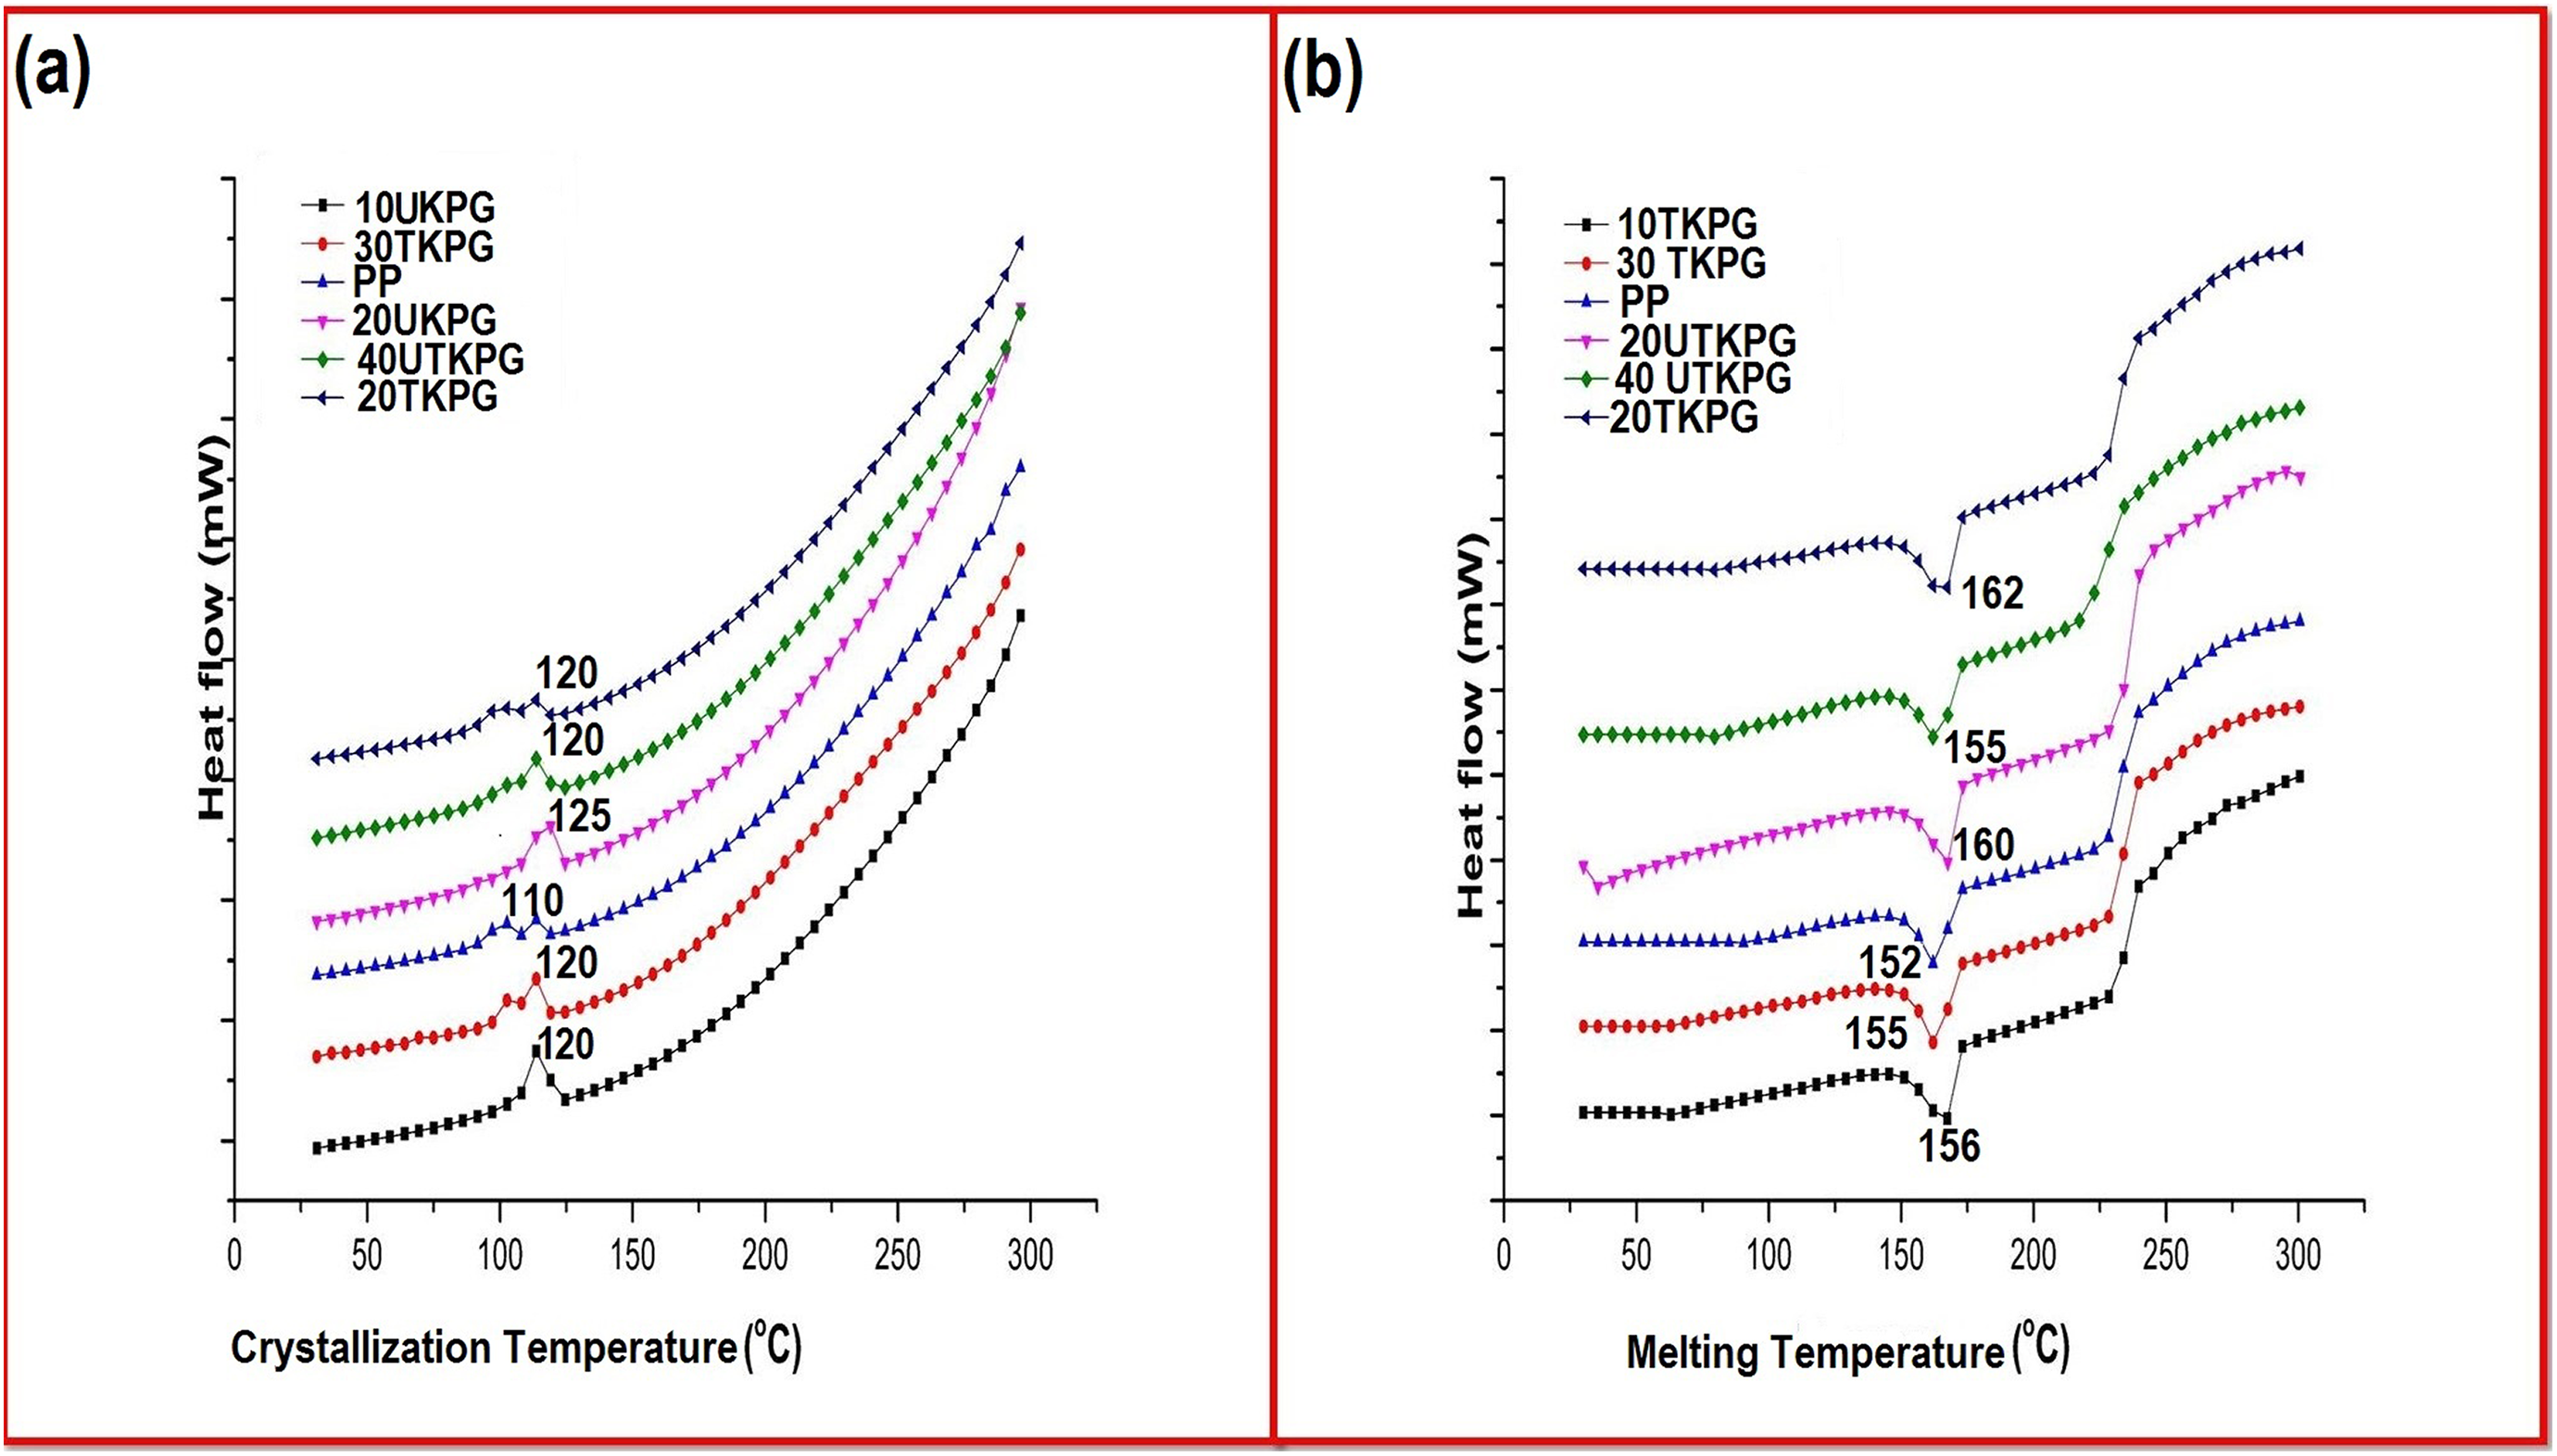
(a) Crystallization and (b) melting scans of DSC measurements for TKGP and UKGP nanocomposites.
DSC of PP, TKGP, and UKPG nanocomposites.
DSC: differential scanning calorimetry; PP: polypropylene; UKPG: Untreated kenaf polypropylene graphene nanocomposite; TKPG: Treated kenaf polypropylene graphene nanocomposite.
From Table 6, the T c value is highest for 20 wt% treated KPG at 162°C followed by 20 wt% untreated KPG. This is attained as result of their high thermal properties due to synergy with GNP. This trend is attributed to the interconnected structure of GNP and synergy achieved with kenaf fiber. This trend can be elucidated by the effect of heterogeneous nucleation of the GNP synergism on the matrix chain segments, which resulted in PP crystallization at elevated temperatures. 27 Similar elucidation can be depicted for the T c of PP. However, the degree of crystallinity of PP in nanocomposites varied slightly due to GNP synergism with kenaf flour. It is perceived that increasing the inclusion of kenaf flour effectively hindered PP chain mobility during the process of crystallization. The broad surface area of GNP sheets presented a wide heterogeneous nucleation site which escalated the rate of crystallization. Therefore, fewer crystalline zones were formed due to shorter available time. In addition, as result of the nanosizes of nanoparticles, they were effectively distributed in PP phases, thereby exerting significant effect on PP T c.
Mechanical analysis
The effect of treatment on mechanical properties of the materials was insignificant. Thus, mechanical behavior of untreated kenaf is presented herein. Flexural modulus and flexural strength increased across the materials due to the high modulus of graphene sheets (1 TPa) and synergy attained with increasing inclusion of kenaf flour which by law of mixtures was transferred to the nanocomposites as shown in Figure 16.
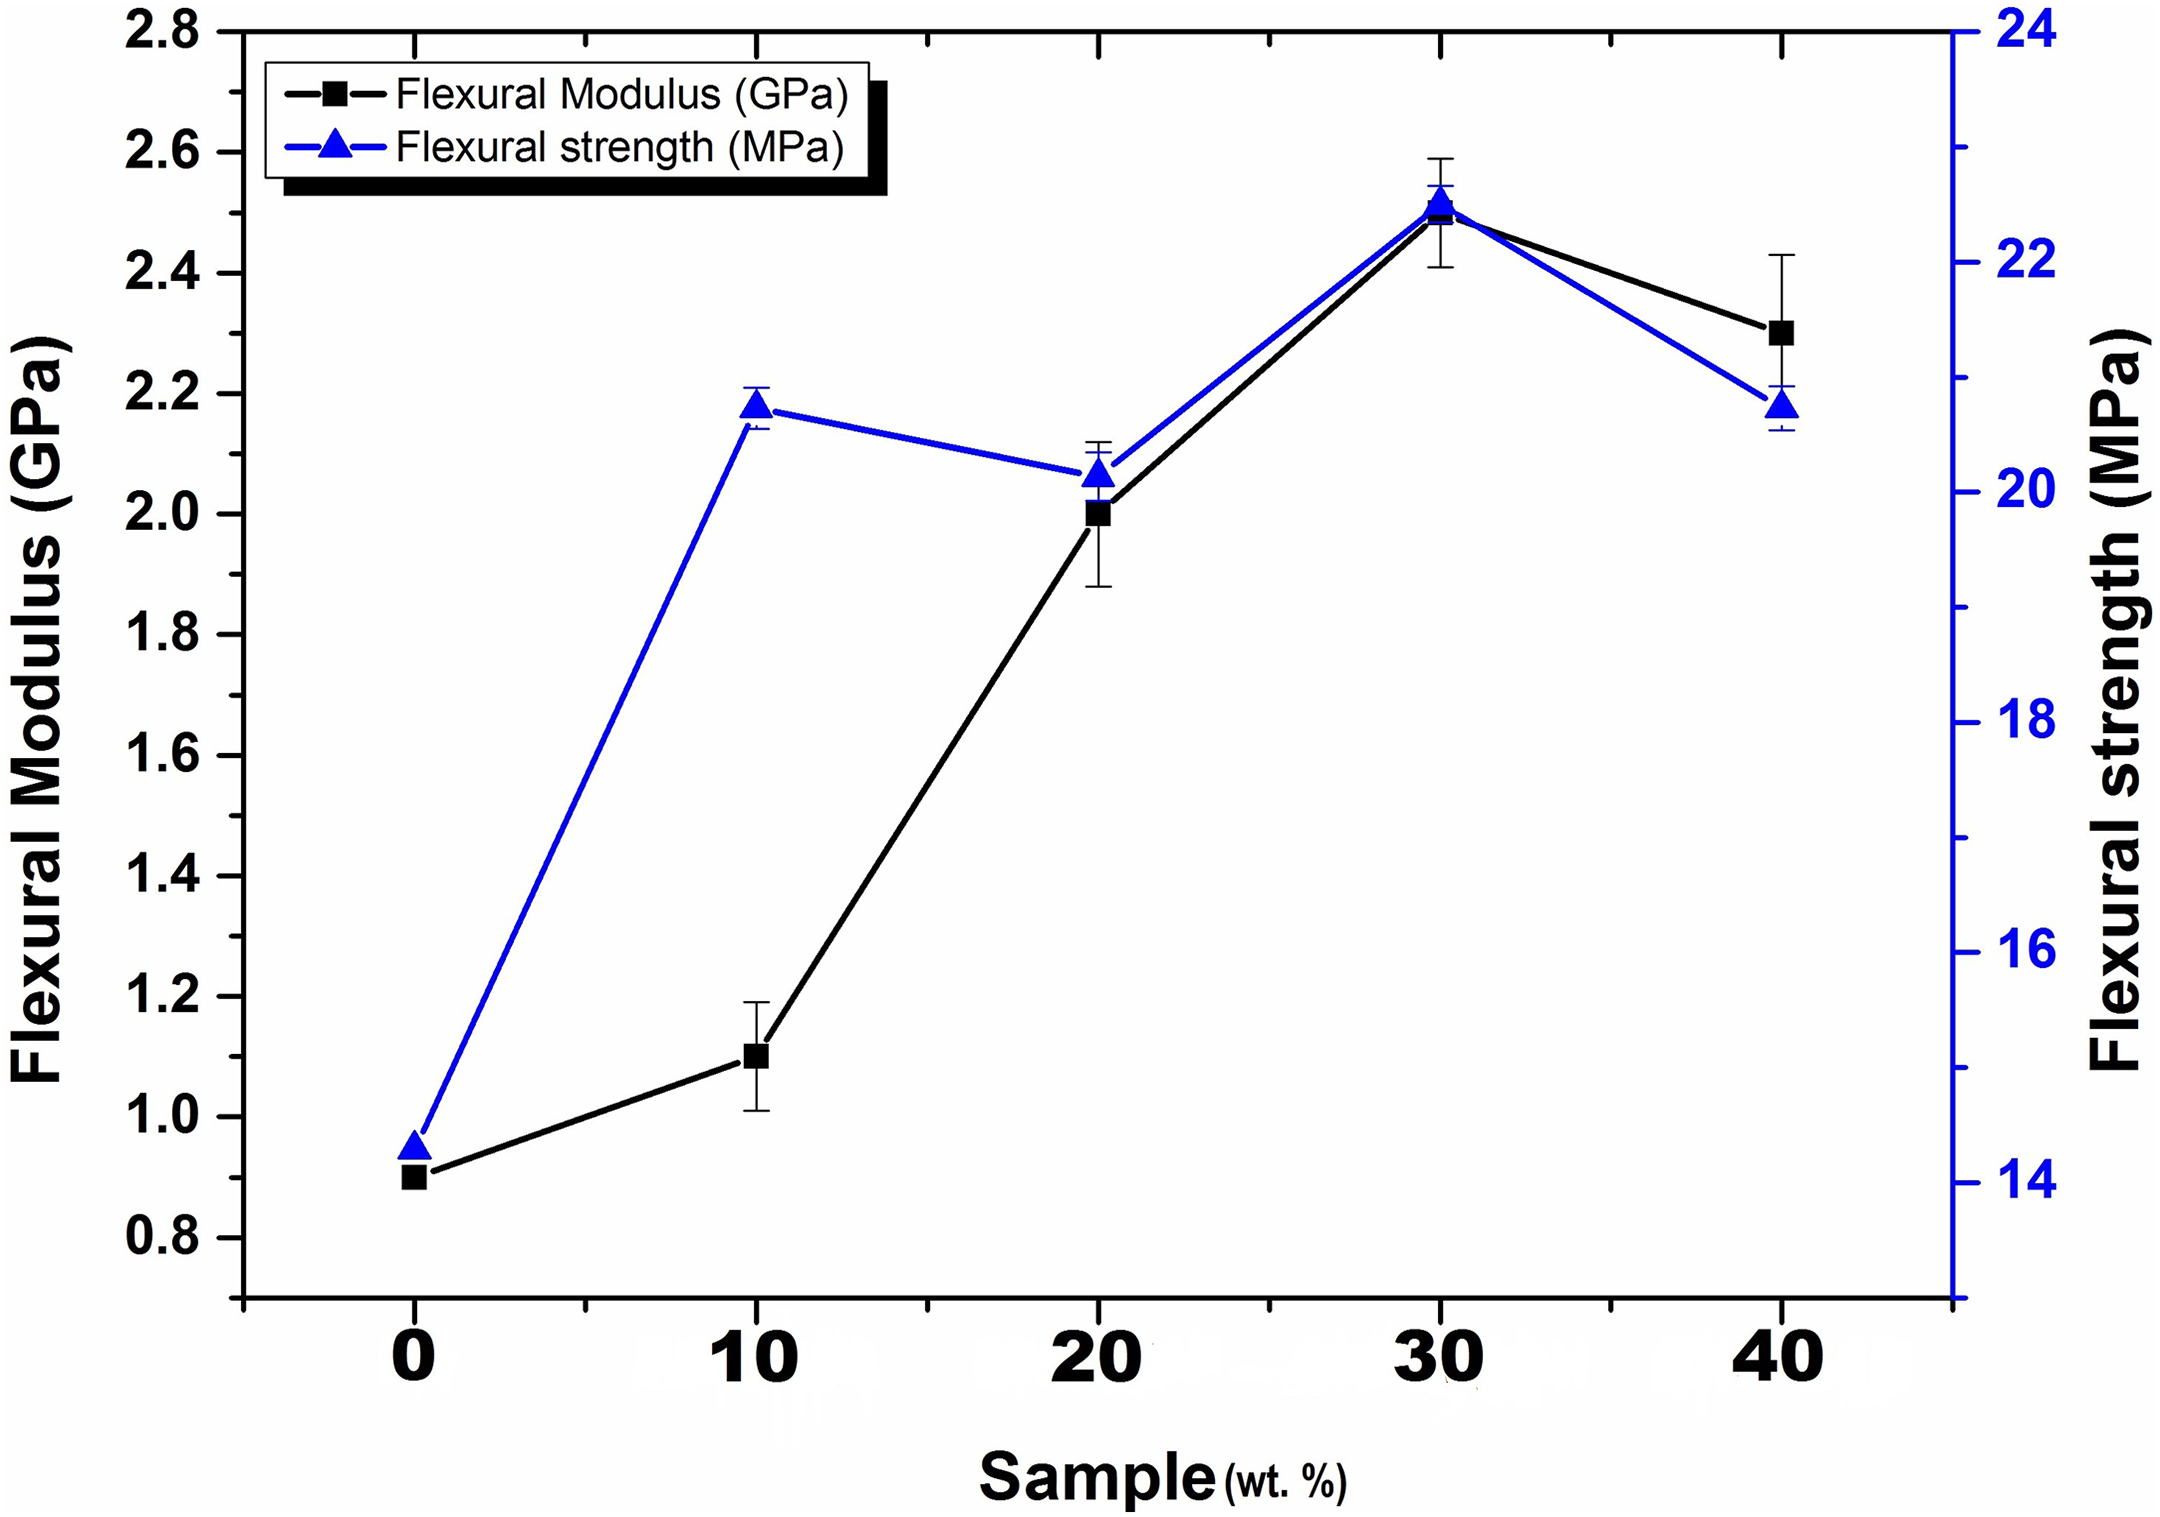
Flexural modulus and strength of hybrid nanocomposites.
This trend is attributed to segmental-chain mobility restrictions due to increased concentration of both nanofillers and kenaf flour. The degree of distribution of nanofillers in matrix is directly linked to its efficiency at enhancing properties of nanocomposites. The flexural modulus of composites is majorly dependant on the modulus of individual component. Improved flexural properties for composites loading are ascribed to high stiffness and aspect ratio of graphene sheets. 28 In addition, increment in flexural properties was anticipated as a result of enhanced adhesion between components in the composites. A study has reported that the modulus of nanocomposites at elevated GNP loading may not increase due to agglomeration of GNP sheets. A vital parameter in composites fabrication is GNP distribution in the matrix. GNP agglomeration is detrimental to physical and mechanical properties of nanocomposites. 29 The Young’s modulus exhibited an increase in nanocomposites in comparison with pristine PP. Increasing Young’s modulus is attributed to effective stress transfer between matrix and filler arising from homogeneous dispersion of GNP. It is thought that further inclusion of fibers in polymer may have resulted in agglomeration due to van der Waals attraction within GNP and increased inclusion of fibers. Agglomeration will impart less efficient improvement on materials strength.
Conclusion
Thermal conductivity, HDT, flame retardancy, thermal behavior, morphological features, mechanical properties, and structure of PP/GNP-filled increasing concentration of treated and untreated kenaf nanocomposites were studied. Data obtained from MLC, including HRR, PHRR, time to ignition (TTI), and % mass loss, LOI, and UL-94-V, revealed enhancement of flame resistance of hybrid nanocomposites samples due to synergistic inclusion of GNP/kenaf flour. Enhancement of fire resistance of 20-wt% TKPG, 20-wt% UKPG, and 10-wt% hybrid nanocomposites was through the formation of an even compact carbonaceous char layer in the condensed and gas phase accordingly during decomposition of the polymer matrix. The carbonaceous char structural layer effectively restrained the interior thermal degradation products into the fire region and hindered oxygen from penetrating into the underlying polymer matrix. Thermal conductivity was improved mainly through increasing inclusion of fiber in GNP. This was attributed to the formation of effective heat transfer interconnecting bridges of GNPs which improved heat dissipation. Morphological studies revealed efficient distribution and development of interconnected and partially exfoliated GNP sheets. This study showed potential of using synergism attained between GNP-kenaf system in developing a heat dissipating, eco-benign, fire resisting, and higher temperature deflecting polymer nanocomposites for potential applications in the automobiles, aircrafts, and electrical/electronic components where fire retardancy and thermal conductivity of components are essential. Synergism of kenaf/GNP enhanced fire retardancy through formation of a carbonaceous-intumescent barricade because of increased condensed phase viscosity. Thus, swelling of residue was hindered, height of protective layer reduced, and the burning behavior changed to residue-forming material because of GNP presence. The synergism also enhanced thermal stability through shifting of T onset and T max to higher temperatures. During combustion, GNP strongly enhanced surface and microscopic structure of hybrid residue. This resulted in improved heat barrier, especially with regard to small fire reaction. In the MLC, heat barricading synergistic of the nanocomposites demonstrated improved fire insulative properties due to the development of a carbonaceous layer which further reduced HRR, EHC, and other critical fire parameters. The synergism of the hybrid nanocomposites exhibited improved flexural modulus, enhanced HDT, thermal stability, and thermal conductivity suitable for application in the automotive and aerospace components where electrical conductivity, heat dissipation, and flame retardancy are essential.
Footnotes
Acknowledgements
The authors would like to thank the management of Universiti Teknologi Malaysia, Head of Research Group R2 Fire Unité Matériaux et Transformations (UMET)—CNRS UMR 8207 Ecole Nationale Supérieure de Chimie de Lille (ENSCL) Villeneuve d’Ascq Cedex, France, for providing facilities for the success of this research.
Funding
The author(s) received no financial support for the research, authorship, and/or publication of this article.